Article

Study on the Flow Characteristics and Energy Dissipation of Side Inlet/Outlet Structures

1
POWERCHINA Chengdu Engineering Co., Ltd., Chengdu 610072, China
2
State Key Laboratory of Hydraulics and Mountain River Engineering, Sichuan University, Chengdu 610065, China
*
Author to whom correspondence should be addressed.
Water 2026, 18(6), 678; https://doi.org/10.3390/w18060678
Submission received: 24 December 2025 / Revised: 13 February 2026 / Accepted: 10 March 2026 / Published: 13 March 2026
(This article belongs to the Section Hydraulics and Hydrodynamics)

Abstract

As a critical hydraulic component of pumped storage power stations, the side inlet/outlet directly affects unit efficiency, flow stability, and system safety. This study investigates the side inlet/outlet of a pumped storage power station using three-dimensional numerical simulations, focusing on the influence of the diffuser length L on hydraulic performance, and further analyzes the underlying mechanisms of energy loss based on entropy production theory. The results indicate that, with increasing diffuser length L, the flow rates in individual channels gradually deviate from the design values, leading to an aggravated imbalance in flow distribution. In contrast, the velocity non-uniformity coefficient CV at the trash rack decreases, accompanied by a pronounced attenuation of recirculation and local flow separation, resulting in a more uniform and stable flow field. Moreover, increasing L improves the streamwise velocity uniformity within each channel, while the extent and intensity of the top recirculation zone are reduced, suppressing local flow separation. Quantitative analysis shows that when L increases from 65 m to 85 m, the total turbulent dissipation entropy production rate in the diffuser section increases linearly from 2732.32 W/K to 2842.32 W/K, whereas the direct dissipation entropy production rate increases from 0.41 W/K to 0.59 W/K. This indicates that turbulent dissipation entropy production plays a dominant role in the overall energy loss. Shorter diffusers tend to induce high-intensity local dissipation, whereas longer diffusers reduce local peak dissipation but increase the overall entropy production within the diffuser, reflecting a trade-off between local optimization and global energy loss. This study reveals the sensitivity and governing effects of diffuser length on the hydraulic characteristics of side inlet/outlets, providing a reference for geometry optimization and engineering design of similar hydraulic components.

1. Introduction

With the large-scale integration of renewable energy sources such as wind power and photovoltaics, their inherent intermittency and variability pose significant challenges to the safe and stable operation of power grids [1,2]. As a key support for enhancing power system flexibility, energy storage systems can effectively achieve peak shaving and valley filling, frequency regulation, and reserve capacity support, and thus play an essential role in modern power systems [3]. Among them, pumped storage, characterized by technological maturity, long service life, high efficiency, and strong economic performance, has become the large-scale physical energy storage technology with the largest installed capacity and the widest application at present [4,5,6]. As a key hydraulic component in pumped storage power stations, the side-type inlet/outlet structure directly affects turbine operating efficiency, unit stability, and overall system safety. With the continuous expansion in the scale of large hydropower stations and pumped storage power plants, the complex flow characteristics and vortex phenomena in side-type inlet/outlet structures have become increasingly prominent. This has raised higher demands for the design and optimization of hydraulic components and attracted widespread attention from researchers both domestically and internationally [7,8].
Research on side inlet/outlet structures primarily focuses on the influence of geometric parameters on head loss, flow distribution, and flow field characteristics [9,10,11]. For a long time, the study of hydraulic characteristics at the side inlet/outlet of pumped storage power stations has primarily relied on traditional hydraulic model tests. The model test conducted by Li et al. [12] demonstrated that proper control of Fr and relative submergence depth can suppress the generation of harmful vortices and improve the flow pattern. Zhu et al. [13] employed Laser Doppler Velocimetry (LDV) and Acoustic Doppler Velocimetry (ADV) to measure the fluctuating flow velocities along the inlet/outlet channels and at the trash rack cross-section, revealing the longitudinal variation characteristics of fluctuating velocities and the flow patterns at the trash rack. Gao et al. [14] conducted experimental research using Particle Image Velocimetry (PIV) and ADV, revealing the bidirectional flow characteristics of side inlet/outlet structures and the pulsating velocity patterns of trash racks.
With the advancement of CFD algorithms and computing hardware, numerical simulation has become capable of efficiently resolving complex three-dimensional unsteady flows and free-surface problems and has become an important tool in hydraulic engineering that complements physical model experiments [15,16,17,18]. CFD technology can thoroughly reveal the unsteady flow characteristics inside complex hydraulic components, compensating for the flow details that are difficult to obtain through traditional hydraulic model tests. Ye et al. [19] simulated unsteady incompressible flow with free water surface using the Realizable k-ε turbulence model and VOF method, and pointed out that the horizontal diffusion angle is the main cause of backflow. Wu et al. [20] conducted a three-dimensional numerical simulation based on the Realizable k-ε turbulence model. The research demonstrated that optimizing the structure of the splitter pier and introducing vertically curved tailrace tunnels can effectively mitigate the flow deviation phenomenon in the intermediate channel, while reducing flow velocity unevenness and head loss. However, the traditional two-equation k-ε model assumes turbulence to be isotropic by default, and often fails to accurately predict flow details in cases involving strong recirculation, vortices, or secondary flow structures [21,22]. The Reynolds stress model (RSM) model directly solves the Reynolds stress transport equations and accounts for the anisotropy of turbulence, demonstrating advantages in complex hydraulic problems and gaining increasing adoption [23,24].
The energy loss issue in pumped storage power stations has consistently been a focal point in both research and engineering practice. Some scholars use turbulent kinetic energy K to characterize fluctuating flow velocity energy, thereby reflecting the head loss of water particles. In recent years, entropy production theory has emerged as a method for quantifying internal energy dissipation [25] and has been successfully applied in the field of fluid machinery, such as turbines and pumps [26,27,28]. Qi et al. [29] quantified the energy losses in different regions using entropy generation theory, finding that the entropy generation values were higher in the turbine blade passage and outlet region, indicating greater energy losses in these areas. Based on the thermodynamic entropy generation theory, Yu et al. [30] calculated and analyzed the local entropy generation rate of various components (such as guide vanes, impellers, etc.) inside the pump-turbine to evaluate the distribution and extent of energy loss. Zhou et al. [31] systematically reviewed the application of entropy generation theory in the analysis of internal flow in fluid machinery, pointing out that compared with traditional energy loss evaluation methods, this approach can provide more precise loss localization and quantitative analysis. However, this method has so far been mainly applied in the field of fluid machinery, and its application and related studies in the side-type inlet/outlet structures of pumped storage power stations remain limited. Overall, there is still a lack of systematic qualitative and quantitative evaluation of the internal energy dissipation distribution within such structures. The characteristics of energy dissipation in local regions have not yet been fully clarified, and the corresponding research and application methods remain incomplete.
This study takes the side-type inlet/outlet structure of a typical pumped storage power station as the research object. A three-dimensional numerical simulation method is employed to investigate the influence of diffuser length L on the hydraulic performance of the inlet/outlet. A detailed analysis was conducted primarily from the aspects of flow distribution characteristics, velocity distribution at the trash rack cross-section, and internal flow field structure, revealing the sensitivity and regularity of hydraulic characteristics to parameter variations. Furthermore, based on the entropy production theory analysis method, this study conducted an in-depth investigation into the energy distribution characteristics and loss mechanisms of the diffusion section from both qualitative and quantitative perspectives, revealing the dominant causes of energy loss. The research results not only provide a theoretical basis for optimizing the shape of side inlet/outlet structures but also offer scientific references for improving the hydraulic efficiency of the inlet/outlet systems in pumped storage power stations.

2. Methodology

2.1. Mathematical Model

The transient Navier–Stokes (N–S) equations can directly describe the instantaneous details of turbulent flows; however, their computational cost is extremely high, making them impractical for engineering applications. In engineering applications, the Reynolds-Averaged Navier–Stokes method is commonly adopted, where time-averaging is performed to obtain the mean flow field, thereby achieving a balance between accuracy and computational efficiency. The RANS method involves Reynolds averaging the N-S equations, obtaining mean turbulent flow field parameters by solving the Reynolds-averaged equations. Assuming the fluid is incompressible, the instantaneous continuity equation and momentum equation are as follows:
u i x i = 0
u j u i x j = 1 ρ p x i + 1 ρ x j ( μ u i x j ρ u i u j ¯ ) + f i
In the equation, x i denotes the coordinate components; u i denotes the velocity components; ρ denotes the fluid density; p the pressure; υ denotes the kinematic viscosity; and f i denotes the body force per unit mass acting on the fluid.
Considering that the internal flow within the side-type inlet/outlet structure involves complex phenomena such as strong swirl and recirculation, conventional isotropic turbulence models (e.g., the standard k–ε model) have difficulty accurately capturing these flow details, and often exhibit significant deviations in predicting flow separation and reattachment locations [32]. The RSM, as a higher-order closure approach in turbulence modeling, more rigorously accounts for effects such as streamline curvature, vortices, rotation, and rapid changes in strain rate compared to single-equation and two-equation models. Consequently, it is more likely to provide accurate predictions for complex flows and has been widely adopted and applied in hydraulic numerical simulations [33,34,35].
The transport equation for the RSM is:
x k ( ρ u k u i u j ¯ ) = x k μ i σ k u i u j ¯ x k + x k μ x k ( u i u j ¯ ) 2 3 δ i j ε P i j + φ i j
In the equation, μ t represents the turbulent dynamic viscosity coefficient; δ i j represents the Kronecker delta; the empirical constant σ k = 1 ; P i j denotes the stress production term, which can be calculated by the following formula:
P i j = ρ ( u i u k ¯ u j x k + u j u k ¯ u i x k )
ε is the turbulent energy dissipation rate, obtained by solving its transport equation:
u j ε x j = x j c μ k 2 ε ε x j c c i ε k u i u j ¯ u i x j c c 2 ε 2 k
In the equation, the model constant c μ = 0.09 , c ε 1 = 1.44 , c ε 2 = 1.92 .

2.2. Physical Method

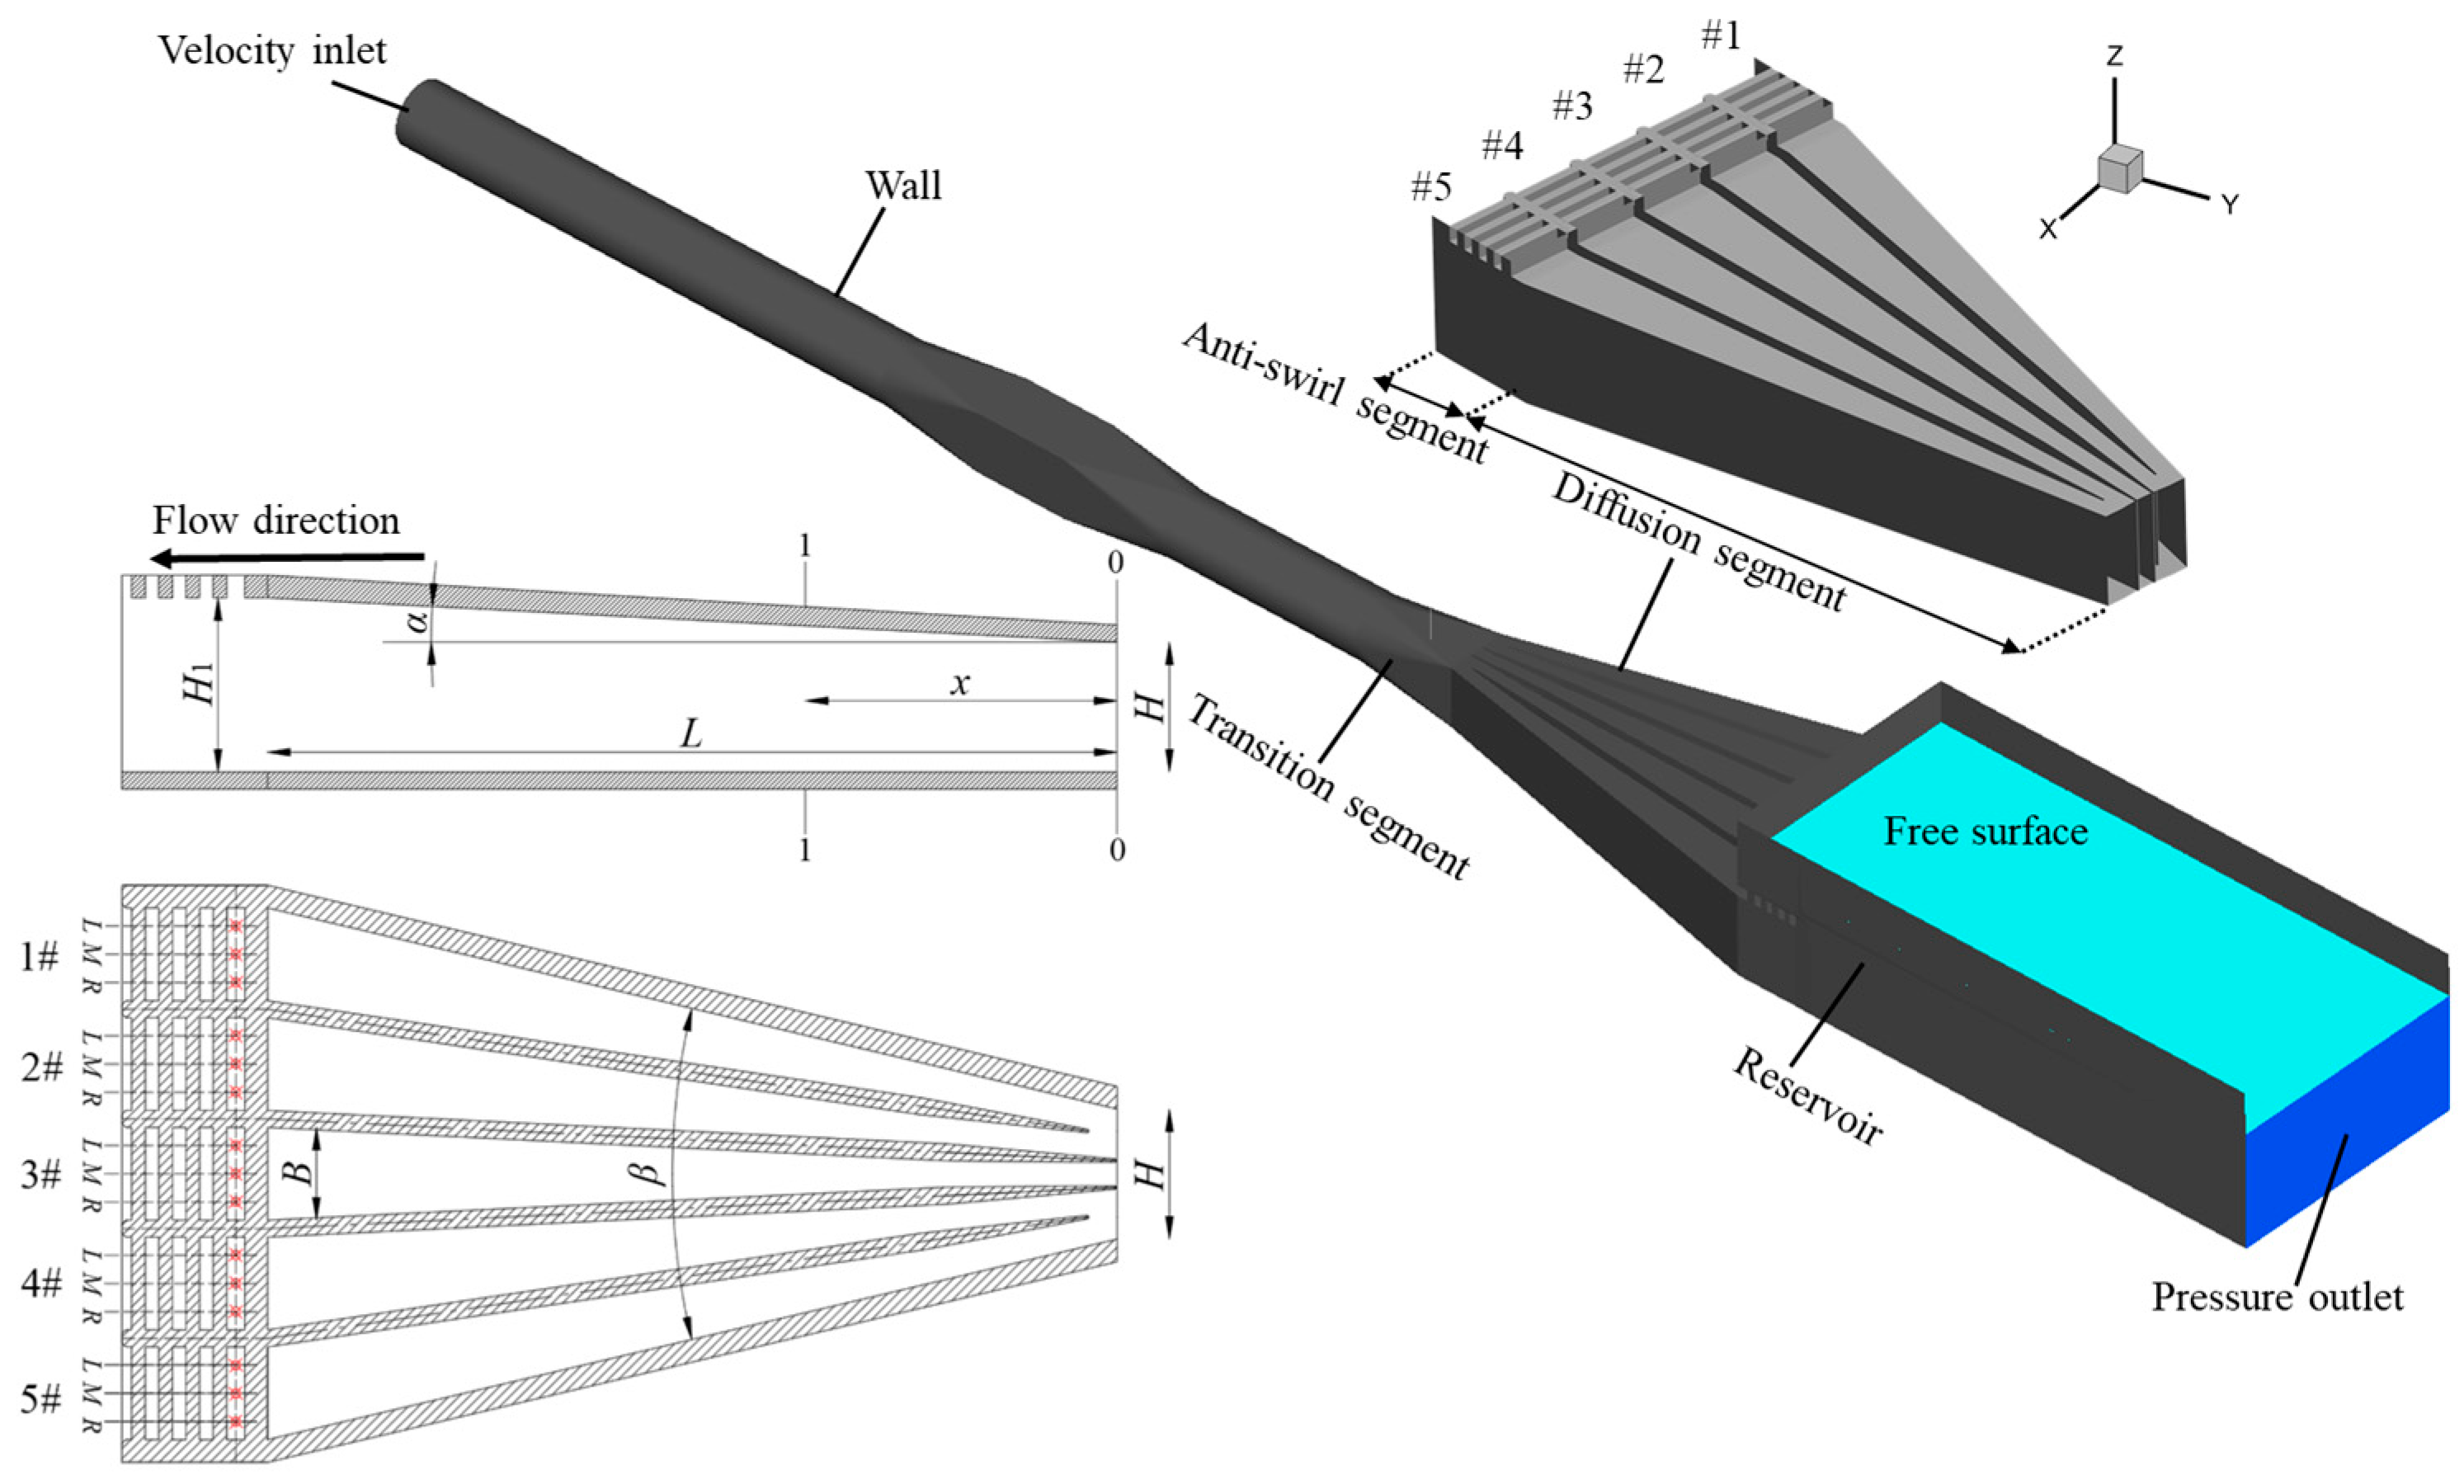
The side inlet/outlet is widely used in pumped storage power stations, featuring advantages such as compact structure and flexible layout. However, its bidirectional flow characteristics intensify the complexity of the flow field, easily inducing backflow and vortices, increasing hydraulic losses, and compromising operational efficiency and structural safety. Figure 1 shows the schematic diagram of the structural configuration of the diffuser section at the side inlet/outlet of a pumped storage power station. The length of the diffusion section is L; the height of the channel orifice is H1, and the width of a single channel orifice is B; the vertical diffusion angle is α, and the total plane diffusion angle is β; the width and height of the tunnel are H. Assuming cross-section 0-0 as the reference section of the diffuser, the distance between any cross-section 1-1 on the diffuser and cross-section 0-0 is defined as x, and the dimensionless distance is defined as λ = x/L (0 ≤ λ ≤ 1). While maintaining the constant height H1 and width B of the channel orifice, the study investigated the influence of five different diffuser lengths L on the flow characteristics and energy dissipation properties of the side inlet/outlet. The geometric parameters of each computational model are listed in Table 1.
This study was conducted using the commercial CFD software ANSYS Fluent 2021R1, which is widely used in hydraulic and hydropower engineering. The platform integrates a mature solver system based on the Finite Volume Method (FVM). In the numerical simulations, the built-in RSM was employed to close the Unsteady Reynolds-Averaged Navier–Stokes equations, and the SIMPLE algorithm was adopted to achieve pressure–velocity coupling. The pressure term is discretized using the Body Force Weighted (BFW) method to effectively handle the pressure field distribution in gravity-driven flows. All other variables (such as velocity, momentum, etc.) are spatially discretized using the Second-order Upwind scheme. The reservoir boundary is set as a pressure boundary, with hydrostatic pressure determined by the reservoir water level; the tunnel inlet/outlet boundaries adopt velocity boundary conditions, where the average flow velocity in the tunnel cross-section is calculated based on the given discharge. The wall is set as a no-slip boundary condition; the free surface in the reservoir is treated using the VOF method. The specific boundary condition settings are shown in Figure 1. For each operating condition, 128 CPU cores were employed for parallel computation, and the computational time for a single simulation was approximately 10 days to ensure full convergence of the flow field and obtain a high-accuracy steady-state solution.

2.3. Mesh Generation and Independence Verification

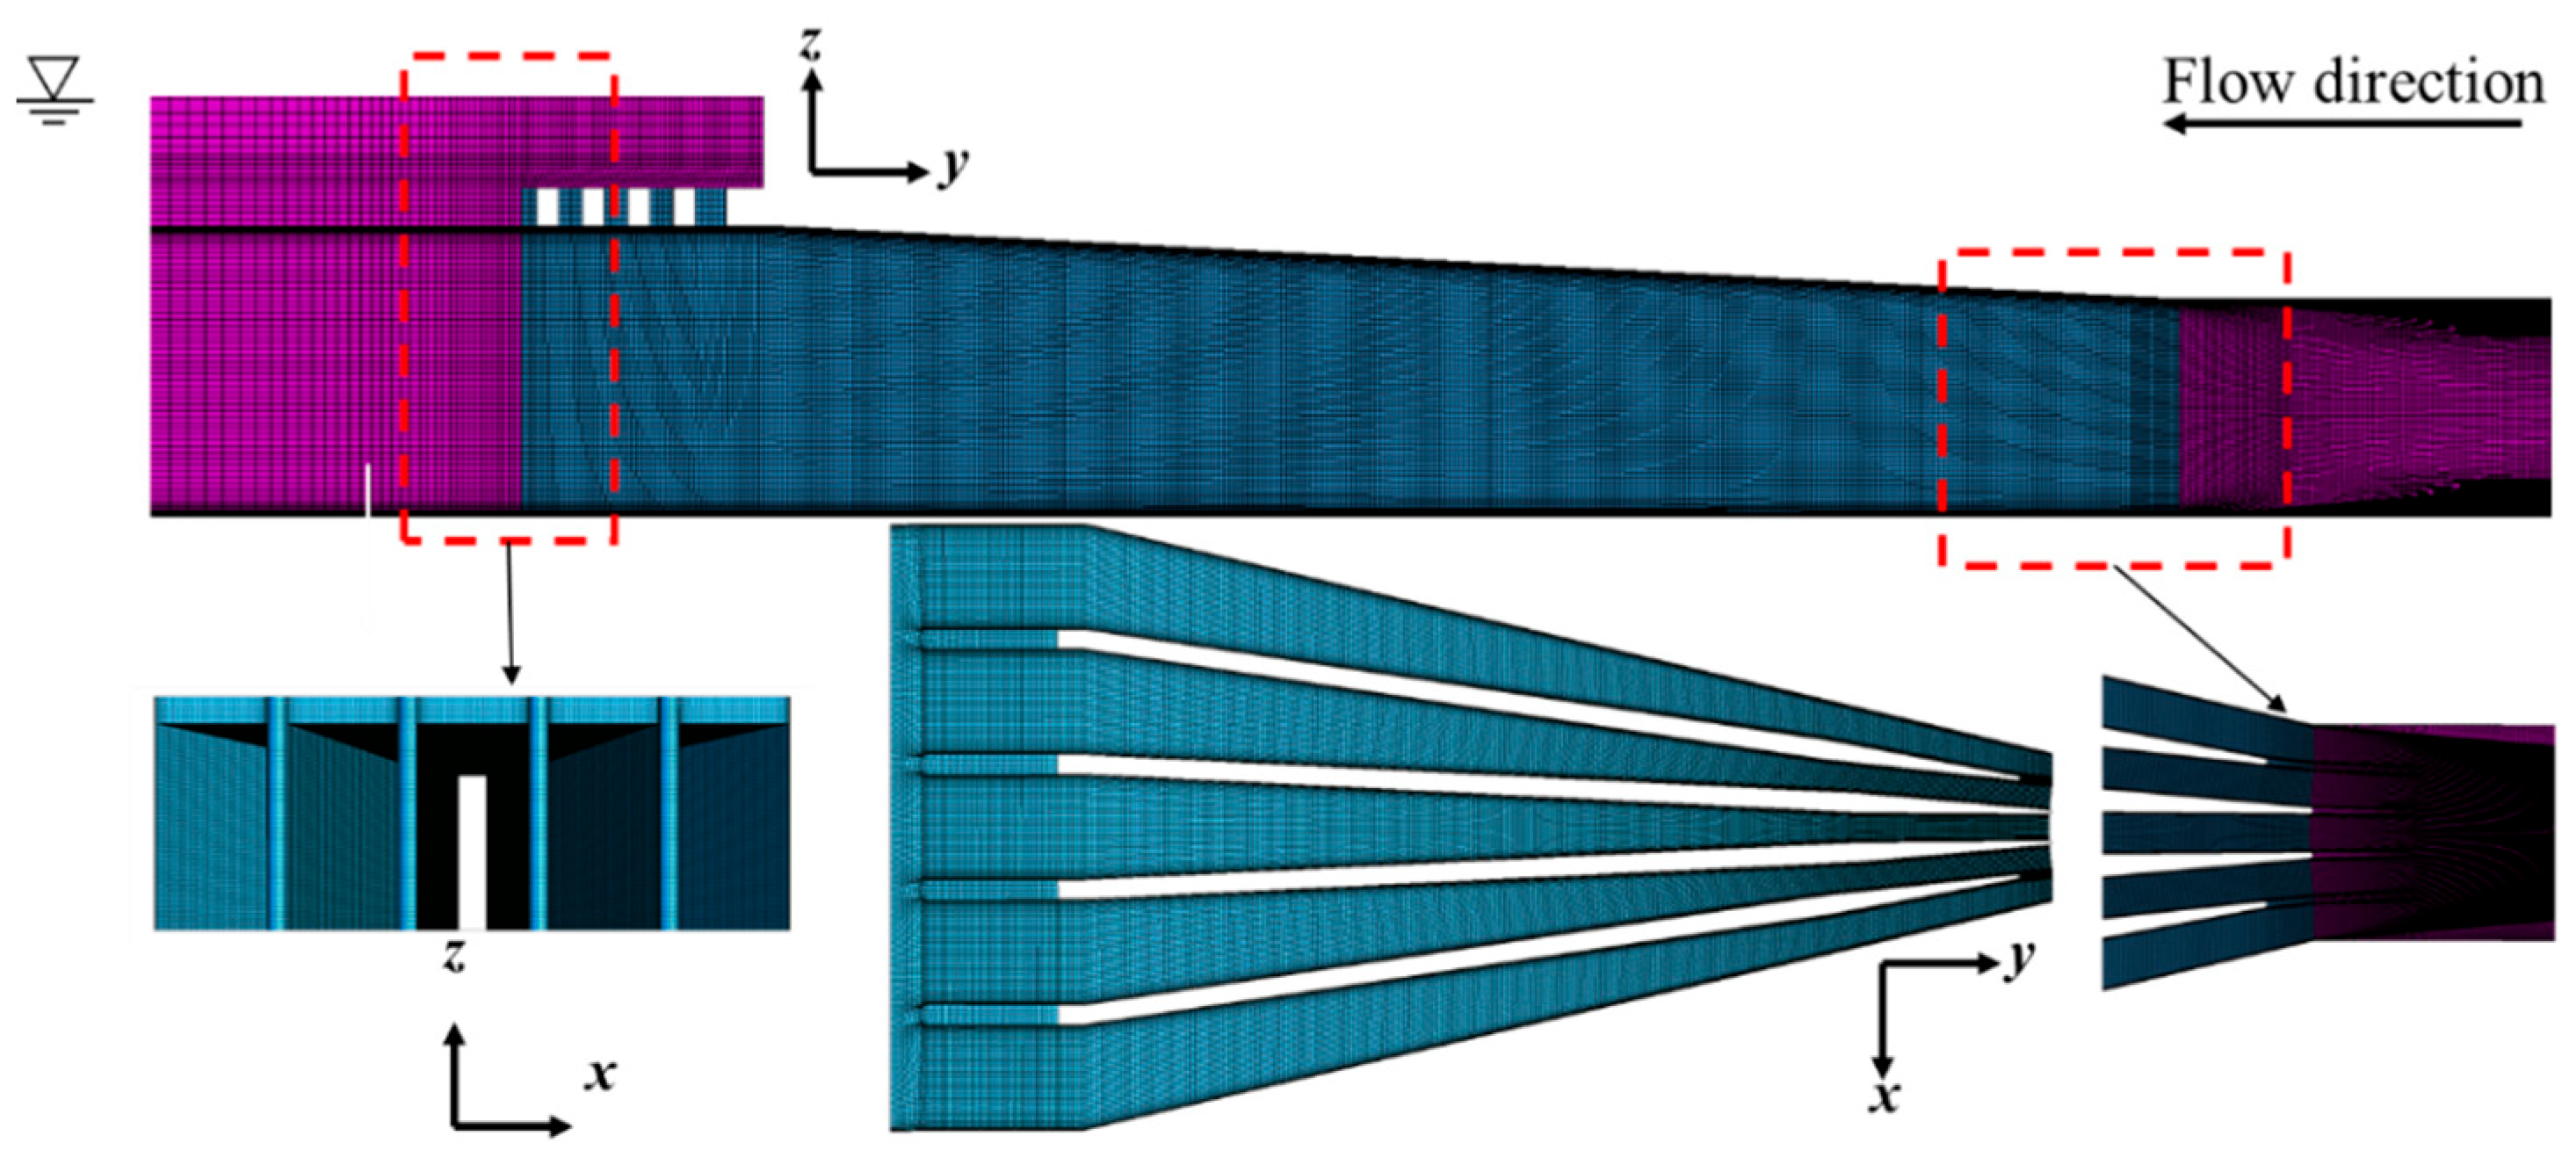
This study employs ANSYS-ICEM 2021R1 software to perform high-quality, well-controlled hexahedral structured meshing. The tunnel section adopts an O-type topological grid layout to ensure mesh continuity and isotropic consistency. To accurately capture the flow characteristics in the near-wall region, boundary layer meshes are arranged adjacent to the walls. Since the mesh quality and resolution have a significant influence on the accuracy of numerical simulation results, local mesh refinement was applied in key regions such as the diffuser section and the transition section, ensuring that the mesh size in these areas is smaller than 0.3 m. The overall mesh configuration is illustrated in Figure 2.
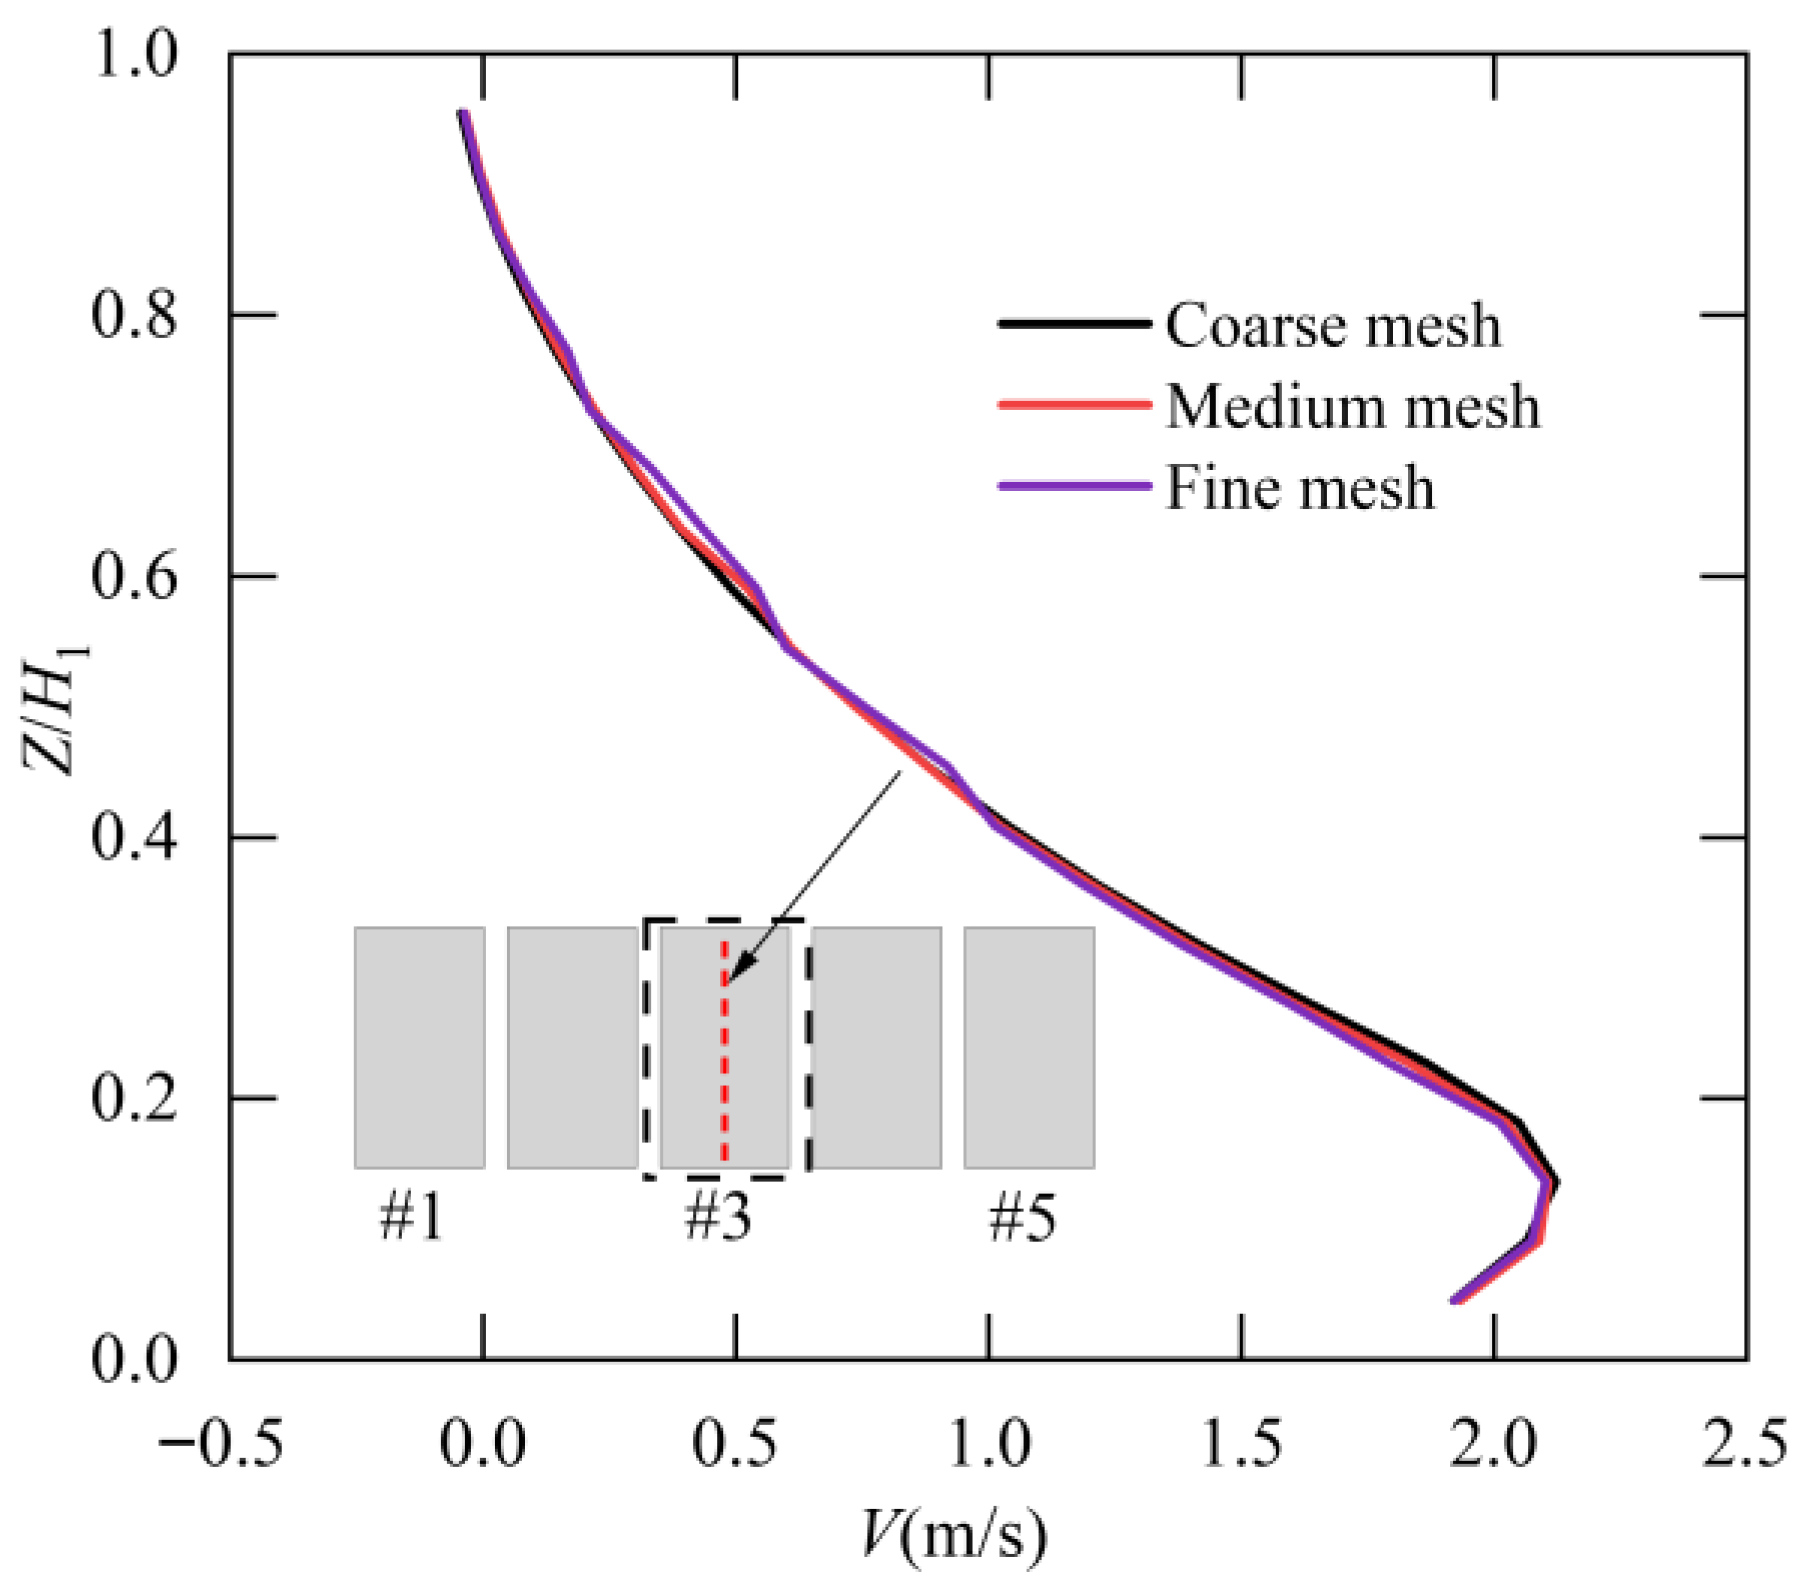
Table 2 presents the numbers of nodes for the coarse, medium, and fine meshes, along with the maximum-to-average velocity ratio (Vmax/Vave) at the trash rack and the corresponding errors relative to the fine mesh. With mesh refinement, Vmax/Vave increases from 2.532 to 2.736; However, the difference between the medium and fine meshes is relatively small. The relative error decreases from 7.47% to 1.20%, indicating that the numerical results tend to converge. Figure 3 shows the velocity distribution along the centerline of Channel #3 at the trash rack cross-section. It can be seen that the results obtained with the medium and fine meshes are nearly identical, whereas the coarse mesh exhibits relatively large deviations in the near-wall region and low-velocity areas. Considering both computational accuracy and computational cost, the medium mesh (approximately 15 million cells) is adopted for the subsequent simulations, which improves computational efficiency while maintaining adequate accuracy. Figure 3 and all flow field contours presented in the manuscript show the instantaneous velocity distribution at a representative time instant after the solution had reached a statistically steady state, in order to reflect the characteristic flow structures under the given operating condition.

3. Results and Discussion

3.1. Hydraulic Characteristics Analysis of Trash Rack Cross-Section

In multi-channel flow-splitting structures, the uniformity of flow distribution directly affects energy losses and flow stability. To characterize the non-uniformity of flow distribution, several quantitative indices are introduced [9], including the channel flow ratio CR, the flow rate non-uniformity coefficient CQ, and the velocity non-uniformity coefficient CV. The corresponding definitions are given as follows:
C R = Q r Q a v e r
C Q = Q r Q a v e r Q a v e r
C V = V m a x V a v e r
In the equations, Qr denotes the flow rate allocated to a single channel; Qaver is the average flow rate per channel; Vmax is the maximum velocity at the cross-section; Vaver is the average velocity at the cross-section. Ideally, the single-channel flow ratio is CR = 1. A value of CR < 1 indicates that the channel flow is less than the average channel flow, while CR > 1 indicates that the channel flow exceeds the average.
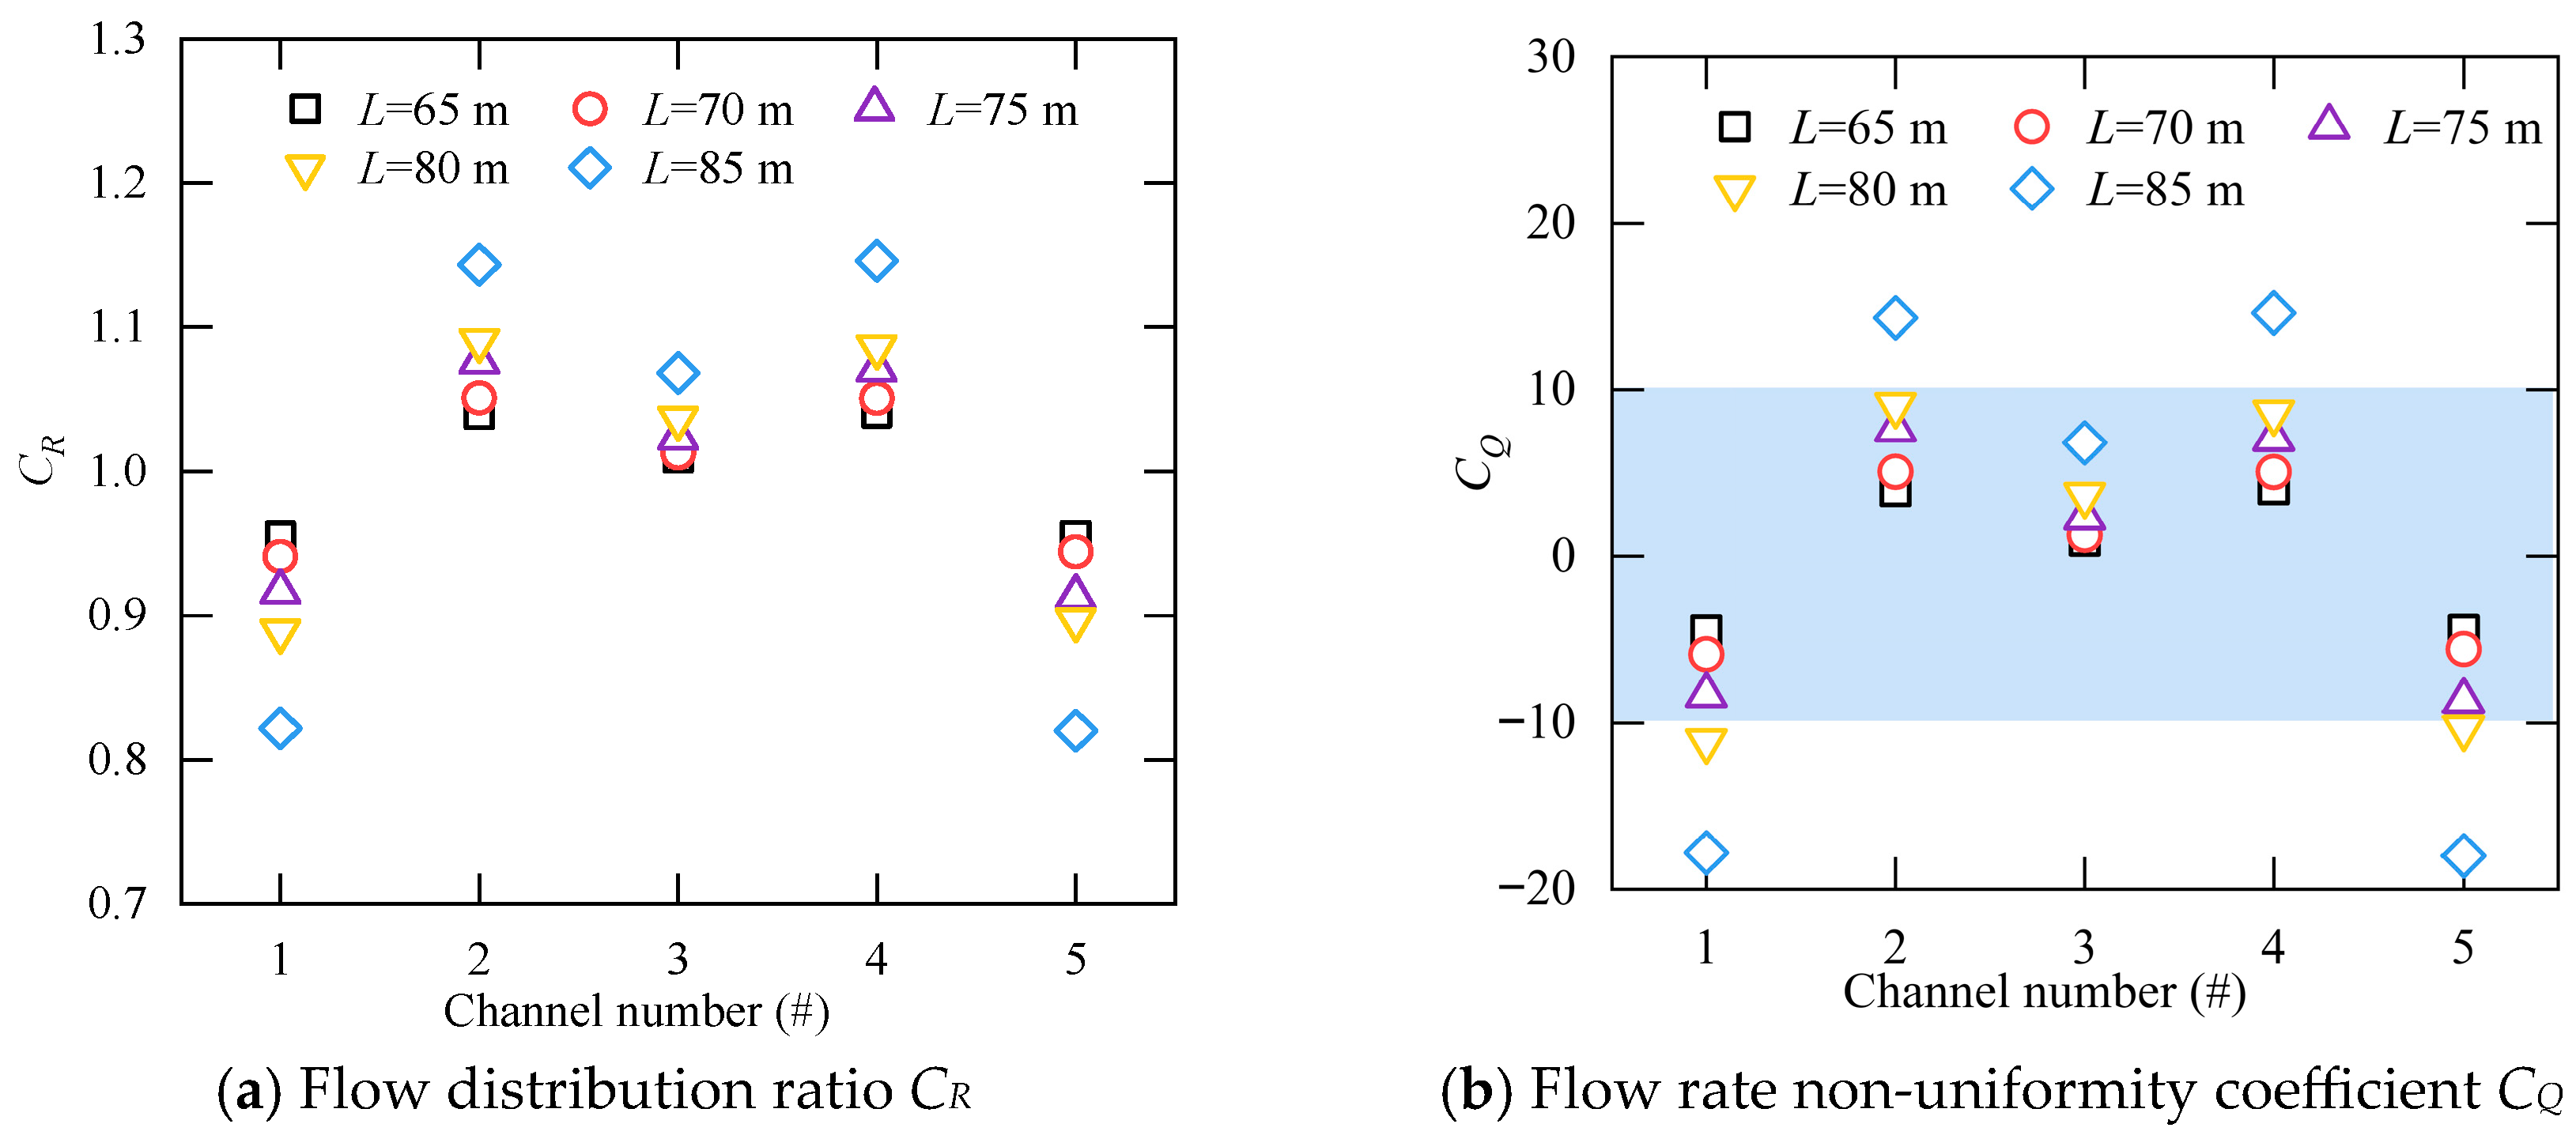
With other characteristic parameters held constant, changes in the diffuser length can alter the flow distribution characteristics and flow stability. As shown in Figure 4, under all operating conditions, the distributions of CR and CQ exhibit similar patterns. The flow ratios of the middle three channels (#2, #3, and #4) are generally higher, while the side channels (#1 and #5) have relatively lower ratios, forming a distribution pattern of “higher in the middle, lower on both sides”. When 65 m ≤ L ≤ 75 m, the CQ values for all channels satisfy the criterion of being less than 10%, indicating that the overall flow distribution is within an acceptable range. As the length L continues to increase, the CQ values for the side channels (#1 and #5) deviate more significantly and no longer meet the design standard, indicating severe flow imbalance and increased non-uniformity.
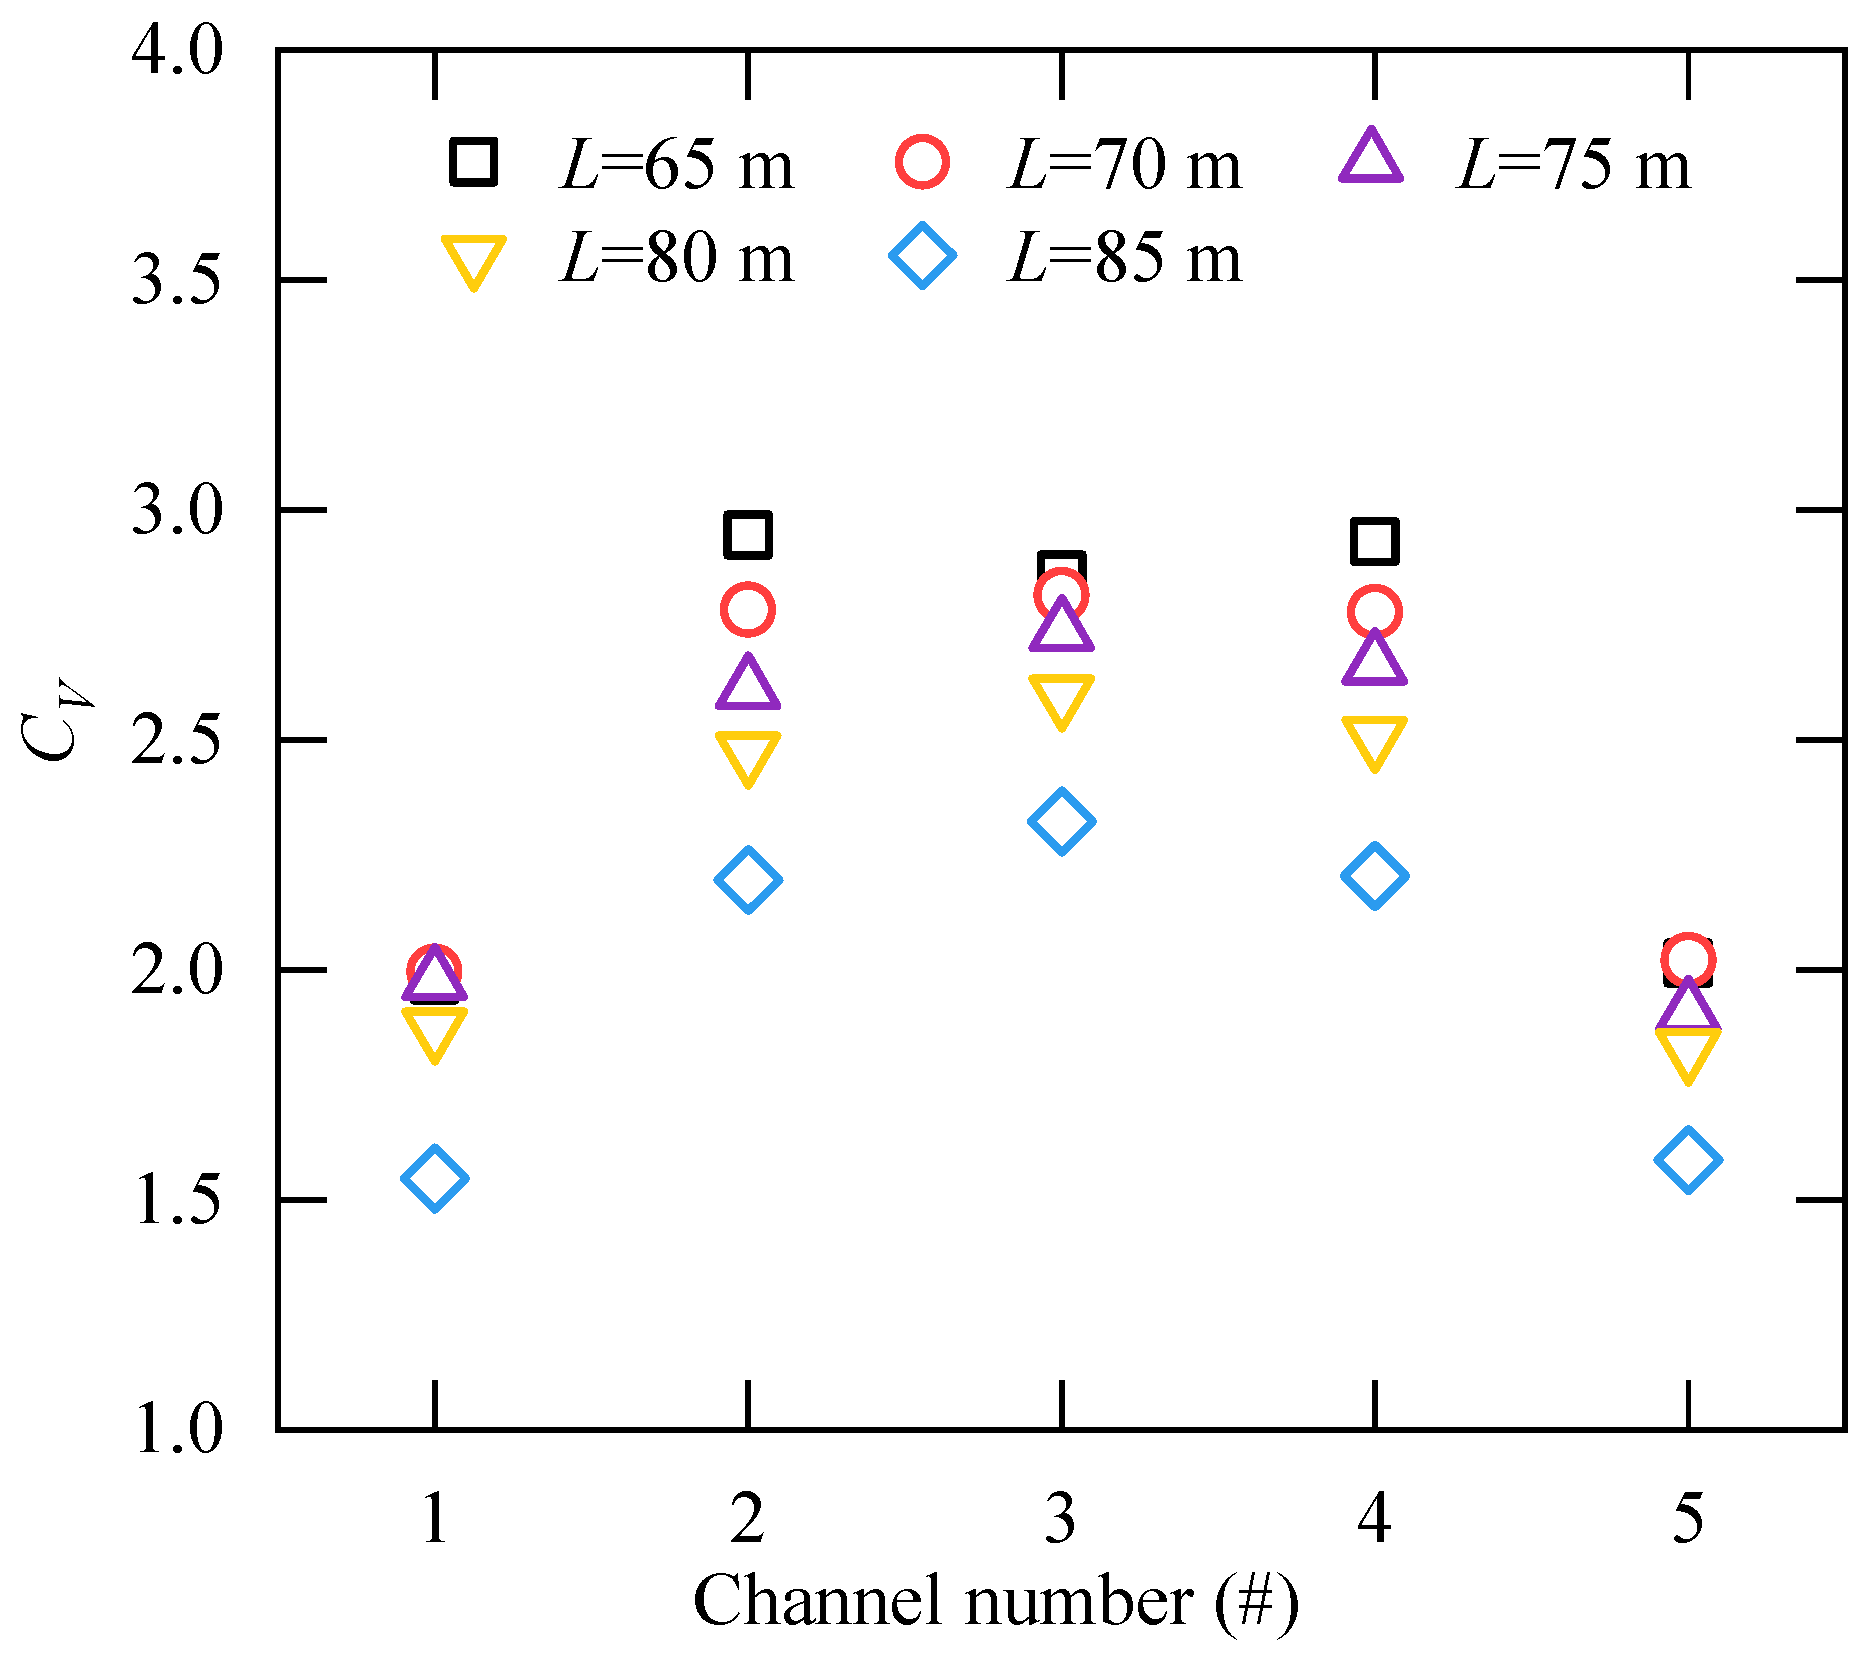
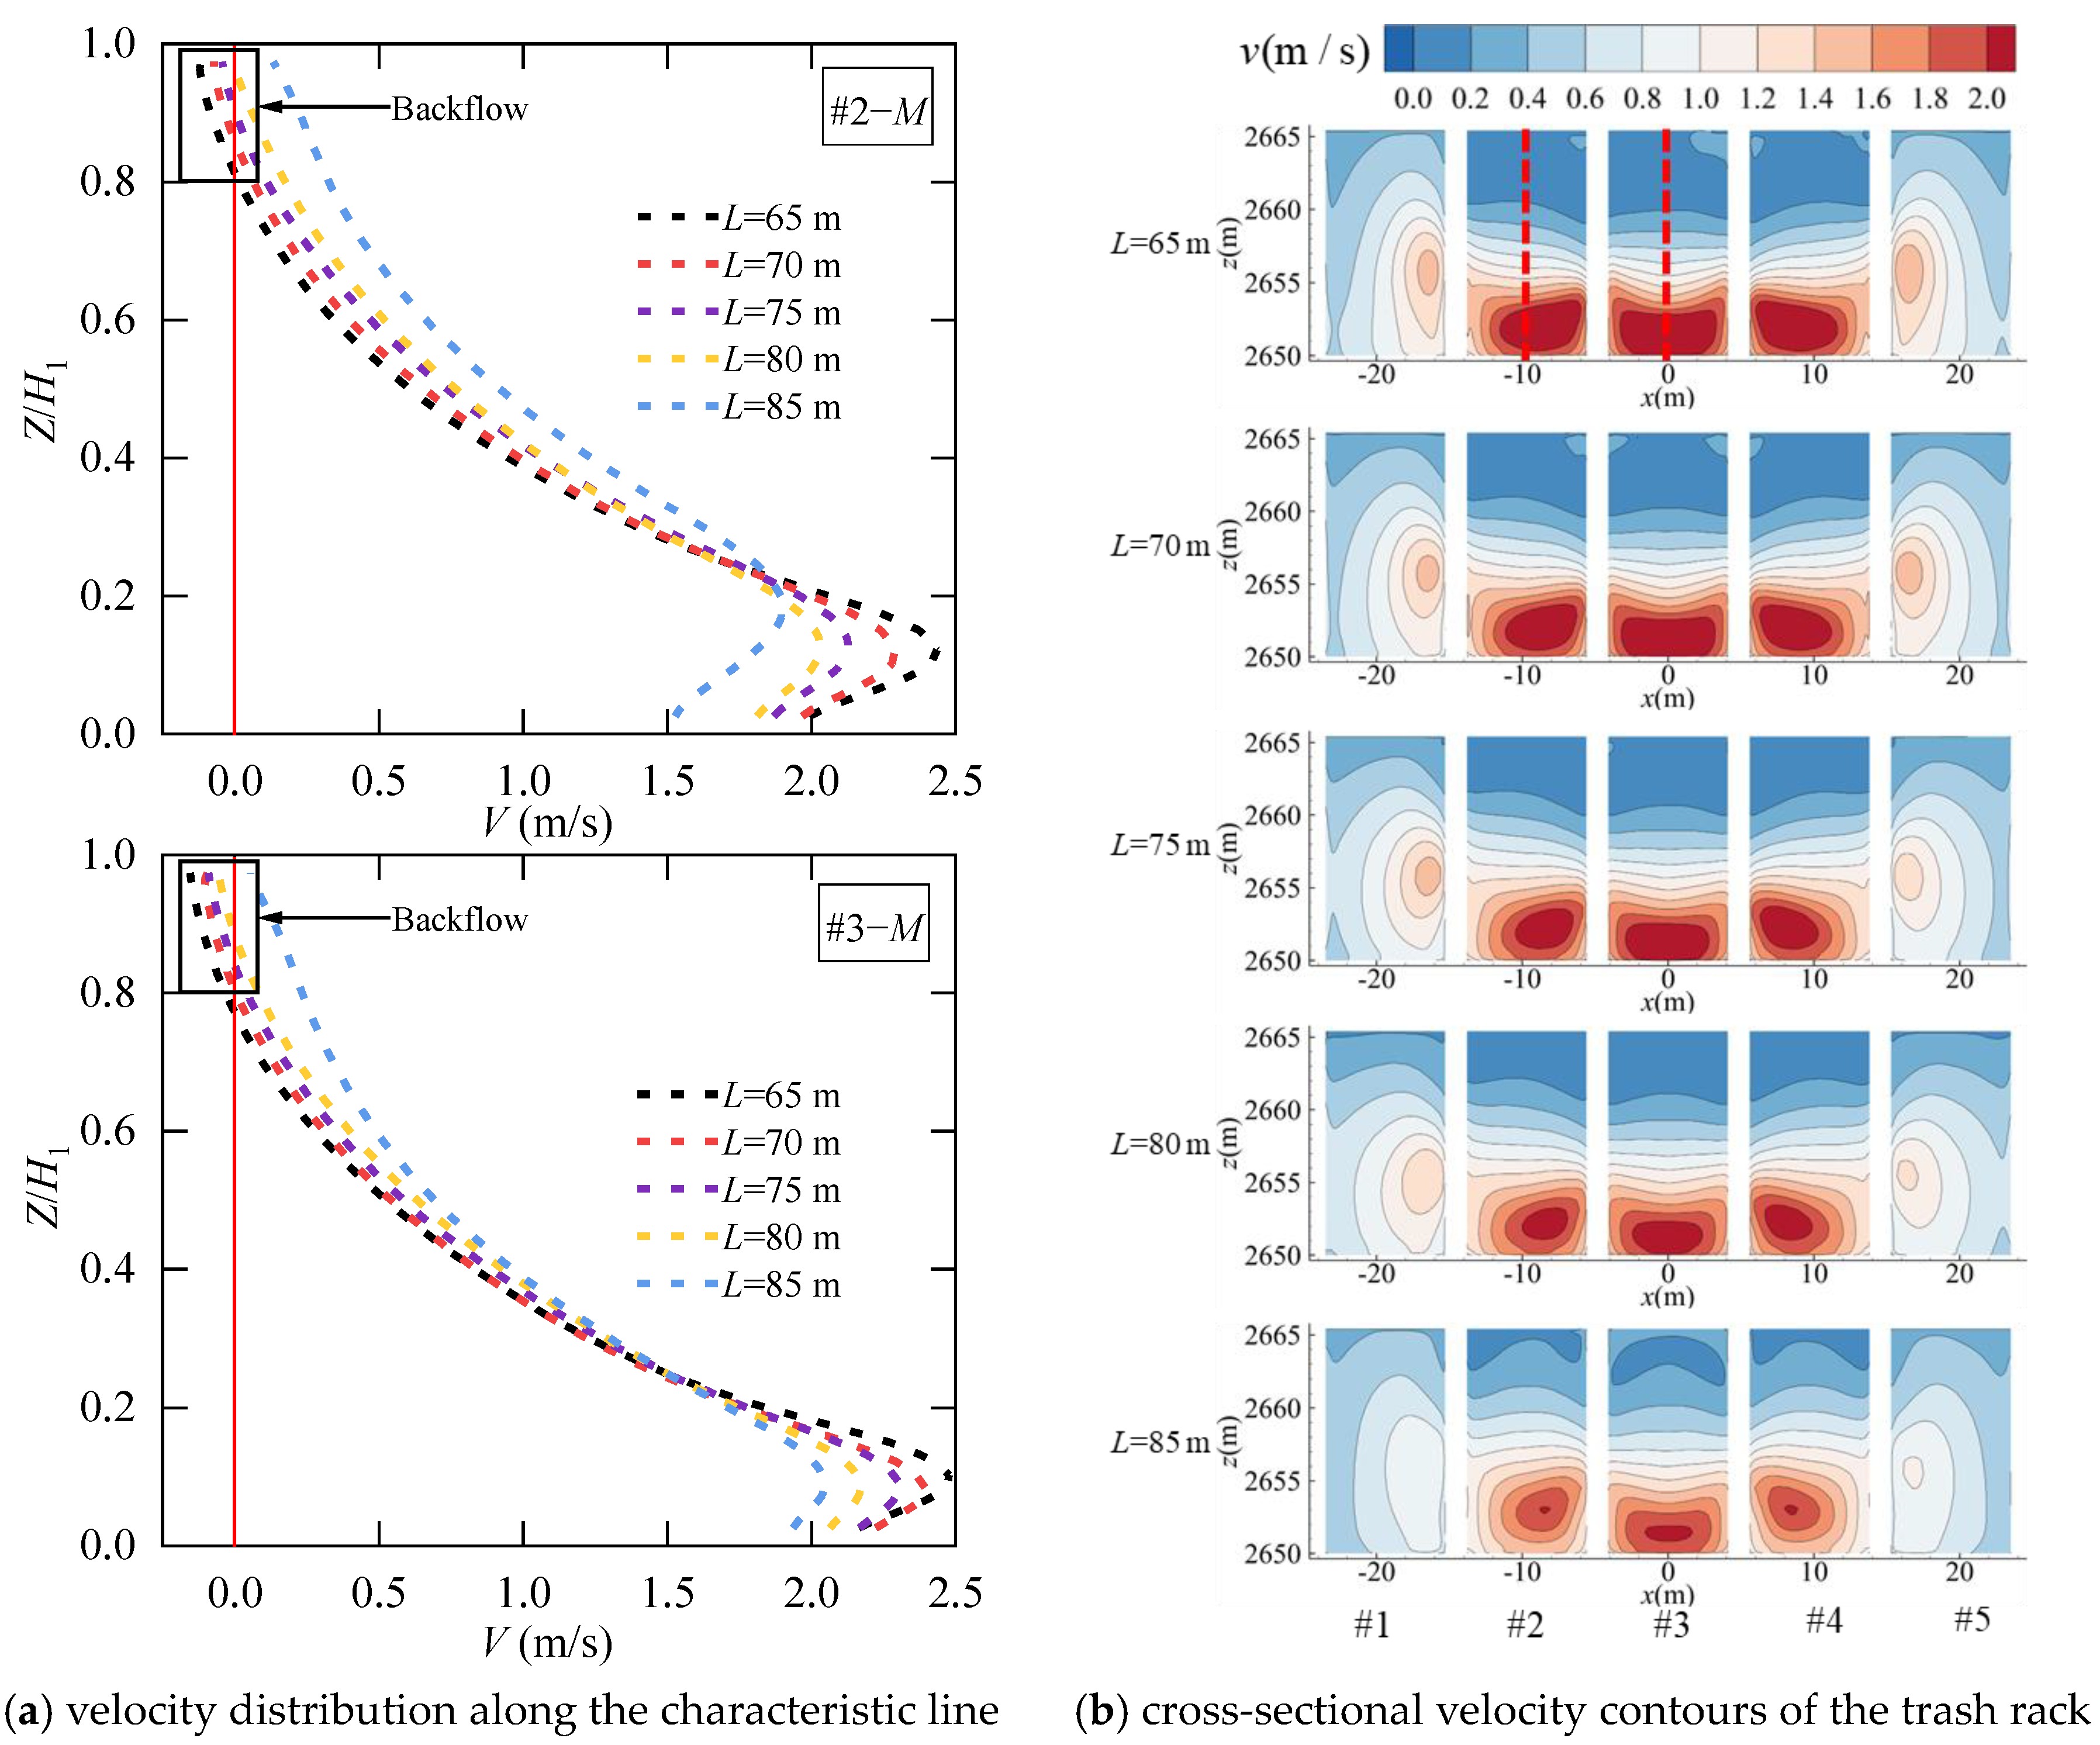
As shown in Figure 5, the velocity non-uniformity coefficient CV at the trash rack cross-section exhibits higher values in the middle channels and lower values in the side channels. Under conditions with a shorter diffuser, the CV of all channels increases significantly, indicating enhanced velocity fluctuations and reduced flow stability. As shown in Figure 6, the main flow is concentrated in the middle to lower parts of the channels, with high-velocity regions primarily distributed in Channels #2, #3, and #4. As the diffuser length increases from 65 m to 85 m, the velocity distribution curves across the cross-section gradually become smoother. The high-velocity region near the bottom shrinks, while the velocity gradient in the middle to upper region (Z/H1 > 0.5) is significantly reduced, indicating that the fluid energy is more fully diffused and the velocity is more evenly redistributed in a longer diffuser. Under short diffuser conditions, a recirculation zone appears near the top of the trash rack, with a relatively large extent. When L ≥ 80 m, the recirculation zone gradually shrinks or even disappears, resulting in a more uniform overall velocity distribution.

3.2. Internal Flow Characteristics Analysis

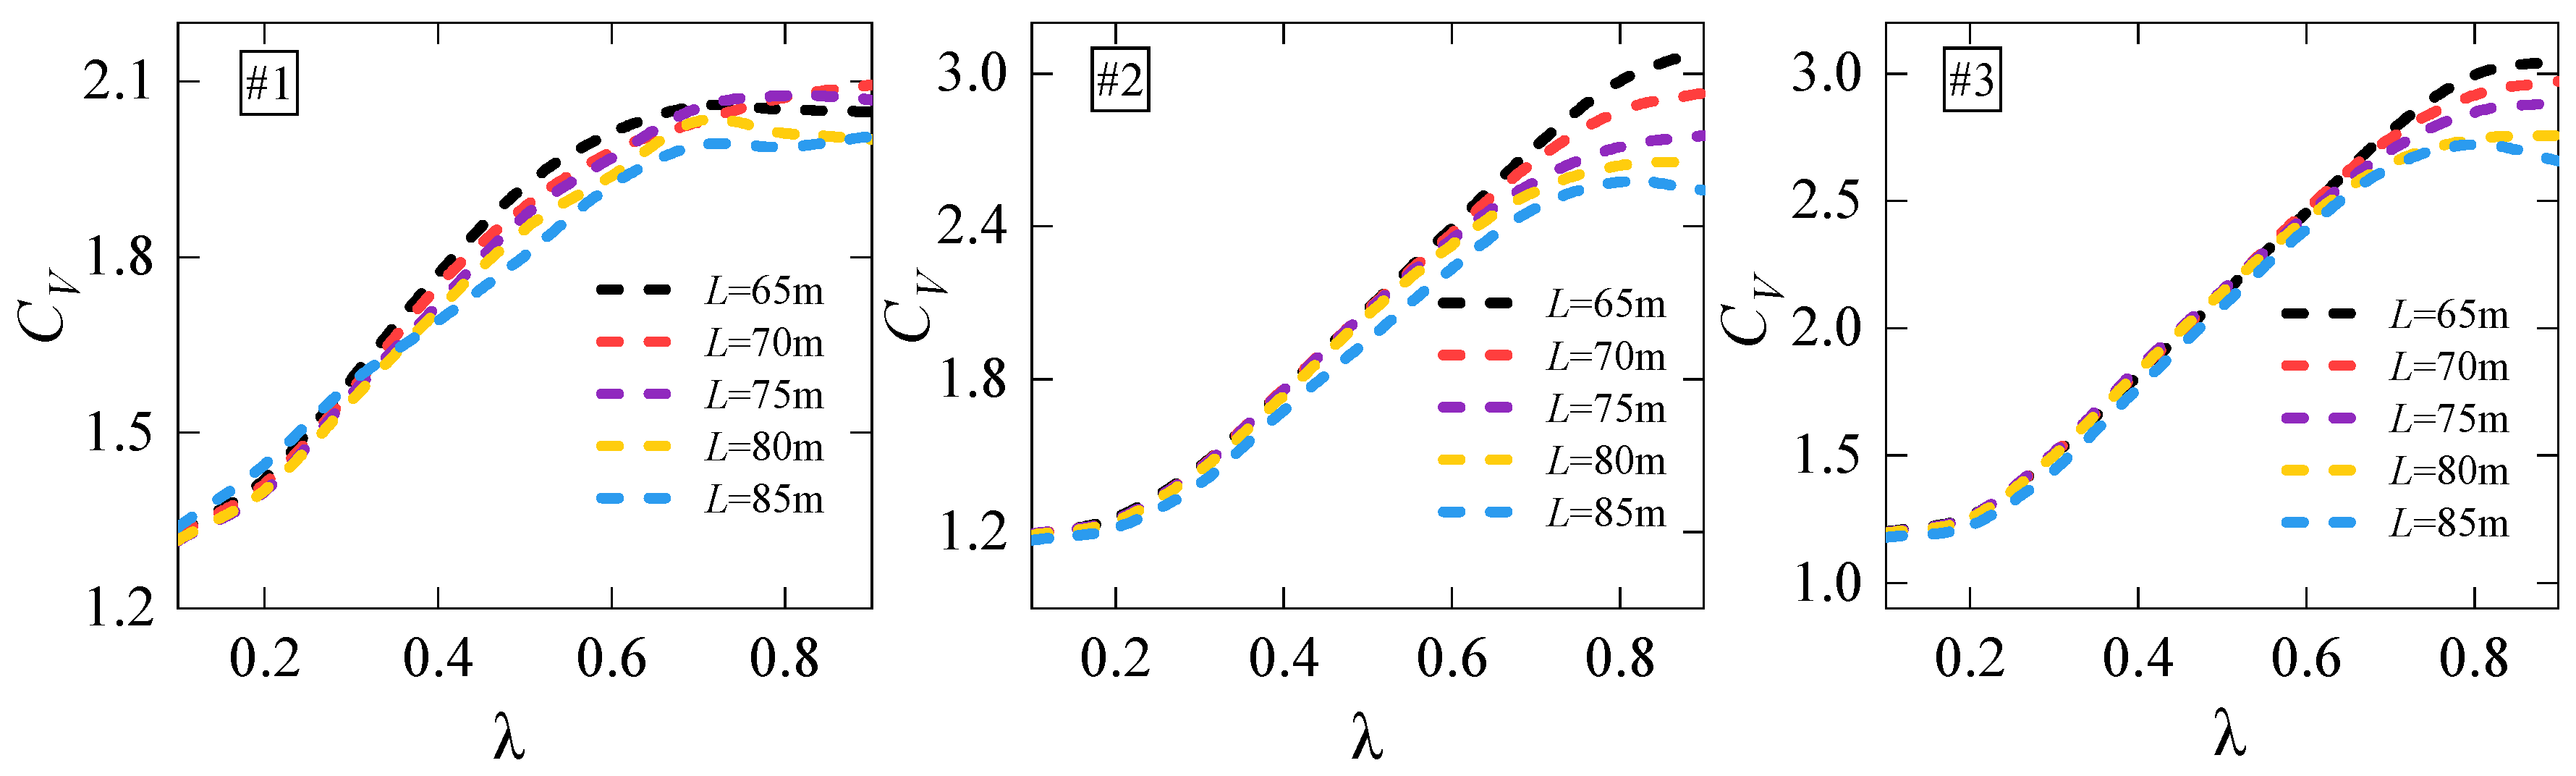
As shown in Figure 7, the velocity non-uniformity coefficient CV for Channels #1, #2, and #3 exhibits a similar trend along the variation in λ. As λ increases from 0.1 to 0.9, the CV values for all diffuser lengths L first increase, reach a peak, and then slightly decrease or level off. For Channel #1, when 0.1 ≤ λ ≤ 0.3, the CV values show no significant differences across different diffuser lengths L. When 0.3 < λ ≤ 0.9, the CV values exhibit an approximately negative correlation with L. That is, the longer the diffuser, the smaller the CV values. For Channels #2 and #3, the longitudinal variation patterns are generally consistent with those of Channel #1. Specifically, for 0.1 ≤ λ ≤ 0.4 in Channel #2 and 0.1 ≤ λ ≤ 0.6 in Channel #3, changes in diffuser length L have little effect on the CV values. In addition, the CV peak values for Channels #2 and #3 are generally higher than those for Channel #1, indicating that the geometric characteristics of different channels have a significant impact on the velocity distribution.
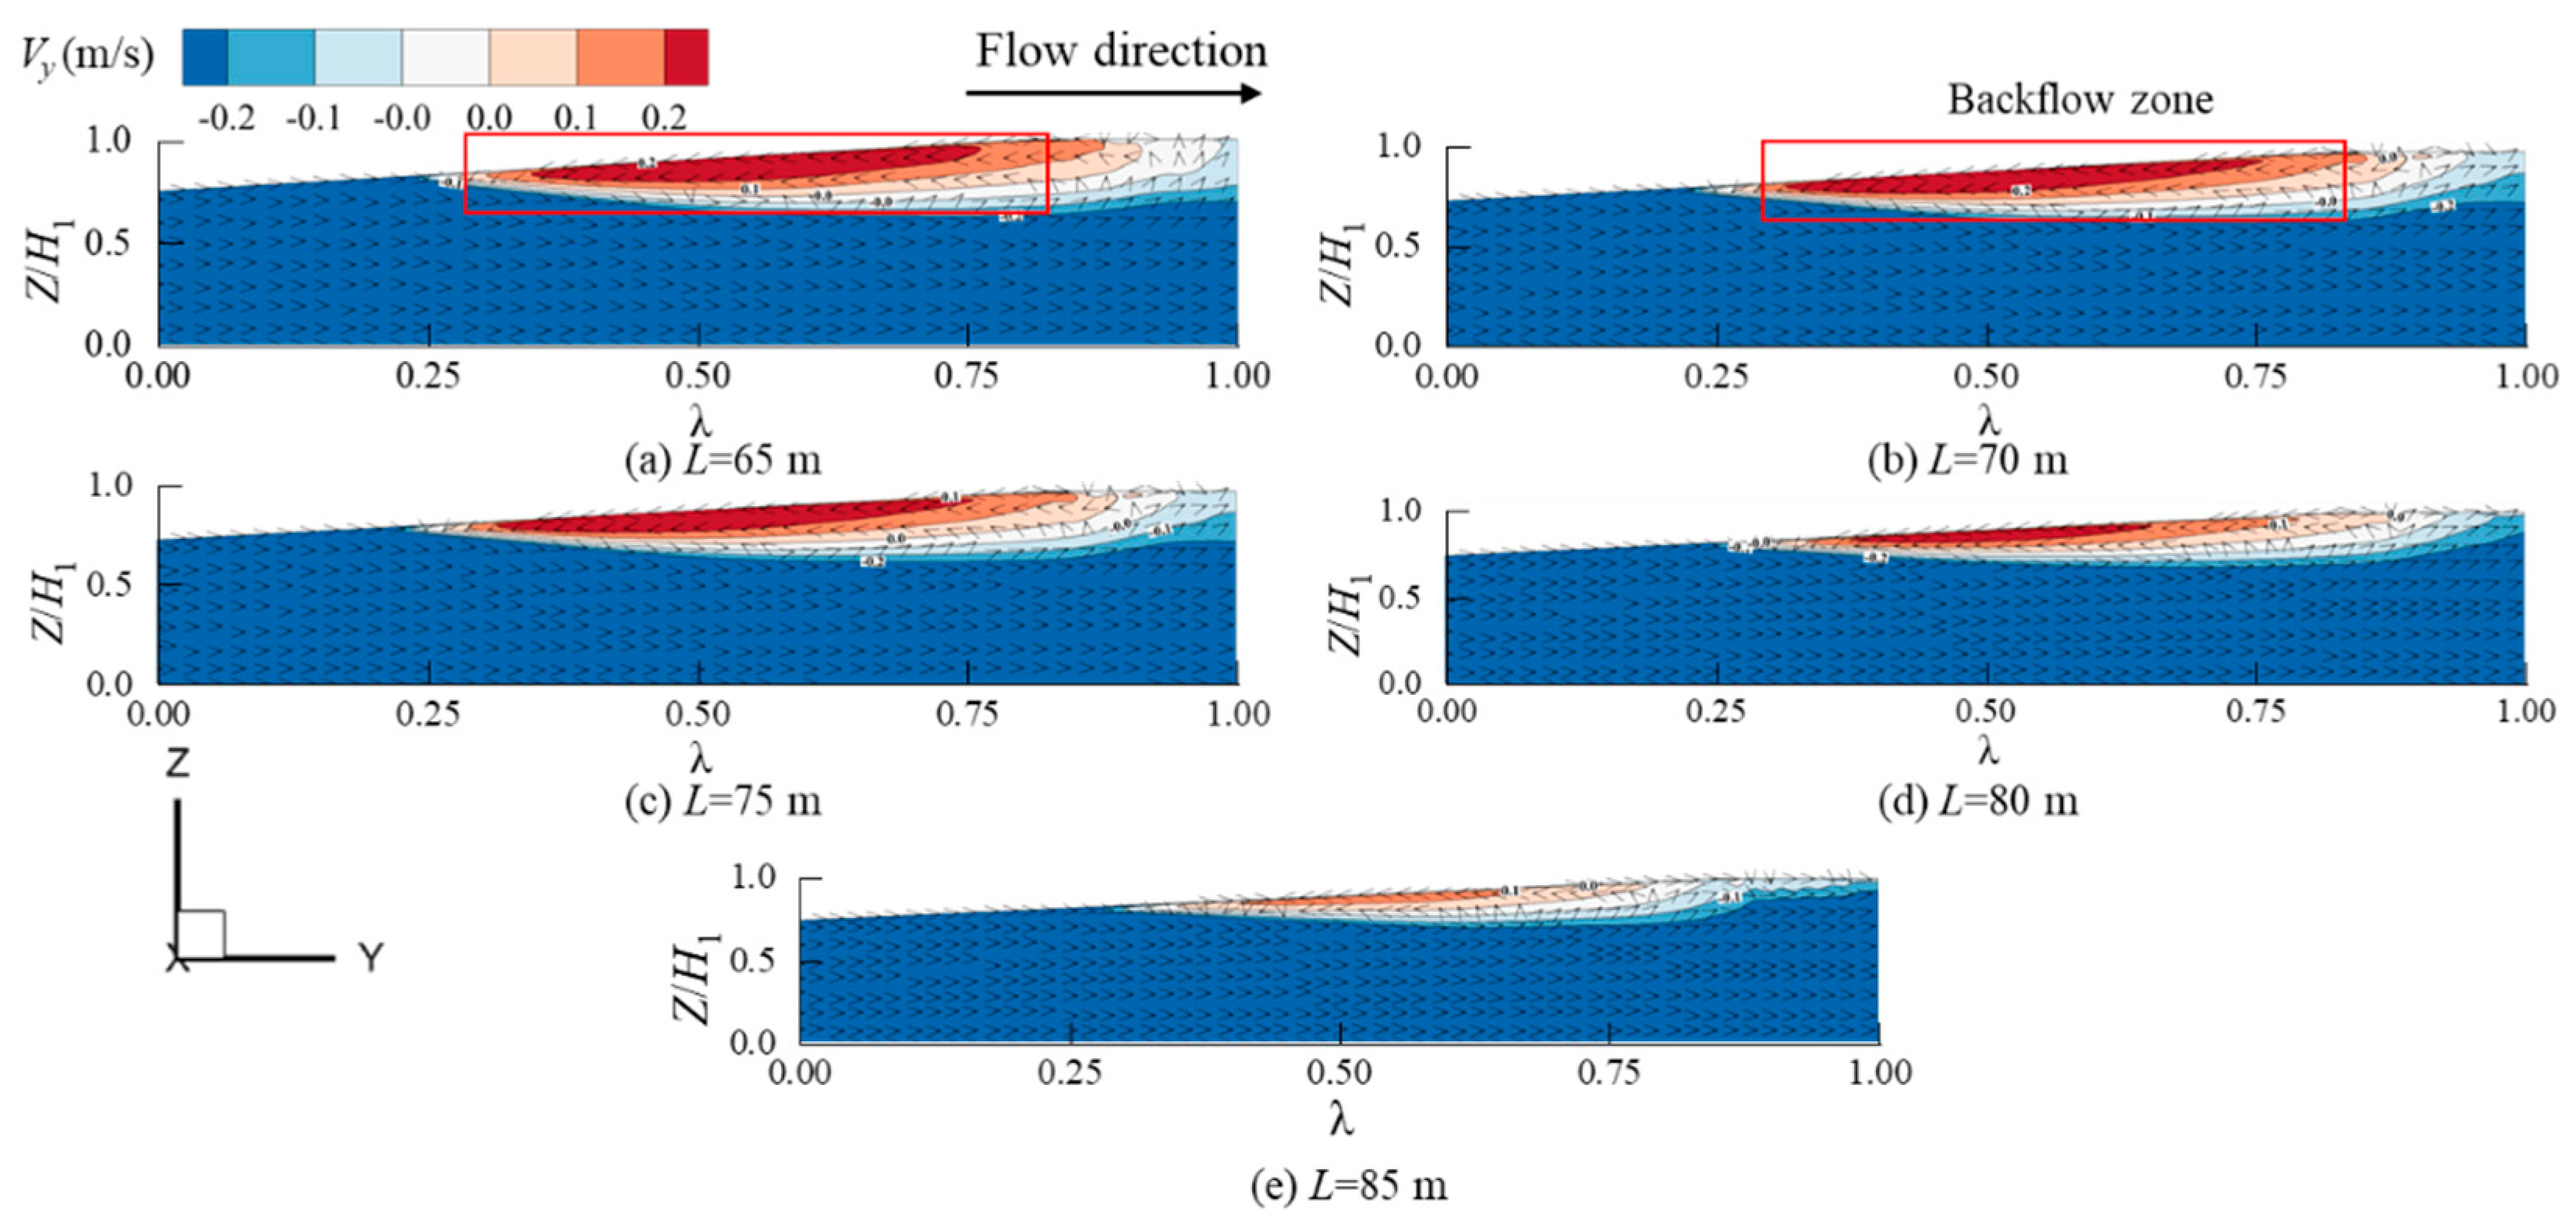
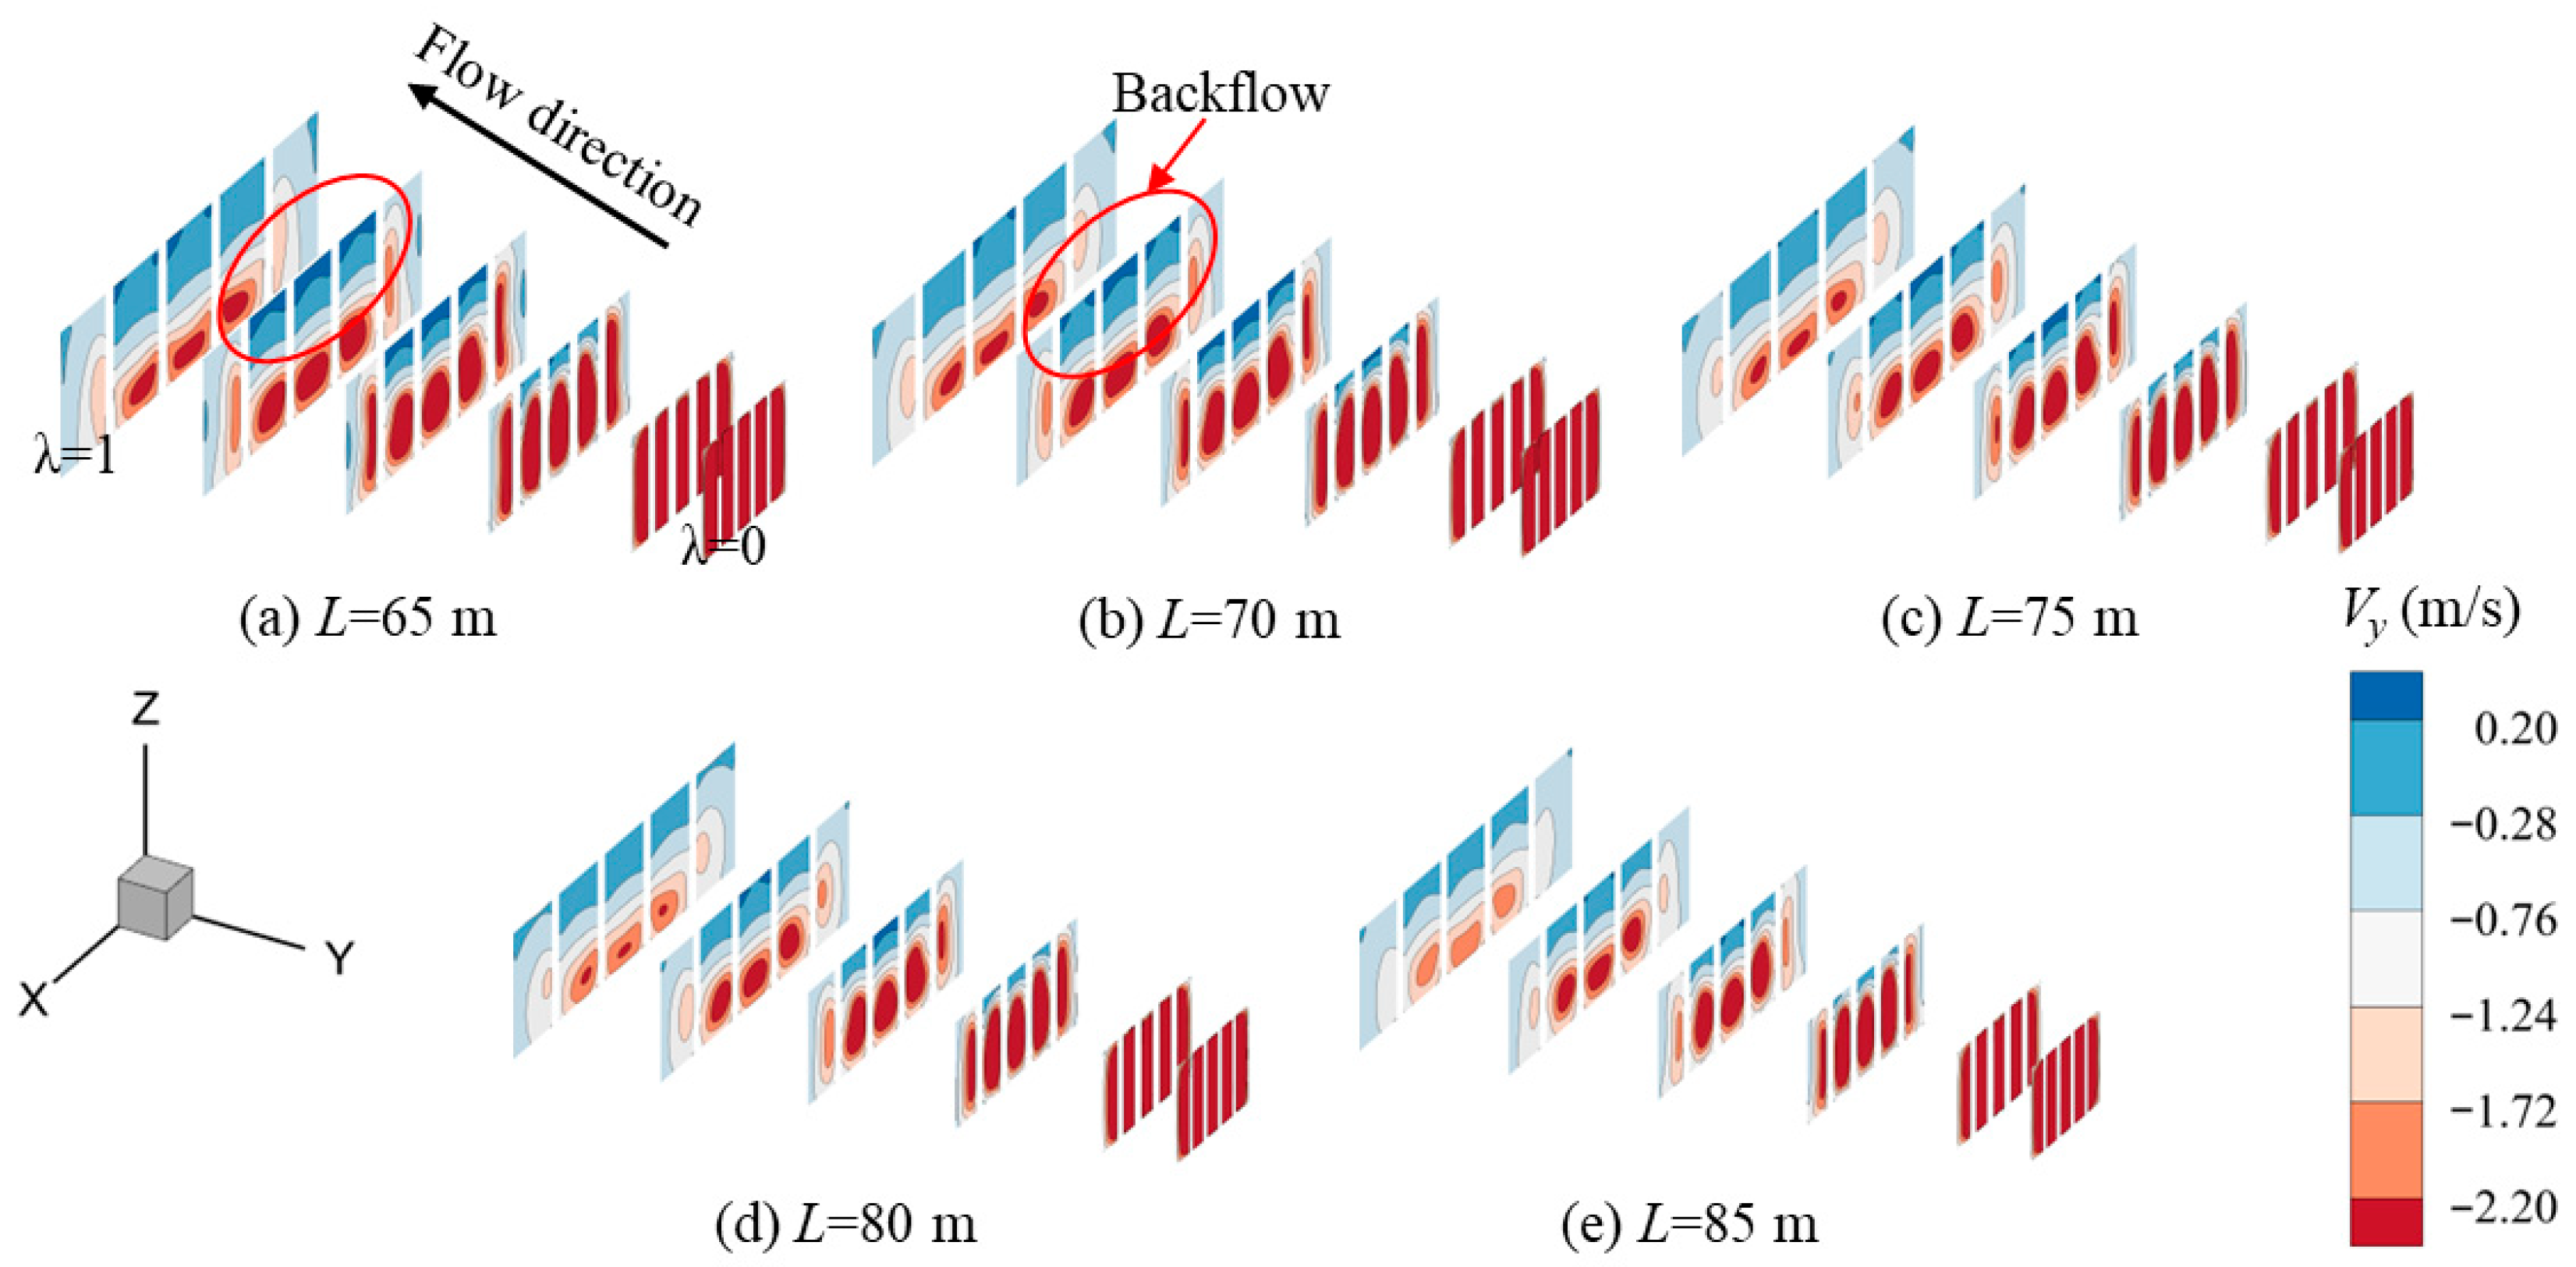
Figure 8 shows the Vy velocity distribution contours at six characteristic sections (λ = 0.1, 0.2, 0.4, 0.6, 0.8, 1) for different diffuser lengths L, highlighting the sensitivity to length and the flow separation characteristics. From the figure, it can be observed when L = 65 m, the flow within the channels experiences separation due to the adverse pressure gradient, resulting in a recirculation zone near the top of the diffuser, which is particularly pronounced at the characteristic sections λ = 0.6 and λ = 0.8. In the five parallel channels, the separation phenomena are more prominent in channels #2, #3, and #4, while the channels on both sides #1 and #5, maintain relatively stable flow structures, showing weaker separation tendencies and more uniform velocity diffusion characteristics. As shown in Figure 8e, when L = 85 m, the recirculation zone at the top of the diffusion section significantly shrinks, and the lateral diffusion of the overall flow field becomes more uniform. This indicates that a longer diffusion section can mitigate the effects of the adverse pressure gradient. At the same time, it can be observed that the range of the high-speed main flow area shrinks as L increases, further proving that a longer diffusion section can improve flow stability, allowing the flow field to approach a fully developed state. Meanwhile, it can be observed that the extent of the high-speed main flow region contracts with increasing L, further demonstrating that a longer diffuser can improve flow stability and promote the flow field to approach a fully developed state. The velocity distribution results of Vy at the middle cross-section of channel #3 further indicate that the length L not only affects the range distribution of the recirculation zone in the diffusion section, but also influences the intensity of the recirculation zone, as shown in Figure 9. With a shorter diffusion section, the flow separation at the top is pronounced, and the recirculation zone extends to the trash rack with considerable intensity. As the length increases, both the range and intensity of the recirculation zone significantly decrease, confirming that a longer diffusion section helps the flow field transition towards a fully developed state.

3.3. Energy Loss Analysis

According to the second law of thermodynamics, entropy production is caused by irreversible processes such as heat transfer, friction, and viscous dissipation in the flow. The entropy production theory provides an intuitive way to represent the location of flow losses and quantifies the energy dissipation within the flow field. Entropy production is a thermodynamic quantity used to characterize irreversible processes. For single-phase incompressible flow in a Cartesian coordinate system, when temperature rise and heat transfer are not considered, the entropy production rate transport equation per unit mass can be written as:
ρ ( s t + u s x + v s y + w s z ) = div q T + S ˙ D
In the equation, u, v and w represent the velocity components in the x, y and z directions of the Cartesian coordinate system, respectively; ρ represents the fluid density, kg/m3; T represents the fluid temperature, K; s represents absolute entropy production, J/(kg·K); q represents heat flux, W/m2; S ˙ D represents absolute entropy production rate, W/(m3·K).
The term on the far right of the equation represents the entropy production rate caused by viscous dissipation, revealing the entropy production mechanism in the transport process. According to the Reynolds-averaged Navier–Stokes equations, the entropy production of transient flow consists of two parts: one caused by the time-averaged velocity, and the other due to dissipation caused by fluctuating velocity. Therefore, the local entropy production can be expressed as:
S ˙ D = S ˙ D ¯ + S ˙ D
In the equation, S ˙ D ¯ is the entropy production rate caused by the time-averaged velocity field, also known as the direct dissipation entropy production rate. S ˙ D is the entropy production rate generated by the fluctuating velocity, also known as the turbulent dissipation entropy production rate. The expressions for S ˙ D ¯ and S ˙ D are as follows:
S ˙ D ¯ = μ T 2 u ¯ x 2 + v ¯ y 2 + w ¯ z 2 + u ¯ y + v ¯ x 2 + u ¯ z + w ¯ x 2 + w ¯ y + v ¯ z 2
S ˙ D = μ T 2 u x 2 + v y 2 + w z 2 + u y + v x 2 + u z + w x 2 + v z + w y 2
In the equation, μ represents the molecular viscosity of the fluid (laminar viscosity), Pa·s; However, numerical simulation results based on Reynolds-averaged methods cannot capture the information of the fluctuating velocity field. Studies by Kock [36] and Mathieu [37] have shown that the entropy production rate caused by velocity fluctuations is closely related to ε or ω in turbulence models and can be approximated as:
S ˙ D = ρ ε T
ε represents the turbulence dissipation rate, m2/s3; Therefore, the entropy production caused by both the time-averaged velocity and fluctuating velocity in a fluid volume can be expressed as:
S ˙ p r o , D ¯ = V S ˙ D ¯ d V
S ˙ p r o , D = V S ˙ D d V
S ˙ p r o = S ˙ p r o , D ¯ + S ˙ p r o , D
In the equation, S ˙ p r o represents the sum of the total time-averaged entropy production rate and the total fluctuating entropy production rate.
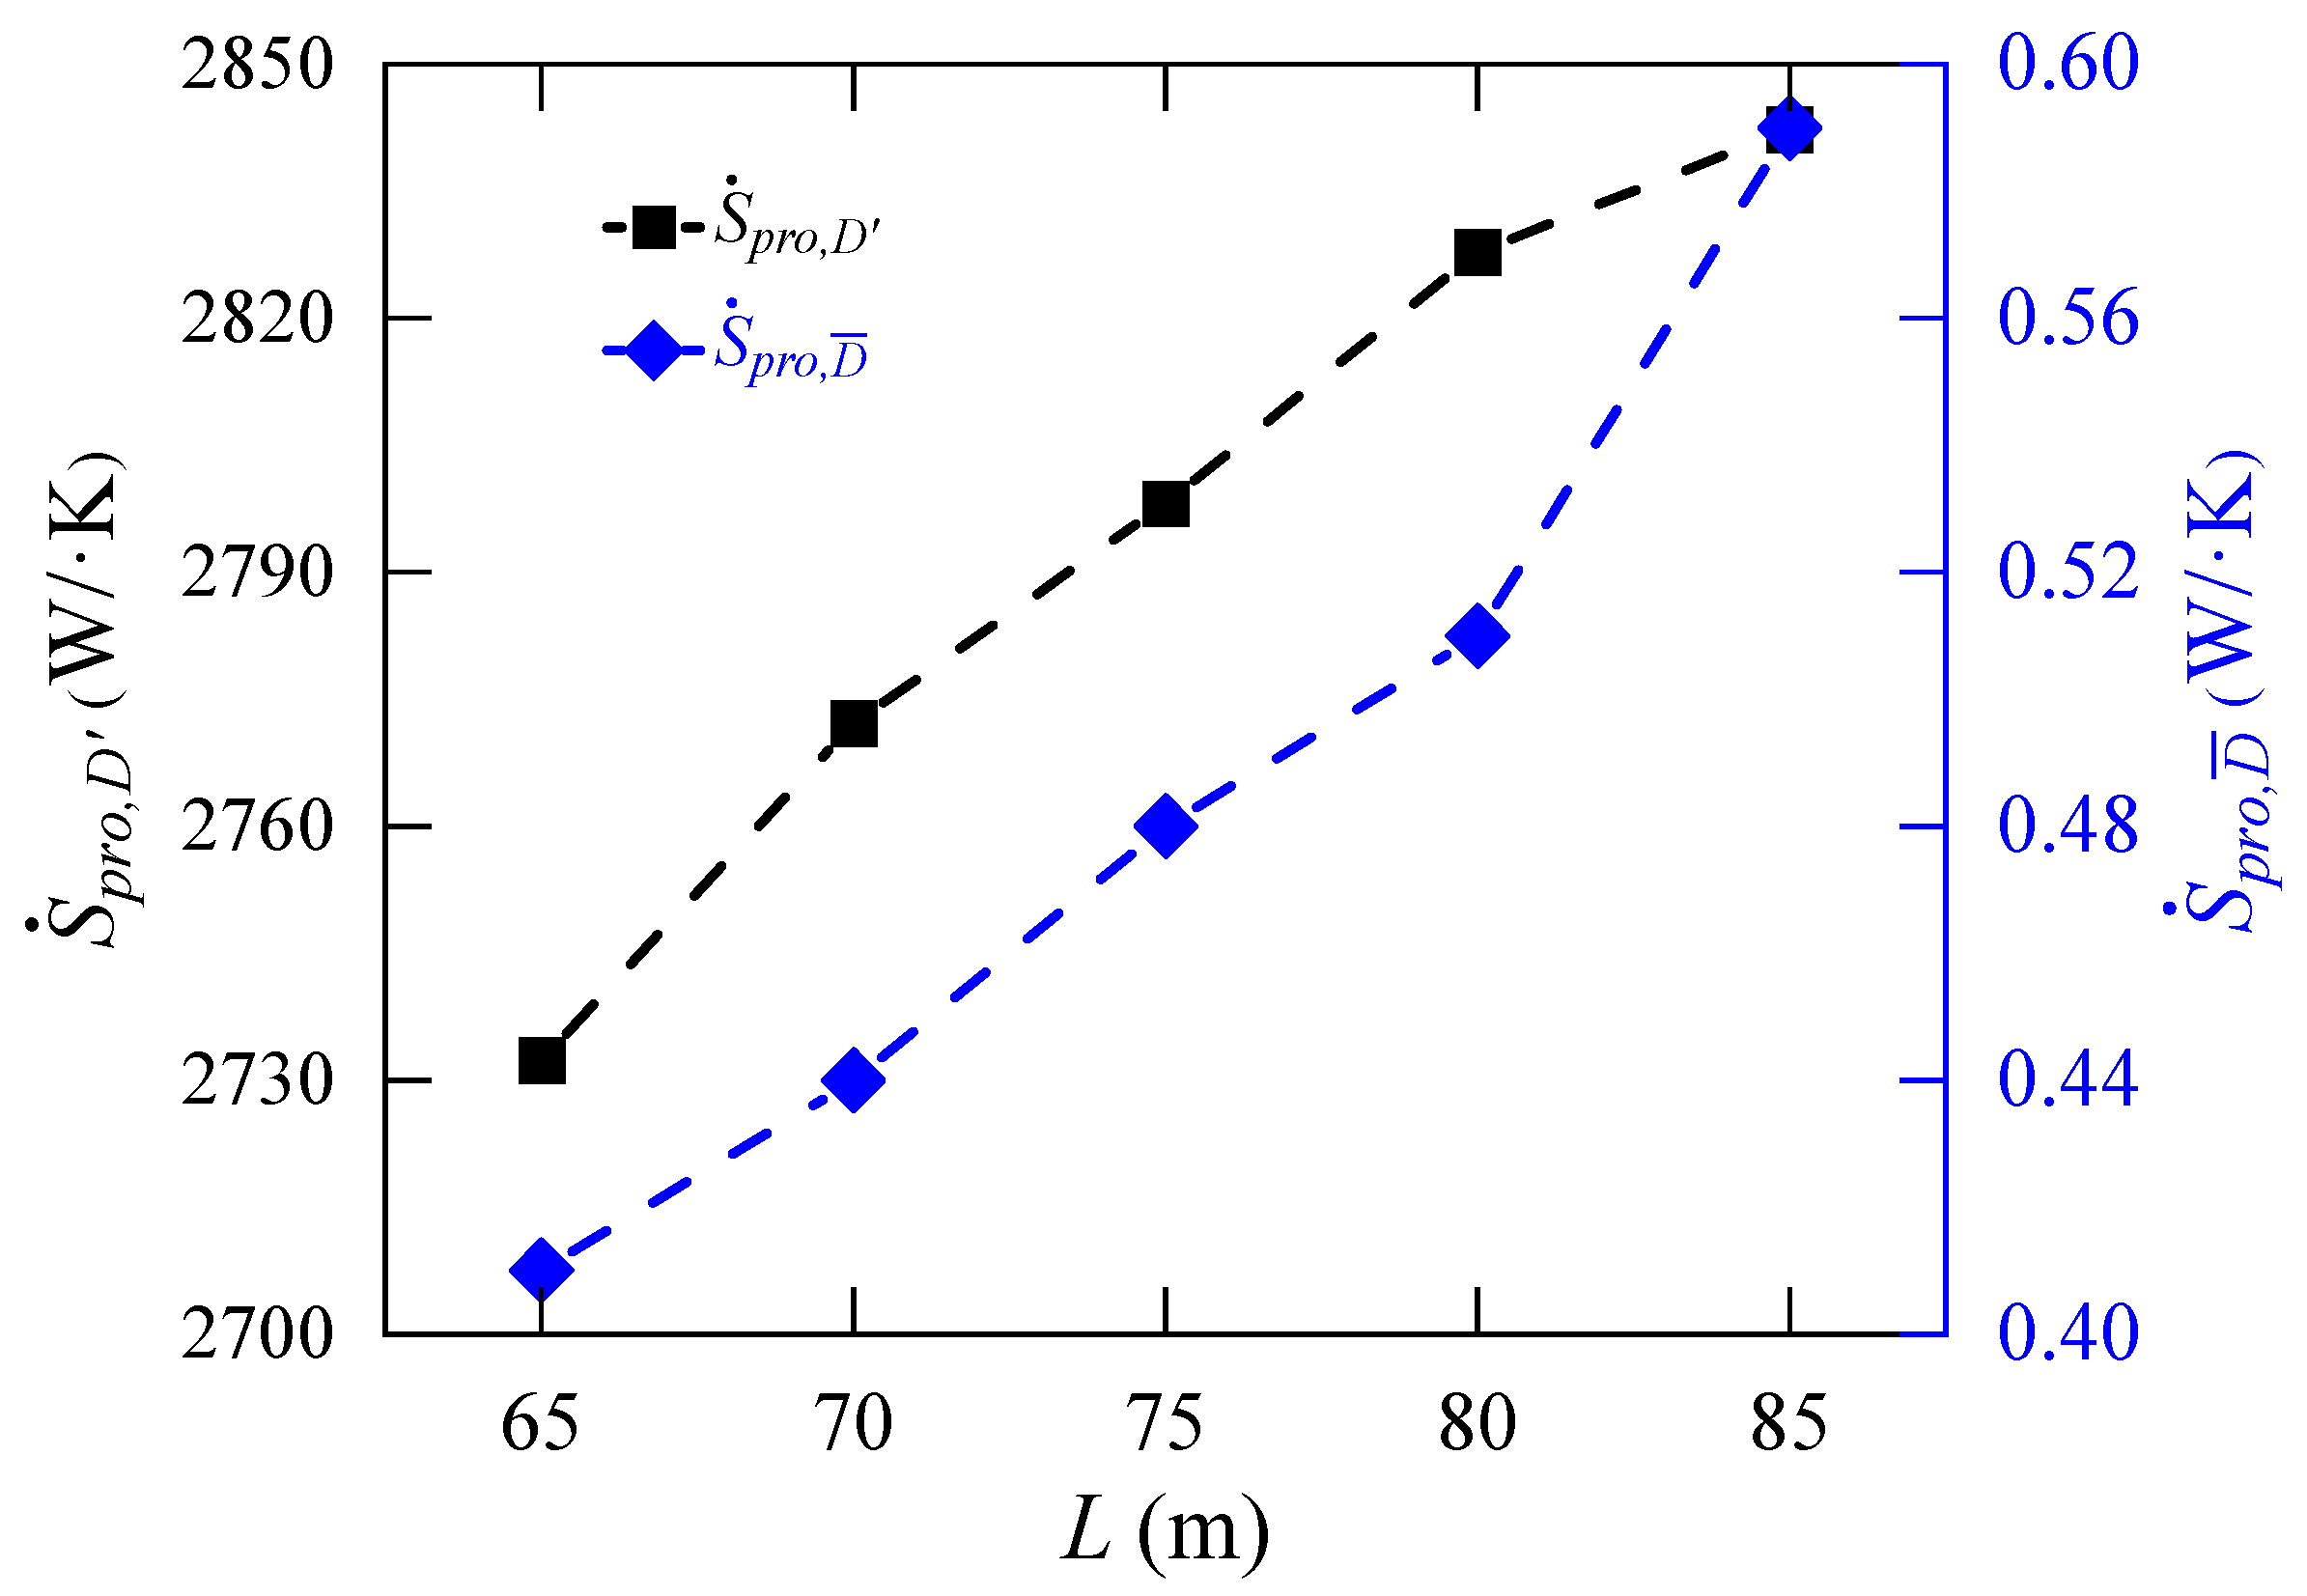
Figure 10 shows the effect of diffusion section length on the direct dissipation entropy production rate S ˙ p r o , D ¯ and the turbulence dissipation entropy production rate S ˙ p r o , D . It can be seen that both curves exhibit a linear growth trend, indicating a positive correlation between the diffusion section length and energy loss.
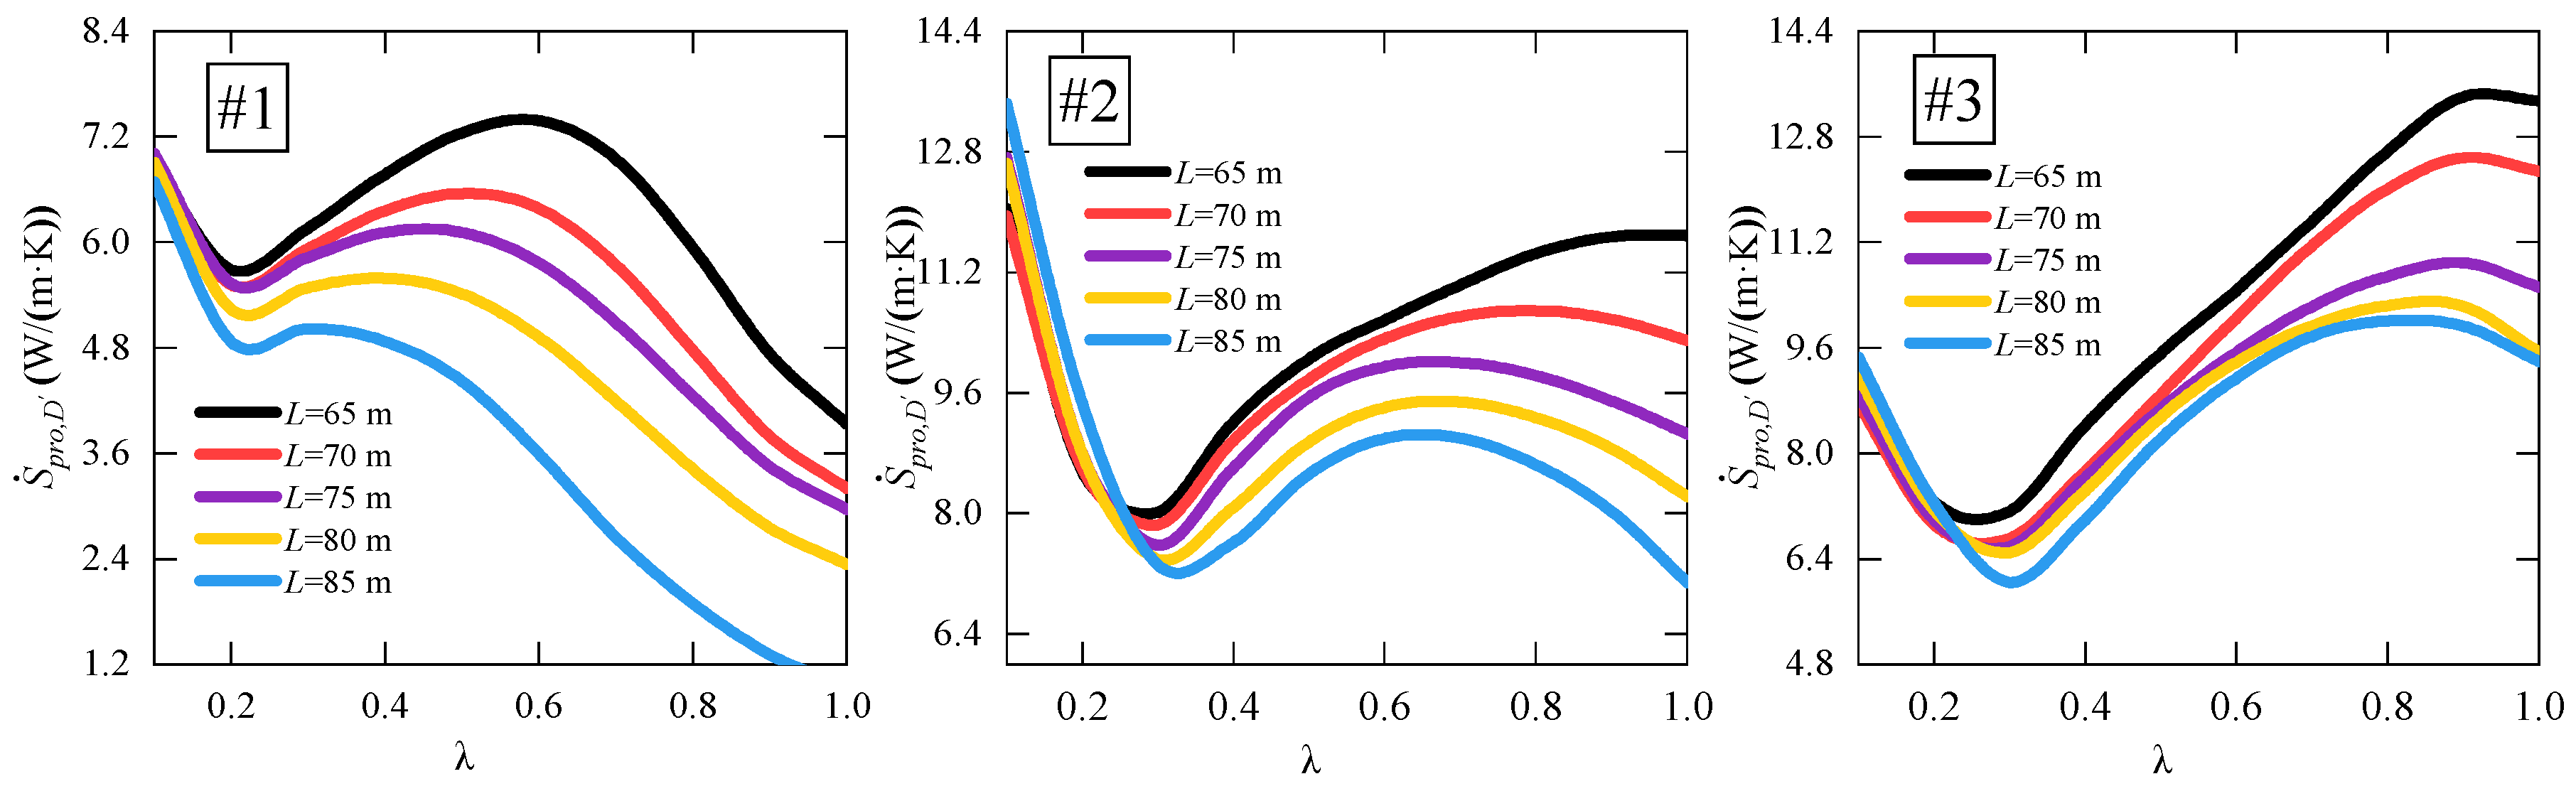
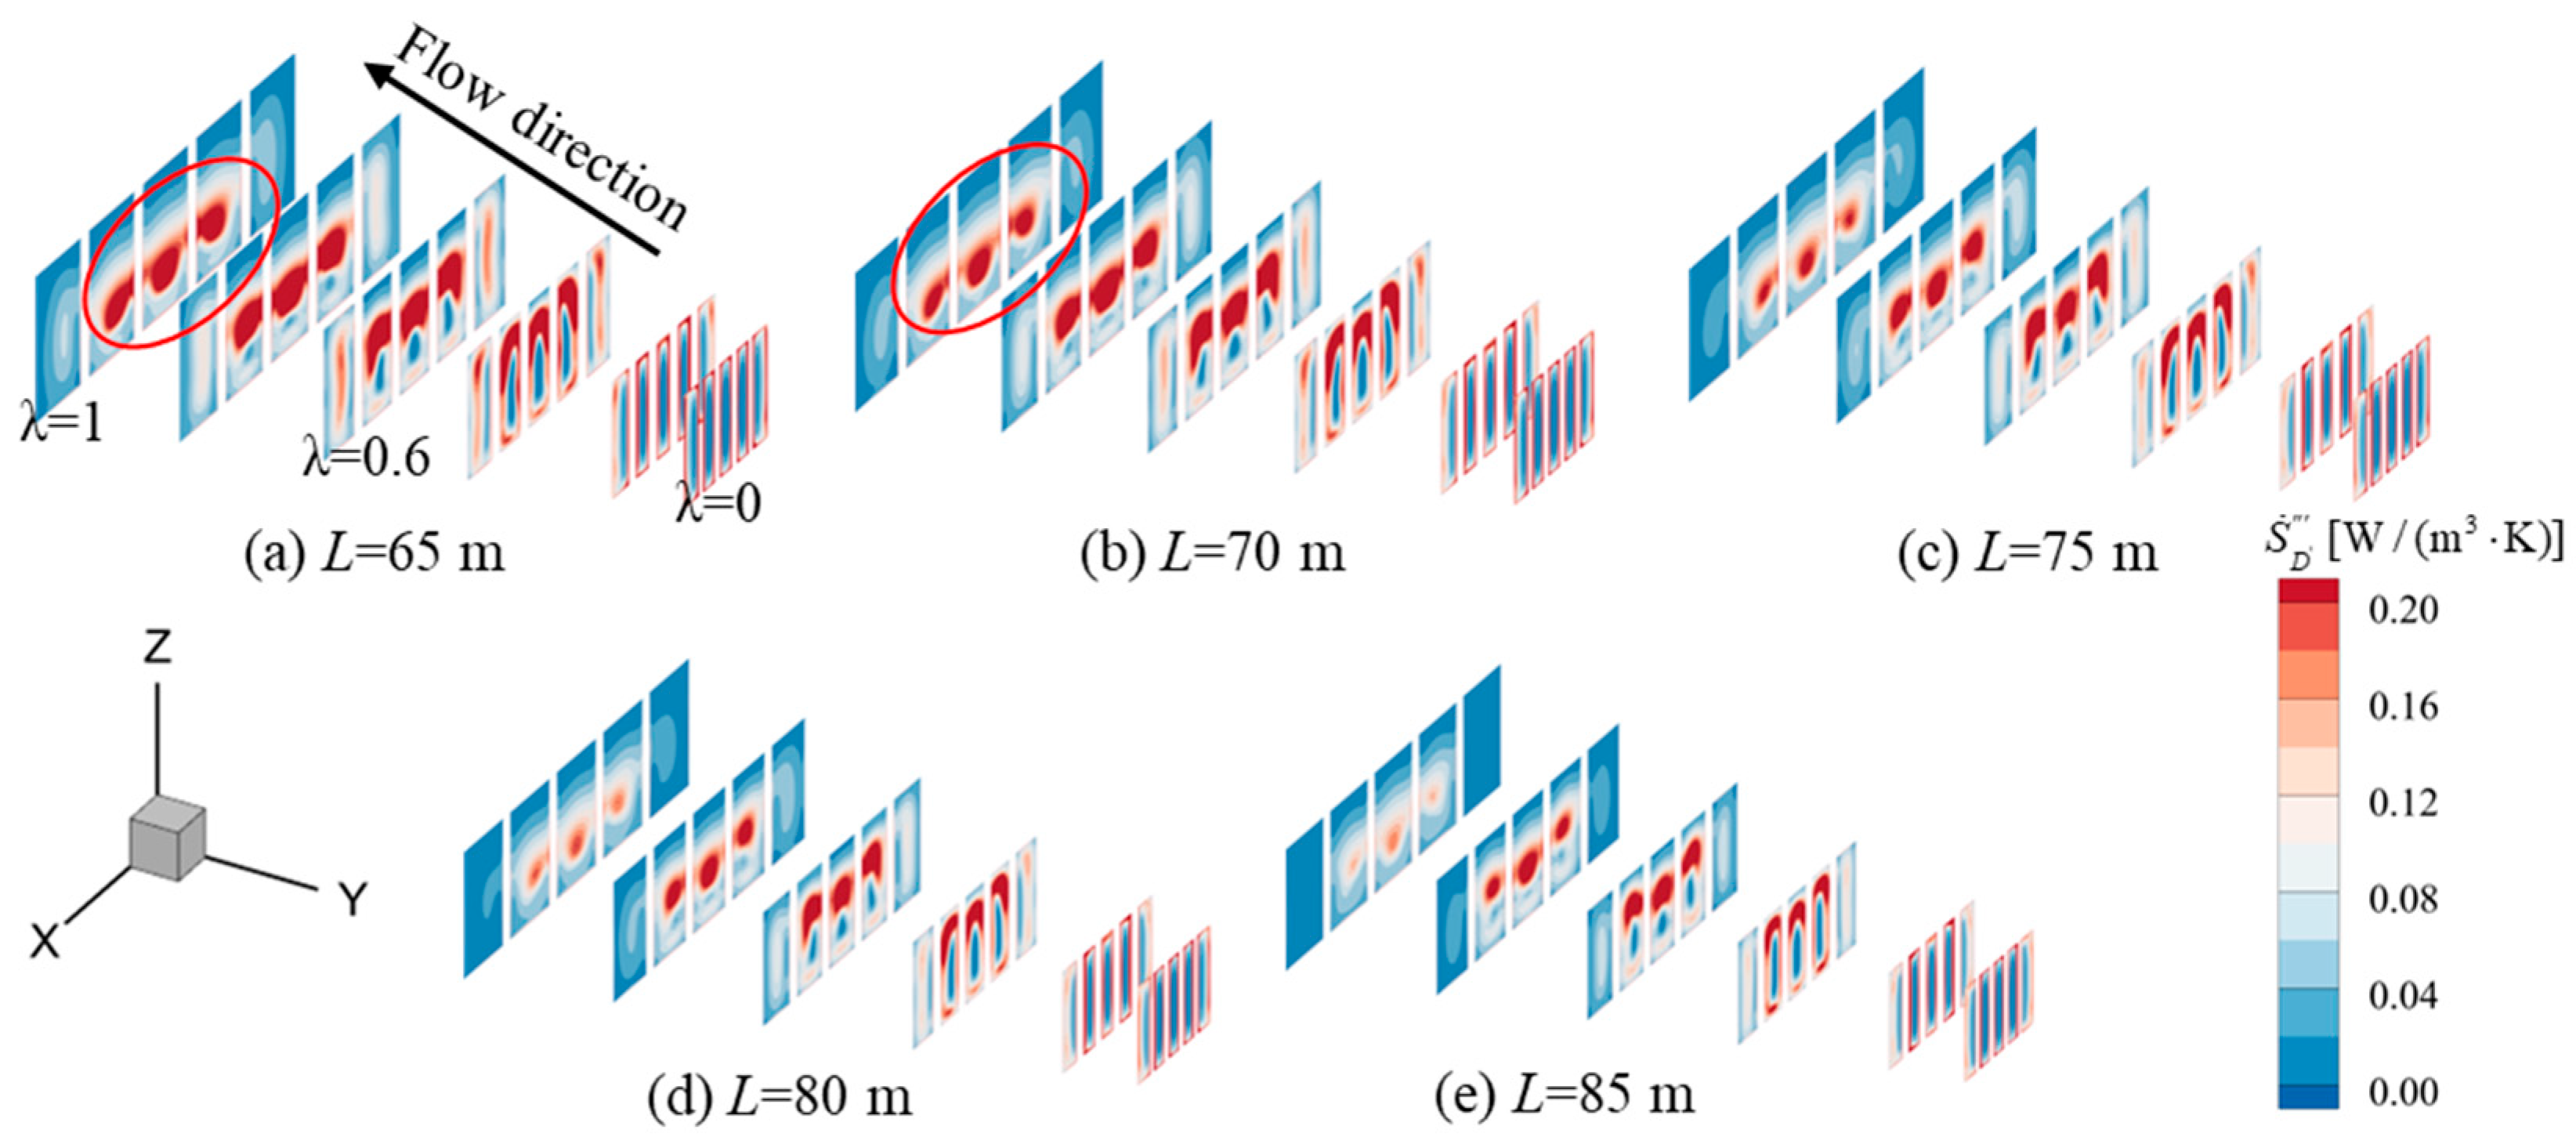
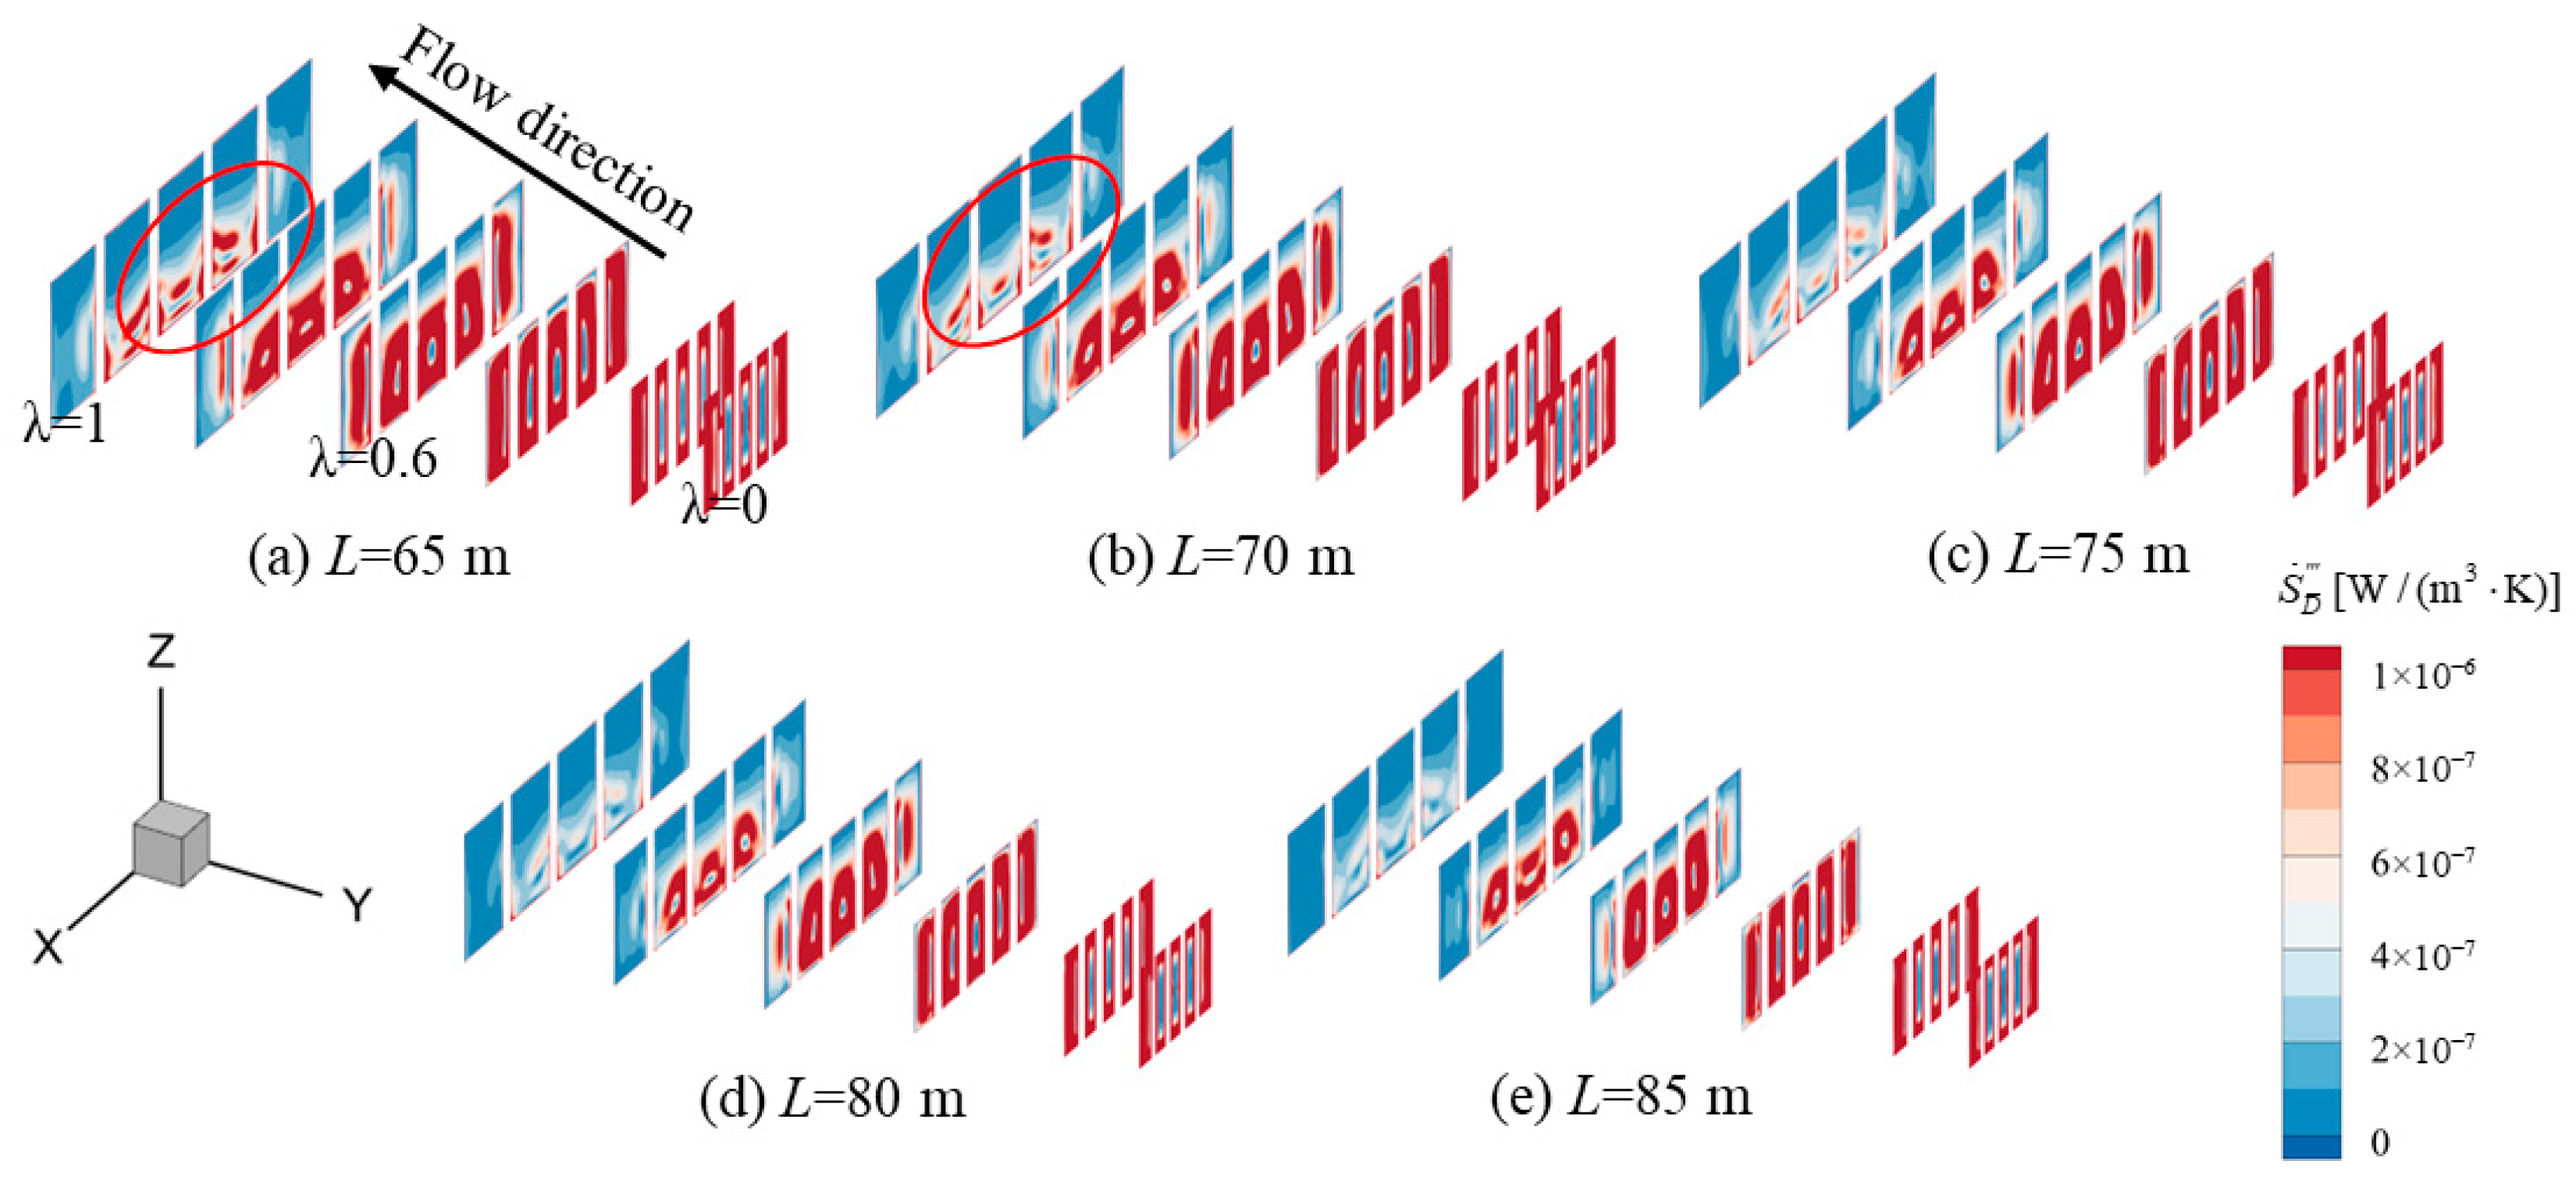
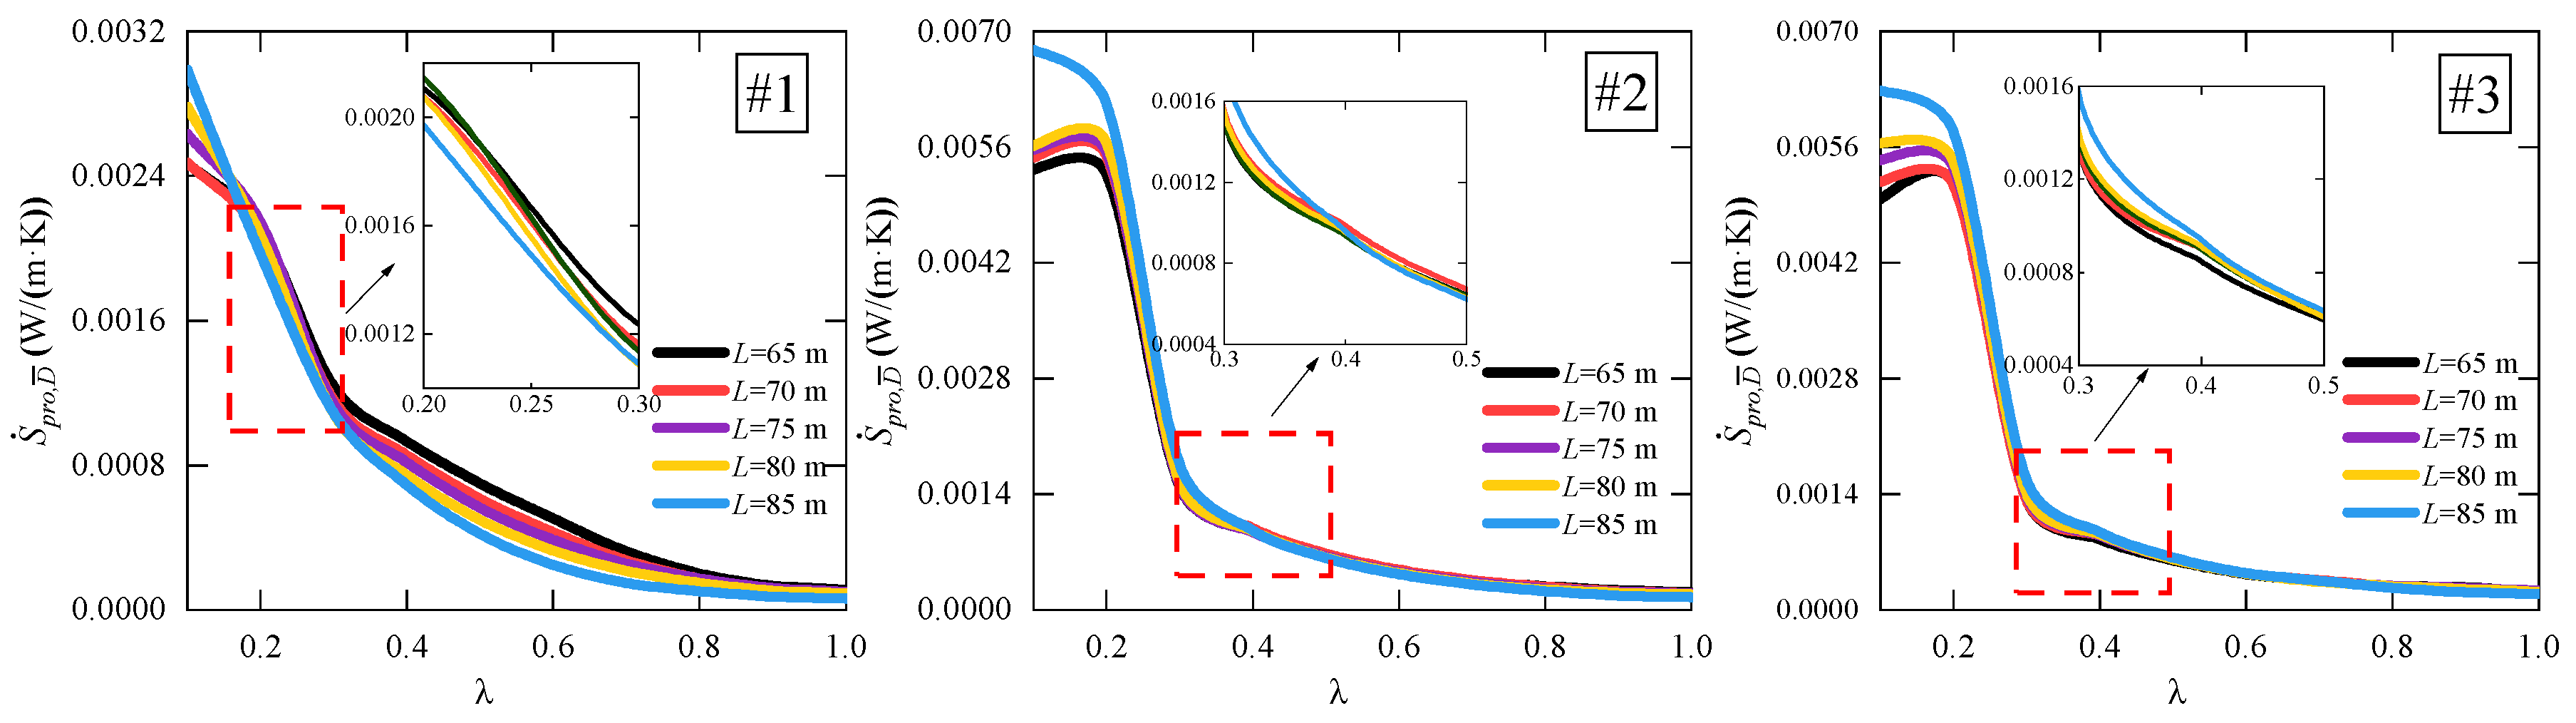
As the diffusion section length L increases from 65 m to 85 m, the value of S ˙ p r o , D rises from 2732.32 W/K to 2842.32 W/K, and the value of S ˙ p r o , D ¯ increases from 0.41 W/K to 0.59 W/K. The turbulence dissipation entropy production rate S ˙ p r o , D is significantly higher than the direct dissipation entropy production rate, indicating that turbulence dissipation S ˙ p r o , D is the primary source of energy loss. Figure 11 and Figure 12 show the distribution of turbulence dissipation entropy production rate S ˙ D and direct dissipation entropy production rate S ˙ D ¯ at characteristic cross-sections for different lengths of the diffusion section. Overall, the high-value regions of both S ˙ D and S ˙ D ¯ are concentrated in channels #2, #3, and #4, while channels #1 and #5 exhibit a more diffuse distribution with weaker intensities. The high-entropy production regions at characteristic cross-sections λ = 0.1, 0.2 and 0.4 are more concentrated, while at λ = 0.6, 0.8 and 1.0, the high-entropy production areas are more dispersed. As the diffusion section length L increases from 65 m to 85 m, the intensities of both S ˙ D and S ˙ D ¯ decrease, and the regions of high intensity shrink. The above provides a qualitative analysis of the spatial distribution characteristics of S ˙ D and S ˙ D ¯ in various regions of the diffusion section. The following will further quantitatively analyze the energy loss in these regions. Figure 13 shows the distribution of the turbulence dissipation entropy production rate S ˙ p r o , D along the length of the diffusion section for different values of L. In channel #1, the value of S ˙ p r o , D exhibits a local minimum in the range of 0.1 < λ < 0.3, and then monotonically decreases to a lower value as λ continues to increase. In channels #2 and #3, the overall magnitude is higher than in channel #1, with S ˙ p r o , D showing a local minimum in the range of 0.2 < λ < 0.4, followed by an increasing trend or a gradual decrease after a peak towards the outlet of the diffusion section. As the diffusion section length L increases from 65 m to 85 m, the overall amplitude of the curve gradually decreases, with the peak becoming weaker and flatter. This indicates that a shorter diffusion section tends to produce strong energy dissipation at the middle section, which is related to flow separation or recirculation near the top of the diffusion section. Extending the diffusion section helps mitigate energy concentration and reduce local dissipation intensity. Figure 14 shows the distribution of the turbulence dissipation entropy production rate S ˙ p r o , D ¯ along the length of the diffusion section for different values of L. It can be observed that the magnitude of S ˙ p r o , D ¯ in channels #1, #2, and #3 is much smaller than that of S ˙ p r o , D , with the energy loss caused by direct dissipation concentrated in the range 0 < λ < 0.3 of the diffusion section. In channel #1, the value of S ˙ p r o , D ¯ shows an overall monotonic decreasing trend. The curve drops sharply when λ < 0.3, then decreases slowly and gradually flattens out as λ > 0.3. The curves for channels #2 and #3 follow a similar pattern. A longer diffusion section length L results in higher amplitude values when λ < 0.2, indicating an increase in energy loss due to direct dissipation at this range. The value of S ˙ p r o , D ¯ drops sharply in the range 0.2 < λ < 0.3, then decreases slowly and gradually flattens out as 0.3 < λ < 1.0. The above analysis indicates that increasing the diffusion section length helps improve flow uniformity and reduces local energy loss peaks. However, this improvement may be accompanied by an increase in the total entropy production rate, reflecting a trade-off between local and overall optimization.

4. Conclusions

This study focuses on the side inlet/outlet structures, employing three-dimensional numerical simulation to analyze the influence of diffusion section length on flow distribution, flow velocity at the trash rack cross-section, and internal flow field characteristics. Combined with entropy production theory, the analysis reveals the energy distribution patterns and primary loss mechanisms. The main conclusions of this research are as follows:
(1)
The length L of the diffusion section affects both multi-channel flow distribution and flow field stability. As L increases, both QR and CQ exhibit a gradual deviation from the average value, with the imbalance degree of inter-channel flow distribution continuously intensifying. Under shorter diffusion sections, the velocity non-uniformity coefficient CV remains high, accompanied by noticeable backflow, while longer diffusion sections can significantly mitigate flow concentration and backflow phenomena, improving the flow field stability at the trash rack.
(2)
The length L of the diffusion section affects the uniformity of flow velocity distribution and the internal flow field structure. As L increases, the velocity non-uniformity coefficient CV along each flow channel generally shows a decreasing trend, resulting in a more uniform velocity field distribution. In particular, the range of the recirculation zone at the top of the channel is significantly reduced, and its intensity weakens simultaneously. This effectively suppresses local flow separation, leading to a notable stabilization of the local flow structure.
(3)
The length L of the diffuser section has a certain influence on energy loss. As L increases from 65 m to 85 m, the turbulent dissipation entropy production rises linearly from 2732.32 W/K to 2842.32 W/K, while the direct entropy production increases from 0.41 W/K to 0.59 W/K. Both components exhibit a linear growth trend with increasing length, and turbulent dissipation consistently remains the dominant contributor. A shorter diffuser section is more likely to induce localized energy concentration and intense dissipation, whereas extending the diffuser length can reduce peak dissipation and improve flow uniformity, but at the expense of a higher overall entropy production rate. This study extends the application of entropy production theory to the analysis of side-type inlet/outlet structures, identifies turbulent dissipation as the primary source of energy loss, and reveals the intrinsic trade-off between local optimization and global energy consumption.

Author Contributions

H.-Y.L.: Writing—original draft, Investigation; M.-J.L.: Writing—original draft, Software; Q.L.: Conceptualization, Investigation; W.-R.W.: Methodology, Conceptualization; J.D.: Methodology, Formal analysis. All authors have read and agreed to the published version of the manuscript.

Funding

The paper was completed within the research projects funded by the National Natural Science Foundation of China (Grant Nos. U23A20668 and 52521005).

Data Availability Statement

The original contributions presented in this study are included in the article. The raw data are available on request from the corresponding authors.

Conflicts of Interest

Author Mrs. Hai-Yan Lv was employed by the company POWERCHINA Chengdu Engineering Corporation Limited. The remaining authors declare that the research was conducted in the absence of any commercial or financial relationships that could be construed as a potential conflict of interest.

References

  1. Lin, P.; Du, L.; Zhang, H.; Zhu, M.; Ma, J.; Wang, P. Power Lever: To Transform Interlinking Architecture in Hybrid AC/DC Microgrids Community. IEEE Trans. Ind. Electron. 2025, early view, 1–14. [Google Scholar] [CrossRef] [Scilit]
  2. Lin, P.; Meng, Q.; Zhu, M.; Ghias, A.M.Y.M.; Blaabjerg, F. Dynamic Circuit-Based Unified Power Regulation for Hybrid AC/DC/DS Microgrids: A Comprehensive Approach to Static and Transient Control. IEEE Trans. Ind. Electron. 2025, 73, 522–533. [Google Scholar] [CrossRef] [Scilit]
  3. Ma, K.; Yang, J.; Liu, P. Relaying-assisted communications for demand response in smart grid: Cost modeling, game strategies, and algorithms. IEEE J. Sel. Areas Commun. 2019, 38, 48–60. [Google Scholar] [CrossRef] [Scilit]
  4. He, Y.; Liu, Y.; Li, M.; Zhang, Y. Benefit evaluation and mechanism design of pumped storage plants under the background of power market reform—A case study of China. Renew. Energy 2022, 191, 796–806. [Google Scholar] [CrossRef] [Scilit]
  5. Guo, G.; Liu, Y.; Cao, Z.; Zhang, D.; Deng, Y. Characteristics of flow structure of lateral inlet/outlet in pumped storage power stations. J. Energy Storage 2024, 103, 114291. [Google Scholar] [CrossRef] [Scilit]
  6. Kong, Y.; Kong, Z.; Liu, Z.; Wei, C.; Zhang, J.; An, G. Pumped storage power stations in China: The past, the present, and the future. Renew. Sustain. Energy Rev. 2017, 71, 720–731. [Google Scholar] [CrossRef] [Scilit]
  7. Zhu, H.; Gao, X.; Liu, Y. Experimental investigation on the unsteady flow fluctuation of a vertical pipe inlet/outlet of the pumped storage power station. J. Energy Storage 2023, 58, 106381. [Google Scholar] [CrossRef] [Scilit]
  8. Zhu, H.; Gao, X.; Liu, Y.; Liu, S. Numerical and experimental assessment of the water discharge segment in a pumped-storage power station. Energy 2023, 265, 126375. [Google Scholar] [CrossRef] [Scilit]
  9. Gao, X.; Tian, Y.; Sun, B. Shape optimization of bi-directional flow passage components based on a genetic algorithm and computational fluid dynamics. Eng. Optim. 2018, 50, 1287–1303. [Google Scholar] [CrossRef] [Scilit]
  10. Guo, G.; Liu, Y.; Cao, Z.; Zhang, D.; Zhao, X. Interpretable GBDT model-based multi-objective optimization analysis for the lateral inlet/outlet design in pumped-storage power stations. J. Hydroinformatics 2024, 26, 1189–1205. [Google Scholar] [CrossRef] [Scilit]
  11. Gao, X.; Zhang, H.; Liu, J.; Sun, B.; Tian, Y. Numerical investigation of flow in a vertical pipe inlet/outlet with a horizontal anti-vortex plate: Effect of diversion orifices height and divergence angle. Eng. Appl. Comput. Fluid Mech. 2018, 12, 182–194. [Google Scholar] [CrossRef] [Scilit]
  12. Li, G.; Lu, T.; Chen, F.; Yang, S.; Jiang, L.; Zhen, H. Experimental study of a hydraulic model of the side inlet and outlet of a pumped storage power station. Journal of Physics: Conference Series. IOP Publ. 2023, 2565, 012031. [Google Scholar] [CrossRef] [Scilit]
  13. Zhu, H.; Gao, X.; Liu, Y. Experimental study of velocity fluctuations in inlet/outlet under outflow diffusion. J. Hydroelectr. Eng. 2022, 41, 129–139. [Google Scholar]
  14. Gao, X.; Zhu, H.; Liu, Y.; Sun, B. Research on velocity distribution and fluctuation law of bidirectional flow structure of inlet/outlet. J. Hydraul. Eng. 2022, 53, 722–732. [Google Scholar]
  15. Zhang, H.; Gao, X.; Sun, B.; Qin, Z.; Zhu, H. Parameter analysis and performance optimization for the vertical pipe intake-outlet of a pumped hydro energy storage station. Renew. Energy 2020, 162, 1499–1518. [Google Scholar] [CrossRef] [Scilit]
  16. Guo, M.; Huang, Z.; Jiang, K.; Shen, Y.; Wang, W. Research on the hydraulic loss in the side inlet and outlet of a pumped storage power station. J. Phys. Conf. Ser. 2024, 2854, 012078. [Google Scholar] [CrossRef] [Scilit]
  17. Morabito, A.; Vagnoni, E. CFD-based analysis of pumped storage power plants implementing hydraulic short circuit operations. Appl. Energy 2024, 369, 123474. [Google Scholar] [CrossRef] [Scilit]
  18. Xu, L.; Zhang, Y.; Xu, J.; Wang, Y.; Feng, C.; Yang, Y.; Liu, D.; Liu, X.; Zheng, Y. Towards the integration of new-type power systems: Hydraulic stability analysis of pumped storage units in the S-characteristic region based on experimental and CFD studies. Energy 2025, 329, 136755. [Google Scholar] [CrossRef] [Scilit]
  19. Fei, Y. Numerical simulations of the hydraulic characteristics of side inlet/outlets. J. Hydrodyn. Ser. B 2011, 23, 48–54. [Google Scholar]
  20. Wu, S.; Li, S.; Gao, P.; Li, G.; Zuo, J. Effects of separation pier shape and inflow conditions on the hydraulic characteristics of pumped storage power station inlet/outlet. J. Energy Storage 2025, 117, 116131. [Google Scholar] [CrossRef] [Scilit]
  21. Launder, B.E.; Reece, G.J.; Rodi, W. Progress in the development of a Reynolds-stress turbulence closure. J. Fluid Mech. 1975, 68, 537–566. [Google Scholar] [CrossRef] [Scilit]
  22. Craft, T.J.; Launder, B.E.; Suga, K. Development and application of a cubic eddy-viscosity model of turbulence. Int. J. Heat Fluid Flow 1996, 17, 108–115. [Google Scholar] [CrossRef] [Scilit]
  23. Gao, X.; Tian, Y.; Sun, B. Multi-objective optimization design of bidirectional flow passage components using RSM and NSGA II: A case study of inlet/outlet diffusion segment in pumped storage power station. Renew. Energy 2018, 115, 999–1013. [Google Scholar] [CrossRef] [Scilit]
  24. Guo, M.; Wang, Z.; Song, R.; Xu, G.; Wang, W.; Shen, Y. Investigation on the hydraulic loss in the vertical inlet and outlet of a pumped storage power station. J. Phys. Conf. Ser. 2024, 2854, 012079. [Google Scholar] [CrossRef] [Scilit]
  25. Kock, F.; Herwig, H. Local entropy production in turbulent shear flows: A high-Reynolds number model with wall functions. Int. J. Heat Mass Transf. 2004, 47, 2205–2215. [Google Scholar] [CrossRef] [Scilit]
  26. Zhang, X.; Tang, F. Energy loss evaluation of axial flow pump systems in reverse power generation operations based on entropy production theory. Sci. Rep. 2022, 12, 8667. [Google Scholar] [CrossRef] [Scilit]
  27. Pei, J.; Shen, J.; Wang, W.; Yuan, S.; Zhao, J. Evaluating hydraulic dissipation in a reversible mixed-flow pump for micro-pumped hydro storage based on entropy production theory. Renew. Energy 2024, 225, 120271. [Google Scholar] [CrossRef] [Scilit]
  28. Wang, Z.; Yang, H.; Li, X.; Xia, X.; Zuo, Q.; Xie, B. Energy loss evaluation in radical inflow turbine based on entropy production theory and orthogonal experiment method. Phys. Fluids 2024, 36, 025134. [Google Scholar] [CrossRef] [Scilit]
  29. Qi, B.; Bai, X.; Li, Y.; Wang, X.; Zhang, X.; Zhang, D. Research on the influence mechanism of internal flow characteristics on energy conversion in radial energy recovery turbines under multiple conditions. Energy 2024, 296, 131191. [Google Scholar] [CrossRef] [Scilit]
  30. Yu, A.; Li, L.; Ji, J.; Tang, Q. Numerical study on the energy evaluation characteristics in a pump turbine based on the thermodynamic entropy theory. Renew. Energy 2022, 195, 766–779. [Google Scholar] [CrossRef] [Scilit]
  31. Zhou, L.; Hang, J.; Bai, L.; Krzemianowski, Z.; El-Emam, M.A.; Yasser, E.; Agarwal, R. Application of entropy production theory for energy losses and other investigation in pumps and turbines: A review. Appl. Energy 2022, 318, 119211. [Google Scholar] [CrossRef] [Scilit]
  32. Launder, B.E.; Spalding, D.B. The numerical computation of turbulent flows. In Numerical Prediction of Flow, Heat Transfer, Turbulence and Combustion; Pergamon: Oxford, UK, 1983; pp. 96–116. [Google Scholar]
  33. Kadia, S.; Albayrak, I.; Lia, L.; Rüther, N.; Pummer, E. Reynolds Stress Model Study Comparing the Secondary Currents and Turbulent Flow Characteristics in High-Speed Narrow Open Channel and Duct Flows. J. Hydraul. Eng. 2024, 150, 04024017. [Google Scholar] [CrossRef] [Scilit]
  34. Khalfaoui, K.; Zorn, M.; Ségoufin, C.; André, F.; Kerner, J.; Riedelbauch, S. Dynamic stress prediction for a Pump-Turbine in Low-Load Conditions: Experimental validation and phenomenological analysis. Eng. Fail. Anal. 2024, 162, 108428. [Google Scholar] [CrossRef] [Scilit]
  35. Mao, X.; Monte, A.D.; Benini, E.; Zheng, Y. Numerical study on the internal flow field of a reversible turbine during continuous guide vane closing. Energies 2017, 10, 988. [Google Scholar] [CrossRef] [Scilit]
  36. Herwig, H.; Kock, F. Local entropy production in turbulent shear flows: A tool for evaluating heat transfer performance. J. Therm. Sci. 2006, 15, 159–167. [Google Scholar] [CrossRef] [Scilit]
  37. Mathieu, J.; Scott, J. An Introduction to Turbulent Flow; Cambridge University Press: Cambridge, UK, 2000. [Google Scholar]
Figure 1. Side inlet/outlet structure.
Water 18 00678 g001
Figure 2. Mesh generation diagram.
Water 18 00678 g002
Figure 3. Velocity distribution in the middle channel at the trash rack section under three mesh resolutions.
Water 18 00678 g003
Figure 4. Flow distribution ratio CR and flow rate non-uniformity CQ at different diffuser lengths L.
Water 18 00678 g004
Figure 5. Velocity non-uniformity CV of each channel at the trash rack section.
Water 18 00678 g005
Figure 6. Velocity distribution along the characteristic line of the trash rack and cross-sectional velocity contours for different diffuser lengths.
Water 18 00678 g006
Figure 7. CV along the diffuser for different lengths L.
Water 18 00678 g007
Figure 8. Contour of Vy distribution at characteristic cross-sections of the diffuser for different lengths L.
Water 18 00678 g008
Figure 9. Contour distribution of Vy at the central cross-section of channel #3 in the diffuser section.
Water 18 00678 g009
Figure 10. Variation curves of parameters S ˙ p r o , D and S ˙ p r o , D ¯ in the diffuser for different lengths L.
Water 18 00678 g010
Figure 11. Distribution of S ˙ D at characteristic sections of the diffuser for different lengths L.
Water 18 00678 g011
Figure 12. Distribution of S ˙ D ¯ at characteristic sections of the diffuser for different lengths L.
Water 18 00678 g012
Figure 13. Distribution of S ˙ p r o , D along the diffuser for different lengths L.
Water 18 00678 g013
Figure 14. Distribution of S ˙ p r o , D ¯ along the diffuser for different lengths L.
Water 18 00678 g014
Table 1. Geometric parameters of the computed configurations.
Diffuser Length L/mChannel Height H1/mChannel Width
B/m
Tunnel Height
H/m
Tunnel Diameter
D/m
Vertical Diffusion angle/°Horizontal Divergence Angle β
6515.48.211.511.53.4330.55
703.1928.46
752.9826.63
802.7925.01
852.6323.59
Table 2. Grid independence verification.
Grid ResolutionNumber of NodesVmax/VaveRelative Error with the
Fine Grid (%)
Coarse8.9 million2.5327.47%
Medium15.0 million2.7031.20%
Fine26.7 million2.736
Disclaimer/Publisher’s Note: The statements, opinions and data contained in all publications are solely those of the individual author(s) and contributor(s) and not of MDPI and/or the editor(s). MDPI and/or the editor(s) disclaim responsibility for any injury to people or property resulting from any ideas, methods, instructions or products referred to in the content.