Article

Multidimensional Analysis of Water Scarcity Risk and Its Transmission Network Across Chinese Provinces


School of Economics and Finance, Hohai University, Changzhou 213200, China
*
Author to whom correspondence should be addressed.
Water 2026, 18(5), 644; https://doi.org/10.3390/w18050644
Submission received: 16 January 2026 / Revised: 27 February 2026 / Accepted: 5 March 2026 / Published: 8 March 2026

Abstract

Water scarcity is increasingly shaped by interactions between environmental constraints and interconnected economic systems, evolving from a localized supply–demand issue into a systemic risk embedded in economic networks. This study develops an integrated framework that conceptualizes water scarcity as a multidimensional risk by jointly accounting for water quantity, water quality, and environmental flow requirements, and embeds it within a multiregional input–output (MRIO) model to examine its formation and transmission across China. Results show that multidimensional constraints substantially amplify water scarcity risk and reshape its spatial distribution, extending risk beyond traditionally water-stressed regions to major agricultural provinces and key ecological function zones. Water-intensive, pollution-intensive, and basic industries form the core of risk accumulation, while virtual water linkages drive cross-regional risk propagation, with developed coastal provinces acting as major receivers. Network analysis identifies a small number of provinces—particularly Henan and Jiangsu—as critical hubs for risk transmission and systemic amplification. These findings highlight the need for integrated, multidimensional, and network-oriented water governance to enhance water system resilience.

1. Introduction

Water resources underpin socioeconomic development while simultaneously constraining regional sustainability [1,2,3]. Under the combined pressures of climate change [4,5,6,7], rapid population growth, and the continuous expansion of economic activities, water scarcity is no longer confined to localized shortages of physical water resources, but has evolved into a systemic risk threatening economic security, social stability, and ecosystem integrity [8]. According to United Nations assessments, more than two billion people currently experience varying levels of water stress, highlighting water scarcity as a persistent challenge to sustainable development [9,10]. For many countries and regions, water scarcity is no longer manifested solely as an insufficiency in water quantity, but rather as a compound challenge intertwined with water quality degradation [11,12], ecosystem functioning, and resource use efficiency issues [13,14,15], significantly increasing the complexity of water resources management.
At the same time, economic globalization and deepening regional specialization have fundamentally altered the spatial manifestation of water scarcity [16,17]. The expansion of interregional and international supply chains allows water constraints in one region to be transmitted to others through trade in goods and services, giving rise to so-called “virtual water” flows embedded in economic exchanges [18]. This process, commonly described as virtual water transfer [19], redistributes water use and associated risks across space [20]. While virtual water trade may relieve direct water pressure in water-scarce regions [21,22], it can also shift water scarcity risks to downstream regions and sectors, embedding local water constraints within broader economic systems [23]. Therefore, identifying and characterizing the formation mechanisms and transmission pathways of water scarcity risks from an integrated, economy-wide perspective has become an important topic in water resources and sustainable development research.
A substantial body of literature has examined water scarcity using a range of indicators and assessment approaches. Early studies predominantly focused on water quantity, employing metrics such as per capita water availability, water stress indices [24,25,26], and water scarcity thresholds [27,28,29,30] to characterize regional supply–demand imbalances. These approaches provide clear physical interpretations of water scarcity, but they tend to treat water scarcity as a local phenomenon and largely overlook its differentiated economic impacts across regions and sectors. As a result, they offer limited insight into how water scarcity may propagate through interconnected economic systems.
With the expansion of research perspectives, increasing attention has been paid to the economic implications of water scarcity [31,32]. Several studies have incorporated socioeconomic variables to assess the potential impacts of water shortages on production, trade, and economic output, thereby improving the policy relevance of water scarcity assessments [33]. Parallel to this development, the concept of virtual water has become an important analytical lens for understanding the spatial redistribution of water use through trade. By embedding water consumption in interregional commodity flows, virtual water studies—often based on input–output or multiregional input–output (MRIO) models—have provided detailed accounts of water dependencies among regions and sectors. However, most existing work focuses on the magnitude and direction of virtual water flows [32,34], while paying relatively little attention to the economic risks induced by water scarcity and their transmission mechanisms along supply chains.
More recently, water scarcity assessment itself has undergone a shift from single-dimensional to multidimensional perspectives. Water quality degradation has been incorporated into scarcity assessments to account for the reduction in effective water availability caused by pollution [35,36,37,38], while environmental flow requirements (EFRs) have been introduced to represent the minimum water needed to sustain riverine and aquatic ecosystems. Empirical evidence suggests that ignoring water quality and ecological water demand can lead to systematic underestimation of water scarcity [39,40,41]. Despite these advances, studies that simultaneously integrate water quantity, water quality, and environmental flow requirements within a unified analytical framework remain limited, particularly at the national scale and within an explicitly economic context.
In addition, even when multidimensional water constraints are considered within MRIO-based analyses, most studies emphasize aggregate risk levels or spatial distributions. Such approaches are insufficient for revealing the structural characteristics of water scarcity risk in complex economic systems. Interregional production networks create asymmetric dependencies, causing certain regions and sectors to act as major risk sources, transmission hubs, or receivers [42,43,44]. From this perspective, water scarcity risk exhibits clear network properties, and its impacts depend not only on local water conditions but also on a region’s position within economic networks. Identifying key nodes and critical transmission pathways is therefore essential to understanding systemic vulnerability and for designing effective and targeted water governance strategies.
Against this background, this study focuses on the 31 provincial-level regions of mainland China as the empirical setting. China provides a particularly suitable case for examining multidimensional water scarcity risk due to its pronounced spatial heterogeneity in water endowment, strong north–south contrasts in water quantity and quality pressures, large interprovincial disparities in economic structure, and intensive trade linkages across regions. These characteristics make China not only a water-stressed country in physical terms, but also a highly interconnected economic system in which local water constraints may propagate through national production networks. An interprovincial, nationwide perspective is therefore essential for capturing the formation and transmission of water scarcity risk under integrated quantity–quality–ecological constraints.
Building on this context, this study reconceptualizes water scarcity as a multidimensional economic risk embedded in interregional production networks and advances existing research in three respects [45,46,47]. First, we develop an integrated assessment framework that simultaneously incorporates water quantity, water quality, and environmental flow requirements (QQE) to measure direct water scarcity risk at the provincial and sectoral levels, moving beyond quantity-dominated virtual water assessments. Second, we extend multidimensional water scarcity analysis to the national interprovincial scale, enabling systematic examination of how local water constraints are redistributed and transmitted across regions through trade linkages. Third, we introduce a network–structural perspective by constructing a directed weighted virtual water scarcity risk (VWSR) transmission network, making possible the identification of key hubs, bridge regions, and critical industrial pathways within the economic system.
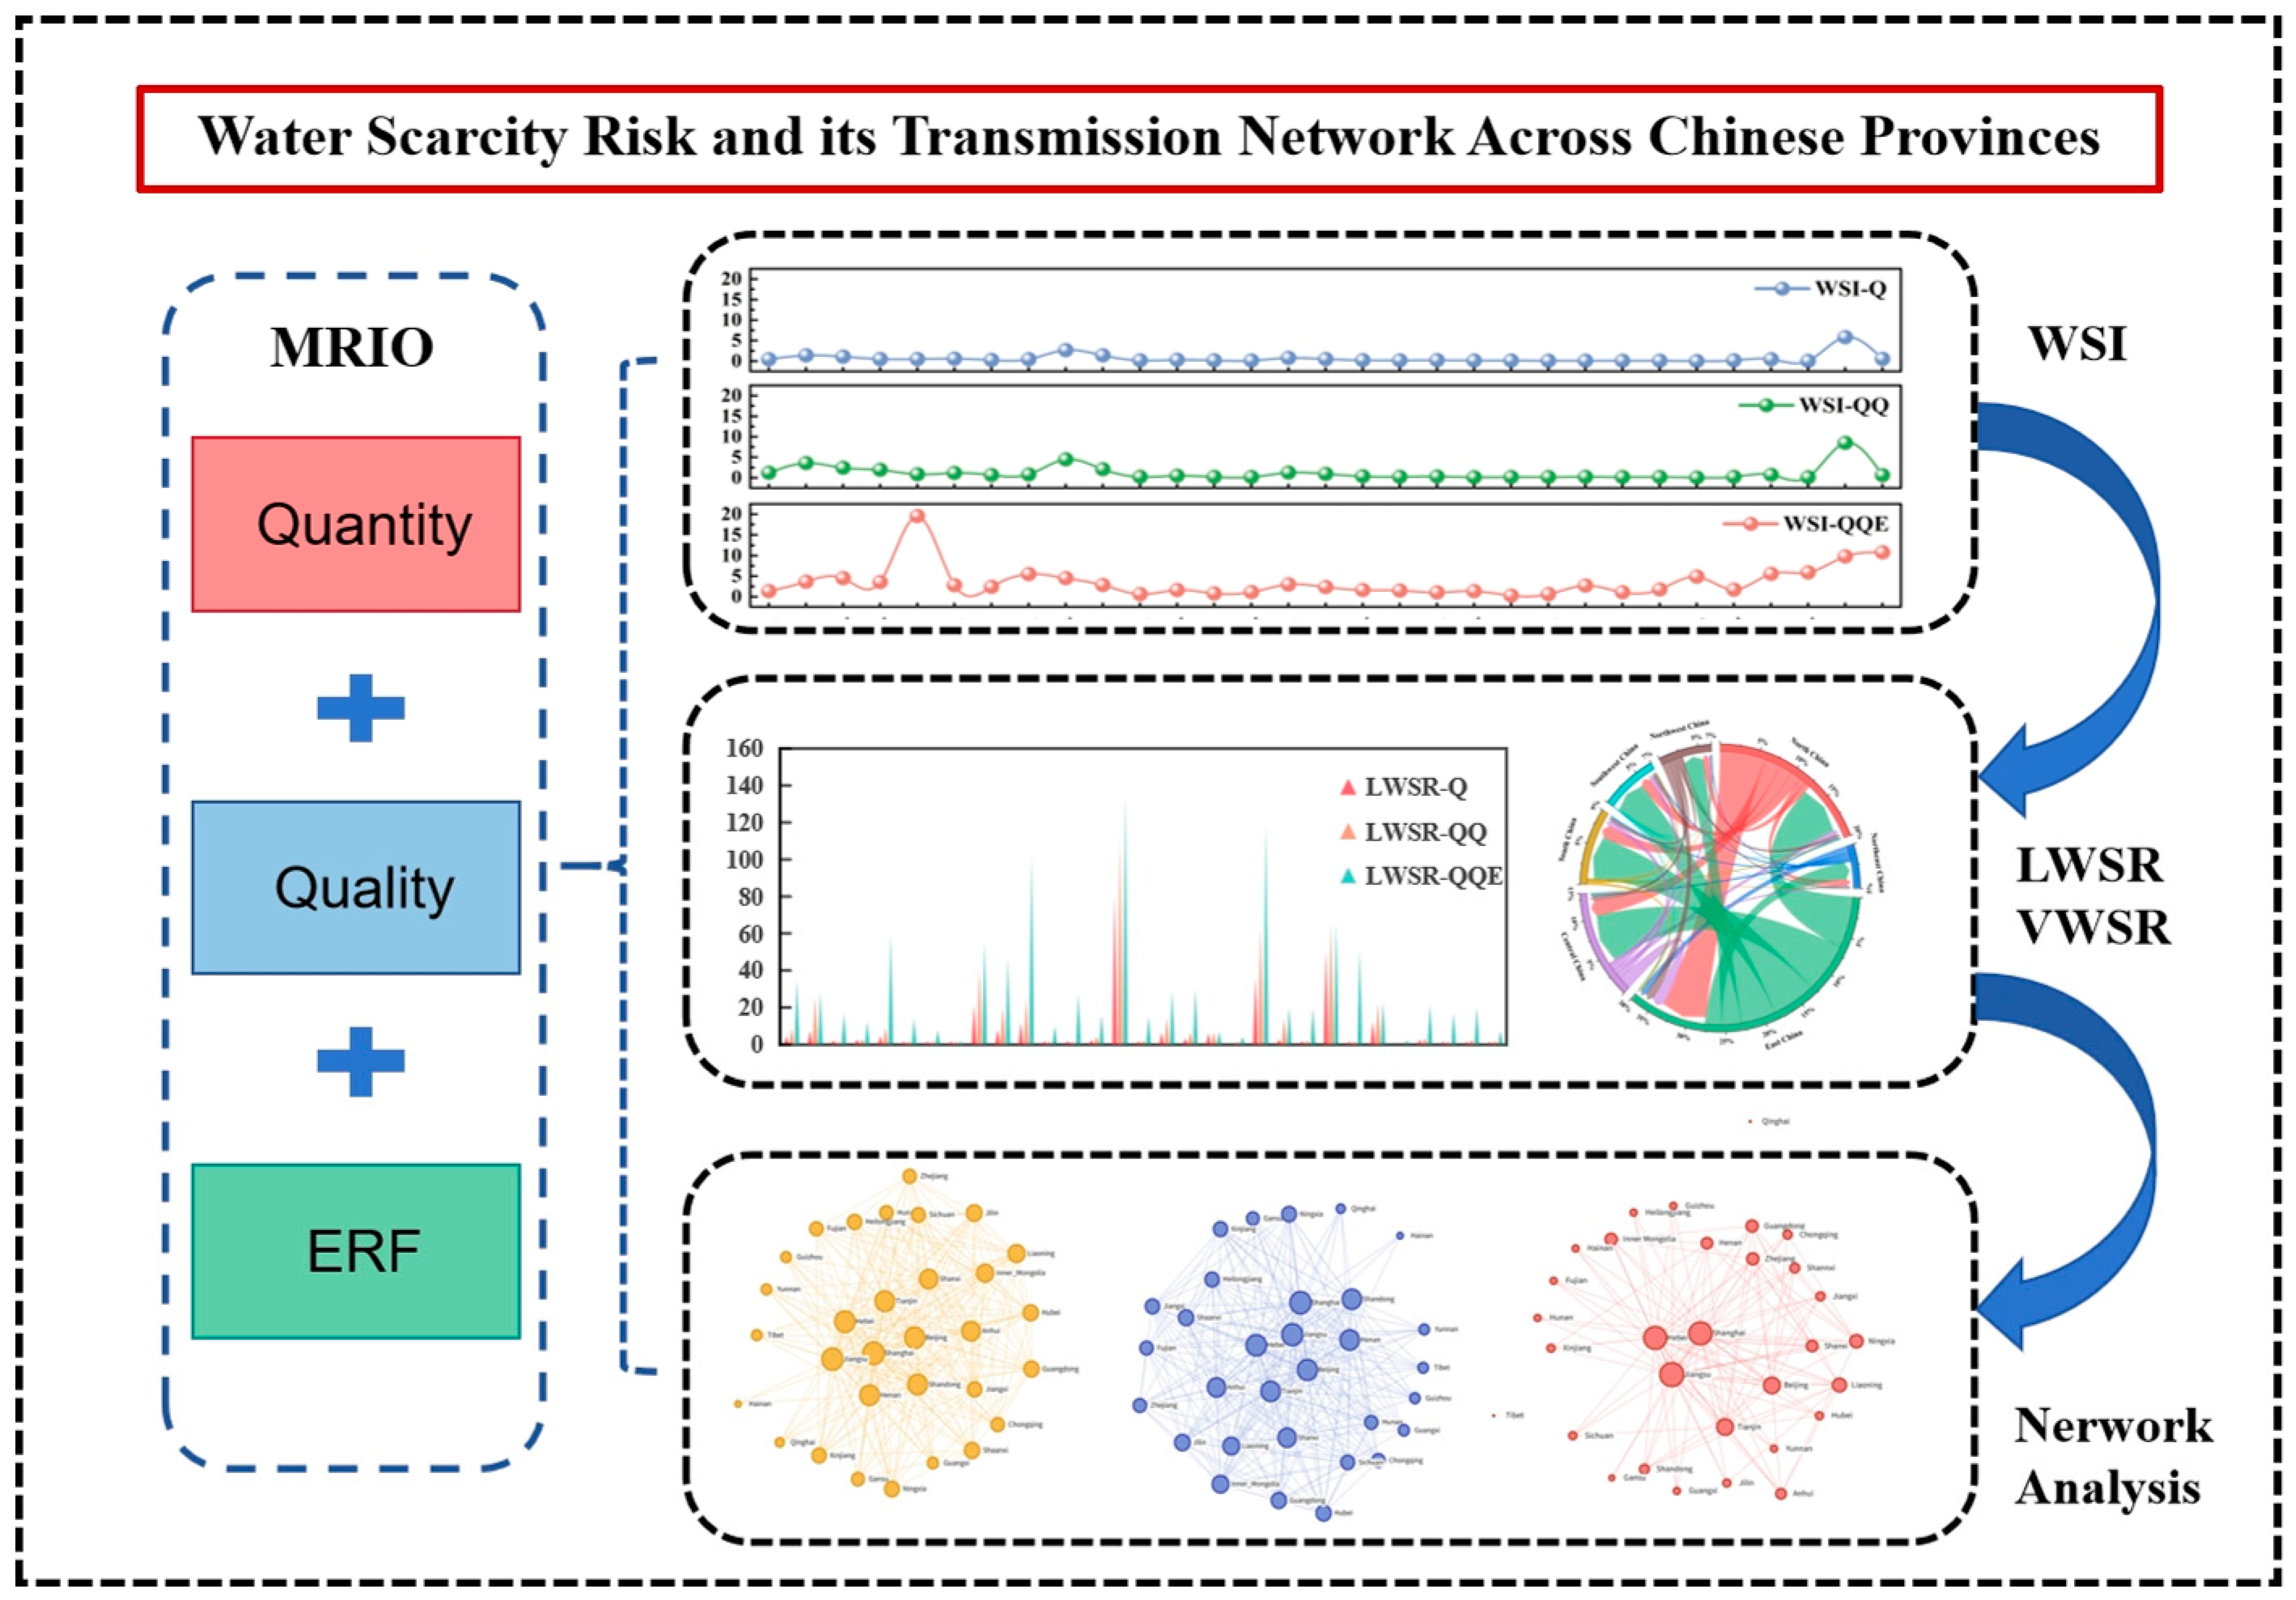
Methodologically, the QQE-based multidimensional assessment is embedded into a multiregional input–output (MRIO) framework to quantify cross-regional and intersectoral risk propagation. Network analysis is subsequently employed to characterize topological evolution, node centrality, and modular clustering under different constraint scenarios. By doing so, this study aims to achieve a system-level understanding of water scarcity risk and support coordinated water governance, filling the multiple research gaps of single-dimensional assessment, narrow research scope and insufficient structural analysis in current related studies (Figure 1).

2. Methods

Under conditions of strong interregional economic linkages and multiple water-related constraints, water scarcity is no longer manifested solely as local water quantity shortages. Instead, it is jointly shaped by water quality degradation and rigid ecological water demand constraints, and further amplified through industrial specialization and interregional trade at broader spatial scales. To systematically characterize both the direct economic impacts of water scarcity and its cross-regional transmission through economic networks, this study develops an integrated methodological framework consisting of three components: identification of multidimensional water constraints, assessment of direct water scarcity risk, and analysis of virtual water scarcity risk transmission.

2.1. Water Deprivation Risk (WDR)

The Water Stress Index (WSI) is used to measure the intensity of water resource constraints at the regional level. Following existing studies, when only water quantity is considered, the WSI can be expressed as:
W S I i q u a = s W s , i Q i ,
Building on this formulation, gray water footprint and environmental flow requirements (Environmental Flow Requirement, EFR) are incorporated to construct a composite water stress index, which is defined as:
W S I i i n t = s ( W s , i + G s , i ) + G p , i + E i Q i ,
In this formulation, W s , i denotes the direct water withdrawal of sector s in region i ; W s , i represents blue water use, i.e., the actual consumption of clean freshwater resources; G s , i denotes direct gray water use; G p , i represents gray water generated by household wastewater, which is quantified as a new indicator G s , i through a consistency-based allocation method; Q i denotes the total available water resources in regio i .
Sectoral gray water use is determined by the pollutant that requires the largest dilution volume, which is calculated as:
G s , i = m a x δ r ( L δ c δ , m a x c δ , n a t ) ,
where δ refers to key water pollutants for grey water footprint calculation in this study: chemical oxygen demand (COD), ammonia nitrogen (NH3–N), total phosphorus (TP), and total nitrogen (TN). L δ denotes the total discharge of pollutant δ from sector s in region i ; c δ , m a x is the maximum allowable concentration of pollutant δ under the target water quality standard; c δ , n a t represents the natural background concentration, which is assumed to be close to zero. These selected pollutants are the key representative indicators for China’s surface water quality degradation, covering organic pollution from industrial and domestic point sources and nutrient pollution from agricultural non-point sources.
To translate water stress into a quantitative measure of scarcity risk, this study introduces Water Deprivation Risk (WDR), which maps the WSI to the interval through a transformation function:
W D R i = f W D R ( W S I i ;   σ ) = E ( Y i ) ,
where the random variable Y i is defined as:
Y i = { 0 ,     X i 1 1 X i ,     X i < 1 ,
The parameter σ controls the risk gradient and is set to 1 in this study. The probability of water scarcity occurrence in each region is assumed to follow a normal distribution:
X i ~ ( μ X i , σ X i 2 ) ,
In this study, the distributional assumption serves as a smooth functional transformation rather than a statistical inference about observed event frequencies. Where μ X i is the mean of the distribution, defined as the reciprocal of the logarithm of the WSI, μ X i = 1 l o g ( W S I ) . A threshold is further specified such that when the calculated risk value is less than or equal to 0.05, the region is assumed to face no water scarcity risk, and the WDR is set to zero.

2.2. Local Water Scarcity Risk Assessment (LWSR)

Direct water scarcity risk (Local Water Scarcity Risk, LWSR) is used to quantify the potential economic losses faced by specific regions and sectors under the combined constraints of water quantity, water quality, and ecological water demand. When only water quantity is considered, sectoral water scarcity risk is calculated as:
L Q W S R s , i = W D R i q u a × W D s , i q u a × x s , i ,
where L Q W S R s , i denotes the local water scarcity risk of sector s in region i under the water quantity constraint; W D R i q u a represents water deprivation risk based solely on water quantity; W D s , i q u a is the sectoral water dependency coefficient; and x s , i denotes total sectoral output.
When water quantity, water quality, and EFR are jointly considered, the multidimensional water scarcity risk is defined as:
L W S R s , i = W D R i i n t × W D s , i i n t × x s , i ,
where L W S R s , i denotes the composite water scarcity risk, W D R i i n t represents the integrated water deprivation risk, and W D s , i i n t is the corresponding multidimensional water dependency coefficient.
The water dependency coefficient reflects output vulnerability under constrained water supply conditions and measures the economic output loss resulting from a 1% reduction in water use. The sectoral water dependency coefficients under water quantity-only and multidimensional constraints are defined as indicated below.
WD is an indicator of output vulnerability under water supply constraints. W D s , i q u a measures the water dependence of regional i sectors s . W D s , i i n t measures Water dependency when simultaneously considering water quantity, water quality, and EFR, and is defined as the economic output loss caused by a 1% reduction in water use.
W D s , i q u a = 1 1 + ( 1 0.001 1 ) e x p ( α 1 W I s , i q u a ) ,
W I s , i q u a = W s , i x s , i ,
W D s , i i n t = 1 1 + ( 1 0.001 1 ) e x p ( α 2 W I s , i i n t ) ,
W I s , i i n t = W s , i + G s , i x s , i ,
where W I s , i q u a and W I s , i i n t denote sectoral water use intensities; W s , i represents direct water withdrawal; and α is an adjustment parameter that controls the rate at which water dependency changes with water use intensity.

2.3. Virtual Water Scarcity Risk Assessment (VWSR)

Given the high degree of interconnection in regional economic systems, water scarcity risk in a single region or sector is rarely confined locally, but instead propagates through supply chains and interregional trade. To capture these indirect effects, this study introduces the concept of Virtual Water Scarcity Risk (VWSR) and quantifies it using a multiregional input–output (MRIO) model.
For the MRIO table, the row balance condition is expressed as:
j = 1 n Z i j + f i + e x i i m i = x i ,
where f i denotes final demand for sector i ; e x i represents exports to regions outside the study area; i m i denotes imports; and x i is total output of sector i .
Based on this balance relationship, the direct input coefficient matrix BBB is defined as:
B = ( b i j ) = Z i j X i ,
Rearranging the balance equation yields:
X i = v × ( I B ) 1 ,
where B is the direct input coefficient matrix, b i j denotes its elements, Z i j represents intermediate transactions, X i is total input of sector i , v denotes value added, I is the identity matrix, and ( I B ) 1 is the Ghosh inverse matrix. The elements of the Ghosh inverse describe how a unit change in primary input in one sector propagates through the supply chain and affects total production in other sectors.
Using this matrix, the impact of direct water scarcity risk under water quantity–water quality–EFR constraints on the trade system can be evaluated as:
Δ X = d i a g ( L W S R ) × ( I B ) 1 ,
d i a g ( L W S R ) = [ L W S R 11 0 0 L W S R n n ] ,
where Δ X denotes the output loss matrix, and d i a g ( L W S R ) is the diagonal matrix.
To quantify water scarcity risk at the provincial level, sector-level results are aggregated using the following formulation:
p n r = i p r o v i n c e   n j p r o v i n c e   r Δ X i j ,
Let R denote a matrix whose elements are derived from matrix Δ X , representing the potential economic losses that region n may suffer as a result of direct local water scarcity risk (LWSR) occurring in region r . Each element reflects the impact of sector-level direct water scarcity risk in region i on the economic output of sectors in region j . Based on this framework, the export- and import-related virtual water scarcity risks (VWSRs) are calculated as follows:
V W S R r e x = r n p r n ,
V W S R n i m = n r Δ X n r ,

2.4. Risk Transmission Network

Building upon the MRIO-based estimation, virtual water scarcity risks exchanged among regions and sectors can be further abstracted as a directed and weighted risk flow structure. To characterize the diffusion of water scarcity risk within the regional–industrial economic system, this study constructs a directed weighted social network based on VWSR.
In this network, each node represents a regional economic entity, while directed edges between nodes capture the transmission of water scarcity risk through interregional industrial linkages. Let G = { V , E , W } denote the water scarcity risk transmission network, where V = { 1,2 , , N } is the set of nodes, E is the set of directed edges, and W = { ω i j } is the weighted adjacency matrix. When region i transmits virtual water scarcity risk to region j through industrial supply chains, a directed edge from i to j is defined, with its weight representing the intensity of risk transmission:
ω i j = k , m V W S R i k j m
where V W S R i k j m denotes the virtual water scarcity risk transmitted from sector k in region i to sector m in region j. By aggregating risks across sectors, a region-level risk transmission network can be obtained.
Embedding virtual water scarcity risk into a social network analysis framework overcomes the limitations of traditional region- or sector-isolated assessments. From a structural perspective, this approach reveals the diffusion mechanisms of water scarcity risk within the economic system. It not only identifies high-risk regions and critical industrial pathways but also uncovers the structural foundations underlying systemic risk formation, thereby providing methodological support for coordinated water risk governance and targeted intervention strategies.

2.5. Data

This study adopts 2017 as the unified base year. Multiregional input–output (MRIO) data are obtained from the China Emission Accounts and Datasets (CEADs) [48], covering 31 provincial-level regions and 42 sectors, which are aggregated into 30 sectors based on similarity in water use intensity and pollution emission characteristics. This aggregation strategy preserves the core water-related attributes of sectors while maintaining computational feasibility under national-scale MRIO analysis.
Provincial agricultural, industrial, domestic, and ecological water use data are primarily sourced from the China Water Resources Bulletin (2017) [49]. Industrial sectoral water use is disaggregated proportionally using data from the China Economic Census Yearbook (Energy Volume). Water use in the construction and service sectors is estimated based on water statistics and the input structure of the water production and supply sector in the input–output tables.
Pollutant discharge data are obtained from the Second National Pollution Source Census and the China Environmental Statistical Yearbook. Chemical oxygen demand (COD), ammonia nitrogen (NH3–N), total phosphorus (TP), and total nitrogen (TN) are selected for grey water footprint calculations.
Runoff data required for estimating environmental flow requirements (EFR) are sourced from the China River Sediment Bulletin. Environmental flow requirements are calculated using the Tennant method, which is widely applied in hydrological studies.
The specification of thresholds and key parameter settings follows nationally recognized standards and established methodologies. In particular, Water quality standards follow the Environmental Quality Standards for Surface Water (GB 3838–2002) [50]. Anchoring parameter settings to authoritative regulatory and hydrological benchmarks enhances the methodological robustness and comparability of the results.

3. Results and Discussion

3.1. Analysis of Direct Water Scarcity Risk (LWSR) in China

3.1.1. Spatial Distribution of Integrated Water Scarcity Risk

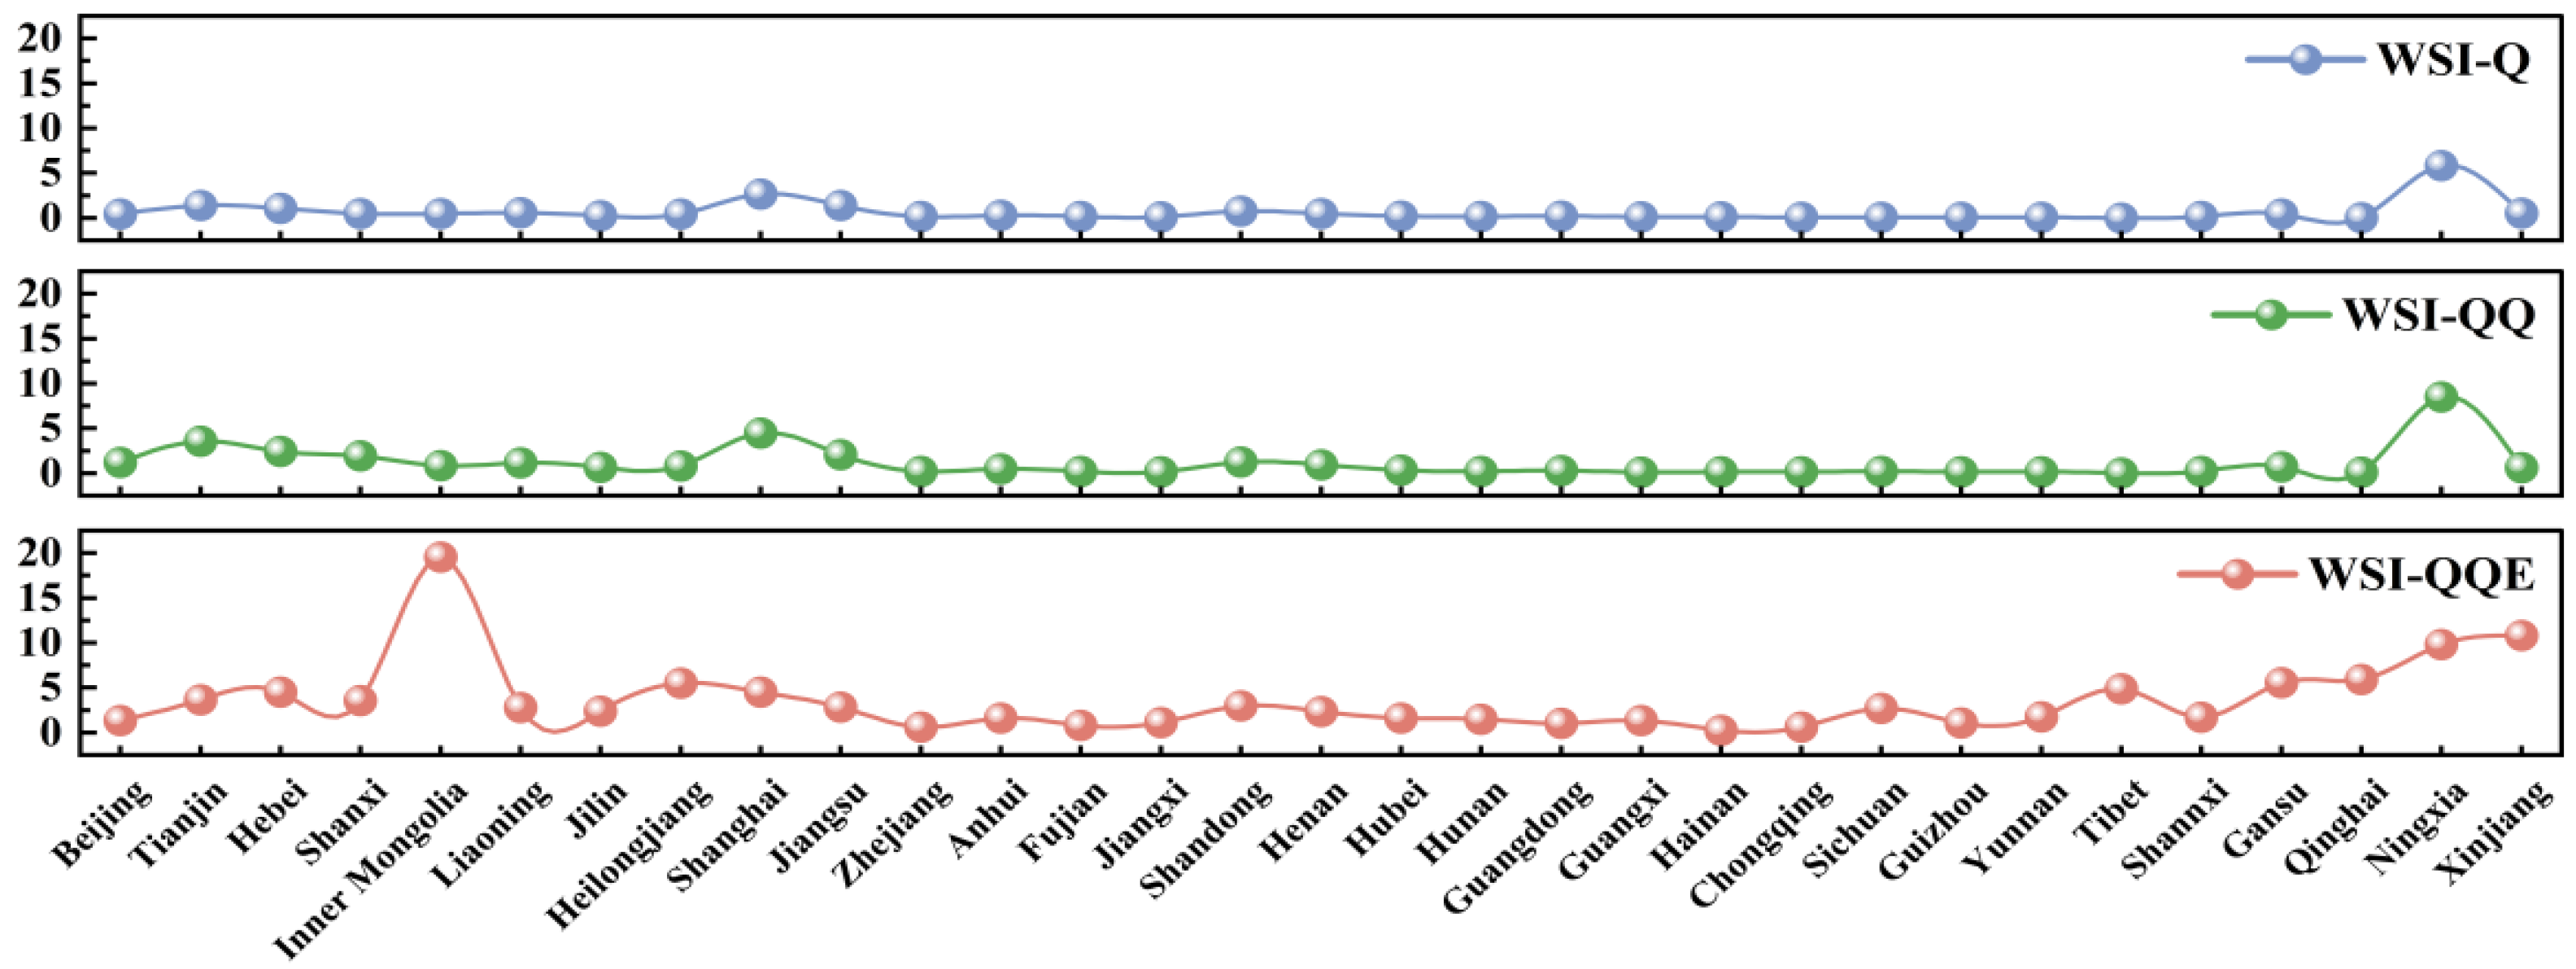
With the progressive expansion of assessment dimensions, the spatial distribution of water stress in China exhibits pronounced changes. As the framework expands from quantity (Q) to integrated QQE constraints, the national risk landscape is fundamentally restructured, with pollution and ecological flow requirements emerging as major amplifiers of direct economic risk. Northern China remains primarily driven by water quantity scarcity and agricultural irrigation demand, whereas southern regions face dual constraints from water quality degradation and ecological flow requirements.
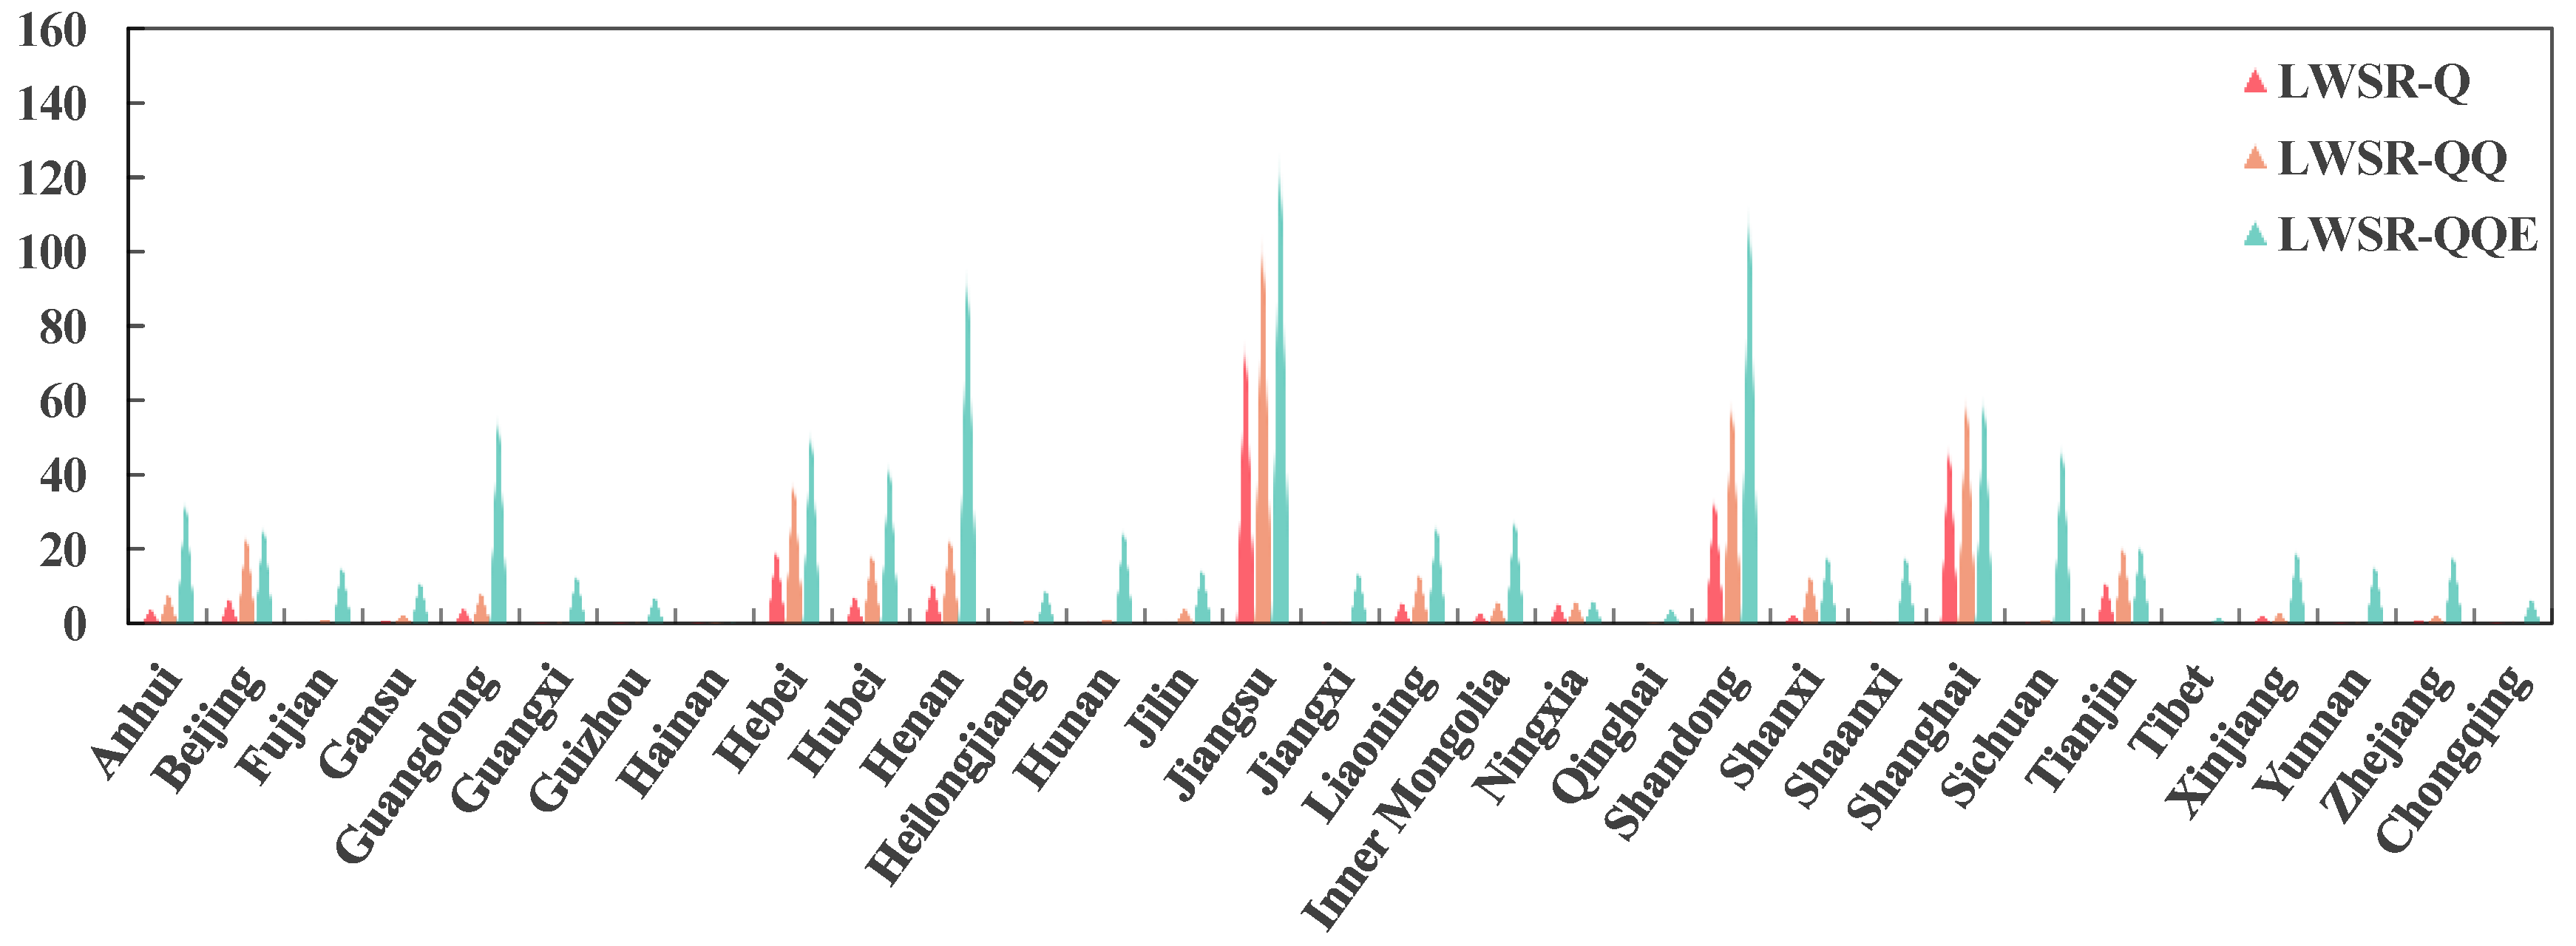
Under the water-quantity-only scenario, China’s total direct water scarcity risk amounts to CNY 26.657 billion, exhibiting substantial regional heterogeneity. High-risk regions are concentrated in economically developed eastern provinces and major agricultural production areas in North China, reflecting a typical “economic scale–water use intensity” driven pattern. Jiangsu Province records the highest risk value, far exceeding other regions, highlighting long-term tensions between water supply and demand under intensive industrialization and population agglomeration. Shanghai, Shandong, Hebei, and Tianjin also fall within the high-risk category. In contrast, Qinghai, Tibet, Hainan, and Guizhou exhibit near-zero risk levels, suggesting that physical water scarcity alone generates limited direct economic risk where economic intensity remains low (Figure 2).
When water quality constraints are incorporated (LWSR-QQ), the national direct water scarcity risk increases sharply to CNY 45.832 billion—approximately 72% higher than under the quantity-only scenario. Jiangsu remains the highest-risk province, with a substantial increase indicating that water pollution significantly reduces effective water availability. Shanghai and Shandong also experience pronounced risk escalation. Notably, Beijing’s risk surges from CNY 0.734 billion to CNY 2.564 billion, an increase of more than threefold, suggesting that even regions with extensive water management investments remain vulnerable to hidden water quality risks. Southwestern provinces such as Yunnan and Guizhou also exhibit marked increases, challenging the traditional “water-scarce north vs. water-abundant south” dichotomy and highlighting the structural importance of water quality constraints.
Further incorporating environmental flow requirements (LWSR-QQE), China’s total direct water scarcity risk escalates to CNY 101.908 billion, while Shandong (CNY 11.979 billion) and Henan (CNY 10.179 billion) rise significantly. Henan’s jump from sixth to third reflects its dual role as a major agricultural base and a key ecological flow guarantee region in the Yellow River Basin. Shanghai’s risk increases only marginally relative to QQ, suggesting relatively stable ecological flow pressures in highly urbanized systems. In contrast, Qinghai, Yunnan, and Guangxi experience sharp risk increases due to their critical ecological functions and high environmental flow shares, highlighting their sensitivity to ecological water constraints. Overall, water quality degradation and ecological flow requirements not only magnify the magnitude of direct water scarcity risk but fundamentally reshape its spatial distribution (Figure 3).

3.1.2. Sectoral Distribution of Direct Water Scarcity Risk

Direct water scarcity risk exhibits pronounced heterogeneity across sectors, with high water-consuming, highly polluting, and ecologically disruptive industries experiencing progressively amplified risks as assessment dimensions expand.
Under the water-quantity-only scenario, risks are primarily concentrated in water-intensive and large-scale foundational industries. Construction shows the highest total risk (CNY 5.87 billion), followed by chemical manufacturing (CNY 4.83 billion) and metal smelting and rolling (CNY 4.12 billion). These sectors rely heavily on freshwater inputs and are widely distributed across industrial provinces. Agriculture and electricity supply show moderate risk levels, reflecting either dispersed water use or structural importance in the water–energy nexus.
When water quality is included (LWSR-QQ), risk rises sharply across manufacturing sectors. Chemical manufacturing emerges as the most water-quality-sensitive sector, with risk rising from CNY 4.83 billion to CNY 11.24 billion. Paper, printing, and cultural goods manufacturing also experience a marked increase, reflecting the crowding-out effect of pollution on effective water availability. In contrast, construction shows a relatively modest increase, indicating that its risk is dominated by water quantity dependence. Notably, wholesale, retail, and financial services exhibit significant risk increases, revealing the supply-chain-mediated exposure to upstream water-intensive industries.
Under the LWSR-QQE scenario, sectoral risks rise further while maintaining a broadly stable high-risk structure. Chemical manufacturing reaches approximately CNY 13.25 billion, and metal smelting increases to CNY 8.97 billion, reflecting compounded ecological constraints. Construction risk increases to CNY 7.21 billion, with a slowing growth rate, while coal mining increases from CNY 0.58 to CNY 0.92 billion, indicating amplified pressure in resource-dependent regions. These results confirm that multidimensional water constraints progressively shift risk concentration toward pollution-intensive, basic material, and energy-related sectors.

3.2. Transmission Characteristics of VWSR in China

3.2.1. Regional Patterns of VWSR

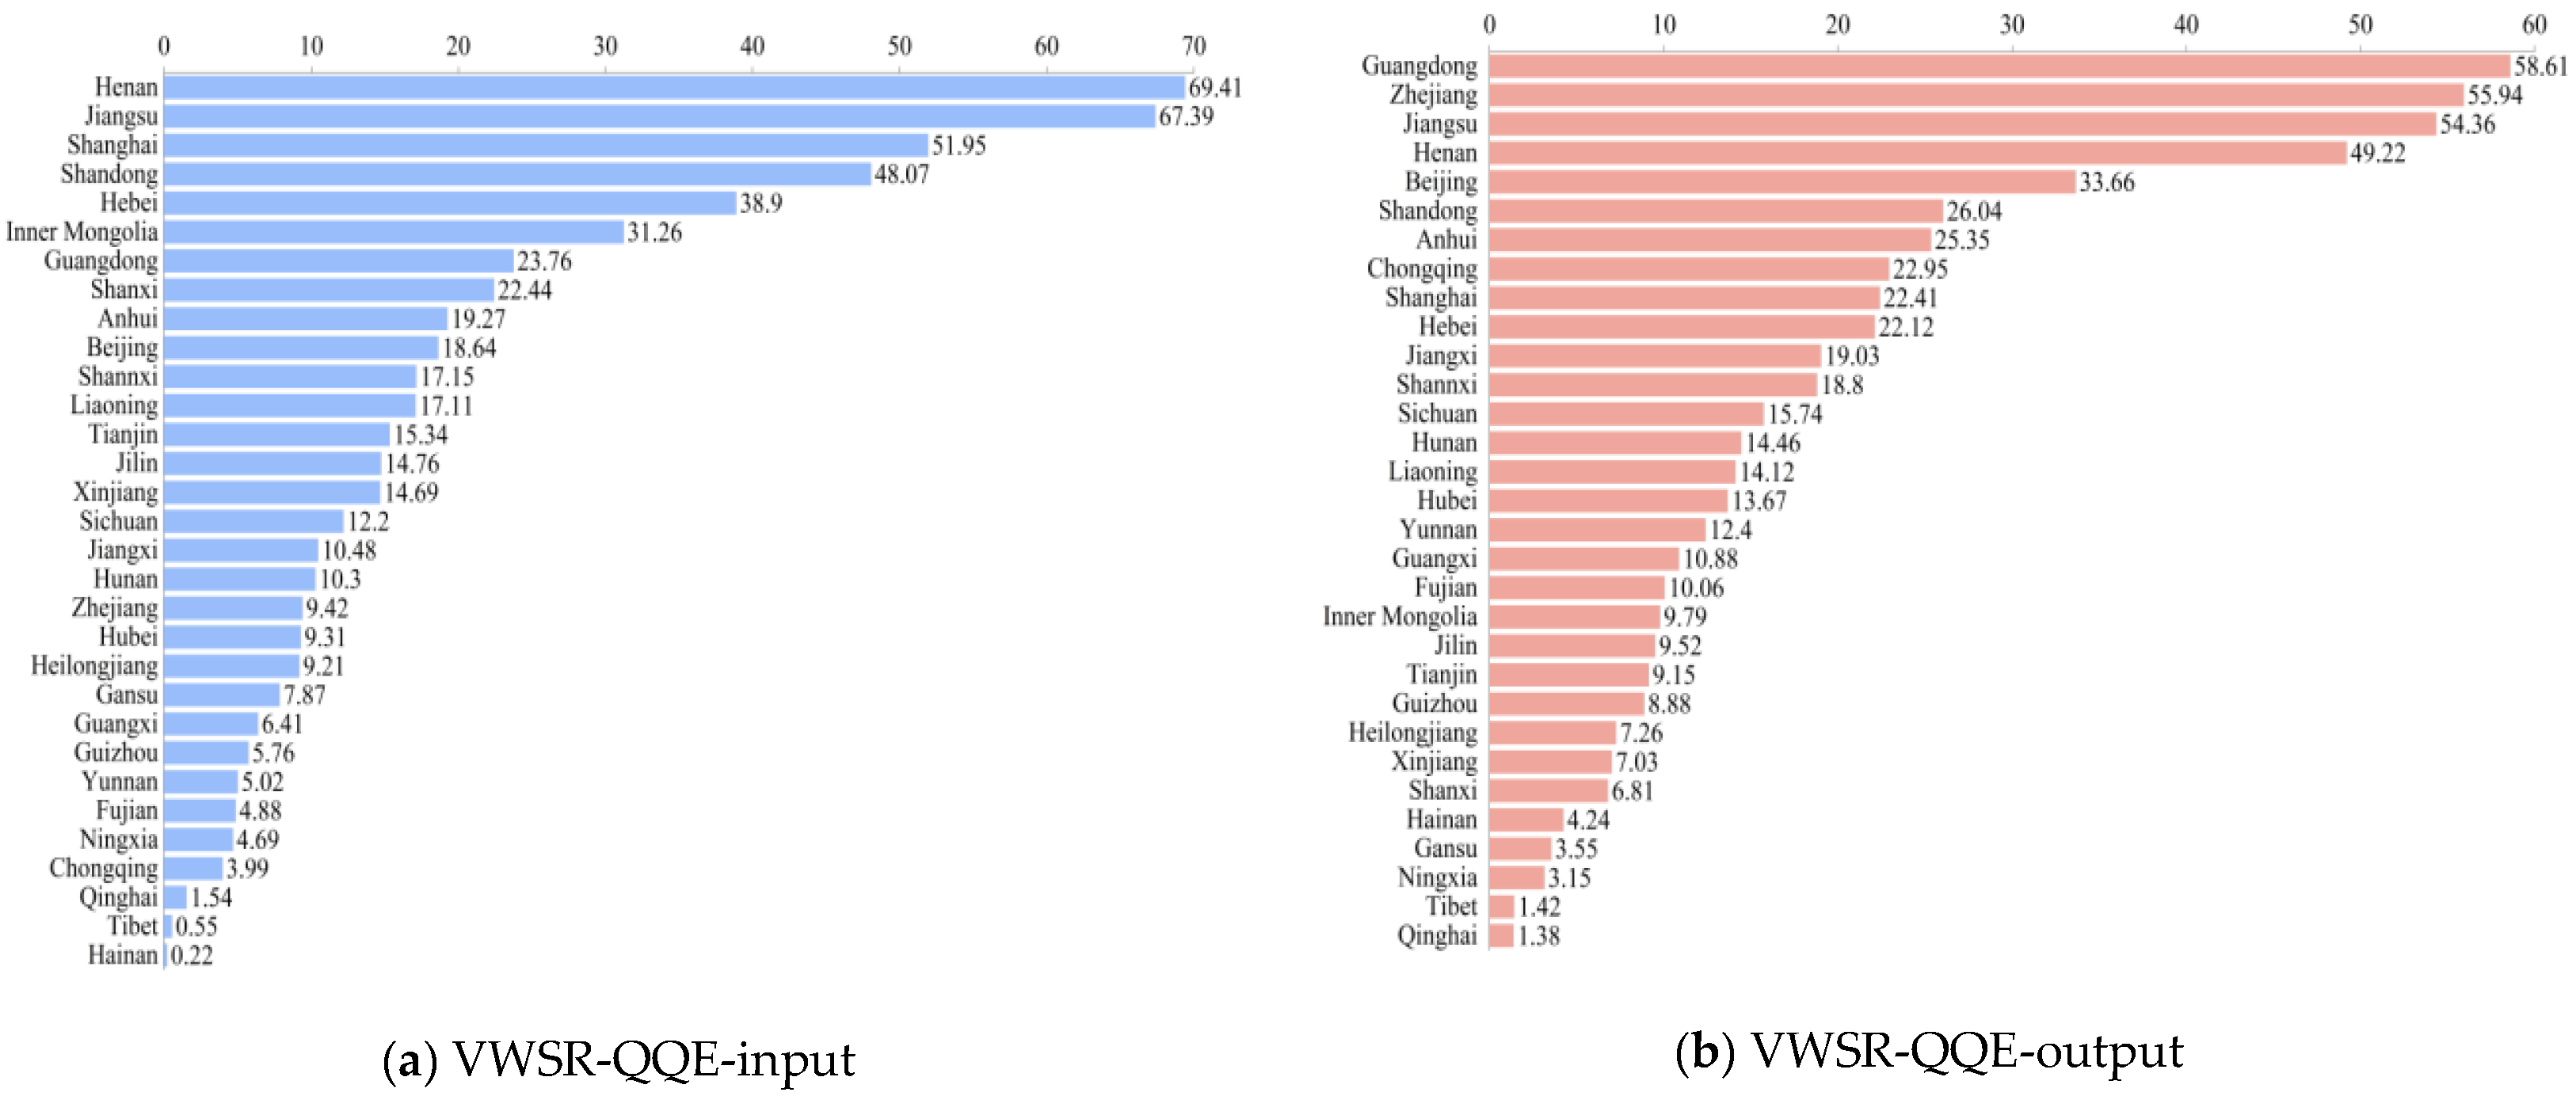
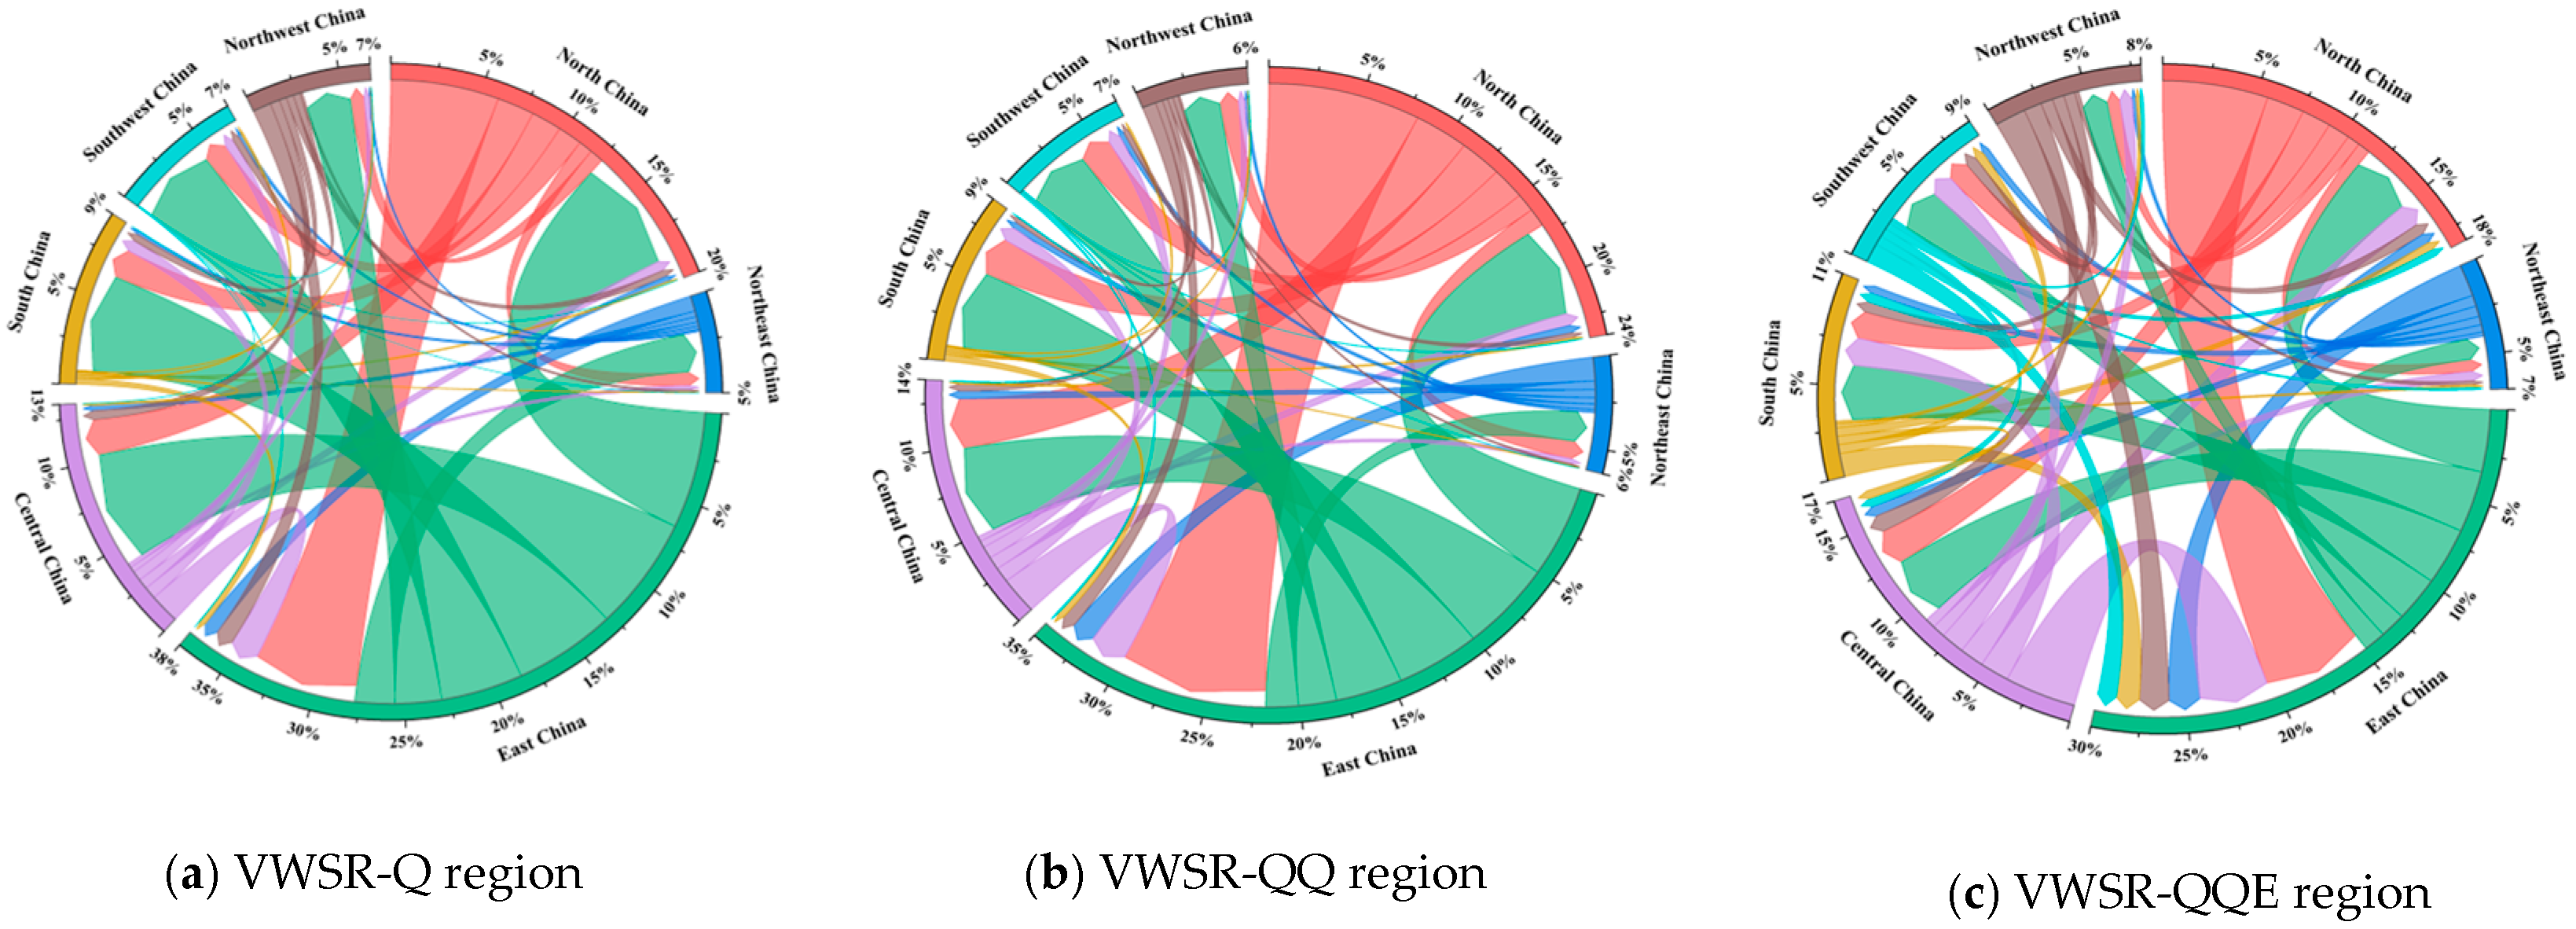
Based on the estimated virtual water scarcity risk (VWSR) for China in 2017, the results indicate that Virtual water scarcity risk (VWSR) transforms localized water stress into a nationwide systemic economic risk through interregional production linkages. Even under the water-quantity-only scenario (VWSR-Q), virtual water scarcity risk already exhibits pronounced cross-regional diffusion, suggesting that specialization and trade integration prevent risks from remaining within administrative boundaries. As water quality constraints (VWSR-QQ) and environmental flow requirements (VWSR-QQE) are progressively incorporated, both the magnitude and structural complexity of interprovincial risk flows increase markedly (Figure 4).
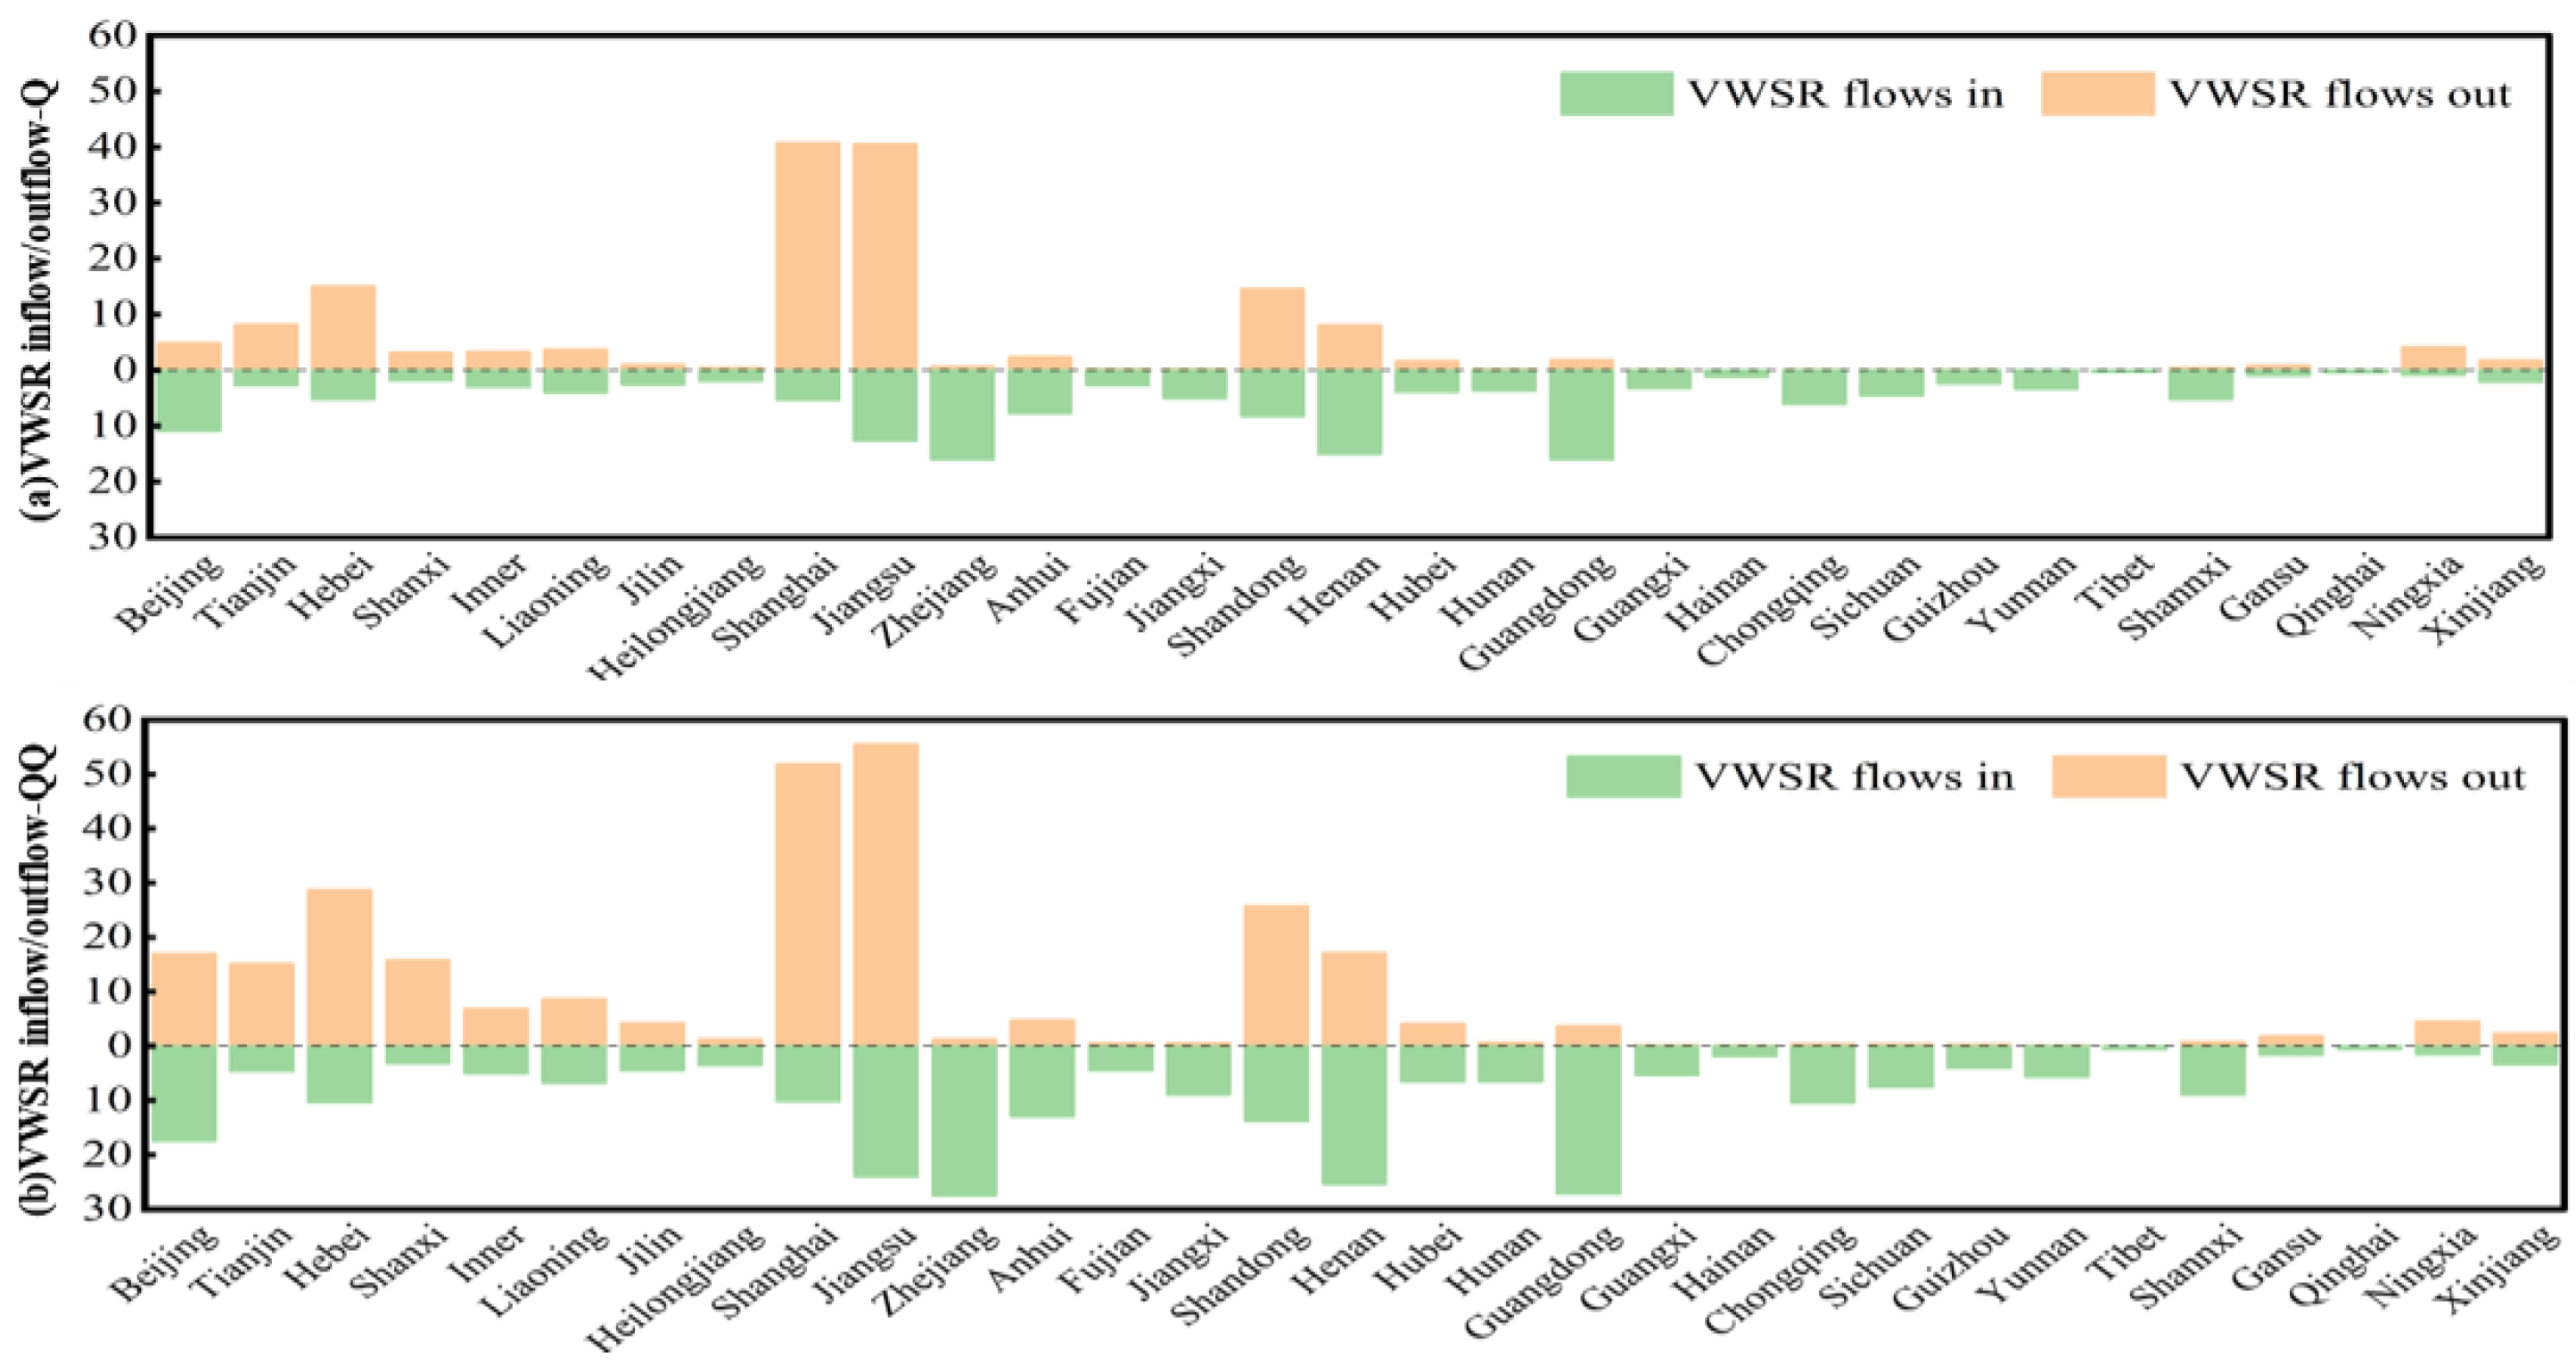
From the perspective of risk outflows, both the intensity and ranking of provinces as risk sources undergo significant restructuring across the three scenarios. Under water-quantity-dominated conditions, risk outflows are dominated by economically dense provinces such as Shanghai, Jiangsu, and Hebei. With water quality constraints (VWSR-QQ), pollution-intensive regions emerge as key exporters: Shanxi’s outflow rises from CNY 0.312 to CNY 1.578 billion, and Henan’s from CNY 0.805 to CNY 1.709 billion. Under VWSR-QQE, the structure shifts further—Henan becomes the largest exporter (CNY 6.941 billion), followed by Jiangsu (CNY 6.739 billion), while Inner Mongolia’s outflow increases nearly tenfold. These shifts demonstrate that pollution and ecological water appropriation replace purely physical scarcity as dominant drivers of interregional risk diffusion (Figure 5).
From the perspective of risk inflows, provincial vulnerability to external water-related economic shocks also increases progressively and shows strong geographical concentration. Under the VWSR-Q scenario, Zhejiang, Guangdong, and Henan are the main risk-importing regions. These provinces typically feature large economic scales and occupy downstream or midstream positions within national supply chains. Under the VWSR-QQ scenario, risk inflows to these economically developed provinces increase dramatically. Zhejiang’s risk inflow rises from CNY 1.599 billion to CNY 5.594 billion, while Guangdong’s increases from CNY 1.595 billion to CNY 5.860 billion. Jiangsu and Shandong also experience substantial growth in risk inflows. These results indicate that coastal and economically advanced regions function simultaneously as centers of value creation and as terminal aggregation points for virtual water scarcity risk within the national production network. Notably, Henan exhibits both the highest risk outflow and a very high risk inflow under the VWSR-QQE scenario, transitioning from a traditional risk recipient to a bidirectionally exposed hub node. This dual exposure underscores the embedding of local water stress within national production networks (Figure 6).

3.2.2. Industrial Chain Transmission Pathways of Virtual Water Scarcity Risk

An examination of the key interprovincial, intersectoral risk transmission pathways under the three VWSR scenarios reveals that Risk transmission follows structured industrial pathways rather than random diffusion.
Under the water-quantity-only scenario (VWSR-Q), virtual water scarcity risk primarily propagates along high value-added, tightly connected modern industrial systems, displaying a typical efficiency-sensitive pattern. Transmission is concentrated among economically dense coastal provinces, particularly between Shanghai, Jiangsu, and major economies such as Shandong, Guangdong, Zhejiang, and Beijing. The dominant sectors include advanced manufacturing—such as transport equipment manufacturing, chemical manufacturing, and computer and electronic equipment manufacturing—as well as producer services including leasing and business services and scientific research and technical services. The pathway with the highest risk value runs from transport equipment manufacturing in Shanghai to transport equipment manufacturing in Shandong, indicating that under quantity-dominated constraints, risk diffusion is driven mainly by economic scale and industrial agglomeration rather than pollution intensity. Jiangsu appears repeatedly at the exporting end of top-ranked pathways, reflecting its central role in national manufacturing networks (Table 1).
When water quality constraints are incorporated, the structure of the risk transmission network changes markedly. High-pollution and high grey-water-footprint sectors emerge as major risk sources, introducing resource- and pollution-intensive industries into the core transmission network. Although pathways linking Shanghai and Jiangsu with coastal provinces through advanced manufacturing remain prominent, coal mining in Shanxi becomes a representative new risk source. Key pathways include coal mining in Shanxi → electricity and heat production in Zhejiang and coal mining in Shanxi → metal smelting in Hebei exhibit high risk values, demonstrating that pollution-intensive production substantially amplifies water scarcity risk under water quality constraints. These risks are rapidly transmitted to manufacturing cores via energy and raw material supply chains. At the same time, Agricultural non-point source pollution also becomes visible in transmission pathways, such as agriculture in Hebei → food processing in Shandong. Under this scenario, risk transmission exhibits a dual structure, characterized by the coexistence of resource- and pollution-intensive industries and high-end manufacturing and consumption-oriented industries (Table 2).
When water quantity, water quality, and environmental flow requirements are simultaneously considered, the industrial transmission pattern of virtual water scarcity risk undergoes a more fundamental transformation. Basic material industries and energy supply chains become the dominant channels of risk diffusion. The manufacture of non-metallic mineral products in Henan emerges as the most important risk-exporting sector, accounting for seven of the top twenty transmission paths. These risks are primarily transmitted to the construction sector across multiple regions, with the highest-risk pathway linking non-metallic mineral products in Henan to construction in Guangdong. This shift indicates that ecological flow requirements intensify compound pressures on water-intensive basic material industries located in water-stressed regions, particularly cement and construction materials. These pressures are widely transmitted through construction-related supply chains, generating substantial cross-regional economic exposure. Meanwhile, coal mining in Shanxi and energy production in Inner Mongolia continue to strengthen their roles in the network, further concentrating risk within energy supply chain. In addition, agricultural risk transmission under ecological constraints becomes more pronounced in certain regions, as evidenced by the emergence of pathways such as agriculture in Heilongjiang to food processing in Jilin. The evolution from Q to QQE reveals a clear stage-wise transition: from scale-driven manufacturing diffusion, to pollution-driven resource transmission, and finally to ecology-constrained basic material and energy-centered systemic risk propagation (Table 3).

3.3. Network Analysis of Water Scarcity Risk Transmission

3.3.1. Topological Evolution of the Risk Transmission Network

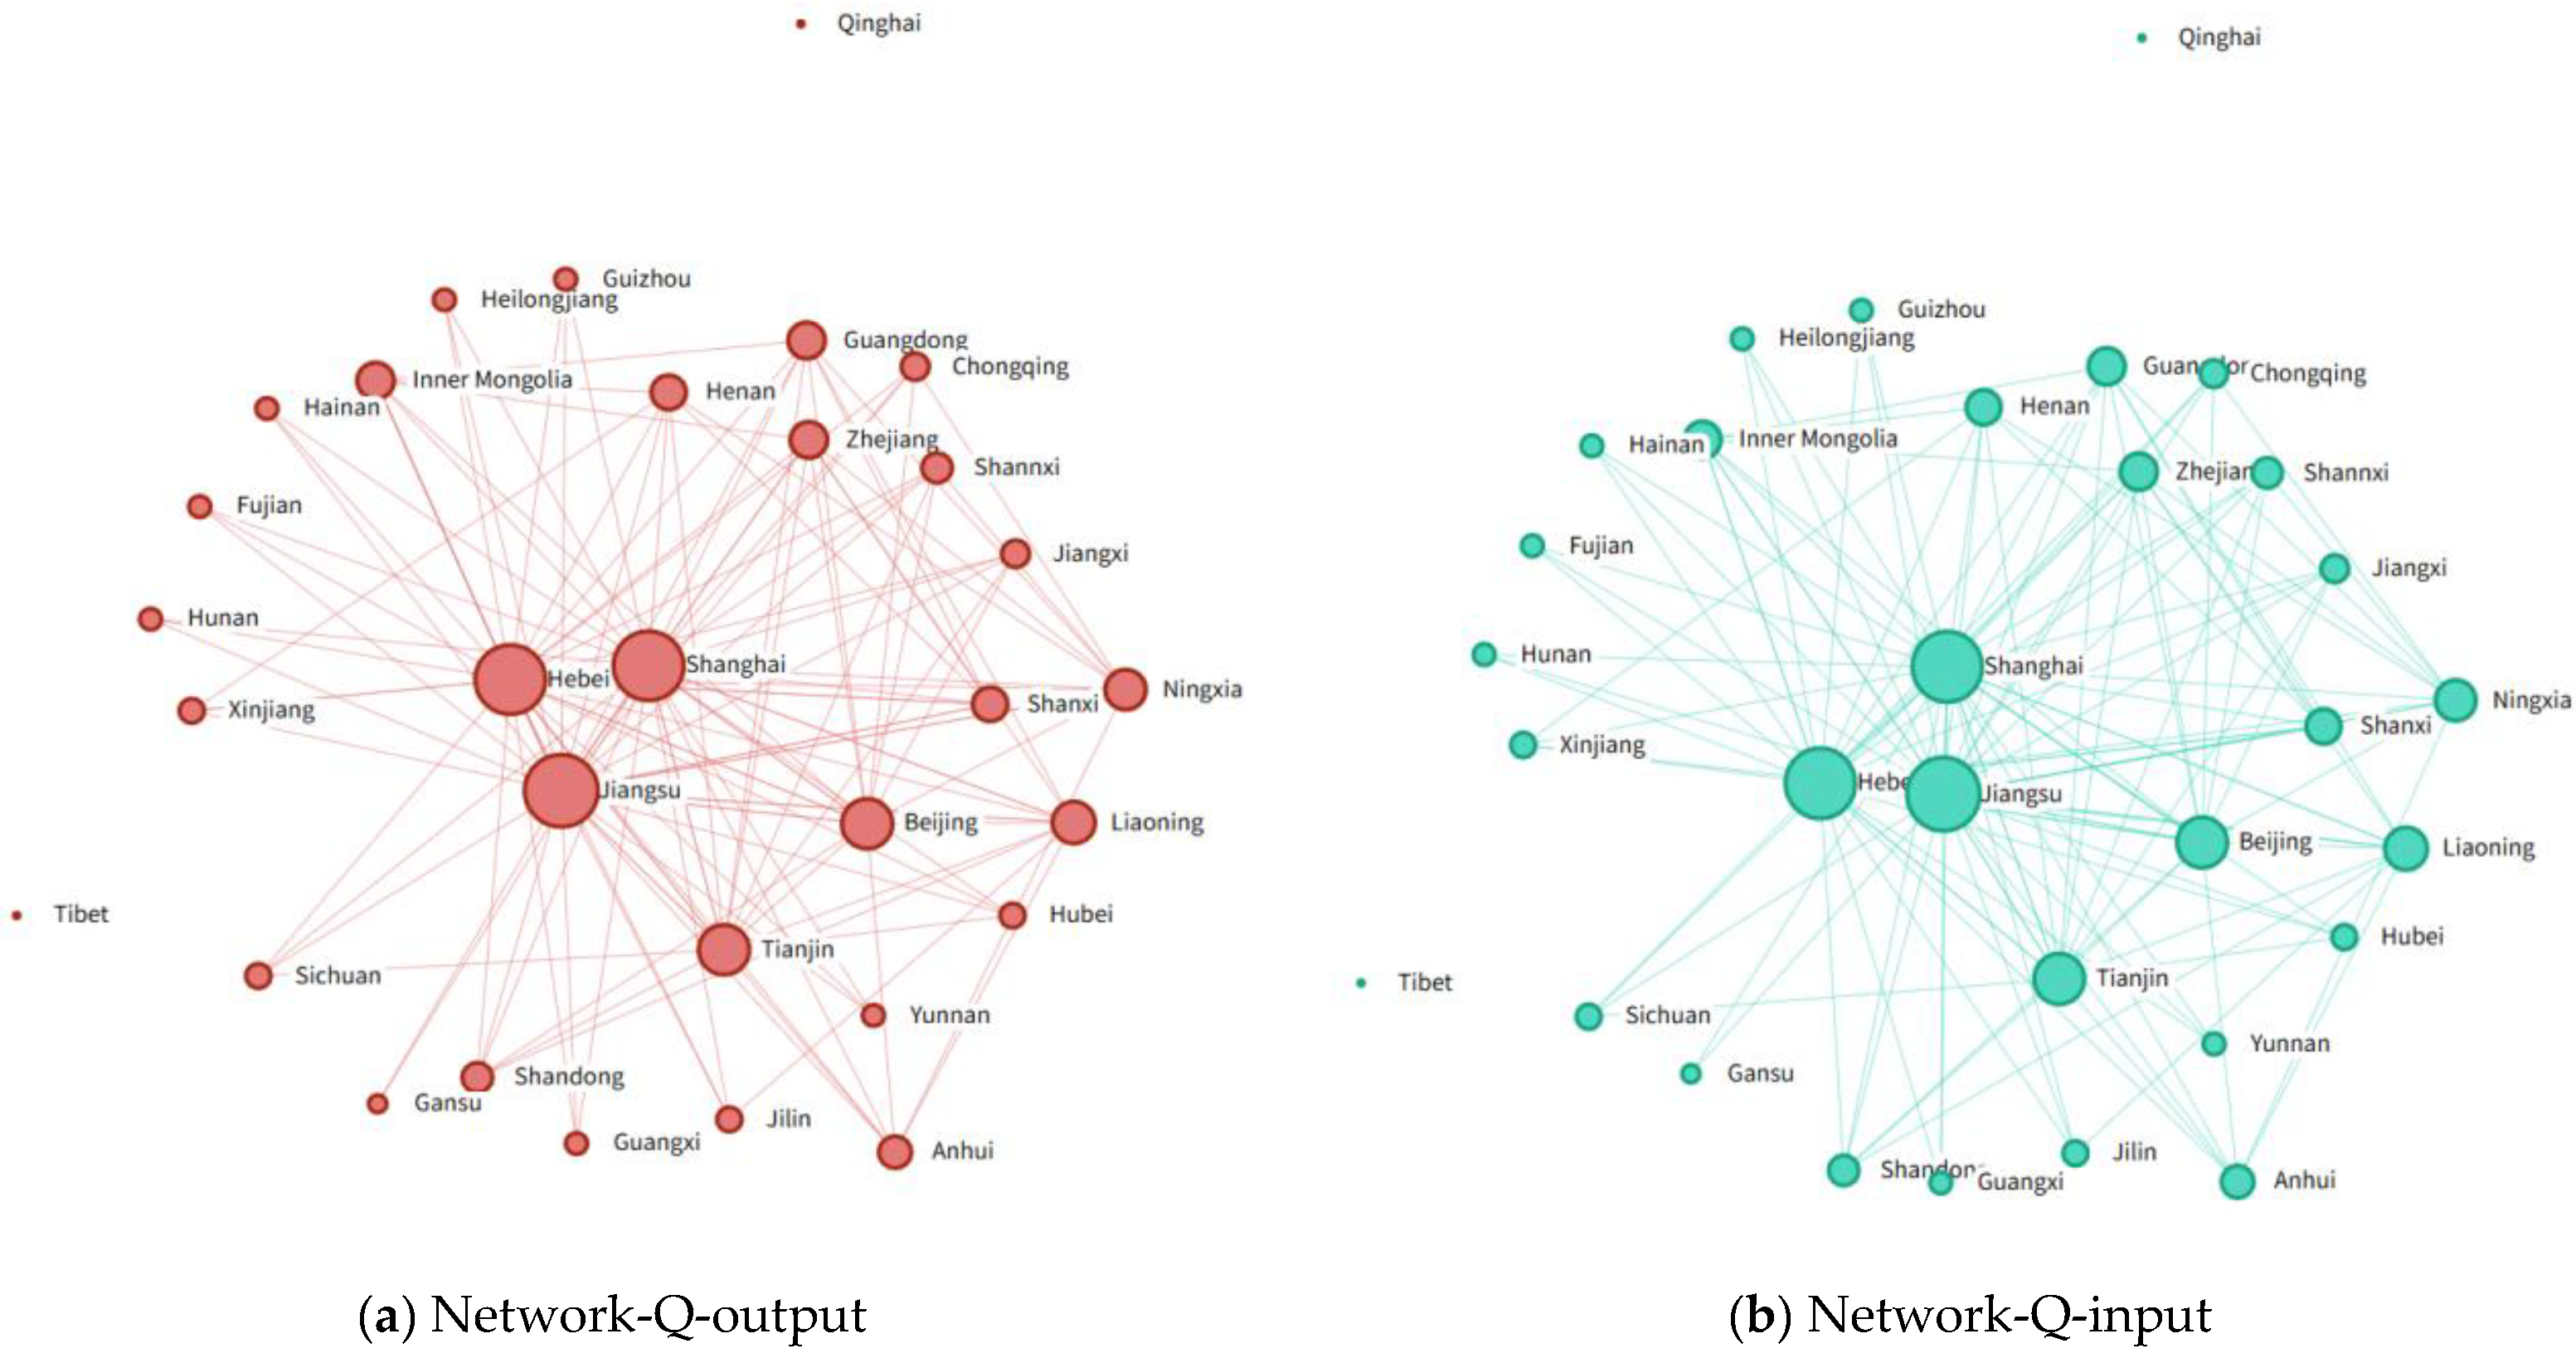
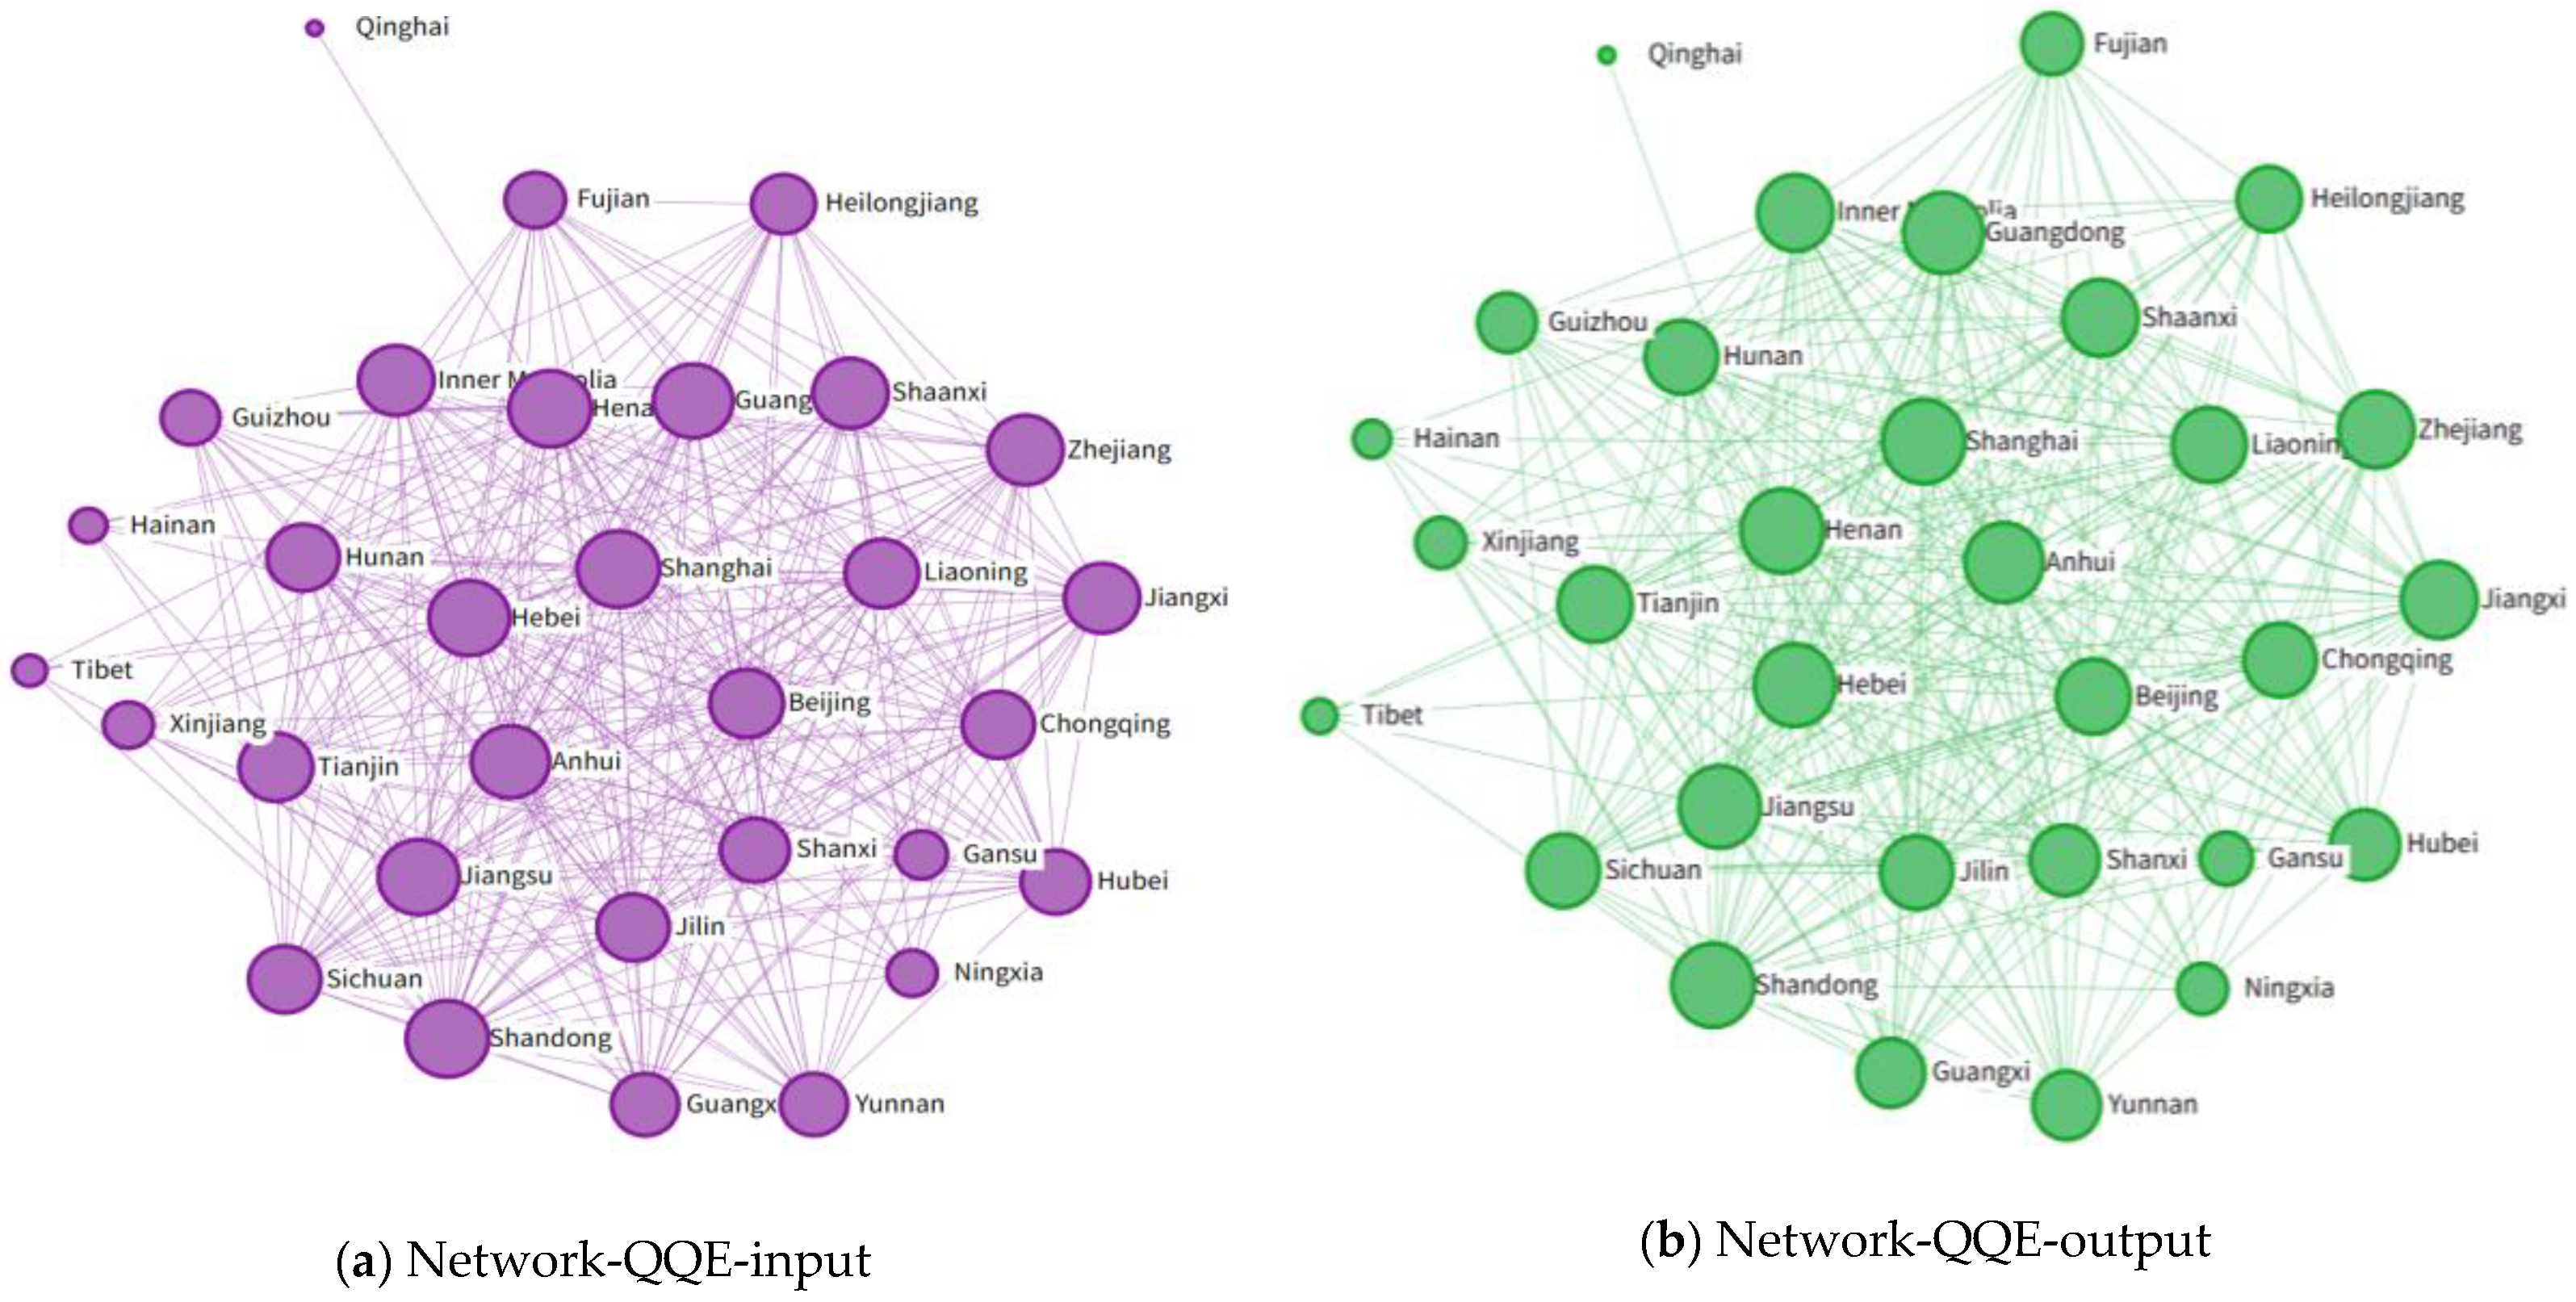
From a system-wide perspective, the water scarcity risk transmission network exhibits a pronounced structural strengthening as the evaluation dimensions expand from a single water-quantity constraint (Q) to the integrated QQE framework. Network density increases continuously, the average path length decreases markedly, and the weighted clustering coefficient rises substantially. Together, these changes indicate that water scarcity risk is evolving from a relatively dispersed regional issue into a highly connected systemic risk network with greater transmission efficiency.
Under the quantity-only scenario (Q), the network density is 0.2065, with 192 effective directed links, suggesting that risk transmission is concentrated along a limited set of trade linkages. When water quality constraints are introduced, network density rises rapidly to 0.4129, and the number of effective links increases to 384, demonstrating that pollution-related constraints substantially broaden interprovincial interdependence by activating previously implicit supply-chain pressures. After further incorporating environmental flow requirements (QQE), network density increases to 0.6204, with 577 effective links. This indicates that ecological water allocation converts a large share of latent supply–demand tensions into explicit risk connections, producing a highly coupled and structurally more complex national network. Under this integrated framework, water scarcity is no longer a local or regional constraint; rather, it becomes a nationwide systemic risk network embedded in the economic system.
Multidimensional constraints also accelerate the diffusion of risk through the economic system. As the evaluation framework expands, the average path length decreases from 1.562 under Q to 1.316 under QQE, a reduction of approximately 15.7%, indicating that fewer intermediate steps are required for risk to spread between provinces. Meanwhile, network cohesion increases from 0.328 to 0.763, suggesting that overall interconnections become much tighter. Importantly, enhanced transmission efficiency does not imply reduced risk. Instead, it implies that systemic risks can diffuse and accumulate more rapidly. Under QQE, the weighted clustering coefficient reaches 0.547, compared with 0.373 under Q, indicating that high-weight risk pathways form tightly connected local clusters. This clustering structure intensifies the potential for co-amplification of risks among closely linked regions.

3.3.2. Identification of Key Risk Nodes and Role Transitions

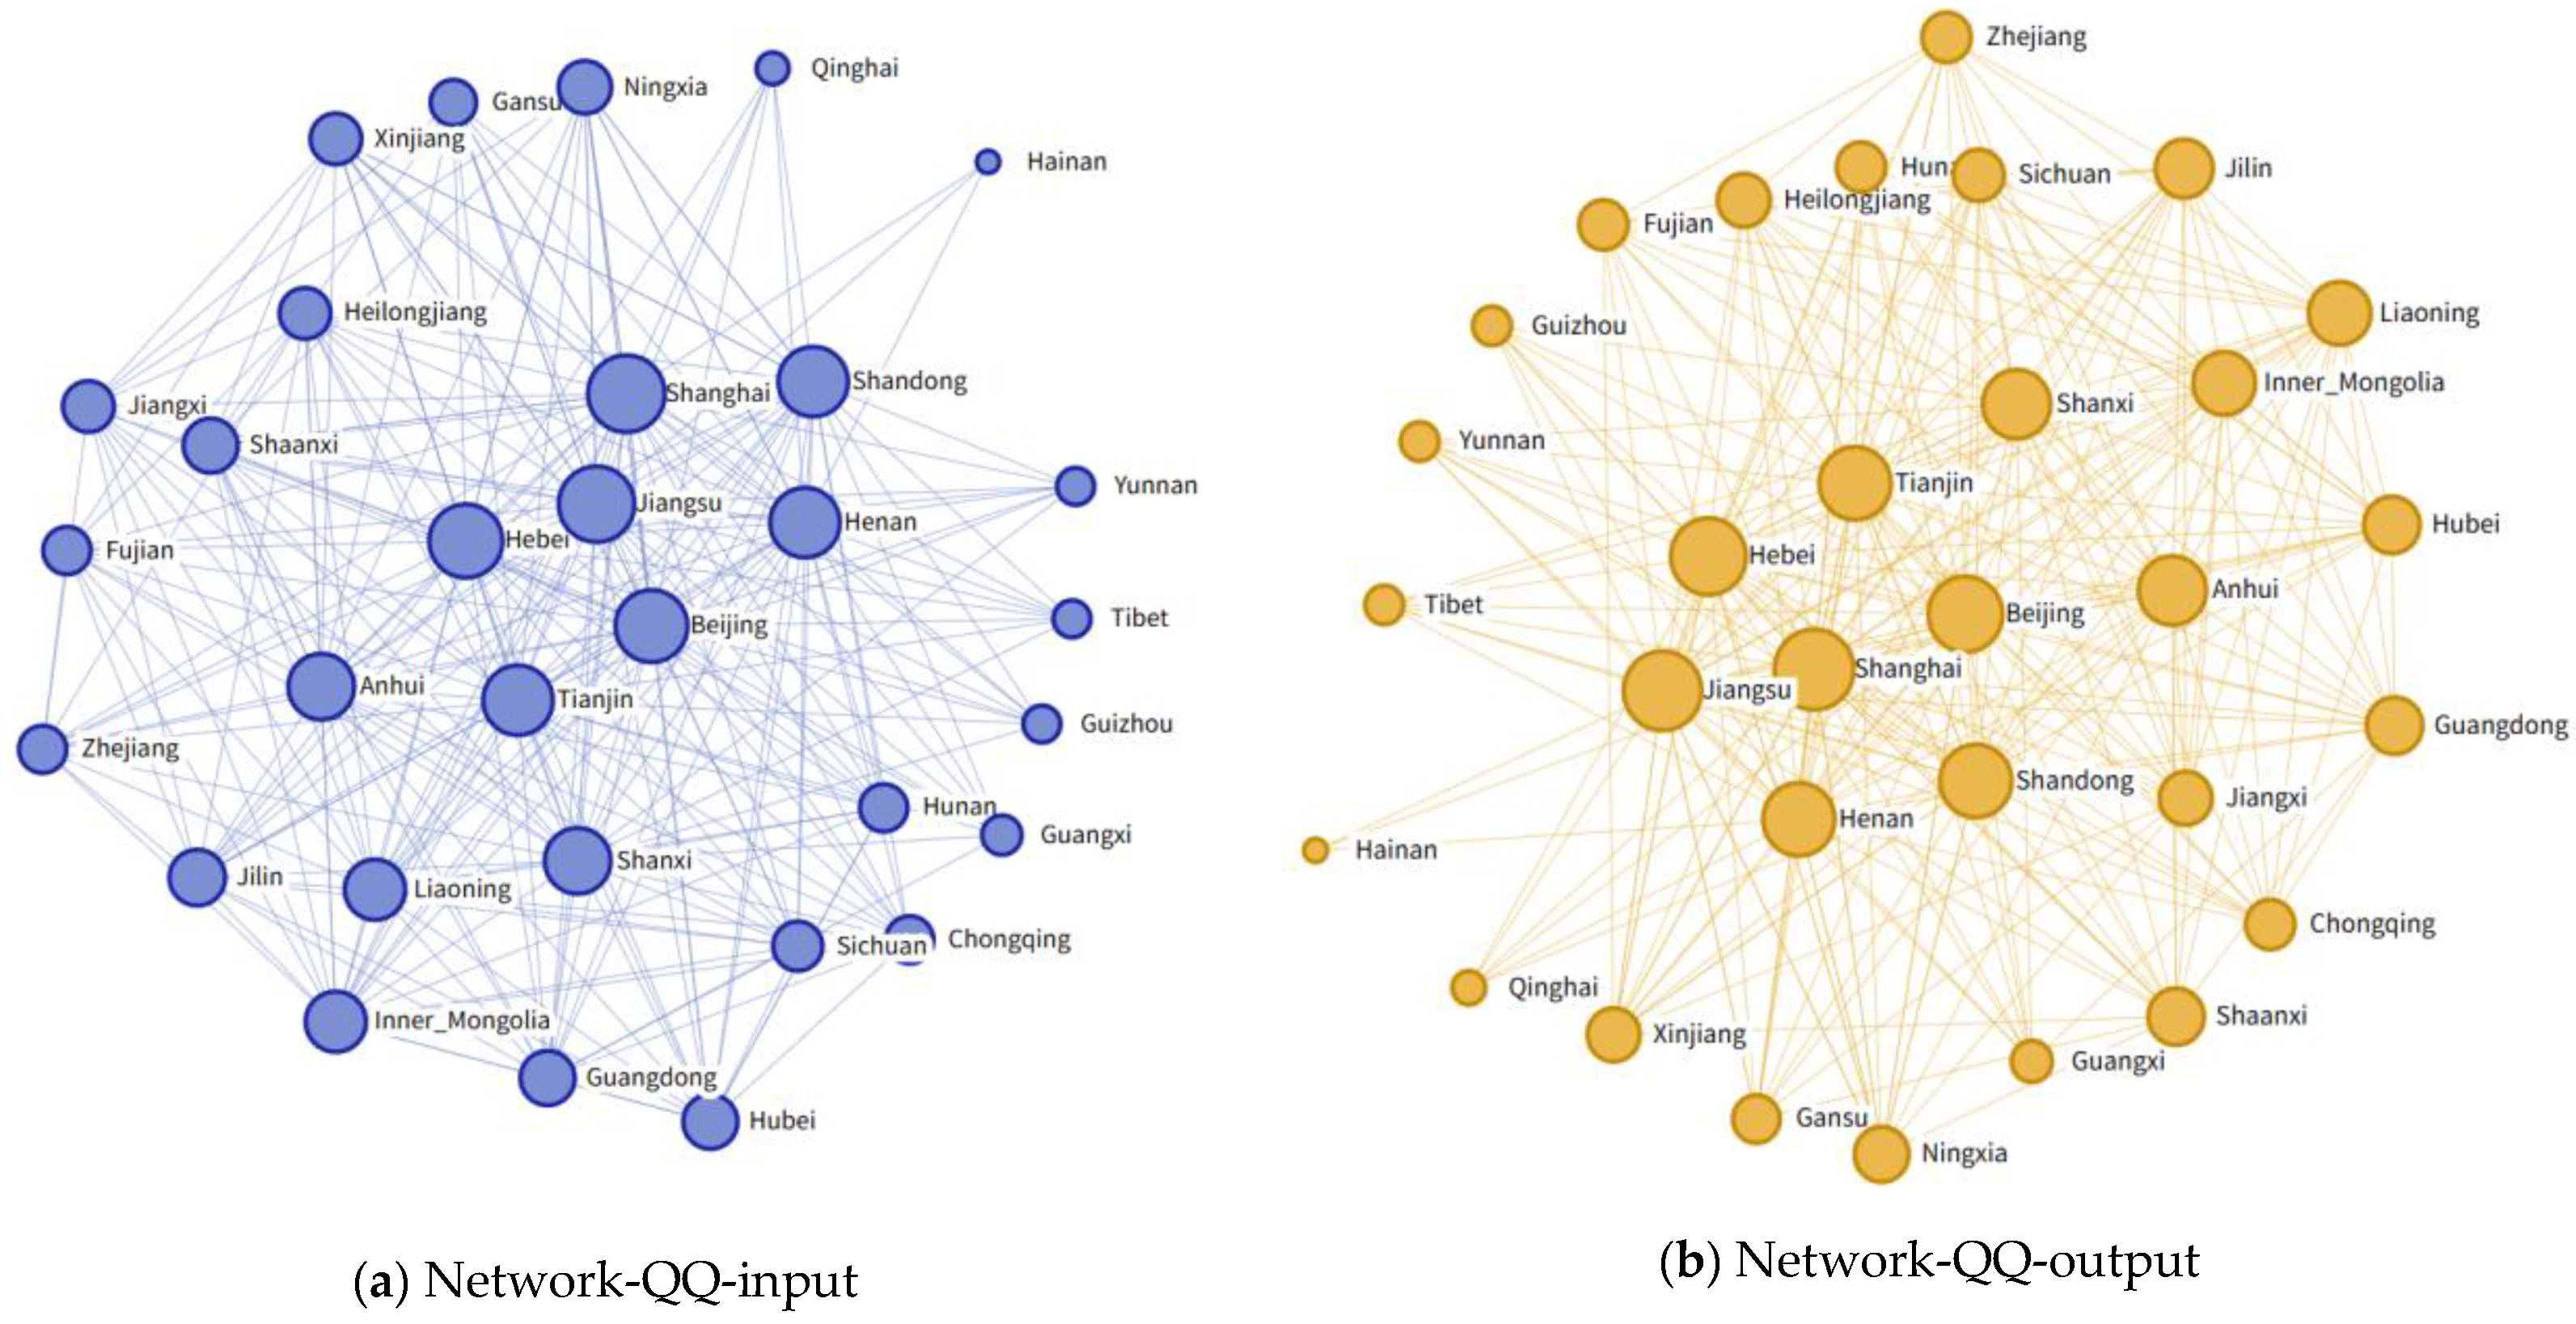
Under the quantity-only scenario (Q), Shanghai and Jiangsu act as the dominant risk-exporting cores, with weighted out-degrees of 29.221 and 29.112, respectively, representing the highest risk radiation intensity in the network. Hebei and Shandong function as critical “bridges” in interprovincial risk transmission, supported by high betweenness centrality values. In contrast, Henan is primarily a risk-importing province weighted in-degree 14.956, with relatively limited outward transmission capacity (Figure 7).
When water quality constraints are incorporated (QQ), the network core begins to shift. Henan’s weighted in-degree rises to 13.309, making it the province most strongly impacted by external risk inflows, indicating that pollution-related constraints significantly increase the dependence of central China on cross-regional supply chains. At the same time, Jiangsu maintains strong outward transmission capacity, while Shanghai’s risk export intensity declines slightly, suggesting heterogeneous impacts of water quality constraints across major economic centers (Figure 8).
After environmental flow requirements are further included (QQE), Henan replaces coastal economic powerhouses as the central hub of national risk diffusion. Its weighted out-degree rises to 24.893, representing an increase of roughly 330% relative to the quantity-only case, while its betweenness centrality reaches 4.778, indicating that Henan simultaneously holds strong risk radiation capacity and notable control over risk transmission pathways. Jiangsu remains an important risk exporter, Its weighted out-degree rises to 24.169, whereas Shandong’s bridging function weakens further (Figure 9).
By contrast, provinces such as Qinghai and Tibet remain consistently located at the network periphery across all scenarios. For example, Qinghai’s normalized weighted out-degree under QQE is only 0.004, while Tibet exhibits almost no effective risk linkages, implying extremely low participation in the national water scarcity risk network. Overall, this evidence points to an increasingly reinforced core–periphery structure under multidimensional constraints.

3.3.3. Risk Modularization

Multidimensional water constraints reshape not only overall network connectivity but also the way risk clusters within local structures. As the evaluation framework expands from Q to QQE, the average clustering coefficient decreases slightly from 0.720 to 0.685, indicating a modest weakening of generic local interconnectedness. However, the weighted clustering coefficient increases substantially, revealing that high-risk, high-weight transmission pathways become increasingly concentrated among a limited set of provinces.
Under the QQE scenario, Henan, Jiangsu, and Shandong form a pronounced “core triangle” of risk diffusion, with weighted out-degrees of 24.893, 24.169, and 17.240, respectively. Together, these three provinces account for 23.8% of total network risk outflows. This configuration suggests a “bundled” diffusion pattern: once risk increases in one core node, it can readily trigger regionally coupled shocks through strong, high-weight connections. The structural patterns identified in this study also exhibit consistency with observed regional water stress conditions. Provinces highlighted as high-risk or structurally central nodes—such as Henan, Jiangsu, and Shandong—are frequently reported in national water resource assessments as facing elevated water stress and pollution pressures. This correspondence lends additional credibility to the structural identification of risk hubs derived from the network analysis.
Meanwhile, the structural gap between peripheral regions, including Qinghai and Tibet, and the core module continues to widen, indicating a highly uneven modular risk landscape. Overall, the multidimensional framework yields a network characterized by higher connectivity, faster transmission, and stronger core clustering. Water quality degradation and environmental flow requirements not only enlarge the magnitude of risk, but also accelerate its diffusion by restructuring the network and enhancing the systemic significance of key hub provinces. These results imply that China’s water scarcity has evolved into a systemic risk embedded in the economic network, requiring governance strategies that move beyond point-based control toward coordinated interventions targeting key nodes and critical structural pathways.

4. Conclusions

This study proposes an integrated assessment framework that extends the concept of water scarcity from a single-dimensional resource constraint to a multidimensional systemic risk by jointly incorporating water quantity constraints, water quality degradation, and environmental flow requirements. By embedding the framework within a multiregional input–output (MRIO) model and applying economic network analysis, the study examines the formation, spatial distribution, and interregional and intersectoral transmission of water scarcity risk in China. The main conclusions are summarized as follows.
First, multidimensional environmental constraints substantially amplify water scarcity risk and fundamentally reshape its spatial distribution. Under conventional quantity-based assessments, water scarcity risk is primarily concentrated in economically developed and water-intensive regions, such as the Beijing–Tianjin–Hebei and Yangtze River Delta urban agglomerations. When water quality degradation and environmental flow requirements are incorporated, risk expands markedly toward major agricultural provinces, represented by Henan, as well as regions with important ecological functions. This shift indicates that contemporary water scarcity is no longer determined solely by insufficient water supply, but increasingly reflects the combined pressures of water pollution and ecosystem water demand.
Second, sectoral water scarcity risk remains structurally concentrated and propagates through intersectoral supply chain linkages. Water-intensive, pollution-intensive, and basic material industries consistently constitute the core of risk accumulation under all scenarios. Heavy and chemical industries exhibit particularly high sensitivity to multidimensional water constraints, while risks are transmitted to downstream sectors with relatively low direct water use through economic linkages. Construction, chemical manufacturing, and metal smelting remain central nodes in the risk structure, and parts of the service sector and light manufacturing become exposed under integrated assessment. These results suggest that management strategies focusing only on a limited set of traditionally water-intensive industries may underestimate indirect and linkage-driven risks.
Third, the economic network structure plays a decisive role in the diffusion and amplification of water scarcity risk. Risk transmission is highly uneven across regions and is dominated by a small number of hub provinces. Under integrated constraints, Henan evolves from a major risk recipient into a key transmission hub, Meanwhile, Jiangsu remains an important source of risk outflows, maintaining high outward transmission strength within the network structure. Meanwhile, economically developed regions such as Beijing–Tianjin–Hebei and the Yangtze River Delta act as major aggregation terminals of nationwide risk. This hub-dominated transmission pattern indicates that localized water constraints can evolve into systemic economic risks through embedded network structures.
Based on these findings, several policy implications can be drawn. Water governance should move beyond single-dimensional water quantity management toward an integrated approach that simultaneously addresses water quality improvement and ecological flow requirements. In addition, effective risk mitigation requires a supply-chain-oriented perspective that identifies critical upstream sectors and coordinates industrial structure adjustment with water use optimization. Finally, given the dominant role of key regional hubs in risk transmission, network-oriented regulation and interregional coordination are essential to enhance system resilience and prevent the rapid amplification of water scarcity risks across the economic network.
The MRIO framework employed in this study is based on the 2017 benchmark-year input–output table and thus represents a comparative-static structural analysis. As an accounting-based approach, MRIO captures intersectoral relationships under a given economic configuration without modeling endogenous temporal adjustments. The present analysis aims to identify structural risk propagation patterns and key transmission hubs embedded in the existing production network.
Future research may extend this framework toward multiperiod comparisons or dynamic modeling approaches to examine the evolution of water scarcity risk under climate change and economic transition scenarios. In addition, although the results are structurally consistent with observed regional water stress patterns, incorporating empirical data such as production losses, drought records, or ecological monitoring indicators would further enhance model validation.

Author Contributions

Conceptualization, C.S. and X.L.; methodology, X.L.; software, K.Z.; formal analysis, X.L.; data curation, K.Z. and R.Z.; writing—original draft preparation, X.L.; writing—review and editing, K.Z., R.Z. and C.S.; visualization, X.L.; supervision, C.S.; project administration, C.S. All authors have read and agreed to the published version of the manuscript.

Funding

This research was funded by the National Innovation and Entrepreneurship Training Program for Undergraduates (Grant No. 202510294087).

Data Availability Statement

The original China Multi-Regional Input-Output Table 2017 is available from Carbon Emission Accounts and Datasets (CEADs) at https://www.ceads.net/data/input_output_tables (accessed on 1 March 2025) [48]. Water usage data of each province derived from the “China Water Resources Bulletin 2017” is available from Ministry of Water Resources of the People’s Republic of China at http://mwr.gov.cn/sj/tjgb/szygb/201811/P020220121619384021110.pdf and http://mwr.gov.cn/sj/tjgb/szygb/ (accessed on 1 March 2025) [49]. The authors confirm that critical data generated during this research are included in this article as tables and figures. Additional data will be made available on reasonable request.

Conflicts of Interest

The authors declare no conflicts of interest.

References

  1. Zhao, F.; Wang, X.; Wu, Y.; Singh, S.K. Prefectures vulnerable to water scarcity are not evenly distributed across China. Commun. Earth Environ. 2023, 4, 145. [Google Scholar] [CrossRef]
  2. Ahmed, A.A.; Sayed, S.; Abdoulhalik, A.; Moutari, S.; Oyedele, L. Applications of machine learning to water resources management: A review of present status and future opportunities. J. Clean. Prod. 2024, 441, 140715. [Google Scholar] [CrossRef]
  3. Babuna, P.; Yang, X.; Tulcan, R.X.S.; Dehui, B.; Takase, M.; Guba, B.Y.; Han, C.L.; Awudi, D.A.; Li, M.S. Modeling water inequality and water security: The role of water governance. J. Environ. Manag. 2023, 326, 116815. [Google Scholar] [CrossRef] [PubMed]
  4. Boretti, A.; Rosa, L. Reassessing the projections of the World Water Development Report. npj Clean Water 2019, 2, 15. [Google Scholar] [CrossRef]
  5. Ingrao, C.; Strippoli, R.; Lagioia, G.; Huisingh, D. Water scarcity in agriculture: An overview of causes, impacts and approaches for reducing the risks. Heliyon 2023, 9, e18507. [Google Scholar] [CrossRef]
  6. Musie, W.; Gonfa, G. Fresh water resource, scarcity, water salinity challenges and possible remedies: A review. Heliyon 2023, 9, e18950. [Google Scholar] [CrossRef]
  7. Salehi, M. Global water shortage and potable water safety; Today’s concern and tomorrow’s crisis. Environ. Int. 2022, 158, 106936. [Google Scholar] [CrossRef]
  8. Yan, D.; Yao, M.; Ludwig, F.; Kabat, P.; Huang, H.Q.; Hutjes, R.W.A.; Werners, S.E. Exploring Future Water Shortage for Large River Basins under Different Water Allocation Strategies. Water Resour. Manag. 2018, 32, 3071–3086. [Google Scholar] [CrossRef]
  9. Gu, W.; Wang, F.; Siebert, S.; Guo, S.; Zhao, H.R.; Chiu, A.C.F.; Liang, S.; Zou, J.P.; Xu, M. The asymmetric impacts of international agricultural trade on water use scarcity, inequality and inequity. Nat. Water 2024, 2, 318–330. [Google Scholar] [CrossRef]
  10. He, C.Y.; Liu, Z.F.; Wu, J.G.; Pan, X.H.; Fang, Z.H.; Li, J.W.; Bryan, B.A. Future global urban water scarcity and potential solutions. Nat. Commun. 2021, 12, 6691. [Google Scholar] [CrossRef] [PubMed]
  11. Jia, X.; Klemes, J.J.; Alwi, S.R.W.; Varbanov, P.S. Regional Water Resources Assessment using Water Scarcity Pinch Analysis. Resour. Conserv. Recycl. 2020, 157, 104749. [Google Scholar] [CrossRef]
  12. Jones, E.R.; Bierkens, M.F.P.; Van Vliet, M.T.H. Current and future global water scarcity intensifies when accounting for surface water quality. Nat. Clim. Change 2024, 14, 512–519. [Google Scholar] [CrossRef]
  13. Li, M.; Long, K.S. Direct or Spillover Effect: The Impact of Pure Technical and Scale Efficiencies of Water Use on Water Scarcity in China. Int. J. Environ. Res. Public Health 2019, 16, 3401. [Google Scholar] [CrossRef]
  14. Jiang, M.; Yu, X.; Dai, M.; Shen, X.M.; Zhong, G.Y.; Yuan, C.L. How do Multi-Scale Virtual Water Flows of Large River Economic Belts Impact Regional Water Distribution: Based on a Nested Input-Output Model. Water Resour. Manag. 2024, 38, 1027–1043. [Google Scholar] [CrossRef]
  15. Huang, Z.W.; Yuan, X.; Ji, P.; Sun, S.; Leng, G. Shifts in trends and correlation of water scarcity and productivity over China. J. Hydrol. 2024, 635, 131187. [Google Scholar] [CrossRef]
  16. Wei, J.; Lei, Y.; Liu, L.; Yao, H. Water scarcity risk through trade of the Yellow River Basin in China. Ecol. Indic. 2023, 154, 110893. [Google Scholar] [CrossRef]
  17. Zhong, R.; Chen, A.F.; Zhao, D.D.; Mao, G.Q.; Zhao, X.; Huang, H.; Liu, J.G. Impact of international trade on water scarcity: An assessment by improving the Falkenmark indicator. J. Clean. Prod. 2023, 385, 135740. [Google Scholar] [CrossRef]
  18. Qu, S.; Liang, S.; Konar, M.; Zhu, Z.Q.; Chiu, A.S.F.; Jia, X.P.; Xu, M. Virtual Water Scarcity Risk to the Global Trade System. Environ. Sci. Technol. 2018, 52, 673–683. [Google Scholar] [CrossRef] [PubMed]
  19. Allan, J.A. Virtual water: A strategic resource global solutions to regional deficits. Ground Water 1998, 36, 545–546. [Google Scholar] [CrossRef]
  20. Li, M.; Yang, X.; Wang, K.; Di, C.; Xiang, W.; Zhang, J. Exploring China’s water scarcity incorporating surface water quality and multiple existing solutions. Environ. Res. 2024, 246, 118191. [Google Scholar] [CrossRef]
  21. Li, P.; He, C.; Huang, Q.; Wang, Y.D.; Zhao, Y.X. Spillover of Water Scarcity Risk through Virtual Water Trade in Rapidly Urbanizing Drylands. Int. J. Disaster Risk Sci. 2025, 16, 618–635. [Google Scholar] [CrossRef]
  22. Liu, W.; Antonelli, M.; Kummu, M.; Zhao, X.; Wu, P.T.; Liu, J.G.; Zhuo, L.; Yang, H. Savings and losses of global water resources in food-related virtual water trade. Wiley Interdiscip. Rev.-Water 2019, 6, e1320. [Google Scholar] [CrossRef]
  23. Xie, J.; Qu, S.; Xu, M. Mapping water scarcity risks in global supply chain networks. Int. J. Logist. Res. Appl. 2024, 27, 2541–2555. [Google Scholar] [CrossRef]
  24. Mekonnen, M.M.; Hoekstra, A.Y. Four billion people facing severe water scarcity. Sci. Adv. 2016, 2, e1500323. [Google Scholar] [CrossRef] [PubMed]
  25. Huang, H.; Wang, J.; Han, Y.; Wang, L.; Li, X.S. Assessing impacts of water regulations on alleviating regional water stress with a system dynamics model. Water Supply 2019, 19, 635–643. [Google Scholar] [CrossRef]
  26. Liu, Q.; Yan, D.; He, Y.; Deng, W.; Zhang, G. Early Warning for Agricultural Water Security in Northeast Region of China. Bull. Soil Water Conserv. 2003, 23, 53–57. [Google Scholar]
  27. Shu, R.; Cao, X.C.; Wu, M.Y. Clarifying Regional Water Scarcity in Agriculture based on the Theory of Blue, Green and Grey Water Footprints. Water Resour. Manag. 2021, 35, 1101–1118. [Google Scholar] [CrossRef]
  28. Yan, Y.; Wang, R.; Chen, S.; Zhang, Y.; Sun, Q.L. Three-dimensional agricultural water scarcity assessment based on water footprint: A study from a humid agricultural area in China. Sci. Total Environ. 2023, 857, 159407. [Google Scholar] [CrossRef]
  29. Damkjaer, S.; Taylor, R. The measurement of water scarcity: Defining a meaningful indicator. Ambio 2017, 46, 513–531. [Google Scholar] [CrossRef]
  30. Ding, B.B.; Zhang, J.M.; Zheng, P.F.; Li, Z.D.; Wang, Y.S.; Jia, G.D.; Yu, X.X. Water security assessment for effective water resource management based on multi-temporal blue and green water footprints. J. Hydrol. 2024, 632, 130761. [Google Scholar] [CrossRef]
  31. Yang, J.; Li, J.; Van Vliet, M.T.H.; Jones, E.R.; Huang, Z.W.; Liu, M.M.; Bi, J. Economic risks hidden in local water pollution and global markets: A retrospective analysis (1995–2010) and future perspectives on sustainable development goal 6. Water Res. 2024, 252, 121216. [Google Scholar] [CrossRef]
  32. Zhang, X.; Zhao, X.; Li, R.; Mao, G.Q.; Tillotson, M.R.; Liao, X.W.; Zhang, C.; Yi, Y.J. Evaluating the vulnerability of physical and virtual water resource networks in China’s megacities. Resour. Conserv. Recycl. 2020, 161, 104972. [Google Scholar] [CrossRef]
  33. Wang, C.; Shuai, C.; Chen, X.; Sun, J.R.; Zhao, B. Linking local and global: Assessing water scarcity risk through nested trade networks. Sustain. Dev. 2025, 33, 1–18. [Google Scholar] [CrossRef]
  34. Wang, Y.; Shuai, C.; Chen, X.; Huang, W.; Sun, J.R.; Zhao, B. Estimating water scarcity risks under climate change: A provincial perspective in China. Water Environ. Res. 2025, 97, e70031. [Google Scholar] [CrossRef] [PubMed]
  35. Liu, W.; Fu, Z.; Van Vliet, M.T.H.; Davis, K.F.; Ciais, P.; Bao, Y.Z.; Bai, Y.W.; Du, T.S.; Kang, S.Z.; Yin, Z.; et al. Global overlooked multidimensional water scarcity. Proc. Natl. Acad. Sci. USA 2025, 122, e2421625122. [Google Scholar] [CrossRef] [PubMed]
  36. Guan, Y.; Qiang, Y.; Li, B.; Zhang, N.N.; Xiao, Y.; Lu, W.T. Assessing the integrated environmental impacts and typological characteristics of water pollution and scarcity in Chinese cities. J. Hydrol. 2025, 661, 133662. [Google Scholar] [CrossRef]
  37. She, Y.; Chen, J.; Zhou, Q.; Wang, L.P.; Duan, K.; Wang, R.R.; Qu, S.; Xu, M.; Zhao, Y. Evaluating Losses from Water Scarcity and Benefits of Water Conservation Measures to Intercity Supply Chains in China. Environ. Sci. Technol. 2024, 58, 1119–1130. [Google Scholar] [CrossRef]
  38. Ma, T.; Sun, S.; Fu, G.T.; Hall, J.W.; Ni, Y.; He, L.; Yi, J.; Zhao, N.; Du, Y.; Pei, T.; et al. Pollution exacerbates China’s water scarcity and its regional inequality. Nat. Commun. 2020, 11, 5522. [Google Scholar] [CrossRef] [PubMed]
  39. Huang, H.; Pang, Q.; Shi, C.; Zhi, J. Complex network analysis of water scarcity risk propagation in the Yellow River Basin under the quality-quantity-environmental flow requirement (QQE) framework. J. Clean. Prod. 2026, 538, 147238. [Google Scholar] [CrossRef]
  40. Wang, M.; Bodirsky, B.L.; Rijneveld, R.; Beier, F.; Bak, M.P.; Batool, M.; Droppers, B.; Popp, A.; van Vliet, M.T.H.; Strokal, M. A triple increase in global river basins with water scarcity due to future pollution. Nat. Commun. 2024, 15, 2523. [Google Scholar] [CrossRef]
  41. Li, J.; Yang, J.; Liu, M.; Ma, Z.; Fang, W.; Bi, J. Quality matters: Pollution exacerbates water scarcity and sectoral output risks in China. Water Res. 2022, 224, 119059. [Google Scholar] [CrossRef]
  42. Xu, Y.; Tian, G.; Xu, S.; Xia, Q. Analysis of Virtual Water Flow Patterns and Their Drivers in the Yellow River Basin. Sustainability 2023, 15, 4393. [Google Scholar] [CrossRef]
  43. Zhi, J.; Yu, Y.; Zeng, Q.; Shi, C.; Chen, S.; Wang, Y. Multi-scale near-long-range flow measurement and analysis of virtual water in China based on multi-regional input-output model and machine learning. Process Saf. Environ. Prot. 2023, 175, 854–869. [Google Scholar] [CrossRef]
  44. Dong, G.; Zhang, J.; Tian, L.; Chen, Y.; Zhang, M.X.; Nan, Z.W. Structural Properties Evolution and Influencing Factors of Global Virtual Water Scarcity Risk Transfer Network. Energies 2023, 16, 1436. [Google Scholar] [CrossRef]
  45. Wang, C.; Wang, Y.; Shuai, C.; Chen, X.; Zhao, B.; Qu, S.; Xu, M. Water Scarcity and Its Cascading Economic Effects in China’s Trade Network: A Transmission Analysis. Water Res. 2026, 125407. [Google Scholar] [CrossRef]
  46. Shi, C.F.; Qi, J.H.; Zhi, J.Q.; Zhang, C.J.; Chen, Q.Y.; Na, X.H. Study on the pattern and driving factors of water scarcity risk transfer networks in China from the perspective of transfer value: Based on complex network methods. Environ. Impact Assess. Rev. 2025, 112, 107752. [Google Scholar] [CrossRef]
  47. Huang, W.; Shuai, C.Y.; Xiang, P.C.; Chen, X.; Zhao, B. Mapping water scarcity risk in China with the consideration of spatially heterogeneous environmental flow requirement. Environ. Impact Assess. Rev. 2024, 105, 107400. [Google Scholar] [CrossRef]
  48. Zheng, H.; Zhang, Z.; Wei, W.; Song, M.; Dietzenbacher, E.; Wang, X.; Meng, J.; Shan, Y.; Ou, J.; Guan, D. Regional determinants of China’s consumption-based emissions in the economic transition. Environ. Res. Lett. 2020, 15, 074001. [Google Scholar] [CrossRef]
  49. Ministry of Water Resources of the People’s Republic of China. China Water Resources Bulletin 2017; China Water Power Press: Beijing, China, 2018.
  50. GB 3838–2002; Environmental Quality Standards for Surface Water. China Environmental Science Press: Beijing, China, 2002.
Figure 1. Enhanced framework for assessing water scarcity risk in China.
Water 18 00644 g001
Figure 2. Water stress index in different regions under various scenarios in 2017.
Water 18 00644 g002
Figure 3. LWSR index in different regions under various scenarios in 2017.
Water 18 00644 g003
Figure 4. VWSR index in different regions under various scenarios.
Water 18 00644 g004
Figure 5. Inflow–Outflow of VWSR under Q and QQ scenarios.
Water 18 00644 g005
Figure 6. Inflow–Outflow of VWSR under QQE scenario.
Water 18 00644 g006
Figure 7. Water Risk Transmission Network under the Q Scenario.
Water 18 00644 g007
Figure 8. Water Risk Transmission Network under the QQ Scenario.
Water 18 00644 g008
Figure 9. Water Risk Transmission Network under the QQE Scenario.
Water 18 00644 g009
Table 1. Top 5 VWSR-Q transmission paths (Unit: Million yuan).
Outflow Region–SectorInflow Region–SectorRisk Value
Shanghai—Manufacture of transport equipmentShandong—Manufacture of transport equipment38.98
Jiangsu—Manufacture of communication equipment, computers and other electronic equipmentGuangdong—Manufacture of communication equipment, computers and other electronic equipment29.44
Jiangsu—Manufacture of chemical productsZhejiang—Manufacture of chemical products29.21
Jiangsu—Manufacture of chemical productsGuangdong—Manufacture of chemical products27.11
Jiangsu—Leasing and commercial servicesBeijing—Leasing and commercial services25.84
Table 2. Top 5 VWSR-QQ transmission paths (Unit: Million yuan).
Outflow Region–SectorInflow Region–SectorRisk Value
Shanghai—Manufacture of transport equipmentShandong—Manufacture of transport equipment49.63
Jiangsu—Manufacture of communication equipment, computers and other electronic equipmentGuangdong—Manufacture of communication equipment, computers and other electronic equipment40.28
Jiangsu—Manufacture of chemical productsZhejiang—Manufacture of chemical products39.98
Shanxi—Mining and washing of coalZhejiang—Production and distribution of electric power and heat power37.16
Jiangsu—Manufacture of chemical productsGuangdong—Manufacture of chemical products37.10
Table 3. Top 5 VWSR-QQE transmission paths (Unit: Million yuan).
Outflow Region–SectorInflow Region–SectorRisk Value
Henan—Manufacture of non-metallic mineral productsGuangdong—Construction78.00
Shanxi—Mining and washing of coalZhejiang—Production and distribution of electric power and heat power52.84
Shanghai—Manufacture of transport equipmentShandong—Manufacture of transport equipment49.77
Jiangsu—Manufacture of communication equipment, computers and other electronic equipmentGuangdong—Manufacture of communication equipment, computers and other electronic equipment48.91
Jiangsu—Manufacture of chemical productsZhejiang—Manufacture of chemical products48.55
Disclaimer/Publisher’s Note: The statements, opinions and data contained in all publications are solely those of the individual author(s) and contributor(s) and not of MDPI and/or the editor(s). MDPI and/or the editor(s) disclaim responsibility for any injury to people or property resulting from any ideas, methods, instructions or products referred to in the content.