1. Introduction
Under the dual pressures of global climate change and escalating water scarcity, improving water use efficiency for sustainable agricultural development has become critical [
1]. In China, agricultural irrigation accounts for more than 60% of total water withdrawals [
2]. However, overall water use efficiency remains relatively low, and substantial water losses and wastage persist across parts of the effectively irrigated area [
3]. This situation not only constrains progress toward national food security objectives but also exerts sustained pressure on water-dependent ecosystems. Consequently, optimizing irrigation water allocation under complex and rapidly evolving natural and socioeconomic conditions has emerged as a key scientific challenge in agricultural water management. However, multiple sources of uncertainty such as precipitation fluctuations [
4], groundwater depth [
5,
6] and soil heterogeneity [
7,
8] are prevalent in actual agricultural systems. At present, most relevant research models adopt a static solution mode and fail to accurately characterize the dynamic response and adaptive adjustment capabilities of irrigation systems over time series. They rarely consider the water use competition among multiple water users, making it difficult to support adaptive regulation and timely decision adjustment in modern agricultural management.
To alleviate water scarcity and intensifying competition among multiple water users, considerable research has focused on water allocation strategies, irrigation scheduling optimization, and the promotion of water-saving irrigation technologies. Notable progress has been made in developing scientifically grounded allocation frameworks. For example, Babel et al. proposed a multi-objective water allocation model that simultaneously considers economic, social, and environmental benefits [
9]. Yang et al. reviewed evidence on drip irrigation and reported that, compared with conventional irrigation methods including sprinkler irrigation, drip irrigation can reduce irrigation water inputs while maintaining crop yields, and in some cases increasing yields [
10]. More recently, Wang et al. developed a multi-objective allocation framework and introduced a dynamic scheduling scheme to reconcile heterogeneous water demands with environmental sustainability [
11]. Overall, these studies integrate key dimensions such as economic performance, social equity, and ecological protection, and they employ multi-objective optimization to quantify trade-offs and support more robust allocation decisions.
Regarding irrigation scheduling optimization, an internationally adopted paradigm is to couple crop growth models with optimization algorithms. The AquaCrop model has been widely used to assess crop yield and water use efficiency under alternative irrigation schedules. For instance, Tang et al. integrated AquaCrop with particle swarm optimization to optimize irrigation timing and quotas, thereby significantly improving water use efficiency [
12]. Wang et al. employed AquaCrop to examine water use efficiency under different hydrological year types and showed that irrigation management strategies can substantially influence water resource outcomes [
13]. In addition, to address practical characteristics of irrigation water allocation, including parameter uncertainty and time-varying constraints, Yang et al. proposed an improved interval parameter programming approach to derive robust allocation schemes, emphasizing the need for reliable and implementable decisions under uncertainty [
14]. Nevertheless, regulation in irrigation districts requires more than deriving a single optimal solution; it also demands closed-loop integration with canal operation processes and management objectives. Aligning allocation decisions with operational rules and enhancing scheduling responsiveness to supply and demand variability are essential for improving the practicality and operational feasibility of allocation schemes [
15].
In terms of uncertainty characterization and risk assessment, the research paradigm has gradually shifted from seeking a single deterministic optimum to emphasizing scenario-based simulation, distributional performance outputs, and explicit quantification of tail risk. Yang et al. proposed a Monte Carlo sampling-based framework for agricultural water management, where repeated scenario solving yields empirical performance distributions that probabilistically quantify solution stability and tail risk, providing a reusable template for reliability assessment under highly variable conditions in irrigation districts [
16]. From a broader systems perspective, Yang et al. developed a two-stage multi-objective decision making approach within an agriculture–water–energy–food nexus framework, in which a Pareto optimal solution set is first generated and subsequently screened through integrated evaluation to support decision making; this approach offers methodological insights for planning and regulation under more complex objectives and constraints [
17]. Overall, existing evidence suggests that uncertainty-aware analytical methods are indispensable for rigorous risk evaluation and robust decision support in agricultural water management [
18].
In recent years, research on water-saving irrigation technologies has continued to advance. Pérez-Blanco and Hrast Essenfelder reviewed the adoption of high efficiency irrigation practices, including drip and sprinkler systems, and reported that these technologies can substantially improve water use efficiency without compromising crop yields [
19]. Focusing on China, Yang et al. synthesized available evidence and showed that drip irrigation often reduces irrigation inputs without yield penalties and, in many cases, increases yields across multiple crop types [
20]. Earlier work by Deng et al. similarly indicated that diffusion of sprinkler and drip irrigation can significantly enhance water use efficiency, particularly in water-scarce regions [
21]. More recently, Jing et al. proposed water-saving irrigation management strategies tailored to contrasting climatic conditions and discussed the regional applicability of sprinkler and drip irrigation [
22]. Emerging evidence further suggests that precision irrigation can simultaneously increase water productivity and reduce irrigation-related carbon emissions by improving water and energy management efficiency in irrigated systems [
23]. Overall, water-saving irrigation constitutes a key technological pathway for optimizing agricultural water use. This is especially important in arid and semi-arid provinces such as Shanxi, where improving irrigation efficiency is essential for alleviating agricultural water supply–demand imbalances and safeguarding both food security and ecological integrity.
To address these challenges, this study proposes an uncertainty-aware optimization and dynamic regulation framework for agricultural water allocation (UODRA). The framework represents multi-source uncertainties probabilistically and improves allocation schemes dynamically by integrating Dinkelbach fractional programming with Monte Carlo simulation [
24,
25]. In the present case study, Monte Carlo sampling is conducted in a reduced scenario space, restricted to (i) the upper bound of available water supply and (ii) an aggregated irrigation efficiency parameter (reported in
Section 2.3); other uncertainty sources are reported for transparency and future extension but are not sampled and are treated as fixed due to data availability and scenario design. The Dinkelbach method is computationally efficient and straightforward to implement, and it has been widely applied to ratio-type objectives, such as benefit–cost ratios and yield per unit water consumption. By preserving the physical interpretability of fractional objectives, it transforms the original fractional problem into a sequence of tractable linear or convex subproblems. Through this integration, UODRA not only identifies efficiency-improving solutions but also quantifies performance variability across hydrological conditions, thereby balancing modeling fidelity with operational applicability for irrigation district water allocation under climate change and increasing hydrological variability. In this study, dynamic regulation refers to the ability to update irrigation plans and allocation proportions over time in response to evolving climatic conditions and management time scales, enabling flexible and adaptive water management. This feature relaxes static assumptions commonly adopted in conventional irrigation models and helps sustain robust performance under both long-term trends and short-term disturbances. Recent studies further suggest that explicitly accounting for irrigation return flow and uncertainty can enhance the realism and robustness of irrigation water allocation models [
26].
In this paper, dynamic regulation refers to an information-updating and re-optimization mechanism across successive management periods, whereby irrigation plans and allocation ratios are revised as climatic and operational information is updated. The proposed framework can be implemented in a rolling-horizon manner in practice, with periodic re-optimization as new information becomes available. In the case study, we perform scenario-based re-optimization under three supply levels (S60/S80/S100) and use Monte Carlo sampling to characterize distributional performance and tail-risk behavior. This case study is intended to illustrate how the framework supports adaptive updating under uncertainty.
2. Data and Materials
2.1. Study Area
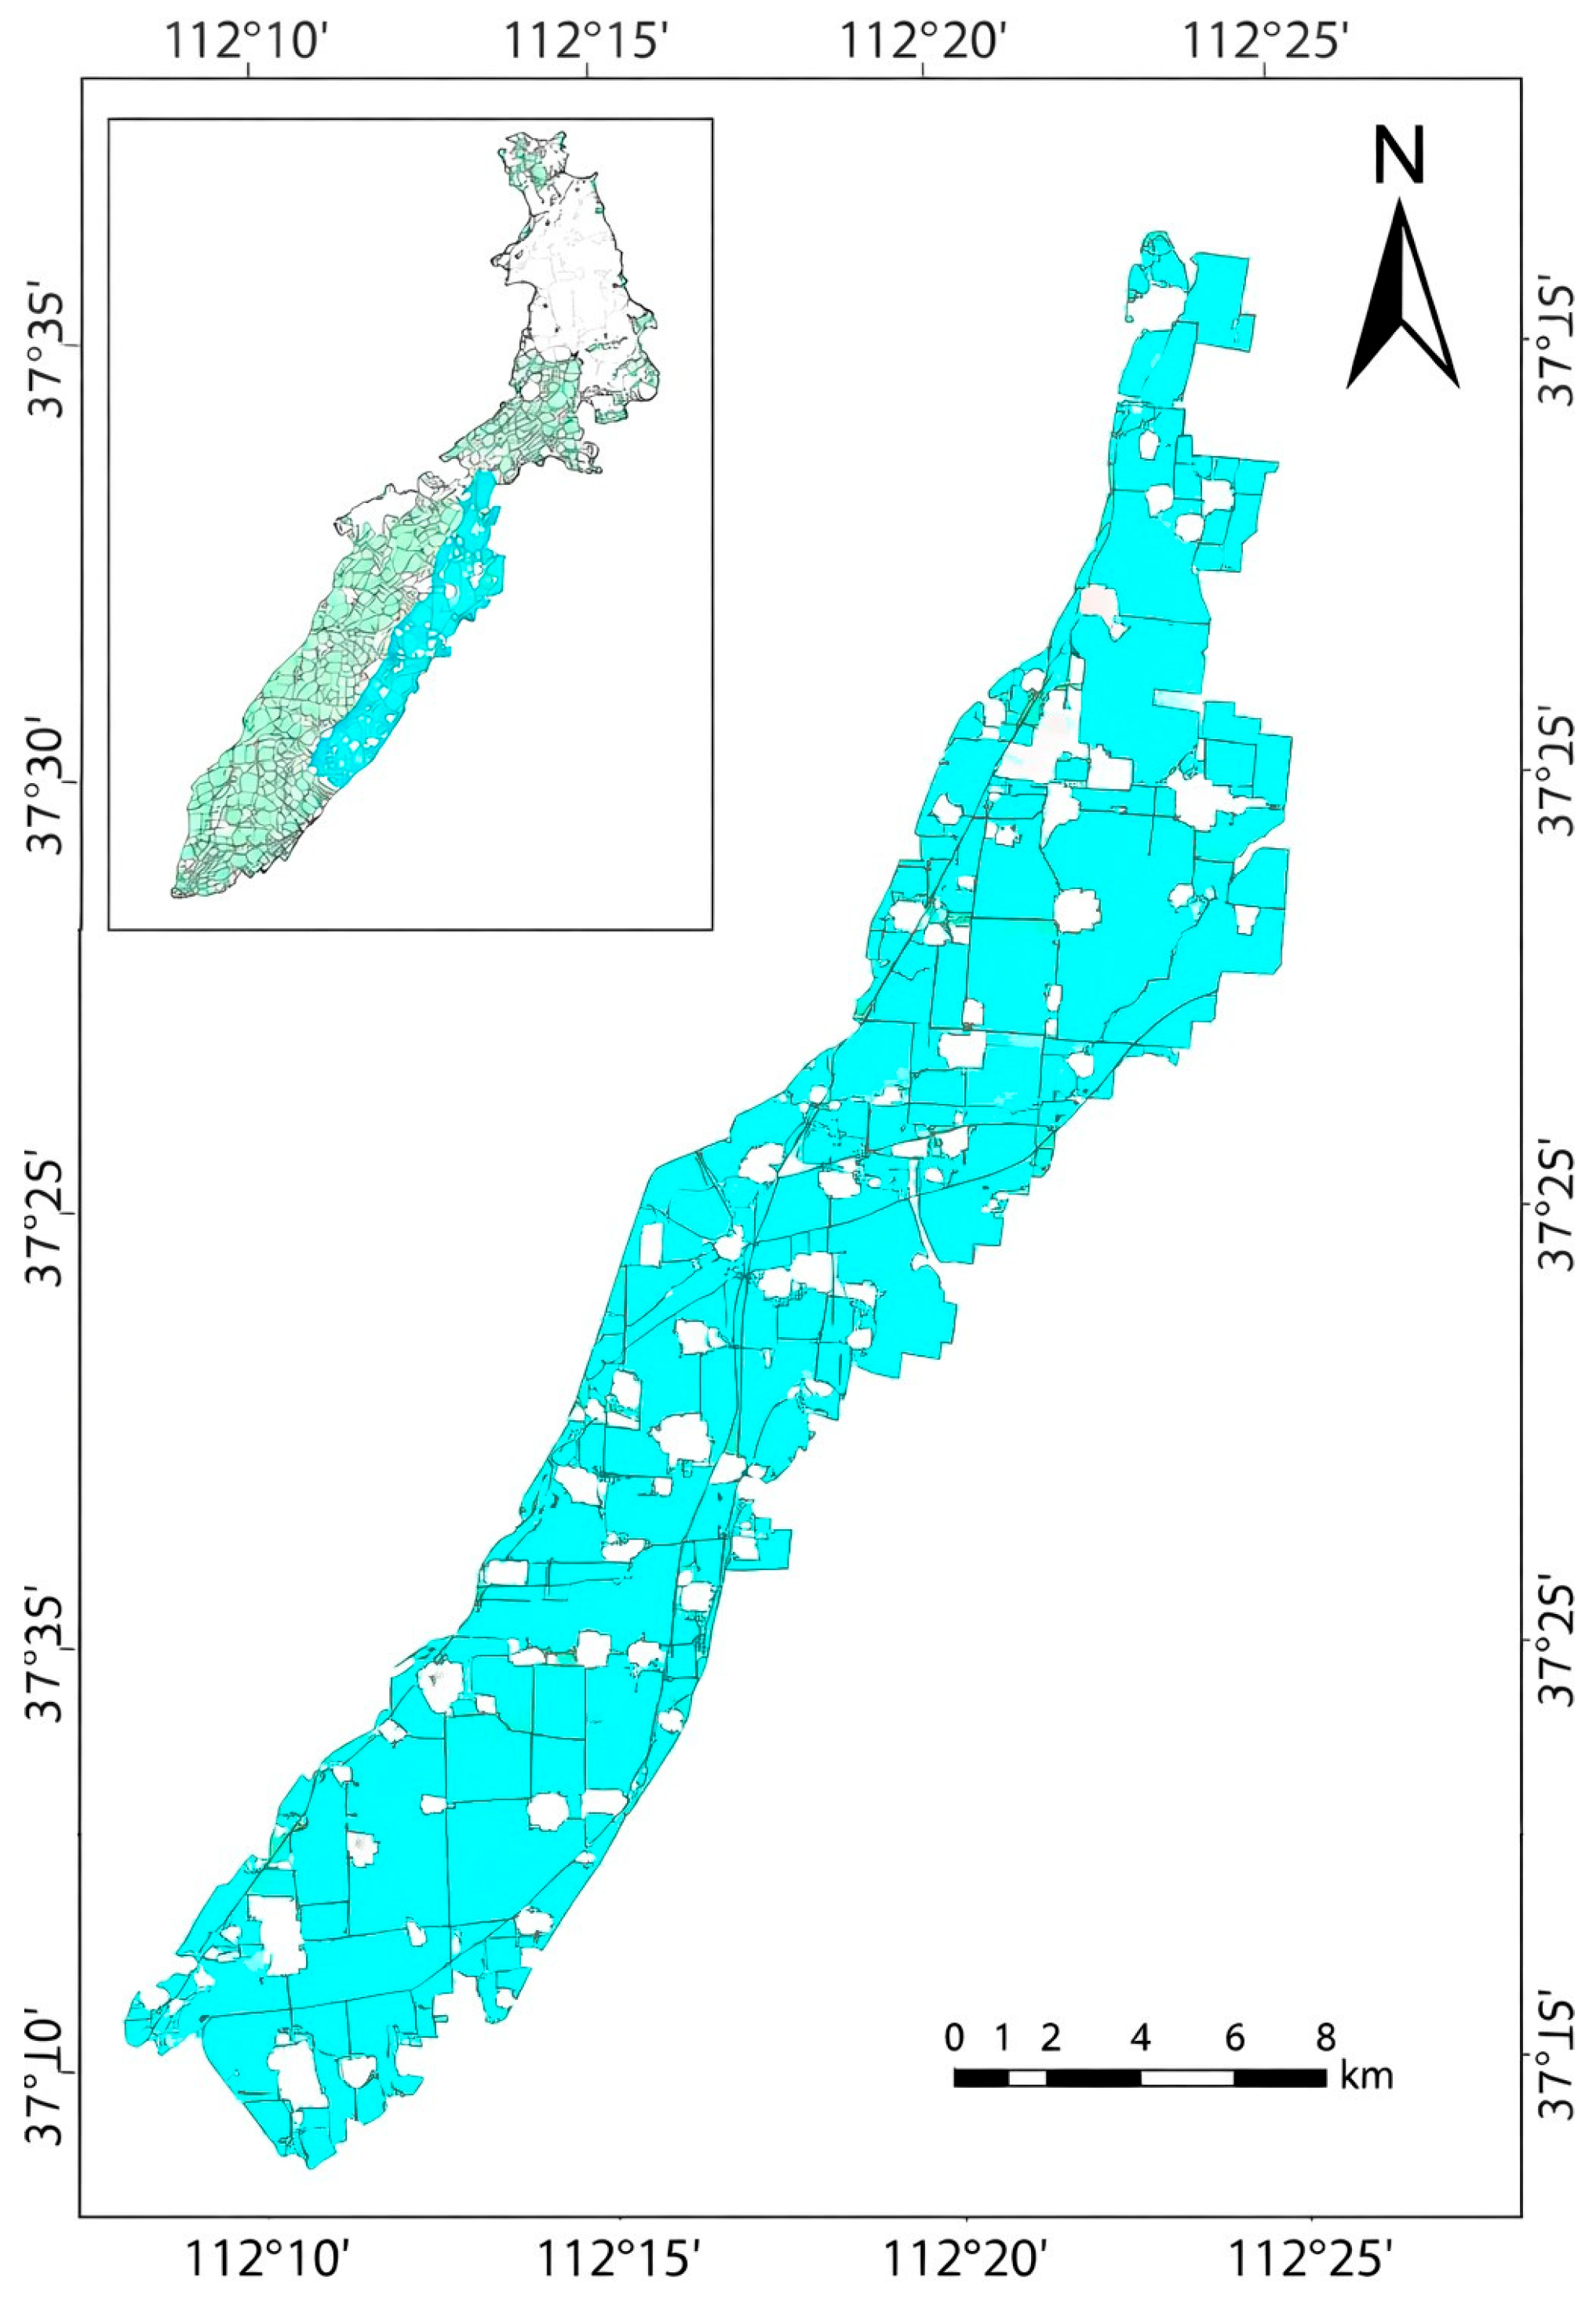
The Fendong Irrigation District in Qi County, Shanxi Province, China, was selected, as shown in
Figure 1. Situated in the Fen River Basin, it is one of the major agricultural irrigation districts in Shanxi Province [
27]. The irrigation system spans multiple counties and supports a large irrigated area, primarily providing water for major crops (corn and pear). Despite its agricultural significance, the district has long faced persistent water scarcity and recurrent drought and flood hazards. Under climate change, the imbalance between water supply and irrigation demand has become increasingly evident. Irrigation water is mainly diverted from the Fen River and its tributaries, making the efficient utilization and optimal allocation of available water resources essential for sustainable agricultural development in the region. Accordingly, developing and evaluating improved water allocation strategies for the Fendong Irrigation District is of both theoretical and practical importance.
2.2. Data Sources
Meteorological data were collected from the China Meteorological Data Service Center, a national open-access platform providing free daily records of key variables, including air temperature, precipitation, relative humidity, and wind speed. Daily observations for 2021–2024 were used as the primary dataset for the study period. In addition, long-term statistics for 1980–2020 were used to compute multi-year means and variances to assess the representativeness and stability of the short-term sample.
Soil data were obtained from the Chinese Soil Database, a publicly available dataset that provides nationwide information on soil types, texture, field water-holding capacity, saturated hydraulic conductivity, and other fundamental attributes at a 1 km spatial resolution. Hydrological data were compiled from national and local hydrological information platforms, including records of river discharge, groundwater levels, and regional water supply volumes, which were used to characterize hydrological supply–demand conditions in the study area.
The datasets used in this study include both publicly available data and data obtained under confidentiality agreements. Public data sources are cited in the manuscript. The remaining datasets cannot be publicly disclosed due to the terms of access, but can be requested from the corresponding author subject to confidentiality constraints.
2.3. Data Preprocessing
To improve transparency and reproducibility, we summarize the key ranges of the processed inputs used in the model. Specifically, (FAO-56 Penman–Monteith) has a mean of 25.75 mm/month and a 95th percentile of 55.88 mm/month, while has a mean of 19.32 mm/month and a 95th percentile of 61.28 mm/month. The irrigation technology efficiency parameter averages 0.741, with the 5th–95th percentile range spanning 0.63–0.90.
To ensure the accuracy and internal consistency of model inputs, systematic preprocessing and quality control were applied to all raw datasets. First, completeness screening and outlier detection were performed for the meteorological, hydrological, and soil records. Outliers were identified and removed using the Z-score method
[
28] and missing values were imputed using linear interpolation [
29]. Subsequently, multi-source datasets were aggregated to a monthly time scale to reduce high-frequency noise and enhance temporal comparability. In addition, spatial resampling and coordinate correction were conducted to standardize all gridded layers to a 1 km × 1 km resolution, thereby ensuring spatial consistency across datasets. Spatial registration and clipping were implemented in the ArcGIS (version 10.8) environment to preserve the positional accuracy of model inputs.
During the statistical modeling stage, probability distribution fitting and parameter estimation were performed to characterize uncertainties in key input variables. Based on the Shapiro–Wilk normality test, precipitation and evaporation were found to be consistent with a normal distribution
[
30], with parameters estimated from long-term historical records. Available water supply passed the Kolmogorov–Smirnov test and was therefore modeled using a lognormal distribution
[
31]. Using interval estimation, the soil infiltration coefficient and field water-holding capacity were assumed to follow a uniform distribution
[
32]. Owing to the limited sample size, the canal conveyance loss coefficient was represented by a triangular distribution
[
33] to capture its asymmetric variability.
In this study, the processed irrigation technology efficiency parameter is used as an aggregated conveyance-and-application efficiency input for the case study; the Monte Carlo analysis perturbs this parameter together with the water supply upper bound, while other fitted uncertainties are documented for transparency and future extension.
3. Materials and Methods
This study aims to optimize irrigation water allocation under uncertainty by developing an integrated modeling framework that links data preprocessing, uncertainty simulation, and fractional programming-based optimization. Baseline irrigation district datasets were imported and processed in Python (version 3.7), including crop types for representative fields, daily crop evapotranspiration, irrigation efficiency parameters by irrigation method, and physical parameters of the conveyance system. Daily water requirements were aggregated to a monthly scale using the number of days per month to obtain monthly crop water demand, and field-level net irrigation requirements were then computed accordingly. The canal conveyance loss coefficient was estimated from the canal length and the permeability index of canal-bed soils and combined with the field irrigation method efficiency to derive the composite irrigation water utilization coefficient under engineering conditions.
Reference evapotranspiration () was computed using the FAO-56 Penman–Monteith method, and crop evapotranspiration was estimated as . Crop coefficients () were taken from the FAO-56 tables and mapped to local conditions using the crop calendar and growth stage progression; when local observations were unavailable, FAO-56-recommended parameters were used.
A fractional programming model was subsequently formulated to maximize the effective utilization coefficient of irrigation water. The model was solved using the Dinkelbach iterative algorithm, which converts the ratio-type objective into a sequence of parameterized linear subproblems and updates the associated parameter until convergence, thereby enabling efficient treatment of the nonlinear fractional structure.
To represent stochastic fluctuations in water supply conditions and engineering operational status, random perturbations were imposed on (i) the upper bound of available water supply and (ii) irrigation efficiency. These uncertainties were modeled using a lognormal distribution for available water supply and a truncated normal distribution for irrigation efficiency. Monte Carlo sampling was then applied to generate a large ensemble of uncertain realizations under three hydrological scenarios (S60, S80, and S100). The optimization model was solved for each realization to compute , and the resulting samples were used to estimate the empirical probability distribution of .
Computational implementation and reproducibility: The model was implemented in Python. For each Monte Carlo realization, the fractional objective was solved using the Dinkelbach method, where the inner subproblem is evaluated via a greedy water allocation rule under the water supply and upper-bound constraints. In the case study, 1000 stochastic realizations were generated for each supply scenario (S60/S80/S100) using a fixed random seed for reproducibility. The Dinkelbach stopping tolerance was set to 1 × 10⁻⁴, with a maximum of 100 iterations. All key modeling assumptions, uncertainty distributions, and parameter bounds are described in the main text. No commercial MILP solver is required in this implementation, because the inner subproblem is computed using the greedy allocation rule. Overall computational effort scales approximately linearly with the number of realizations, which facilitates extension to larger-scale scenario analyses.
Here, S60, S80, and S100 represent typical supply scenarios corresponding to 60%, 80%, and 100% of the baseline available water, respectively. They approximate dry, moderately dry, and normal hydrological years and are used to capture differences in district-level water constraints across hydrological conditions.
3.1. Methodological Framework
This study classifies uncertainty into four categories: climatic, economic, soil-related, and conveyance loss-related uncertainty. Climatic variables (precipitation and evaporation) were fitted with normal distributions based on long-term historical records. Available water supply was represented by a lognormal distribution. The soil infiltration coefficient was modeled using a uniform distribution defined over an interval. Owing to limited samples, the seepage index during water conveyance was assumed to follow a triangular distribution to characterize uncertainty in canal conveyance losses; the triangular distribution can capture physically plausible asymmetric variation using only a small number of parameters.
Based on the above uncertainty characterization, the uncertainty input vector is defined as
, where E denotes climate-related uncertain inputs, S denotes the available water supply condition (implemented as a stochastic perturbation on the supply upper bound), C denotes economic parameters in the economic component of the model, including the objective function and the water demand function,
denotes conveyance loss-related uncertain parameters (seepage index), and s denotes soil-related uncertain parameters (infiltration coefficient). In the case study implementation, the Monte Carlo procedure explicitly perturbs the supply upper bound S and an aggregated conveyance-and-application efficiency parameter (reported in
Section 2.3 as the irrigation technology efficiency parameter), which serves as the composite irrigation water use efficiency capturing both conveyance and on-field application performance. Other parameters (including the economic parameters C) are treated as deterministic, consistent with the available data and the scenario design. Irrigation demand is reported as an endogenous output from each re-optimized solution.
Monte Carlo sampling was performed in a reduced scenario space, restricted to the perturbed components considered in this case study (the supply upper bound S and the aggregated irrigation efficiency parameter). Multiple input realizations were generated and substituted into the objective function and constraint system for re-optimization. This procedure enables characterization of the distributional properties of irrigation water use efficiency and assessment of its sensitivity to the dominant uncertainty drivers considered in this case study.
3.1.1. Objectives
This study takes the effective utilization coefficient of irrigation water, denoted by
, as the optimization objective. Multiple sources of uncertainty—including climate variability, soil heterogeneity, water price fluctuations, and canal conveyance losses—are explicitly considered. The effective utilization coefficient of irrigation water is calculated using the head–tail method. It is defined as
=
, where
is the total diversion at the headworks (canal intake) and
is the net irrigation water effectively reaching the crop root zone after conveyance and field application losses. Thus,
represents system-level composite efficiency (conveyance plus on-farm application). Symbols and units are provided in Abbreviations.
The net irrigation quota
is calculated as follows:
is calculated as follows:
Effective precipitation was estimated using an empirical formula [
34]. When precipitation is low, the effective precipitation ratio increases with increasing rainfall; when precipitation is high, the utilization ratio tends to stabilize because surface runoff losses increase. The formula is given as follows:
Considering the influence of economic factors on irrigation demand, the relationship between the average irrigation quota and water price as well as annual precipitation can be expressed as follows [
35]:
3.1.2. Constraints
- I
Water supply constraint
This constraint ensures that the total water withdrawal for all irrigation zones does not exceed the upper limit of available water supply.
- II
Demand–deficit balance constraint
Equation (10) is formulated in volumetric units (m3). The net irrigation requirement is converted from depth to volume by multiplying the irrigation depth by the irrigated area . For a selected irrigation method k (through ), the term () represents the gross–net difference, which corresponds to the additional water volume required to compensate for conveyance and field application losses under efficiency . The right-hand side computes the conveyance loss volume using the explicit loss function and aggregates it over management periods t. Therefore, Equation (10) serves as a loss-accounting (consistency) constraint: losses are incorporated via the gross–net conversion term and are not treated as an independent deficit quantity. Enforcing equality prevents double-counting of losses across constraints and maintains dimensional consistency. Aggregation over indices (crop i, zone j, method k, and period t) follows the same summation convention as in Equations (8)–(12).
When precipitation is insufficient and evapotranspiration is high, net irrigation water must compensate for the shortfall to avoid crop water stress. This constraint prioritizes meeting the minimum water requirement for crop growth, thereby ensuring that food production is not compromised.
We define as a binary selection variable indicating whether irrigation method k is chosen for crop i in zone j. Thus, , and for each crop and zone, exactly one method is selected ().
- III
Irrigation method selection constraint
For each crop–zone combination, only one irrigation method (e.g., drip or sprinkler irrigation) can be selected within a given period. This constraint prevents unrealistic cases in which multiple irrigation methods are simultaneously applied to the same field, ensures the operational feasibility of the optimization, and enables the model to choose the most effective option among available irrigation technologies.
- IV
Non-negativity constraint
All water allocation quantities and decision variables are constrained to be non-negative to ensure the physical feasibility and interpretability of the results.
3.2. Solution Method
To solve the fractional objective efficiently, the Dinkelbach iterative method is adopted, which is specifically designed for optimization problems with ratio-type objective functions. By iteratively updating the optimal value of the ratio, the method progressively improves the objective until the convergence criterion is satisfied [
36]. This approach transforms the original nonlinear fractional objective into a sequence of linear subproblems, thereby substantially simplifying the solution procedure.
During model solution, the objective function is first reformulated into a linear form. This linearization enables the problem to be solved using standard linear programming techniques, thereby avoiding the complexity of directly handling a nonlinear formulation. At each iteration, the optimal value associated with the current solution is computed and used to update the objective ratio, ensuring that the algorithm progressively approaches the global optimum. Owing to its high computational efficiency and fast convergence, this method is well suited for complex uncertainty-aware optimization problems.
The original fractional objective is transformed into the following sequence (parametric form):
where
is updated at each iteration as the ratio
obtained from the optimal solution of the previous iteration, until the convergence criterion
is satisfied; here,
=
denotes the convergence tolerance.
- I
Linearization of sufficient/non-sufficient irrigation
is reformulated into two linear inequalities as follows:
- II
Piecewise-linear approximation of canal losses
Canal losses are approximated using a piecewise-linear formulation [
37,
38,
39].
A set of R discrete flow breakpoints is specified over the interval .
The approximation is then constructed as follows:
- III
Dynamic parameter treatment
To characterize the non-stationary behavior of the irrigation system under varying hydrological conditions and operational states, this study treats the upper bound of water supply and irrigation water use efficiency as scenario-dependent parameters that are updated dynamically. An optimization model is constructed independently for each simulated sample. The water supply upper bound is generated by perturbing the baseline supply according to the modeled supply uncertainty as follows:
where
corresponds to typical supply levels (S60, S80, and S100), and the perturbation factor
represents fluctuations in available water supply across different hydrological years. Meanwhile, to reflect the effects of canal seepage conditions, evaporative losses, and field management heterogeneity on irrigation efficiency, a dynamic perturbation was introduced into the utilization coefficient across samples, so that the efficiency structure in each sample remains consistent with realistic operating conditions.
To ensure that the efficiency structure of each sample is consistent with realistic operational variability, an independent set of constraints is constructed for each scenario. Accordingly, system efficiency is represented in the model in a fractional form as follows:
The scenario-specific optimization problem is solved using the Dinkelbach method over the corresponding feasible region. As water supply and composite efficiency vary across Monte Carlo realizations (and across the representative supply levels S60/S80/S100), both the feasible set and the optimal withdrawal pattern adjust accordingly. In this study, “dynamic” behavior is defined as information-driven updating and re-optimization across scenarios and Monte Carlo realizations, rather than an explicit time-sequenced rolling-horizon scheduling simulation. This differs from conventional scenario-based simulation, where predefined scenarios are evaluated independently without adaptive re-optimization of allocation decisions. Solving the model over a large ensemble of scenarios yields an empirical distribution of system efficiency, which supports quantitative comparison across hydrological conditions and provides a basis for reliability assessment and identification of policy-relevant thresholds.
- IV
Solution procedure
Dynamic parameter treatment: Independent and representative parameter inputs are generated for each scenario by applying dynamic perturbations to the water supply upper bound and irrigation efficiency.
Scenario-specific modeling: For each scenario, the optimization model is reconstructed based on its dynamic parameters so that the solution process accurately reflects the corresponding environmental state.
Iterative solution: The fractional efficiency objective is solved iteratively for each scenario using the Dinkelbach method, yielding the scenario-specific optimal efficiency and water withdrawal (allocation) scheme.
Distributional outputs: By solving a large ensemble of scenarios on a sample-by-sample basis, an empirical distribution of efficiency is obtained, providing probabilistic evidence for system performance evaluation and policy-threshold identification.
Through Monte Carlo simulation, this study not only verifies the model’s adaptability to varying water supply conditions and operational efficiency states, as well as fluctuations in water supply–demand dynamics, but also provides more reliable decision support. The results from repeated simulations demonstrate the model’s stability and efficiency under the dominant uncertainty drivers considered in this case study, thereby offering a solid theoretical basis for practical optimization of irrigation water allocation in agricultural systems.
4. Results Analysis
4.1. Overall Analysis of Model Results
To evaluate the applicability of the proposed uncertainty-aware optimization and dynamic regulation framework for agricultural water allocation (UODRA) under scenario-specific constraints and multi-source perturbations, three representative water supply scenarios (S60, S80, and S100) were selected for comparative analysis. Based on deterministic computations, stochastic perturbations were further introduced and repeatedly sampled to capture uncertainty in system inputs. System performance was quantified using the integrated system efficiency , and the results were interpreted jointly in terms of the optimized allocation structure and the associated risk of water deficit.
As shown by the deterministic results in
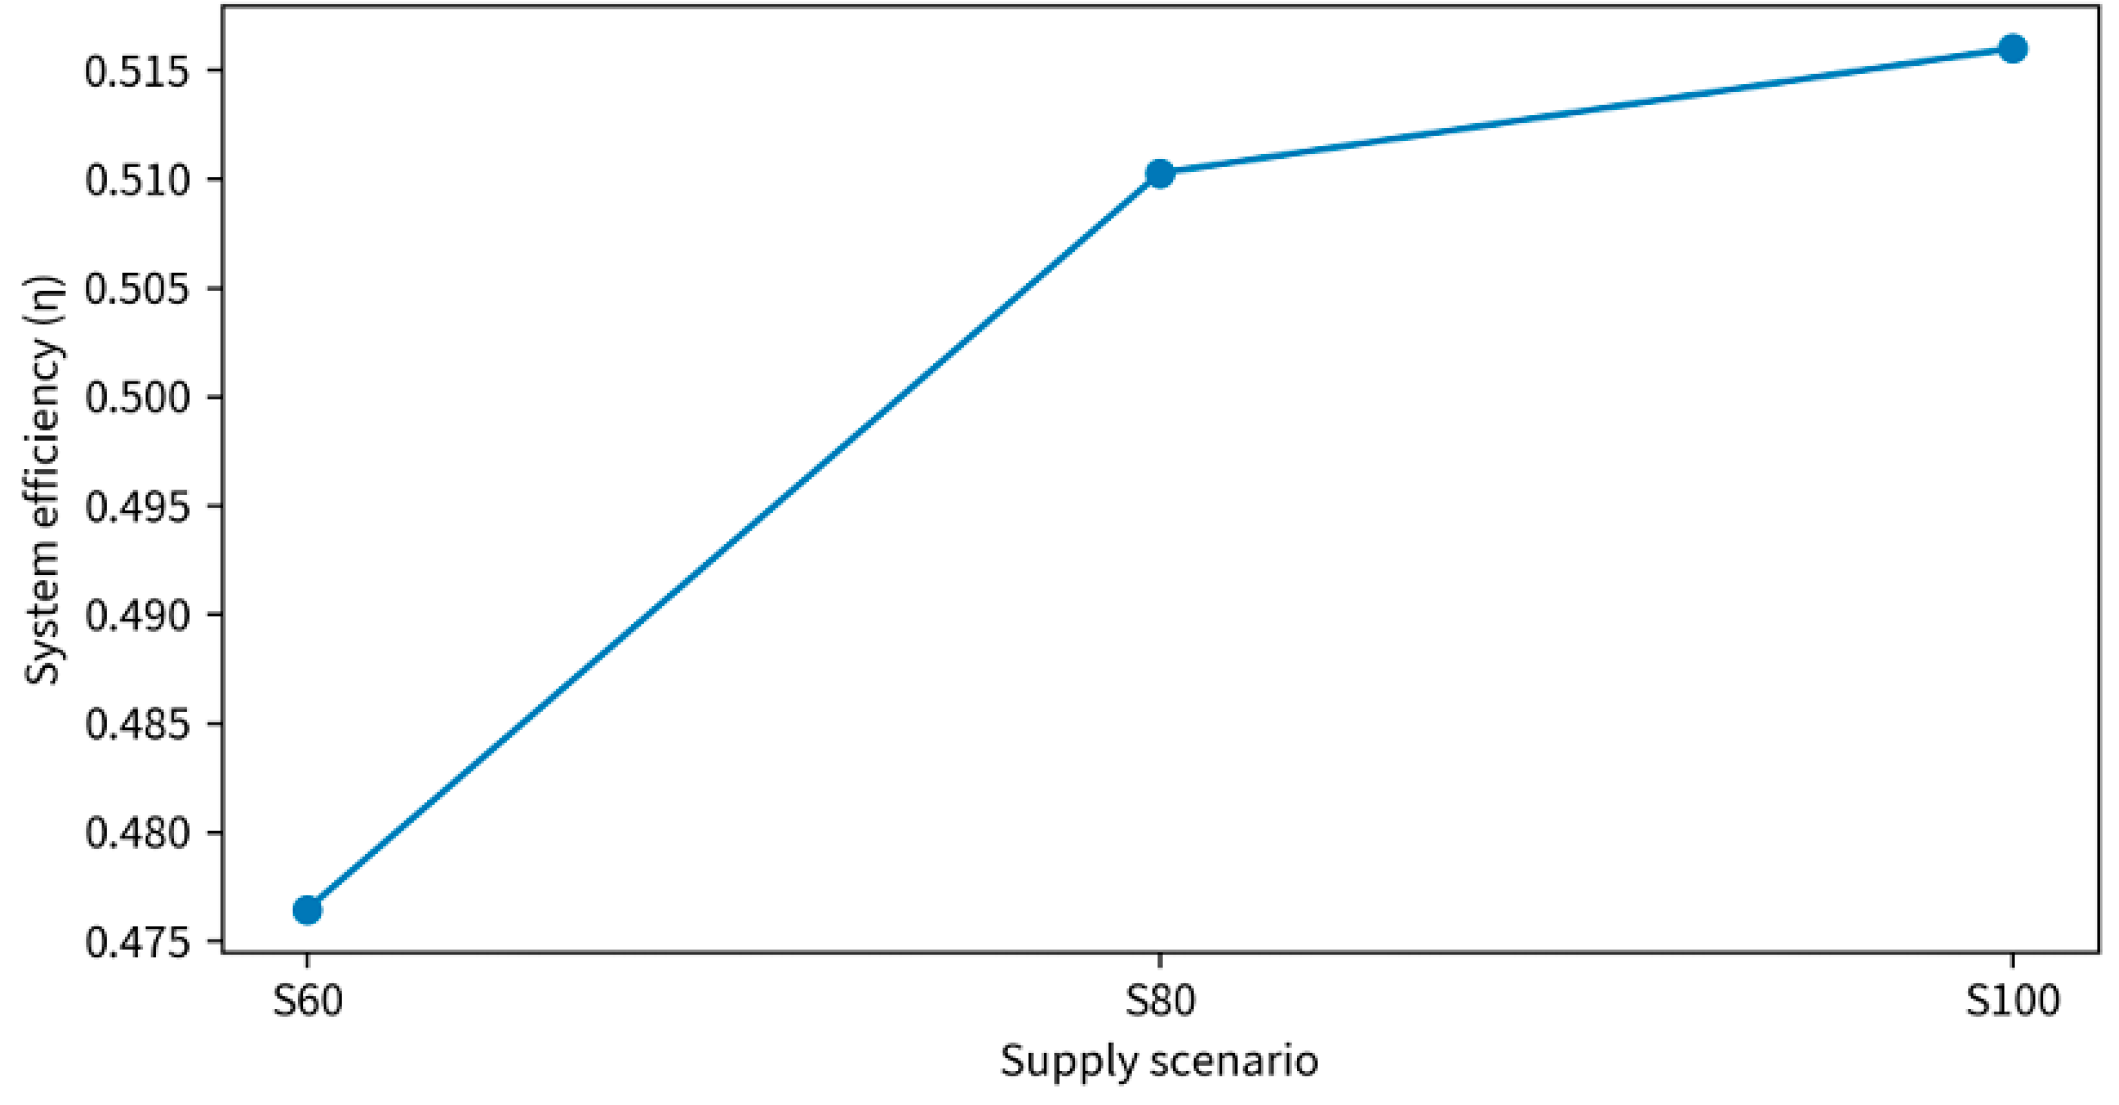
Figure 2, system efficiency differs markedly across the three scenarios:
equals 0.476, 0.510, and 0.516 under S60, S80, and S100, respectively. This indicates that overall system performance is sensitive to water supply constraints. Further comparison shows that the efficiency gain from S60 to S80 is approximately 0.034, whereas the gain from S80 to S100 is only about 0.006. Under the sample conditions and engineering settings considered in this study, efficiency improvements are therefore more pronounced under moderate supply constraints, while the marginal improvement diminishes as water availability becomes relatively sufficient. This pattern also suggests that efficiency enhancement is jointly constrained by the underlying efficiency structure of system components and the resulting water allocation structure. This modest increase suggests that, once the water supply constraint is largely relaxed, the optimal allocation has already prioritized higher-efficiency units. Additional supply is therefore directed to uses with lower marginal efficiency and to compensating conveyance and application losses, resulting in diminishing marginal gains in the ratio-based efficiency metric.
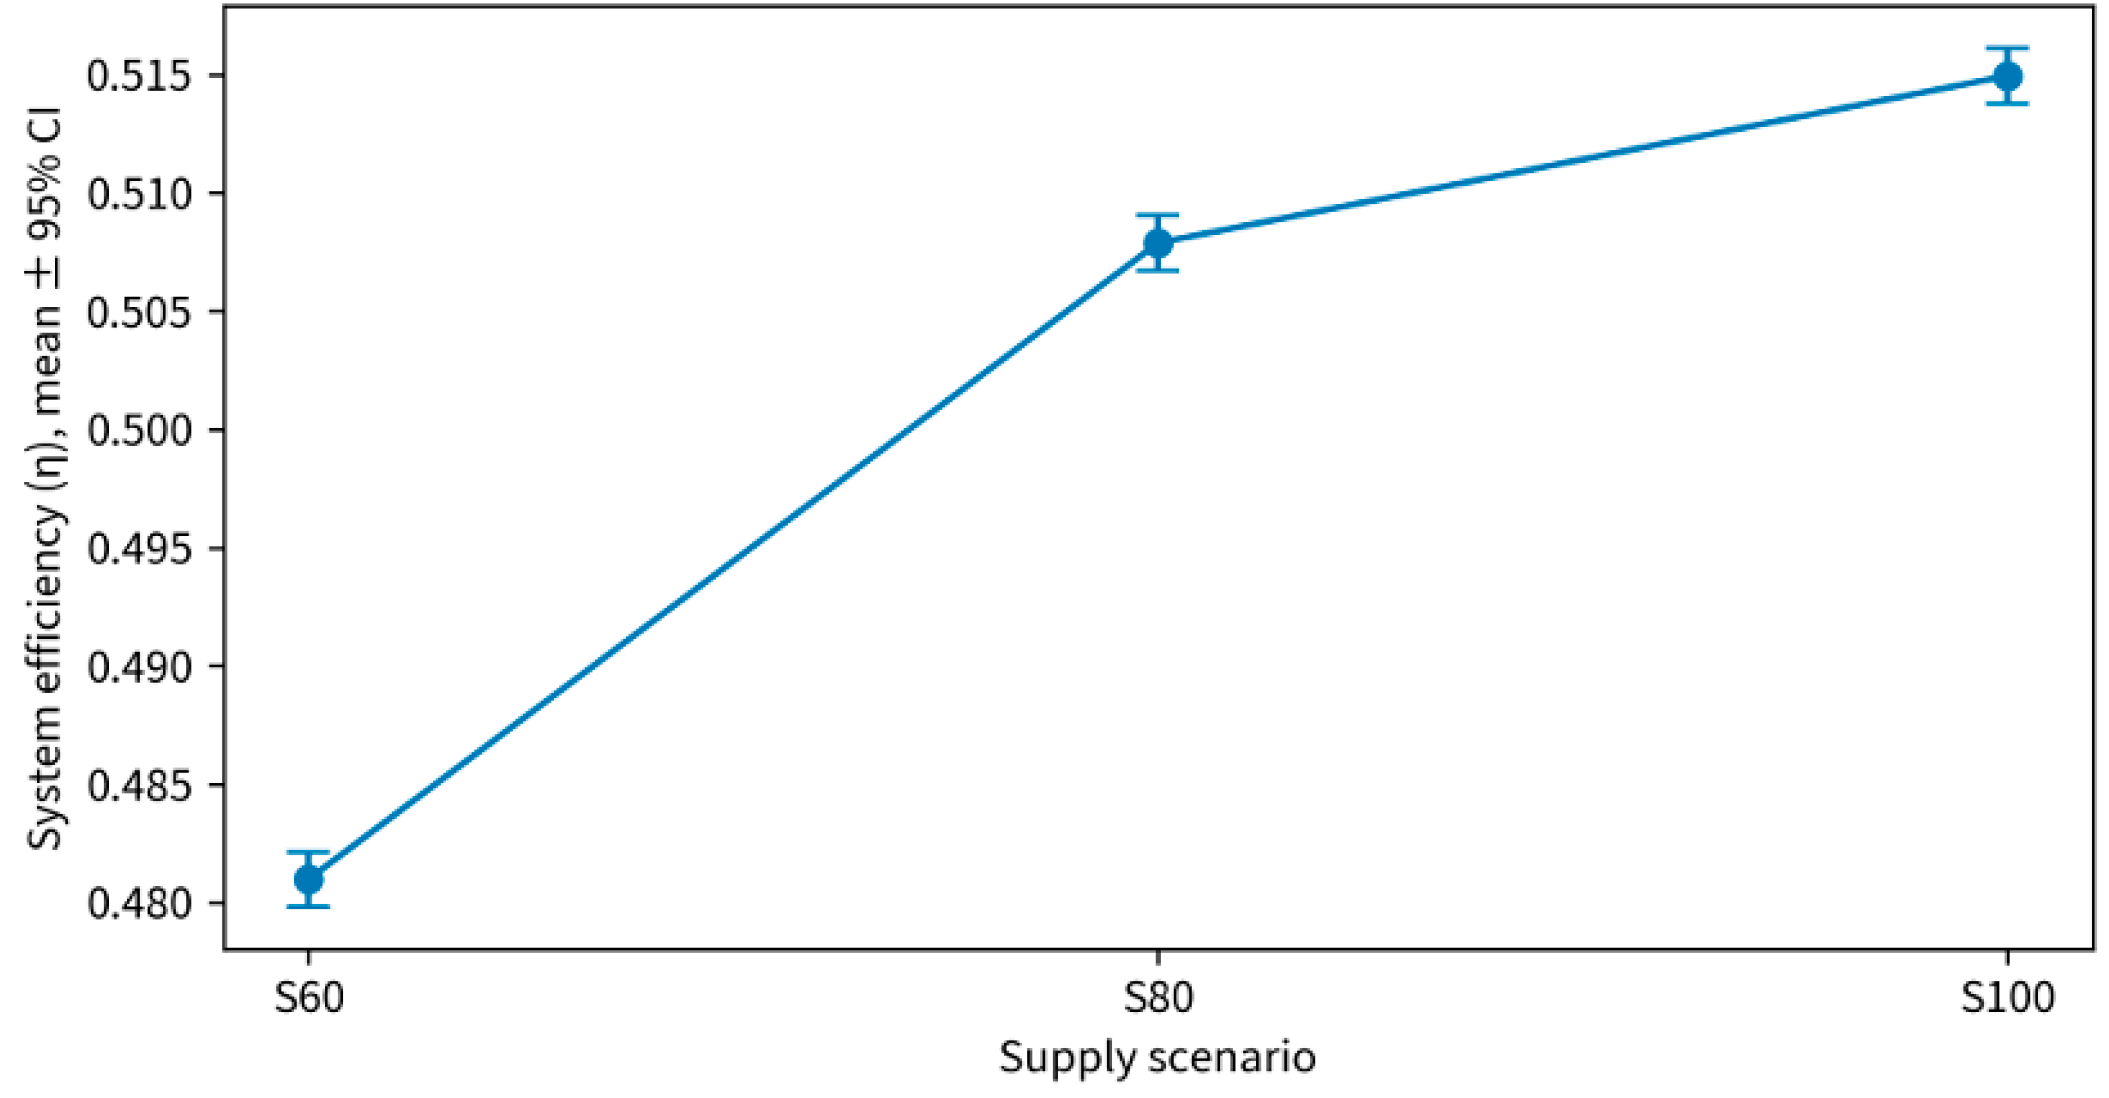
After introducing stochastic perturbations, the mean values and confidence intervals of system efficiency are presented in
Figure 3. As shown, the mean
values under S60, S80, and S100 are approximately 0.481, 0.508, and 0.515, respectively, and the confidence intervals are generally narrow, indicating that the model outputs remain stable when uncertainty is accounted for. Nevertheless, a stable mean does not necessarily imply stable performance under adverse realizations, as uncertainty may also manifest through changes in variability and tail behavior. Therefore, the subsequent analysis evaluates system efficiency from a probabilistic (distribution-based) perspective to characterize dispersion, distributional shape, and low-efficiency risk under different water supply constraints.
4.2. Comparative Analysis of the Three Water Supply Scenarios (S60/S80/S100)
Following the probabilistic evaluation presented in
Section 4.1, the efficiency distributions under S60, S80, and S100 were compared after repeated random sampling. Overall, no large-scale instability was observed in the efficiency outcomes. In terms of the distribution,
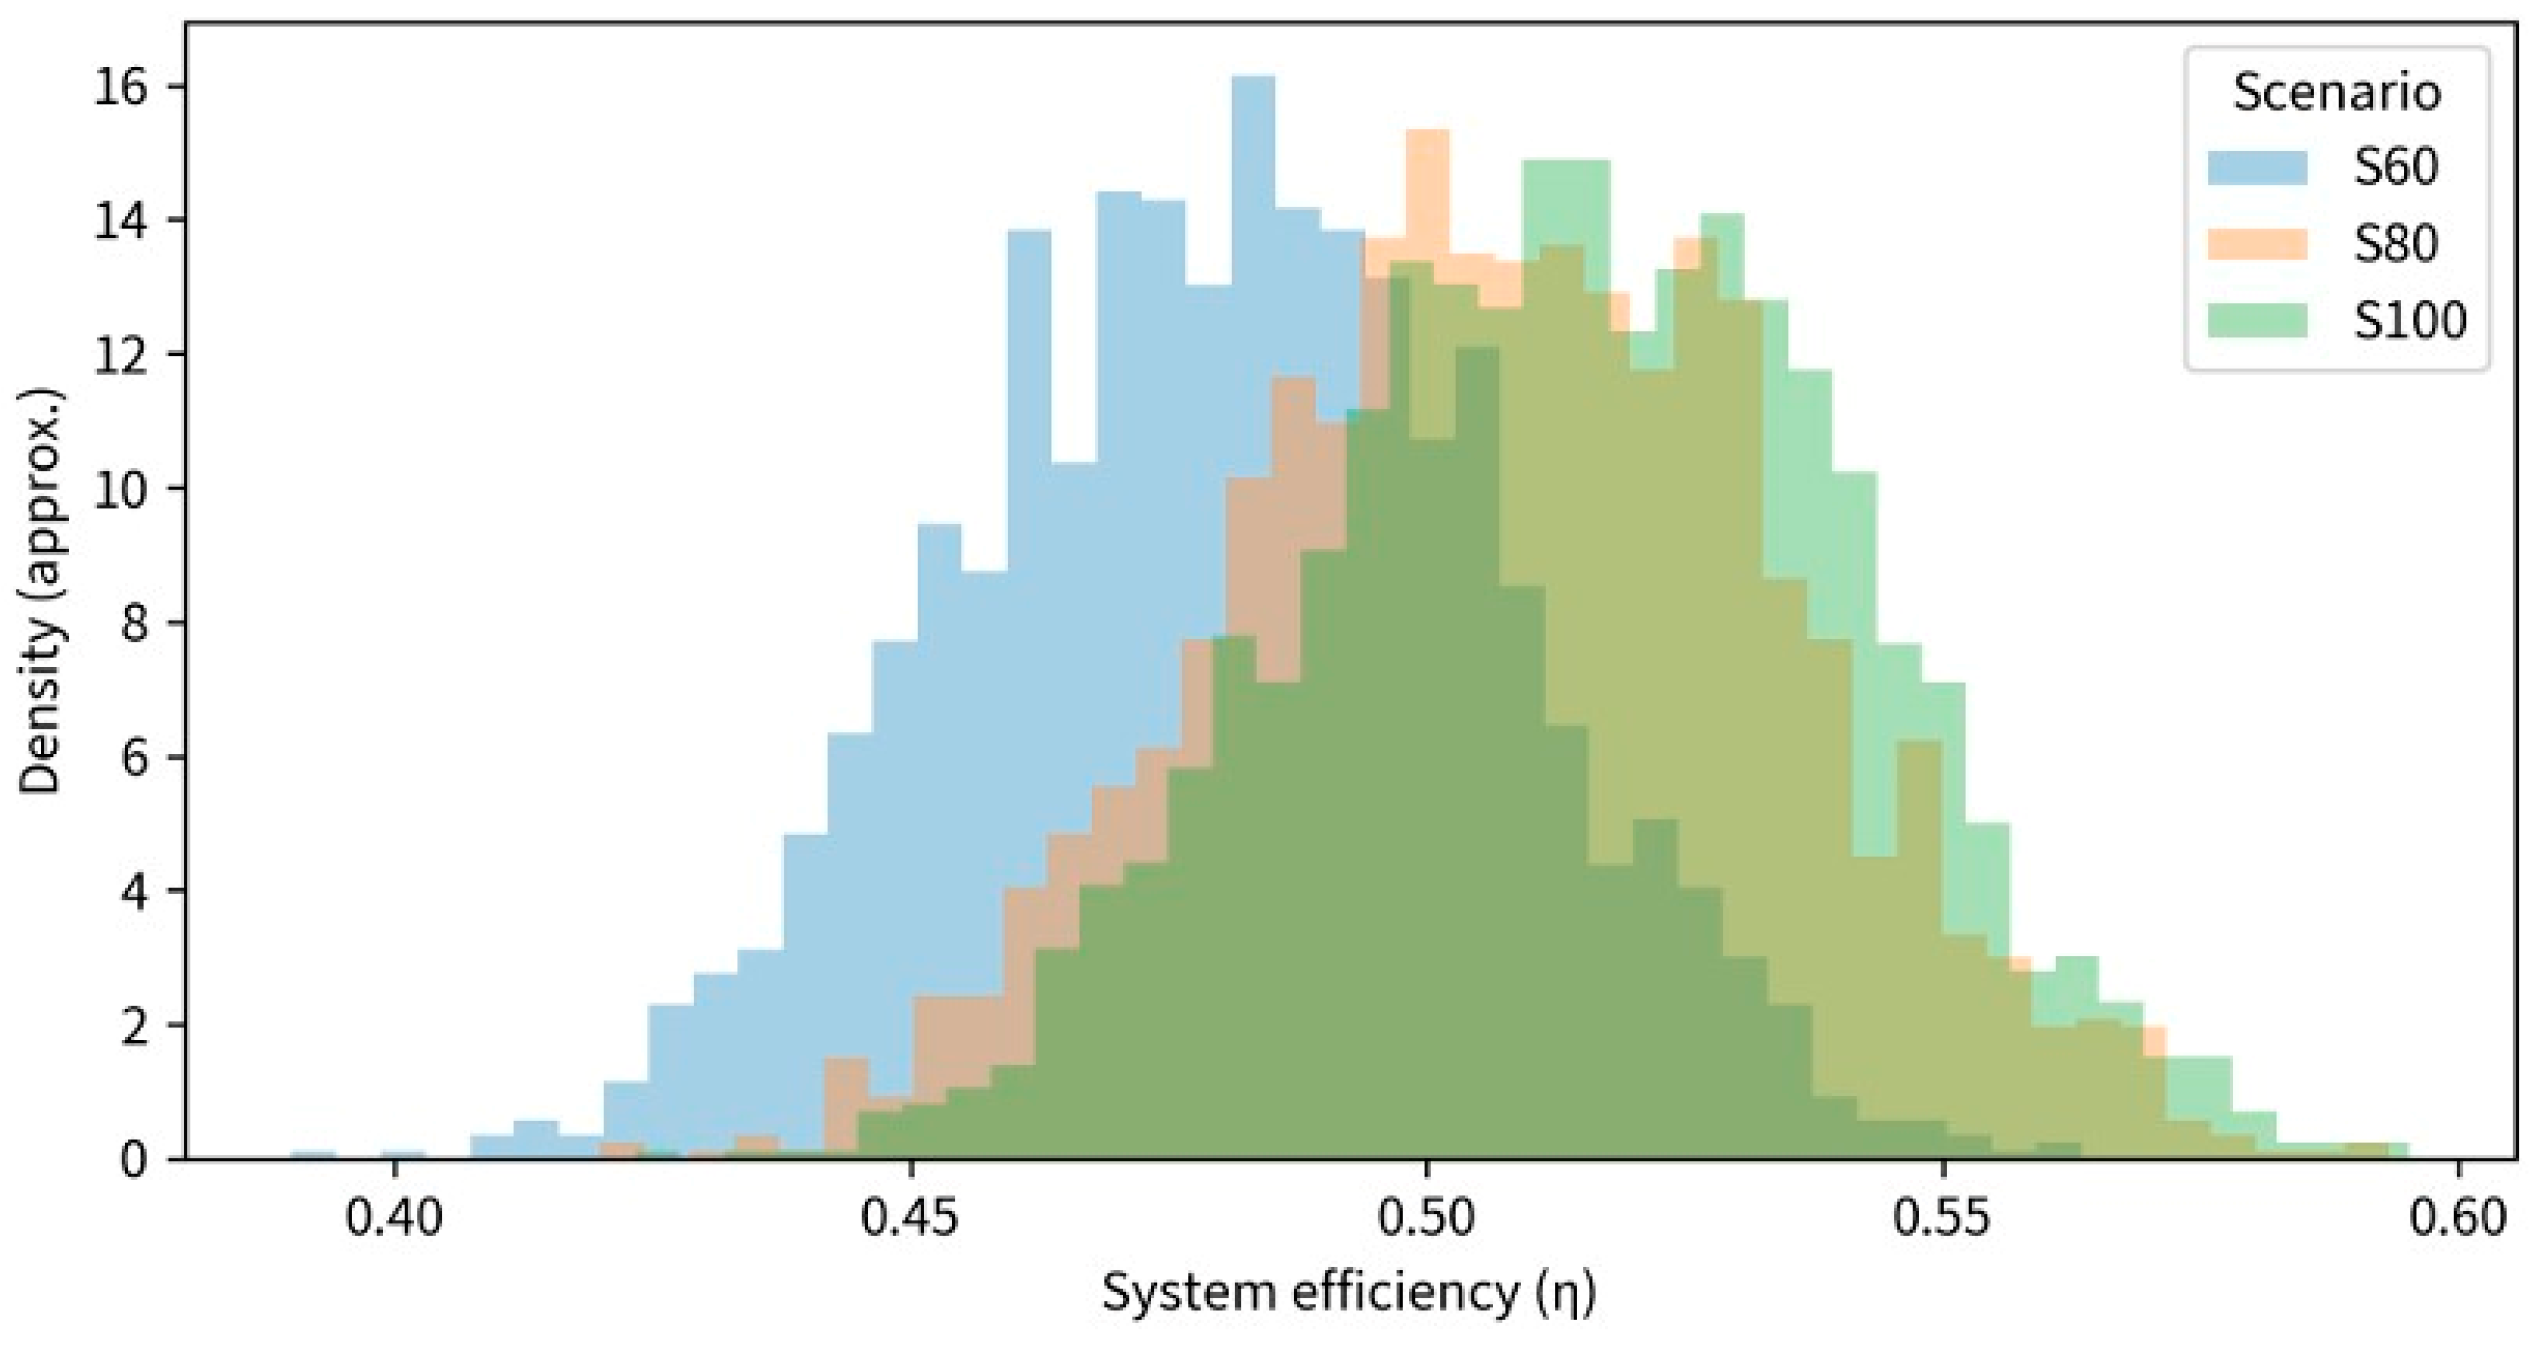
is primarily concentrated within the range of 0.45–0.55, indicating that under the current canal system configuration and irrigation technology settings, the optimized system efficiency remains generally stable and does not frequently exhibit extremely low-efficiency states due to single perturbations. These characteristics are then examined from complementary distributional perspectives in
Figure 4,
Figure 5 and
Figure 6.
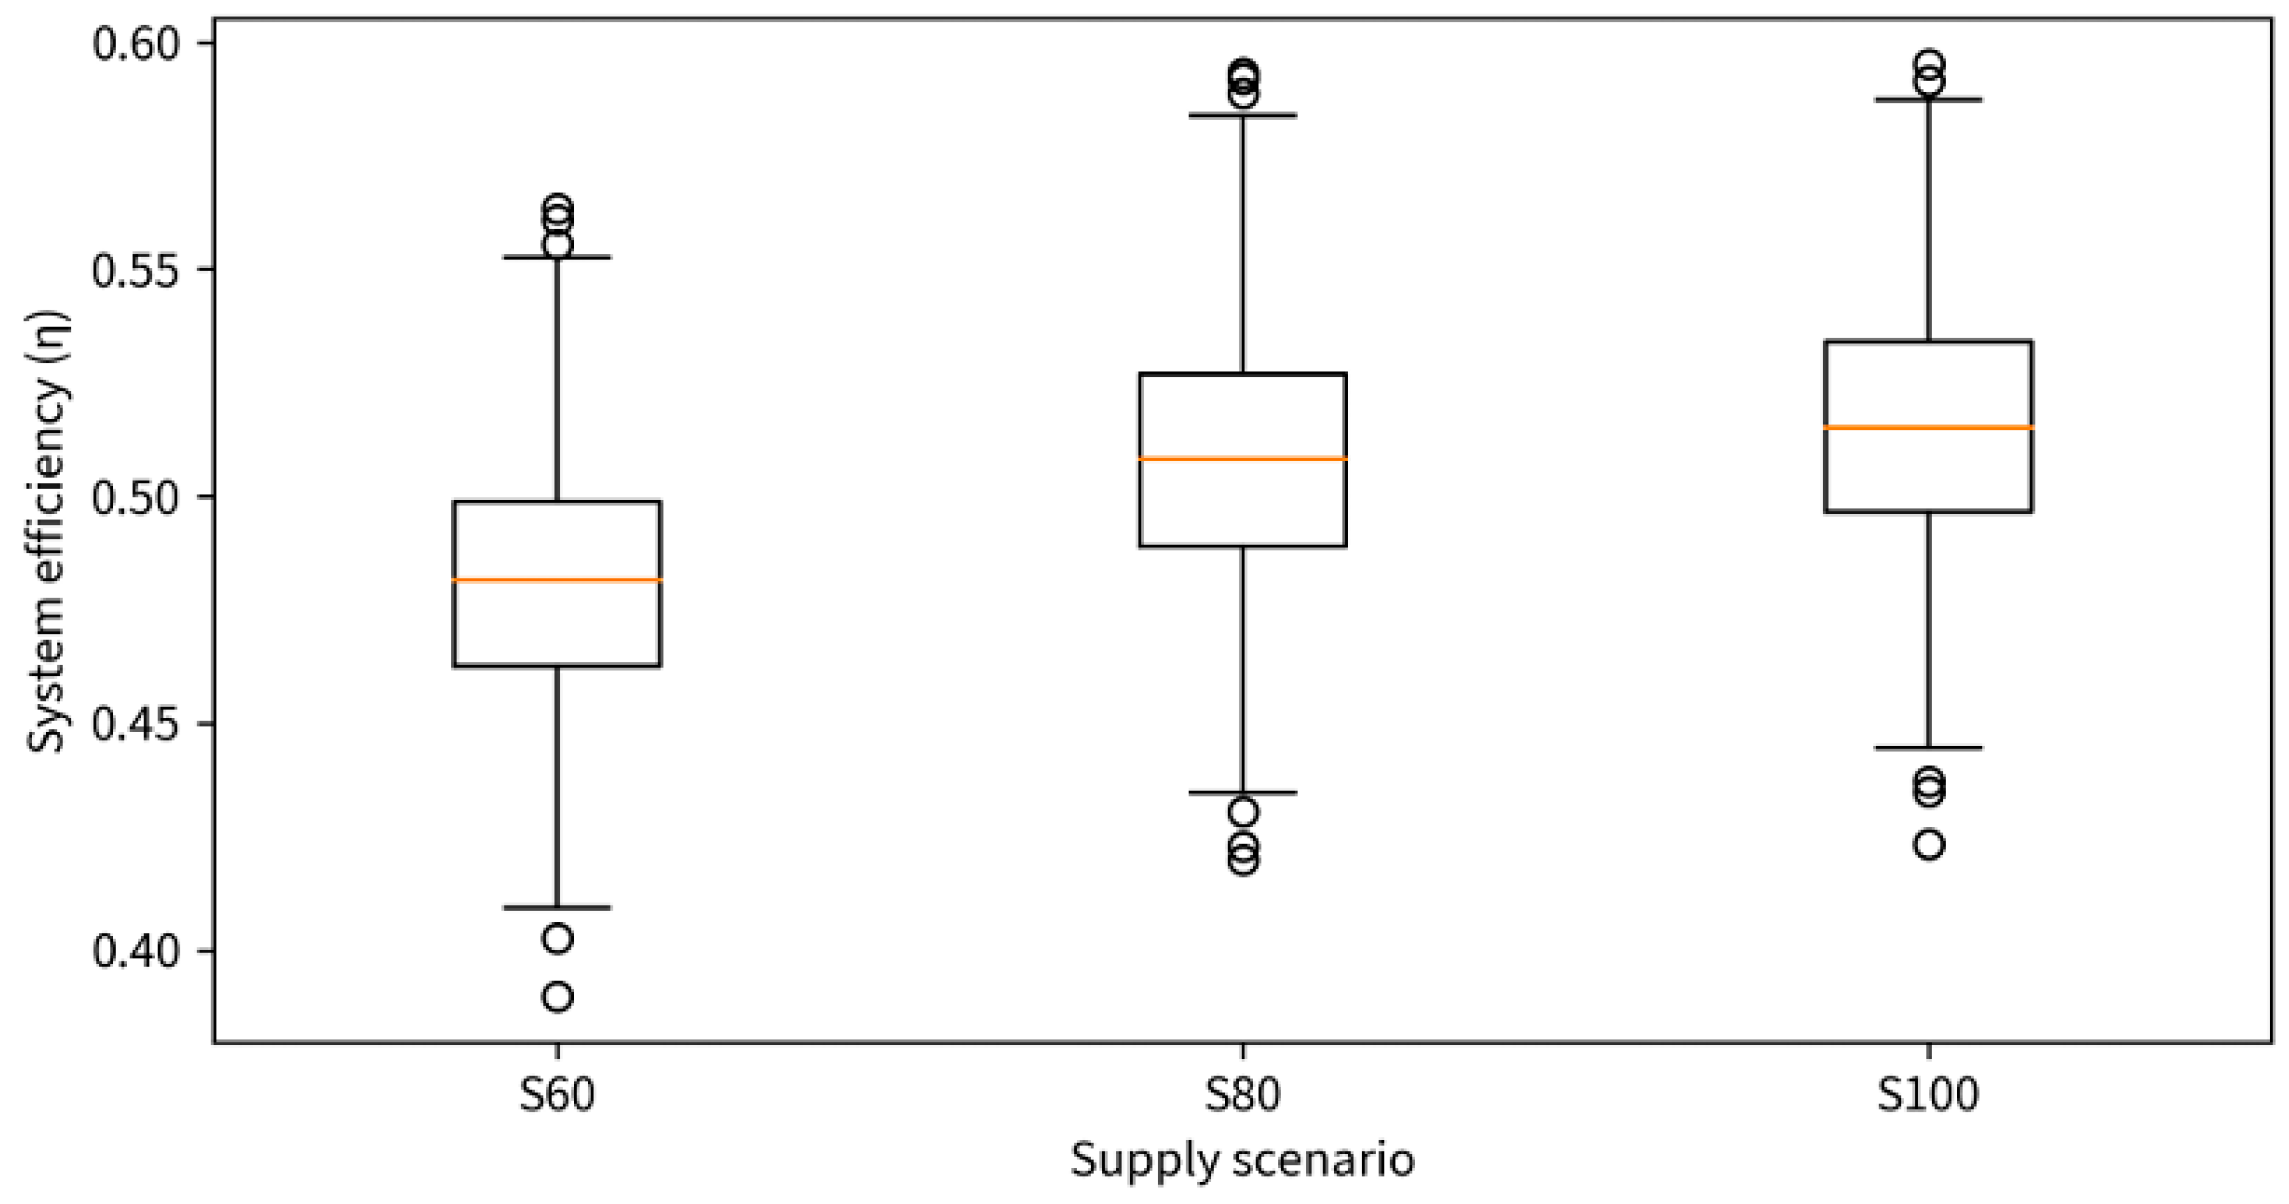
In terms of numerical summaries, the mean values under S60, S80, and S100 are approximately 0.481, 0.508, and 0.515, respectively, with standard deviations of about 0.026–0.027 (under S60, S80, and S100 scenarios, the values are approximately 0.026, 0.027, and 0.026, respectively). These results indicate that variability within each scenario is relatively limited, whereas the mean efficiency exhibits consistent differences across scenarios. Tail-risk characterization under adverse conditions further highlights scenario contrasts: the 5th percentile of under S60 is approximately 0.439, which is notably lower than that under S80 (0.462) and S100 (0.471). This suggests that under tighter water supply constraints, the system is more likely to fall into relatively low-efficiency states. Meanwhile, the 95th percentiles are approximately 0.525, 0.553, and 0.558 for S60, S80, and S100, respectively, indicating that scenario differences persist under favorable conditions; however, the cross-scenario disparity is more pronounced in the low-efficiency tail.
These differences are further examined using three complementary visual diagnostics, each emphasizing a different aspect of efficiency distribution. As shown in
Figure 4, the scenarios differ in both the median level and the whisker ranges, indicating that scenario effects are reflected not only in the mean performance but also in the variability interval.
Figure 5 shows that the efficiency distributions are generally unimodal for all scenarios, yet the modal locations shift across scenarios: the mode under S60 is noticeably left-shifted, whereas those under S80 and S100 are right-shifted. This suggests that changes in water supply constraints alter the location of the efficiency distribution by reshaping the allocation structure of water across units with heterogeneous efficiency characteristics.
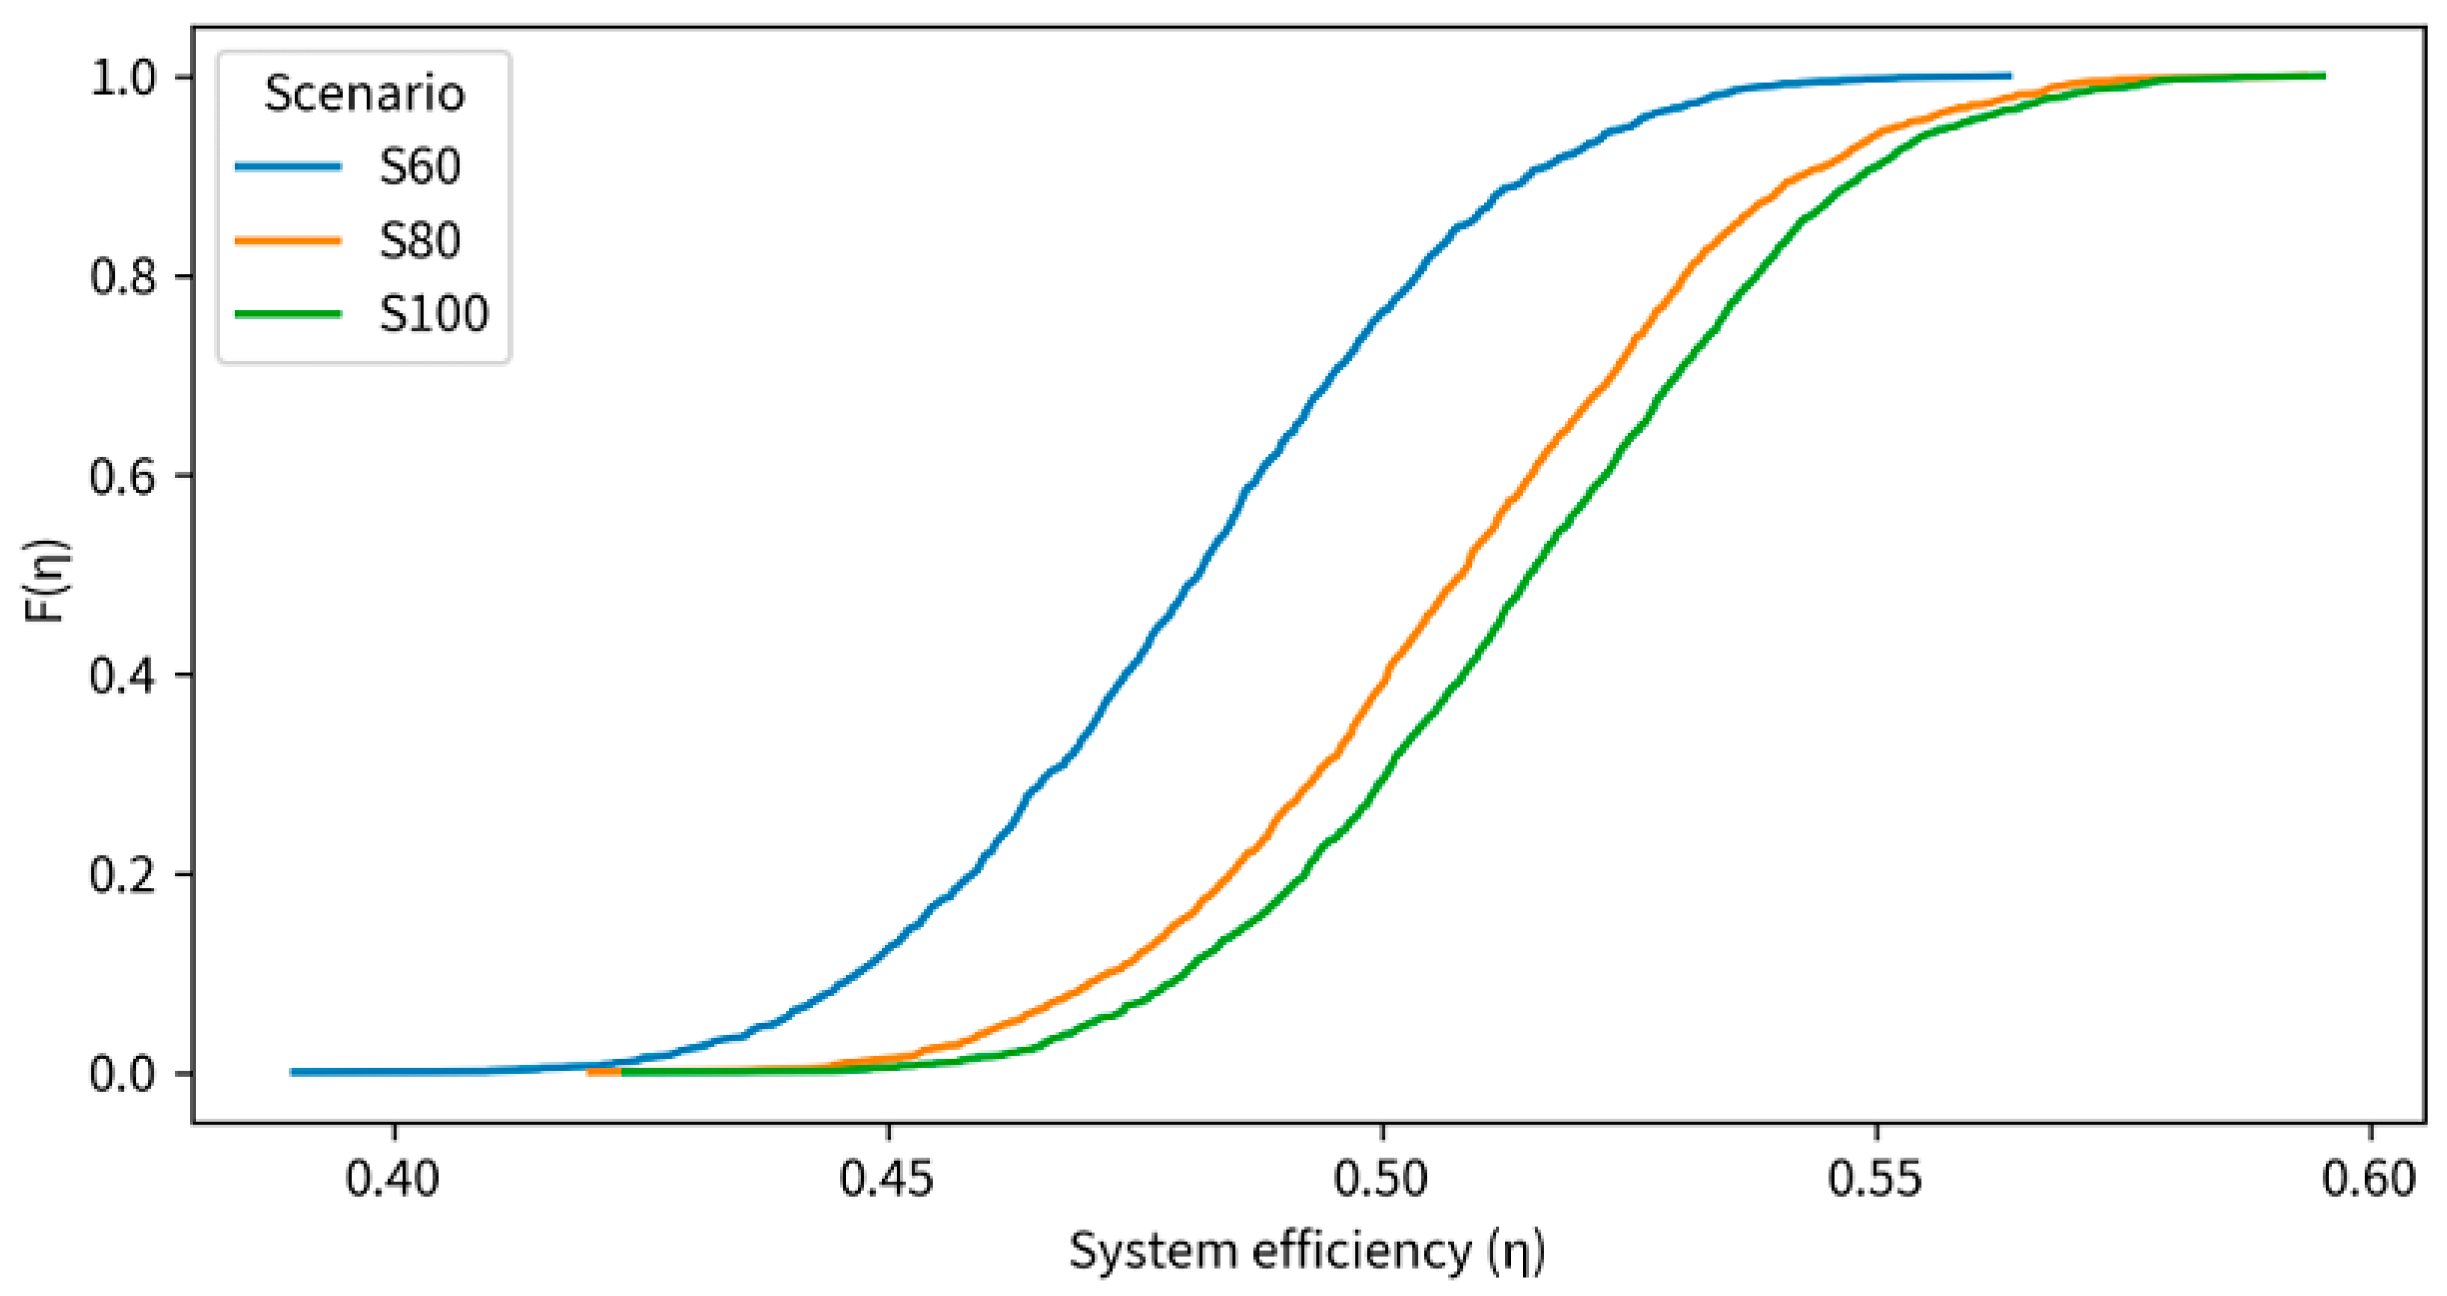
Figure 6 further enables comparison of low-efficiency risk using the empirical cumulative distribution function (CDF). For any given efficiency threshold, the CDF value represents the probability (i.e., the proportion of Monte Carlo realizations) that the efficiency does not exceed this threshold. Therefore, at the same threshold, a higher CDF curve indicates a higher likelihood of low-efficiency outcomes, allowing scenario-dependent differences in downside risk within the low-efficiency region to be identified. In practical terms, decision makers can interpret
Figure 6 by selecting a target efficiency level (for instance, η = 0.48) and reading the CDF value at that threshold for each scenario. A higher CDF value at the selected threshold indicates a greater probability that system efficiency will fall below the target, implying higher downside risk.
4.3. Irrigation Method Differences
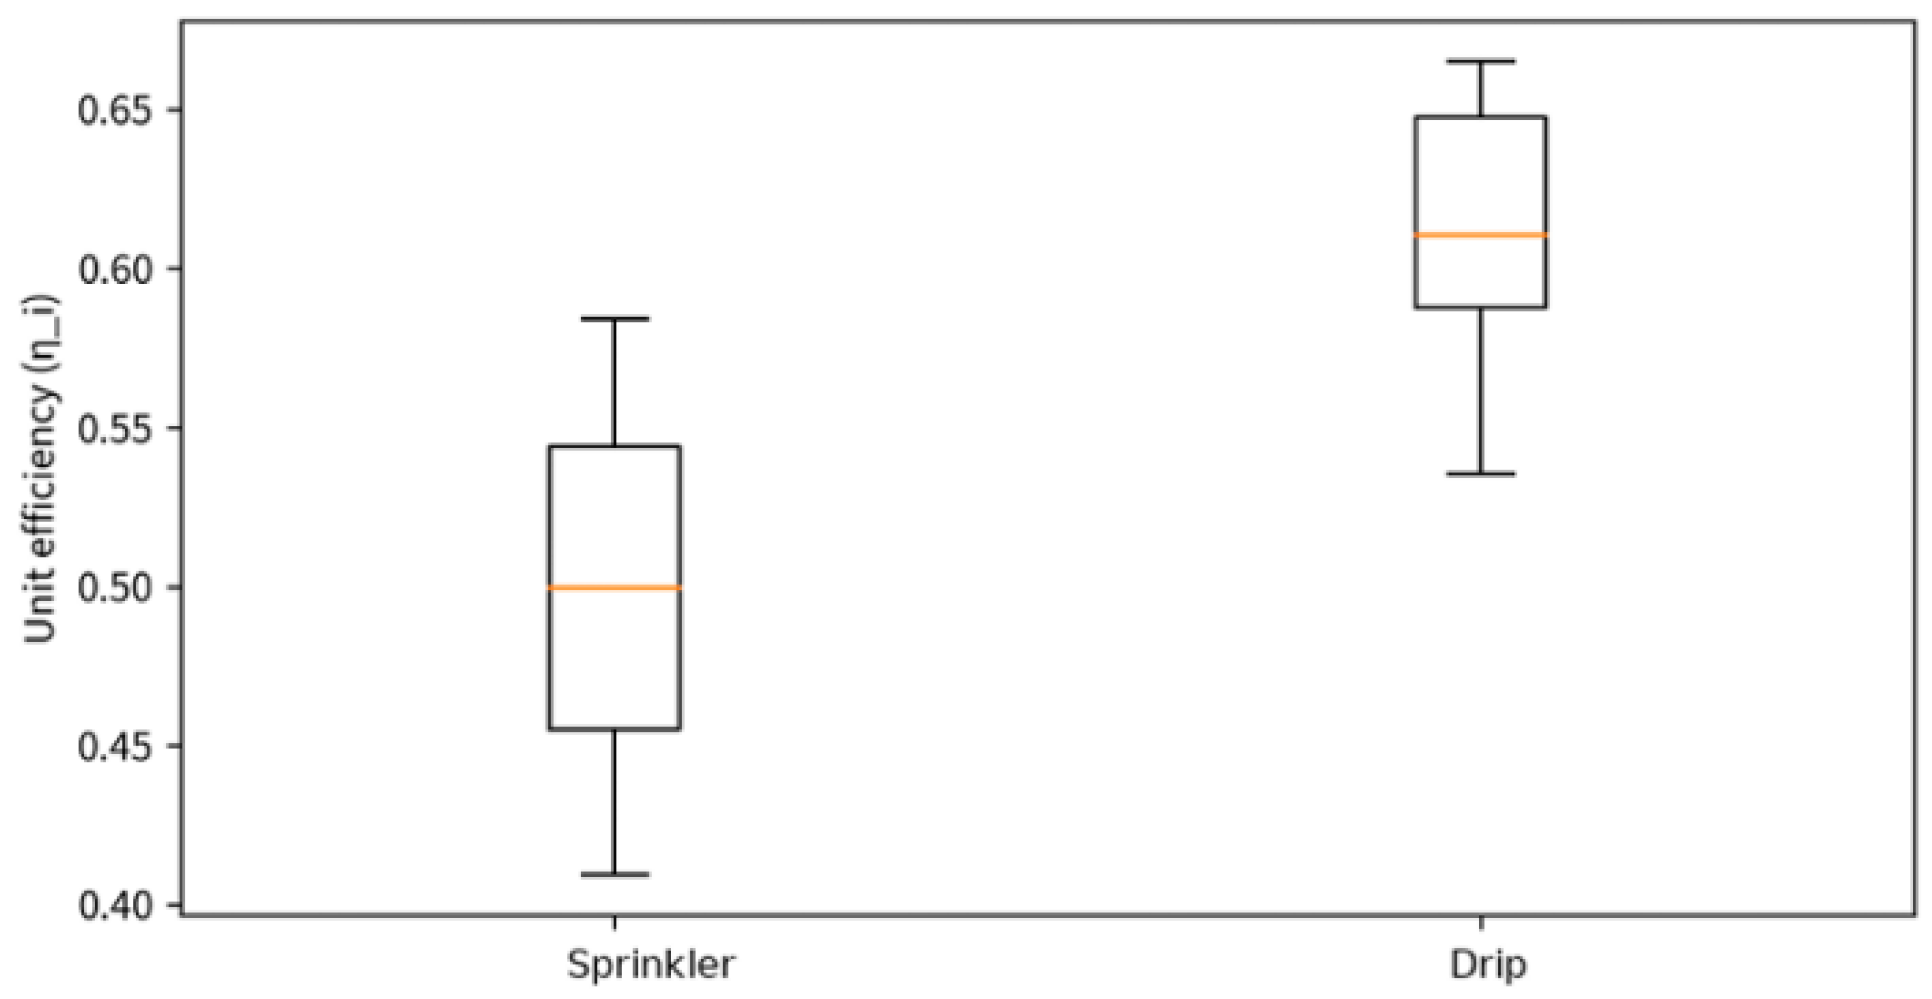
From the perspective of irrigation technology, the unit-level integrated efficiency differs substantially across irrigation methods (
Figure 7). The mean integrated efficiency of sprinkler-irrigated units is approximately 0.499, with a median of about 0.500. In contrast, drip-irrigated units exhibit a markedly higher mean integrated efficiency of approximately 0.614 and a median of about 0.610, together with less dispersion. These results indicate that, under the current conveyance system conditions, differences in irrigation technology constitute a key source of heterogeneity in unit efficiency. High-efficiency water-saving irrigation not only improves unit-level efficiency but also helps reduce efficiency variability, thereby enhancing the operational stability of the overall system. The reported values represent integrated (system-level) efficiencies that combine canal conveyance efficiency with on-farm application efficiency. Consequently, although the on-farm application efficiency of drip irrigation can reach 0.90–0.95, conveyance losses in the distribution network can substantially lower the integrated efficiency, which is consistent with the value of approximately 0.61 reported here.
4.4. Uncertainty Analysis
Under uncertainty, fluctuations in water supply, variability in irrigation demand, and efficiency perturbations jointly shape the distribution of system efficiency. Here, irrigation demand (crop irrigation requirement) is an endogenous model output from each re-optimized solution; its variability is induced by perturbations in the supply upper bound and composite irrigation efficiency. To identify the dominant drivers of
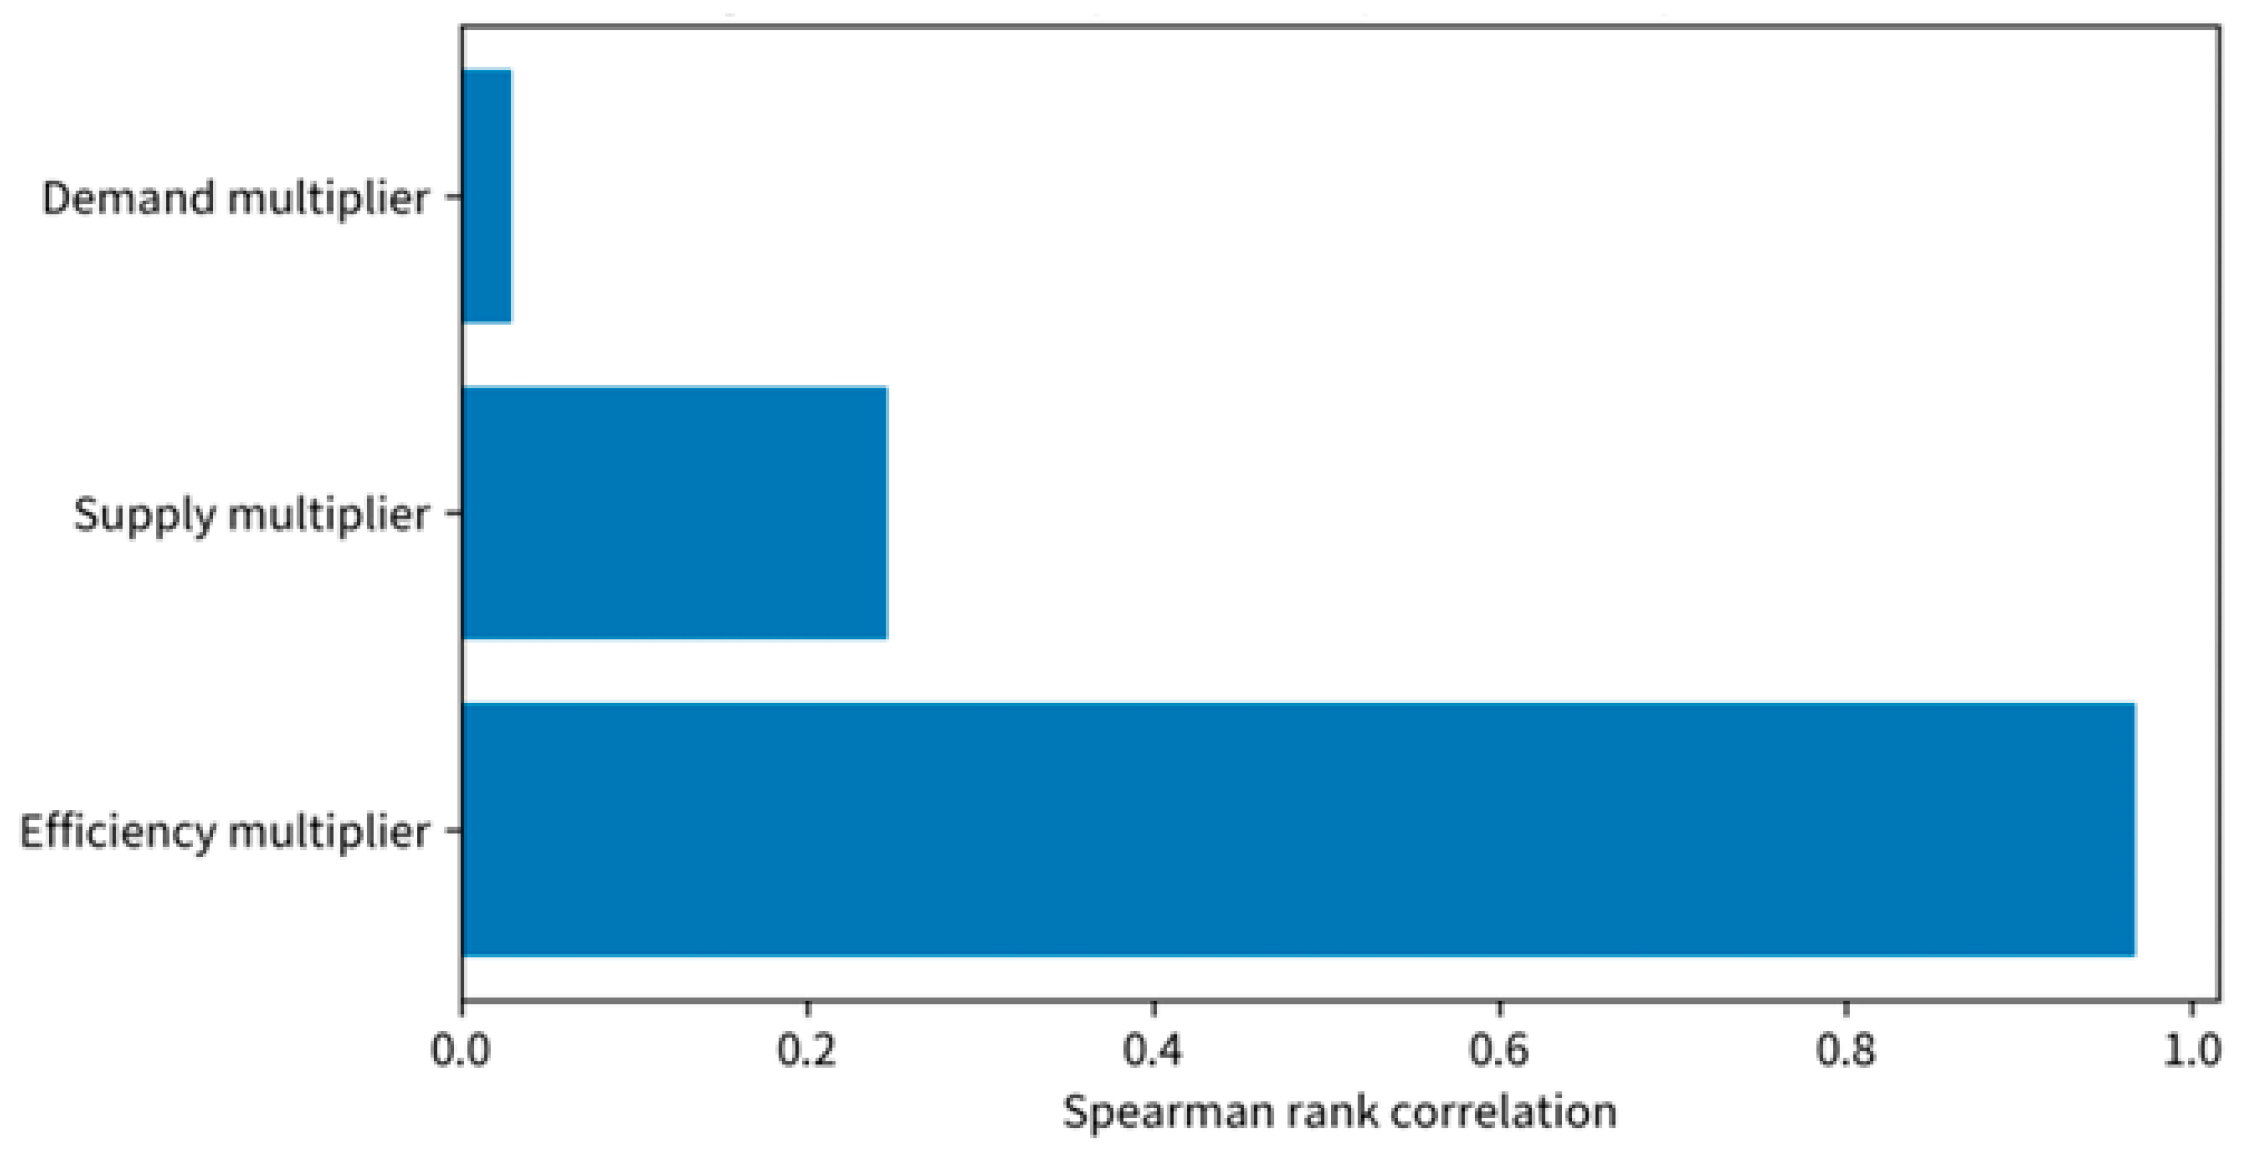
variability, a sensitivity analysis was conducted (
Figure 8). Efficiency perturbations exert the strongest influence on
, with a Spearman correlation coefficient of approximately 0.967, which is substantially higher than that of supply perturbations (about 0.246) and variation in simulated irrigation demand (about 0.029). These results indicate that, under the assumptions of this study, efficiency-related perturbations are the primary driver of variability in
, followed by water supply perturbations, whereas demand-side variation in simulated irrigation demand exerts a comparatively weaker influence on
. This finding suggests that, to achieve stable efficiency improvements under uncertainty, priority should be given to enhancing baseline efficiency while simultaneously improving the reliability of water supply to mitigate efficiency fluctuations under adverse conditions.
In addition to efficiency metrics, water deficit risk is a critical dimension for evaluating scenario performance. Risk was quantified using the water deficit ratio. Simulation results show pronounced differences in the mean deficit ratio across scenarios: approximately 0.438 for S60, 0.210 for S80, and 0.041 for S100. Under adverse conditions, the 95th percentiles of the deficit ratio are about 0.532, 0.346, and 0.166 for S60, S80, and S100, respectively, indicating that tighter supply constraints lead to more pronounced tail risk of water deficit. These findings imply that, when developing uncertainty-aware management contingency plans, it is insufficient to consider only the average deficit risk; attention should also be given to the upper bound of risk under unfavorable realizations, which provides a quantitative basis for assessing operational stress and supply reliability under extreme conditions.
These findings suggest that uncertainty-aware contingency planning should rely on distributional risk metrics rather than mean values alone. Management thresholds can be defined using upper-quantile deficit ratios to keep operational stress within acceptable bounds under unfavorable realizations, while mean values can be used for baseline planning.
5. Discussion
This study employed UODRA to examine system efficiency and risk under different water supply scenarios, providing a more refined assessment and greater flexibility than many previous approaches. Prior studies have shown that both supply level and supply uncertainty can substantially affect allocation structure and efficiency performance in irrigation systems. For example, Li et al. developed a stochastic multi-objective framework to reveal how changes in resource constraints influence system outputs and allocation schemes [
40] and further quantified trade-offs in the coordinated allocation of water and soil resources under uncertainty using multi-objective nonlinear optimization [
41,
42]. Li et al. also formulated an optimization model under different supply levels and stochastic supply fluctuations, demonstrating that water scarcity can reshape optimal allocation patterns and alter efficiency-related indicators [
43,
44]. Overall, however, much of the existing literature emphasizes mean performance or scenario-to-scenario comparisons, while providing limited explicit characterization of efficiency variability and tail risk under adverse conditions [
45].
Methodologically, the UODRA framework provides a stronger capability for addressing uncertainty-driven perturbations than conventional linear programming approaches [
46]. Traditional formulations typically treat model parameters as known and time-invariant, which may limit their applicability under highly variable hydrological and operational conditions. In contrast, UODRA integrates Monte Carlo simulation with multi-scenario analysis to quantify performance variability and to evaluate system stability and efficiency across a range of water supply scenarios. Consequently, the proposed framework offers more robust support when key inputs are uncertain.
Compared with the optimization approach adopted by He et al. [
47], the multi-scenario simulation strategy developed in this study enhances model flexibility and yields more adaptive solutions for water resource management. Specifically, the UODRA framework quantifies irrigation efficiency outcomes across alternative water supply scenarios, thereby enabling a more comprehensive evaluation of system performance. This capability is particularly valuable under extreme weather events and pronounced supply fluctuations, where scenario-informed results can provide more actionable decision support for irrigation district operations and management.
Compared with classical stochastic programming approaches, which typically require predefined scenario trees and probability assignments that may significantly increase model size and computational burden, the proposed Monte Carlo-based framework [
48] directly generates empirical performance distributions without constructing complex scenario structures. In contrast to robust optimization, which often focuses on worst-case guarantees and may lead to overly conservative allocation decisions, the present approach quantifies full distributional characteristics, including dispersion and downside risk. These features highlight the methodological advantages of the UODRA framework in balancing computational tractability and uncertainty representation.
Although the proposed model offers clear advantages, computational efficiency can become a limiting factor when it is applied to large-scale datasets and highly complex management settings. Future work may improve computational performance through algorithmic refinements and parallel-computing implementations. In addition, the framework could be extended to incorporate additional drivers, such as water quality constraints and soil-type heterogeneity, thereby broadening its applicability and strengthening its practical relevance.
From a policy perspective, the findings suggest that improving irrigation system efficiency may yield greater performance gains than merely expanding water supply under uncertainty. The sensitivity analysis indicates that efficiency-related perturbations exert stronger impacts on output variability than supply-side fluctuations, implying that investments in conveyance infrastructure improvement and high-efficiency irrigation technologies such as drip irrigation could enhance both mean performance and operational stability. Furthermore, the observed diminishing marginal returns under high supply levels indicate that excessive infrastructure expansion may not proportionally increase effective utilization efficiency. Therefore, adaptive strategies prioritizing efficiency enhancement and risk-aware allocation may provide more sustainable pathways for irrigation district management under increasing climate variability.
6. Conclusions
This study, based on an uncertainty-aware optimization model for agricultural water allocation, investigated the efficiency and risk characteristics of an irrigation system under different water supply scenarios. The results indicate that water supply constraints have a pronounced impact on system efficiency. Under a low supply level (S60), system efficiency is relatively low; as water availability increases, system efficiency improves progressively, with a more evident gain when the supply constraint is relaxed from S60 to S80. However, when the supply level is further increased to S100, the improvement in system efficiency becomes marginal, suggesting diminishing returns under relatively sufficient supply conditions.
Meanwhile, this study shows that although system efficiency adjusts with changes in water supply constraints, uncertainty-induced perturbations have a substantial influence on efficiency outcomes. Efficiency-related disturbances are the primary drivers of system stability and performance. In addition, under high-efficiency water-saving irrigation modes, both overall efficiency and operational stability are significantly improved. These findings provide theoretical support for the selection and optimization of irrigation technologies: in particular, adopting high-efficiency water-saving irrigation can effectively reduce efficiency variability and enhance the operational reliability of the system.
Further analysis of water deficit risk reveals clear scenario-dependent trends. Under tighter water supply constraints, deficit risk is substantially higher; in particular, when supply is limited, the system is more likely to experience water shortages and to fall into low-efficiency states. Therefore, improving infrastructure efficiency, optimizing water supply allocation, and upgrading irrigation technologies emerge as key strategies for reducing deficit risk and enhancing overall system performance.
Overall, this study provides robust decision support for agricultural water management. In particular, it offers both theoretical value and practical guidance for system optimization and risk control under varying water supply constraints.




 ,
,