Article

Explainable Deep Learning and PHREEQC-Constrained Assessment of Genesis and Health Risks of Deep High-Fluoride Groundwater: A Case Study of Hengshui City, North China Plain

1
Ecological Environment Protection Ministry Soil and Agricultural and Rural Ecological Environment Supervision and Technology Center, Beijing 100012, China
2
School of Water Resources and Environment, China University of Geosciences Beijing, Beijing 100083, China
3
Water Science Research Institute, Beijing Normal University, Beijing 100083, China
4
School of Information Management, Heilongjiang University, Harbin 150080, China
5
School of Computer Science and Technology, Changchun University, Changchun 130022, China
6
College of Disaster Prevention and Mitigation, Langfang 065201, China
*
Author to whom correspondence should be addressed.
These authors contributed equally to this work.
Water 2026, 18(5), 600; https://doi.org/10.3390/w18050600
Submission received: 21 December 2025 / Revised: 21 January 2026 / Accepted: 30 January 2026 / Published: 1 March 2026

Abstract

Fluoride (F) contamination in deep groundwater threatens drinking water security, yet its enrichment is commonly governed by coupled nonlinear hydrogeochemical feedbacks that are difficult to resolve with linear diagnostics alone. Here, we integrate an explainable deep learning framework (HydroAttentionNet + SHAP) with thermodynamic and mass-conservative inverse modeling (PHREEQC) to quantitatively link data-driven thresholds to mineral water processes in a multi-aquifer system. Using 258 deep-well samples, we delineate a robust evolution pathway from background to ultra-high-fluoride (Ultra-High F, ≥1.5 mg/L) waters. HydroAttentionNet achieves strong predictive skill (R2 = 0.77) and reveals a clear mechanistic tipping behavior: alkalinity (HCO3/CO32−) is the primary trigger for F activation, while progressive Na+ enrichment and Ca2+ depletion act as amplifiers by suppressing a(Ca2+) and weakening fluorite precipitation capacity. PHREEQC simulations confirm a coupled “salinization–decalcification–fluoridation” loop in which (i) evaporite dissolution elevates ionic strength (salt effect) and supplies Na+ to promote Na–Ca exchange, and (ii) carbonate re-equilibration drives calcite precipitation as an efficient Ca sink, offsetting ~45.8% of Ca2+ inputs; together, these processes maintain fluorite undersaturation and sustain net fluorite dissolution, contributing 56.6% of newly added dissolved F in evolved end-members. Monte Carlo health risk assessment (10,000 iterations) indicates substantial intergenerational inequity: 67.9% of children exceed the non-carcinogenic risk threshold (HQ > 1), compared with 29.3% of adults. Sensitivity analysis identifies source-water fluoride concentration as the dominant driver (Spearman r = 0.93), implying that supply-side interventions (defluoridation, well-screen optimization, and blending with low-F sources) are substantially more effective than behavioral measures.

1. Introduction

Excess fluoride in drinking water can lead to fluorosis and possible neurological impairment. High-fluoride groundwater is a widespread geogenic water-quality issue, especially common in arid and semi-arid basins. Although evaporation-driven enrichment in shallow aquifers has been extensively reported, the origin of high fluoride in deep confined aquifers remains only partly understood due to prolonged water–rock interaction and hidden hydrochemical evolution pathways [1,2,3,4,5].
From a methodological perspective, fluoride-source identification has commonly relied on hydrochemical diagrams (e.g., Piper plots) and thermodynamic equilibrium calculations. Although useful, these mainly linear approaches often fail to describe complex nonlinear relationships among multiple hydrochemical variables in deep aquifers. In recent years, machine learning (ML) has emerged as a strong tool for groundwater-quality prediction; however, many hydrogeological ML studies still face the “black-box” limitation—high predictive performance but weak mechanistic interpretability. Linking data-driven nonlinear relationships with process-based geochemical constraints therefore remains a key challenge in modern hydrogeological research [6,7,8,9,10,11,12].
High-fluoride groundwater has been documented in Bangladesh, India, Canada, the United States, China, and many other regions [13]. In China, high-fluoride groundwater is mainly distributed in Shandong, Henan, Hebei, Ningxia, Anhui, Jilin, Xinjiang, Inner Mongolia, Shanxi, Shaanxi, and other areas [14]. In certain locations, groundwater fluoride exceeds the national drinking water standard by more than one order of magnitude [15]. Sreedevi et al. reported that fluoride in Indian groundwater is mainly derived from fluorine-bearing minerals (e.g., fluorite) within granitic rocks [16]. Armienta and Segovia proposed that fluoride in Mexican groundwater originates from the dissolution of volcanic rocks [17]. Asghar Moghaddam and Fijani observed that high-fluoride zones in northwestern Iran are largely associated with basaltic terrains [18]. Rao suggested that agricultural practices, such as phosphate-fertilizer application, can also enhance groundwater fluoride levels [19]. Jayawardana et al. concluded that fluoride in Sri Lankan groundwater primarily results from the weathering of F-bearing minerals, including apatite and fluorite [20]. Dehbandi et al. demonstrated that high-fluoride waters in central Iran are strongly affected by evaporation concentration and ion exchange [21].
Dai et al. estimated that over 50 million rural residents in China consume drinking water with fluoride concentrations above 1.5 mg/L [22]. Lv et al. reported that fluoride enrichment in groundwater of the Qinwangchuan Basin is governed by the weathering and dissolution of F-bearing minerals (e.g., fluorite), evaporation concentration, cation exchange, desorption, and competitive adsorption, and is typically characterized by Na enrichment, Ca depletion, and weak alkalinity [23]. Liu et al. examined the distribution and formation of high-fluoride groundwater in the Weishan Lake Basin and found that F is negatively related to Ca2+ but positively related to Na+ and HCO3; fluorite dissolution, leaching, and evaporation jointly contribute to fluoride enrichment [24]. Wu et al. suggested that mineral dissolution equilibria, particularly of calcite and fluorite, together with ion exchange, are the main controls on fluoride in the Liujiang Basin [25]. Yang et al. identified a “low-around/high-center” spatial pattern of fluoride in deep groundwater in a representative area of northern Anhui, with fluoride mainly originating from the dissolution of F-bearing minerals under weakly alkaline conditions and regulated by dissolution–precipitation processes and cation exchange adsorption [26]. Mao et al. showed that fluoride exceedance in the Hetao Basin (Inner Mongolia) is greater in piedmont zones than in plains; high-fluoride waters are generally Na-rich, Ca-poor, and weakly alkaline, with piedmont fluoride influenced by silicate (mica) and calcite dissolution and precipitation, whereas fluoride in plain areas is controlled by evaporation, cation exchange, and competitive adsorption [27].
To address these issues, a coupled “data-mechanism” framework is proposed. Specifically, this study seeks to do the following: (1) identify hydrochemical phase transitions linked to different F levels; (2) employ a novel attention-based neural network (HydroAttentionNet) combined with SHAP (SHapley Additive exPlanations) to quantitatively determine the nonlinear contributions of individual ions across enrichment stages; (3) validate these data-driven results using PHREEQC inverse modeling and quantify mineral mass transfer (e.g., fluorite dissolution and calcite precipitation fluxes); and (4) perform probabilistic health risk assessment to identify vulnerability differences between adults and children. This integrated strategy provides a sound scientific basis for the management of deep groundwater resources in high-fluoride regions [28,29,30,31].
To explicitly differentiate this work from prior high-fluoride studies that rely mainly on linear bivariate diagnostics or qualitative mechanism narratives, we contribute three advances: (i) an explainable nonlinear predictor (HydroAttentionNet + SHAP) that identifies mechanistic tipping behavior (a threshold-like transition) in the alkalinity–Ca–Na control space rather than assuming monotonic relationships; (ii) PHREEQC-based activity/SI diagnostics coupled with mass-conservative inverse modeling that closes elemental budgets and quantifies mineral/exchange fluxes along the evolution pathway, thereby converting data-driven correlations into thermodynamic evidence; and (iii) a risk-to-management translation that links the dominant uncertainty source in probabilistic HQ to concrete supply-side interventions (well-screen optimization, blending, and defluoridation). These advances align with nonlinear evolution concepts commonly discussed in seepage systems and bifurcation frameworks, where small changes in controlling variables can trigger regime shifts in system behavior.

2. Study Area

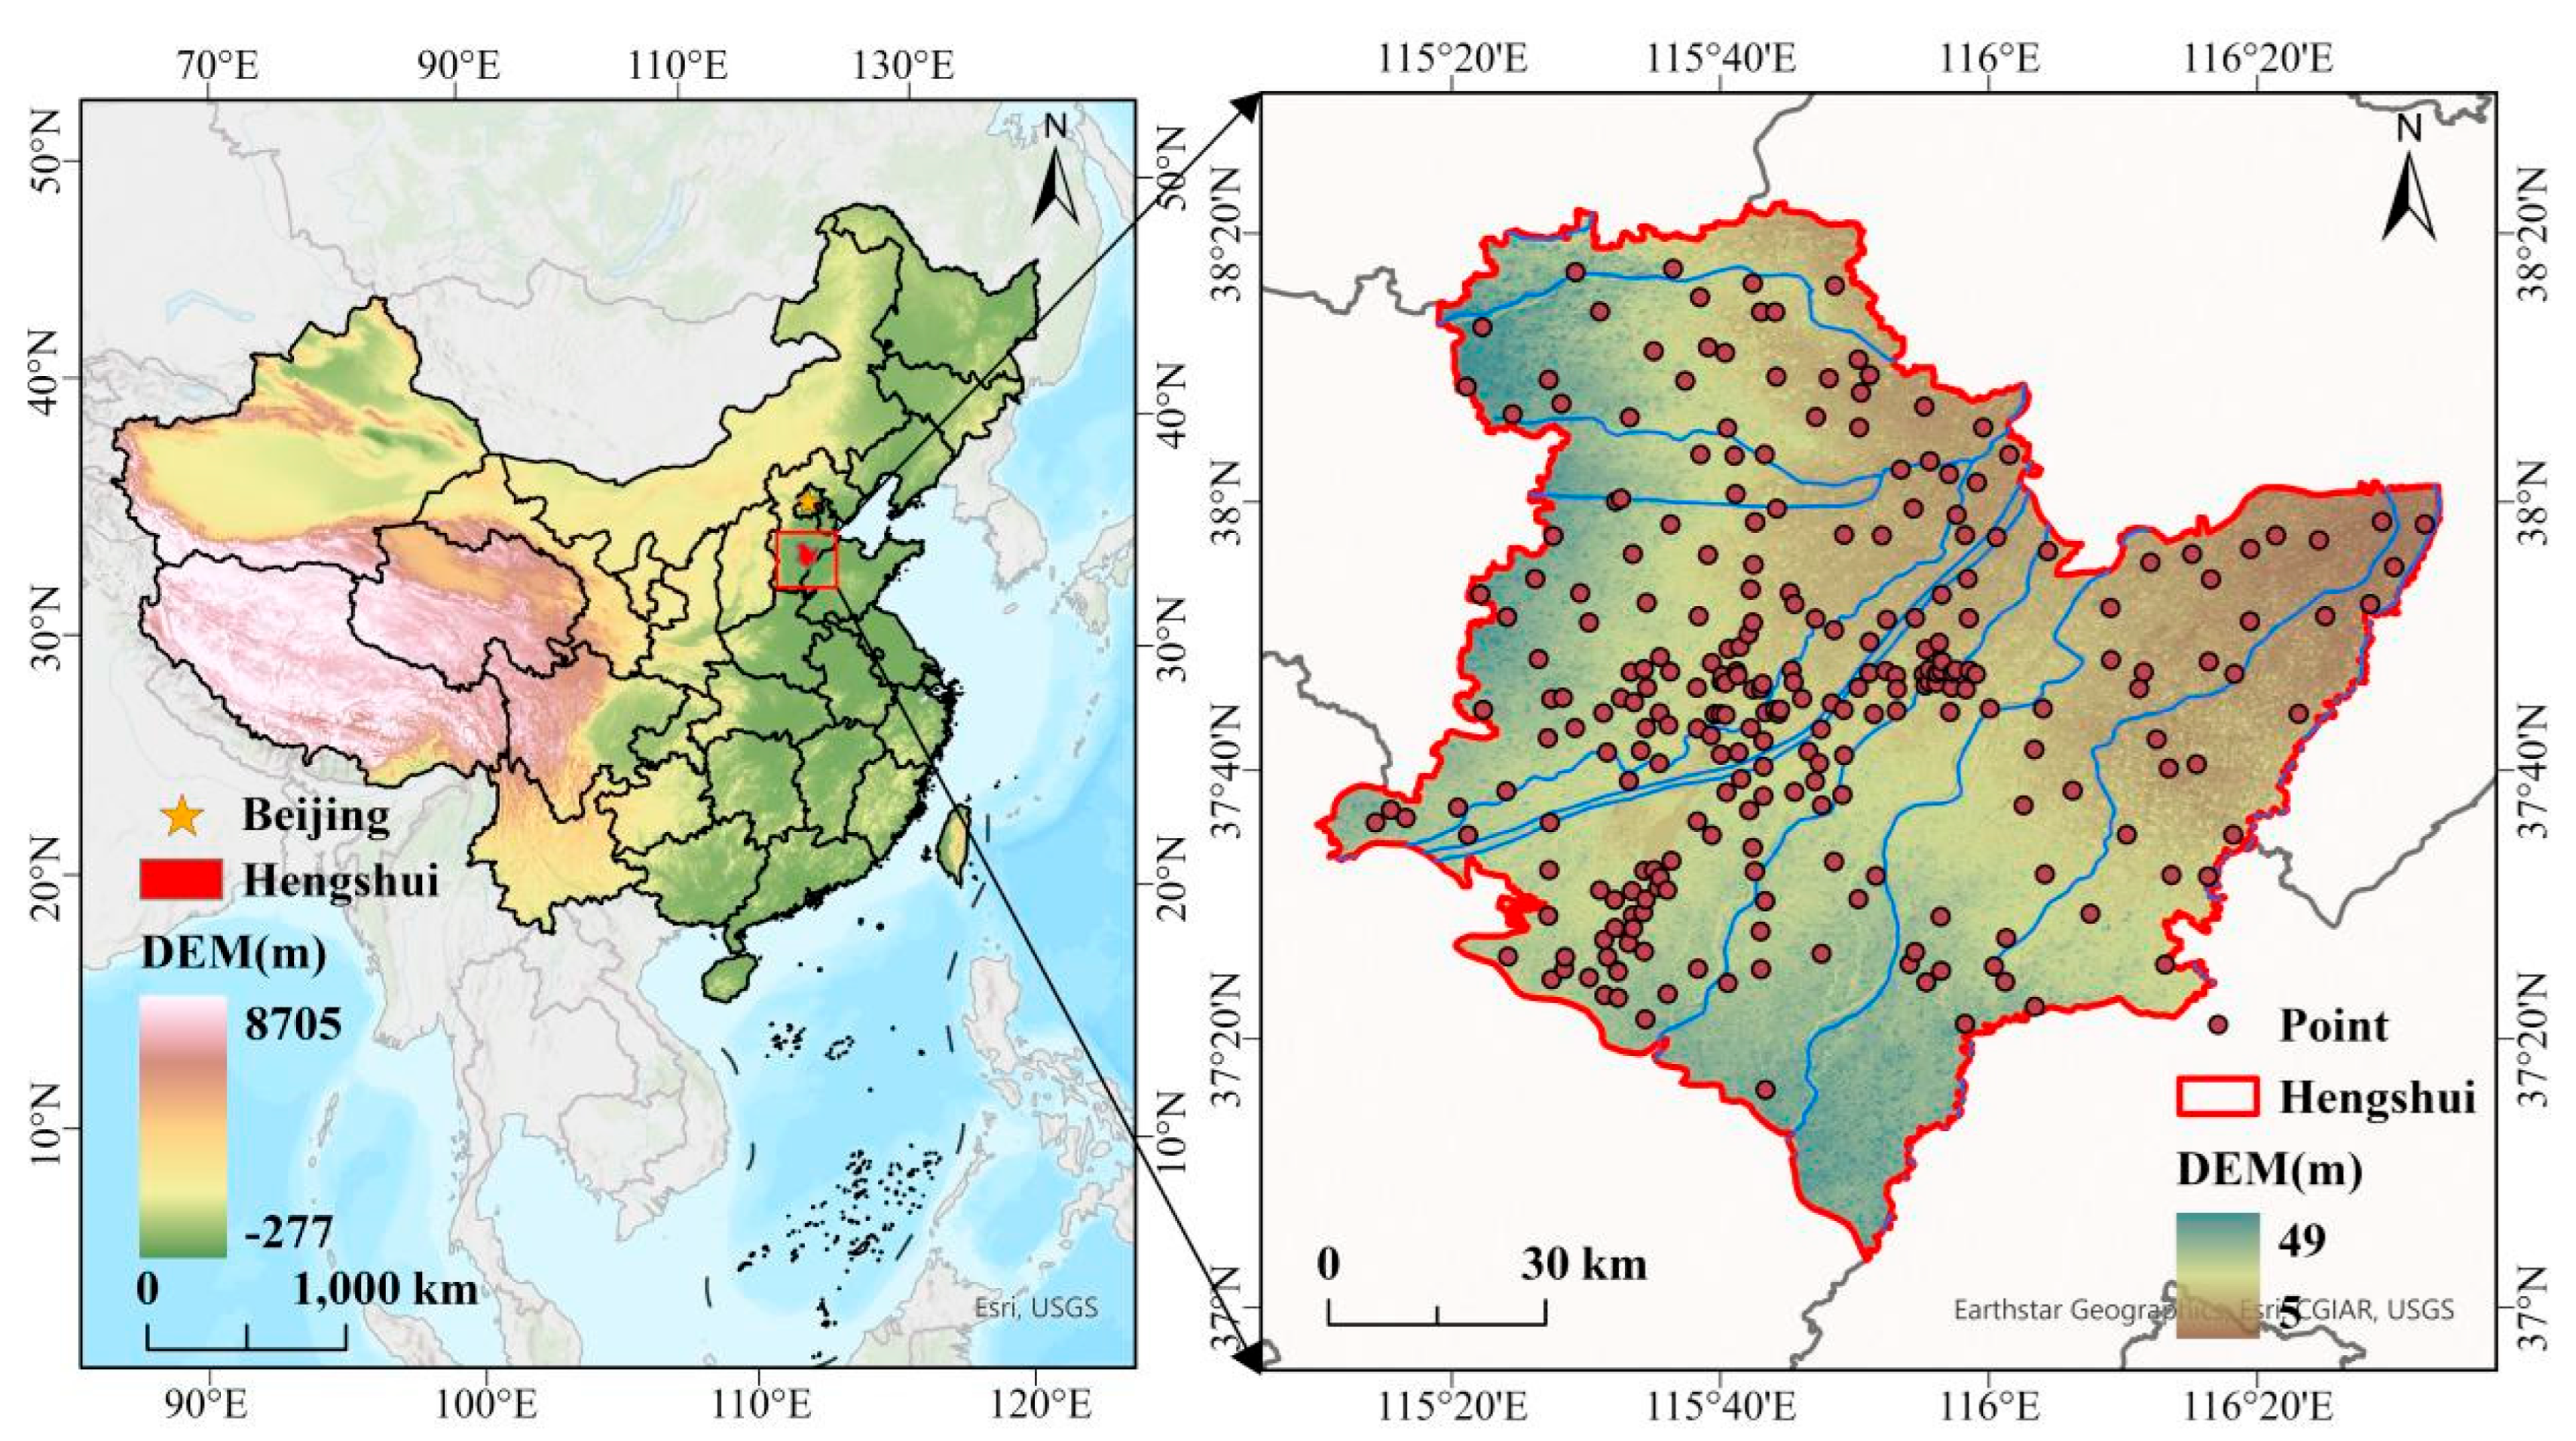
The study area encompasses the entire Hengshui City in the northeastern North China Plain, China (37°03′–37°51′ N, 115°35′–116°27′ E), covering a total area of 8836 km2 (Figure 1). Major rivers include the Zhulong River, Hutuo River, Fuyang River, Fudong Drainage Canal, Suolu River–Laoyan River, Qingliang River, Jiangjiang River, and the Weiyun River–Nanyun River system (nine in total). According to hydrogeological characteristics, the region can be subdivided from northwest to southeast into the Hutuo River alluvial–proluvial subregion, the Fuyang River alluvial–lacustrine subregion, and the Zhangwei River alluvial–lacustrine subregion. Groundwater mainly occurs as Quaternary unconsolidated pore water. Laterally, the system is divided into a fully freshwater zone and a zone containing saline water bodies. Vertically, based on groundwater occurrence conditions, flow dynamics, and stratigraphic age, the Quaternary deposits are classified into four aquifer groups corresponding to q4, q3, q2, and q1 (Table 1).
Climatically, the study area has a continental monsoon regime with distinct seasons and pronounced contrasts between cold/warm and dry/wet periods. Summers are influenced by southerly airflows along the periphery of the western Pacific subtropical high, resulting in hot and humid conditions with concentrated precipitation; winters are dominated by the northwesterly monsoon and are cold and dry with sparse rain and snow. Spring is typically dry and windy with rapid warming, whereas autumn is often characterized by clear and pleasant weather. The annual and diurnal temperature ranges are large and precipitation is relatively low, indicating a semi-humid climate. The long-term mean annual air temperature is 13.10 °C; the coldest month is January (mean −4 °C) and the warmest month is July (mean 27 °C).

3. Materials and Methods

3.1. Sampling

A total of 258 groundwater samples were collected from deep monitoring wells across Hengshui City, targeting the confined Quaternary aquifer groups (q4–q1). Before sampling, each well was purged (≥3 well volumes) until field parameters (pH, temperature, and TDS) stabilized (variation <5% over three consecutive readings). In situ measurements were performed using a calibrated multiparameter probe. Samples for major cations were filtered through 0.45 μm membranes, acidified to pH < 2 with ultrapure HNO3, and stored at 4 °C; samples for anions and alkalinity were filtered but not acidified. HCO3/CO32− were determined by Gran alkalinity titration within 24 h. Major cations (K+, Na+, Ca2+, Mg2+) and anions (Cl, SO42−, F) were measured by ion chromatography following standard protocols (Shimadzu AA-6000CF atomic absorption spectrophotometer and a Dionex ICS-2100 ion chromatograph), and analytical precision was checked using duplicates, blanks, and certified reference solutions. Charge-balance error (CBE) was used for quality control; only samples with |CBE| ≤ 10% were retained for subsequent analyses.

3.2. Data-Driven Modeling

HydroAttentionNet and SHAP. To capture nonlinear and interactive hydrochemical controls on F, we implemented an attention-augmented feed-forward neural network (HydroAttentionNet). Inputs included well depth, temperature, TDS, pH, and eight major ions (Ca2+, Mg2+, K+, Na+, Cl, SO42−, HCO3, CO32−), and the target was dissolved F. All predictors were standardized (z-score) using training statistics, and F was modeled in log1p space to reduce heteroscedasticity. The network consists of (i) a feature-attention gate that learns normalized weights (0–1) for each input feature, followed by (ii) two fully connected layers with dropout regularization, and (iii) a linear output layer. Model training used the Adam optimizer with early stopping based on validation loss to mitigate overfitting given the moderate sample size (n = 258). Data were split into training and testing subsets (80%/20%) using a fixed random seed for reproducibility. To interpret predictions, SHAP (SHapley Additive exPlanations) was applied to compute feature-attribution values at both global and group levels, enabling identification of dominant drivers and their stage-wise transitions (Background → High F → Ultra-High F). (Data processing and modeling were performed in Python (Version 3.13); Python Software Foundation).
Sample size adequacy and model validation. Although n = 258 is moderate for deep learning, this scale is common in hydrogeochemical field studies where samples are costly; to ensure that model capacity is commensurate with data availability, we used (i) strong regularization (dropout and L2 weight decay), (ii) early stopping, and (iii) repeated K-fold cross-validation (5 folds × 10 repeats) to report robust performance distributions rather than a single split. In addition to HydroAttentionNet, three widely used baseline models were trained under the same preprocessing-to-benchmark added value: random forest regression (RF), support vector regression with RBF kernel (SVR), and gradient-boosted trees (XGBoost). Hyperparameters were tuned by inner-loop grid search within cross-validation (nested CV) to avoid optimistic bias. Learning-curve diagnostics were used to confirm performance saturation and to verify that the model does not rely on leakage or overfitting artifacts.
Implementation details. The attention gate outputs feature weights via a softmax-normalized vector a = softmax (Wa·h + ba), which is used to reweight standardized inputs (x′ = a ⊙ x). The network uses two hidden layers (128 and 64 neurons, ReLU activation) with dropout (p = 0.20) and L2 weight decay (1 × 10⁻⁴). Training was performed for up to 500 epochs with mini-batch size 32 using Adam (learning rate 1 × 10⁻³), and early stopping (patience = 30) based on validation RMSE.

3.3. Geochemical Modeling

The thermodynamic behavior of the system was simulated using PHREEQC (3.73-15895) with the wateq4f.dat database. Ion activities (ai = γi·mi) and saturation indices (SIs) of fluorite, calcite, dolomite, gypsum, and halite were computed to diagnose dissolution/precipitation tendencies. Inverse modeling was then performed to quantify net reaction fluxes (mol·kgw−1) along the evolution pathway from initial low-F end-members to evolved high-F end-members, enforcing stoichiometric closure for Ca, Mg, Na, Cl, S, C, and F and constraining carbonate phases to near-equilibrium conditions (SI ≈ 0). The inversion outputs were further validated by comparing predicted solute increments (Δ) with mineral-derived contributions under reaction stoichiometry.
Operational procedure for inverse modeling. We first defined representative initial (low-F) and evolved (high-F/ultra-high-F) end-members using the 10th and 90th percentiles of F within each hydrochemical facies. For each pathway, PHREEQC INVERSE_MODELING was configured to include potential phases (fluorite, calcite, dolomite, gypsum, halite) and an exchange assemblage (NaX, CaX2) with charge-balanced constraints. Carbonate alkalinity was constrained by measured HCO3/CO32− and pH, and redox-sensitive reactions were excluded because the system is dominated by major-ion evolution. The solution set was accepted only if (i) mass-balance residuals for conserved elements were within analytical uncertainty, (ii) the direction of modeled fluxes matched SI-based plausibility (e.g., net precipitation requires SI ≥ 0), and (iii) the pathway reproduced observed ΔTDS and ΔNa/Ca trends. This workflow provides a transparent, stepwise data-generation procedure for reaction fluxes used in Section 4.3.

3.4. Probabilistic Health Risk Assessment

Unlike deterministic approaches based on single-point estimates, Monte Carlo simulation (10,000 iterations) was used to characterize probability distributions of the non-carcinogenic hazard quotient (HQ) for adults and children. The simulation treats contaminant concentration (Cw) and key physiological parameters (daily water ingestion rate IR and body weight BW) as stochastic variables, thereby quantifying both central tendency and high-risk tails. Spearman rank correlation was used for global sensitivity analysis to identify the dominant uncertainty sources and to translate risk results into actionable management levers (e.g., lowering Cw through treatment, blending, or well-screen optimization).

4. Results and Discussion

4.1. Hydrochemical Characteristics

4.1.1. Ionic Composition Across Fluoride Levels

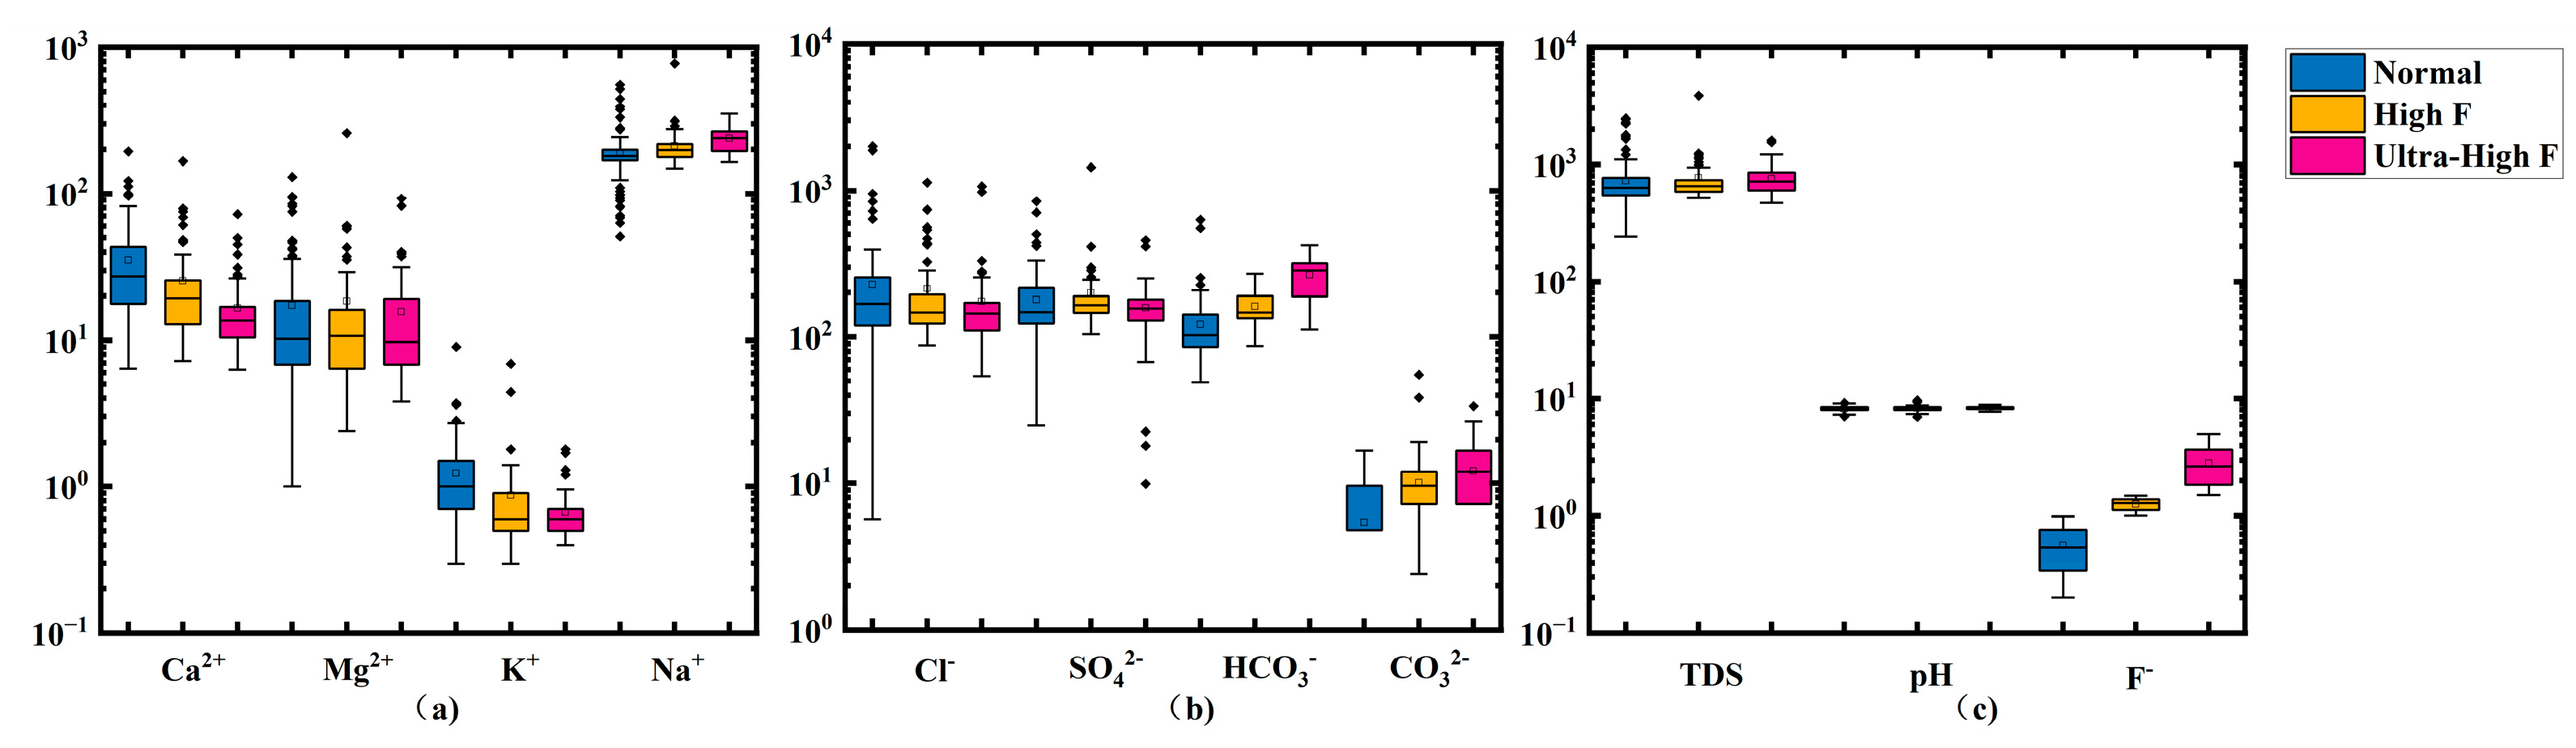
Based on F concentration, groundwater samples were divided into three groups: Normal (F < 1.0 mg/L), High F (1.0–1.5 mg/L), and Ultra-High F (F ≥ 1.5 mg/L). As shown in Figure 2, median concentrations of Ca2+, Mg2+, and K+ generally lie within 100–102 mg/L, whereas Na+, Cl, SO42−, and HCO3 mainly fall in the range of 101–103 mg/L. Among cations, Ca2+ and Mg2+ decrease consistently with increasing fluoride: median Ca2+ declines from ~3 × 101 mg/L in the Normal group to ~2 × 101 and ~1 × 101 mg/L in the High F and Ultra-High F groups, respectively; Mg2+ shows a comparable decrease from ~2 × 101 mg/L to ~101 mg/L. K+ exhibits little variation among groups and remains close to ~100 mg/L. In contrast, median Na+ rises from ~1 × 10² mg/L in the Normal group to ~1.3–1.5 × 10² mg/L in the High F group, and further to ~1.5–2 × 10² mg/L in the Ultra-High F group. This combined pattern of Ca–Mg depletion and Na enrichment suggests that high- and ultra-high-fluoride waters preferentially develop under increasingly sodic hydrochemical conditions [31,32,33,34,35] (Figure 2a).
From a chemical–thermodynamic perspective, the observed Ca–Mg depletion is not merely a generic “ionic pairing” phenomenon. Ca2+ exhibits strong affinity for the carbonate system and tends to be preferentially removed via calcite precipitation (Ca2+ + CO32− → CaCO3(s)) under alkaline, DIC-rich conditions, while Na–Ca cation exchange further lowers aqueous Ca2+ activity (2Na–X + Ca2+ ⇌ Ca–X2 + 2Na+). Because fluorite solubility is controlled by IAP = a(Ca2+)·a(F)2, any sustained suppression of a(Ca2+) increases the equilibrium F required for fluorite saturation and therefore promotes net fluorite dissolution and fluoride accumulation. In contrast, Na+ forms weak ion pairs with F and primarily acts as an indirect amplifier by increasing ionic strength and driving exchange, consistent with the progressive shift toward Na-dominant facies.
Ion-binding priority and aqueous speciation further reinforce this mechanism. Under alkaline, high-ionic strength conditions, F can form aqueous complexes (e.g., CaF+ and MgF+), but these complexes reduce free F activity only when Ca/Mg remain available; once Ca2+ is efficiently scavenged by carbonate precipitation and exchange, complexation capacity collapses, and the system shifts toward higher free a(F). In contrast, Na+ forms comparatively weak neutral pairs with F and therefore does not directly buffer F activity; its primary role is to increase ionic strength (affecting γi) and to drive exchange that suppresses a(Ca2+), jointly amplifying fluorite undersaturation.
For anions, all three groups are dominated by HCO3, with Cl and SO42− as secondary constituents (Figure 2b). Median HCO3 concentration in the Normal group is ~1 × 10²–1.5 × 10² mg/L, increasing stepwise to ~1.5 × 10² mg/L in the High F group and nearly 2 × 10² mg/L in the Ultra-High F group, indicating progressively stronger bicarbonate enrichment in fluoride-rich waters. Cl and SO42− concentrations are generally on the order of 102 mg/L across all groups, although Cl is slightly higher in the Normal group, implying that fluoride-rich groundwater is not simply a high-Cl saline type. Instead, it represents a mixed water dominated by HCO3 with notable contributions from Cl and SO42−. CO32− is close to the detection limit in the Normal group but increases substantially, with median values of several mg/L, in the High F and Ultra-High F groups, reflecting gradual alkalinization and a more complete conversion of HCO3 to CO32− as F increases.
The distributions of TDS and pH further define the background conditions of fluoride-rich waters (Figure 2c). Median TDS values for all groups lie within 102–103 mg/L: ~5–6 × 10² mg/L for the Normal group, ~7–8 × 10² mg/L for the High F group, and close to 103 mg/L for the Ultra-High F group, indicating that high- and ultra-high-fluoride waters are generally moderately to highly mineralized. pH values mainly range between 7.0 and 8.0; although intergroup differences are limited, median pH increases from Normal to High F and then to Ultra-High F, suggesting that ultra-high-fluoride waters tend to form under weakly to moderately alkaline conditions. Together, the patterns of Na+, Ca2+, HCO3/CO32−, TDS, and pH define a consistent geochemical signature of fluoride-rich groundwater: elevated Na+ and HCO3/CO32−, reduced Ca2+, moderately high TDS, and weakly alkaline pH—conditions favorable for F release and accumulation [36,37,38,39,40].

4.1.2. Hydrochemical Facies and Their Relationship with Fluoride

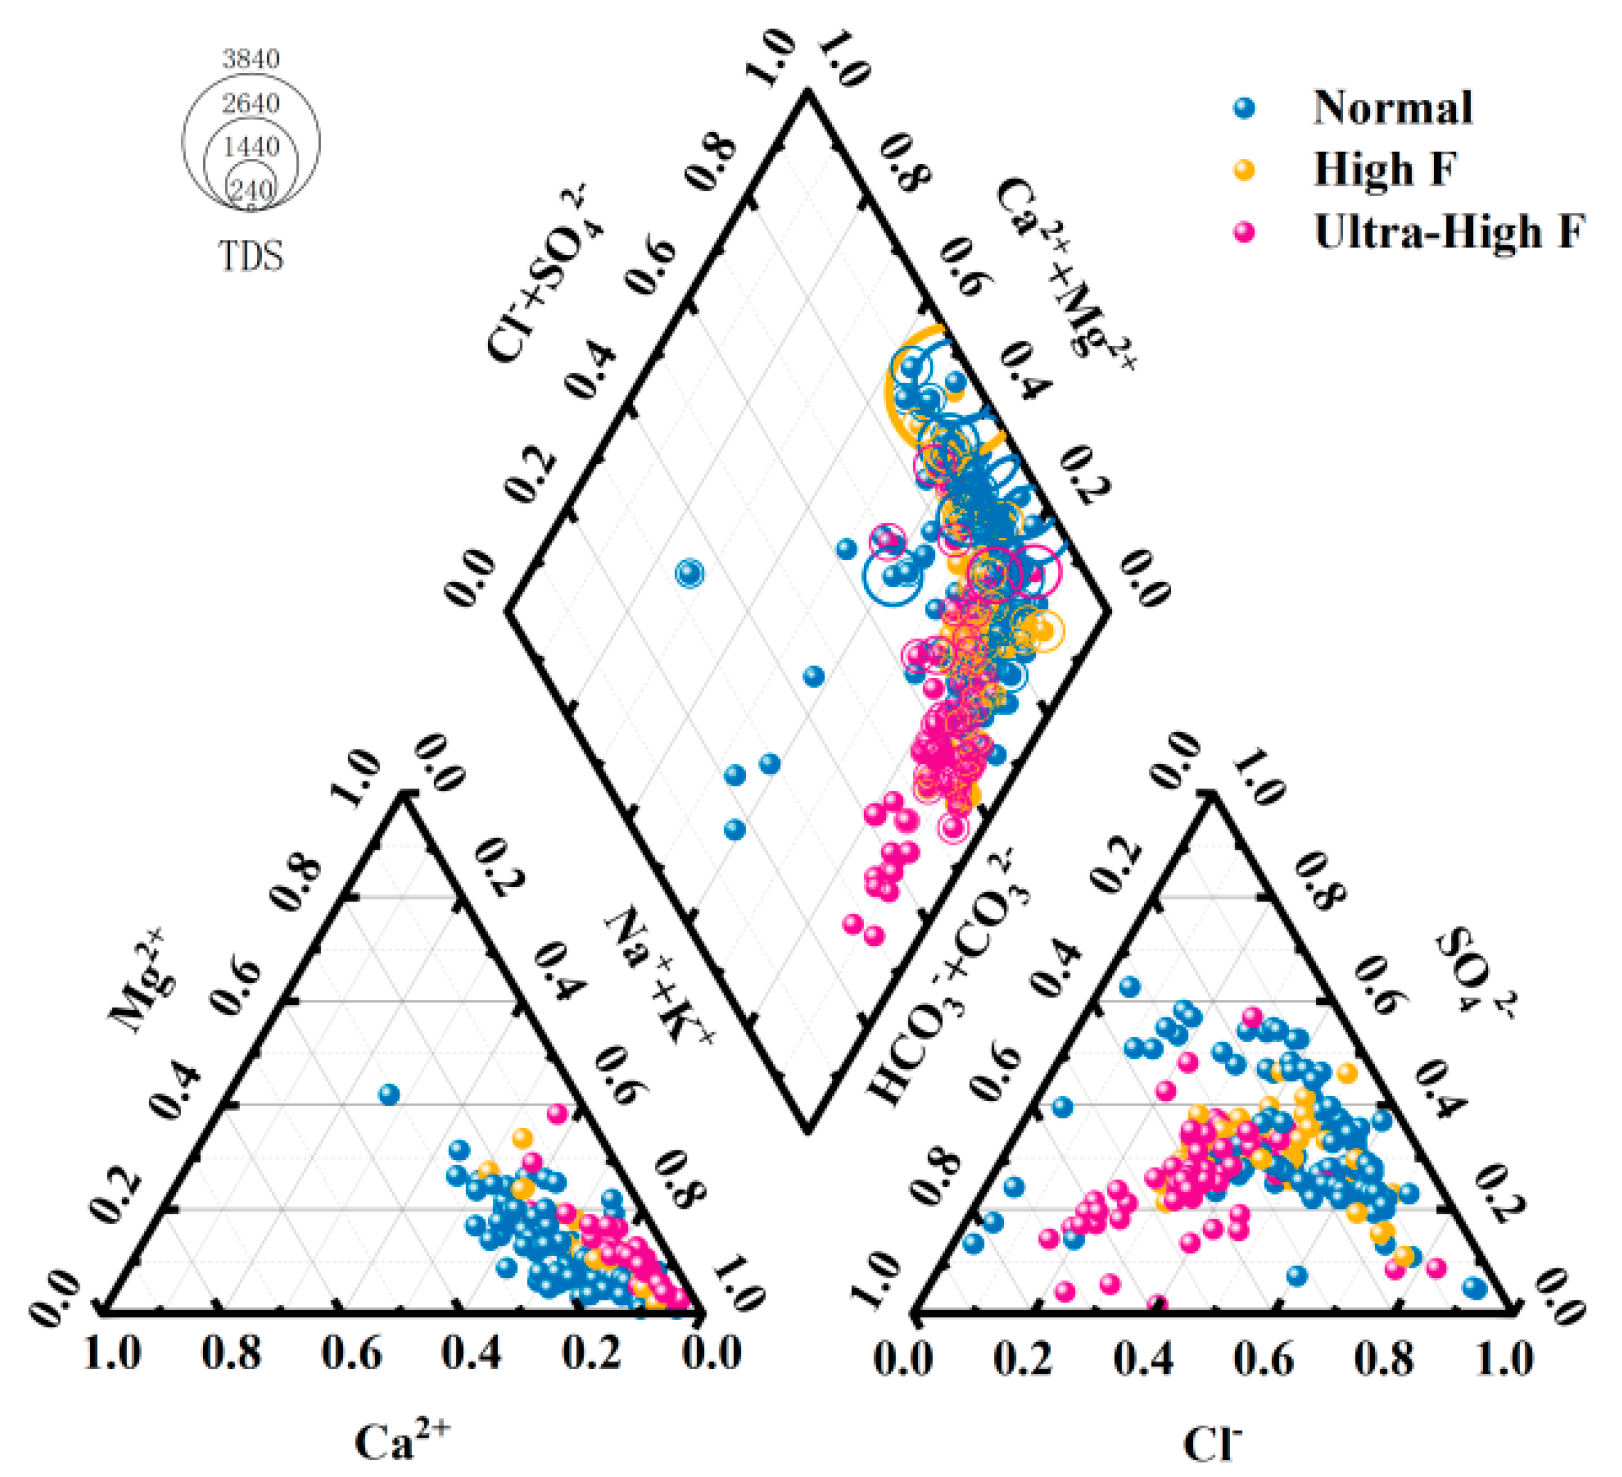
The Piper diagram (Figure 3) further illustrates hydrochemical facies and evolutionary trends among the fluoride groups based on equivalent percentages. The Normal group is mainly characterized by HCO3Ca·Mg waters and transitional types trending toward HCO3Na. High F samples cluster toward HCO3Na and HCO3·ClNa facies. Ultra-High F samples are tightly grouped within Na–HCO3 or Na–(HCO3+Cl) waters with moderate-to-high mineralization; bubble sizes indicate that their TDS is generally higher than that of the Normal group. In the cation triangle, Normal samples form a belt-like distribution extending from the Ca2+ apex toward the (Na ++K +) apex, retaining substantial Ca·Mg contributions. High F samples shift closer to the (Na ++K +) apex, with equivalent fractions commonly exceeding 0.6. Ultra-High F samples plot almost entirely near the (Na++K+) apex, with fractions often above 0.8, indicating that increasing fluoride levels are associated with a pronounced shift in the cation framework from Ca·Mg-type toward Na-type waters.
In the anion triangle, samples largely fall between the Cl and HCO3 apices, with relatively low SO42− proportions. Some Normal samples trend toward the Cl apex, with Cl fractions often greater than 0.5, representing Cl-dominant or Cl–HCO3 mixed waters. High F and Ultra-High F samples converge progressively toward the HCO3 apex, with HCO3 fractions mainly in the range of 0.4–0.7, indicating that the anion framework of fluoride-rich waters is more strongly governed by bicarbonate [41,42,43,44,45,46,47,48,49].

4.2. Groundwater Pollution Identification Model

Based on the hydrochemical results, a machine learning model was applied to quantitatively fit groundwater F concentrations, with the aim of identifying key controls on high- and ultra-high-fluoride waters and clarifying their evolution pathway. Samples were grouped into Background (F ≤ 1.0 mg/L), High F (1.0–1.5 mg/L), and Ultra-High F (F ≥ 1.5 mg/L). After CBE screening (±10%), 258 valid samples were retained, including 137 Background, 57 High F, and 64 Ultra-High F samples.
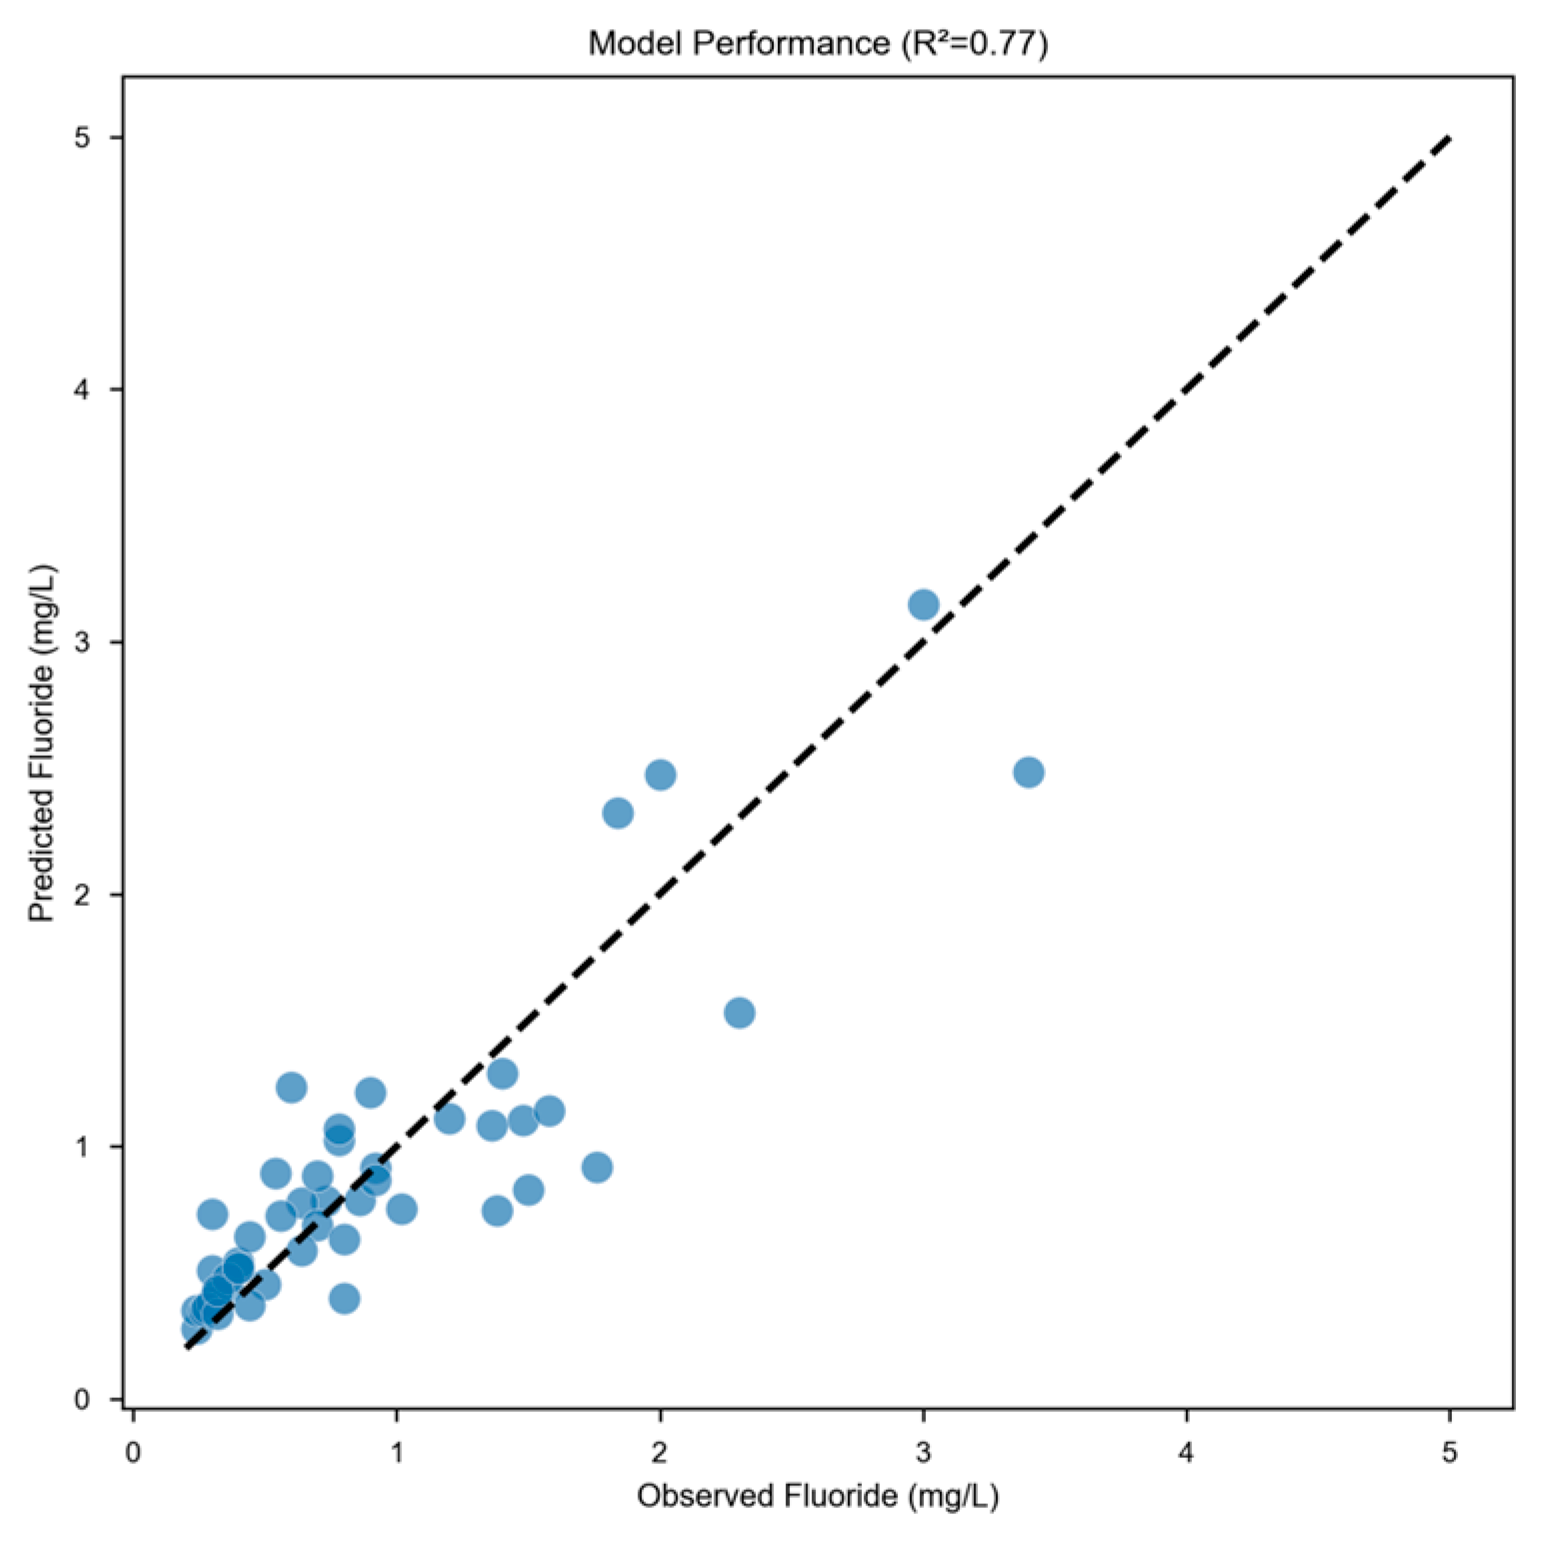
Model inputs consisted of well depth, temperature, TDS, pH, and eight major ions (Ca2+, Mg2+, K+, Na+, Cl, SO42−, HCO3, CO32−). F was treated as a continuous target variable and predicted using an attention-weighted feed-forward neural network (HydroAttentionNet). With an 80%/20% training–testing split, the model achieved an R2 value of 0.77 (Figure 4). Predicted concentrations closely align with the 1:1 line, with only small deviations at higher values, indicating a strong ability to capture nonlinear relationships between hydrochemical parameters and F and providing a reliable foundation for subsequent mechanistic interpretation.

4.2.1. Process Inference Constrained by the Ion-Ratio Matrix

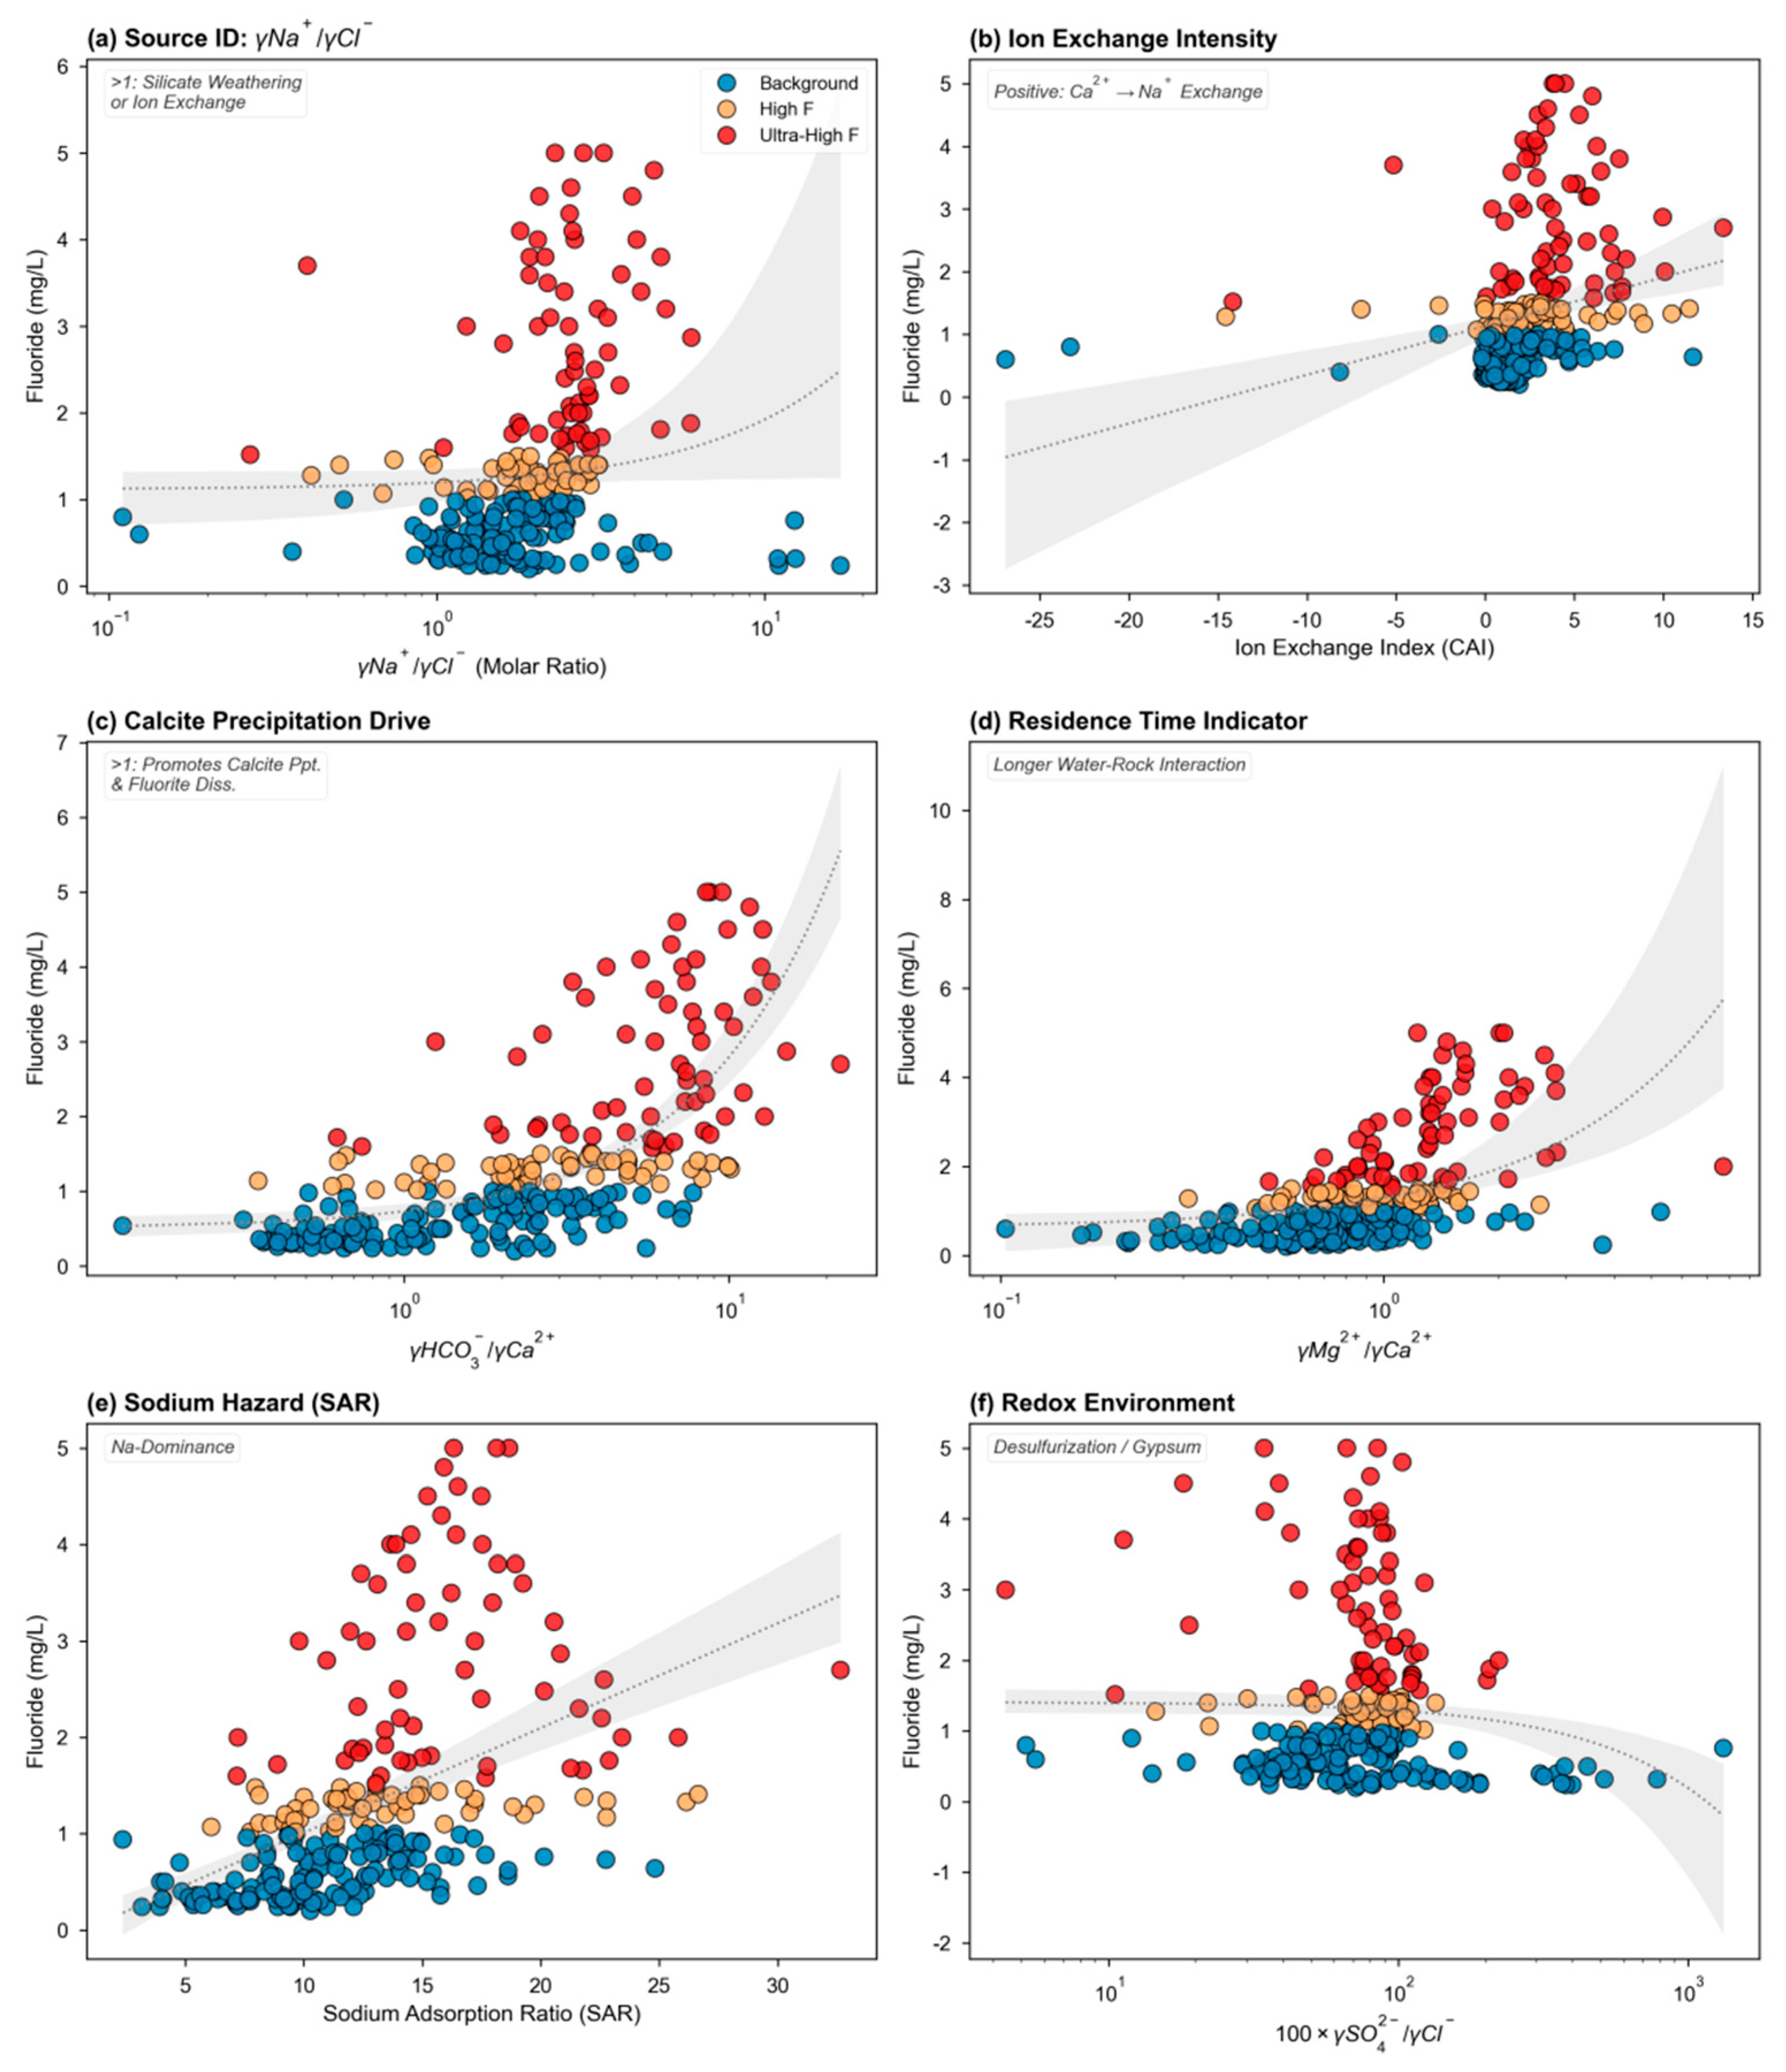
To link machine learning outputs with classical hydrochemical diagnostics, an “ion-ratio matrix” was constructed (Figure 5), with F on the y-axis and selected ion ratios on the x-axis, representing potential fluoride sources, cation exchange strength, alkalinity–Ca balance, residence time, Na dominance, and redox conditions. The activity ratio γNa+/γCl was used to indicate Na sources. Median γNa+/γCl values increase from 1.60 in the Background group (median F = 0.54 mg/L) to 1.99 in the High F group (median F = 1.30 mg/L) and 2.63 in the Ultra-High F group (median F = 2.70 mg/L). As shown in Figure 5a, samples with γNa+/γCl close to 1 are largely background waters, whereas those with γNa+/γCl > 2 are dominated by high- and ultra-high-fluoride waters. This pattern indicates that F enrichment is closely associated with additional Na inputs derived mainly from silicate weathering or Na–Ca exchange, rather than simple halide dissolution [50,51,52,53,54].
The cation exchange index (Index_Exchange) quantitatively describes the direction and intensity of Na–Ca exchange. Median values rise from 2.12 in the Background group to 4.28 in the High F group and 7.47 in the Ultra-High F group, and F shows a positive relationship with the index (Figure 5b). Background waters dominate when Index_Exchange < 0, whereas High F and Ultra-High F waters are common when the index exceeds 5, indicating that strong Na–Ca exchange is a major process promoting fluoride-rich conditions, consistent with the Ca2+ depletion and Na+ enrichment described in Section 4.1.
For the alkalinity–Ca balance and fluorite dissolution or precipitation potential (Figure 5c), the ratio γ(HCO3+CO32−)/γCa2+ (Ratio_Alk_Ca) reflects the extent to which the carbonate system consumes Ca2+. Median Ratio_Alk_Ca values increase from 2.60 in the Background group to 5.21 in the High F group and 14.56 in the Ultra-High F group, accompanied by an increase in median HCO3 from 102.5 to 150.1 and 286.8 mg/L and a decrease in median Ca2+ from 27.3 to 17.6 and 13.2 mg/L. When the ratio is <5, F is mostly <1 mg/L; once the ratio exceeds ~10, F rises stepwise to ~4–5 mg/L. This suggests that, under sustained carbonate dissolution and reprecipitation, particularly calcite precipitation, Ca2+ is continuously removed, and together with cation exchange, the potential for CaF2 precipitation is reduced, creating thermodynamic conditions favorable for fluorite dissolution and F accumulation.
The activity ratio γMg2+/γCa2+ (Ratio_Mg_Ca) is commonly used to reflect the duration and intensity of water–rock interaction. Median values increase from 0.71 in the Background group to 0.95 in the High F group and 1.33 in the Ultra-High F group; high- and ultra-high-fluoride samples mainly occur at γMg2+/γCa2+ > 1, implying longer residence times and more extensive carbonate and dolomite weathering, consistent with enrichment in deeper aquifers.
Na dominance (SAR) and redox-related proxies (Figure 5e,f) are represented by the sodium adsorption ratio (SAR) and 100 × γSO42−/γCl, respectively. When SAR exceeds 15, the proportion of High F and Ultra-High F samples increases sharply, and F rises about linearly with SAR, highlighting an amplifying effect of strongly Na-dominant conditions. Ultra-High F samples cluster mainly within intermediate 100×γSO42−/γCl values, suggesting that partial sulfate reduction or gypsum dissolution under reducing conditions may lower sulfate levels and indirectly enhance dissolution within the carbonate–fluorite system, thereby promoting F accumulation [55,56,57,58,59,60,61].
In summary, Figure 5 shows that, during the evolution from Background to High F and then to Ultra-High F waters, the main controlling processes include Na–Ca cation exchange, carbonate system-driven Ca removal coupled with HCO3/CO32− enrichment, prolonged water–rock interaction, and strongly Na-dominant hydrochemical conditions.

4.2.2. SHAP-Based Diagnosis of Dominant Drivers and Stage-Wise Transitions

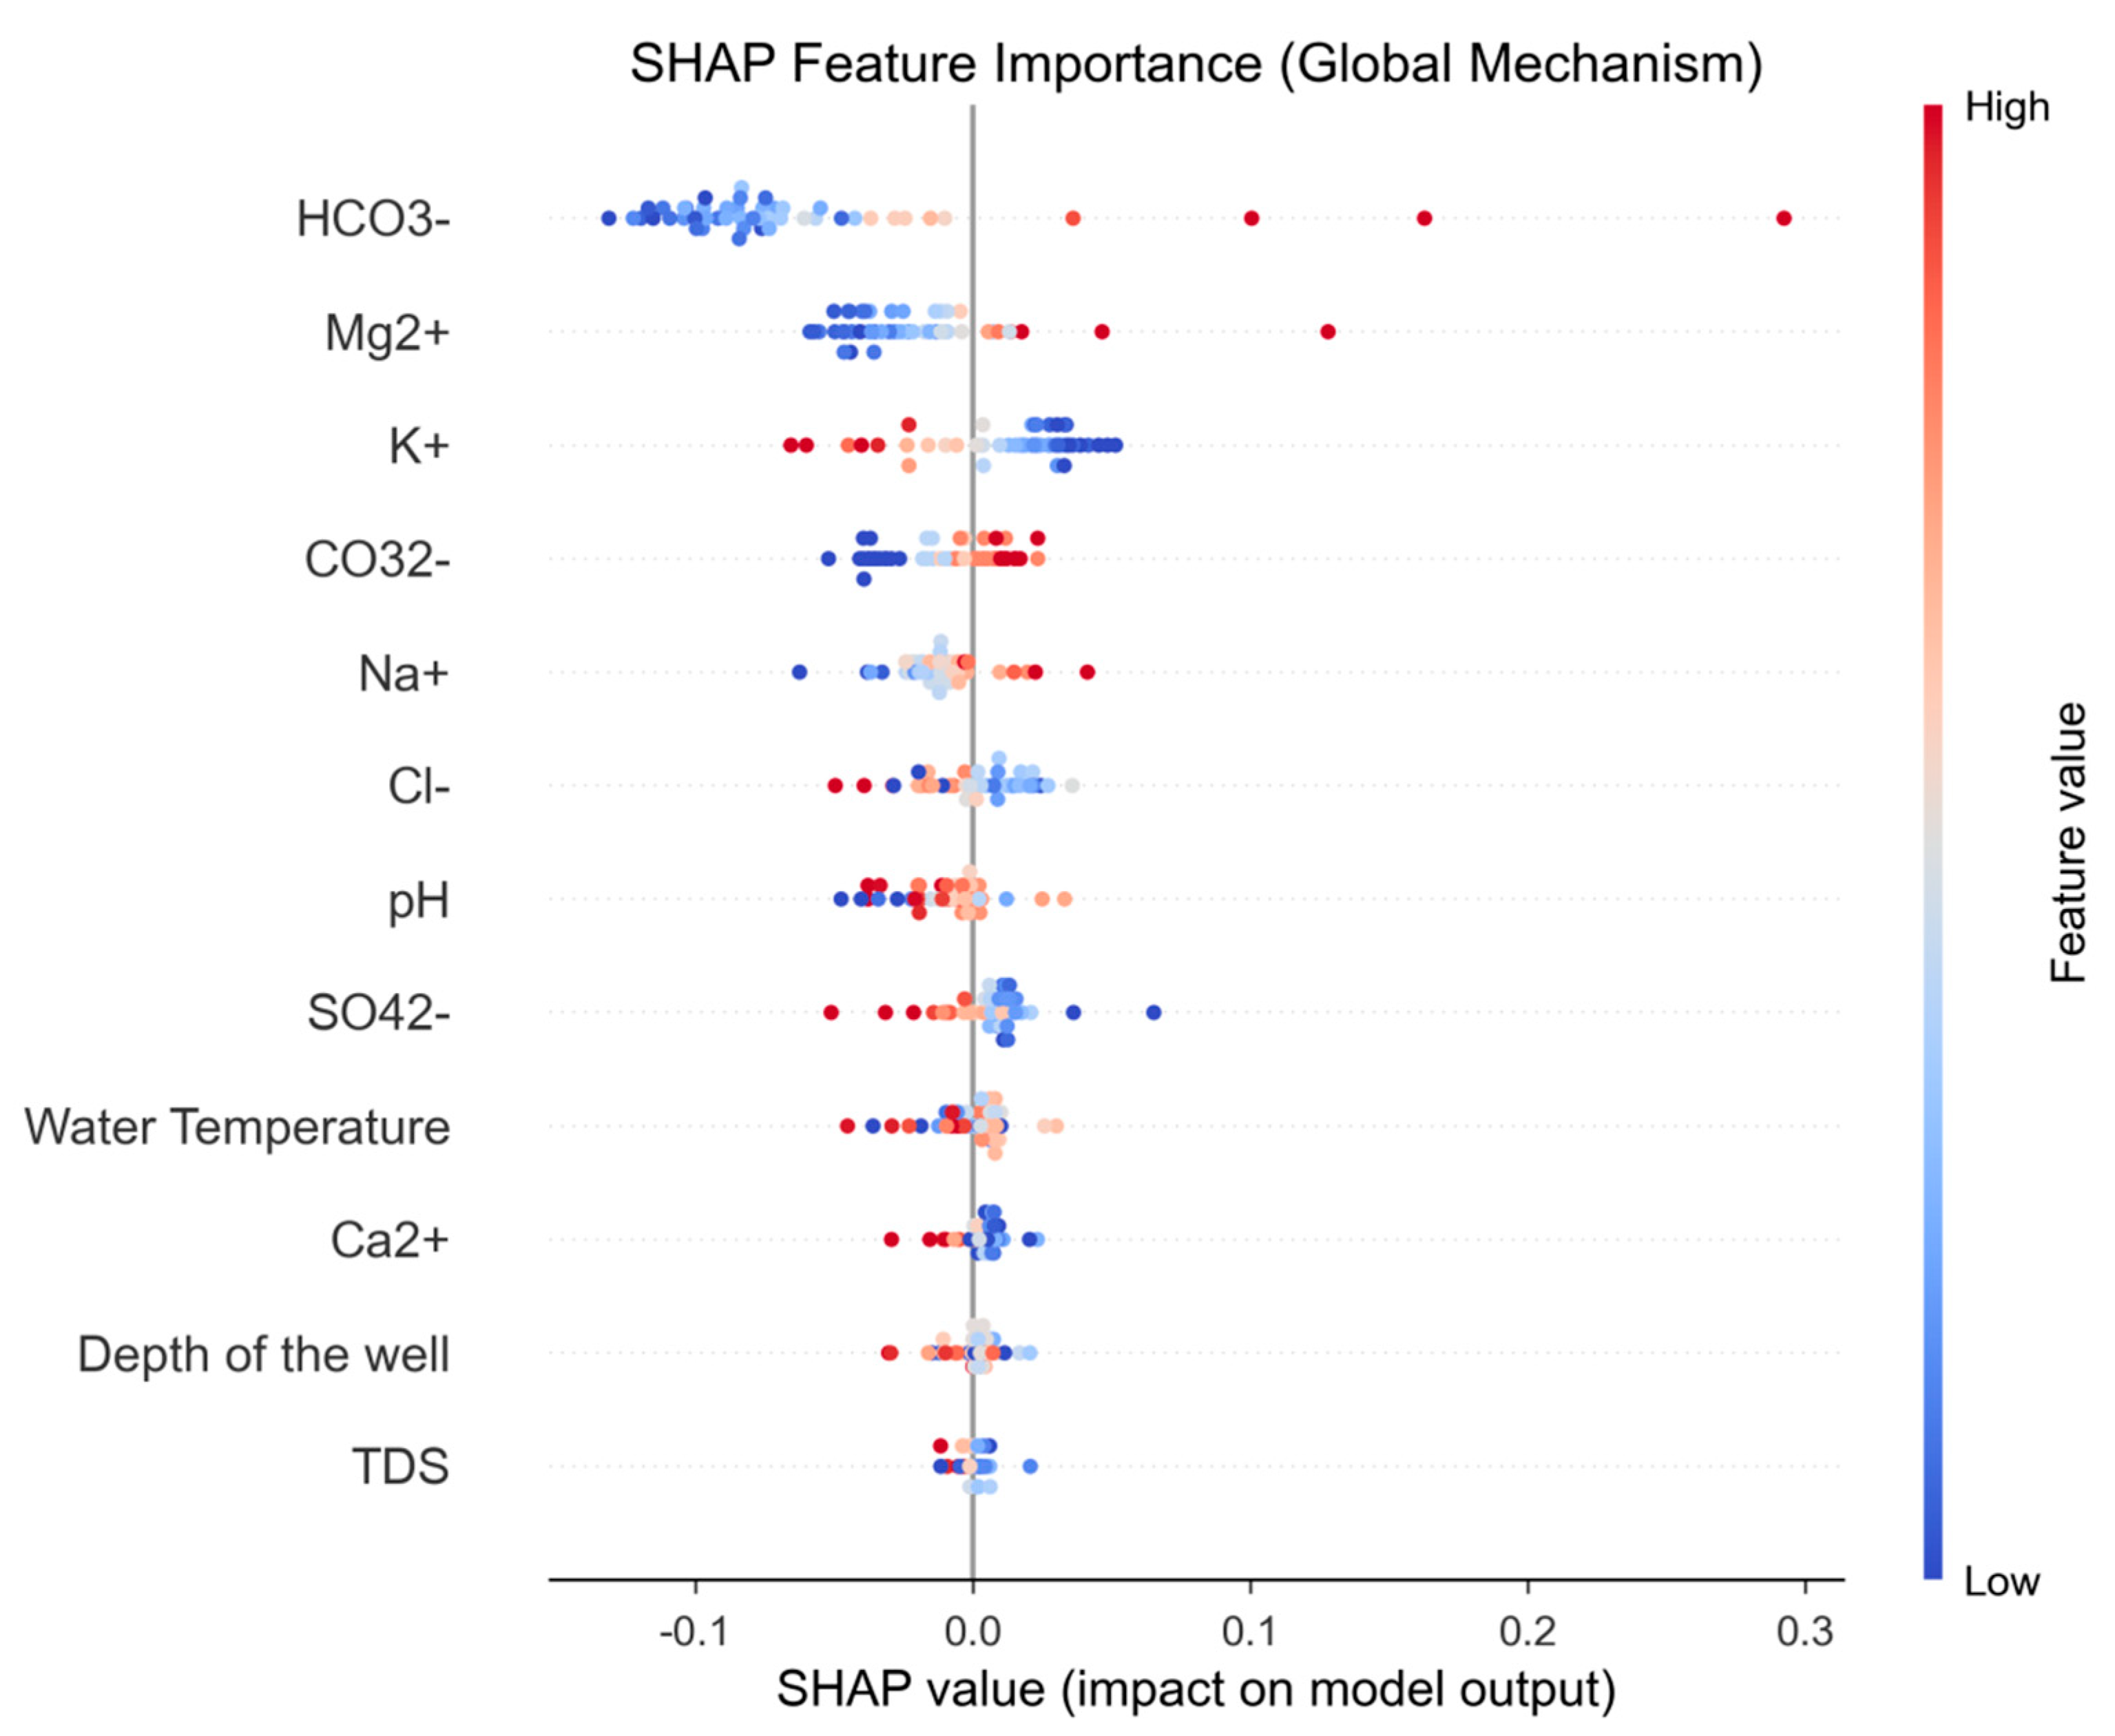
To quantitatively identify sensitive controls on F and determine dominant mechanisms across concentration stages, KernelSHAP was applied to interpret HydroAttentionNet at both global and group levels. The SHAP beeswarm plot (Figure 6) indicates that HCO3 has the highest mean absolute SHAP value and acts as the strongest positive contributor. CO32−, K+, Na+, and Cl also show positive contributions, whereas Ca2+ and Mg2+ contribute mainly negatively; the effects of pH, well depth, and temperature are relatively minor. These patterns are consistent with the ion-ratio matrix signature of high HCO3/CO32−, elevated Na+, low Ca2+, with the partial involvement of Cl.
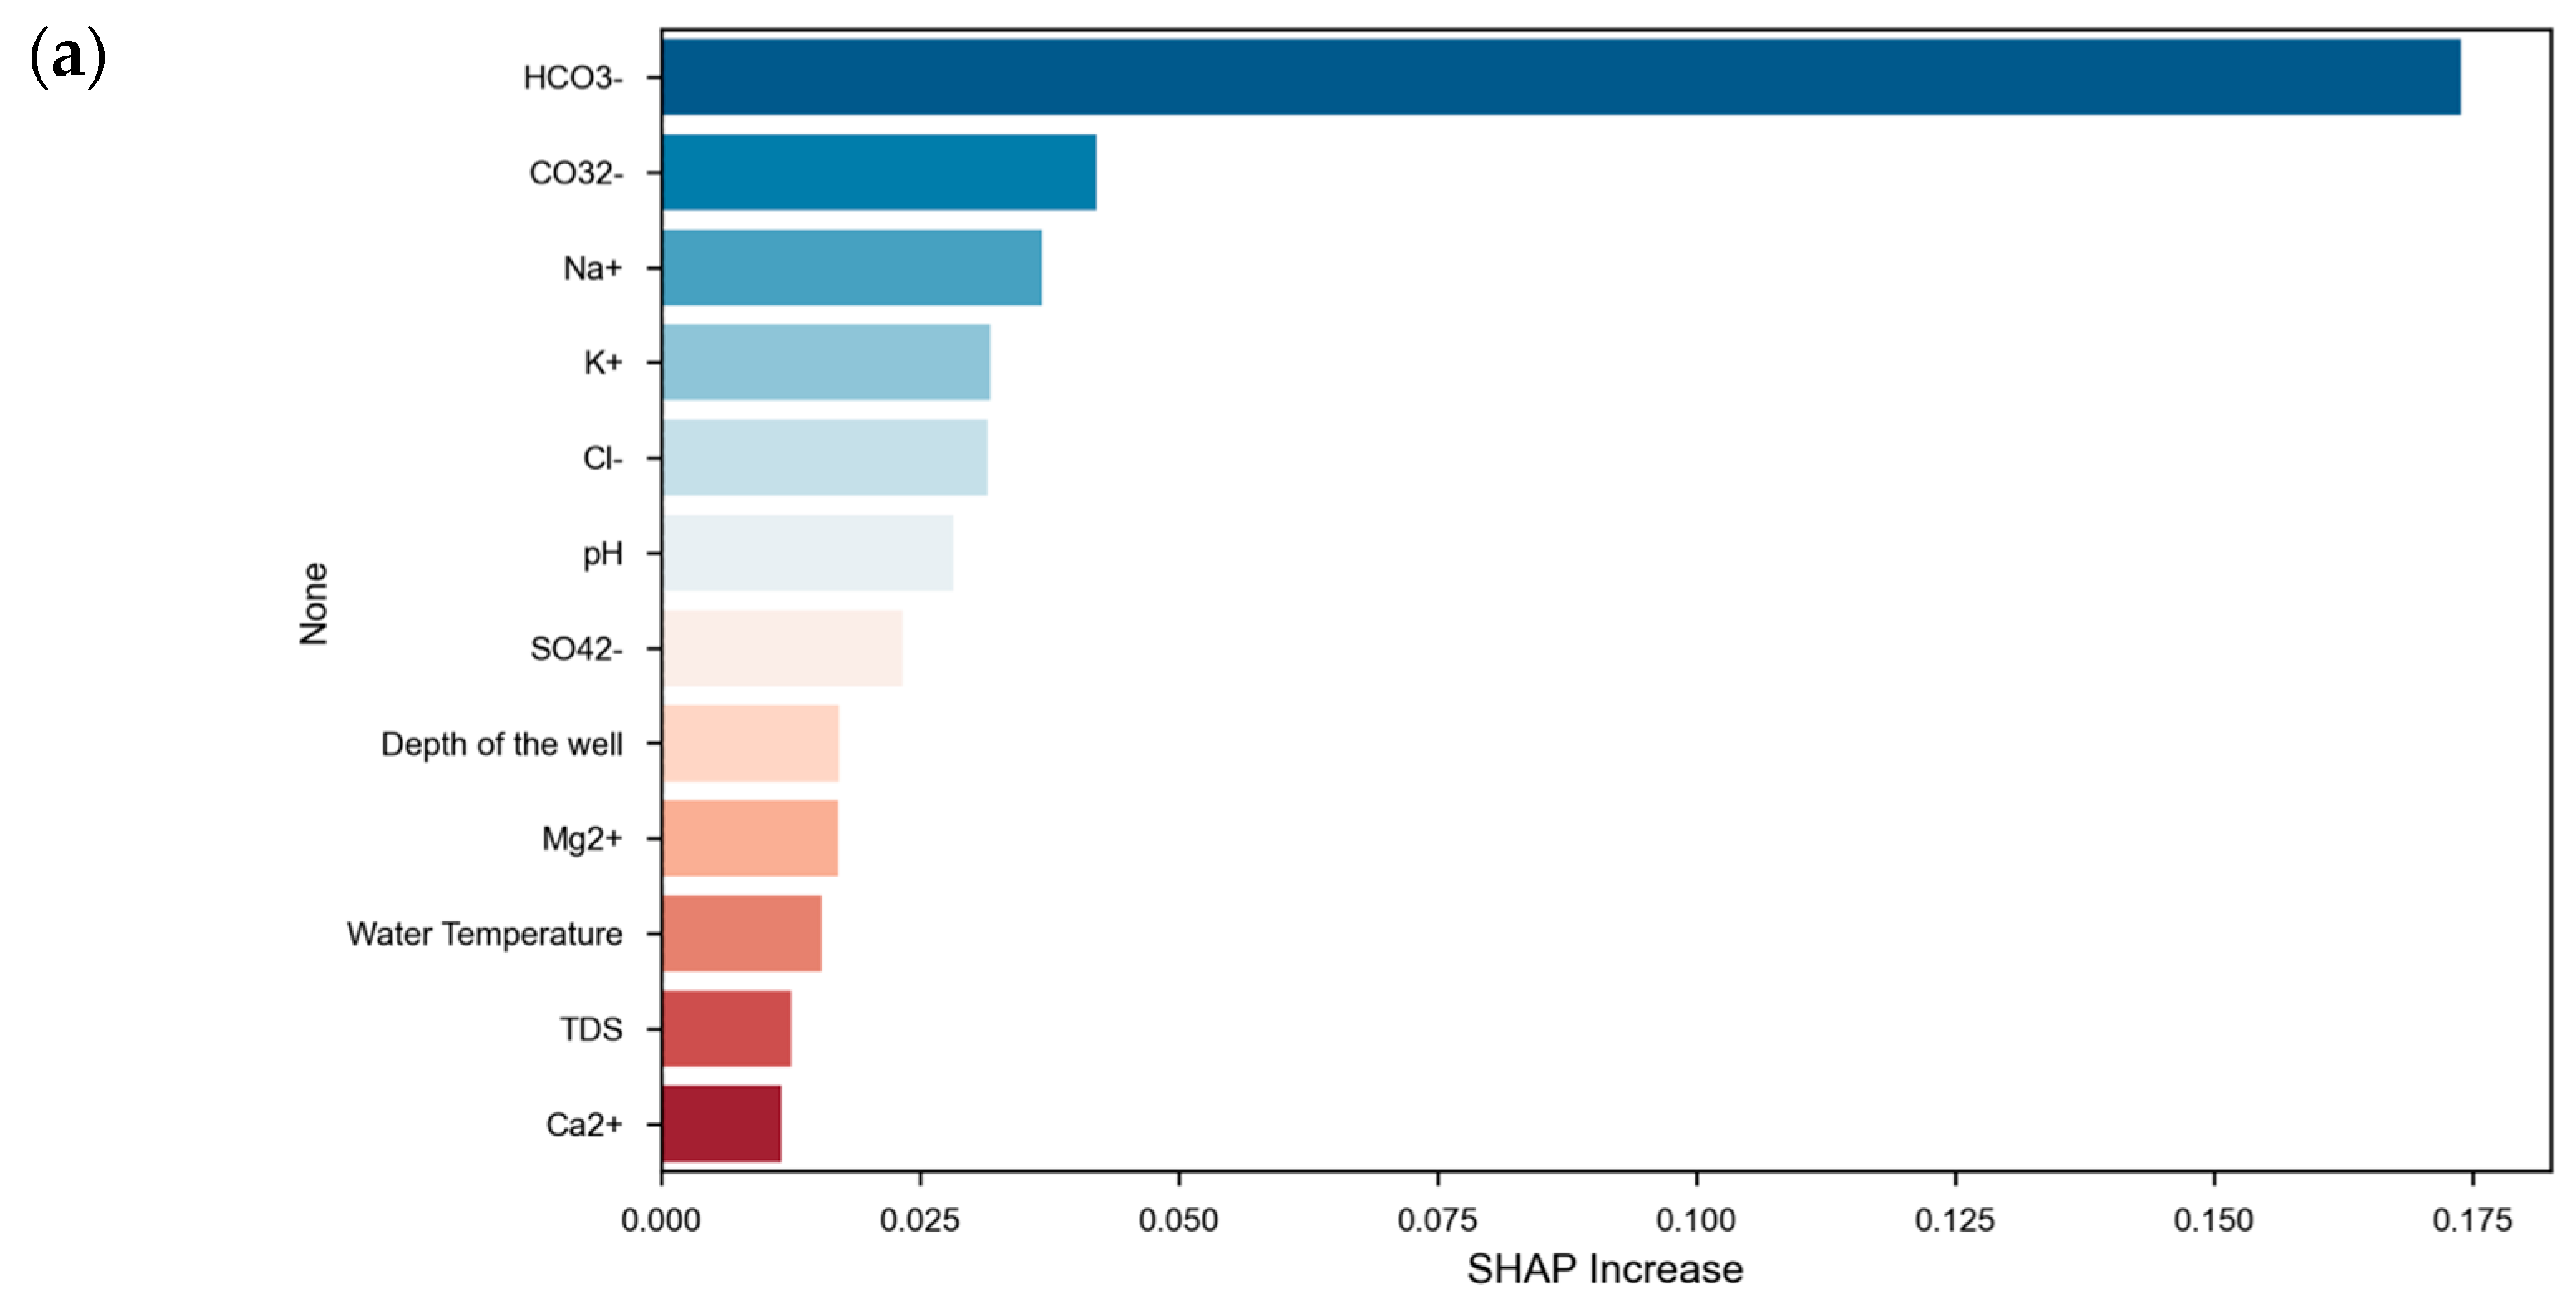
Stage-dependent differences in contributions were further examined (Figure 7). In Stage 1 (Background → High F), the SHAP increment of HCO3 is the largest, followed by K+, CO32–, Cl, and Mg2+. This indicates that the transition from safe background waters to high-fluoride waters is mainly triggered by increasing alkalinity, together with moderate enrichment in K+ and Cl, the latter possibly linked to irrigation return flow or localized anthropogenic inputs, while Na–Ca exchange is still in an early strengthening stage, as reflected by small increments in Ca2+ and Na+.
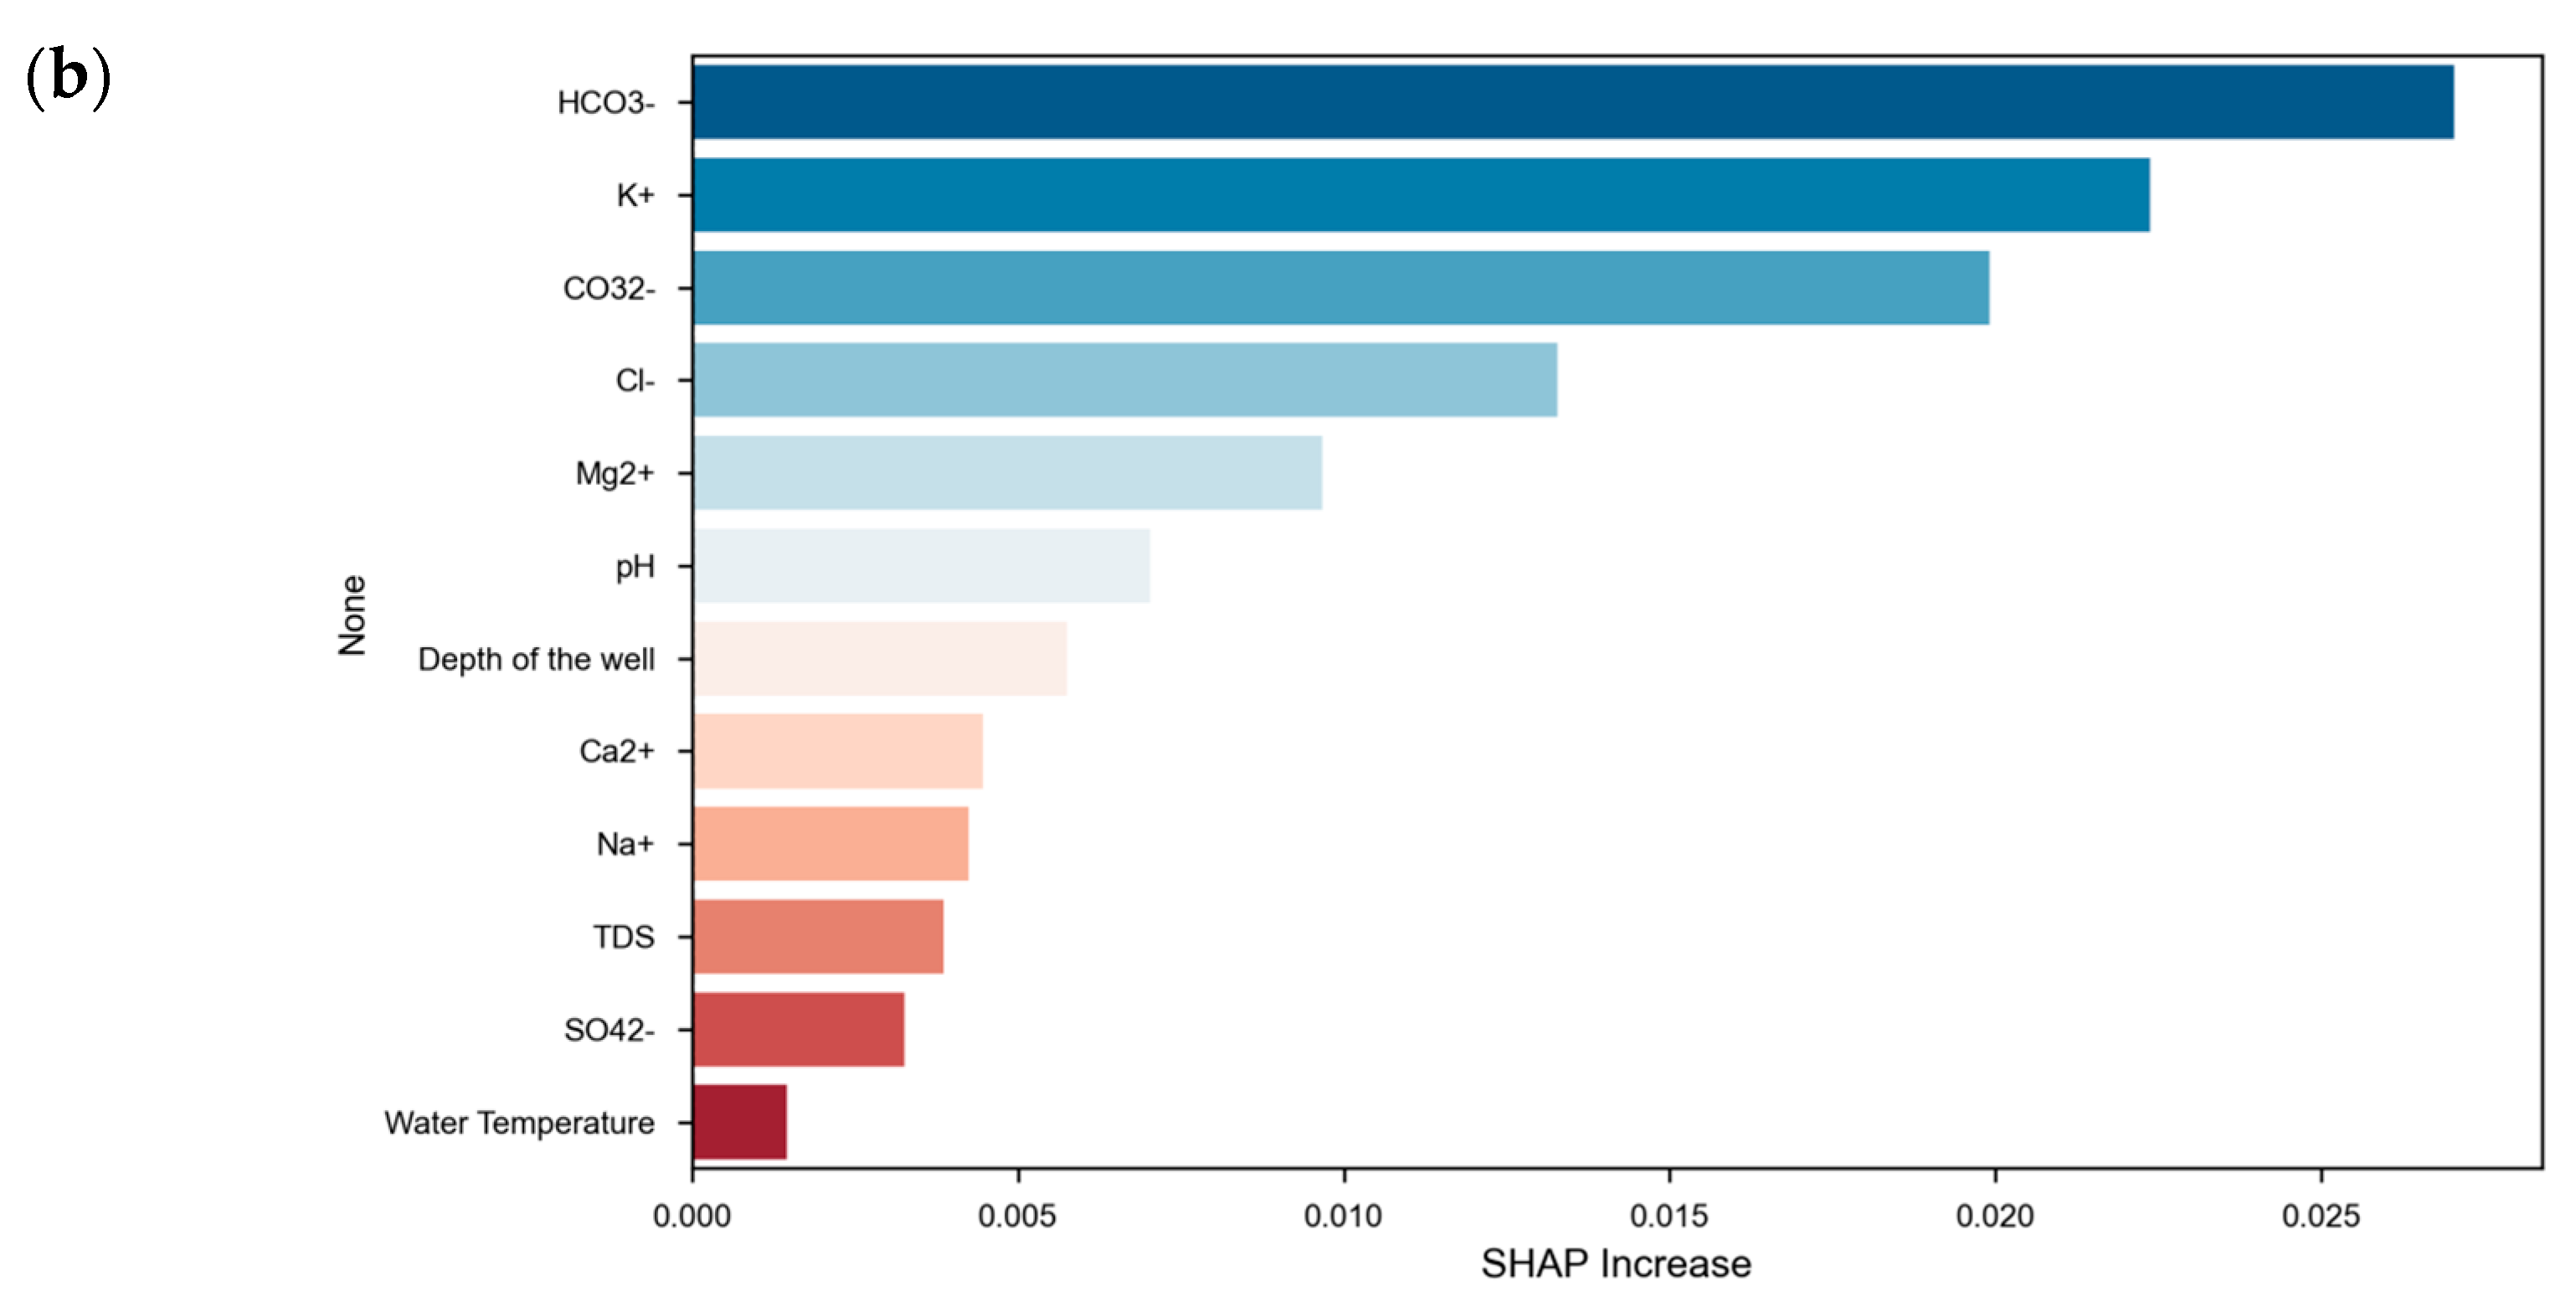
In Stage 2 (Background → Ultra-High F), the SHAP increment of HCO3 greatly exceeds that of all other variables, followed by CO32− and Na+; K+, Cl, pH, and SO42− also exhibit positive contributions (Figure 7b). These patterns suggest that the amplification mechanism leading to ultra-high fluoride involves extreme alkalinization of the carbonate system, marked by strong increases in HCO3/CO32−, together with pronounced Na enrichment, whereas Ca2+ and Mg2+ show near-zero or slightly negative increments. This implies near-complete depletion of Ca–Mg and a shift toward an extreme high-F, low-Ca2+ end-member within the fluorite dissolution–precipitation system [62,63,64,65,66,67,68,69].
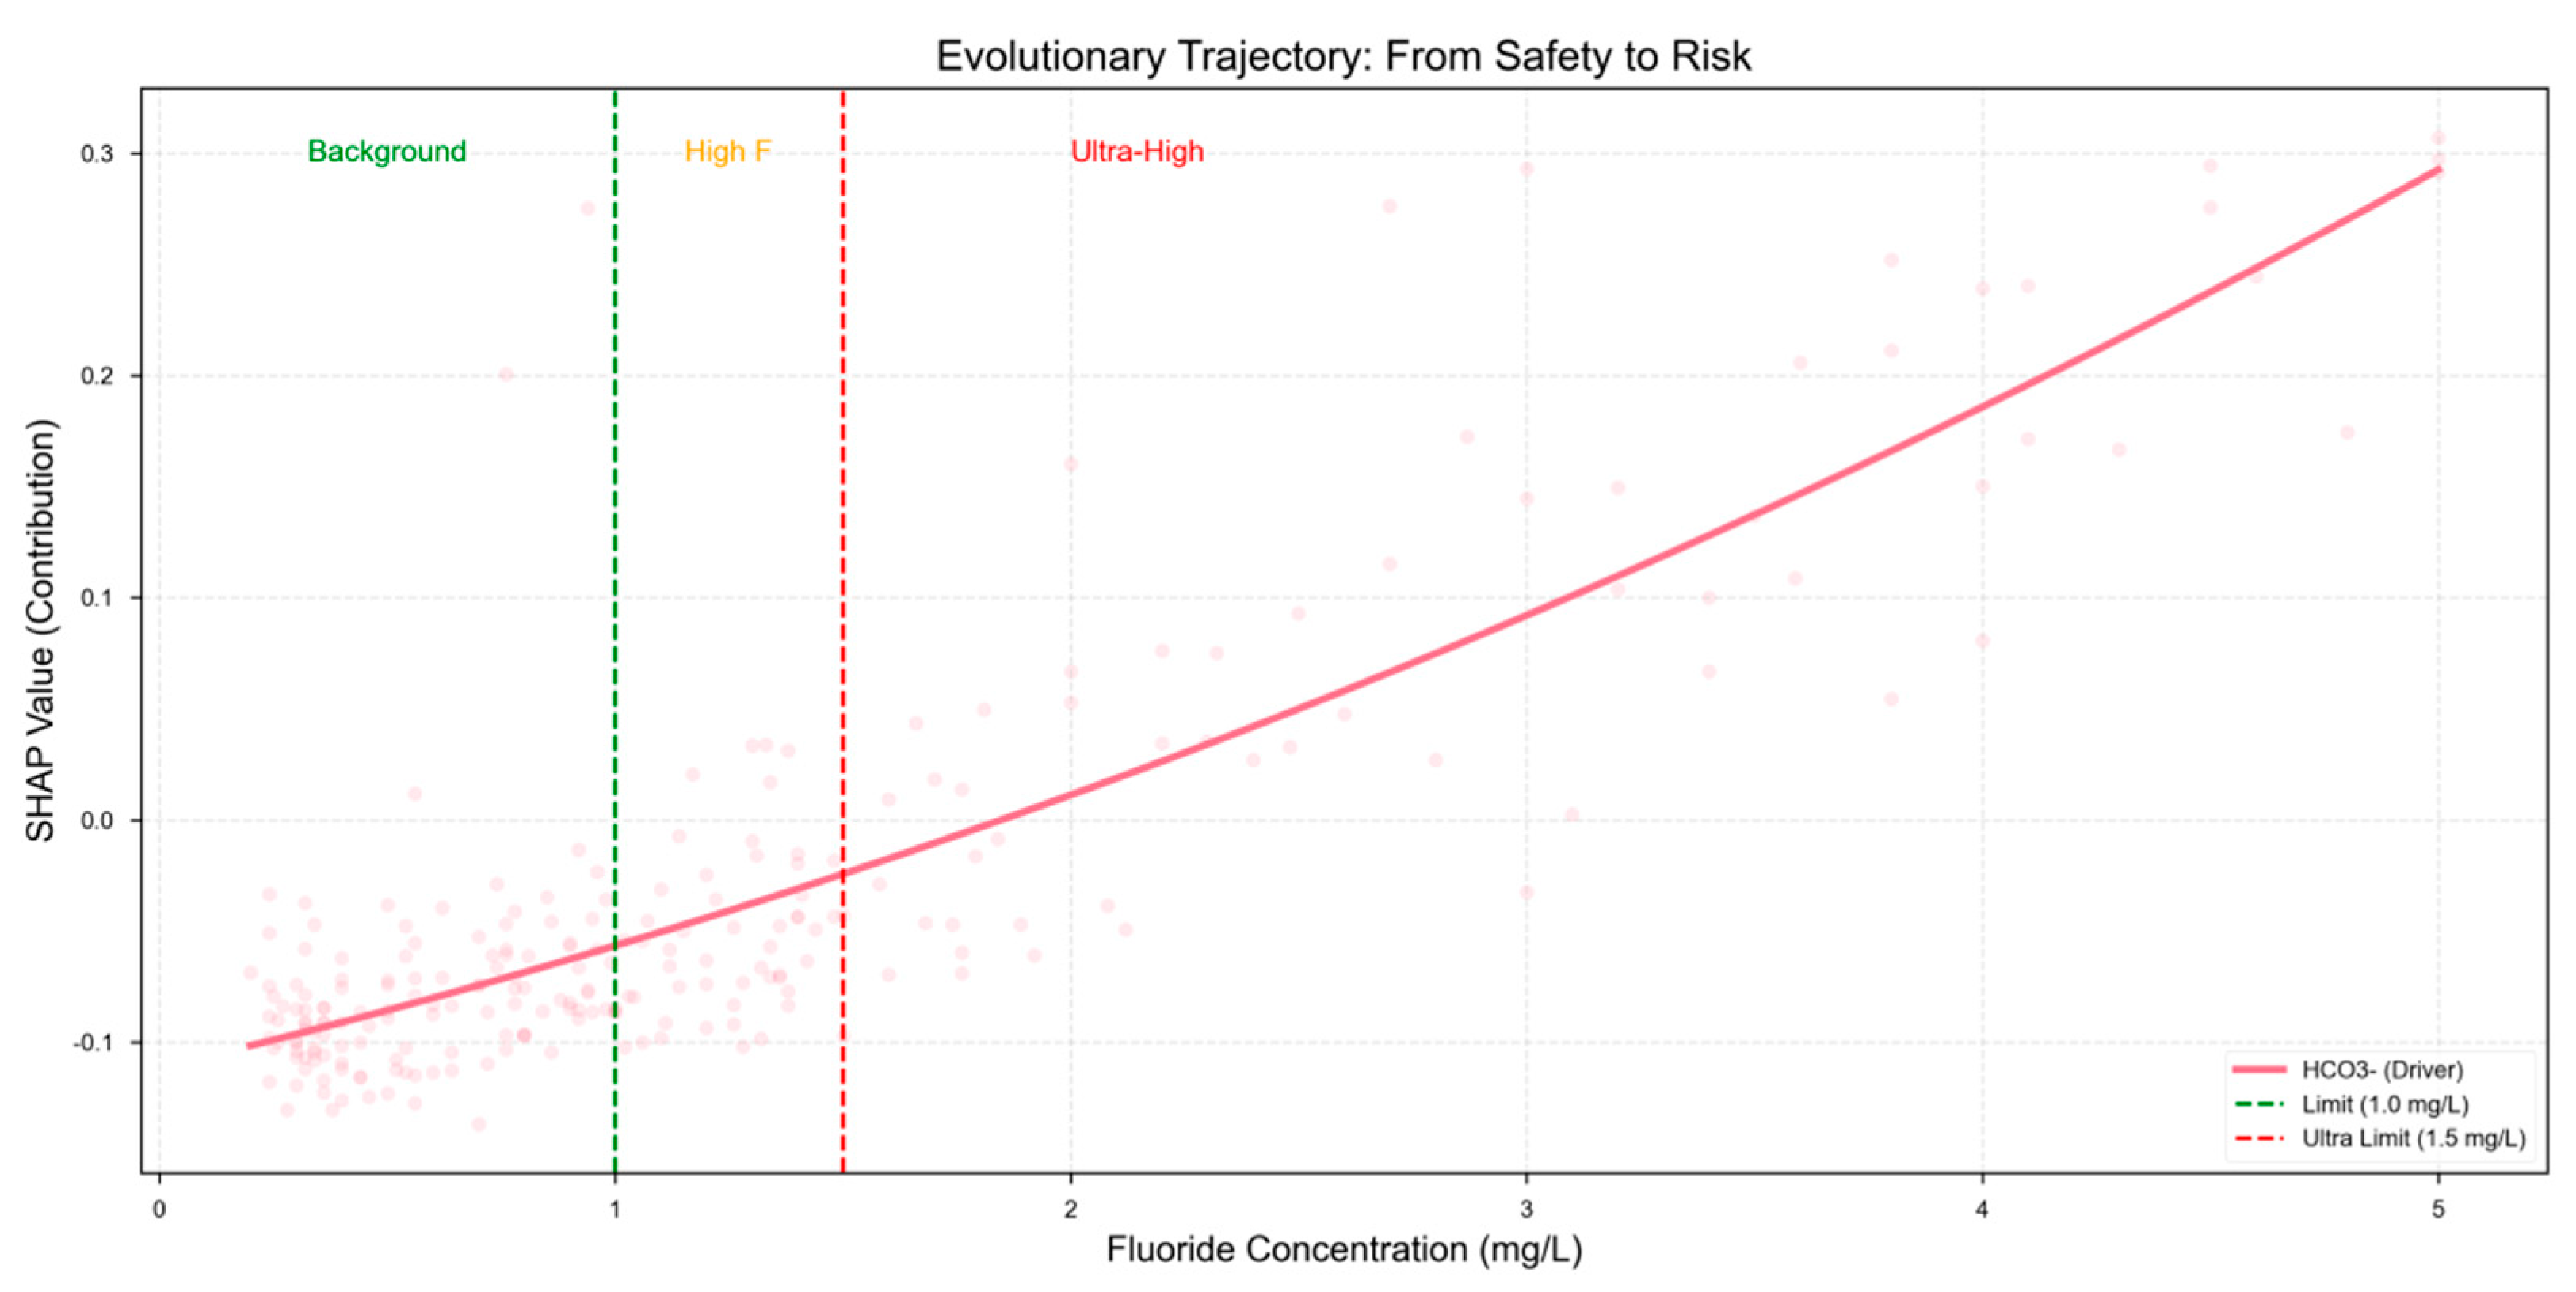
Figure 8 presents the “evolutionary trajectory” of SHAP values using HCO3 as an illustrative example. When F < 1.0 mg/L (Background), SHAP values of HCO3 are mostly negative or close to zero. As F increases to 1.0–1.5 mg/L (High F), SHAP values become weakly positive. Once F ≥ 1.5 mg/L (Ultra-High F), SHAP values rise sharply with increasing F, revealing a clear threshold behavior: only after bicarbonate concentration, and its dominance relative to Ca2+, surpass a critical level does HCO3 shift from a background parameter to a dominant driver that initiates rapid fluoride accumulation.

4.3. Genesis of High-Fluoride Groundwater

4.3.1. Mineral Dissolution and Precipitation

To elucidate the formation mechanisms of deep high-fluoride groundwater at the process scale, saturation indices (SIs) of key minerals were calculated using PHREEQC. Together with carbonate system equilibria and cation exchange, these results were used to construct a thermodynamic framework describing the coupled “salinization–decalcification–fluoridation” mechanism (Figure 8). The initial waters (Sheet 1) are generally weakly alkaline to alkaline (pH = 6.95–9.63; median 8.23), with low concentrations of divalent cations (Ca2+, Mg2+) and strong enrichment of Na+ and Cl (median 194 and 156 mg/L, respectively), indicating a stable salinization background in the deep aquifer. At the same time, elevated dissolved inorganic carbon (DIC; median 31.4 mg/L) reflects a well-developed carbonate buffering system. Fluoride concentrations range from 0.20 to 5.01 mg/L (mean 1.30 mg/L), and 48.5% of samples exceed 1.0 mg/L, consistent with a typical high-fluoride groundwater system.
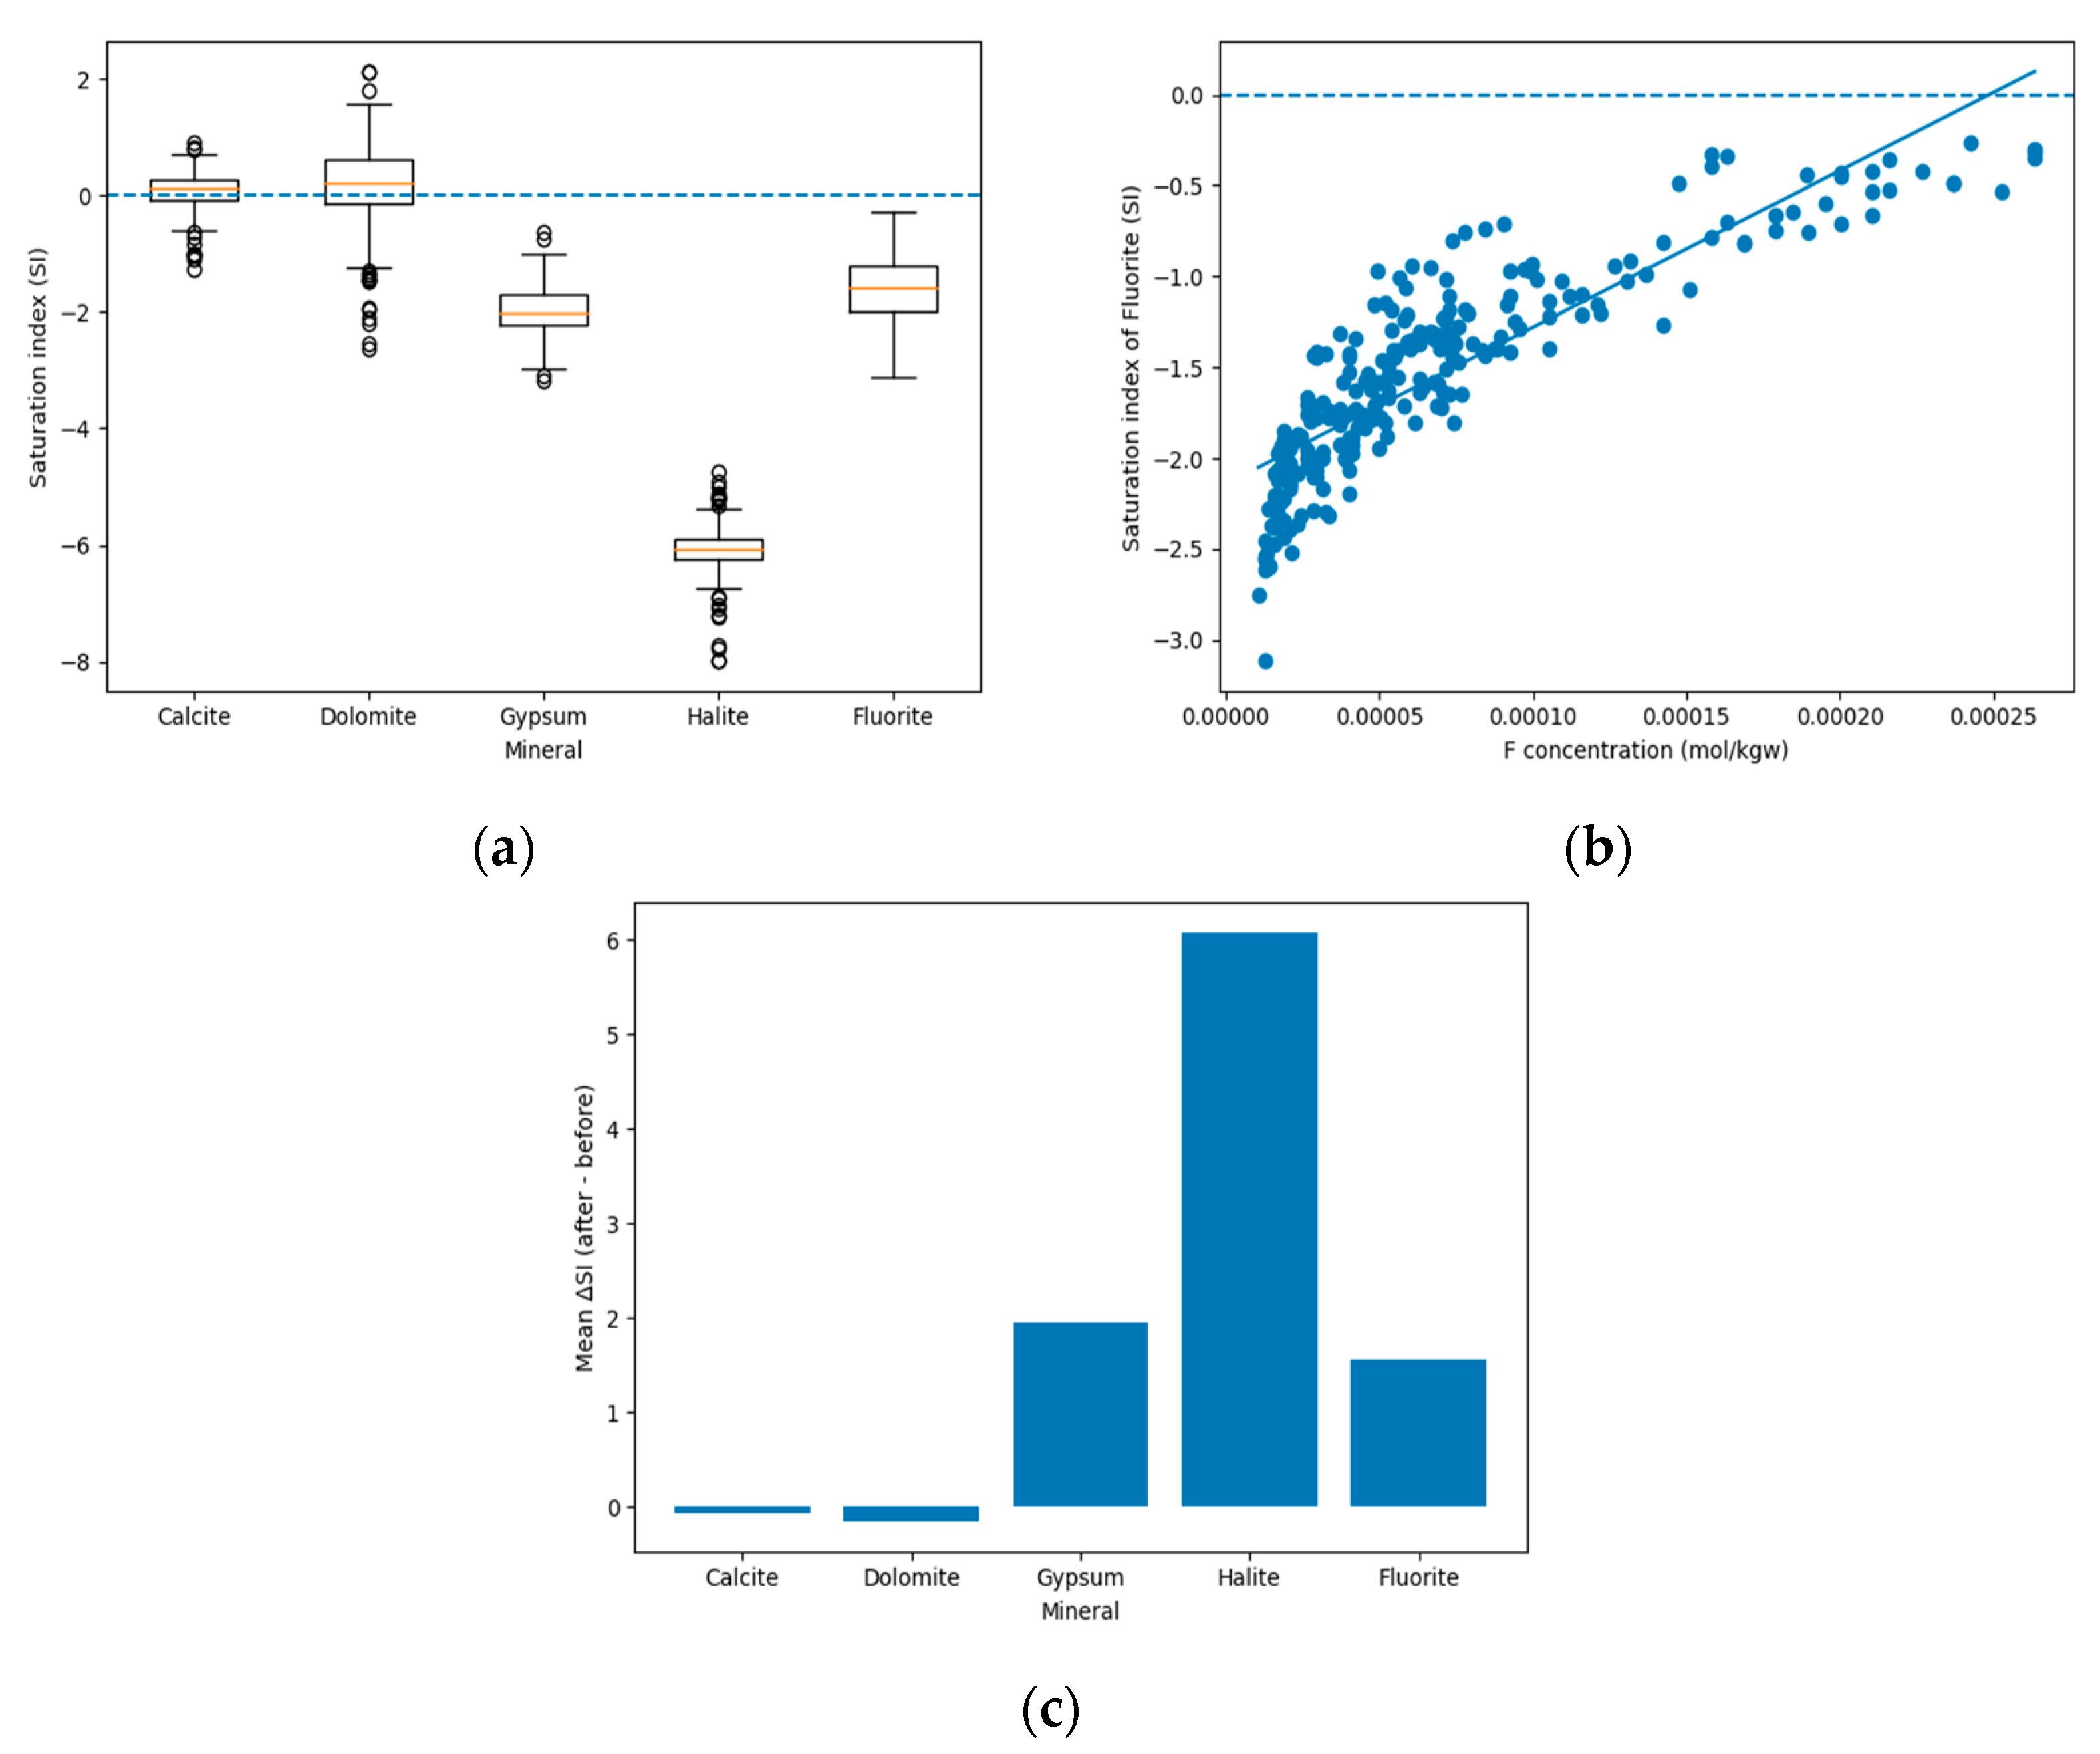
As shown in Figure 9a, evaporite minerals are strongly undersaturated in all samples. Gypsum SI values range from −3.172 to −0.637 (median −2.008), while halite SI values range from −7.990 to −4.735 (median −6.077), indicating persistent thermodynamic driving forces for dissolution. The dominant reactions are as follows:
(R1) NaCl(s) -> Na+ + Cl
(R2) CaSO4·2H2O(s) -> Ca2+ + SO42− + 2H2O
These dissolution reactions not only directly supply Na–Cl salinity components and Ca–SO4 loads, but also markedly modify ion activity coefficients (ai = γimi) by increasing ionic strength. This ionic strength-driven “salt effect” shifts dissolution equilibria of F-bearing minerals and provides a hydrochemical background that explains the commonly observed increase in fluoride while fluorite remains undersaturated.
In contrast, carbonate minerals are generally close to saturation or slightly supersaturated (Figure 9a). Median SI values of calcite and dolomite are 0.135 and 0.225, respectively, and more than 66% of samples have SI > 0. This indicates substantial carbonate weathering along flow paths and suggests that the system is presently controlled mainly by precipitation–dissolution re-equilibration. Under alkaline, carbon-rich conditions, the key reactions can be expressed as follows:
(R3) CaMg(CO3)2(s) + 2CO2 + 2H2O -> Ca2+ + Mg2+ + 4HCO3
(R4) Ca2+ + CO32− -> CaCO3(s)
Here, calcite precipitation (R4) represents the critical “decalcification/Ca-locking” end-member, acting as an effective Ca sink. Even with continuous Ca2+ inputs from gypsum dissolution (R2) and dolomite weathering (R3), the tendency for carbonate precipitation can suppress Ca2+ activity a(Ca2+) at the system scale. This weakens the capacity of CaF2 precipitation to remove fluoride and therefore provides a thermodynamic basis for fluoride enrichment.
Carbonate speciation is jointly governed by pH and CO2 partial pressure:
(R5) CO2(aq) + H2O ⇌ H2CO3
(R6) H2CO3 ⇌ H+ + HCO3
(R7) HCO3 ⇌ H+ + CO32−
With increasing pH, equilibrium (R7) shifts to the right, increasing the proportion and activity of CO32− and thereby strengthening the driving force for CaCO3 precipitation (R4). This has direct implications for fluorite saturation. Based on the solubility–product relationship, IAP_fluorite = a(Ca2+)·a(F)2. When a(Ca2+) is persistently suppressed by carbonate precipitation, the equilibrium a(F) required to reach fluorite saturation increases passively.
(E1) IAP_fluorite = a(Ca2+) × a(F)2; SI_fluorite = log(IAP/Ksp)
This explains why SI_fluorite in Figure 9b approaches zero with increasing F but remains negative overall (Spearman ρ = 0.916, p ≪ 0.001), indicating a state that is approaching equilibrium but has not yet reached the precipitation threshold, thereby allowing continued fluoride accumulation.
In addition to carbonate precipitation, cation exchange within the aquifer matrix (R8) further reinforces the “decalcification” end-member:
(R8) 2Na-X + Ca2+ ⇌ Ca-X2 + 2Na+
When this reaction proceeds to the right, aqueous Ca2+ is adsorbed onto exchange sites while Na+ is released into the solution. This process acts synergistically with the Na–Cl background generated by halite dissolution (R1): elevated Na+ promotes the forward direction of (R8), further reducing a(Ca2+) without a corresponding increase in Cl. A generally negative chlor-alkali index (CAI-1/CAI-2) would provide independent evidence for Na+ excess relative to Cl and the dominance of forward cation exchange. Together with carbonate precipitation, this mechanism sustains persistently low Ca conditions and enhances fluoride retention in groundwater.
Fluorite remains consistently undersaturated in all samples (median SI_fluorite = −1.584), indicating widespread potential for dissolution:
(R9) CaF2(s) ⇌ Ca2+ + 2F
Under the combined constraints of reduced a(Ca2+) due to precipitation (R4) and exchange (R8), reverse precipitation of (R9) is inhibited, causing fluoride to remain predominantly in dissolved form. The ΔSI analysis shown in Figure 9c further clarifies the evolutionary direction: evaporites and fluorite require substantial positive adjustment (ΔSI > 0) to reach equilibrium, whereas carbonates require only minor adjustment. This pattern is fully consistent with the coupled process chain of “evaporite dissolution + carbonate precipitation (Ca sink) + fluorite dissolution (fluoride release)” [63,69,70,71,72,73,74,75,76,77,78].

4.3.2. Quantifying Mineral Contributions via Inverse Modeling: Stoichiometric Closure and Budget Partitioning

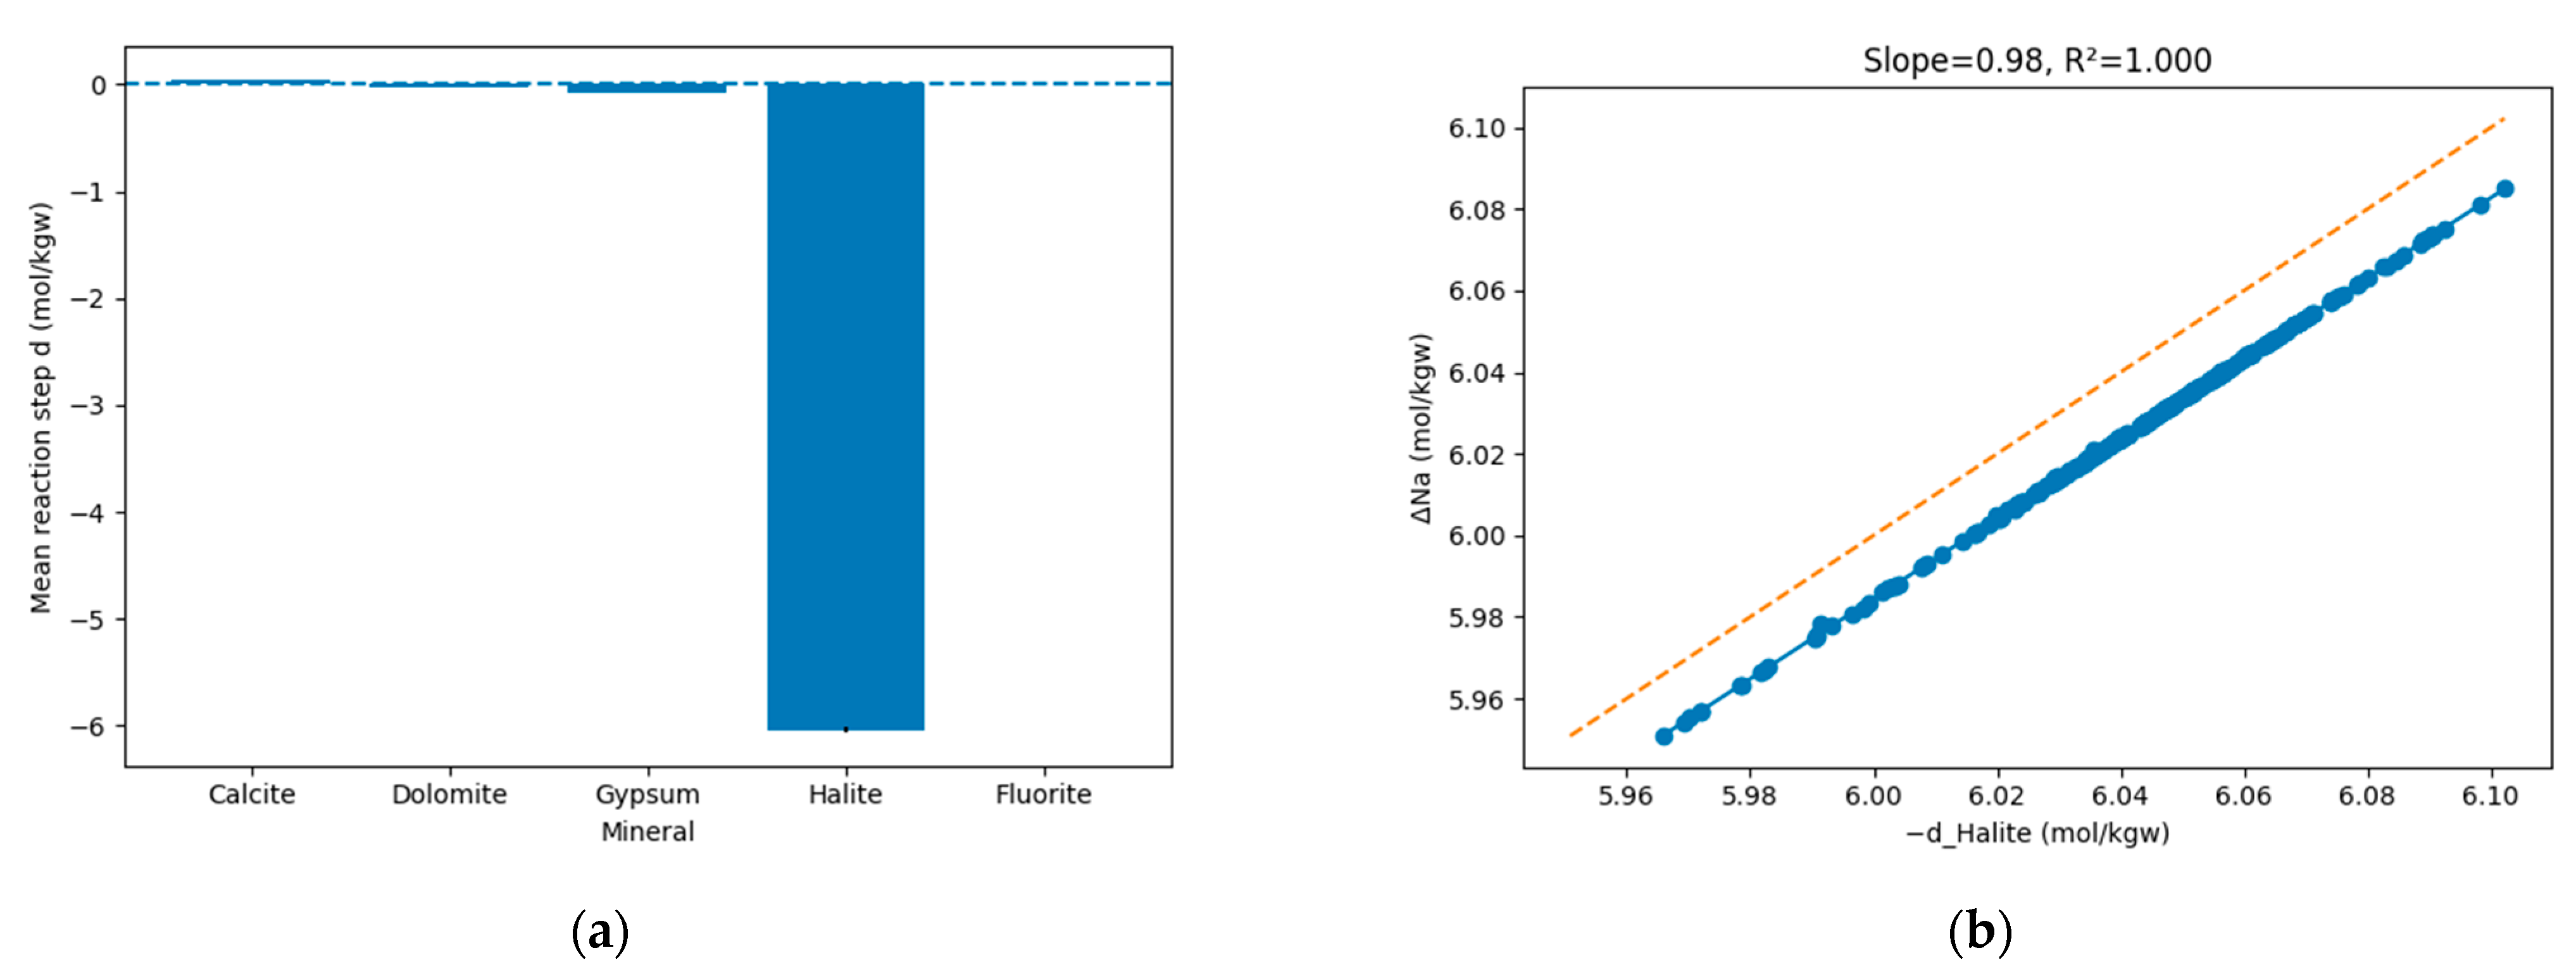
On this basis, PHREEQC inverse modeling was applied to reconstruct a mass-conserved evolution from initial waters (Sheet 1) to an equilibrium-constrained end-member (Sheet 2; assuming SI ≈ 0). The inversion incorporated Ca, Mg, Na, Cl, S(6), C(4), and F, and calculated net reaction fluxes (di, mol·kgw−1) for mineral phases including halite, gypsum, dolomite, calcite, and fluorite. This allowed quantitative partitioning of solute sources and fluoride loading (Figure 10). The inversion results indicate that halite dissolution dominates the mass-flux budget (d_Halite = −6.043 ± 0.025), accompanied by the minor dissolution of gypsum (d_Gypsum ≈ −0.075) and dolomite (d_Dolomite ≈ −0.022). In contrast, calcite behaves as a persistently precipitating phase (d_Calcite = +0.044 ± 0.002). Notably, fluorite exhibits net dissolution in 89.1% of the simulated pathways (mean −4.48 × 10⁻⁵), indicating that newly added F in the equilibrium end-member is mainly released through fluorite dissolution (Figure 10a).
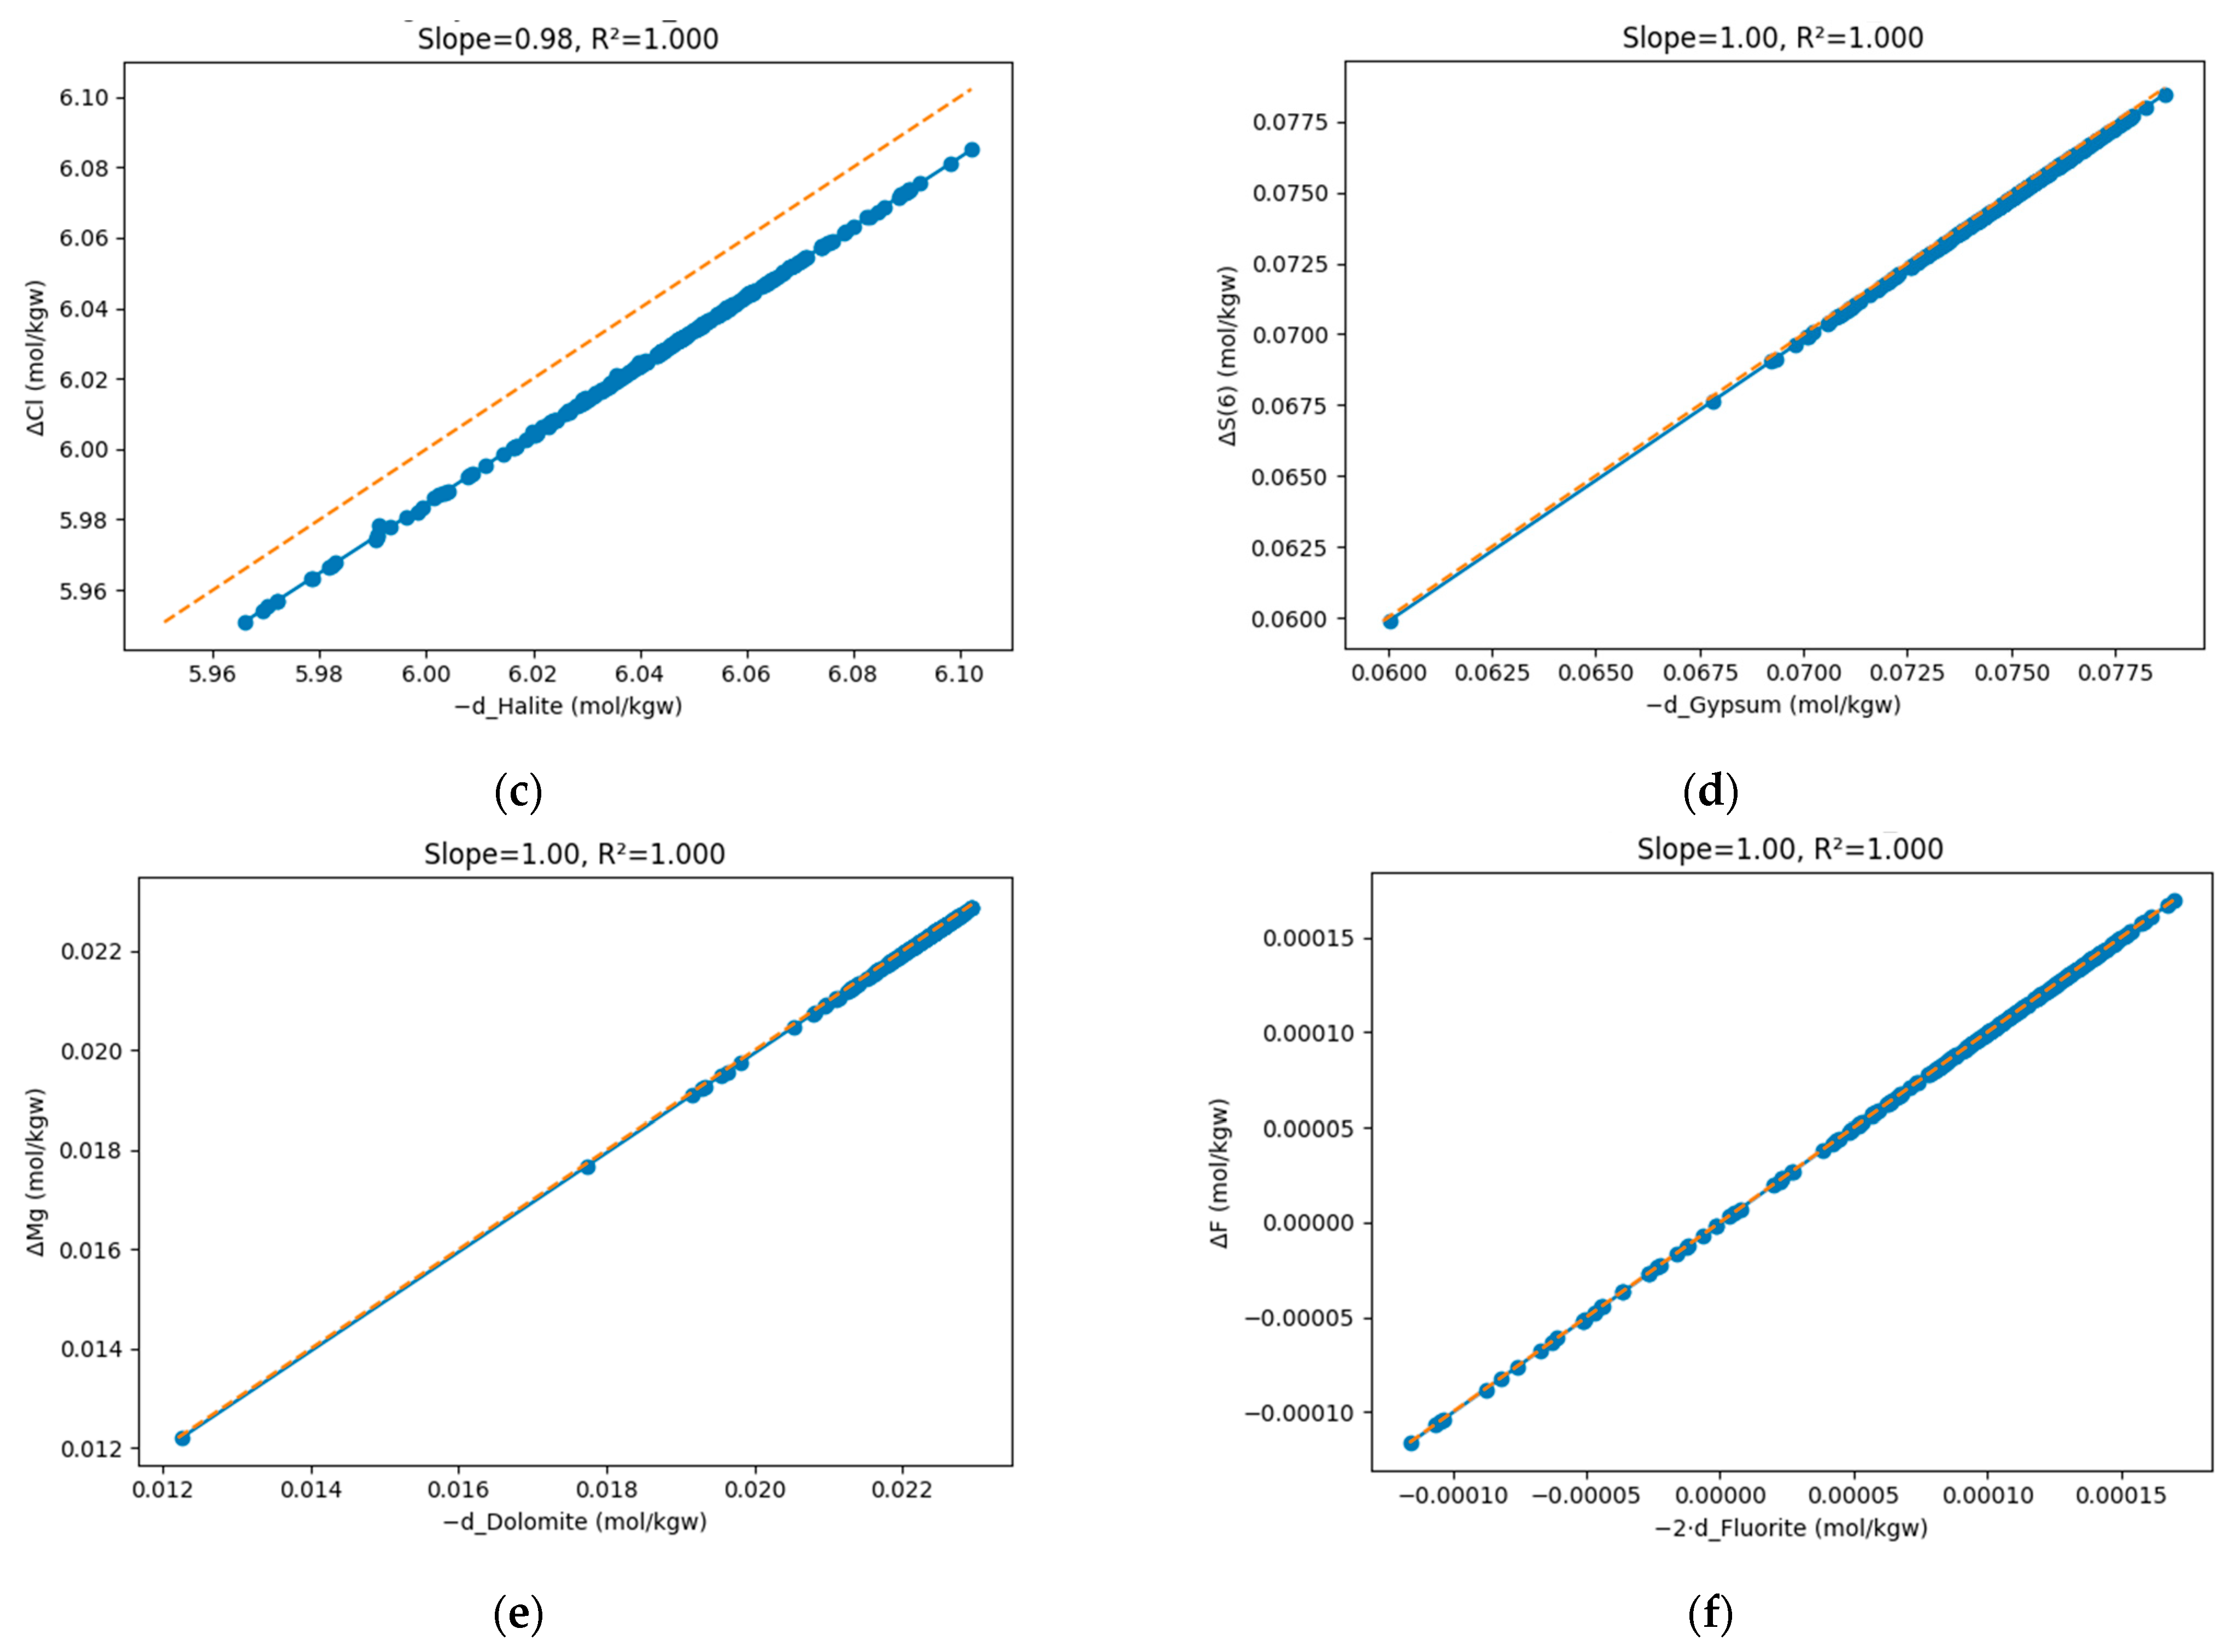
To verify model reliability, simulated mineral fluxes were compared with observed solute increments (Δ = Sheet 2–Sheet 1) under stoichiometric constraints (Figure 10b–f). The results demonstrate exceptionally strong closure. For salinity components, regressions of ΔNa and ΔCl against –d_Halite yield slopes of 0.983 (R2 > 0.999), indicating that Na–Cl increases are almost entirely accounted for by halite dissolution. For Ca–Mg components, regressions of ΔS(6) against –d_Gypsum and ΔMg against –d_Dolomite show slopes close to 1.0 with R2 ≈ 1.0, confirming accurate source attribution for sulfate and Mg. For fluoride, regression of ΔF against –2·d_Fluorite produces a slope of 0.9999 (R2 > 0.99999), strictly satisfying the 2:1 stoichiometry of reaction (R9). These results elevate the conclusion that newly added F originates from fluorite from a qualitative interpretation to quantitative evidence supported by mass conservation.
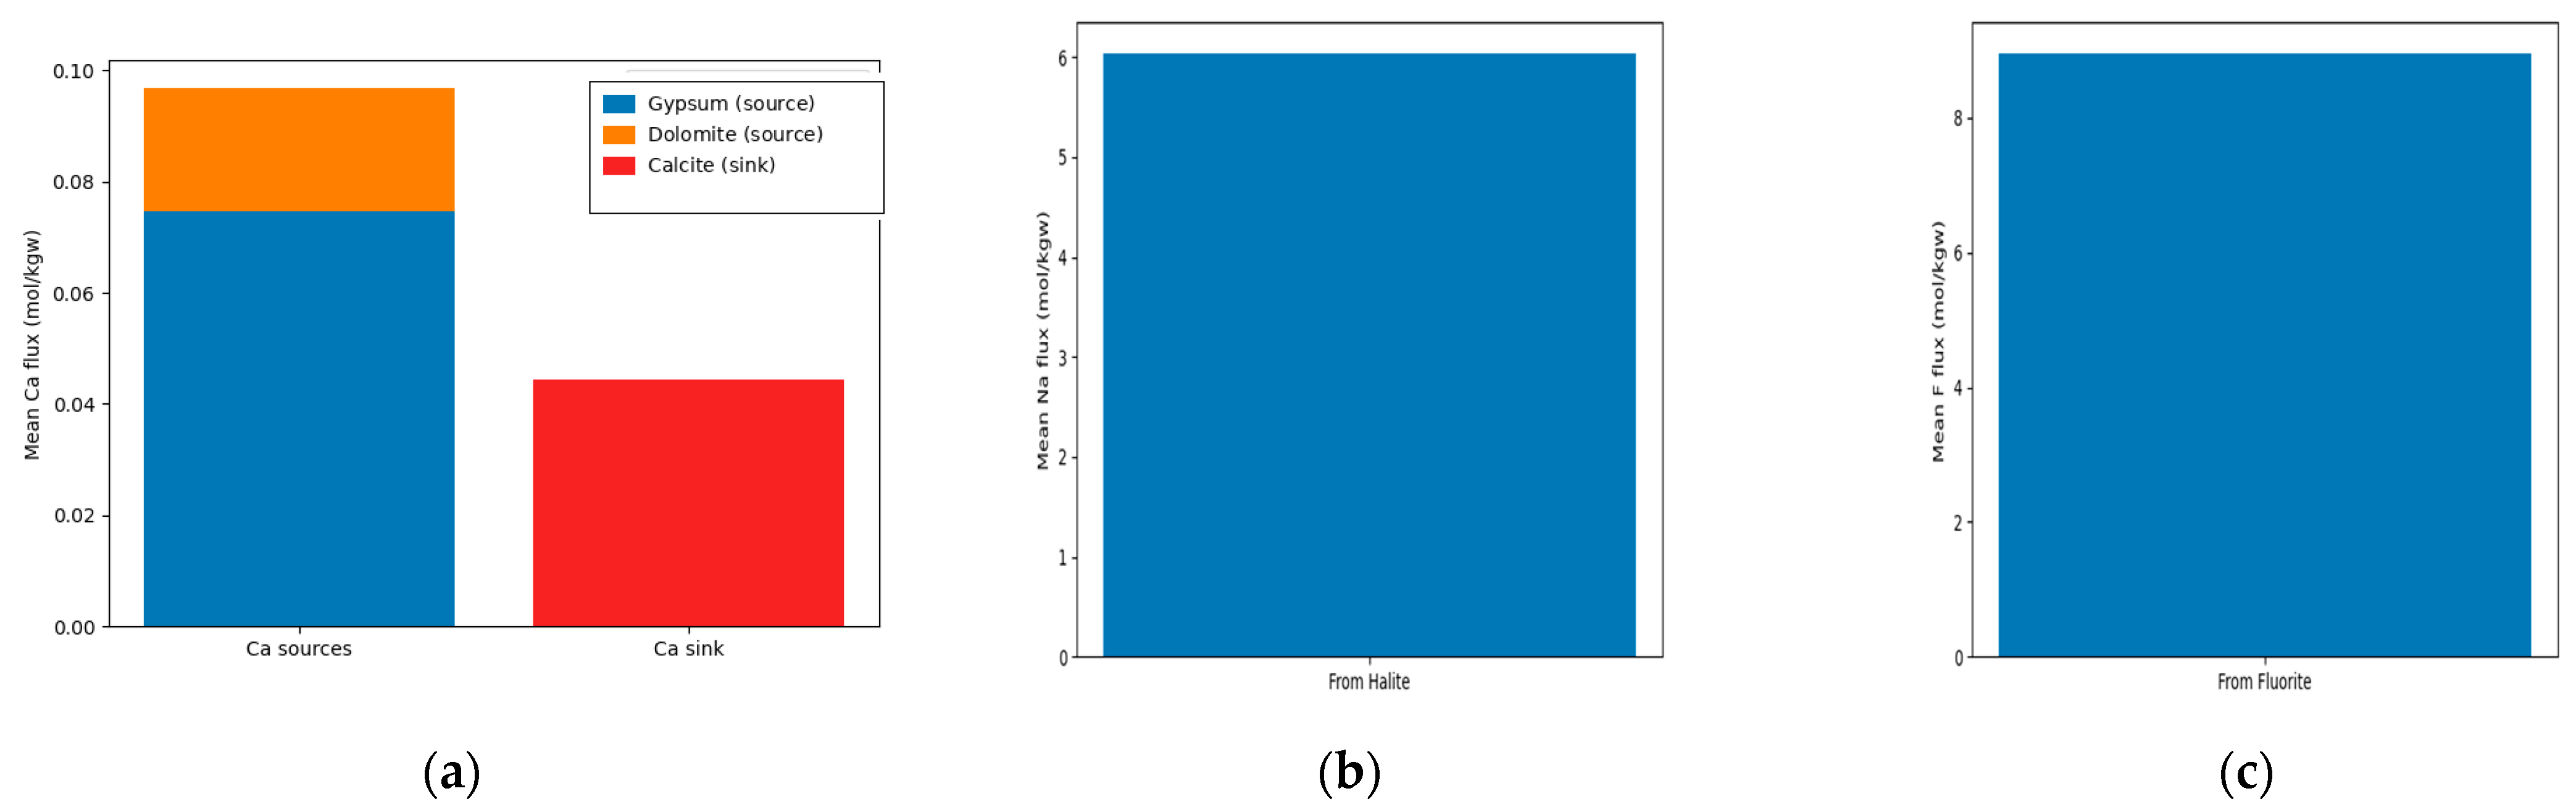
The Ca budget partitioning (Figure 11a) quantifies the intensity of the “decalcification amplifier.” Although gypsum and dolomite dissolution provide the primary Ca inputs (total flux 0.09689 mol·kgw−1), calcite precipitation consumes ~0.04439 mol·kgw−1 of Ca, offsetting 45.8% of total Ca inputs. As a result, nearly half of dissolved Ca is removed through carbonate precipitation, maintaining low a(Ca2+) and suppressing fluorite saturation and precipitation, thereby enhancing the persistence of dissolved fluoride. Fluoride budgeting (Figure 11c) shows that the equilibrium end-member exhibits an average F increase of ~1.69 mg/L relative to initial waters, of which ~56.6% is attributable to newly dissolved fluorite during evolution, while the remaining 43.4% is inherited from the initial high-F background.
Integrating SI constraints with inverse modeling flux validation, the formation of deep high-fluoride groundwater can be summarized as a coupled geochemical feedback loop. As an initiation process, continuous dissolution of evaporites (halite and gypsum) establishes a salinized background characterized by elevated Na–Cl and high ionic strength. As a control process, carbonate re-equilibration under alkaline conditions promotes calcite precipitation, while cation exchange simultaneously removes Ca2+, together forming a strong “decalcification” end-member. As a response process, under sustained thermodynamic suppression of Ca2+ activity, fluorite remains undersaturated and undergoes net dissolution, acting as the principal source of fluoride enrichment. This sequence is supported at multiple levels—from thermodynamic directionality (SI), to stoichiometric closure (Δ versus di), to elemental budget partitioning—providing quantitative evidence for source apportionment of regional fluoride contamination [79,80,81,82,83,84].

4.4. Probabilistic Health Risk Assessment and Uncertainty Attribution

4.4.1. Monte Carlo-Based Characterization of Non-Carcinogenic Risk

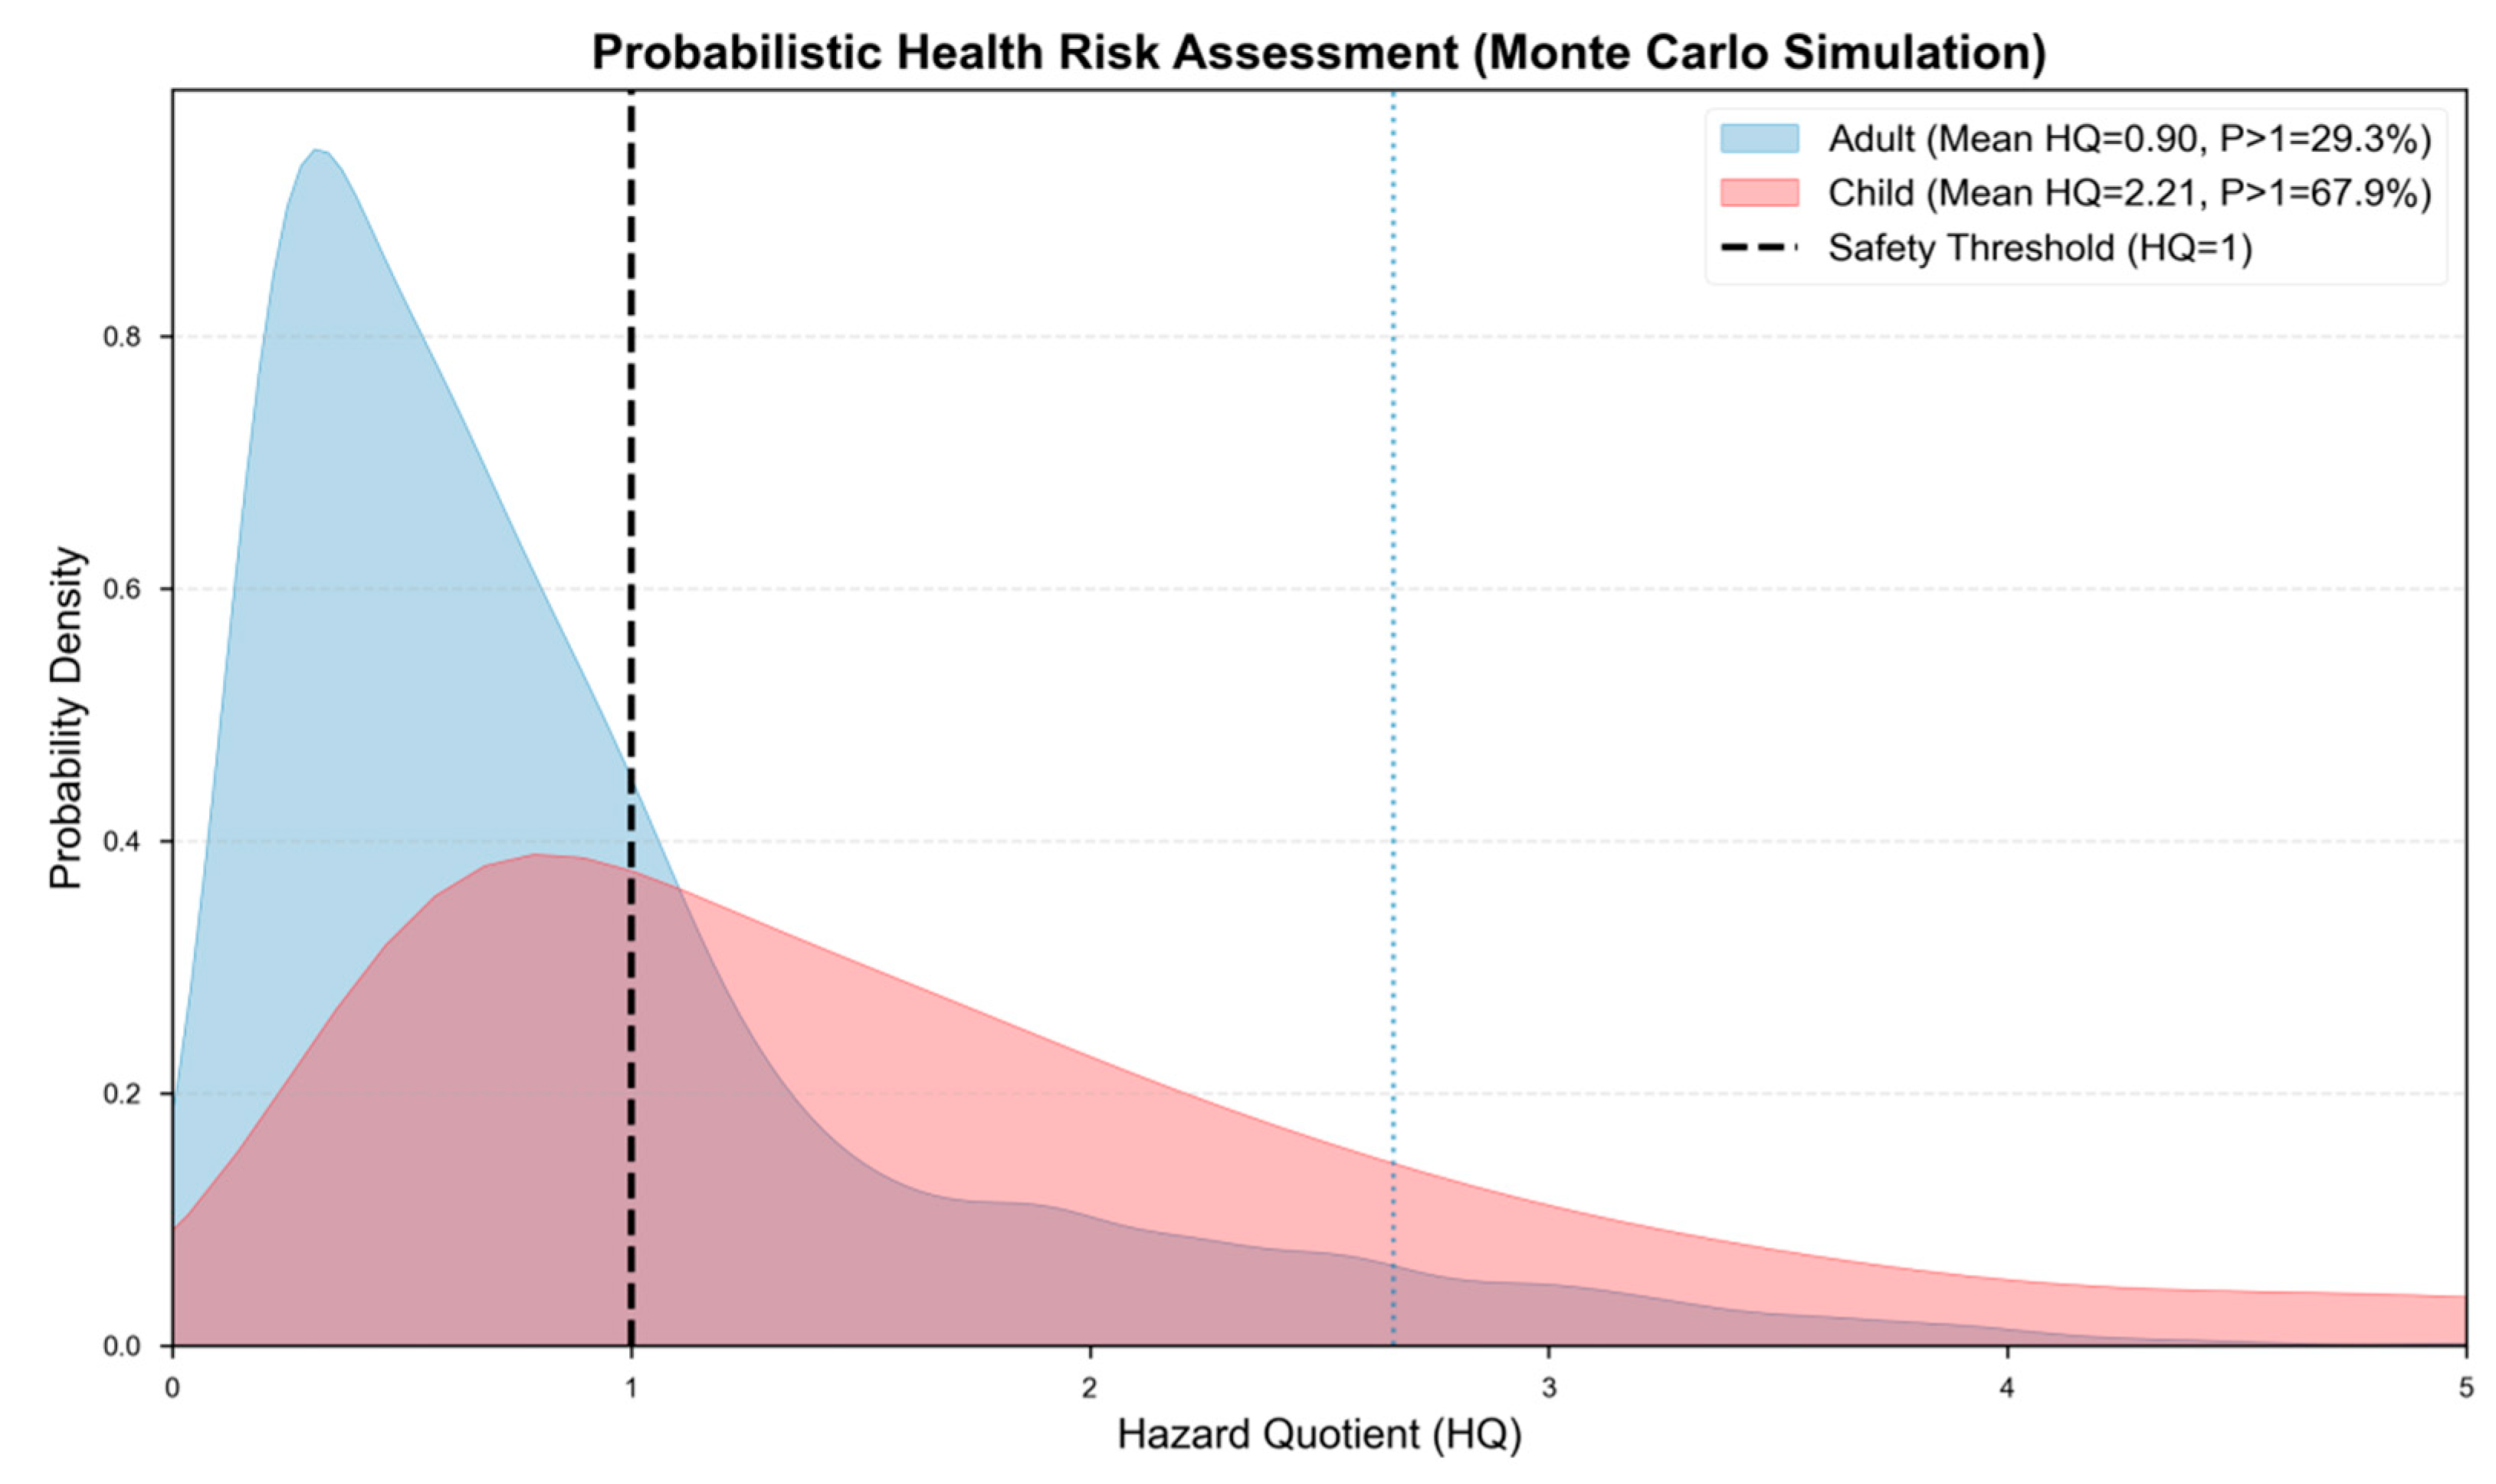
Considering the pronounced spatial heterogeneity of fluoride concentrations in deep groundwater, together with stochastic variability in receptor physiology (e.g., body weight and water ingestion rate), deterministic health risk assessment based on single-point estimates cannot adequately represent population-wide risk distributions or tail risks for highly exposed subgroups. Therefore, based on the classical drinking water exposure model, Monte Carlo simulation (10,000 iterations) was applied to characterize probabilistic distributions of non-carcinogenic risk for adults and children.
HQ = (Cw × IR × EF × ED)/(RfD × BW × AT)
where HQ is the hazard quotient; Cw is the fluoride concentration in drinking water; IR is the daily water ingestion rate; EF and ED are exposure frequency and exposure duration, respectively; RfD is the reference dose; BW is body weight; and AT is averaging time.
The simulations reveal a pronounced intergenerational disparity in risk. The adult HQ distribution is largely concentrated near the threshold, with a mean value of 0.90, close to the safety boundary suggested by WHO and relevant national guidelines; however, the exceedance probability P(HQ > 1) reaches 29.3%, indicating that nearly one third of adults face non-negligible long-term fluoride-related health risks. In contrast, children exhibit a substantially more severe risk profile: their mean HQ reaches 2.21, about 2.5 times that of adults, and P(HQ > 1) is as high as 67.9%, indicating that around two thirds of children fall within an unacceptable non-carcinogenic risk range (Figure 12).
This pronounced age sensitivity primarily results from the much higher body weight-normalized ingestion rate in children compared with adults. Under a high-fluoride geogenic background, this physiological characteristic produces a “dose-concentration” amplification effect: for the same drinking water source and exposure conditions, children receive a substantially higher internal dose than adults, making them the most vulnerable group and the highest-priority target for protection in regional high-fluoride groundwater exposure pathways.

4.4.2. Sensitivity Attribution and Identification of Uncertainty Sources

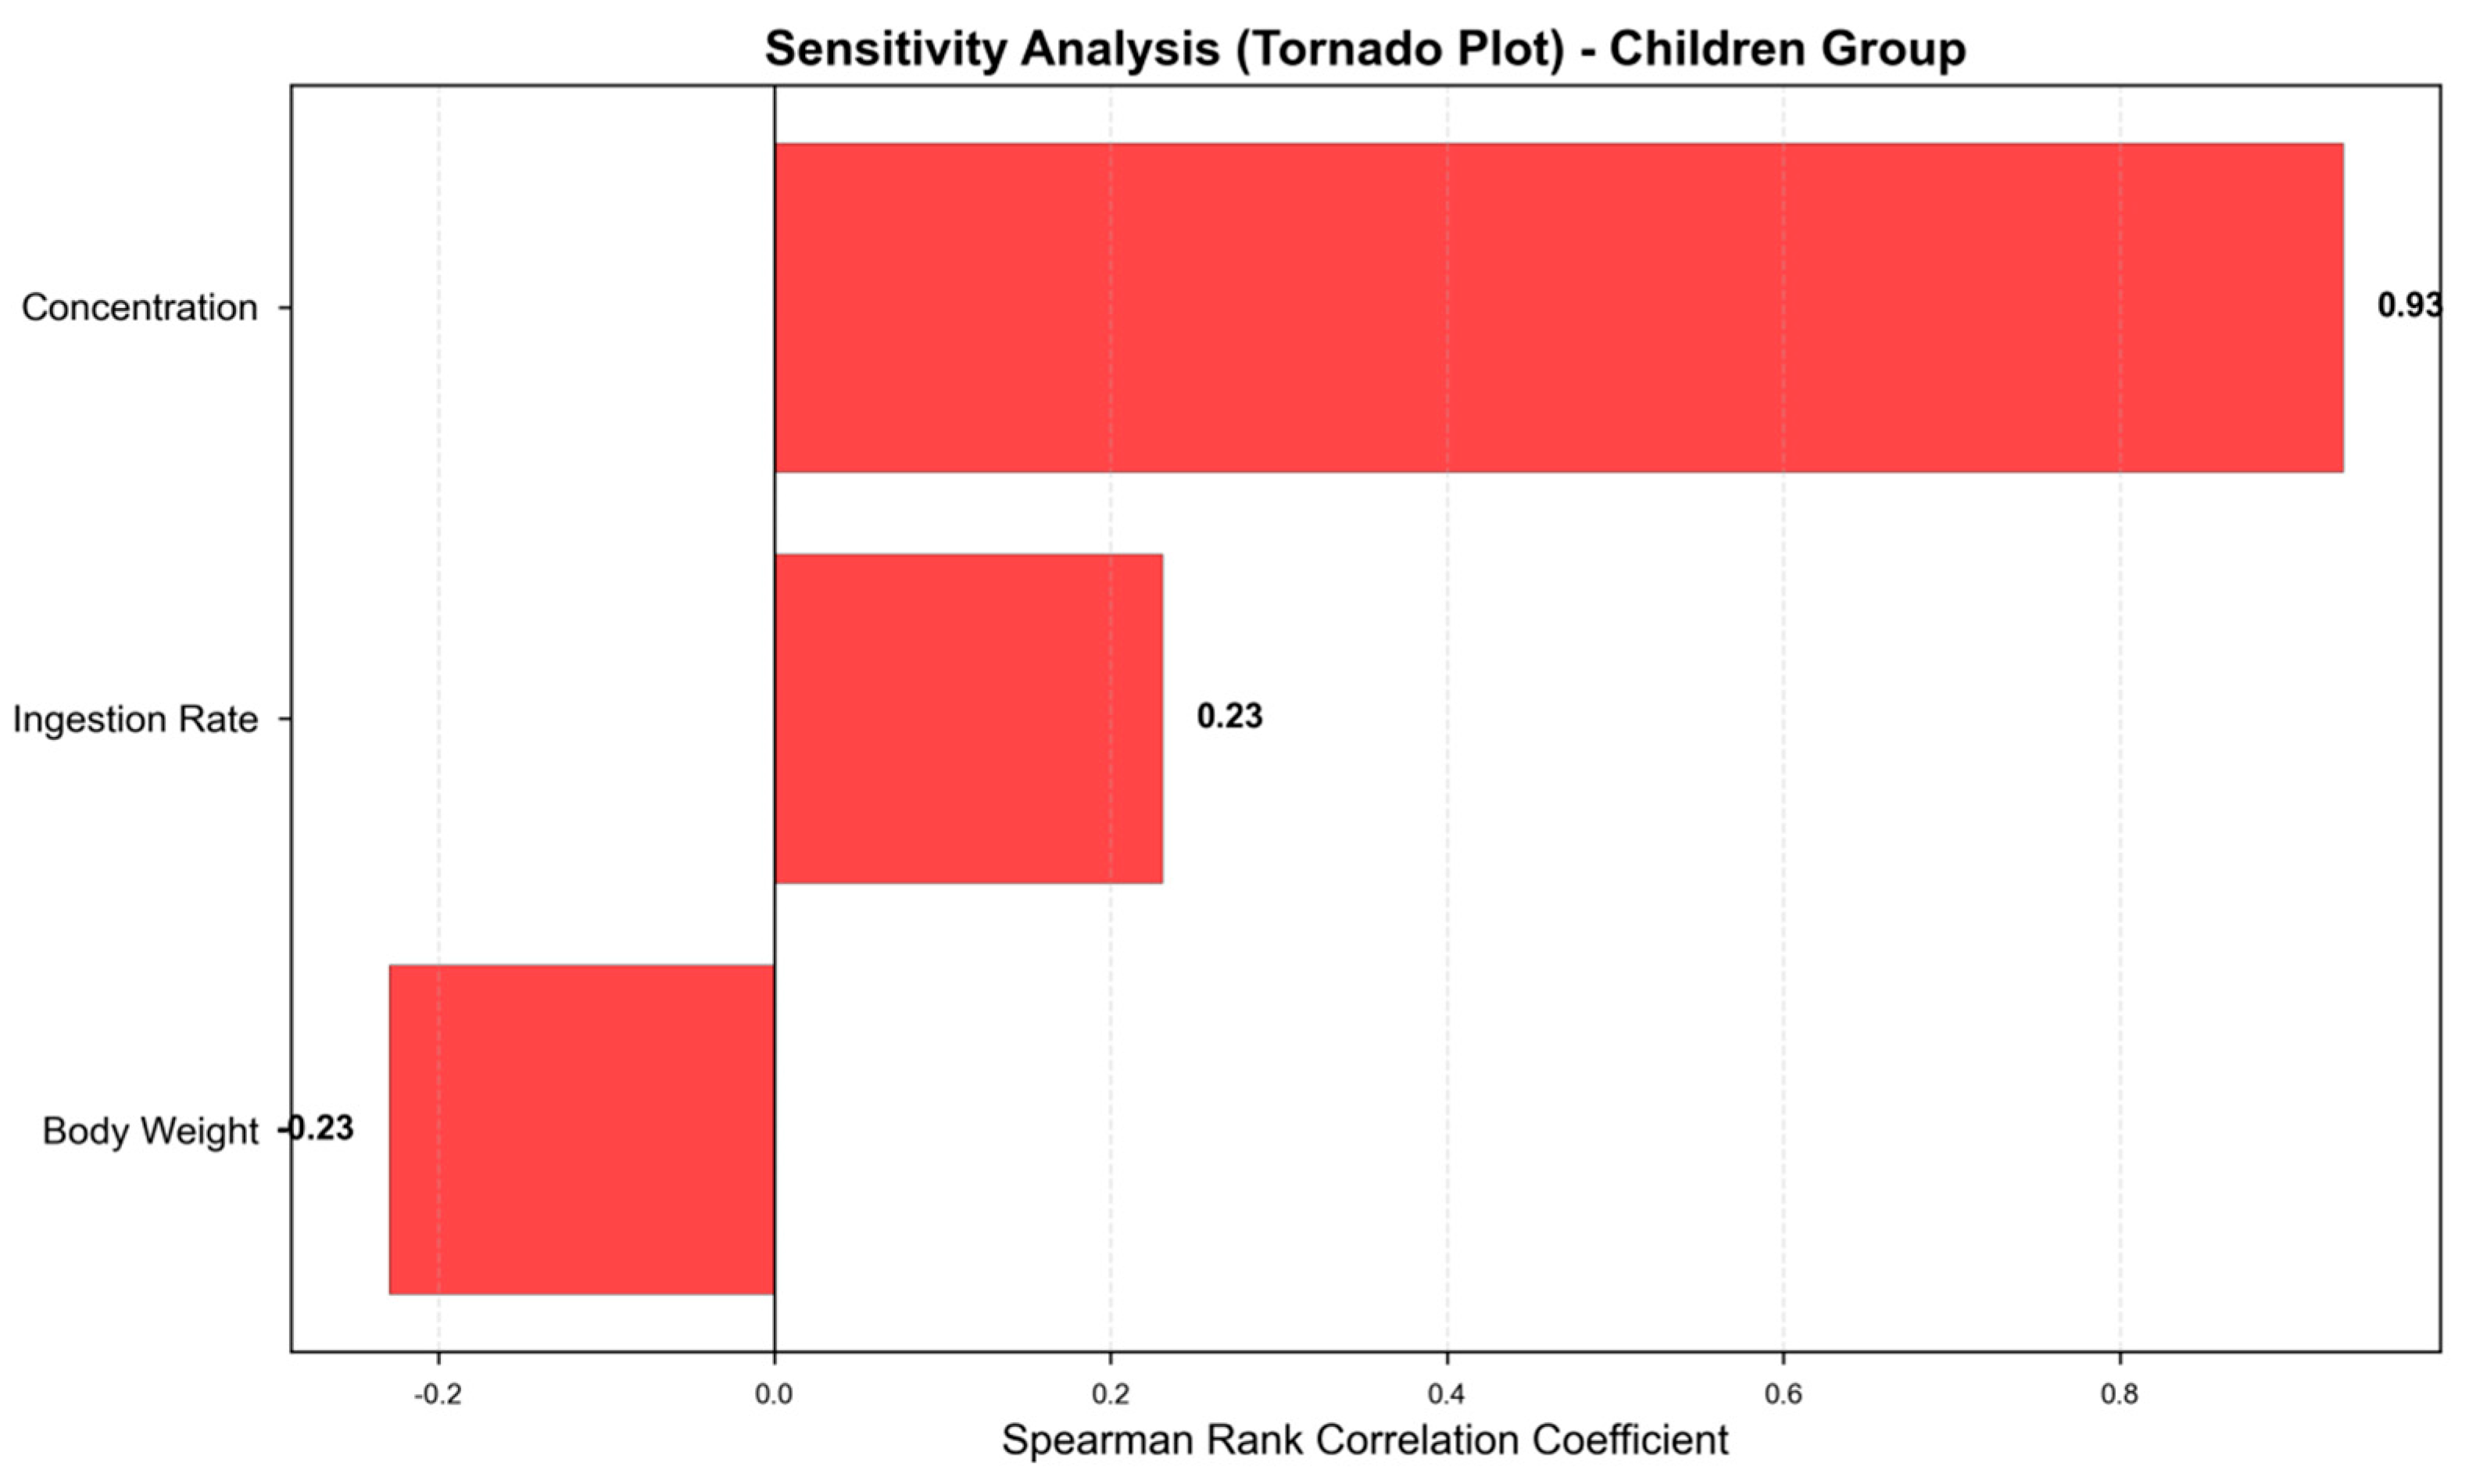
To further determine dominant uncertainty sources in probabilistic risk assessment and to provide quantitative support for risk-control strategies, a global sensitivity analysis was performed using Spearman rank correlation between input parameters and HQ outputs, with results visualized in a sensitivity plot (Figure 13).
The results show that fluoride concentration Cw is the unequivocal dominant driver of overall risk, with a correlation coefficient of r = 0.93, far exceeding those of other parameters. This statistical outcome closely aligns with the hydrogeochemical identification and source apportionment results: the high-fluoride hydrochemical field, shaped jointly by silicate weathering, carbonate processes, and Na–Ca cation exchange, not only governs the spatial and temporal distribution of groundwater F but also directly controls population-level health risk. From a risk-attribution perspective, geogenic fluoride contributes ~93% of total risk and is therefore the overriding factor.
Behavioral parameters exert comparatively limited influence on risk modulation. The daily ingestion rate IR shows a moderate positive correlation with HQ (r = 0.23), indicating that changes in drinking behavior can reduce exposure to some degree but only through marginal adjustments and cannot fundamentally alter the overall risk structure imposed by the high-fluoride background. Body weight BW is negatively correlated with HQ (r = −0.23), reflecting a body-mass “dilution effect,” whereby greater body weight reduces the toxic dose per unit mass under the same exposure scenario.
These sensitivity results carry clear implications for management and policy. Because Cw explains ~93% of HQ variability, health education or behavioral interventions alone, such as advising reduced water intake, cannot fundamentally control regional high-fluoride risks. Effective risk reduction must instead focus on the source and medium of exposure, namely through supply-side measures that lower fluoride concentrations in drinking water. Practical options include centralized defluoridation treatment in high-fluoride areas, optimization of pumping horizons and well design, and promotion of low-fluoride alternative sources or blended surface-water and groundwater supply. Such engineering and management strategies aimed at reducing Cw are most likely to compress the high-risk tail of HQ distributions and ensure equitable protection for highly sensitive groups, particularly children [85,86,87].

4.5. Implications for Groundwater Management

The coupled mechanism identified here implies that high-F risk is structurally linked to the hydrochemical evolution of deep confined groundwater and is therefore difficult to mitigate by behavioral measures alone. Management should prioritize (i) source-water concentration control (Cw) through centralized or point-of-use defluoridation in high-risk towns, (ii) well-design optimization (screen placement and pumping horizons) to preferentially exploit low-alkalinity, Ca-bearing intervals that are less favorable for fluorite dissolution, and (iii) blending strategies using low-F water to compress the upper tail of exposure distributions. Because alkalinity and Na-dominant conditions act as triggers/amplifiers, routine monitoring should include HCO3/CO32− and Na/Ca indicators (e.g., Ratio_Alk_Ca, exchange indices) as early-warning metrics for fluoride escalation during long-term exploitation.
Aquifer-aware operational strategies are particularly important in multi-layer Quaternary systems. Where vertical connectivity is plausible, long-term intensive pumping can induce cross-formational leakage and mix sodic, high-alkalinity waters upward or laterally, potentially spreading high-F signatures. Accordingly, we recommend (i) delineating fluoride-risk strata by combining facies mapping with SI_fluorite and exchange indices (e.g., chloro-alkaline indices), (ii) designing well screens to avoid strongly sodic intervals (Na/(Na+Ca) high) and to favor Ca-bearing sections where fluorite saturation is more easily achieved, (iii) implementing pumping-rate controls to limit drawdown-driven leakage, and (iv) prioritizing community-scale defluoridation and blending in towns with high P(HQ > 1) to reduce the exposure distribution tail [88,89].

5. Conclusions

By integrating high-dimensional hydrogeochemical statistics, threshold-oriented machine learning identification, and PHREEQC thermodynamic inverse modeling, this study quantitatively verifies a coupled “salinization–decalcification–fluoridation” mechanism for fluoride enrichment in deep groundwater and demonstrates pronounced intergenerational differences in health risk. The main conclusions are as follows:
(1) Hydrochemical evolution shows a systematic shift from HCO3–Ca·Mg to Na–HCO3 facies, and ultra-high-F waters are constrained to strongly sodic end-members, indicating that sodification and alkalinization are necessary conditions for deep fluoride enrichment.
(2) HydroAttentionNet (R2 = 0.77) and SHAP interpretation identify a nonlinear tipping control: alkalinity (HCO3/CO32−) is the primary trigger, while Na+ enrichment and Ca2+ depletion act as amplifiers.
(3) PHREEQC SI diagnostics and inverse modeling provide mass-conservative evidence for a coupled “salinization–decalcification–fluoridation” loop, in which calcite precipitation removes ~45.8% of Ca inputs and net fluorite dissolution contributes 56.6% of newly added dissolved F− in evolved end-members.
(4) Probabilistic risk assessment reveals substantial intergenerational inequity (P[HQ>1] = 67.9% for children vs. 29.3% for adults), and sensitivity analysis indicates that lowering Cw is the dominant and most effective management lever; practical implications are summarized in Section 4.5.

Author Contributions

Conceptualization, X.W. and H.L.; methodology, Y.L.; software, Y.L.; validation, F.Z. and X.W.; formal analysis, Y.L.; investigation, Y.L.; resources, X.W.; data curation, X.W.; writing—original draft preparation, Y.L.; writing—review and editing, X.W.; visualization, X.G.; supervision, X.W.; project administration, X.W., H.L. and J.J.; funding acquisition, X.W. and H.L. All authors have read and agreed to the published version of the manuscript.

Funding

This research was funded to explore the occurrence characteristics and evolution patterns of typical pollutants in groundwater in agricultural irrigation areas in accordance with North China law (2022YFC3703701).

Data Availability Statement

The original contributions presented in this study are included in the article. Further inquiries can be directed to the corresponding authors.

Acknowledgments

The authors have reviewed and edited the output and take full responsibility for the content of this publication.

Conflicts of Interest

The authors declare no conflicts of interest.

References

  1. Savenko, V.A.; Savenko, S.V. Fluorine in surface water and fresh groundwater of Arkhangelsk Oblast. Mosc. Univ. Geol. Bull. 2025, 80, 442–449. [Google Scholar] [CrossRef]
  2. Su, H.; Kang, W.; Li, Y.; Li, Z. Fluoride and nitrate contamination of groundwater in the Loess Plateau, China: Sources and related human health risks. Environ. Pollut. 2021, 286, 117287. [Google Scholar] [CrossRef] [PubMed]
  3. Wang, Z.; Guo, H.; Xing, S.; Liu, H. Hydrogeochemical and geothermal controls on the formation of high fluoride groundwater. J. Hydrol. 2021, 598, 126372. [Google Scholar] [CrossRef]
  4. Kurwadkar, S.; Kanel, S.R.; Nakarmi, A. Groundwater pollution: Occurrence, detection, and remediation of organic and inorganic pollutants. Water Environ. Res. 2020, 92, 1659–1668. [Google Scholar] [CrossRef]
  5. Dharma-Wardana, M.W.C. Letter to the Editor re: Jayasinghe and Zhu (2020). Sci. Total Environ. 2020, 721, 137529. [Google Scholar] [CrossRef]
  6. Karunanidhi, D.; Aravinthasamy, P.; Roy, P.D.; Praveenkumar, R.M.; Prasanth, K.; Selvapraveen, S.; Thowbeekrahman, A.; Subramani, T.; Srinivasamoorthy, K. Evaluation of non-carcinogenic risks due to fluoride and nitrate contaminations in a groundwater of an urban part (Coimbatore region) of south India. Environ. Monit. Assess. 2020, 192, 102. [Google Scholar] [CrossRef]
  7. Karunanidhi, D.; Aravinthasamy, P.; Subramani, T.; Roy, P.D.; Srinivasamoorthy, K. Risk of fluoride-rich groundwater on human health: Remediation through managed aquifer recharge in a hard rock terrain, South India. Nat. Resour. Res. 2020, 29, 2369–2395. [Google Scholar] [CrossRef]
  8. Zhang, X.; Gao, X.; Li, C.; Luo, X.; Wang, Y. Fluoride contributes to the shaping of microbial community in high fluoride groundwater in Qiji County, Yuncheng City, China. Sci. Rep. 2019, 9, 14488. [Google Scholar] [CrossRef]
  9. Zuo, R.; Liu, X.; Yang, J.; Zhang, H.; Li, J.; Teng, Y.; Yue, W.; Wang, J. Distribution, origin and key influencing factors of fluoride groundwater in the coastal area, NE China. Hum. Ecol. Risk Assess. 2019, 25, 104–119. [Google Scholar] [CrossRef]
  10. Barwar, U.; Gudesaria, D.D.; Bhandari, H.S.; Mathur, R.P. Groundwater quality characterization of fatehpur (Rajasthan, India) through physicochemical and correlation studies. Curr. Agric. Res. J. 2018, 6, 109. [Google Scholar] [CrossRef]
  11. Arveti, N.; Sarma, M.R.S.; Aitkenhead-Peterson, J.A.; Sunil, K. Fluoride incidence in groundwater: A case study from Talupula, Andhra Pradesh, India. Environ. Monit. Assess. 2011, 172, 427–443. [Google Scholar] [CrossRef] [PubMed]
  12. Roisenberg, A.; Marimon, M.P.C.; Viero, A.P. Origin of high fluoride contents in groundwater of the Santa Maria Formation, Guarany Aquifer System, southern Brazil. Chin. J. Geochem. 2006, 25, 121. [Google Scholar] [CrossRef]
  13. Ayoob, S.; Gupta, A.K. Fluoride in drinking water: A review on the status and stress effects. Crit. Rev. Environ. Sci. Technol. 2006, 36, 433–487. [Google Scholar] [CrossRef]
  14. Zhu, Q.; Xu, G. The current status and research progress of fluoride pollution in groundwater in China. Environ. Sci. Manag. 2009, 34, 4251. [Google Scholar]
  15. Su, Y.; Liu, J. The distribution and genesis of high fluoride groundwater in Xianyang urban area. Eng. Explor. 2004, 3134. Available online: https://kns.cnki.net/kcms2/article/abstract?v=8witAuWEzbM-Tl9_4xwqAuVLPjdHJ7_HNe13VscbEkc8e_OF9swufJUjXJrndAAy-lheFU796XvJDl6asSPgCNWbJdSqmZekwCCgoEx0BWA1Cth6MOvomDB6P5JjddZiy-xAlGFl-BE2Dk4D6Vawe2xFaZ1cDTs6iHk6T1je8Hp-9xIt9gYkew==&uniplatform=NZKPT&language=CHS (accessed on 21 January 2026).
  16. Sreedevi, P.D.; Ahmed, S.; Madé, B.; Ledoux, E.; Gandolfi, J.-M. Association of hydrogeological factors in temporal variations of fluoride concentration in a crystalline aquifer in India. Environ. Geol. 2006, 50, 1–11. [Google Scholar] [CrossRef]
  17. Armienta, M.A.; Segovia, N. Arsenic and fluoride in the groundwater of Mexico. Environ. Geochem. Health 2008, 30, 345–353. [Google Scholar] [CrossRef]
  18. Asghari Moghaddam, A.; Fijani, E. Hydrogeologic framework of the Maku area basalts, northwestern Iran. Hydrogeol. J. 2009, 17, 949–959. [Google Scholar] [CrossRef]
  19. Rao, N.S. The occurrence and behaviour of fluoride in the groundwater of the Lower Vamsadhara River basin, India. Hydrol. Sci. J. 1997, 42, 877–892. [Google Scholar] [CrossRef]
  20. Jayawardana, D.T.; Pitawala, H.; Ishiga, H. Geochemical assessment of soils in districts of fluoride-rich and fluoride-poor groundwater, north-central Sri Lanka. J. Geochem. Explor. 2012, 114, 118–125. [Google Scholar] [CrossRef]
  21. Dehbandi, R.; Moore, F.; Keshavarzi, B. Geochemical sources, hydrogeochemical behavior, and health risk assessment of fluoride in an endemic fluorosis area, central Iran. Chemosphere 2018, 193, 763–776. [Google Scholar] [CrossRef]
  22. Dai, X.; Liu, C.; Li, L. Discussion and countermeasures on safe drinking water in the rural areas of China. Acta Geogr. Sin. 2007, 62, 907–915. [Google Scholar]
  23. Lv, X.; Liu, J.; Zhu, L. Characteristics and influencing factors of fluoride enrichment in groundwater of Qinwangchuan Basin, Gansu Province. Resour. Environ. Arid. Areas 2020, 34, 188195. [Google Scholar]
  24. Liu, C.; Wang, W.; Wei, Z.; Shang, H.; Zhang, Z. Analysis of the causes of high fluoride groundwater in Weishan Lake Basin. J. Geol. 2018, 39, 351357. [Google Scholar]
  25. Wu, C.; Wu, X.; Zhang, Y.; Dong, Y.; Zhu, P. Distribution characteristics and genesis of high fluoride groundwater in the Niuxin Mountain, Qinhuangdao. Earth Sci. Front. 2018, 25, 307. [Google Scholar]
  26. Yang, N.; Liu, J.; Liao, A.; Wang, W.; Zheng, H.; Lin, J.; Gu, W. Distribution and formation factors of high fluoride deep groundwater in typical area of north Anhui Province. Hydrogeol. Eng. Geol. 2017, 44, 33–41. [Google Scholar]
  27. Mao, R.; Guo, H.; Jia, Y.; Jiang, Y.; Cao, Y.; Zhao, W.; Wang, Z. Characteristics and causes of fluoride-containing groundwater in Hetao Basin, Inner Mongolia. Front. Geol. 2016, 23, 260–268. [Google Scholar]
  28. Feng, G.; Li, Z.; Su, C.; Xie, X.; Ge, W.; Gan, Y.; Luo, Z.; Pi, K.; Pan, H.; Gao, Y. Provenance and geogenic modes of high-fluoride groundwater occurred in various sedimentary environments: Constraints of hydrogeology and hydrogeochemstry. Appl. Geochem. 2025, 195, 106624. [Google Scholar] [CrossRef]
  29. Sunkari, E.D.; Zeon, O.D.; Asante-Annor, A.; Nunoo, S.; Ambushe, A.A. Geochemistry, enrichment mechanisms and geomedical assessment of fluoridated groundwater in some parts of the largest semi-arid sedimentary basin in Ghana. J. Geochem. Explor. 2025, 280, 107924. [Google Scholar] [CrossRef]
  30. Su, C.; Ge, W.; Xie, X.; Guo, Z.; Luo, Z.; Gan, Y.; Xiao, Z.; Gao, Y.; Yang, Y. Prediction and controlling factors of high-fluoride groundwater in the Yellow River Basin based on machine learning model. Groundw. Sustain. Dev. 2025, 30, 101458. [Google Scholar] [CrossRef]
  31. Grebenshchikova, V.; Kuzmin, M.; Novopashina, A.; Kuz’mina, E. Distribution and role of fluorine in the aquatic ecosystem (mineral springs, groundwater, tributaries, Baikal water, and the Angara water source) of Lake Baikal, Russia. China Geol. 2025, 8, 303–313. [Google Scholar] [CrossRef]
  32. Yang, Y.; Zhang, Z.; Wang, Z.; Liu, H.; Sun, Z. Formation of high fluoride groundwater and associated health risks in the Cangzhou area of the North China Plain. Environ. Earth Sci. 2025, 84, 111. [Google Scholar] [CrossRef]
  33. Gao, X.; Naseem, A.; Luo, W.; Rashid, A.; Ma, S.; Li, C.; Zhang, X. Impact of microbial activity on fluoride release from sediments in areas with high fluoride groundwater: Mechanisms, sources and the lithology diversity. Sci. Total Environ. 2024, 955, 176940. [Google Scholar] [CrossRef] [PubMed]
  34. Ayub, M.; Javed, H.; Rashid, A.; Khan, W.H.; Javed, A.; Sardar, T.; Shah, G.M.; Ahmad, A.; Rinklebe, J.; Ahmad, P. Hydrogeochemical properties, source provenance, distribution, and health risk of high fluoride groundwater: Geochemical control, and source apportionment. Environ. Pollut. 2024, 362, 125000. [Google Scholar] [CrossRef] [PubMed]
  35. Shube, H.; Karuppannan, S.; Haji, M.; Paneerselvam, B.; Kawo, N.; Mechal, A.; Fekadu, A. Appraising groundwater quality and probabilistic human health risks from fluoride-enriched groundwater using the pollution index of groundwater (PIG) and GIS: A case study of adama town and its vicinities in the central main Ethiopian rift valley. RSC Adv. 2024, 14, 30272–30285. [Google Scholar] [CrossRef]
  36. de Miguel-García, E.; Gómez-González, J.F. Concentrations of F, Na+, and K+ in Groundwater before and after an Earthquake: A Case Study on Tenerife Island, Spain. Hydrology 2024, 11, 138. [Google Scholar] [CrossRef]
  37. Xia, P.; Zhao, Y.; Xie, X.; Li, J.; Qian, K.; You, H.; Zhang, J.; Ge, W.; Pan, H.; Wang, Y. Machine learning prediction of health risk and spatial dependence of geogenic contaminated groundwater from the Hetao Basin, China. J. Geochem. Explor. 2024, 262, 107497. [Google Scholar] [CrossRef]
  38. Xiangcao, Z.; Su, C.; Xianjun, X.; Ge, W.; Xiao, Z.; Yang, L.; Pan, H. Employing machine learning to predict the occurrence and spatial variability of high fluoride groundwater in intensively irrigated areas. Appl. Geochem. 2024, 167, 106000. [Google Scholar] [CrossRef]
  39. Rashid, A.; Ayub, M.; Gao, X.; Khattak, S.A.; Ali, L.; Li, C.; Ahmad, A.; Khan, S.; Rinklebe, J.; Ahmad, P. Hydrogeochemical characteristics, stable isotopes, positive matrix factorization, source apportionment, and health risk of high fluoride groundwater in semiarid region. J. Hazard. Mater. 2024, 469, 134023. [Google Scholar] [CrossRef]
  40. Fu, T.; Fu, Y.; Li, C.; Dong, M.; Qi, C.; Wang, Z.; Chen, G.; Su, Q.; Xu, X.; Yu, H. Seawater intrusion-triggered high fluoride groundwater development on the eastern coast of China. Environ. Sci. Pollut. Res. 2024, 31, 11307–11320. [Google Scholar] [CrossRef]
  41. Zhen, W.; Zhuo, Z.; Narsimha, A. Spatial distribution and enrichment mechanisms of high fluoride groundwater in geotherm-affected Pliocene aquifers of the Guide basin, China. J. Geochem. Explor. 2024, 256, 107356. [Google Scholar]
  42. Yu, F.; Jiang, L.; Li, Z. Distribution, enrichment mechanisms, and health risk assessment of high-fluorine groundwater in the Yudong Plain, Henan Province, China. Environ. Sci. Pollut. Res. 2023, 30, 63549–63564. [Google Scholar] [CrossRef] [PubMed]
  43. Cao, W.; Zhang, Z.; Guo, H.; Fu, Y.; Gao, Z.; Nan, T.; Ren, Y.; Li, Z. Spatial distribution and controlling mechanisms of high fluoride groundwater in the coastal plain of Bohai Rim, North China. J. Hydrol. 2023, 617, 128952. [Google Scholar] [CrossRef]
  44. Demarchi, P.; Garbarino, F.; Mascolo, A.; Silvestrini Biavati, F.; Ugolini, A. Fluorosis and Oral health status in adolescents living in a high-fluoride groundwater area: A case study of Nairobi suburbs (Kenya). Appl. Sci. 2022, 13, 368. [Google Scholar] [CrossRef]
  45. Zhai, Z.; Zhang, C.; Tang, T.; Zhang, C.; Bao, X.; Li, K.; Han, B. Hydrochemical Characteristics and Genetic Analysis of Shallow High-Fluorine Groundwater in Fuyang River Basin. Geofluids 2022, 2022, 9682371. [Google Scholar] [CrossRef]
  46. Liu, S.; Liu, Y.; Wang, C.; Dang, X. The distribution characteristics and human health risks of high-fluorine groundwater in coastal plain: A case study in Southern Laizhou Bay, China. Front. Environ. Sci. 2022, 10, 901637. [Google Scholar] [CrossRef]
  47. Xiao, Y.; Liu, K.; Hao, Q.; Li, Y.; Xiao, D.; Zhang, Y. Occurrence, controlling factors and health hazards of fluoride-enriched groundwater in the lower flood plain of Yellow River, Northern China. Expo. Health 2022, 14, 345–358. [Google Scholar] [CrossRef]
  48. Bennett, G.; Van Reybrouck, J.; Shemsanga, C.; Kisaka, M.; Tomašek, I.; Fontijn, K.; Kervyn, M.; Walraevens, K. Hydrochemical characterisation of high-fluoride groundwater and development of a conceptual groundwater flow model using a combined hydrogeological and Hydrochemical approach on an active volcano: Mount Meru, northern Tanzania. Water 2021, 13, 2159. [Google Scholar] [CrossRef]
  49. Su, H.; Kang, W.; Kang, N.; Liu, J.; Li, Z. Hydrogeochemistry and health hazards of fluoride-enriched groundwater in the Tarim Basin, China. Environ. Res. 2021, 200, 111476. [Google Scholar] [CrossRef]
  50. Sarkar, M.; Pal, S.C. Human health hazard assessment for high groundwater arsenic and fluoride intact in Malda district, Eastern India. Groundw. Sustain. Dev. 2021, 13, 100565. [Google Scholar] [CrossRef]
  51. Sharma, R.; Rojh, B. De-fluoridation of groundwater using precipitation method in a region of Nagaur district, Rajasthan, India. Appl. Ecol. Environ. Sci. 2020, 8, 379–386. [Google Scholar]
  52. Chen, Q.; Hao, D.; Wei, J.; Jia, C.; Wang, H.; Shi, L.; Liu, S.; Ning, F.; An, M.; Jia, Z. The influence of high-fluorine groundwater on surface soil fluorine levels and their FTIR characteristics. Arab. J. Geosci. 2020, 13, 383. [Google Scholar] [CrossRef]
  53. Kechiched, R.; Nezli, I.E.; Foufou, A.; Belksier, M.S.; Benhamida, S.A.; Djeghoubbi, R.; Slamene, N.; Ameur-zaimeche, O. Fluoride-bearing groundwater in the complex terminal aquifer (a case study in Hassi Messaoud area, southern Algeria): Hydrochemical characterization and spatial distribution assessed by indicator kriging. Sustain. Water Resour. Manag. 2020, 6, 54. [Google Scholar] [CrossRef]
  54. Mohanta, V.L.; Singh, S.; Mishra, B.K. Human health risk assessment of fluoride-rich groundwater using fuzzy-analytical process over the conventional technique. Groundw. Sustain. Dev. 2020, 10, 100291. [Google Scholar] [CrossRef]
  55. Liu, T.; Gao, X.; Zhang, X.; Li, C. Distribution and assessment of hydrogeochemical processes of F-rich groundwater using PCA model: A case study in the Yuncheng Basin, China. Acta Geochim. 2020, 39, 216–225. [Google Scholar] [CrossRef]
  56. Marghade, D.; Malpe, D.B.; Subba Rao, N.; Sunitha, B. Geochemical assessment of fluoride enriched groundwater and health implications from a part of Yavtmal District, India. Hum. Ecol. Risk Assess. 2020, 26, 673–694. [Google Scholar] [CrossRef]
  57. LaFayette, G.N.; Knappett, P.S.; Li, Y.; Loza-Aguirre, I.; Polizzotto, M.L. Geogenic sources and chemical controls on fluoride release to groundwater in the Independence Basin, Mexico. Appl. Geochem. 2020, 123, 104787. [Google Scholar] [CrossRef]
  58. Munna, K.; Guhey, R.; Jhariya, D.C. Hydrogeochemistry of high fluoride groundwater to understand the suitability of groundwater for drinking and irrigation purposes in granulite belt part of Bhopalpatnam Area, Bijapur District, Chhattisgarh, India. J. Geol. Soc. India 2019, 94, 309–318. [Google Scholar] [CrossRef]
  59. Su, H.; Wang, J.; Liu, J. Geochemical factors controlling the occurrence of high-fluoride groundwater in the western region of the Ordos basin, northwestern China. Environ. Pollut. 2019, 252, 1154–1162. [Google Scholar] [CrossRef]
  60. Gevera, P.; Mouri, H.; Maronga, G. Occurrence of fluorosis in a population living in a high-fluoride groundwater area: Nakuru area in the Central Kenyan Rift Valley. Environ. Geochem. Health 2019, 41, 829–840. [Google Scholar] [CrossRef]
  61. Bouhadjar, S.I.; Kopp, H.; Britsch, P.; Deowan, S.A.; Hoinkis, J.; Bundschuh, J. Solar powered nanofiltration for drinking water production from fluoride-containing groundwater—A pilot study towards developing a sustainable and low-cost treatment plant. J. Environ. Manag. 2019, 231, 1263–1269. [Google Scholar] [CrossRef]
  62. Craig, L.; Thomas, J.M.; Lutz, A.; Decker, D.L. Determining the optimum locations for pumping low-fluoride groundwater to distribute to communities in a fluoridic area in the Upper East Region, Ghana. Chem. Geol. 2018, 476, 481–492. [Google Scholar] [CrossRef]
  63. Das, S.; Nag, S.K. Geochemical appraisal of fluoride-laden groundwater in Suri I and II blocks, Birbhum district, West Bengal. Appl. Water Sci. 2017, 7, 2559–2570. [Google Scholar] [CrossRef]
  64. Gbabu, R.A.O.; Pvnageswara, R.A.O. Geochemistry of fluoride bearing groundwater from Nuzendla Mandal, Guntur district, Andhra Pradesh, India. Geochemistry 2017, 10, 518–527. [Google Scholar]
  65. Gowrisankar, G.; Jagadeshan, G.; Elango, L. Managed aquifer recharge by a check dam to improve the quality of fluoride-rich groundwater: A case study from southern India. Environ. Monit. Assess. 2017, 189, 200. [Google Scholar] [CrossRef] [PubMed]
  66. Sudheer Kumar, M.; Dhakate, R.; Yadagiri, G.; Srinivasa Reddy, K. Principal component and multivariate statistical approach for evaluation of hydrochemical characterization of fluoride-rich groundwater of Shaslar Vagu watershed, Nalgonda District, India. Arab. J. Geosci. 2017, 10, 83. [Google Scholar] [CrossRef]
  67. Chantharawong, P.; Wongrueng, A.; Rakruam, P.; Wattanachira, S.; Takizawa, S. Effects of activated carbon and cationic exchange resin pretreatments on groundwater defluoridation by reverse osmosis process. Eng. J. 2017, 21, 123–132. [Google Scholar] [CrossRef][Green Version]
  68. Rao, N.S.; Dinakar, A.; Rao, P.S.; Rao, P.N.; Madhnure, P.; Prasad, K.M.; Sudarshan, G. Geochemical processes controlling fluoride-bearing groundwater in the granitic aquifer of a semi-arid region. J. Geol. Soc. India 2016, 88, 350–356. [Google Scholar] [CrossRef]
  69. Nagaraju, A.; Thejaswi, A.; Sun, L. Statistical analysis of high fluoride groundwater hydrochemistry in Southern India: Quality assessment and Implications for source of fluoride. Environ. Eng. Sci. 2016, 33, 471–477. [Google Scholar] [CrossRef]
  70. Wei, C.; Guo, H.; Zhang, D.; Wu, Y.; Han, S.; An, Y.; Zhang, F. Occurrence and hydrogeochemical characteristics of high-fluoride groundwater in Xiji County, southern part of Ningxia Province, China. Environ. Geochem. Health 2016, 38, 275–290. [Google Scholar] [CrossRef]
  71. Naaz, A. Anshumali Hydrogeochemistry of fluoride-rich groundwaters in semiarid region of Central India. Arab. J. Geosci. 2015, 8, 10585–10596. [Google Scholar] [CrossRef]
  72. Rafique, T.; Naseem, S.; Ozsvath, D.; Hussain, R.; Bhanger, M.I.; Usmani, T.H. Geochemical controls of high fluoride groundwater in Umarkot sub-district, Thar Desert, Pakistan. Sci. Total Environ. 2015, 530, 271–278. [Google Scholar] [CrossRef]
  73. Liu, H.; Guo, H.; Yang, L.; Wu, L.; Li, F.; Li, S.; Ni, P.; Liang, X. Occurrence and formation of high fluoride groundwater in the Hengshui area of the North China Plain. Environ. Earth Sci. 2015, 74, 2329–2340. [Google Scholar] [CrossRef]
  74. Singh, C.K.; Mukherjee, S. Aqueous geochemistry of fluoride enriched groundwater in arid part of Western India. Environ. Sci. Pollut. Res. 2015, 22, 2668–2678. [Google Scholar] [CrossRef] [PubMed]
  75. Li, L.X.; Xu, D.; Cheng, X.J.; Sun, R.G.; Li, X.Q. Effect of pH on four defluoridation adsorbents under natural high fluoride groundwater. Appl. Mech. Mater. 2014, 643, 335–341. [Google Scholar] [CrossRef]
  76. Gao, Z.J.; Zhu, Z.H.; Liu, X.D.; Xu, Y.L. The formation and model of high fluoride groundwater and in-situ dispelling fluoride assumption in Gaomi City of Shandong Province. J. Groundw. Sci. Eng. 2014, 2, 34–39. [Google Scholar] [CrossRef]
  77. Katsanou, K.; Siavalas, G.; Lambrakis, N. Geochemical controls on fluoriferous groundwaters of the Pliocene and the more recent aquifers: The case of Aigion region, Greece. J. Contam. Hydrol. 2013, 155, 55–68. [Google Scholar] [CrossRef]
  78. Wen, D.; Zhang, F.; Zhang, E.; Wang, C.; Han, S.; Zheng, Y. Arsenic, fluoride and iodine in groundwater of China. J. Geochem. Explor. 2013, 135, 1–21. [Google Scholar] [CrossRef]
  79. Su, C.; Wang, Y.; Xie, X.; Li, J. Aqueous geochemistry of high-fluoride groundwater in Datong Basin, Northern China. J. Geochem. Explor. 2013, 135, 79–92. [Google Scholar] [CrossRef]
  80. Brindha, K.; Elango, L. Geochemistry of fluoride rich groundwater in a weathered granitic rock region, Southern India. Water Qual. Expo. Health 2013, 5, 127–138. [Google Scholar] [CrossRef]
  81. Shan, H.; Dong, Y.; He, X.; Deng, Y.; He, J.; Ma, T.; Wang, Y. Hydrogeochemical characteristics of high As and high F groundwater in Hangjinhouqi, Hetao Plain, China. Procedia Earth Planet. Sci. 2013, 7, 373–376. [Google Scholar] [CrossRef][Green Version]
  82. Xu, F.; Ma, T.; Shi, L.; Zhang, J.W.; Wang, Y.Y.; Dong, Y.H. The hydrogeochemical characteristics of high iodine and fluoride groundwater in the Hetao plain, Inner Mongolia. Procedia Earth Planet. Sci. 2013, 7, 908–911. [Google Scholar] [CrossRef]
  83. Gbadebo, A.M. Groundwater fluoride and dental fluorosis in southwestern Nigeria. Environ. Geochem. Health 2012, 34, 597–604. [Google Scholar] [CrossRef] [PubMed]
  84. Iyatomi, Y.; Hoshina, H.; Seko, N.; Shimada, A.; Ogata, N.; Sugihara, K.; Kasai, N.; Ueki, Y.; Tamada, M. Investigations to increase the efficiency of fluorine and boron removal from groundwater using radiation-induced graft polymerization adsorbent. Trans. At. Energy Soc. Jpn. 2010, 9, 330–338. [Google Scholar] [CrossRef][Green Version]
  85. Ketata, M.; Hamzaoui, F.; Gueddari, M.; Bouhlila, R.; Ribeiro, L. Hydrochemical and statistical study of groundwaters in Gabes-south deep aquifer (south-eastern Tunisia). Phys. Chem. Earth 2011, 36, 187–196. [Google Scholar] [CrossRef]
  86. Chae, G.T.; Yun, S.T.; Kwon, M.J.; Kim, Y.S.; Mayer, B. Batch dissolution of granite and biotite in water: Implication for fluorine geochemistry in groundwater. Geochem. J. 2006, 40, 95–102. [Google Scholar] [CrossRef]
  87. Martinez, S.E.; Carrillo-Rivera, J.J. Socio-economic constraints of groundwater in Capital La Rioja, Argentina. Environ. Geol. 2006, 49, 875–886. [Google Scholar] [CrossRef]
  88. Jia, Y.; Cao, Z.; Li, Z.; Du, F.; Huang, C.; Lin, H.; Wang, W.; Zhai, M. Nonlinear evolution characteristics and seepage mechanical model of fluids in broken rock mass based on the bifurcation theory. Sci. Rep. 2024, 14, 10982. [Google Scholar] [CrossRef]
  89. Cao, Z.; Xiong, Y.; Xue, Y.; Du, F.; Li, Z.; Huang, C.; Wang, S.; Yu, Y.; Wang, W.; Zhai, M.; et al. Diffusion evolution rules of grouting slurry in mining-induced cracks in overlying strata. Rock Mech. Rock Eng. 2025, 58, 6493–6512. [Google Scholar] [CrossRef]
Figure 1. Location map of the study area.
Water 18 00600 g001
Figure 2. Hydrochemical characteristics of groundwater in the study area. (a) Major cations (Ca2+, Mg2+, K+, and Na+). (b) Major anions (Cl, SO42−, HCO3, and CO32−). (c) Total dissolved solids (TDS), pH, electrical conductivity (EC), and fluoride (F).
Water 18 00600 g002
Figure 3. Piper diagram of groundwater in the study area.
Water 18 00600 g003
Figure 4. Model performance.
Water 18 00600 g004
Figure 5. Ion-ratio matrix for process identification.
Water 18 00600 g005
Figure 6. SHAP contributions of individual predictors.
Water 18 00600 g006
Figure 7. Differences in driver contributions across transition stages: (a) High F; (b) Ultra-High F.
Water 18 00600 g007aWater 18 00600 g007b
Figure 8. “Evolutionary trajectory” of SHAP values with F concentration.
Water 18 00600 g008
Figure 9. Saturation states and dissolution/precipitation behavior of major minerals. (a) saturation indices (SI) of evaporites and carbonates; (b) SI_fluorite versus dissolved F− (approaching equilibrium but remaining undersaturated); (c) ΔSI required for key minerals to reach equilibrium (directional evolution).
Water 18 00600 g009
Figure 10. Inversion simulation schematic diagram. (a) Net reaction fluxes of candidate phases along the evolution pathway; (b) ΔNa vs. −d_Halite; (c) ΔCl vs. −d_Halite; (d) ΔS(6) vs. −d_Gypsum; (e) ΔMg vs. −d_Dolomite; (f) ΔF vs. −2·d_Fluorite.
Water 18 00600 g010aWater 18 00600 g010b
Figure 11. Ca budget decomposition quantitative decomposition chart. (a) Mean Ca flux contributions (mol/kgw) from dominant Ca-bearing sources (gypsum and dolomite dissolution) and the major Ca sink (calcite precipitation). (b) Mean halite dissolution flux (mol/kgw). (c) Mean fluorite dissolution flux (mol/kgw).
Water 18 00600 g011
Figure 12. Threshold plot of intergenerational risk disparity.
Water 18 00600 g012
Figure 13. Sensitivity contribution plot.
Water 18 00600 g013
Table 1. Hydrostratigraphic division of aquifer groups in the study area.
SystemSeriesSubunit (q)Aquifer GroupBottom Boundary Depth (m)Vertical Water-Quality Change
QuaternaryPleistoceneUpper (q3)II160–230Deep freshwater zone
QuaternaryPleistoceneMiddle (q2)III360–480Deep freshwater zone
QuaternaryPleistoceneLower (q1)IV700–800Deep freshwater zone
Disclaimer/Publisher’s Note: The statements, opinions and data contained in all publications are solely those of the individual author(s) and contributor(s) and not of MDPI and/or the editor(s). MDPI and/or the editor(s) disclaim responsibility for any injury to people or property resulting from any ideas, methods, instructions or products referred to in the content.