1. Introduction
Drought research in the Yangtze River Basin (YRB) has become increasingly important with the rising frequency and severity of droughts in recent years [
1]. The Yangtze River, one of China’s most crucial water sources, sustains millions of people, as well as a large agricultural sector and diverse ecosystems [
2]. However, climate change, urbanization, and poor water management have heightened the region’s vulnerability to droughts. It is therefore important to study the causes, impacts, and mitigation strategies for droughts in the YRB as a means of ensuring sustainable water resources amid future climate variability. A significant portion of drought research in the region focuses on improving the accuracy of drought detection and forecasting [
3]. A key tool for this purpose is the Standardized Precipitation Index (SPI), which quantifies drought severity and duration by measuring precipitation deficits relative to a historical reference period [
4]. The SPI is particularly effective at identifying meteorological droughts, which often precede hydrological or agricultural droughts. Recent studies in the YRB have combined the SPI with other indices, such as the Standardized Precipitation Evapotranspiration Index, to improve drought monitoring systems [
5,
6].
The YRB faces unique challenges because of the variability of drought events. While some areas experience prolonged dry spells, others face seasonal droughts that disrupt agricultural activities [
7]. A comprehensive approach is essential to understanding these issues. Recent studies have examined the spatial and temporal variations in droughts within the YRB, offering valuable insights into the hydrological and meteorological processes that exacerbate water scarcity [
8,
9]. This research highlights how human activities, such as water extraction for agriculture, have contributed to the increased frequency of droughts, emphasizing the need for improved water management strategies.
There is increasing attention on the role of climate change in altering precipitation patterns and intensifying drought conditions across the YRB [
10]. This research is crucial for understanding future drought risks and developing adaptation strategies. For example, a recent study analyzed meteorological and hydrological drought risks under future climate scenarios, emphasizing how land-use changes and shifting precipitation patterns could further strain the region’s water resources [
8]. The findings provide an essential reference for formulating long-term water management policies that can adapt to changing environmental conditions. Recent advances in climate research have led to the development of data fusion techniques that combine various data sources, such as satellite observations, weather station data, and model outputs from CMIP6 simulations [
11]. By integrating these datasets, researchers can improve the accuracy of climate projections and better understand the complex interactions within regional climate systems. For instance, a recent study combined CMIP6 models with other climate data to assess how drought hazards in China would change under different global temperature-rise scenarios [
12]. The findings indicate that rising global temperatures would significantly increase the frequency and severity of droughts, particularly in southern China.
Accurately simulating climate scenarios opens up new opportunities for regional drought adaptation strategies [
3,
11]. By understanding how different regions will respond to changing precipitation patterns, policymakers can develop region-specific plans that incorporate sustainable water use practices, alternative water sources, and early warning systems for drought. Drought identification is a critical task in drought research, with various indices used to monitor and assess drought conditions. The SPI is simple to use and provides effective identification of droughts based on precipitation deficits [
13]. It can be calculated over various time scales, ranging from a few months to several years, enabling researchers to assess both short- and long-term droughts. Recent studies have reaffirmed the importance of the SPI in drought monitoring while exploring its limitations and potential for improvement [
14]. The SPI is often used alongside the Standardized Runoff Index to enhance drought identification and classification. For example, a recent study combined the SPI and Standardized Runoff Index to examine drought patterns in the Poyang Lake Basin, predicting how these patterns might evolve under different climate scenarios [
15]. This research highlighted the effectiveness of using multiple drought indices to capture a broader range of drought conditions and improve early warning systems.
Despite the progress made in drought identification and forecasting in the YRB, several limitations persist. One key challenge lies in the reliance on traditional statistical methods and individual drought indices, such as the SPI, which may not fully capture the complex and multifaceted nature of droughts, particularly in areas with significant spatial and temporal variability [
16]. Additionally, while machine learning techniques offer promising advances in drought prediction, their performance can be sensitive to the quality and quantity of input data, and they may struggle to account for the full range of environmental variables that influence drought conditions [
17]. Moreover, the integration of multiple data sources, such as CMIP6 model outputs, presents challenges in terms of data consistency and compatibility. The gap between model projections and real-world observations further complicates the development of accurate and reliable drought forecasting systems. These issues highlight the need for more robust, integrated approaches that combine the strengths of both traditional and modern techniques to improve the accuracy and applicability of drought identification in the region [
18,
19].
Recent drought research in the YRB can be broadly categorized into three interconnected strands. The first focuses on precipitation-based drought indices, particularly the SPI and its multi-time-scale applications, which remain the foundation for regional drought monitoring because of their simplicity and interpretability. A second strand extends beyond single-index approaches by integrating additional hydroclimatic variables, such as evapotranspiration or runoff, to improve drought characterization under changing climate conditions. The third and most recent strand emphasizes data fusion and machine learning techniques, combining station observations, remote sensing products, and climate model outputs to enhance spatial continuity and predictive skill. Despite these advances, existing studies often evaluate methods at isolated time scales or within limited sub-regions, and comparatively little attention has been paid to cross-scale robustness and spatial consistency in large, human-influenced basins. These gaps motivate the present study, which systematically compares multiple fusion strategies across SPI time scales in the YRB.
This paper describes a comparison of traditional CMIP6 data fusion methods and machine learning (ML) fusion approaches in drought identification across the YRB. Bias-corrected CMIP6 datasets (15 models) and meteorological station precipitation data (1960–2014) are calibrated via bilinear interpolation and cumulative distribution frequency matching to unify observational and model scales. Three traditional methods and five ML models are then used to compute drought indices over 3-, 6-, and 12-month periods (SPI-3, SPI-6, and SPI-12, respectively). Traditional methods exhibit spatial limitations in the mountainous upper YRB because they oversmooth terrain-induced precipitation gradients but perform stably in flat mid-lower regions.
2. Methods
2.1. Study Area and Dataset
The YRB (24–36° N, 90–122.5° E) is the world’s third-largest river system, extending approximately 6300 km longitudinally from its western headwaters to the eastern estuary. It spans an area of 1.8 × 10
6 km
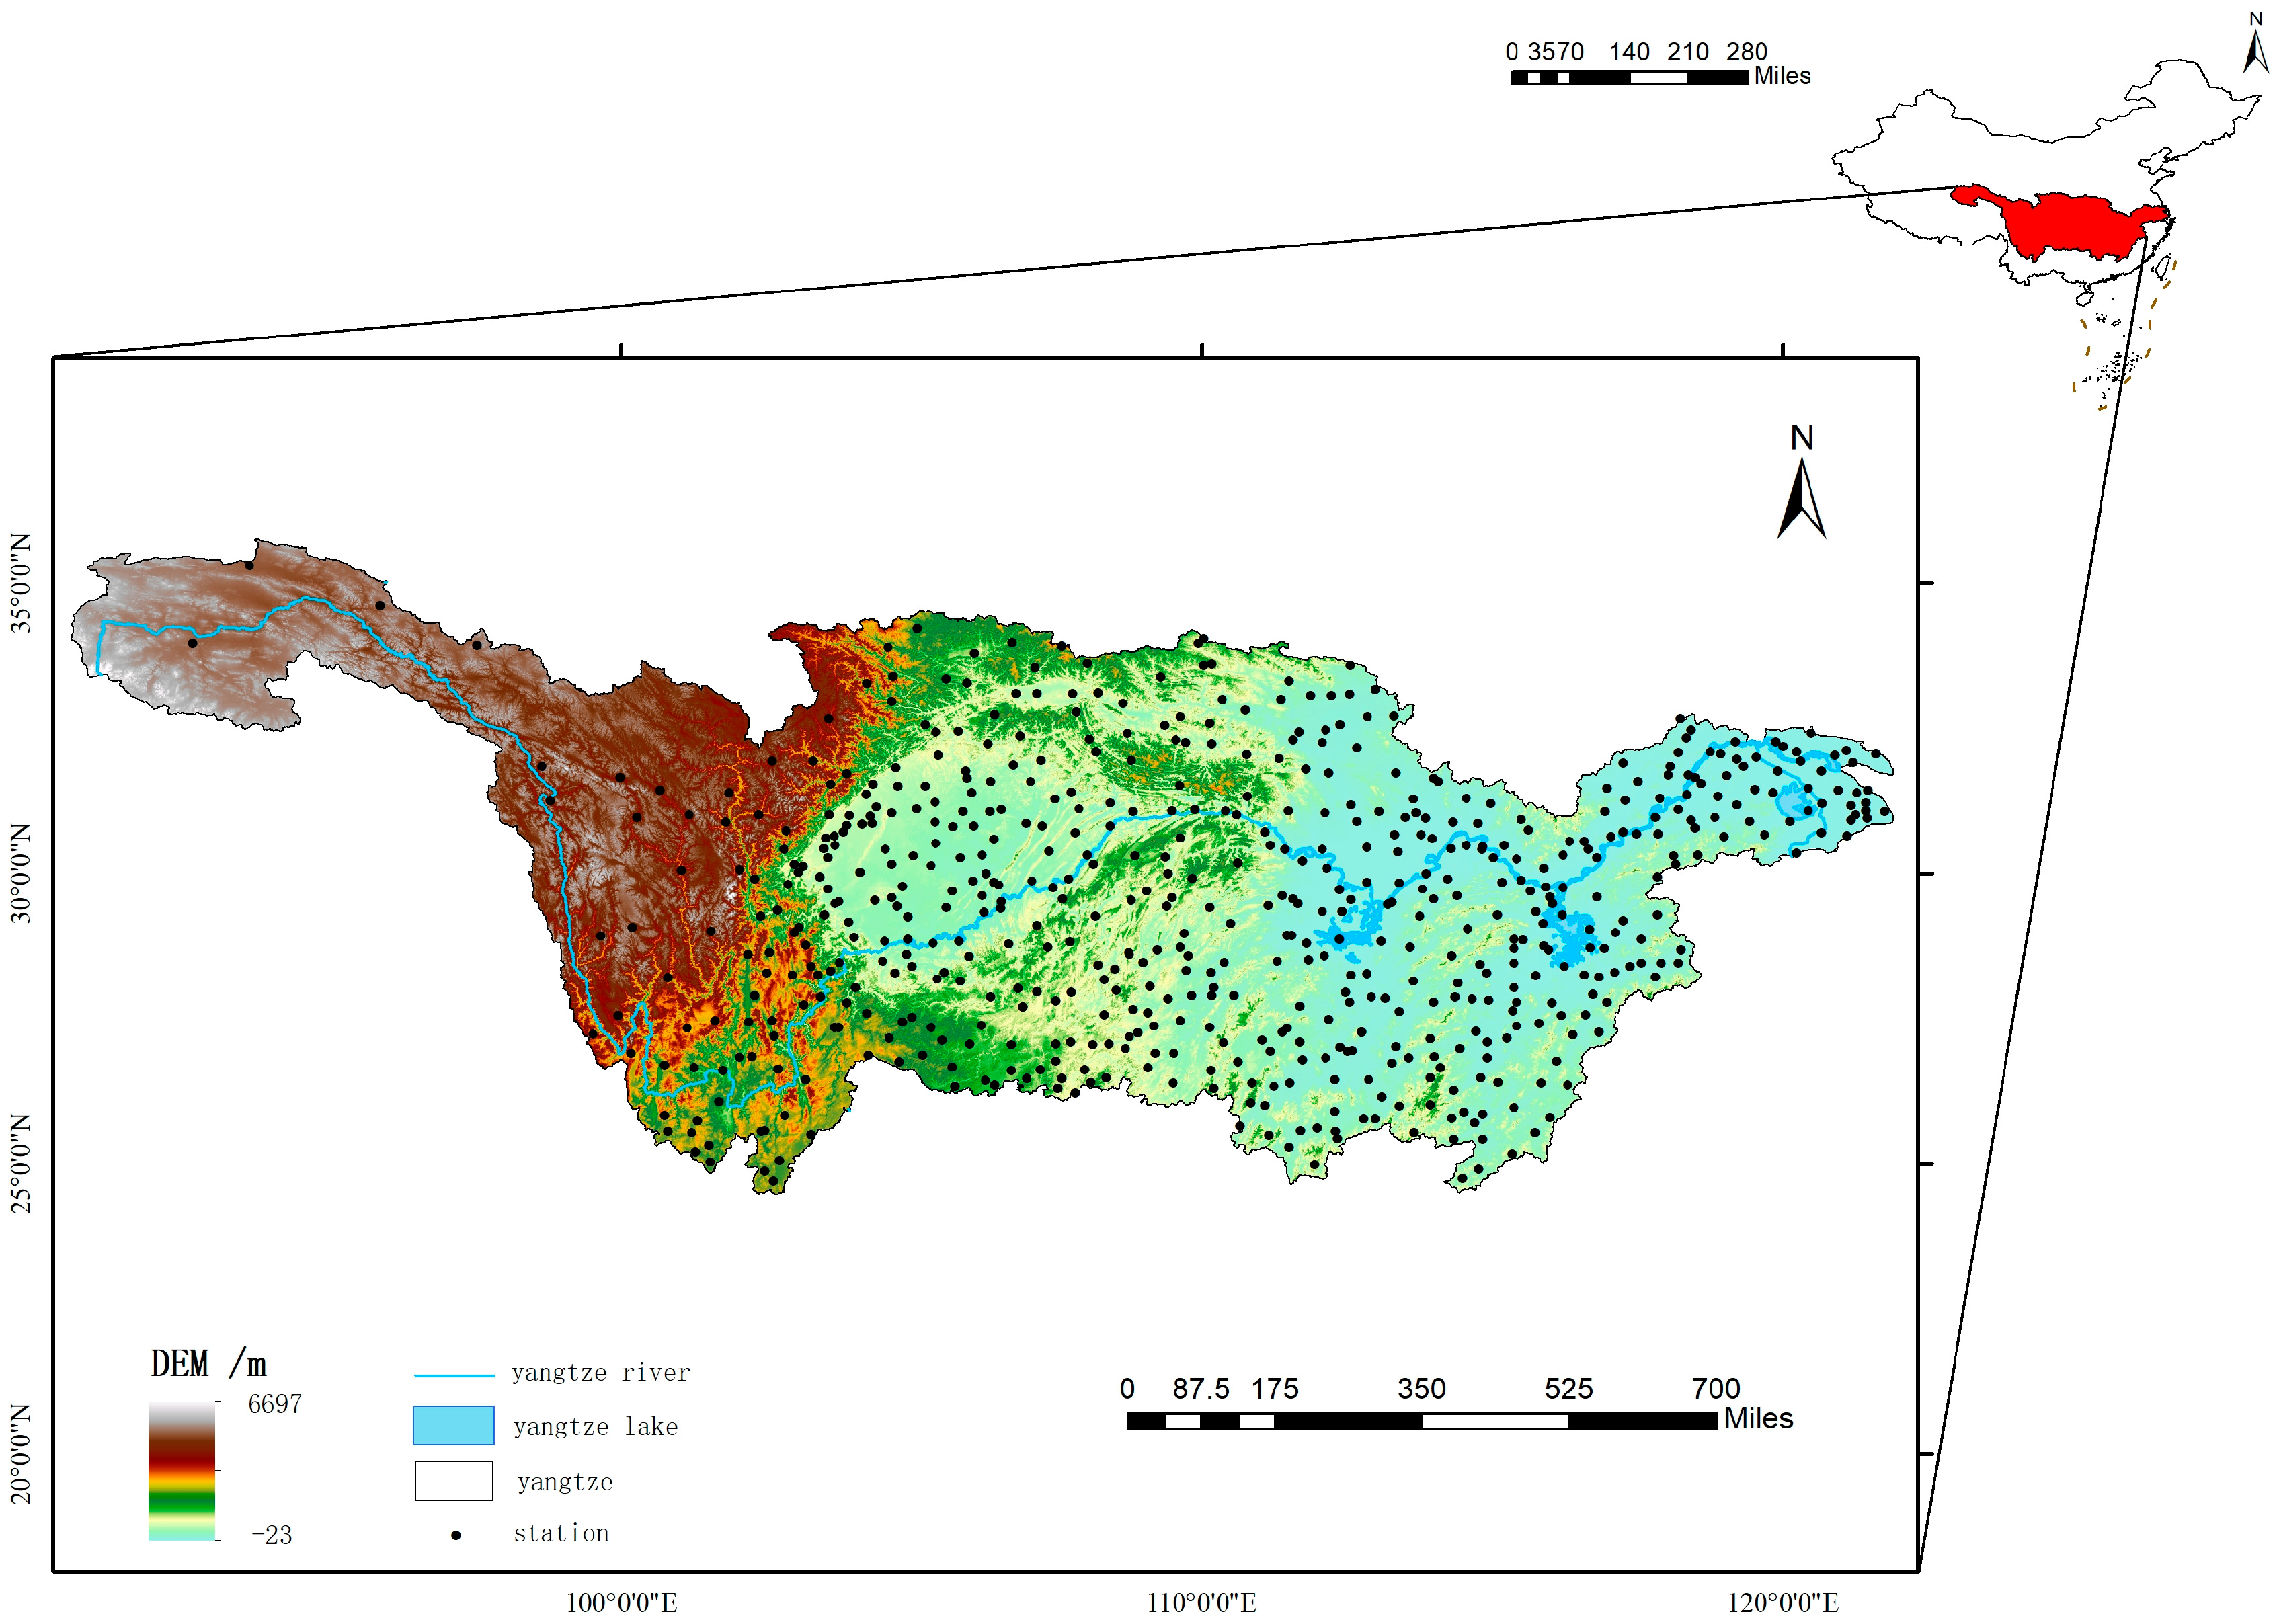
2, covering 11 provinces and numerous cities, and accounts for over 40% of China’s total population and GDP. This study selected data from 733 meteorological stations with complete and relatively uniform data distributions across the YRB, of which 603 stations had fewer than 200 days of missing data in the time series (see
Figure 1). These stations provide a comprehensive and systematic distribution of precipitation data and also reflect regional precipitation characteristics. The spatial distribution of the meteorological stations is shown in the
Figure 1. The data used in this study cover the 55-year period from 1960 to 2014. The precipitation data were sourced from the National Meteorological Science Data Center (
https://data.cma.cn/).
The climate model data used in this study were obtained from CMIP6, which offers higher spatial resolution and improved parameterization schemes than previous versions. The CMIP6 output has been widely used in research on climate change and climate extremes. Precipitation data from 15 CMIP6 global climate models (ACCESS-CM2, ACCESS-ESM1-5, BCC-CSM2-MR, CanESM5, CESM2-WACCM, CIESM, CMCC-CM2-SR5, FIO-ESM-2-0, IITM-ESM, INM-CM4-8, INM-CM5-0, IPSL-CM6A-LR, MPI-ESM1-2-LR, MRI-ESM2-0, and NESM3) were employed in this study, with the data downloaded from the official CMIP6 website (
https://metagrid.esgf-west.org/search, accessed on 15 March 2024). The historical model period spans from 1961 to 2014. Details of the source data are presented in
Table 1.
2.2. Grid-Based Pretreatment
Global climate models typically have a coarse spatial resolution that is not uniform across different models. Thus, bilinear interpolation was employed to resample the model data onto a uniformly spaced 0.5° × 0.5° grid.
The specific formula used is as follows:
where
represents longitude and
represents latitude. Specifically,
and
denote the longitudes of the two neighboring grid points surrounding the target location
, while
and
denote the latitudes of the corresponding neighboring grid points surrounding
. The value
,
,
and
represent the precipitation values at the four surrounding grid points
and
respectively. The bilinear interpolation is then performed by linear interpolation along the
x-direction followed by linear interpolation along the
y-direction.
The Empirical Distribution Cumulative Density Function bias correction method is widely recognized for its reliability in climate studies. This function is grounded in the cumulative probability distributions of observed data, historical simulations, and projected datasets [
20,
21]. When correcting the deviation in the historical simulations of a climate model, the goal is to adjust the mean values of temperature and precipitation simulated by the model to match the corresponding observations for the same period. To correct deviations in the climate model projection data, the cumulative probability corresponding to a future value must be calculated. Assuming that the difference between the corresponding measured and historical simulated data remains unchanged at this cumulative probability, the difference (Δ) can be used to correct the climate model data. The Empirical Distribution Cumulative Density Function is computed as follows:
where
is the climatic factor;
is the cumulative probability distribution function;
denotes measured data from the historical period;
represents simulated data from the historical period; and
denotes the model simulation data for that period.
To evaluate CMIP6 model performance in simulating precipitation events, spatial scale discrepancies must be resolved between coarse-resolution model outputs (typically 50–100 km grids) and point-scale station observations. Direct comparisons between these datasets risk systematic biases [
22,
23]. To align with established methodologies for minimizing scale-driven uncertainties, our analysis entailed the selection of grid cells containing at least one station to satisfy spatial representativeness thresholds, followed by the generation of a gridded reference dataset through arithmetic averaging of all station observations within each valid grid cell. This workflow adheres to standardized protocols for climate model validation and leverages spatially consistent data aggregation techniques [
24,
25].
2.3. Fusion Methods and Statistical Validation
To systematically investigate the impacts of different data fusion approaches on drought identification capabilities, three categories of traditional statistical methods and five types of ML models are considered (see
Table 2). Traditional weighting-based methods emphasize linear aggregation and are commonly applied to characterize large-scale spatial patterns under relatively stable climatic conditions, whereas ML approaches exploit nonlinear mapping and data-driven learning to capture the complex interactions and spatial heterogeneity inherent in drought processes.
All ML models were implemented using standard default hyperparameter settings provided by widely adopted libraries. This configuration was intentionally selected to ensure methodological consistency, reproducibility, and fairness in cross-model comparison, rather than to maximize the performance of any single algorithm through extensive tuning. By adopting a uniform parameter strategy, the comparative analysis focuses on the intrinsic modeling characteristics of each fusion approach and their relative stability across multiple drought time scales. This design enables an objective evaluation of how distinct fusion techniques influence the robustness and scale sensitivity of integrated drought identification models.
In addition to methodological categorization, the ML models adopted in this study differ in their conceptual mechanisms and suitability for drought identification. The Random Forest (RF) classifier is an ensemble tree-based method that aggregates multiple decision trees to capture nonlinear relationships and interaction effects among predictors, making it particularly effective for handling heterogeneous hydroclimatic signals across space and time. The Radial Basis Function (RBF) network employs distance-sensitive kernel functions, enabling localized learning and enhanced representation of spatial variability, which is advantageous for drought mapping in regions with strong geographic heterogeneity.
Backpropagation (BP)-based neural networks learn complex input–output mappings through multilayer nonlinear transformations, allowing them to model multiscale variability in precipitation-driven drought indices. However, BP methods can be sensitive to noise and data availability. The Extreme Learning Machine (ELM) adopts a single-hidden-layer structure with randomly assigned hidden parameters, offering computational efficiency but reduced flexibility in capturing localized extremes. The BP-Adaboost model combines neural learning with adaptive boosting to improve generalization by emphasizing misclassified samples. Collectively, these models were selected to represent a spectrum of learning mechanisms, enabling a systematic comparison of their ability to characterize drought dynamics across SPI time scales.
The SPI was initially developed to assess drought conditions in Colorado, USA [
26]. The SPI formally identifies a drought condition when observed precipitation within a defined temporal interval exhibits persistent deviation below the climatological mean for that specific period, as established by long-term hydroclimatic records. Conversely, if precipitation is significantly higher than average, flooding may occur. The classification standards for drought and flood severity levels are presented in
Table 3; the specific calculation formula follows the Meteorological Drought Classification Standard (GB/T 20481-2017) [
27].
The SPI can be computed over multiple time scales. Thus, it can not only reflect changes in precipitation over short time periods but also describe the evolution of water resources over longer time scales. The 1-month SPI reflects short-term precipitation changes that directly affect ecology and life; the 3-month SPI describes seasonal-scale precipitation changes related to agricultural drought and flooding; the 6-month SPI identifies seasonal to interannual precipitation changes, affecting hydrological parameters; and the 12-month SPI reflects interannual precipitation variability related to large-scale climate patterns.
The True Positive Rate (TPR) describes the accuracy or success rate as the proportion or accuracy of hitting a target. The range is [0, 1], with values closer to 1 indicating stronger drought recognition ability.
where TP denotes True Positive, indicating the number of droughts correctly predicted as droughts, and FN denotes False Negative, indicating the number of drought predictions that are actually non-drought periods.
The False Positive Rate (FPR) defines the no-drought predictions as the proportion of all days when drought occurs. The range is [0, 1], with values closer to 0 indicating stronger drought identification ability.
where FP denotes False Positive, indicating the number of non-drought predictions that are actually drought periods, and TN denotes True Negative, indicating the number of correct non-drought predictions.
The Accuracy metric describes the ratio of the number of correct predictions to the total number of samples. The range is [0, 1], with values closer to 1 indicating stronger drought recognition ability.
The Precision metric describes how many of the predicted drought days were true droughts. The range is [0, 1], with values closer to 1 indicating stronger drought recognition ability.
The F-Measure is a composite metric based on the average of the Precision and TPR indicators. The range is [0, 1], and values closer to 1 indicate stronger drought recognition ability.
3. Results
3.1. Data Accuracy Analysis
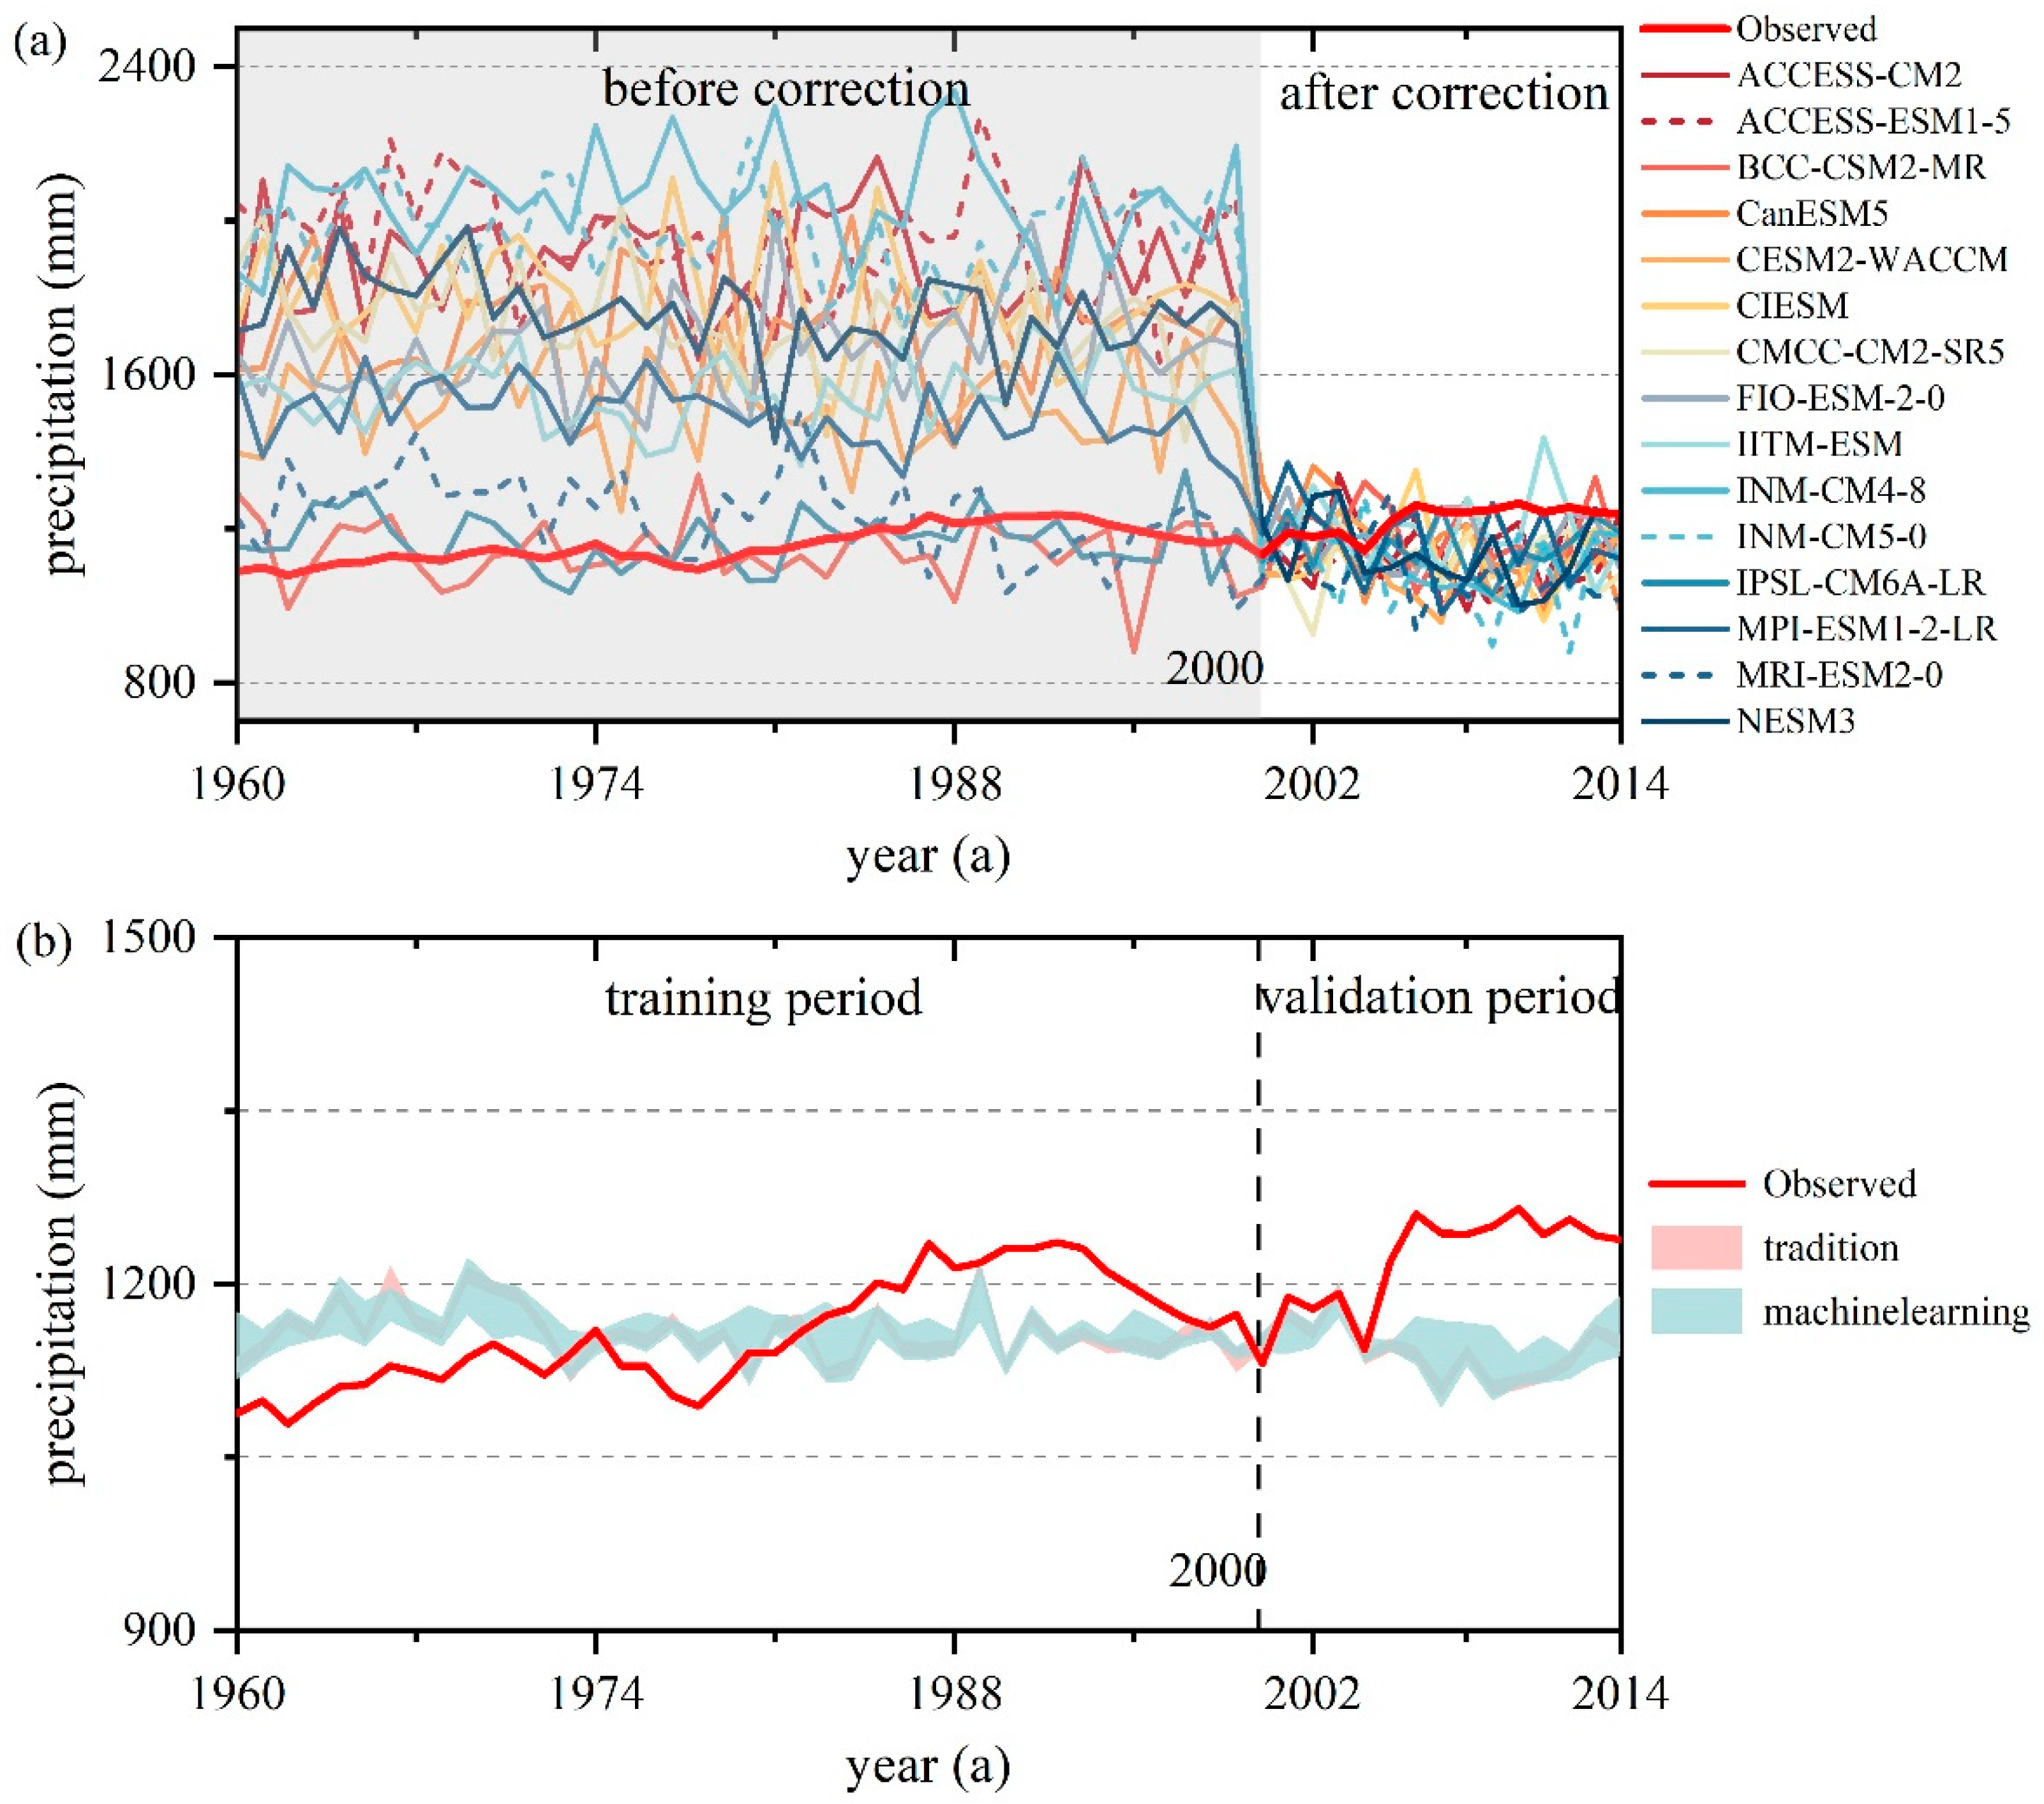
Figure 2a presents annual precipitation data from various climate models before and after downscaling and bias correction, with the observed values labeled as “Observed”. The data are divided into two periods: before and after 2000. Prior to 2000, no downscaling or bias correction was applied, and the precipitation data from different models showed significant deviations from the observed values. Some models, such as ACCESS-CM2 and BCC-CSM2-MR, exhibited greater variability. After 2000, bias correction was applied, reducing the discrepancies between the model outputs and observed values, particularly for ACCESS-CM2 and CanESM5. However, FIO-ESM-2-0 and NESM3 still showed slight deviations, even after correction. These results underscore the importance of bias correction in enhancing the accuracy of climate model predictions, especially in aligning with observed precipitation trends.
Figure 2b shows the range of annual precipitation across all climate models, fused using traditional fusion (green shading) and ML (red shading). The data are divided into two periods: 1960–2000 as the training period and 2000–2014 as the validation period. The observed precipitation values are marked as “Observed” (red line). During the training period, both fusion methods produced similar precipitation ranges, with the traditional method slightly underestimating the observed values, while the ML method aligned more closely with the observed trend. In the validation period, the ML-based fusion method more accurately represented the observed precipitation, maintaining a closer match to the observed values than the traditional method. This highlights the superior predictive capability of the ML fusion approach, particularly in reproducing precipitation patterns in the post-2000 period.
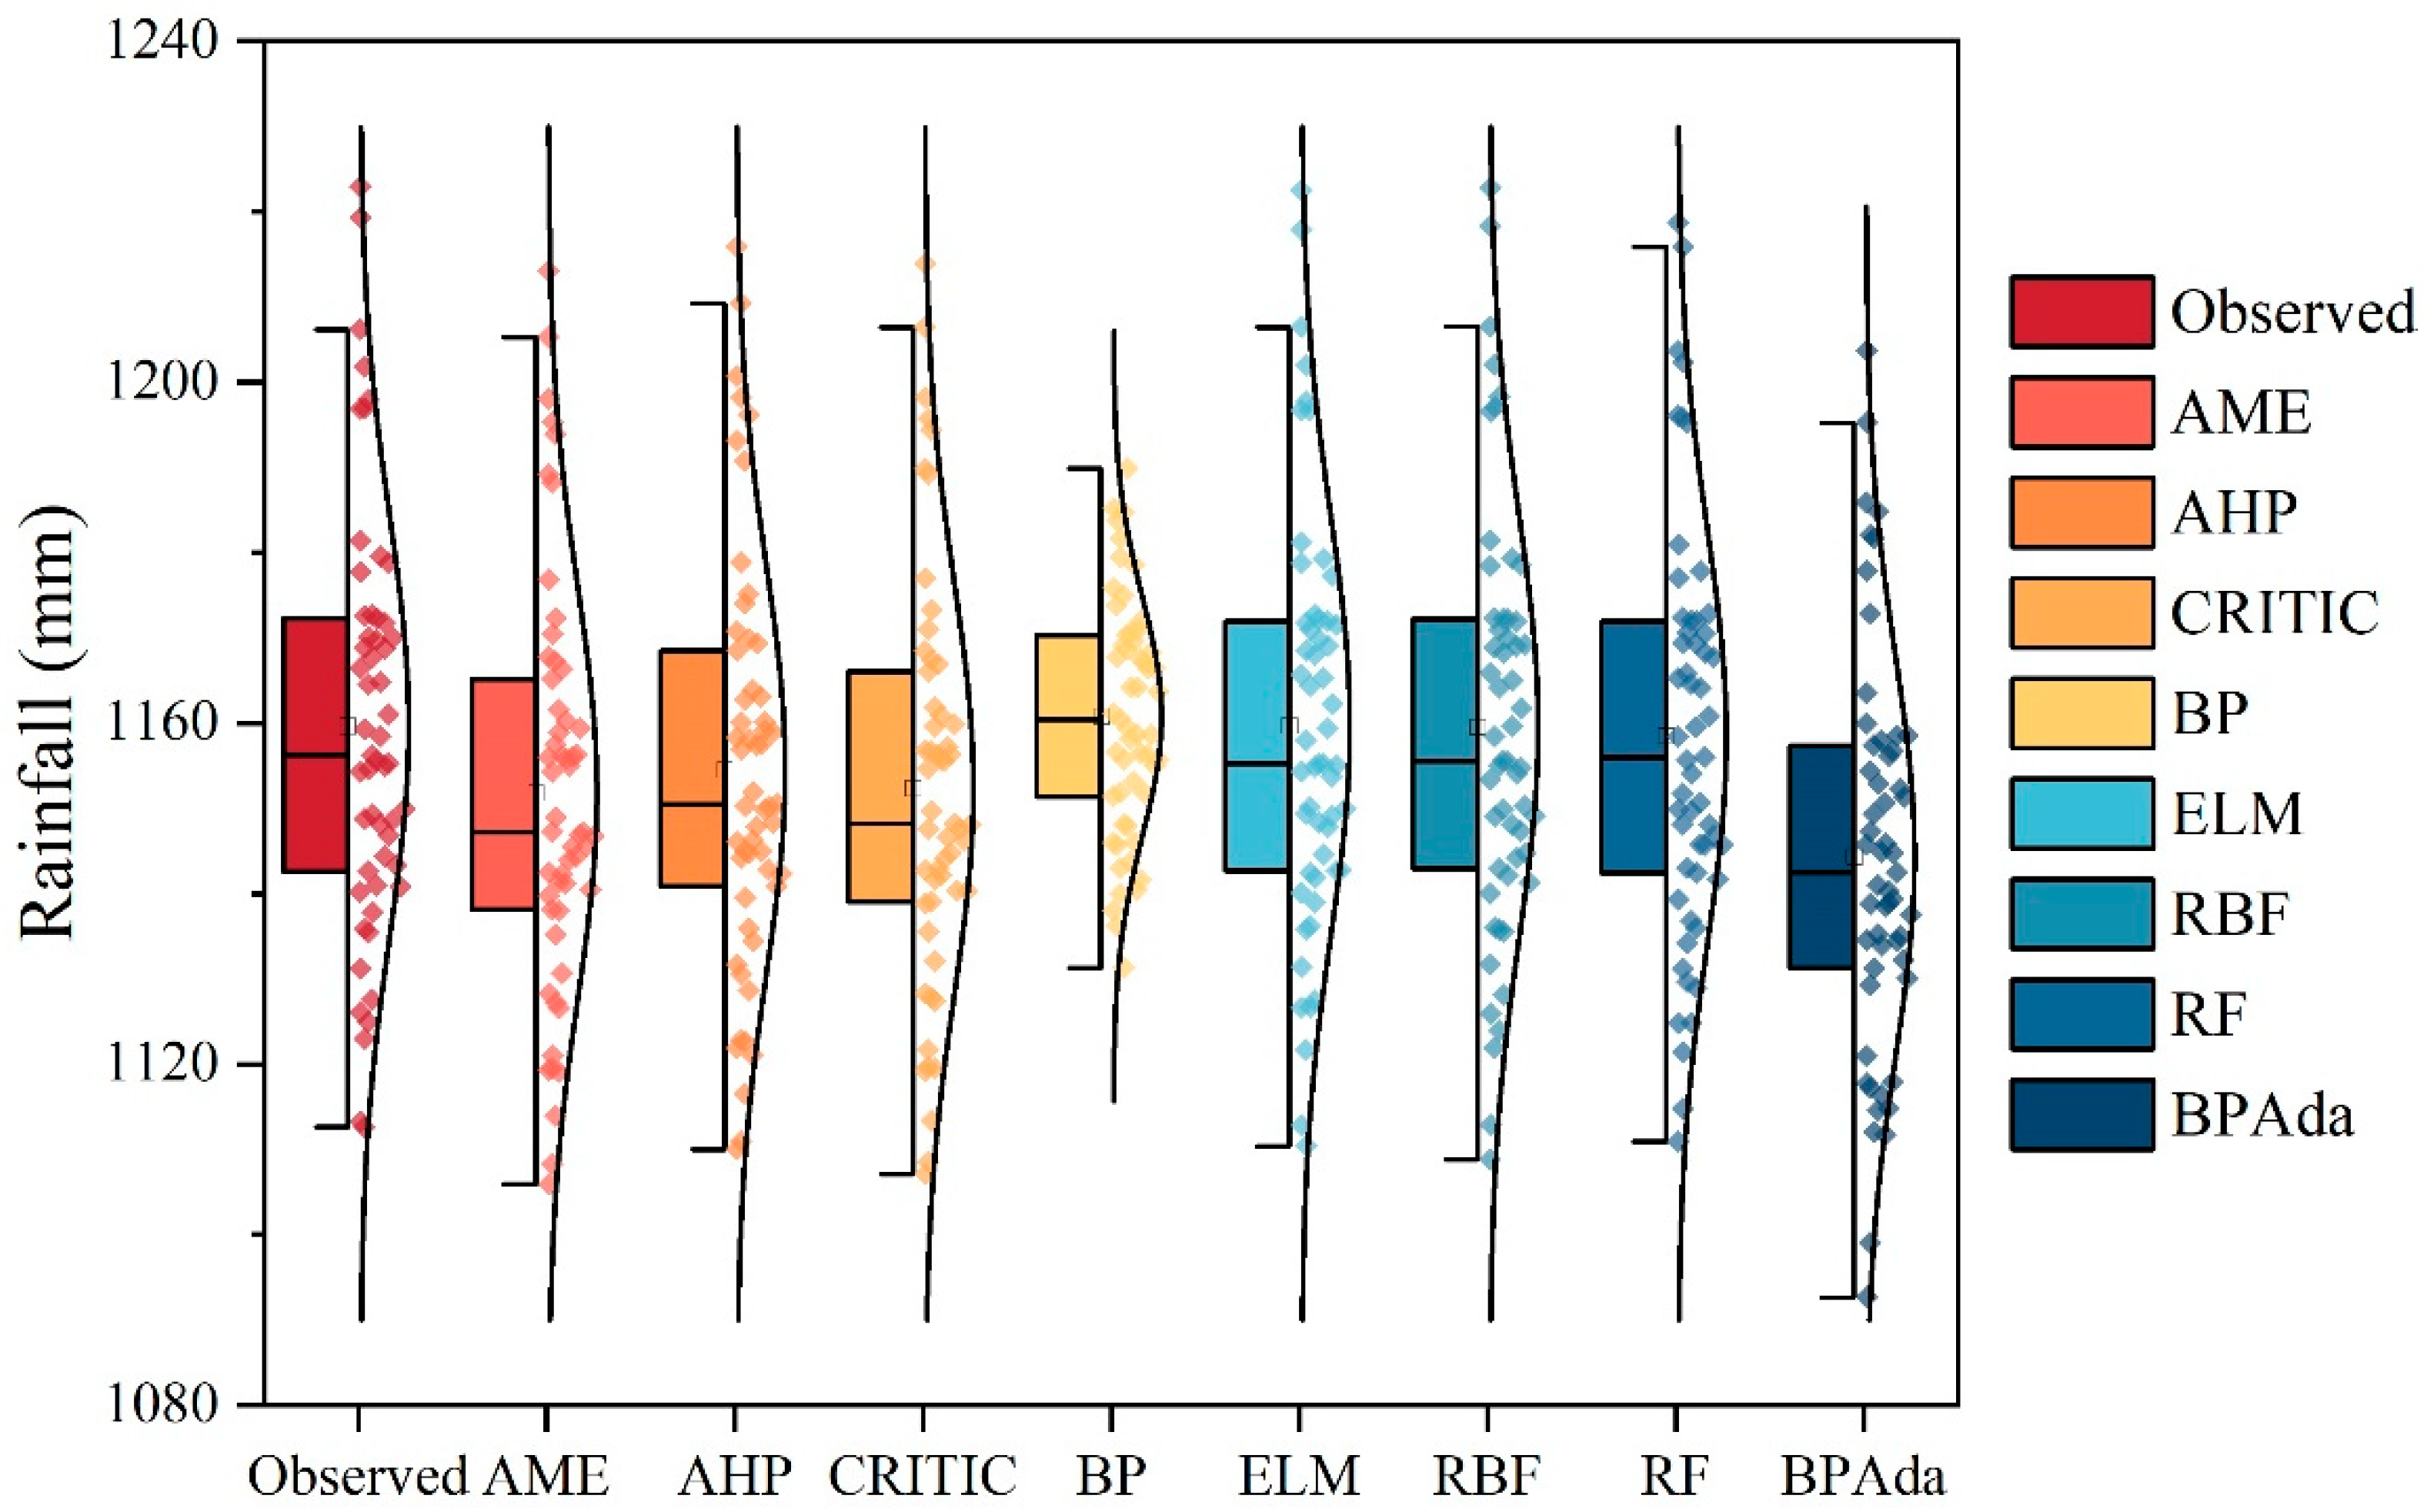
Figure 3 compares annual precipitation predictions from observations, traditional statistical methods, and ML models, revealing that all methods produce predictions within a 0.4% deviation of the observed median (1160 mm, range: 1120–1180 mm). Traditional methods show nuanced differences: AME (median 1161 mm) and AHP (1162 mm) exhibit tight distributions (1140–1180 mm and 1130–1180 mm, respectively), but with occasional overestimations and underestimations, whereas CRITIC (1163 mm) demonstrates superior stability with minimal outliers. ML models display varied performance—BP overestimates the median (1165 mm) and produces the widest range (1135–1185 mm) with prominent upper outliers, whereas ELM and RF match the observations exactly (1160 mm) and have compact distributions (1135–1180 mm) with few anomalies. RBF (1163 mm) maintains reasonable accuracy but shows subtle instability in its extremes. Across all methods, the prediction reliability diminishes in extreme precipitation scenarios, with RF and CRITIC emerging as the most balanced in terms of an accuracy–stability tradeoff, contrasting with BP’s higher variability.
In general, the medians of the RF and RBF models are closest to the observed value (1160 mm), indicating the highest prediction accuracy. Other models, such as AME, AHP, and CRITIC, produce medians that are very close to the observed value, performing well overall. However, the median of BP is slightly higher than the observed value, which may lead to a slight overestimation of precipitation. ELM and RBF demonstrate the most stable predictions, with boxplot ranges closely aligned with the observed values. By contrast, BP and RBF have relatively wider boxplots, suggesting greater prediction fluctuations and lower stability. The AME, BP, and RBF models produce outliers, particularly in higher precipitation ranges, which may indicate instability in the predictions under certain conditions, making them more susceptible to extreme data.
3.2. Seasonal Analysis of Data Precision
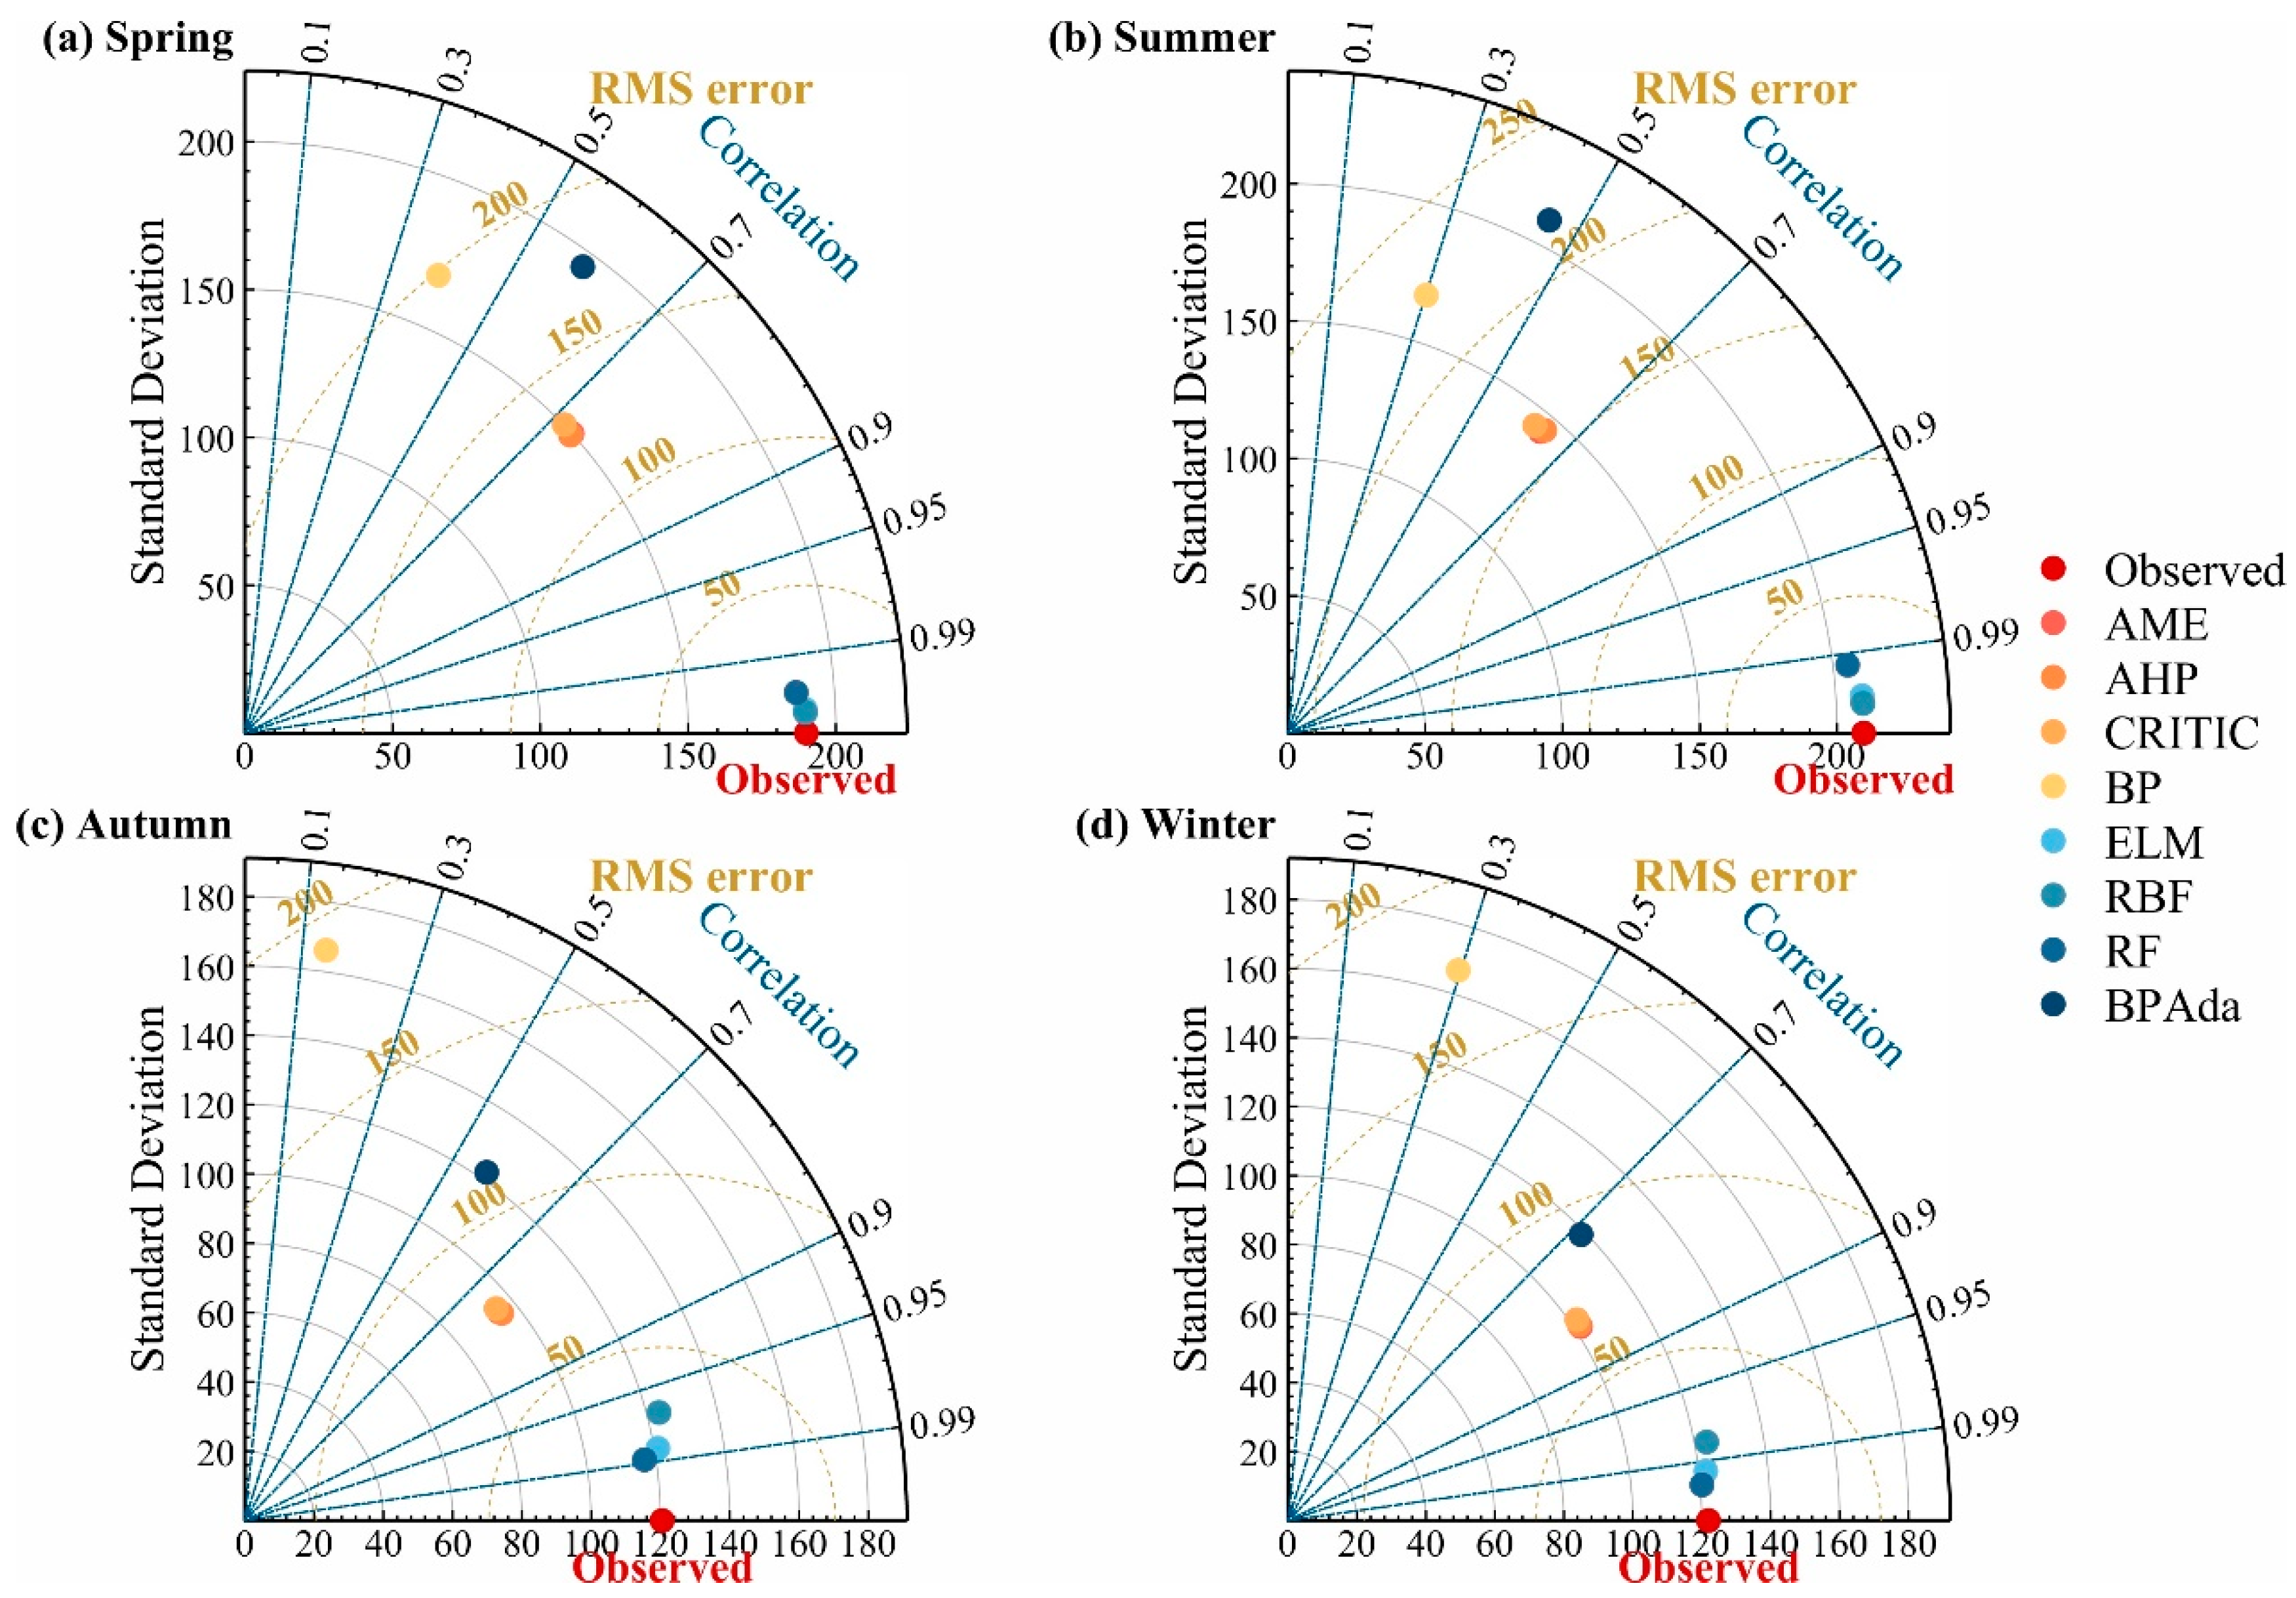
Figure 4 evaluates the seasonal precipitation prediction accuracy of fusion methods using Taylor diagrams, with observed values serving as the benchmark. Across all seasons, ELM, RBF, and RF consistently exhibit optimal performance, showing the highest correlation, minimal root mean square (RMS) error, and standard deviations that are closely aligned with the observations. By contrast, BP demonstrates the poorest performance year-round, with markedly lower correlation, elevated RMS errors, and significant deviations in precipitation variability. BP-Adaboost ranks second-worst in all seasons, trailing slightly behind BP in terms of prediction accuracy. Traditional methods show intermediate performance, remaining consistently further from the observed benchmark than ML models, but outperforming BP and BP-Adaboost. Seasonal analysis reveals no substantial shifts in method rankings, with ELM/RBF/RF maintaining their superiority in spring, summer, autumn, and winter, while BP persistently shows the largest discrepancies in correlation, error magnitude, and variance representation.
The analysis conclusively demonstrates that BP exhibits the lowest prediction accuracy across all seasons, with BP-Adaboost ranking as the second-worst method. By contrast, ELM, RBF, and RF consistently emerge as the top-performing models, demonstrating near-optimal alignment with observed values through high correlation coefficients, minimal RMS error, and standard deviations that closely match the observational data. While traditional methods surpass BP and BP-Adaboost in terms of accuracy, they still display significant deviations from observed values, particularly when compared with the superior precision of ELM, RBF, and RF.
3.3. Spatial Distribution Analysis of Drought Frequency
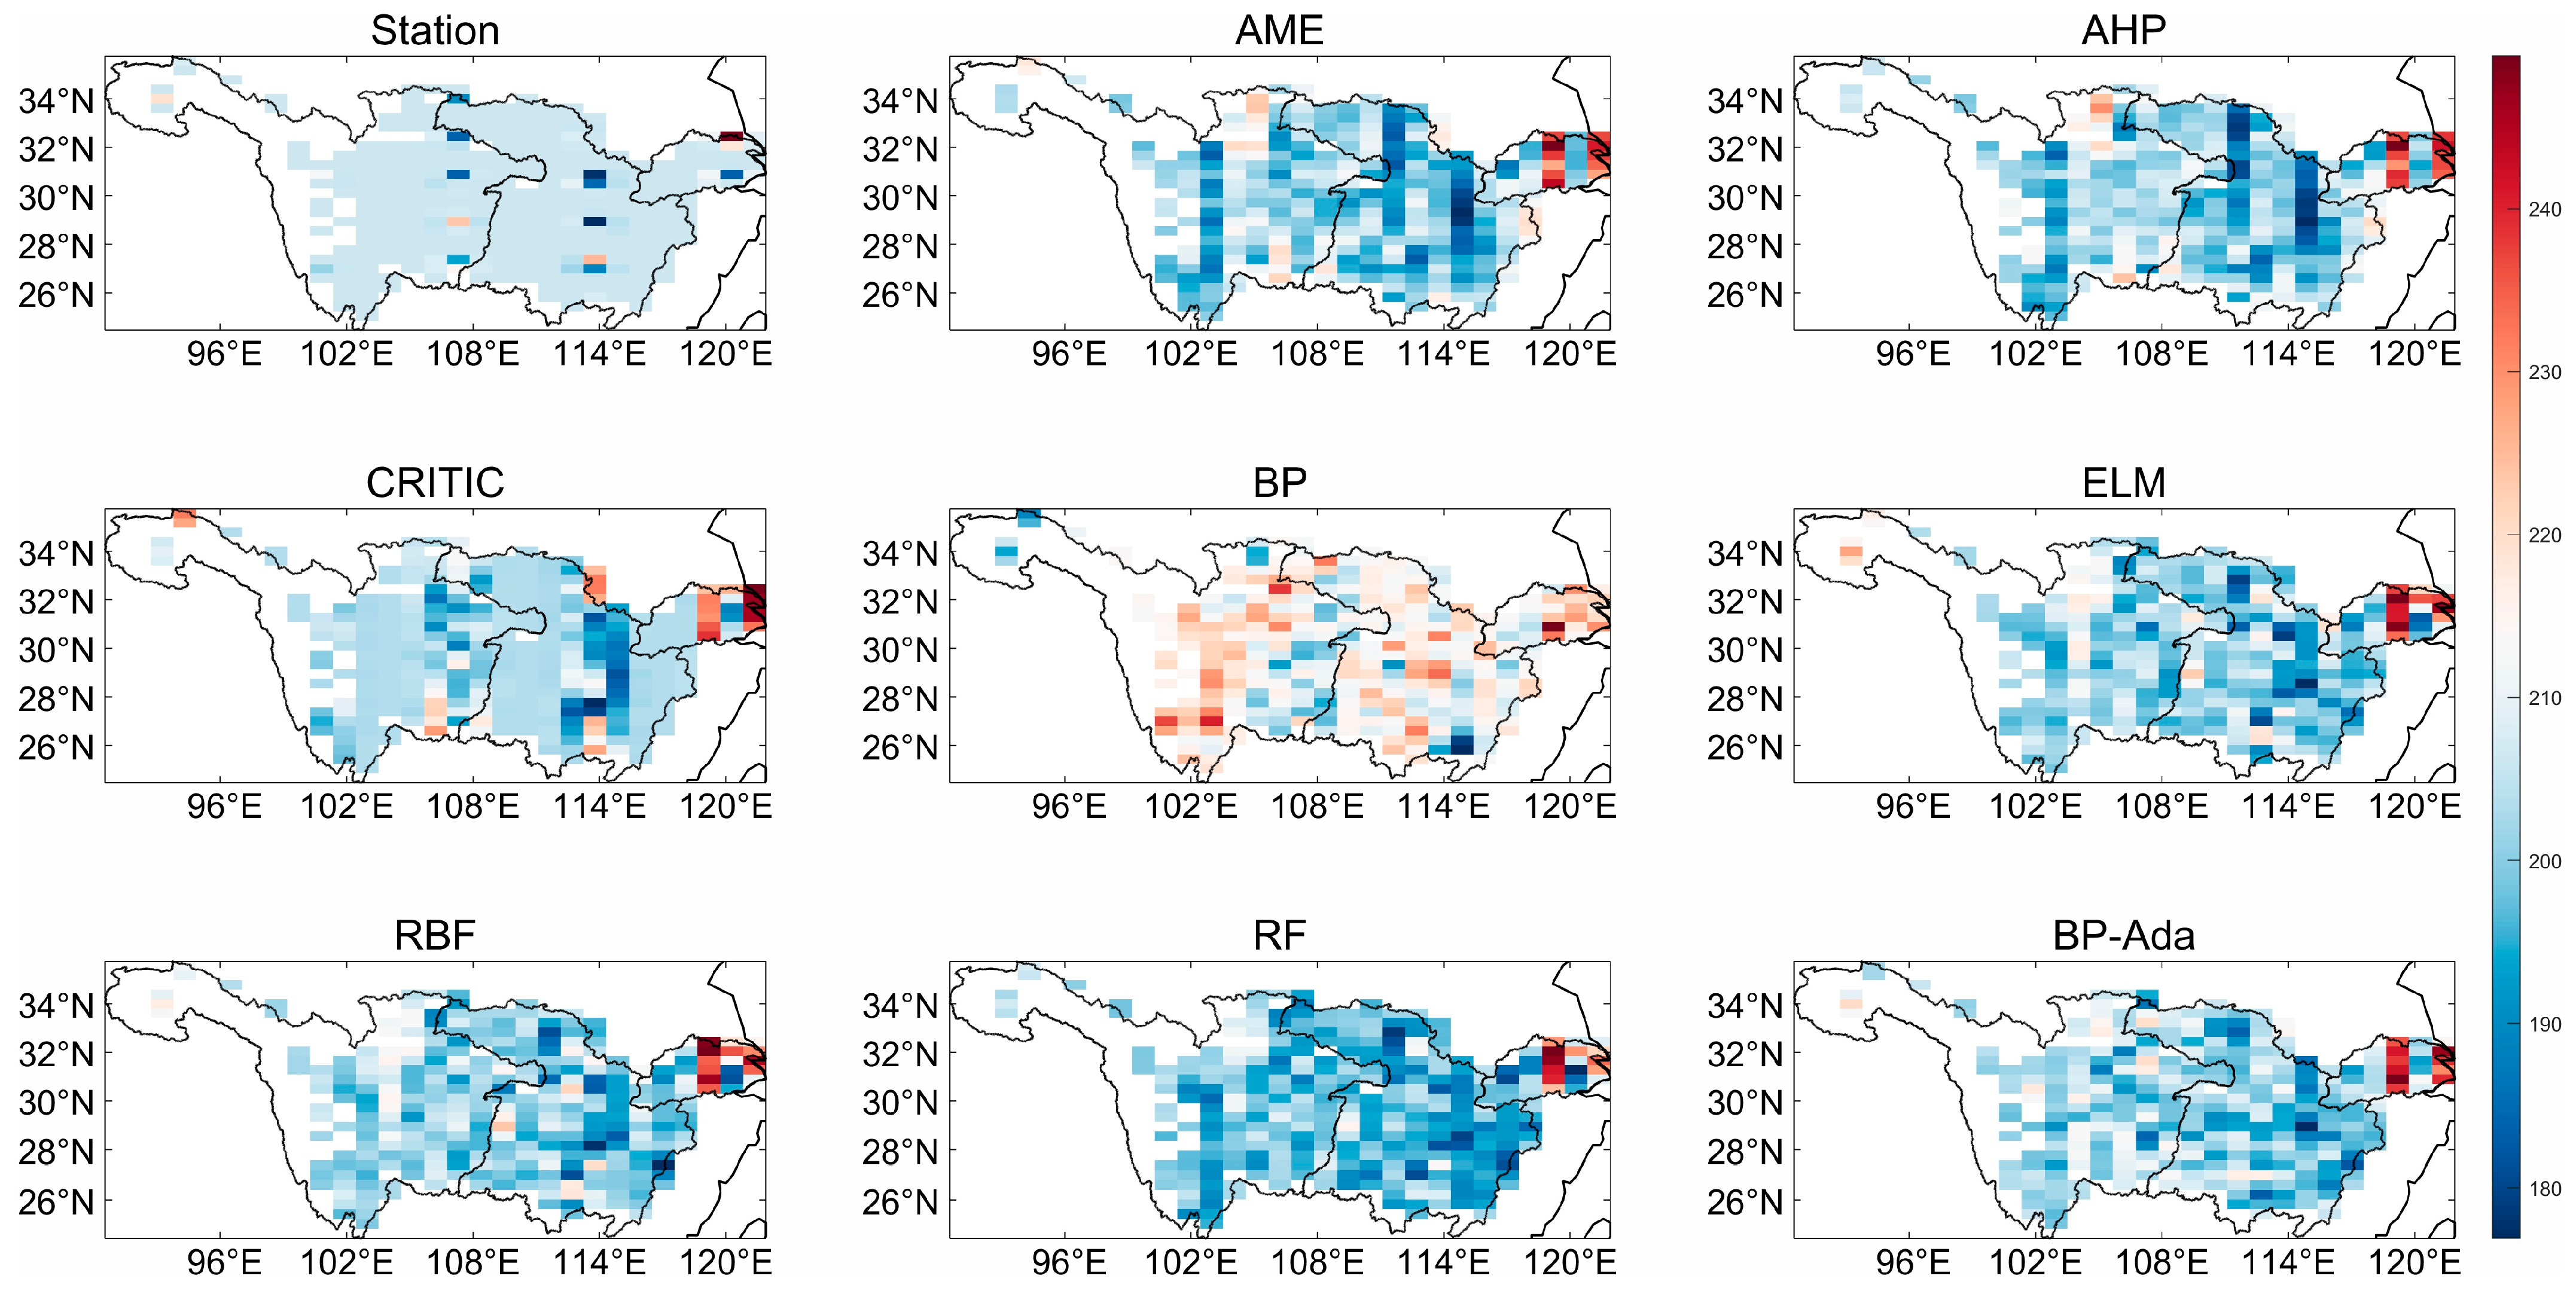
Figure 5 shows the multi-panel SPI-3 drought frequency across the YRB, revealing pronounced discrepancies among fusion approaches relative to station-based observations. In the upstream Jinsha River Valley, station data show moderate drought frequency with strong spatial variability. ML models such as RF and BP tend to overestimate drought occurrence in this region, producing values 25–30% higher than the observations, whereas weight-based methods including CRITIC and AHP yield spatially smoother patterns that underestimate local variability by 15–22%. By contrast, neural network-based methods including ELM and RBF generate localized drought frequency maxima around large lake systems, deviating from the station-derived estimates. The hybrid BP-Adaboost approach reduces part of this spatial inconsistency, improving the agreement with observations in the middle reaches; however, notable mismatches persist, particularly in regions characterized by intensive land–water interactions. These results indicate that SPI-3 drought frequency patterns remain sensitive to methodological choices, especially in areas with strong spatial heterogeneity.
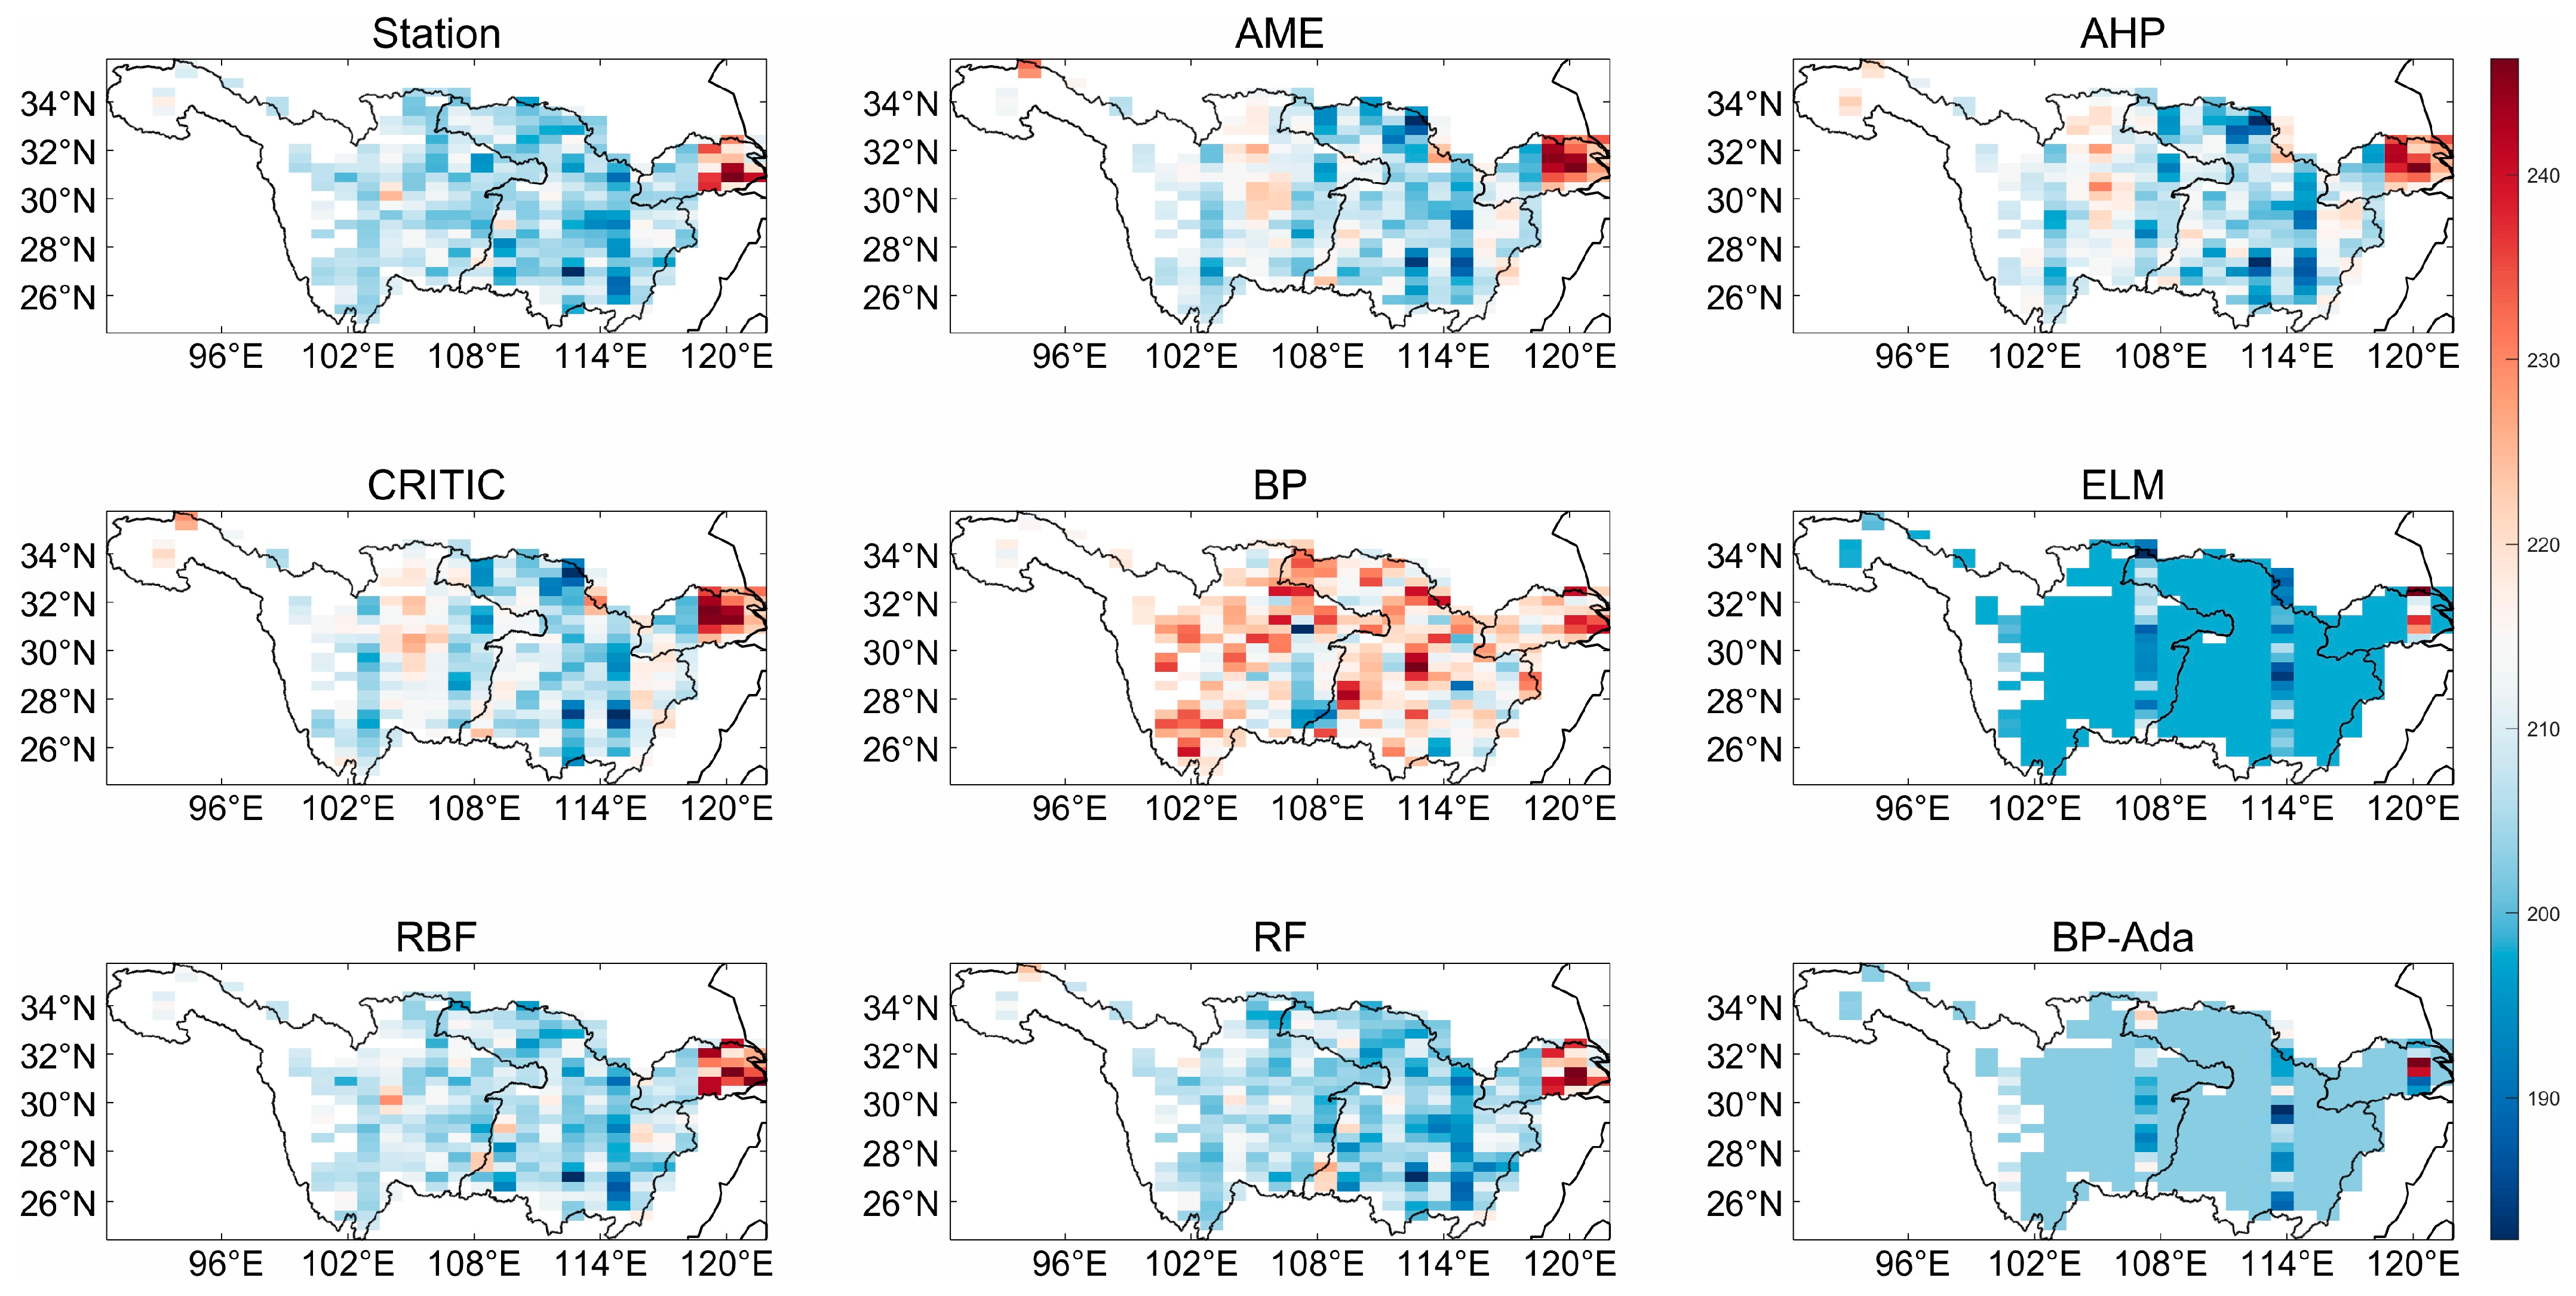
Figure 6 illustrates the spatial distribution of SPI-6 drought frequency, highlighting systematic methodological differences at intermediate time scales. In the upper basin, ML models exhibit elevated drought frequency relative to observations, with the overestimation reaching 20–28% in complex terrain regions. Conversely, weight-based methods oversimplify the microclimatic variability in the Jinsha River Valley, underestimating the observed fluctuations by 12–18%. In the middle and lower reaches, statistical methods maintain closer agreement with the station data, capturing large-scale drought frequency patterns with relatively little spatial noise. Neural network models again produce concentrated drought frequency anomalies near major hydrological features, diverging from the observed distributions. However, persistent discrepancies among methods in the middle basin suggest that SPI-6 drought representation remains influenced by unresolved spatial heterogeneity, which is not explicitly constrained by the fusion framework.
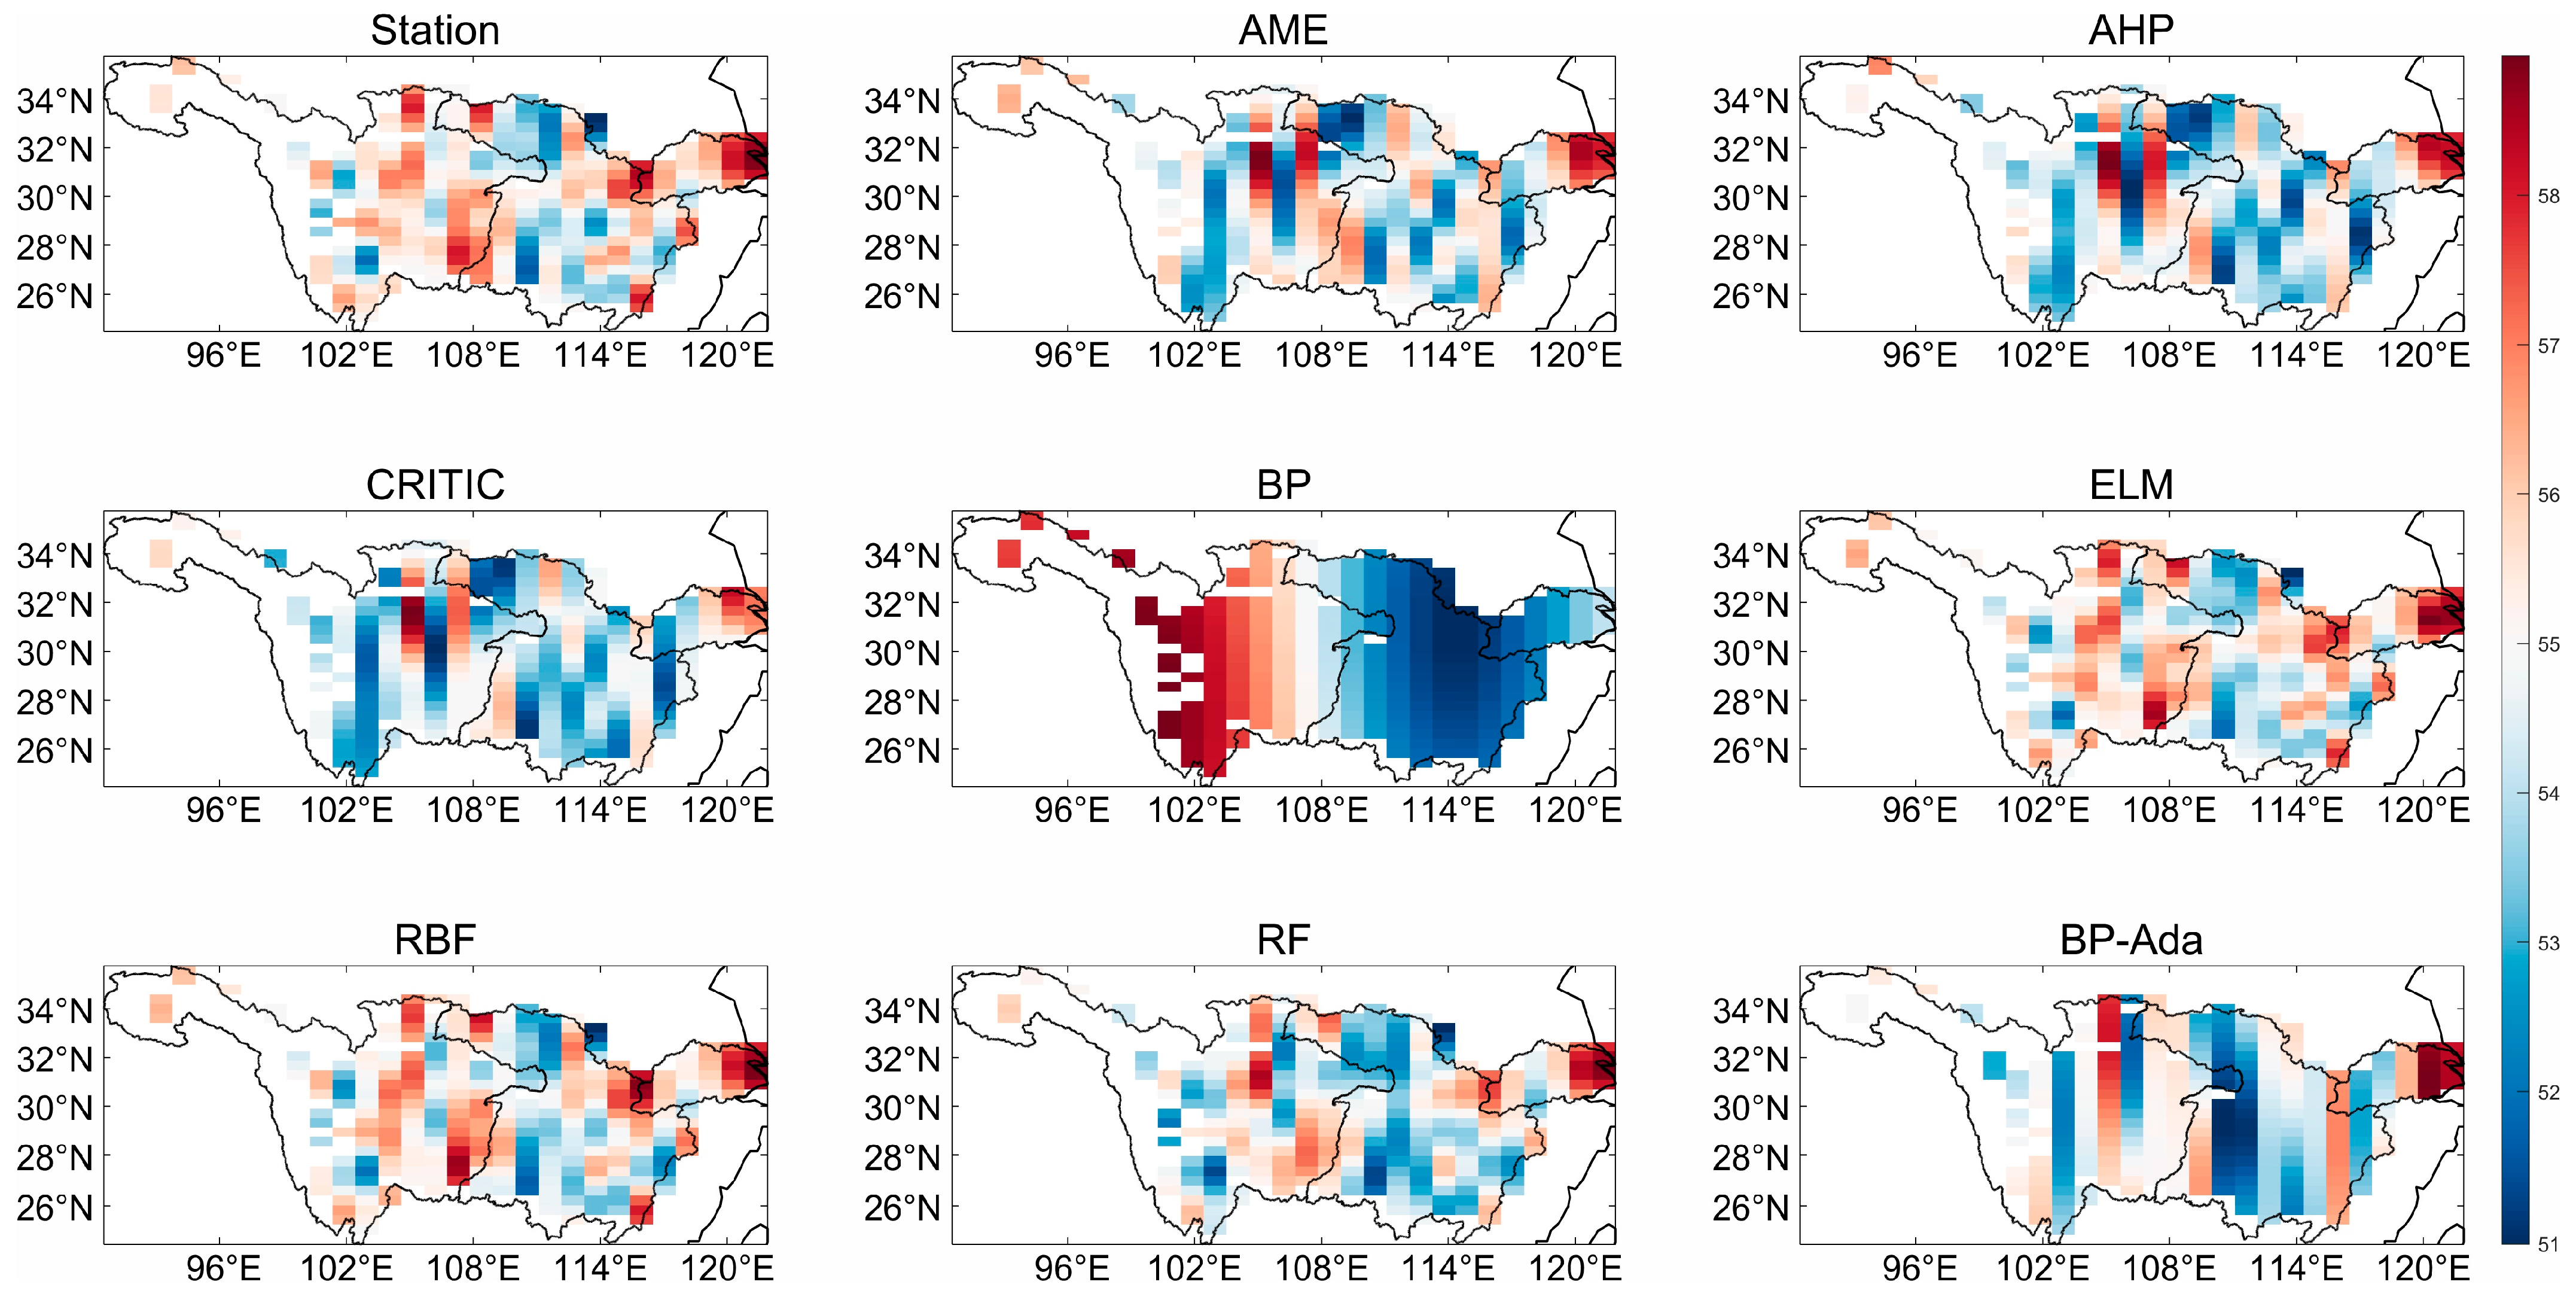
Figure 7 shows the multi-panel analysis of SPI-12 drought frequency across the YRB, revealing systematic methodological contrasts among the eight fusion approaches relative to the observational benchmark. In the mountainous upper basin, RF and BP overestimate the drought frequency by 15–22% relative to observations, whereas AHP and CRITIC underestimate the spatial variability by 10–18%, reflecting contrasting tendencies toward overfitting and oversmoothing. In downstream regions, statistical fusion methods display strong spatial correspondence with station-derived drought frequency patterns, indicating improved consistency at longer time scales. Neural network approaches produce localized anomalies near large water bodies, although their magnitude is reduced compared with shorter SPI scales. The hybrid BP-Adaboost model further improves the spatial alignment, reducing upstream discrepancies by approximately 40% relative to BP. Despite these improvements, residual deviations persist in the vicinity of major regulation zones, underscoring the challenges of representing long-term drought frequency patterns using precipitation-based indices alone. Overall, the SPI-12 results demonstrate greater cross-method convergence, while spatial inconsistencies at shorter time scales highlight the limitations of purely precipitation-driven drought characterization.
3.4. Analysis of Drought Identification Capacity
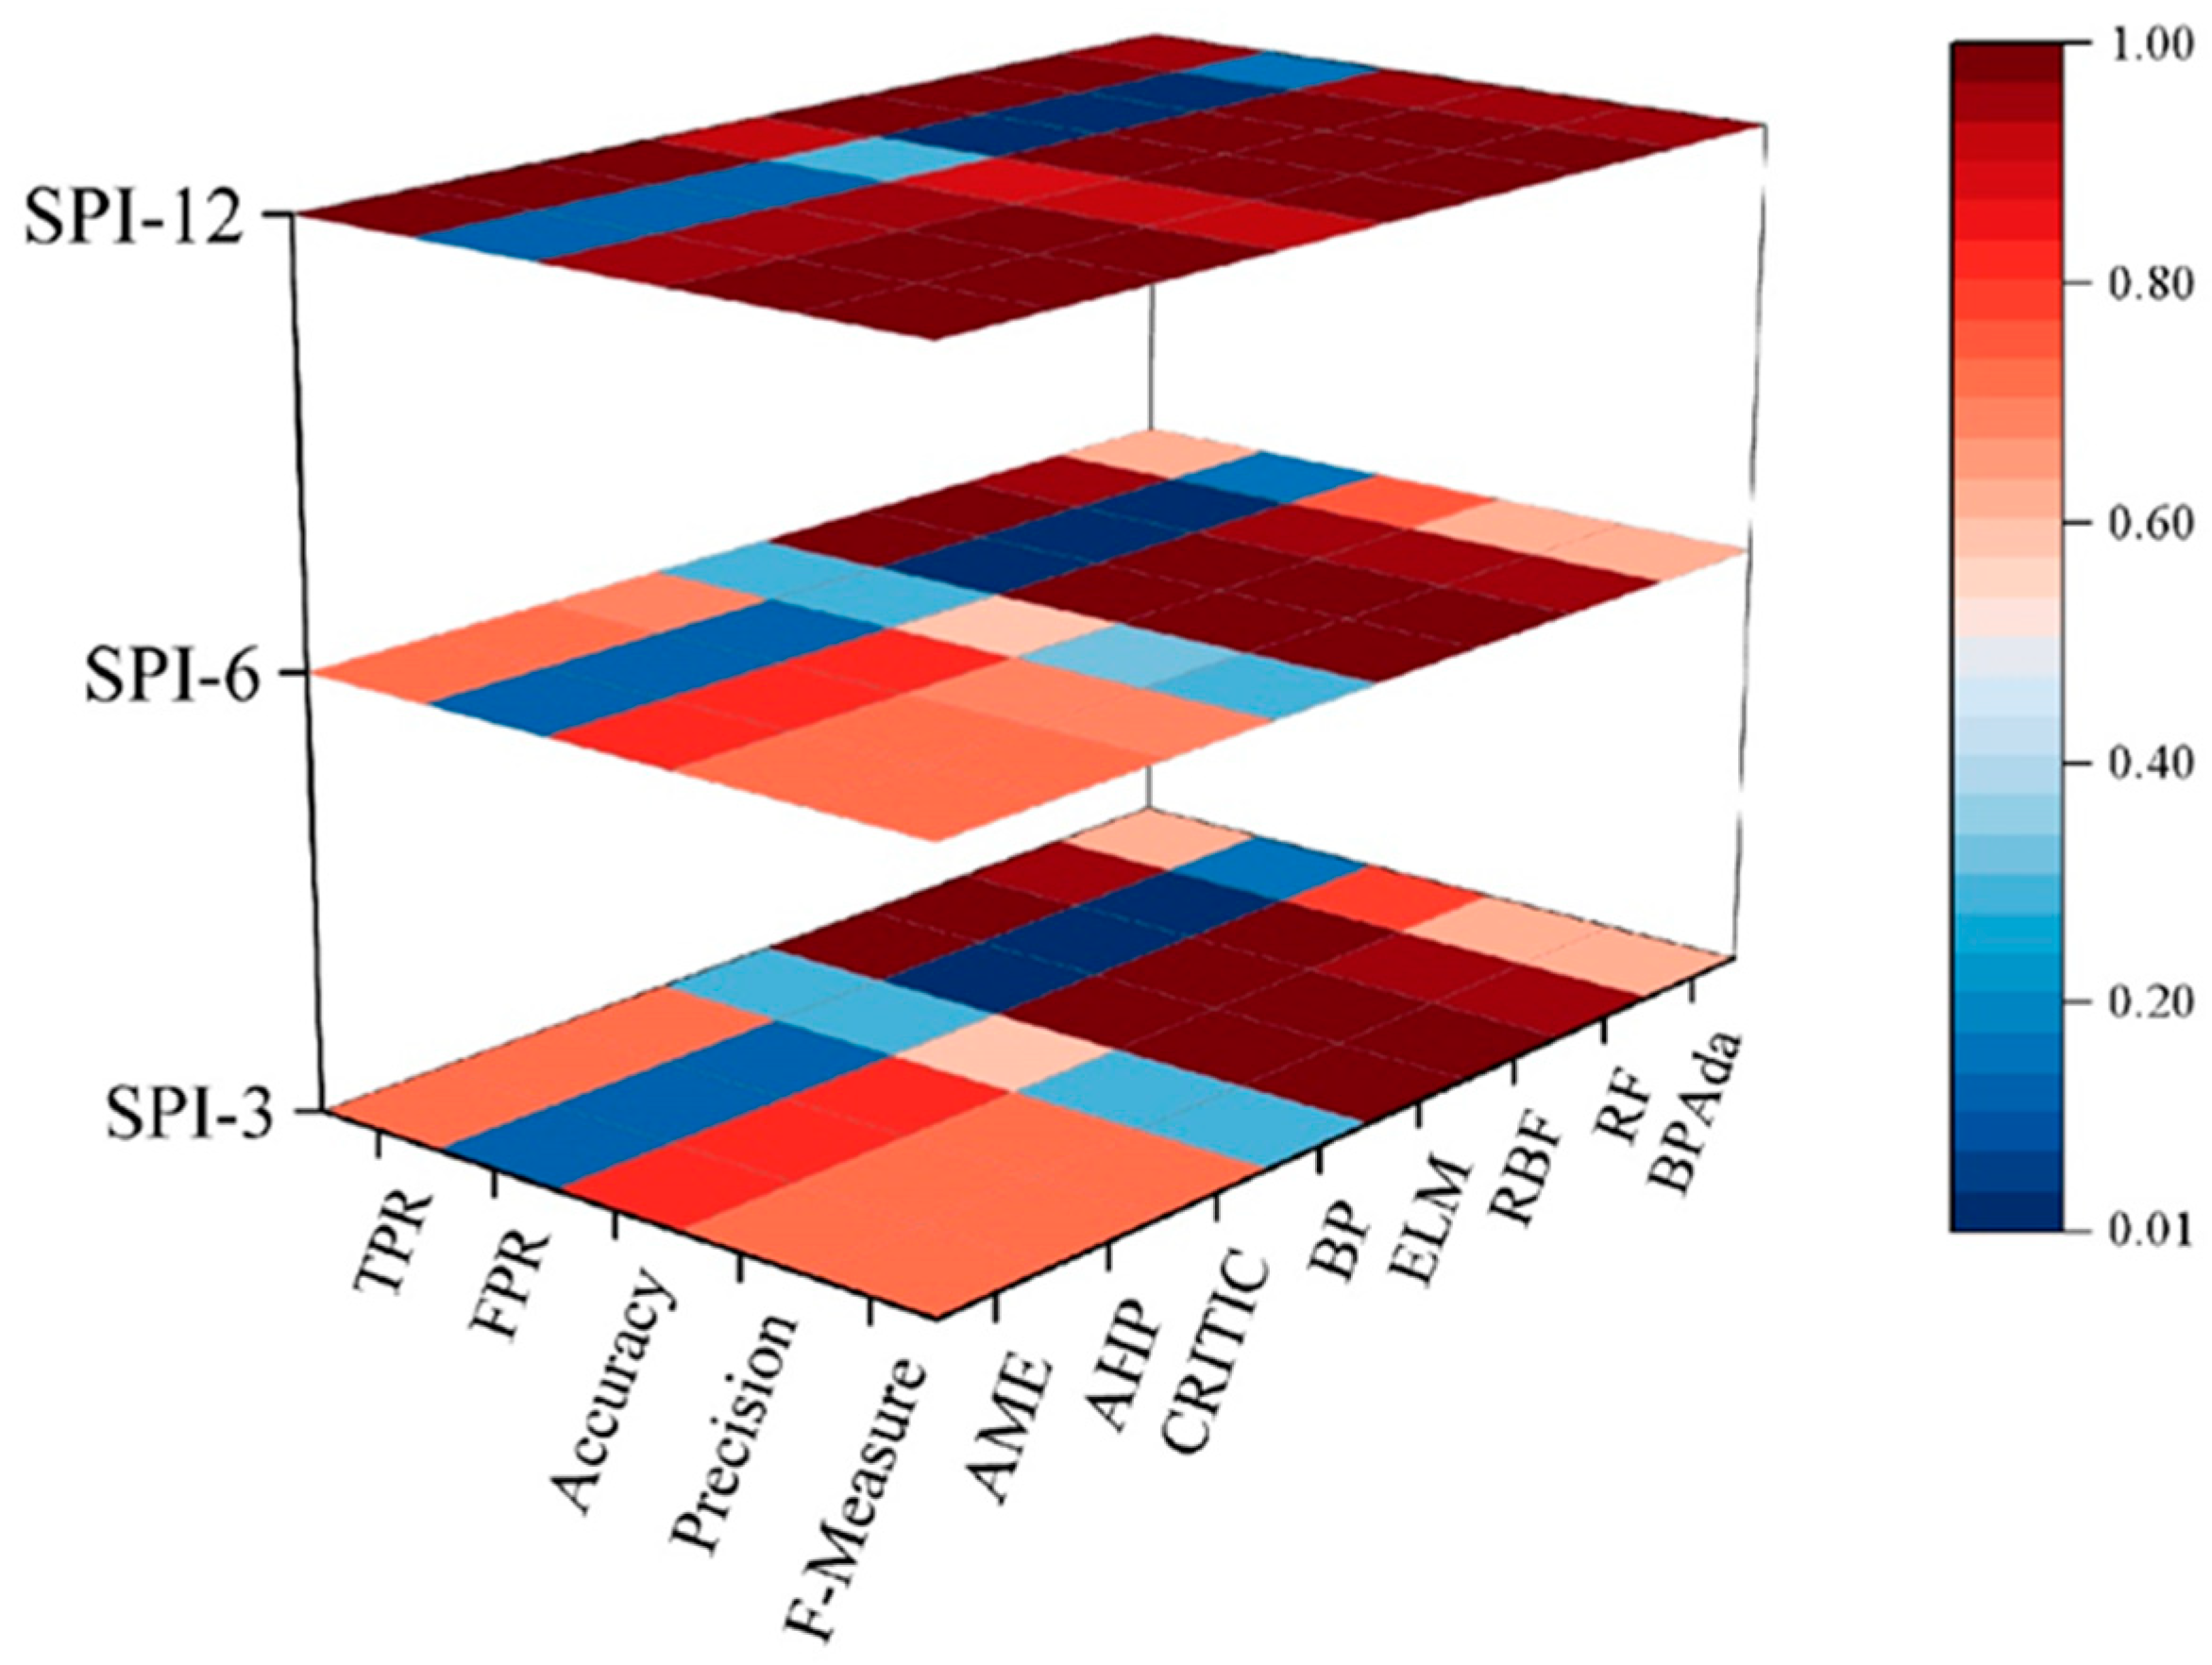
Figure 8 presents a three-dimensional heatmap evaluating the five precipitation prediction metrics of TPR, FPR, Accuracy, Precision, and F-Measure across SPI-3, SPI-6, and SPI-12. RF and RBF dominate the performance across all metrics and time scales, consistently achieving near-maximal values (visually represented by red shading; TPR > 0.92, Accuracy > 0.89, and F-Measure > 0.91), while maintaining minimal FPR values (<0.08). By contrast, BP and BP-Adaboost exhibit the weakest performance, with TPR < 0.75, Accuracy < 0.72, and F-Measure < 0.70, all concentrated in the lower range of the color spectrum and accompanied by elevated FPR values. Traditional methods demonstrate intermediate results, particularly underperforming at shorter time scales, where their Precision and Accuracy are 12–18% lower than those of RF and RBF. Notably, RF and RBF maintain stable metrics across SPI durations, with the F-Measure variation remaining below 5%, while BP-Adaboost shows amplified errors at SPI-12. The heatmap’s color gradient visually reinforces the conclusion that RF and RBF are the most reliable methods, with BP and BP-Adaboost ranking least effective for precipitation fusion tasks.
Overall, RF and RBF demonstrate superior performance across all five metrics and three SPI time scales, making them the most reliable fusion methods. BP and BP-Adaboost, however, consistently show poor performance, particularly in terms of TPR, Accuracy, and F-Measure, indicating that they are less effective in precipitation prediction tasks.
4. Discussion
4.1. Comparative Advantages in the YRB Context
Previous drought identification studies in the YRB have largely relied on traditional weighting-based approaches [
28], which tend to oversimplify the basin’s pronounced spatial heterogeneity and multiscale drought dynamics [
29]. By synthesizing results across SPI-3, SPI-6, and SPI-12, this study shows that RF and RBF provide consistently robust performance, particularly as the drought dynamics become increasingly nonlinear at shorter time scales. At longer time scales (SPI-12), the differences among methods are modest, whereas pronounced contrasts emerge at SPI-3 and SPI-6, where ML-based fusion maintains stability while traditional methods degrade [
30]. By contrast, statistical methods may exhibit potential systemic limitations: AME and CRITIC do not adequately account for monsoon intraseasonal oscillations in drought simulations [
31], which could lead to localized anomalies in drought identification within the middle and lower reaches of the basin [
24]; AHP might inadvertently misclassify drought events associated with urban heat islands in the Yangtze Delta as naturally occurring phenomena [
32]. RF and RBF, however, discern anthropogenic signals through multimodal data integration, demonstrating their adaptability to both natural and human-driven aridity patterns.
4.2. Broader Implications for Data Fusion and Drought Identification
Joint consideration of multiple SPI time scales highlights that traditional methods implicitly assume stable drought-driver relationships [
33], which limits their applicability in climatically and anthropogenically complex regions [
34]. By contrast, our RBF framework demonstrates stability across such gradients [
35], underscoring the need for adaptive fusion in basins with intensive anthropogenic pressures. RF and RBF outperform statistical approaches across SPI scales because of their ability to resolve nonlinear feedback among the precipitation, soil moisture, and temperature data, though challenges remain during extreme short-term events. Statistical methods such as AME and AHP perform reliably in stable, long-term regimes (SPI-12), but their rigidity becomes apparent at shorter time scales (e.g., SPI-3, for which FPR > 0.30), where they fail to adapt to climate nonstationarity. The consistent superiority of RF and RBF stems from their capacity to decode nonlinear dynamics, such as the soil moisture–precipitation feedback [
36], which is critical for flash drought early warning systems [
37].
4.3. Limitations and Future Directions
Several limitations warrant attention, including the incomplete representation of recent extreme events and the absence of explicit extreme-value constraints. The addition of socio-hydrological datasets would make the results more convincing. While RF and RBF excel in moderate droughts, their SPI-3 errors spike (>25%) during record-breaking events, suggesting that hybrid models should embed extreme value theory.
The vast spatial heterogeneity of the YRB necessitates context-specific fusion strategies tailored to sub-basin hydrogeomorphic characteristics. Integrating distributed factors into a hybrid fusion framework could optimize drought prediction, as evidenced by the superior performance of RF and RBF. For instance, high-elevation headwaters may prioritize elevation-weighted RF models to suppress topographic noise; alluvial plains could adopt AHP/CRITIC’s static fusion (Accuracy > 92%) to leverage monsoon homogeneity; and transitional zones may require adaptive methods such as BP-Adaboost to resolve human–natural coupling (ΔFPR = 15% improvement over BP). Overall, the results indicate that scale-aware, region-specific fusion strategies are required, with adaptive nonlinear methods favored for short-term drought monitoring and simpler approaches remaining useful under stable long-term regimes.
4.4. Model Robustness and Uncertainty Considerations Under SPI-Based Drought Representation
Despite the overall strong performance of the proposed ML-based fusion approaches, several robustness and conceptual limitations warrant careful consideration. In particular, the reliance on the SPI introduces an inherent constraint in drought characterization, especially at short time scales (SPI-3), where hydrological and land–atmosphere processes beyond precipitation play a dominant role.
At short time scales, drought development is strongly modulated by evapotranspiration demand, soil moisture memory, and surface energy balance, as well as by anthropogenic influences such as irrigation and reservoir regulation. As a precipitation-only metric, SPI is unable to explicitly account for these processes, which partially explains the increased prediction errors observed during extreme SPI-3 drought events. This limitation is further amplified by the relative scarcity of extreme short-term drought samples, restricting the ability of data-driven models to robustly learn tail behavior under rapidly evolving hydroclimatic conditions.
Ongoing climate change and intensifying human activities in the YRB challenge the stationarity assumption implicit in SPI-based drought indices. Shifts in temperature-driven evapotranspiration and land-use patterns may decouple precipitation deficits from actual water stress, introducing additional uncertainty into short-term drought identification when relying solely on SPI.
To mitigate these issues, several robustness-oriented strategies were incorporated into the modeling framework. First, model performance was systematically evaluated across multiple SPI time scales, enabling an assessment of cross-scale consistency rather than isolated accuracy at individual scales. The sustained superiority of RF and RBF from SPI-3 to SPI-12 indicates that these methods capture fundamental drought-related dynamics, even when the underlying index is simplified. Second, comparative analyses across sub-basins with contrasting hydrogeomorphic and anthropogenic characteristics provided an indirect test of model generalizability under diverse drought-generating mechanisms.
Although hyperparameter optimization may improve the absolute performance of individual ML models, it is unlikely to alter the relative ranking of fusion approaches reported in this study. The comparative conclusions are primarily driven by fundamental differences in model structure and learning mechanisms rather than fine-scale parameter tuning, as evidenced by the consistent performance hierarchy observed across multiple SPI time scales and sub-basin evaluations. Nevertheless, the applicability of the proposed framework should be interpreted within a clearly defined scope. The approach is well suited to regional-scale drought monitoring and comparative assessment across temporal scales using precipitation-based indicators, but it is not intended to fully represent hydrological or socio-hydrological drought processes at short time scales. The omission of variables such as soil moisture, evapotranspiration, runoff, and human water use may lead to an underestimation of drought severity or duration during rapidly evolving events. Future research should therefore prioritize multi-index or multi-variable fusion frameworks that integrate precipitation-based, hydrological, and anthropogenic indicators to improve drought characterization under nonstationary climate conditions.
5. Conclusions
This study has revealed a systematic decline in prediction performance from SPI-12 to SPI-3 across all methodologies, with method-specific degradation patterns underscoring fundamental algorithmic limitations. ML models demonstrated superior resilience, with RF and RBF exhibiting minimal F-Measure reductions because of the inherent stability of nonlinear kernel functions in handling multiscale climate interactions. By contrast, linear fusion methods showed moderate declines, reflecting their inability to disentangle short-term meteorological noise from drought signals. Basic neural architectures (BP/BP-Adaboost) suffered catastrophic performance collapse, exposing critical vulnerabilities to observational randomness and microclimate variability.
Geospatial analysis further highlighted methodological tradeoffs: Static fusion approaches such as AHP/CRITIC oversimplified orographic precipitation patterns in high-relief headwaters, inflating the FPR, yet achieved 92% accuracy in monsoon-regulated lowlands by capitalizing on climatic stationarity. Neural networks (BP/ELM) amplified sensor-level uncertainties, generating spurious drought hotspots across transitional ecotones. The RBF framework effectively mitigated these artifacts through localized kernel optimization, maintaining cross-scale consistency and exemplifying the potential of spatially adaptive ML in drought diagnostics.
The observational and model datasets used in this study extend only to 2014, consistent with the standard design of CMIP historical simulations. As a result, extreme drought events occurring after this period are not explicitly represented, which may limit direct event-specific interpretation under contemporary climate conditions. Nevertheless, the primary contribution of this study lies in the comparative assessment of drought identification methodologies under a harmonized historical framework. The relative performance patterns and scale-dependent insights reported here remain informative for method selection and future model development. Extending the proposed framework using post-2014 observations, reanalysis products, or scenario-based simulations would further enhance its relevance for current and future drought assessments.




 ,
,