Article

Performance Evaluation and Operational Insights from Community-Scale Groundwater Defluoridation Systems Using Field Evidence from West Bengal, India


1
Department of Infrastructure Engineering, Faculty of Engineering and IT, The University of Melbourne, Parkville, VIC 3010, Australia
2
Department of Earth and Environmental Sciences and Williamson Research Centre for Molecular Environmental Science, The University of Manchester, Williamson Building, Oxford Road, Manchester M13 9PL, UK
3
School of Biosciences, The University of Melbourne, Parkville, VIC 3010, Australia
4
Department of Chemical Engineering, Faculty of Engineering and IT, The University of Melbourne, Parkville, VIC 3010, Australia
5
Department of Architecture and Regional Planning, Indian Institute of Technology Kharagpur, Kharagpur 721302, West Bengal, India
6
School of Water Resources, Indian Institute of Technology Kharagpur, Kharagpur 721302, West Bengal, India
7
Department of Civil Engineering, BV Raju Institute of Technology, Narsapur, Medak District, Hyderabad 502313, Telangana, India
8
Department of Civil Engineering, Indian Institute of Technology Kharagpur, Kharagpur 721302, West Bengal, India
*
Authors to whom correspondence should be addressed.
Water 2026, 18(5), 549; https://doi.org/10.3390/w18050549
Submission received: 26 January 2026 / Revised: 19 February 2026 / Accepted: 21 February 2026 / Published: 26 February 2026
(This article belongs to the Section Water Quality and Contamination)

Highlights

  • Assessed the performance of 58 filters in two districts of West Bengal, India.
  • Fluoride > 1.5 mg/L was reported in all pre- and post-filter samples.
  • Post-filter fluoride > 2.5 mg/L in 70% (Bankura) and 22% (Purulia) of samples.
  • Required fluoride removal to reach 1.5 mg/L was often <50% across sites.
  • Observed non-compliance may reflect operational failure, not chemistry limits.

Abstract

Millions of people across rural and peri-urban regions worldwide remain exposed to unsafe concentrations of naturally occurring fluoride in groundwater. In West Bengal, India, community-level water purification plants (CWPPs) have been widely installed to remove excess fluoride, yet their long-term operational performance remains minimally documented. This study assessed the pre-filter and post-filter water quality of 58 such groundwater-based CWPPs across the fluoride-affected districts of Bankura and Purulia in West Bengal, to evaluate in-field fluoride removal performance and potential hydrogeochemical, operational, and management drivers. Evaluation included fluoride concentration and key physicochemical parameters such as pH, temperature, electrical conductivity (EC), oxidation-reduction potential (ORP), total dissolved solids (TDS), and other anions including bromide, chloride, bicarbonate, nitrite, nitrate, phosphate, and sulphate. Fluoride concentration ranged from 1.7 mg/L to 8.2 mg/L and 1.6 mg/L to 3.9 mg/L in the sampled source water of Bankura and Purulia respectively, with both pre- and post-filter water of all the observed treatment units exceeding the WHO guideline of 1.5 mg/L. Potential contributors to underperformance may include inappropriate filter media selection, insufficient backwashing and regeneration, limited operational oversight and/or non-tailored treatment approaches. However, details on the adsorbent media and operational details were not available, and thus findings reflect observed field performance rather than necessarily causal relationships. These operational insights will contribute to the global discussion on improving decentralized groundwater treatment systems in resource-constrained settings.

1. Introduction

Fluoride contamination remains a persistent public health challenge for over 180 million people worldwide, particularly in arid and semi-arid regions where groundwater is the dominant drinking water source [1,2]. Chronic exposure to fluoride above the World Health Organization (WHO) guideline of 1.5 mg/L [3] is linked to a range of health effects, including dental fluorosis, characterized by enamel discoloration, and skeletal fluorosis, which can cause joint stiffness, pain, and deformities [4,5,6,7]. Notably, dental fluorosis can also occur at concentrations below 1.5 mg/L, and recent reviews have examined potential neurodevelopmental effects at lower exposure levels, however, with variable evidence [7,8,9,10]. Long-term ingestion may also affect kidney and thyroid function and has been associated with neurological and developmental disorders in children [4,7,11,12,13,14].
Globally, fluoride contamination is reported across several countries including (alphabetically) Algeria, Argentina, Australia, Canada, China, Egypt, India, Iran, Iraq, Japan, Jordan, Kenya, Libya, Morocco, New Zealand, Nigeria, Pakistan, Persian Gulf, South Africa, Saudi Arabia, Sri Lanka, Syria, Tanzania, Thailand, Turkey, U.S.A., and others [2,15,16,17]. While the problem is most acute in South Asia, East Africa, and parts of China, its persistence reflects a broader challenge of managing decentralized water systems under varying hydrogeochemical and socio-economic conditions [15,18].
In India, fluoride contamination was first reported in 1936 [19] and over 66 million people across 20 of 28 states in India have been reported to be affected by fluoride-contaminated drinking water since then, with concentrations reaching up to 48 mg/L [1,20,21,22,23]. Despite decades of technical intervention, fluoride contamination remains a major public health issue in India (and elsewhere) due to technical, socio-economic, and geological challenges [24,25]. West Bengal, though not the most severely affected state in India, presents a complex hydrogeochemical and infrastructural landscape where groundwater dependence intersects with economic vulnerability and institutional constraints [26,27]. The state’s reliance on untreated groundwater is compounded by limited piped water coverage (~56%) and periodic rainfall deficits, heightening exposure risks, particularly in rural and peri-urban areas [28,29,30].
Recognizing the severity of the issue, the Government of West Bengal has taken proactive steps to address fluoride contamination. The Public Health Engineering Department of West Bengal (WBPHED), in partnership with international agencies, particularly the Asian Development Bank, has implemented the Jal Jeevan Mission (JJM) in West Bengal (and elsewhere in India) to improve safe rural water access [29,31,32,33]. As part of JJM, solar-powered community water purification plants (CWPPs) have been installed to deliver fluoride-reduced drinking water in some districts of West Bengal [32,33]. These CWPPs in the study area typically utilize iron removal filters as pre-treatment followed by three adsorbent media units aimed at reducing fluoride (and residual iron) to acceptable concentrations [32,33].
From a management perspective, understanding the operational behavior of CWPPs is essential for ensuring the sustainability of decentralized water infrastructure. These systems operate at the interface between engineering design and social management, where technical reliability depends as much on local maintenance capacity as on process design. Failures in routine backwashing, regeneration, or timely media replacement can lead to filter clogging, reduced adsorption capacity, and ultimately, non-compliance with drinking water standards [34,35]. Such failures often go unreported due to limited local monitoring, lack of accountability mechanisms, and absence of feedback loops between communities and implementing agencies [34].
The Bankura and Purulia districts of West Bengal present an ideal testbed to examine these issues. Both districts lie within the hard-rock terrains of the Chhota Nagpur Plateau, dominated by granite, gneiss, and schist formations that host fluoride-bearing minerals such as fluorite and apatite [36,37,38]. Groundwater in these regions is typically alkaline and bicarbonate-rich, conditions that enhance fluoride mobility through desorption and dissolution processes [25,39]. Many CWPPs in operation today were procured as standardized packages, following a one-size-fits-all approach. Despite their growing presence, little empirical evidence exists on their real-time performance, maintenance practices, or the hydrogeochemical factors influencing treatment efficacy. As a result, performance data for installed CWPPs remain fragmented, with few studies systematically assessing whether these plants deliver water of acceptable quality under field conditions [40,41,42,43,44].
In the context of fluoride removal in West Bengal, India, evidence from operational audits of community-managed systems under ‘real world’ conditions remains limited. To contribute to this identified knowledge gap, this study evaluated 58 CWPPs across Bankura and Purulia with the aim to (1) assess the current performance of community-based fluoride removal systems under field conditions, (2) to interpret the influence of local hydrogeochemical conditions (e.g., source water chemistry) on treatment outcomes, and (3) to identify potential operational and management factors influencing performance. The main contribution of this study is a field-based assessment of fluoride removal in 58 CWPPs across Bankura and Purulia under ‘real world’ conditions, linking treatment outcomes to local hydrogeochemical conditions and operational factors to support targeted management action. While the geographical focus of this study is on West Bengal (India), the lessons learnt are likely relevant to other groundwater-dependent regions impacted by geogenic fluoride contamination.

2. Materials and Methods

2.1. Study Area and Rationale Behind the Site Selection

West Bengal was selected due to its high population density [45], socio-economic vulnerabilities [26,27], and documented infrastructural challenges related to groundwater fluoride contamination [46]. Although approximately 23% of West Bengal’s regions are classified as high-risk for fluoride contamination [1,31,47], the state’s reliance on untreated groundwater exacerbated by limited tap water coverage [29] and seasonal rainfall deficiency [28] made it a critical region for a targeted investigation.
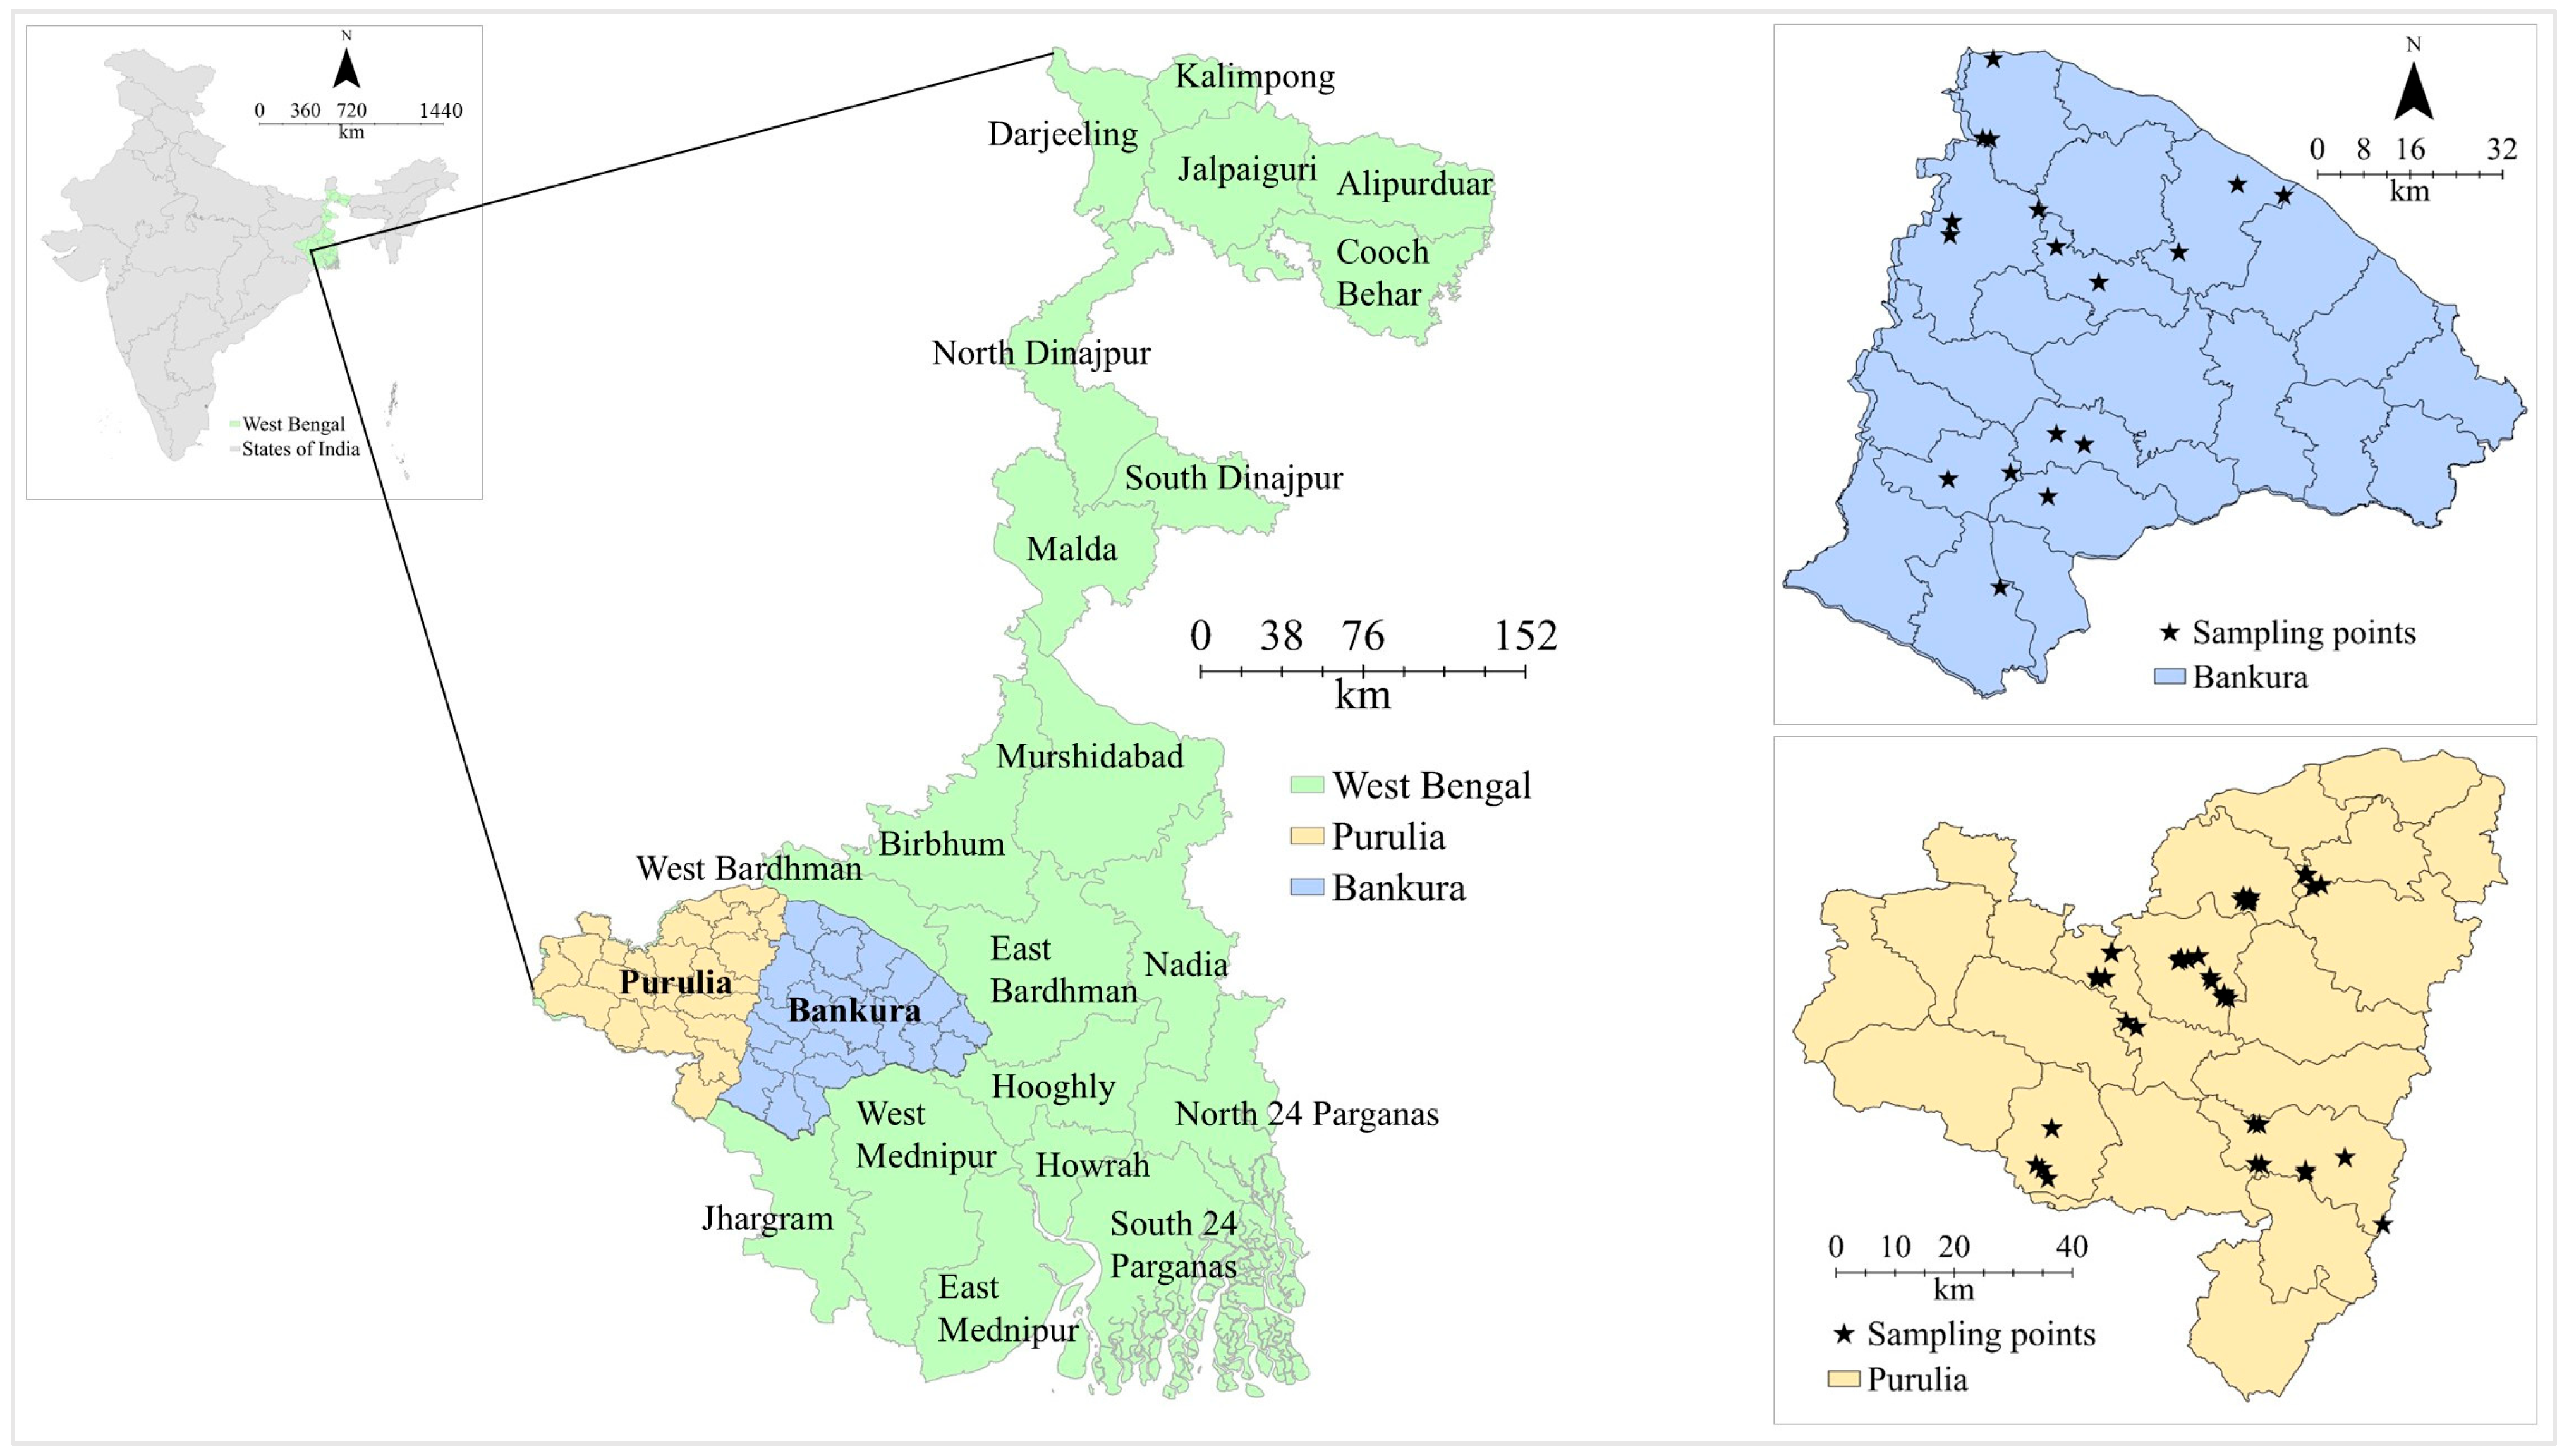
The districts of Purulia and Bankura were chosen due to their previously reported high groundwater fluoride concentrations [25,39], presence of numerous government-installed CWPPs [31,48] and drought-prone conditions [49]. Both districts lie on the eastern fringe of the Chhota Nagpur Plateau and share similar hard-rock geology dominated by Precambrian crystalline formations such as granite, gneiss, and schist [38]. These lithologies, along with associated weathered and fracture zones, influence groundwater chemistry and can host fluoride-bearing minerals that contribute to elevated fluoride concentrations [37]. As per the data provided by the WBPHED, 98 CWPPs in Purulia and 25 in Bankura are designed to serve roughly 100–200 households per unit [32]. Units for this study (n = 58; 41 in Purulia and 17 in Bankura) were selected in consultation with WBPHED officials based on spatial coverage and access. The spatial distribution of study sites (Figure 1) was prepared using ArcGIS® Pro (v3.4, ESRI).
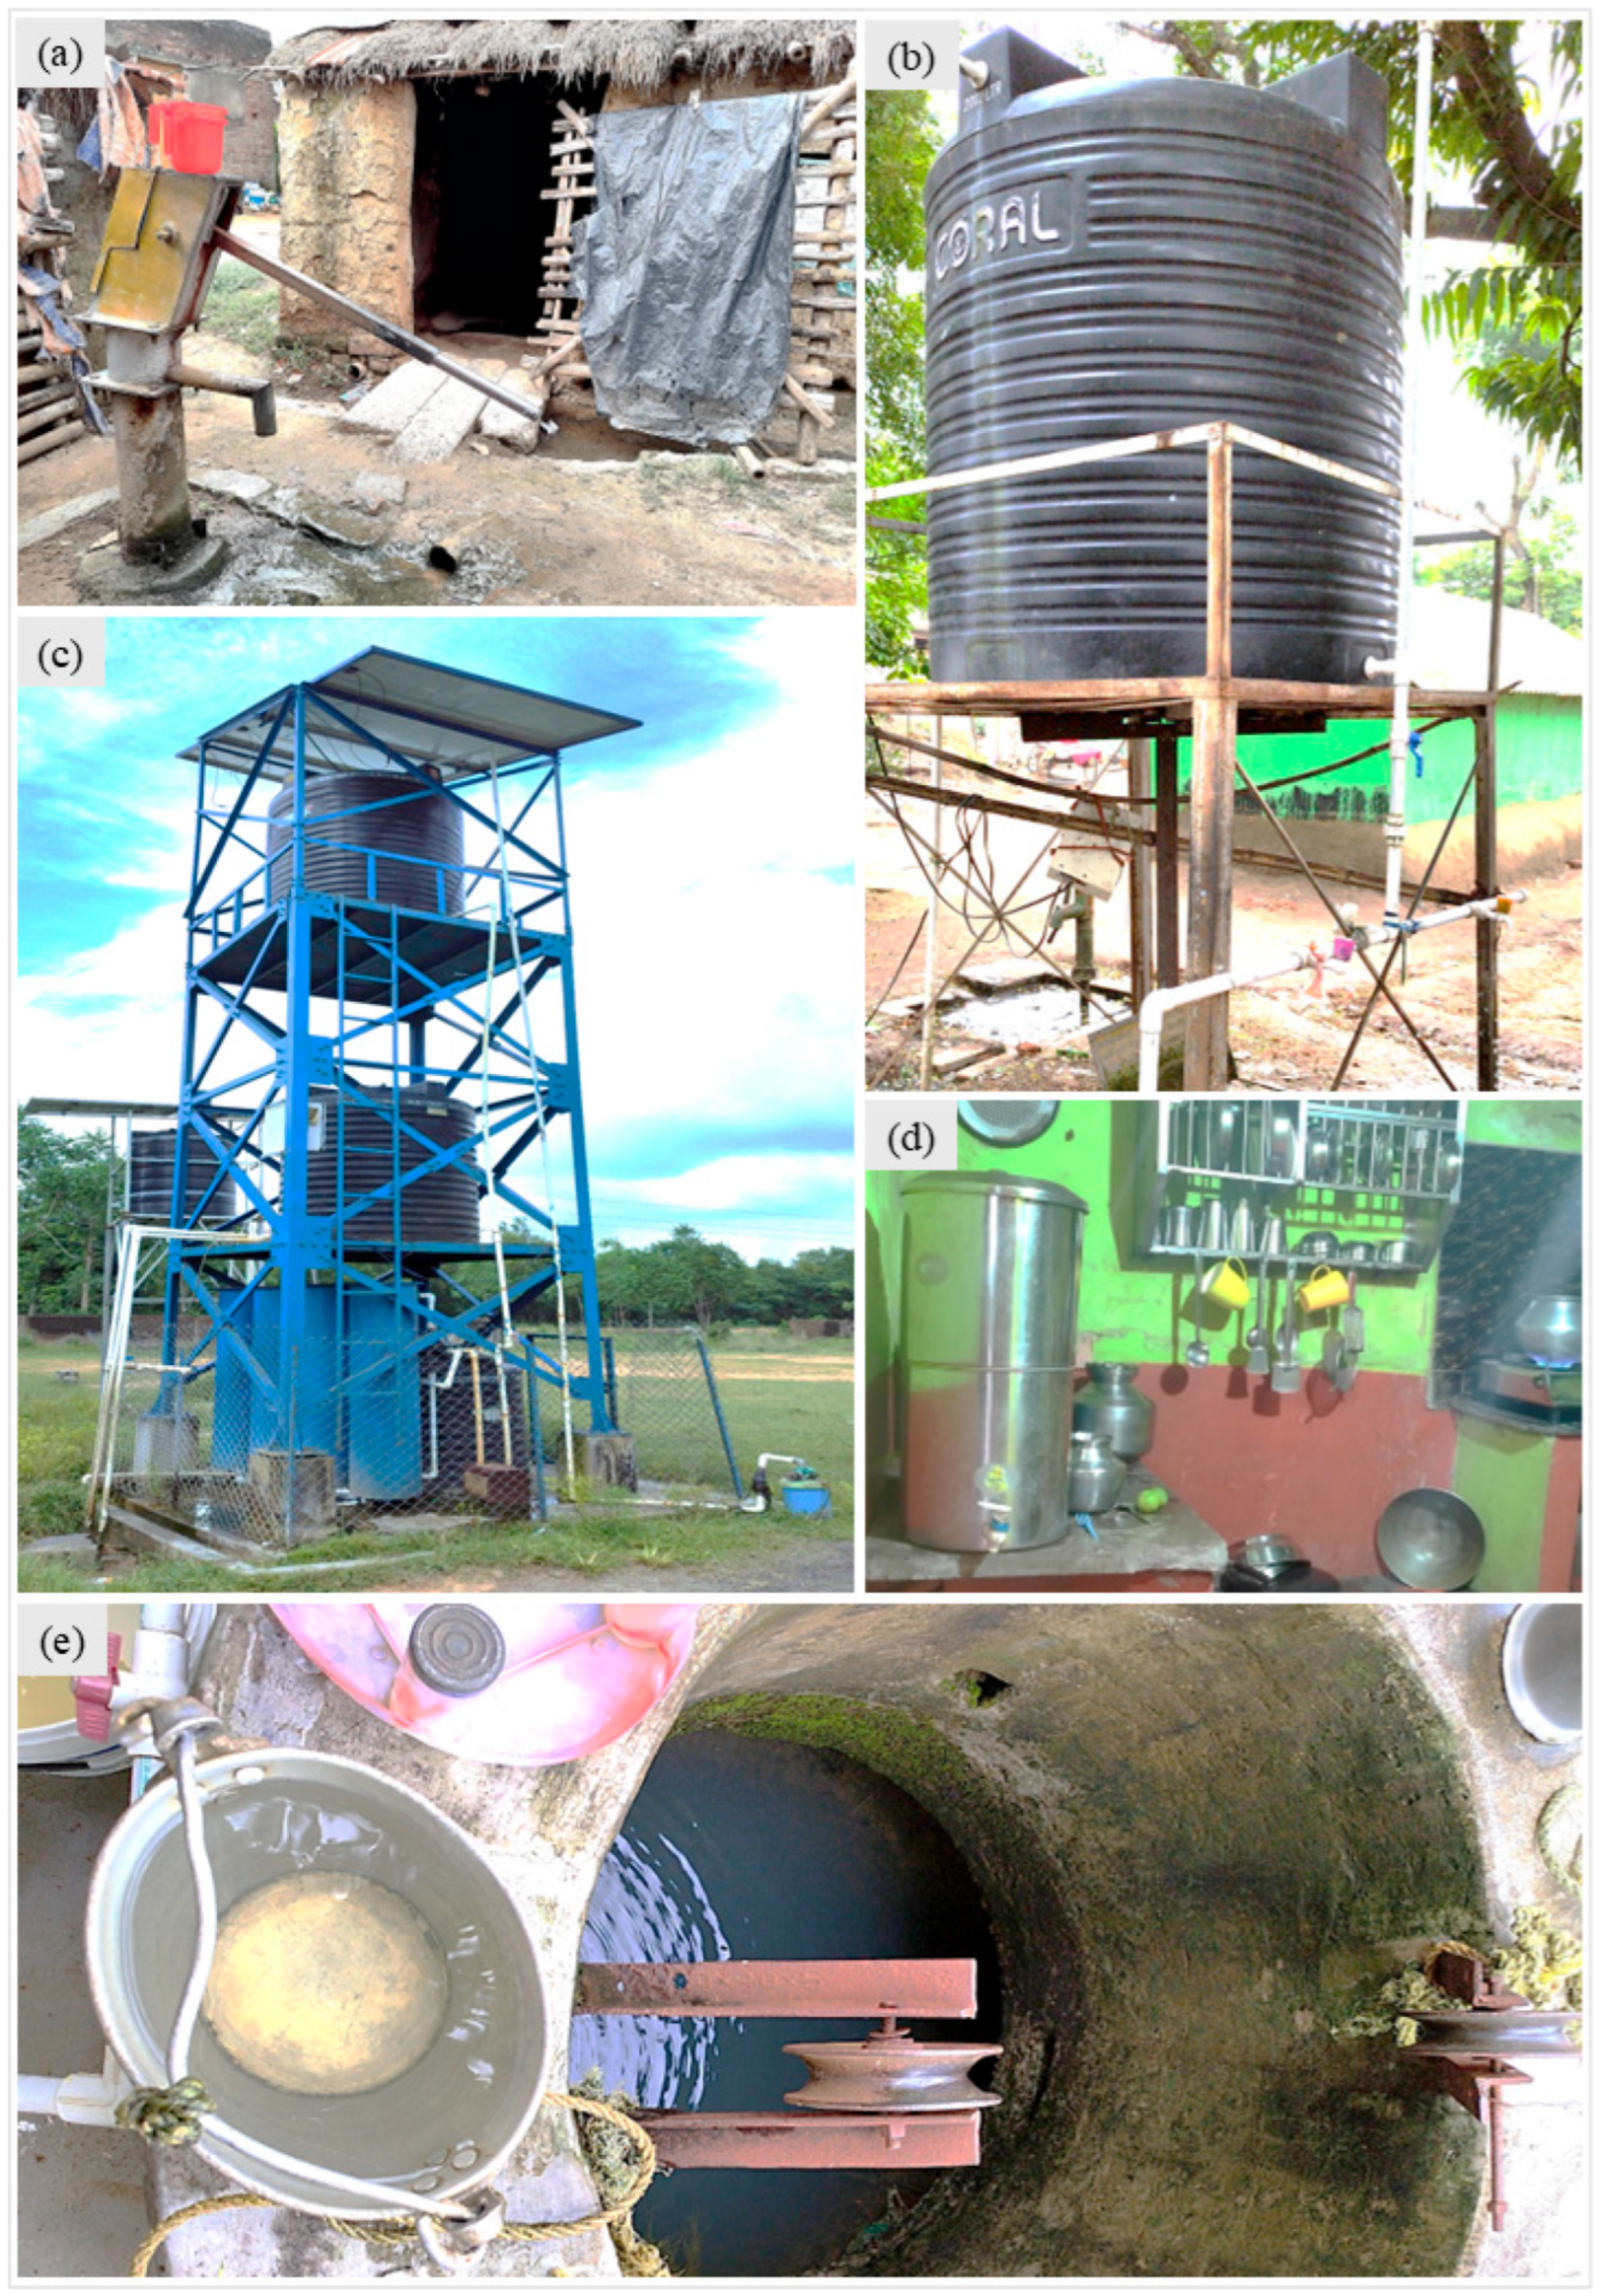
Different drinking water sources and storage methods commonly encountered in the study area highlight the region’s limited water infrastructure and generally poor economic status (Figure 2). The generally poor economic conditions in these districts significantly limit community capacity to implement and maintain effective and sustainable purification methods [26,27]. As observed during the study period, several households still rely on inadequate drinking water infrastructure such as hand pumps and open wells, which are highly susceptible to contamination.

2.2. Description of a Typical CWPP

The CWPPs evaluated in this study followed a broadly standardized design (Figure 2c). It is important to note that the units as observed in Purulia and Bankura districts may not necessarily be the same or of similar configuration to other groundwater remediation systems in other districts or states in India nor globally.
Systems in Purulia and Bankura were typically solar-powered, operating with a centrifugal pump to extract groundwater, which is stored in a 3000 L overhead storage tank equipped with an automatic level controller. Water then passes through an iron removal filter, followed by three treatment columns containing fluoride-selective adsorbents before ultraviolet disinfection and storage in a secondary 2000 L distribution tank. The specific adsorbent media used in the filter systems were not disclosed. At one decommissioned and/or abandoned unit in Purulia, packaging found on site indicated the possible use of spherical microporous polystyrene beads, white with a light-yellow tint, marketed as HIX Nano 200 (Drinkwell Systems, Kolkata, WB, India); however, this could not be independently verified and was not assumed for other sites.
The frequency of backwashing the filter units depends on the volume of water filtered and operator behavior and/or protocols, ideally occurring once a week to maintain their effectiveness. Monthly regeneration of the filter media is recommended using caustic soda, facilitated by a dedicated regeneration tank; however, as per field observations and according to local users, negligible practice of backwashing and regeneration in the study areas was verbally reported, suggesting significant operational and maintenance lapses.

2.3. Sample Collection, Preservation and Storage

Water samples were collected from the inlets (hereafter referred to as “pre-filter”) and outlets (hereafter referred to as “post-filter”) of CWPPs during the late monsoon season (September–October 2023). Onsite measurements of pH, temperature, total dissolved solids (TDS), electrical conductivity (EC), and oxidation-reduction potential (ORP) were taken using an Ultrameter IIITM device (Myron L®, San Diego, CA, USA). Samples were filtered onsite using 0.45 µm polyether sulfone syringe filter and collected in acid-washed 250 mL high-density polyethylene bottles following standard protocols (Section S1, Supplementary Information) prior to sample collection [50]. Bottles were filled to eliminate air gaps, sealed tightly, and wrapped with Parafilm® (Amcor, Melbourne, VIC, Australia). To minimize potential changes in chemical parameters, samples were transported in insulated coolers containing ice packs and subsequently stored at 4 °C in a refrigerator at the end of each day and prior to laboratory analysis.

2.4. Chemical Analysis, Quality Assurance and Quality Control

Anion concentrations (F, Br, Cl, HCO3, NO2, NO3, PO43−, and SO42−) were quantified using ion chromatography (930 Compact IC Flex, Metrohm, Herisau, Switzerland). Calibration standards were prepared by serial dilution of certified multi-ion stock solutions using ultrapure water (18.2 MΩ·cm). All samples were analyzed in duplicate under identical analytical conditions, with analytical blanks and calibration standards included in each run to verify instrument performance. Instrument accuracy and precision were assessed through routine calibration and quality-control procedures. Analytical precision was within ±2%, and accuracy was within ±5% of certified values. Relative standard deviations (RSD) across duplicate analyses were within ±5% for all measured parameters. Limits of detection (LOD) and quantitation (LOQ) for fluoride and other anions were estimated based on calibration-curve approach (Table S1, Supplementary Information) [51]. Further methodological details, including instrument configuration, eluent composition, suppressor settings, calibration procedures, and quality-control details, are provided elsewhere (Section S3, Supplementary Information).

2.5. Data Analysis and Interpretation

Removal efficiency was calculated using Equation (1):
R e m o v a l   e f f i c i e n c y   ( % ) =   C i C f C i × 100
where Ci and Cf are the concentrations (mg/L) in pre-filter and post-filter samples respectively.
All statistical analyses and visualizations were conducted in Python (v3.12) using Jupyter Notebook (v6.5.4). Core libraries included pandas (v2.2.3), NumPy (v1.26.4), matplotlib (v3.9.4), Seaborn (v0.13.2), and SciPy (v1.13.0). Outlier detection, correlation analysis, and regression trends were implemented within this environment (Section S2, Supplementary Information). The interquartile range (IQR) was used to flag statistical outliers, which were retained unless attributable to instrument error or data entry [52,53]. Non-parametric statistical methods were selected due to the non-normal distributions and heterogeneity among systems. Statistical inference considered the magnitude and consistency of observed effects, rather than necessarily statistical significance alone. Accordingly, non-significant results are not necessarily interpreted as evidence of no treatment effect, but are evaluated in the context of effect sizes, variability across systems, and overall treatment performance (Section S4, Supplementary Information) [54]. The equivalence margin of ±0.1 mg/L was selected as an operational threshold based on analytical resolution and measurement uncertainty associated with fluoride analysis, rather than on health-based or regulatory considerations. Spearman’s rank correlation coefficient (ρ) was used to assess associations between pre-filter water quality parameters and fluoride removal efficiency, due to p-value’s robustness against non-normality and outliers. The hypothesis tested for these p-values (ρ) is the null hypothesis (H0) of no correlation between fluoride removal efficiency and the selected pre-filter water quality parameters. If p < 0.05, the observed correlation is statistically significant at the 5% level, and the null hypothesis is rejected. If p < 0.01, the correlation is significant at the 1% level, meaning stronger evidence against the null hypothesis. If p < 0.001, the correlation is highly significant, providing very strong evidence against the null hypothesis. Due to skewness in data, statistical significance was tested using the Wilcoxon signed-rank test. Confidence intervals were estimated using Seaborn’s library in python environment, which fits a linear regression model (ordinary least squares) and applies bootstrapping for error estimation. Ordinary least squares (OLS) regression was applied solely for exploratory visualization of trends between variables [55,56]. Given that assumptions of linear regression were not fully met, OLS results were not used for statistical inference or prediction, and regression lines and confidence intervals are presented only to aid qualitative interpretation of trends.

3. Results and Discussion

3.1. Source Water Chemistry

Groundwater chemistry across Bankura and Purulia districts revealed spatial heterogeneity, with several parameters exceeding permissible drinking water limits. Across both districts, the dominant anion sequence HCO3 > Cl > SO42− > NO3 > F indicated bicarbonate-type groundwater, similar to previously reported studies [43], typically arising from carbonate weathering and evaporative concentration, noting anionic dominance of bicarbonate is typical of groundwaters in the Gangetic Basin [57].
In Bankura, pre-filter fluoride concentrations ranged from 1.7 to 8.2 mg/L, with a mean of 3.7 mg/L, substantially higher than the maximum permissible limit (MPL) of 1.5 mg/L in both Indian and WHO guidelines [3,58] (Table 1). The 100% exceedance beyond the MPL highlighted a widespread problem of geogenic fluoride in the sampled areas, consistent with observations from other regions of the Chhota Nagpur plateau [36,59,60]. The presence of bicarbonate with mean concentration 310 mg/L, alongside a circum-neutral pH (mean: 7.3) and TDS concentrations (mean: 710 mg/L) are typical of the region and suggests water–rock interactions within the aquifer matrix, particularly from carbonate weathering processes [37]. These water–rock processes have been known to promote fluoride mobilization by facilitating the dissolution of fluoride-bearing minerals [61].
Chloride concentrations in Bankura exhibited wide variability (8 to 440 mg/L) with a mean of 170 mg/L. Nitrate, while not dominant (mean: 16 mg/L), reached as high as 110 mg/L in one sample, likely indicating localized inputs from fertilizers and/or inadequate sanitation infrastructure, consistent with earlier studies [62]. The presence of moderate sulphate concentrations (mean: 77 mg/L) suggested dissolution of sulphate bearing minerals [63], although contributions from anthropogenic sources, such as wastewater infiltration due to poor sanitation, may also contribute. These background anions can potentially interfere with fluoride adsorption by competing for active sites on adsorbent media [64].
In Purulia, pre-filter fluoride concentrations ranged from 1.6 to 3.9 mg/L, with a mean of 2.2 mg/L, and 100% of samples exceeded the MPL (Table 2). However, fluoride concentrations in Purulia were mostly lower than in Bankura, possibly due to differences in aquifer lithology and groundwater residence time [65]. Interestingly, nitrate was significantly more prevalent in Purulia, with a mean of 30 mg/L, suggesting higher anthropogenic inputs, plausibly from fertilizers or open defecation practices in rural areas [62]. Chloride concentrations varied greatly (4–550 mg/L), with a mean of 110 mg/L. High concentration of chloride can be because of mixed inputs (geogenic and anthropogenic), causing potential interference in adsorption-based remediation systems [64]. Notably, bicarbonate concentrations showed a broad range (100–510 mg/L), and the mean value of 260 mg/L, indicative of carbonate weathering [37].
The mean oxidation-reduction potential (ORP) for Bankura and Purulia was 180 mV and 210 mV, indicative of generally oxidizing conditions at the time of measurement. Overall, the observed source water chemistry was influenced potentially by both geogenic and anthropogenic inputs [18,61,64]. The regional groundwater composition, characterized by the presence of bicarbonate, chloride, nitrate, and sulphate concentrations, may pose well-documented operational challenges, including reduced adsorption efficiency due to competing anions, and clogging or fouling of filter media for fluoride removal systems [15,18,64,66,67].

3.2. Performance Evaluation of CWPPs

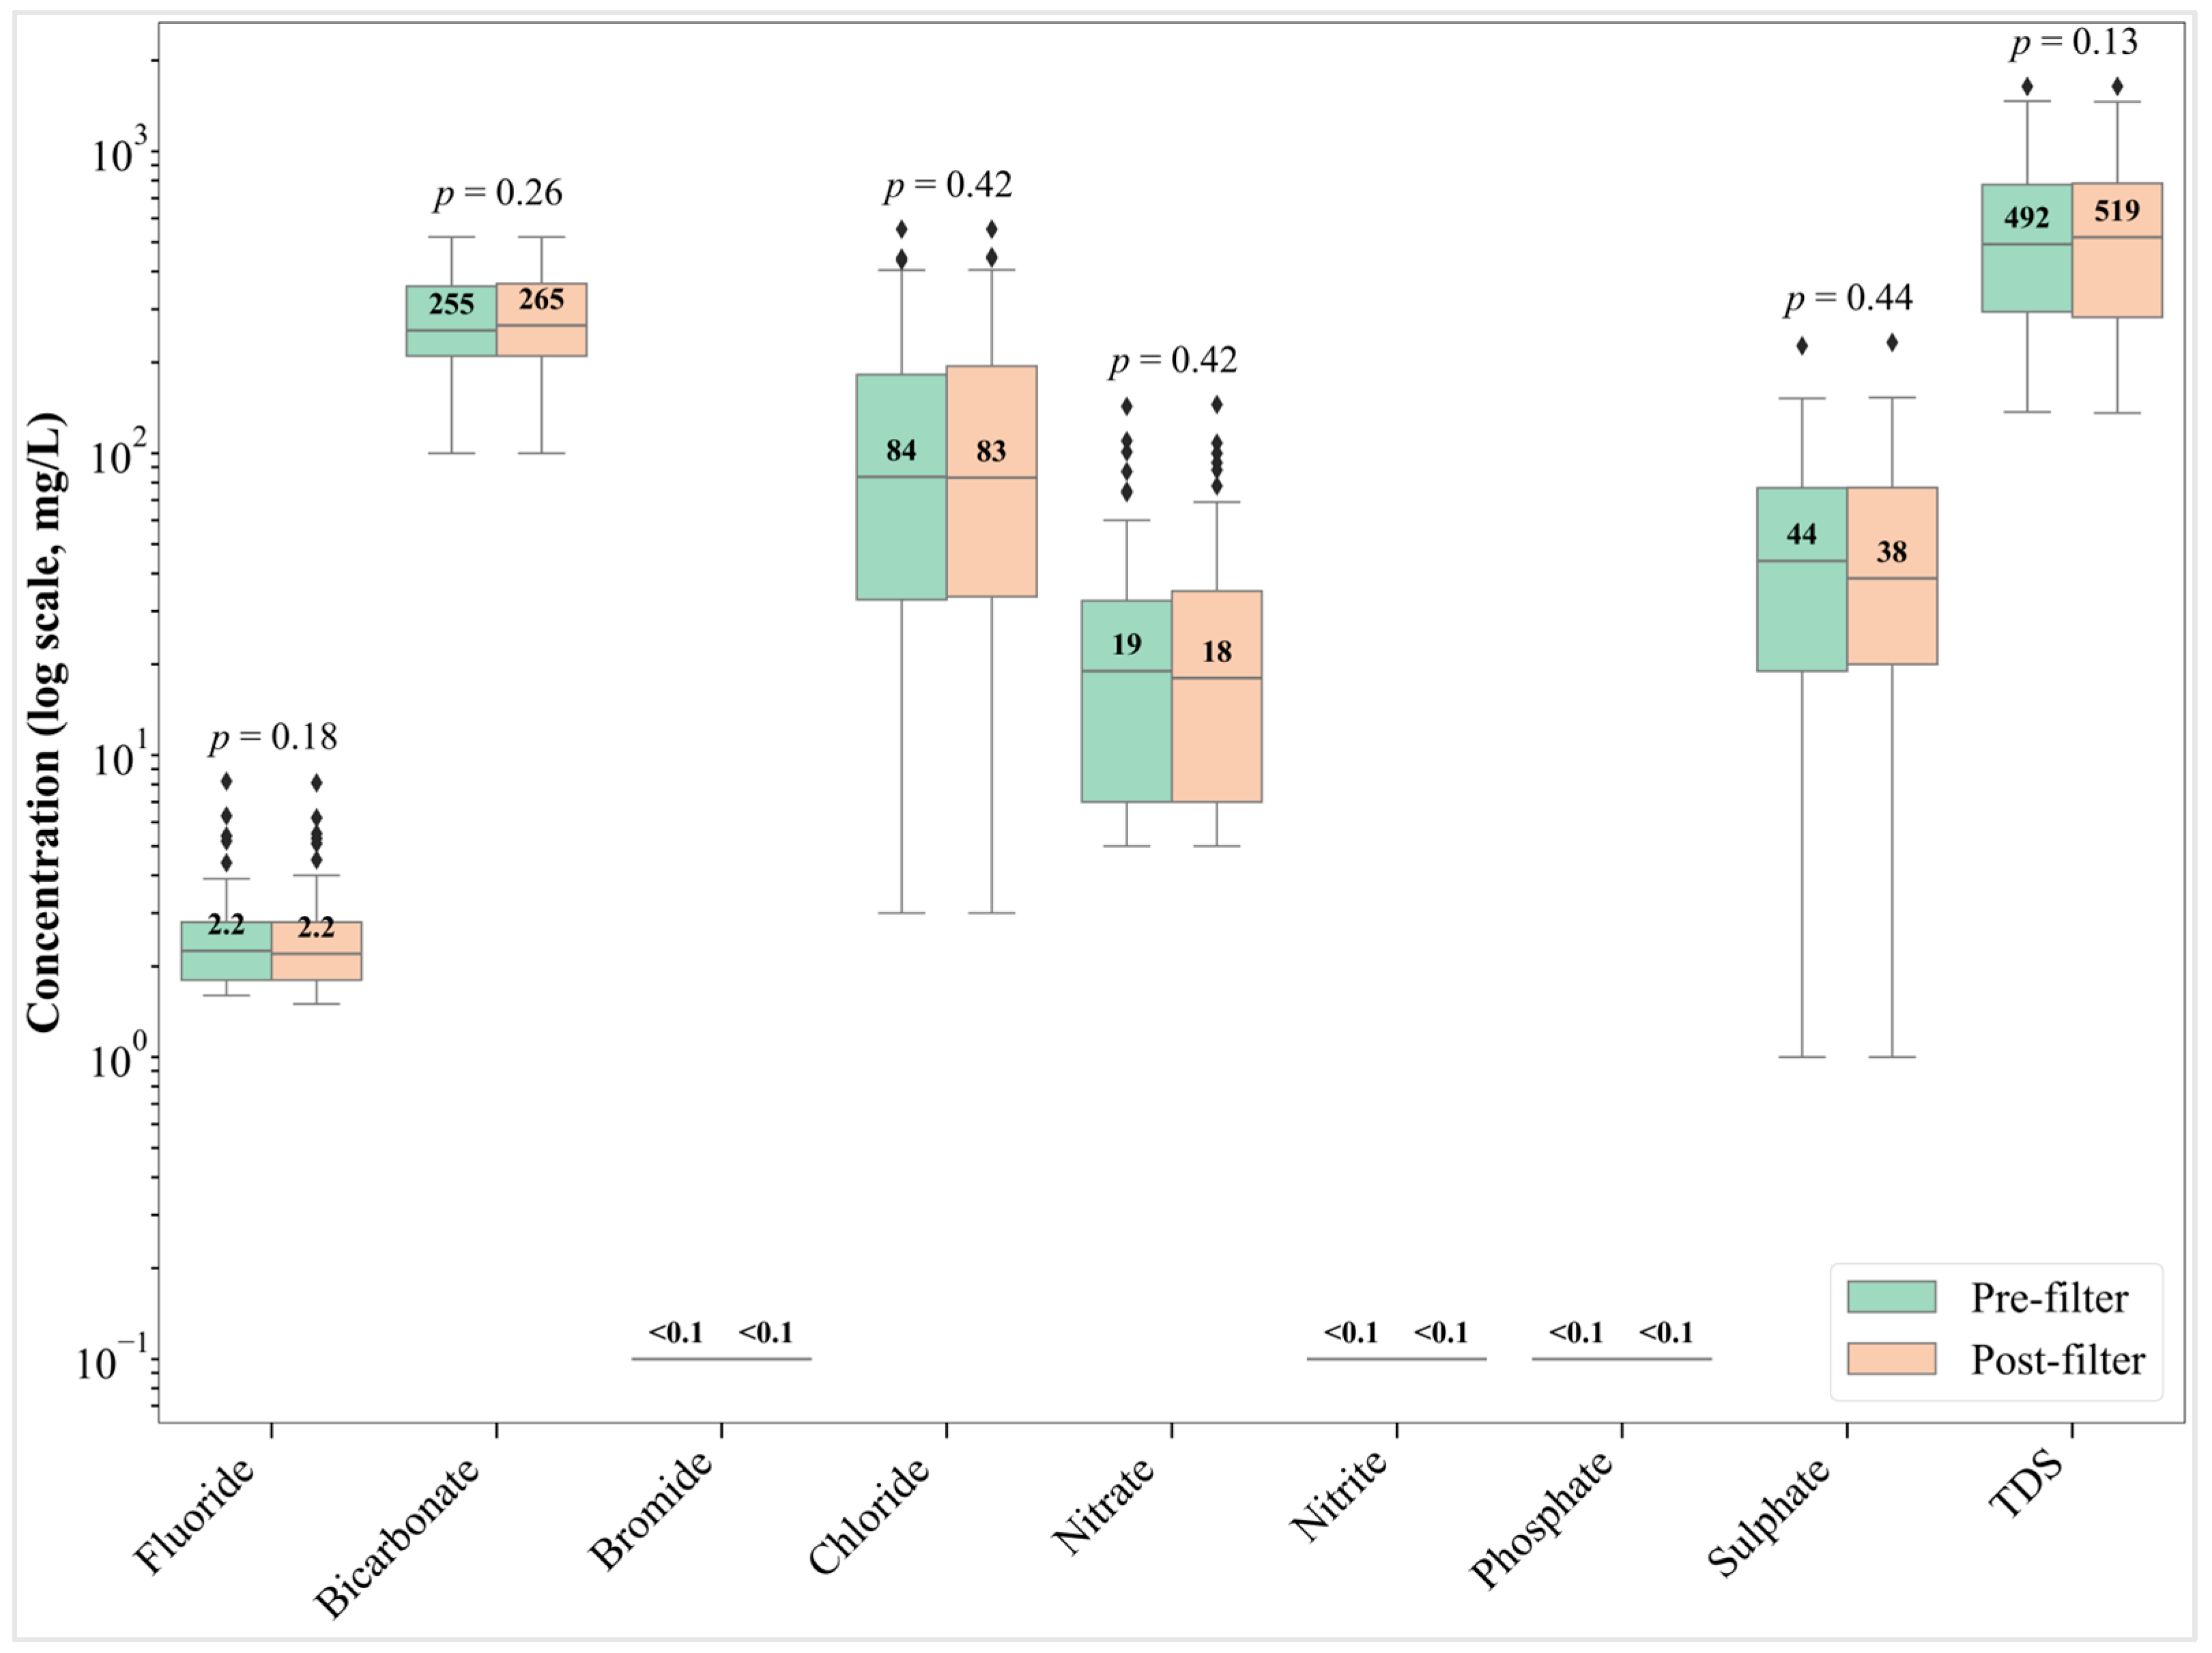
Fluoride concentrations in all post-filter samples exceeded the MPL of 1.5 mg/L, with mean values of 3.7 mg/L in Bankura and 2.2 mg/L in Purulia, highlighting the inadequacy of current treatment units. Statistical comparisons between individual concentrations of fluoride, bicarbonate, bromide, chloride, nitrate, nitrite, phosphate, sulphate, and TDS of pre-filter and post-filter samples of Bankura and Purulia using the Wilcoxon signed-rank test confirmed that no statistically significant differences were observed post-treatment (p > 0.05), indicating consistent non-performance in all the tested CWPPs, and across a range of parameters (Figure 3). Importantly, this absence of statistically significant paired differences does not necessarily imply the absence of treatment effects, noting the very small magnitude of observed pre–post changes relative to inter-CWPP variability. The non-performance could plausibly be attributed to lack of effective removal mechanisms and/or media for dissolved ions removal and/or inadequate maintenance. These trends align with earlier studies which reported poor performance of community-based filtration units in other rural regions of India where maintenance is inconsistent and filter media are often left unmonitored or unreplaced [34,35,44,64,68].

3.3. Site-Specific Pre- and Post-Filter Comparisons

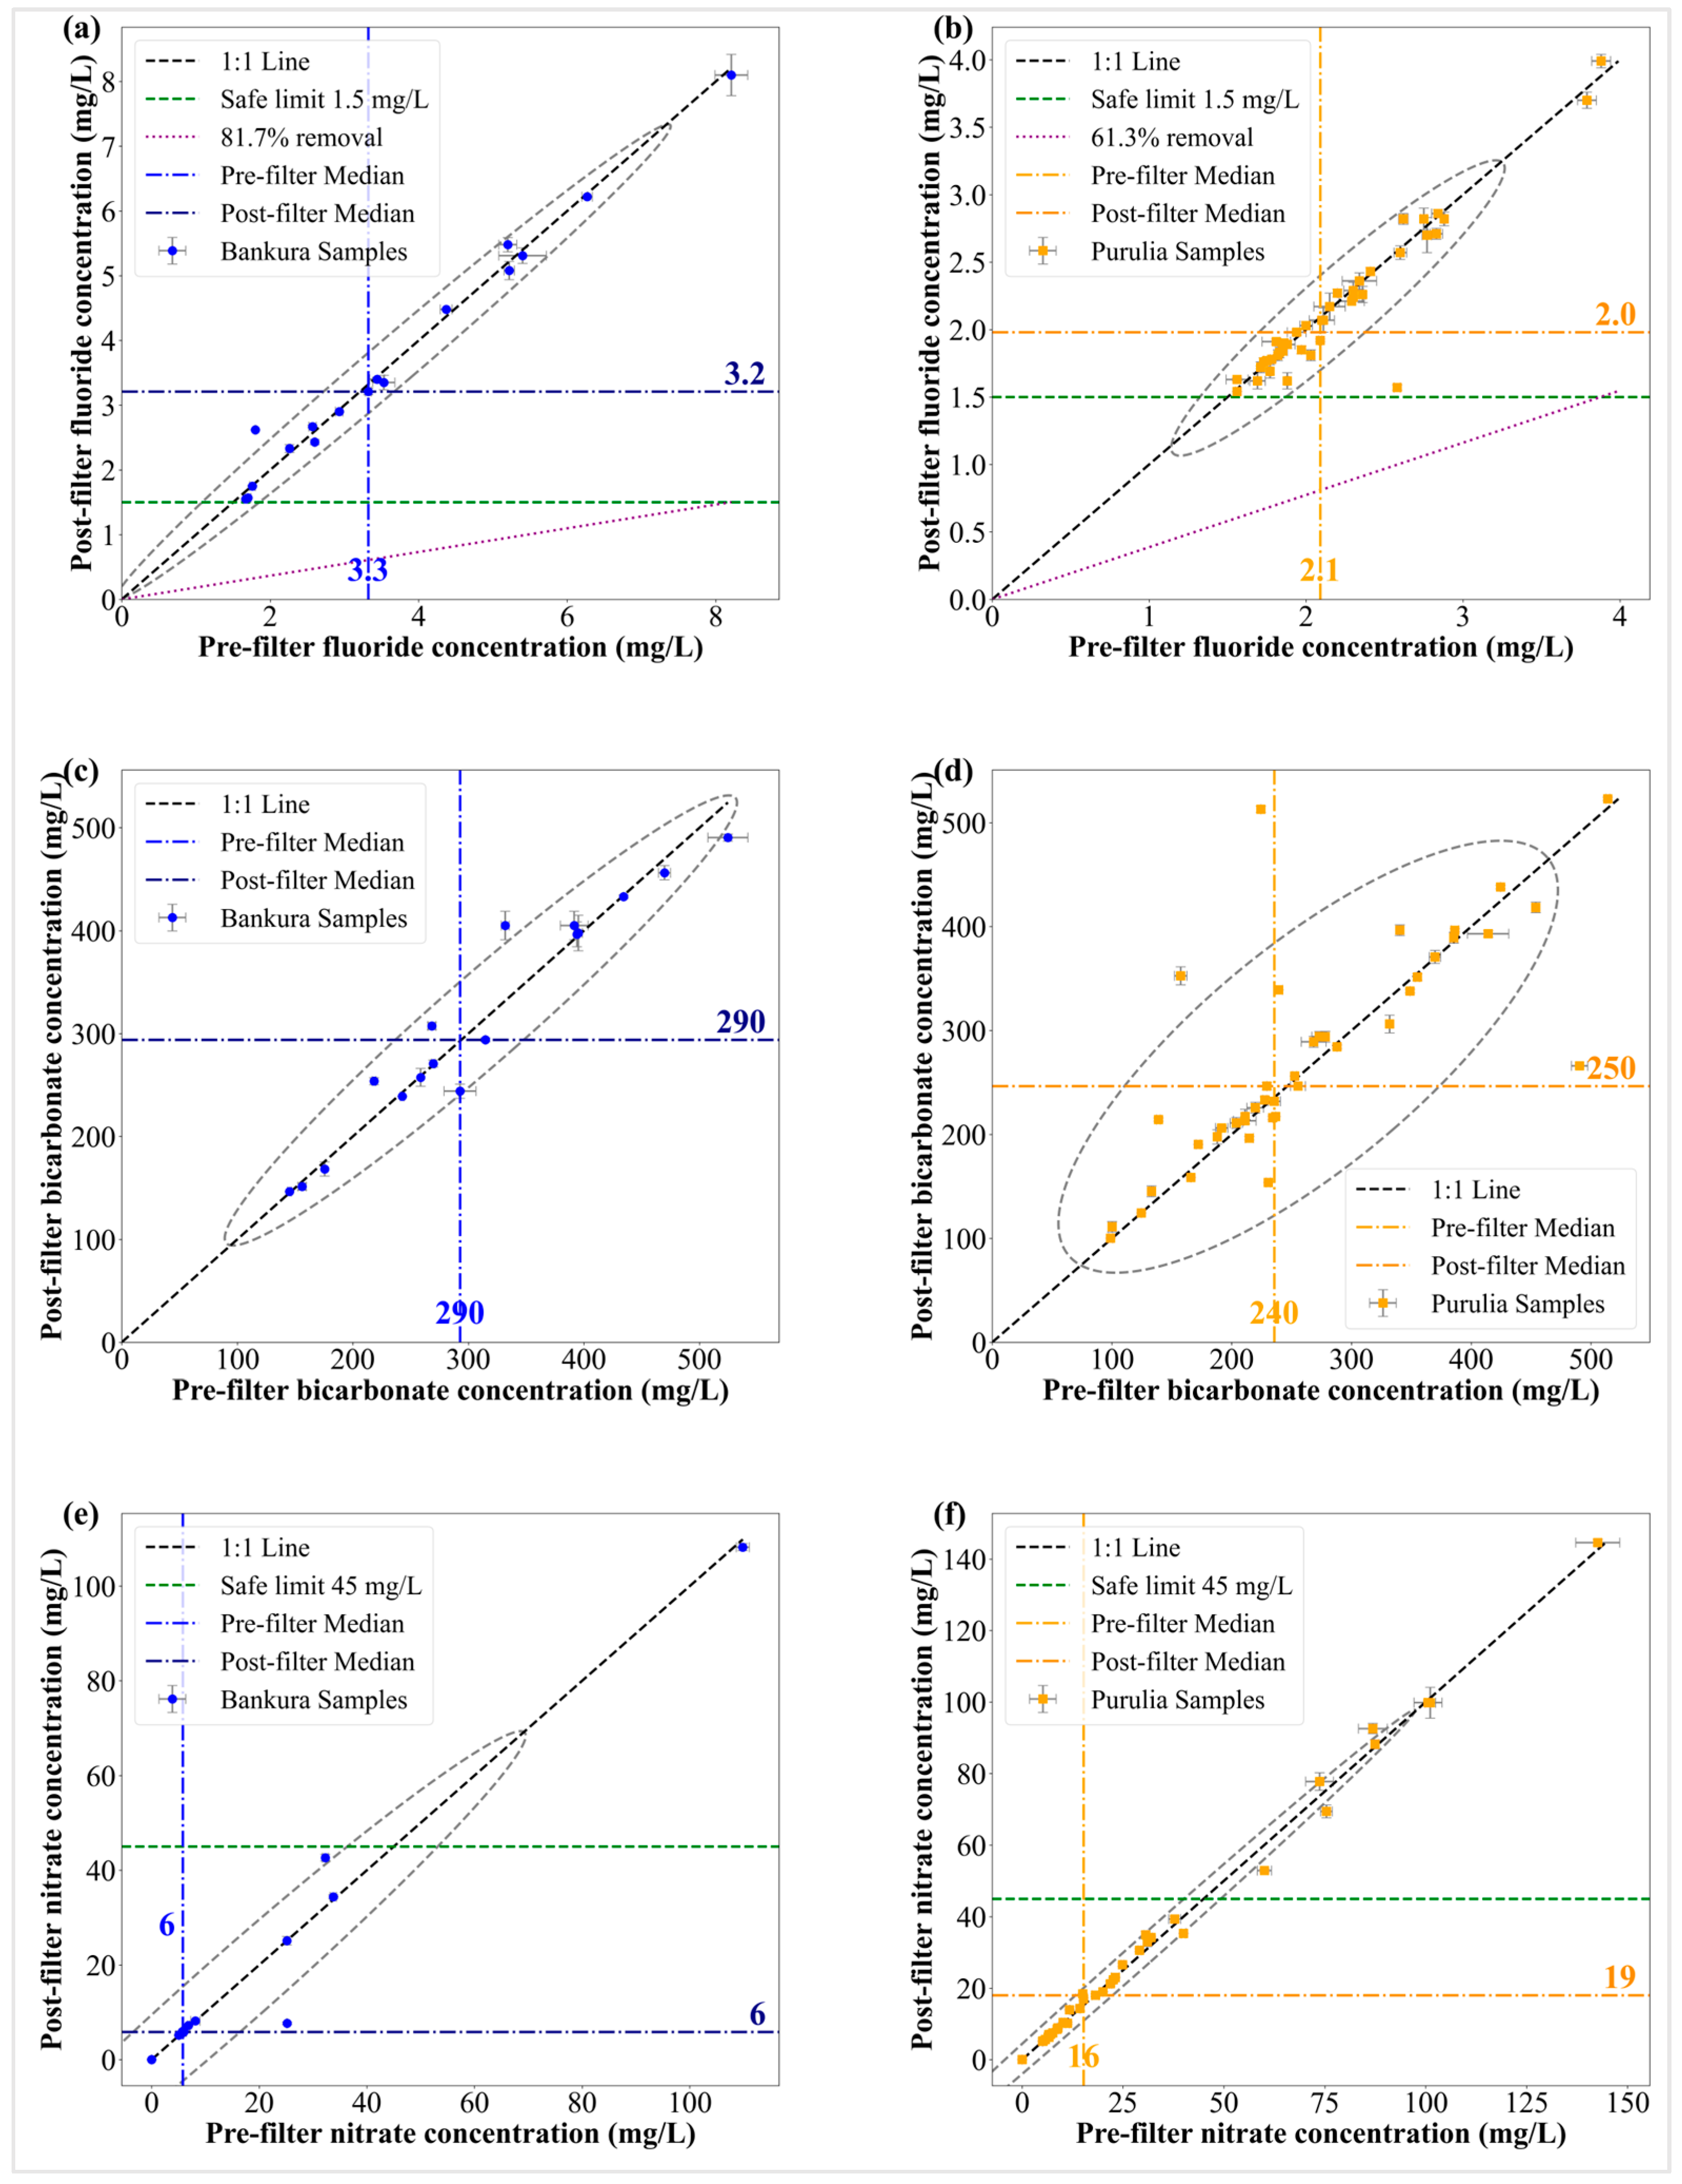
The lack of statistically significant effect of the water treatment on the post-filter concentrations of anions can also be observed within site-specific individualized data (Figure 4). The median fluoride concentrations in pre-filter and post-filter were 3.3 mg/L and 3.2 mg/L respectively in Bankura, representing negligible removal (Figure 4a). Similarly, samples from Purulia (Figure 4b) demonstrated insufficient fluoride removal performance. The median pre-filter and post-filter fluoride concentrations were 2.1 mg/L and 2.0 mg/L, respectively. These graphical trends were supported by numerical data (Tables S3–S6, Supplementary Information), which provided a complete breakdown of pre-filter vs. post-filter fluoride concentrations for each sample, along with the computed removal percentages. Similar trends were observed for bicarbonate and nitrate. In Bankura (Figure 4c,e), these anions remained largely unchanged post-treatment. In Purulia (Figure 4d,f), changes were consistently statistically non-significant.
Equivalence testing of paired concentration differences (Δ = post-filter − pre-filter) further confirmed a functionally null treatment effect across all 58 CWPPs (Section S4, Supplementary Information). For fluoride, median Δ values in both districts were close to zero and lay within the predefined equivalence margin (±0.1 mg/L), indicating that post-treatment concentrations were statistically and practically indistinguishable from pre-treatment values (Figure S1, Supplementary Information). Similar near-zero paired differences were observed for TDS and the other major anions, consistent with baseline operational or hydraulic non-function rather than chemistry-specific inhibition (Figure S1, Supplementary Information). The interpretation is further informed by statistical power considerations (Table S2, Supplementary Information). With 58 paired observations, the study had adequate power to detect moderate to large treatment effects, as demonstrated by the consistent increase in pH (mean Δ ≈ +0.19; median Δ ≈ +0.20), which corresponded to a relatively large, standardized effect (Cohen’s dpaired = 0.73). This indicates an operationally meaningful change in water chemistry, even where other solutes showed little response. In contrast, power to detect small effects was limited. For an effect size comparable to that observed for fluoride (|Cohen’s dpaired| ≈ 0.14), statistical power at n = 58 and α = 0.05 (two-sided) was approximately 0.28, implying a high probability of failing to detect subtle but real changes. Power calculations further indicate that achieving power exceeding 0.90 for effects of this magnitude would require substantially larger sample sizes, on the order of several hundred paired observations (n ≈ 450). However, the observed effect sizes for fluoride and other solutes were consistently small (|Cohen’s dpaired| ≤ 0.16), with confidence intervals spanning near-zero differences, suggesting that any undetected effects are unlikely to be operationally meaningful. Accordingly, the absence of substantial pre–post changes most plausibly reflects genuinely limited treatment impact rather than insufficient analytical sensitivity, underscoring the importance of magnitude-based interpretation alongside formal hypothesis testing. There are multiple potential ways to improve treatment outcomes, noting that systematically evaluating the efficiency of technical or non-technical process amendments was beyond the scope of this study. However, one potential mechanism to improve treatment outcomes could be that CWPPs incorporate fluoride-selective materials specific to the local water chemistry. Considering the highest observed fluoride concentrations in each district, only a maximum fluoride removal efficiency of 82% in Bankura and 61% in Purulia would be required to reduce fluoride to concentrations below the MPL (Figure 4a,b).
The selection of suitable material should ideally be in tandem with regular monitoring protocols and caretaker and/or community training for operation and maintenance. Without such interventions, and systematic maintenance and monitoring, current treatment units risk continued underperformance, failing to safeguard public health in fluoride-affected rural regions. Adequate consideration of potential co-occurring pollutants should be considered when evaluating overall water quality, acceptability and risk assessment.

3.4. Potential Factors Affecting Fluoride Removal

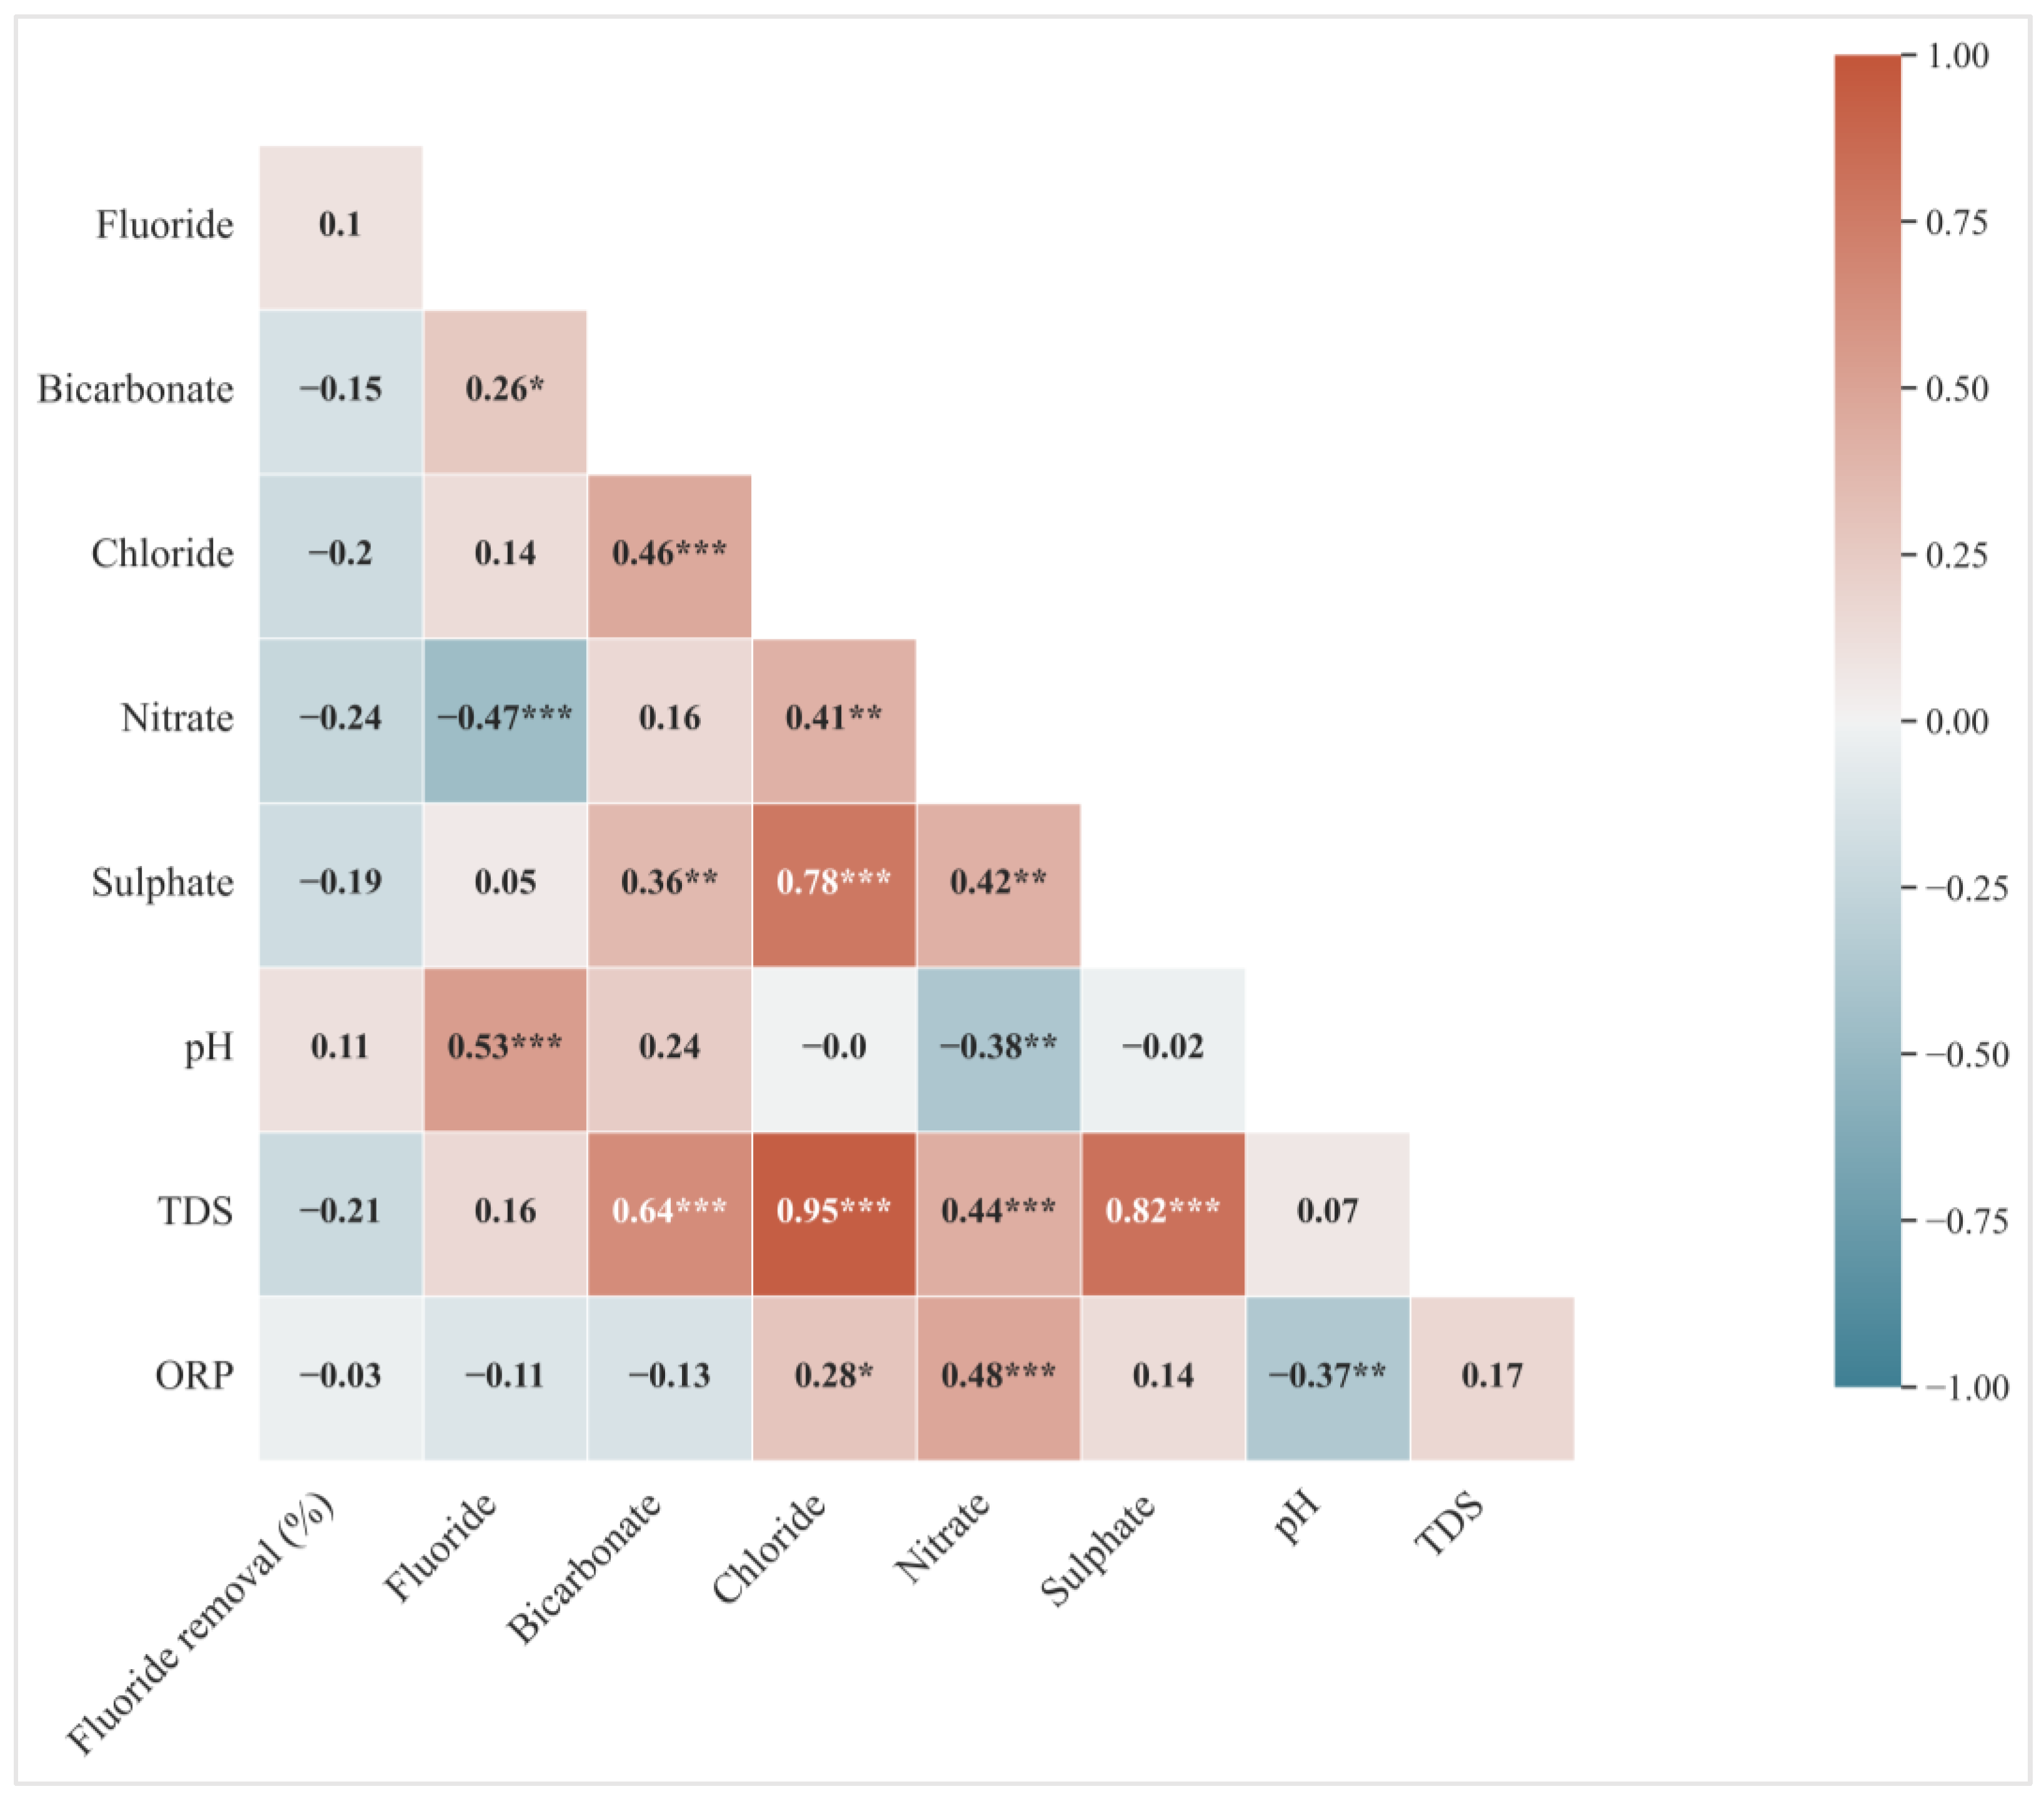
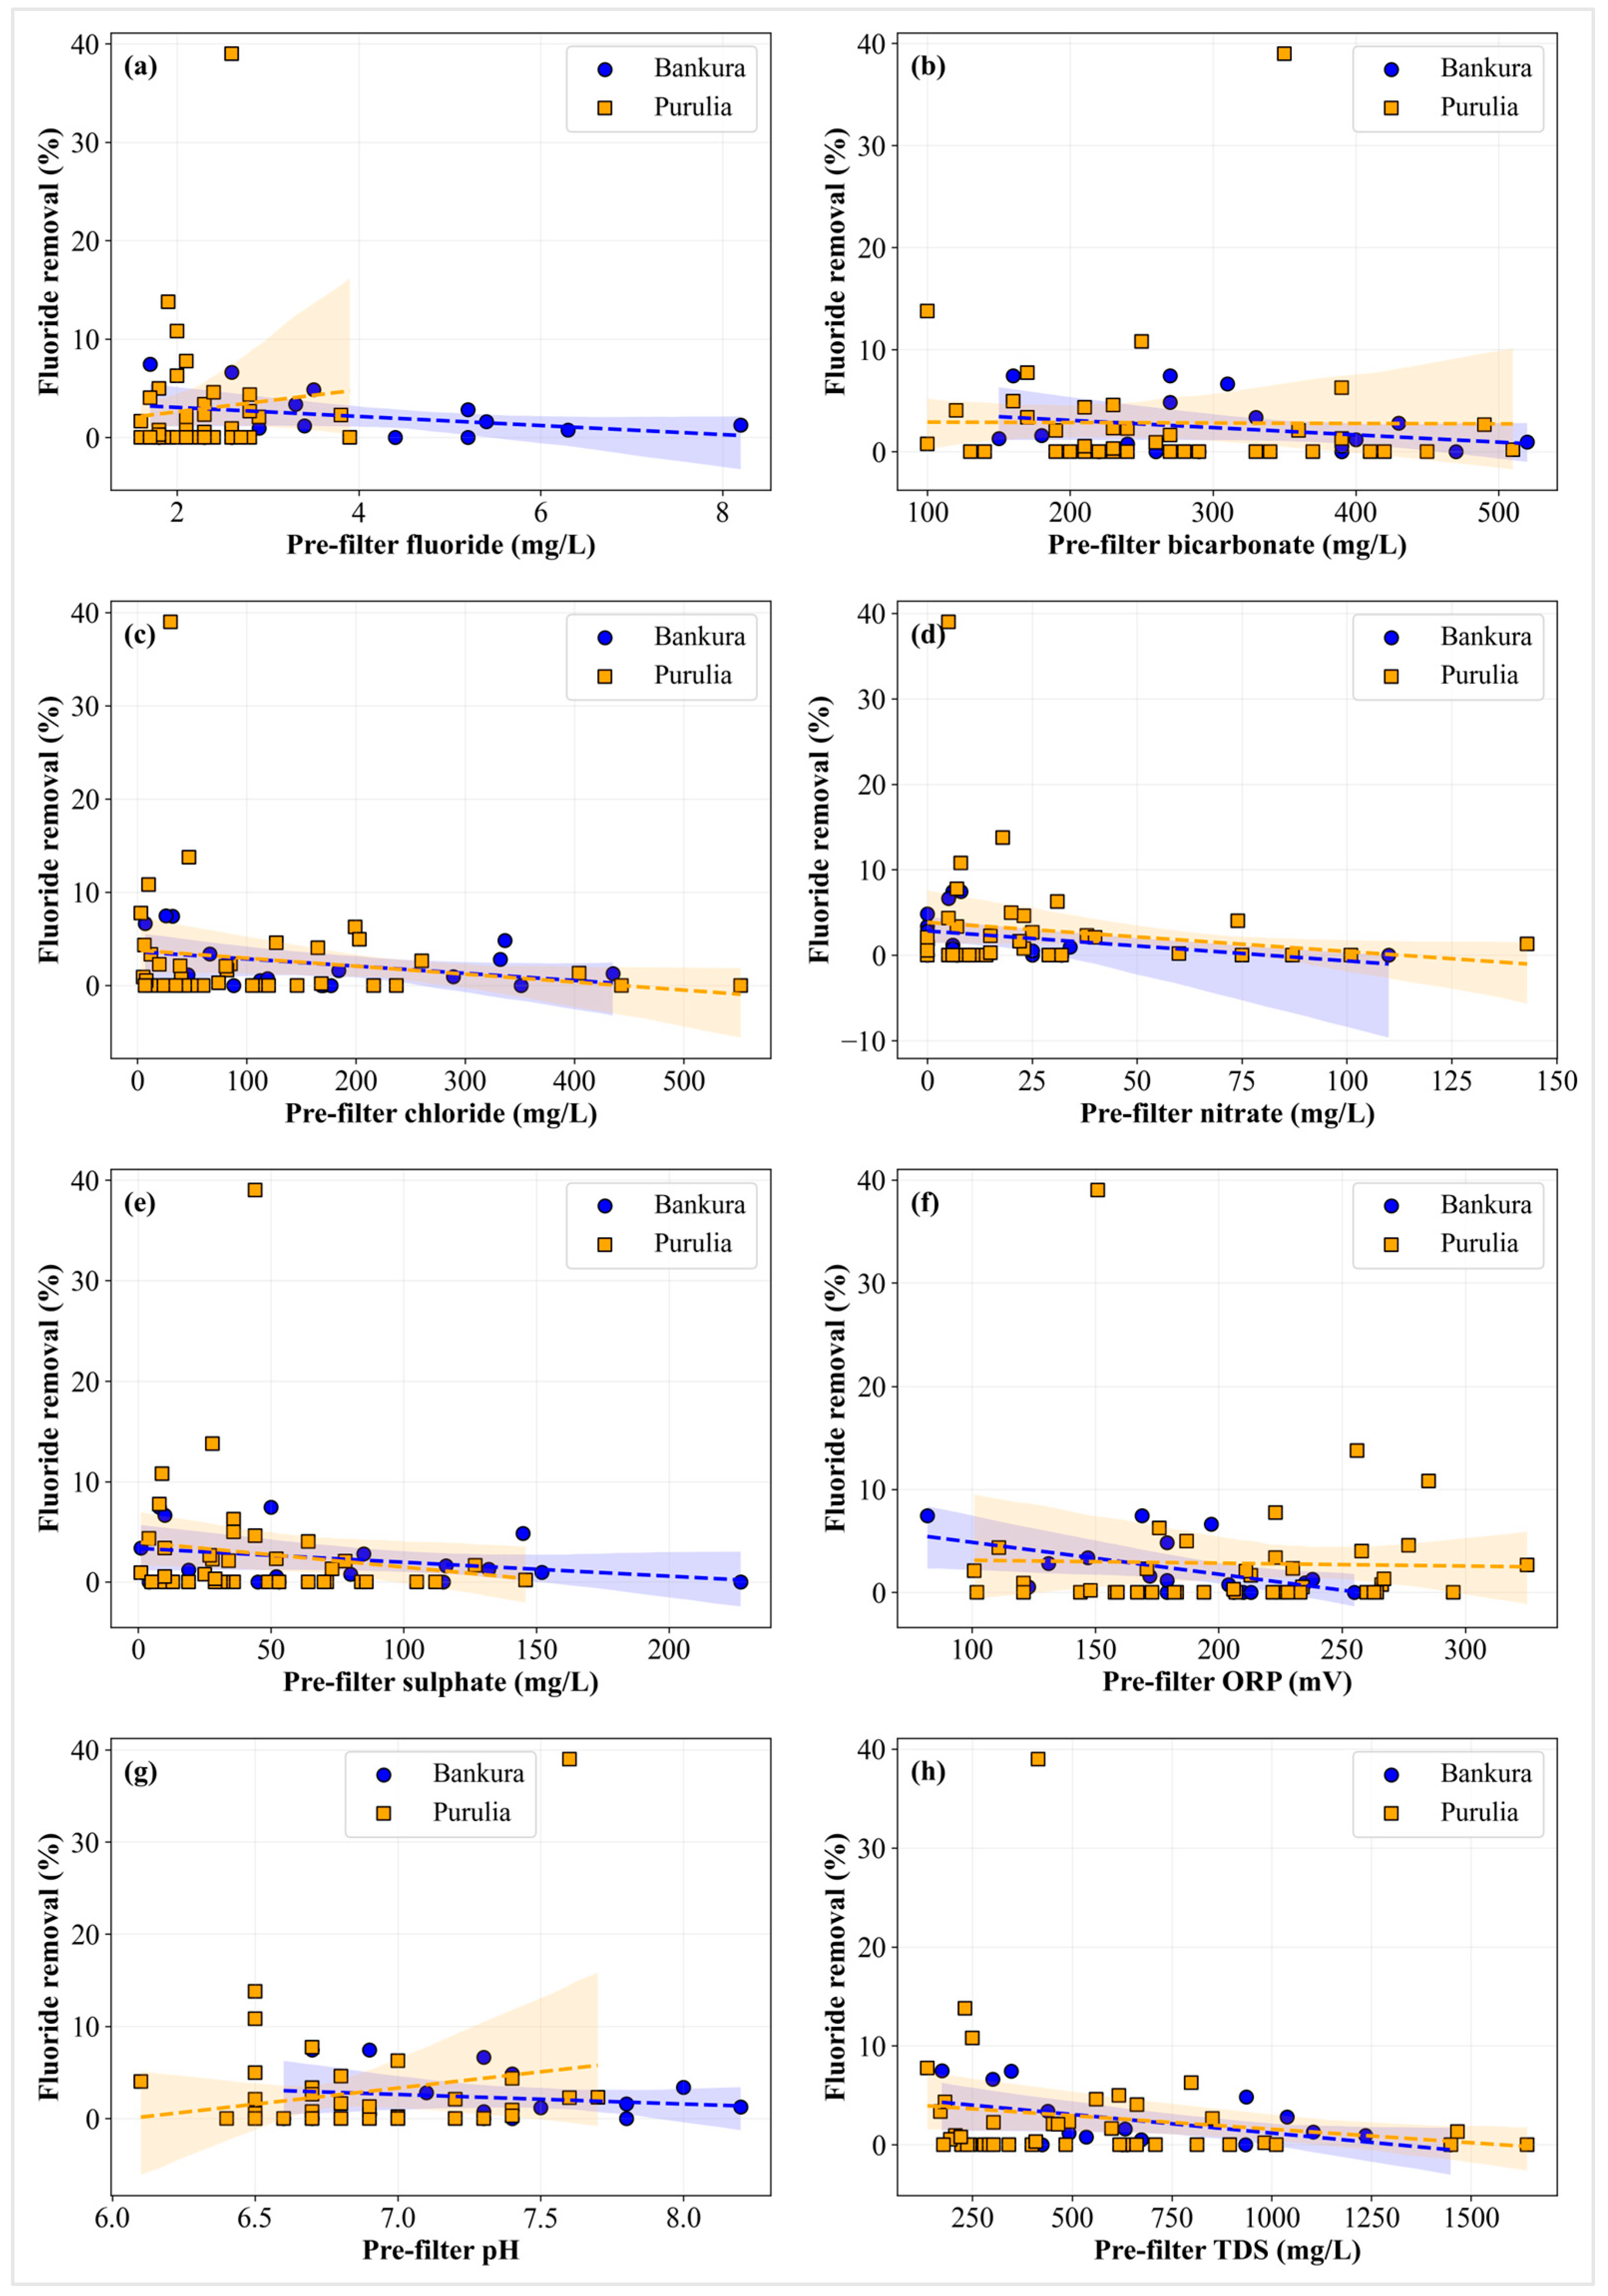
The influence of pre-filter, or source, water quality on fluoride removal was assessed using Spearman correlation analysis (Figure 5) and exploratory OLS regression (Figure 6).
None of the tested pre-filter water quality parameters, including bicarbonate, chloride, nitrate, sulphate, pH, TDS, ORP, or initial fluoride concentration, exhibited statistically significant associations with fluoride removal efficiency. The observed relationships were largely flat trends with wide scatter, indicating no detectable association within the resolution and variability of the dataset (Figure 5 and Figure 6b,c,e,h). This suggests that within the range of conditions measured, these ions did not exhibit consistent or systematic effects on treatment performance. Given that fluoride removal is consistently near-zero, overall poor system performance likely overrides or masks specific chemical influences, such as those due to competing ions, which would be more likely to be observed in systems demonstrating a wider range of operational efficiency. Most CWPPs were relatively new (<12 months) and we did not establish causality. Plausible contributors to underperformance include cumulative loading, inorganic/organic fouling, and particle attrition, which can reduce capacity and promote channeling. Backwashing may also matter; too infrequent allows clogging and stratification; too aggressive can wash out low-density or brittle media, reducing bed depth and empty bed contact time.
Field notes documented proximate issues: beds partly missing after maintenance and/or media loss, exhausted media not replaced on time, possible media–water mismatches, high loading rates or reduced bed depth, and operation and maintenance (O&M) gaps. These are indicative (albeit not definitive) types of factors likely contributing to the under-performance of remediation systems, noting it was not possible to rank relative importance due to the confounding factors.
Seasonal variations in groundwater level and chemistry, particularly in shallow aquifers more likely to be influenced by monsoonal recharge, may also affect the performance of community water purification plants. Monsoonal recharge and post-monsoon mixing may modify hydrochemical composition, ionic strength, alkalinity, and pH, which can influence adsorption efficiency and media exhaustion rates [69,70,71,72,73,74,75]. In fluoride-affected regions of West Bengal, studies have shown that pre- and post-monsoon groundwater chemistry differs systematically, reflecting changes in water–rock interaction, recharge pathways, and abstraction-induced mixing, with implications for both contaminant mobility and treatment effectiveness [70,71]. Seasonal recharge processes can either dilute or enhance fluoride concentrations and associated health risks, depending on local hydrogeological conditions [76], while basin-scale changes in subsurface characteristics across the lower Bengal basin may impact groundwater quality and availability [72].
Behavioral factors may have further discouraged uptake of correct use and maintenance protocols. For example, in the current study areas, most treated water was stored in overhead HDPE tanks, where prolonged sun exposure raised water temperature and may have imparted an undesirable taste, amongst other impacts, whilst users communicated a preference for cooler, untreated well water sourced directly. Such issues may have led to underuse of the systems and neglect of maintenance.
Overall, these findings suggest that while certain ions such as nitrate have been reported to influence the remediation efficiency under specific conditions in other studies [77], the effectiveness of the filtration systems in the studied areas here did not appear to be governed by a single dominant water quality parameter. Instead, the wide variability and generally low removal rates of fluoride observed across samples indicate that performance is likely affected by a combination of site-specific factors, operational conditions, and potentially the complexity of the source water chemistry. This highlights the need for more targeted, context-specific assessments when designing and managing community-scale fluoride treatment systems.

3.5. Operational Implications for Sustainable Management

The operational implications discussed here should be regarded as considerations rather than definitive recommendations, given the lack of verified information on filter media composition, system configuration, and operational history. Based on the observed lack of statistically significant correlations between fluoride removal efficiency and individual pre-filter water quality parameters, it is recommended that treatment system design and management prioritize site-specific assessments and operational monitoring over assumptions based solely on source water chemistry. This interpretation is consistent with established frameworks for sustainable rural water services, which emphasize system functionality, routine operation and maintenance (O&M), monitoring, and institutional accountability as key determinants of long-term performance [33]. The variability and generally low removal performance observed across samples suggest that factors such as filter maintenance, operational conditions, and/or local water matrix complexity might have played important roles in influencing CWPP’s performance. In rural contexts of India and many other developing areas, sustained operation is often hindered by limited resources and technical capacity, inadequate training of operators, irregular supply chains for consumables, and insufficient institutional oversight [78,79].
Incorporating user-preferred storage solutions, such as underground or concrete tanks, could potentially improve acceptability and operational regularity, noting however that this may introduce other trade-offs (such as cost and functionality). From a management perspective, involving the local community in decision-making and a transparent and standardized information system, such as a basic asset register documenting the treatment technology employed, adsorbent media type, installation and commissioning dates, maintenance and regeneration history and current operational status of each CWPP would enable systematic performance evaluation, allow timely troubleshooting, help inform future efforts and facilitate inventory development for scientific research. Such documentation would also align with functionality-focused monitoring approaches commonly applied in rural water supply programs. Without such interventions and information availability, identifying and addressing the root causes of poor performance remains highly challenging, and the system risks continued underperformance, failing to safeguard public health in fluoride-affected rural regions.
These observations primarily highlight the importance of routine performance monitoring, documentation of system design and maintenance, and transparent reporting mechanisms to support effective management of decentralized water treatment systems.

3.6. Limitations

This study is subject to two major limitations that should be considered when interpreting the results. First, detailed information on adsorbent media composition, adsorption capacity, filter configuration, hydraulic loading, and regeneration or replacement practices was not available for most systems. As a result, the analysis cannot attribute observed treatment outcomes to specific technological or operational factors, and causal inference is not possible. Second, sampling was conducted as a single field campaign during the late monsoon period. Groundwater geochemical conditions, particularly in shallow groundwaters, may vary seasonally due to monsoonal ingress, changes in recharge, and/or differences in abstraction patterns [69,70,71,72,76]. The findings therefore represent system performance at the time of sampling and do not necessarily capture temporal variability either seasonally or in regard to changes in system performance over time. These limitations underscore that the results should be interpreted as a field-based performance evaluation rather than a mechanistic or comprehensive engineering assessment of individual treatment units. Given the consistently low fluoride removal observed across systems, the ability to determine causal relationships with source water chemistry or operational influences is constrained. Larger spatial datasets systematically capturing a wider range of source water chemistry and operational parameters would enable interpretation with higher statistical power.

4. Conclusions

This study evaluated the performance of community-scale groundwater treatment systems under real operating conditions by assessing 58 community-based water purification plants (CWPPs) across fluoride-affected regions of Bankura and Purulia, West Bengal, India. None of the investigated CWPPs achieved safe post-treatment fluoride concentrations. Mean pre-filter fluoride concentrations (3.7 mg/L in Bankura and 2.2 mg/L in Purulia) and mean post-filter fluoride concentrations (3.7 mg/L in Bankura and 2.2 mg/L in Purulia) were similar and remained above the WHO recommended guideline of 1.5 mg/L in all the sampled units, indicating negligible fluoride removal efficiency under field conditions.
Hydrochemical analysis showed that bicarbonate was the dominant anion, followed by chloride, sulphate, nitrate, and fluoride, which is typical of the weathered carbonate aquifers and groundwaters in the Gangetic basin. Although competing anions such as bicarbonate, nitrate, and sulphate could theoretically inhibit fluoride adsorption through competitive interactions, the uniformly low removal efficiency suggests that operational and design factors, rather than source-water chemistry, are the primary causes of failure and may mask the potential influence of source water chemistry on performance.
Groundwater chemistry may vary seasonally due to changes in recharge, abstraction, and aquifer mixing, potentially influencing treatment performance. The results presented here therefore represent a late-monsoon snapshot of field performance and should not be used to infer specific technological or operational failure mechanisms. Given the absence of detailed system-level design and operational information, the findings are best understood as a field-based evaluation of real-world outcomes under prevailing conditions, rather than a comprehensive or mechanistic assessment.
Based on the observed trends and field observations, hypothetical contributing factors to the inefficiency in fluoride removal may include (a) inadequate consideration of local hydro-geochemistry during adsorbent media selection, (b) insufficient filter media regeneration or replacement practices maintained, and (c) operational lapses such as poor maintenance or incorrect filter handling and insufficient oversight. While causality could not be definitively established, the consistency of non-performance across sites and solutes points to baseline operational non-function as a primary constraint.
The challenges identified in this study are not necessarily unique to West Bengal, India, and are likely reflect common implementation challenges of decentralized rural water treatment systems in other resource-constrained settings, where limited technical capacity and user engagement strongly influence outcomes. Addressing these governance and implementation gaps through site-specific assessment, routine monitoring, and sustained operational oversight before or alongside deployment may help prevent remediations system’s underperformance, reducing exposure to unsafe drinking water and improving public health. Future research should expand spatial, multi-seasonal and hydro-geochemical coverage and may benefit from prioritizing alternative and/or next-generation treatment configurations under realistic field conditions to support more resilient and context-appropriate fluoride mitigation strategies.

Supplementary Materials

The following supporting information can be downloaded at: https://www.mdpi.com/article/10.3390/w18050549/s1, Figure S1: Paired differences (Δ = post-filter − pre-filter) for (a) fluoride, (b) bicarbonate, (c) chloride, (d) nitrate, (e) sulphate, and (f) total dissolved solids (TDS) across 58 community water purification plants (CWPPs) in Bankura and Purulia, West Bengal. Table S1. Limits of detection (LOD) and quantitation (LOQ) for inorganic anions measured by ion chromatography; Table S2. Paired comparison of pre- and post-filtration water quality parameters (n = 58); Table S3: Comparison of fluoride concentrations in pre-filter water samples against fluoride removal (%), collected from CWPPs in Bankura, West Bengal, India.; Table S4: Comparison of fluoride concentrations in pre-filter water samples against fluoride removal (%), collected from CWPPs in Purulia, West Bengal, India; Table S5: Physicochemical characteristics of post-filter groundwater samples collected from community-based water purification plants (CWPPs) in Bankura, West Bengal, India.; Table S6: Physicochemical characteristics of post-filter groundwater samples collected from community-based water purification plants (CWPPs) in Purulia, West Bengal, India.

Author Contributions

Conceptualization: A.K., M.A., L.A.R., S.M.R., K.A.M.; Data curation: A.K.; Formal analysis: A.K.; Funding acquisition: M.A., L.A.R., S.M.R.; Investigation: A.K., A.M., N.S.; Methodology: A.K., M.A., L.A.R.; Project administration: M.A.; Resources: MA, K.A.M., P.S.G., B.K.D.; Software: M.A.; Supervision: M.A., L.A.R., S.M.R., K.A.M.; Validation: A.K., M.A., L.A.R., S.M.R., K.A.M.; Visualization: A.K.; Writing—original draft: A.K.; Writing—review and editing: A.K., M.A., L.A.R., S.M.R., K.A.M., A.M., N.S., P.S.G., B.K.D. All authors have read and agreed to the published version of the manuscript.

Funding

This research work was supported by the Australia India Institute (Grant number 053139, Unnati Project, Department of Education, Australian Government). AK is a joint PhD student from Manchester-Melbourne PhD funding (The Cookson Scholars) and was supported by the Commonwealth through an Australian Government Research Training Program Scholarship [DOI: https://doi.org/10.82133/C42F-K220]. NS is supported as an institute fellow at IIT Kharagpur. AM was a joint PhD student supported by University of Melbourne-IIT Kharagpur PhD funding (MIPA) during the study period. LAR acknowledges support from a Dame Kathleen Ollerenshaw Fellowship (The University of Manchester), a UK Natural Environment Research Council (NERC) Exploring Frontiers award (NE/X010813/1) and a UKRI Future Leaders Fellowship (MR/Y016327/1 to LAR et al.; www.aquaroad.org; accessed on 24 January 2026).

Data Availability Statement

The original contributions presented in this study are included in the article/Supplementary Materials. Further inquiries can be directed to the corresponding authors.

Acknowledgments

The authors acknowledge the support of David A. Polya, Majid Sedighi, and Anne-Marie Glenny (all, The University of Manchester) for their contribution during the joint PhD project proposal. We also thank Manoj K. Tiwari (IIT Kanpur) for arranging resources in India. We also thank staff of IIT Kharagpur, numerous staff from the WBPHED and local villagers for field assistance. The views expressed here do not necessarily represent those of any of the institutions, funders, or individuals whose support is acknowledged. This research is published in public interest and whilst reasonable attempts have been made to ensure its accuracy, application to decision-making with financial or health consequences for specific individuals or groups should be made only after appropriate independent verification and relevant individual/group-specific assessments.

Conflicts of Interest

The authors declare no conflicts of interest. The funders had no role in the design of the study; in the collection, analyses, or interpretation of data; in the writing of the manuscript; or in the decision to publish the results.

References

  1. Podgorski, J.E.; Labhasetwar, P.; Saha, D.; Berg, M. Prediction Modeling and Mapping of Groundwater Fluoride Contamination throughout India. Environ. Sci. Technol. 2018, 52, 9889–9898. [Google Scholar] [CrossRef] [PubMed]
  2. Podgorski, J.E.; Berg, M. Global Analysis and Prediction of Fluoride in Groundwater. Nat. Commun. 2022, 13, 4232. [Google Scholar] [CrossRef] [PubMed]
  3. World Health Organization (Ed.) Guidelines for Drinking-Water Quality; Fourth Edition Incorporating the First and Second Addenda; World Health Organization: Geneva, Switzerland, 2022; ISBN 978-92-4-004506-4.
  4. Kheradpisheh, Z.; Mirzaei, M.; Mahvi, A.H.; Mokhtari, M.; Azizi, R.; Fallahzadeh, H.; Ehrampoush, M.H. Impact of Drinking Water Fluoride on Human Thyroid Hormones: A Case- Control Study. Sci. Rep. 2018, 8, 2674. [Google Scholar] [CrossRef] [PubMed]
  5. Bera, B.; Bhattacharjee, S.; Chamling, M.; Ghosh, A.; Sengutpa, N.; Ghosh, S. High Fluoride in Groundwater and Fluorosis Related Health Hazard in Rarh Bengal, India: A Socio-Environmental Study. Curr. Sci. 2021, 120, 1225. [Google Scholar] [CrossRef]
  6. Ayele, B.A.; Godebo, T.R.; Tekle-Haimanot, R.; Yifru, Y.M. Neuro-Medical Manifestations of Fluorosis in Populations Living in the Main Ethiopian Rift Valley. Environ. Geochem. Health 2022, 44, 1129–1136. [Google Scholar] [CrossRef] [PubMed]
  7. Veneri, F.; Iamandii, I.; Vinceti, M.; Birnbaum, L.S.; Generali, L.; Consolo, U.; Filippini, T. Fluoride Exposure and Skeletal Fluorosis: A Systematic Review and Dose-Response Meta-Analysis. Curr. Environ. Health Rep. 2023, 10, 417–441. [Google Scholar] [CrossRef]
  8. Kumar, J.V.; Moss, M.E.; Liu, H.; Fisher-Owens, S. Association between Low Fluoride Exposure and Children’s Intelligence: A Meta-Analysis Relevant to Community Water Fluoridation. Public Health 2023, 219, 73–84. [Google Scholar] [CrossRef]
  9. Braithwaite, V.S.; Valentine, R.A.; Wareham, N.J. Artificial Water Fluoridation for Dental Health Improvement: A Review and Meta-Analysis of the Evidence and Implications of a Possible Association between Water Fluoride and IQ. medRxiv 2024. [Google Scholar] [CrossRef]
  10. Taylor, K.W.; Eftim, S.E.; Sibrizzi, C.A.; Blain, R.B.; Magnuson, K.; Hartman, P.A.; Rooney, A.A.; Bucher, J.R. Fluoride Exposure and Children’s IQ Scores: A Systematic Review and Meta-Analysis. JAMA Pediatr. 2025, 179, 282–292. [Google Scholar] [CrossRef]
  11. Valdez-Jiménez, L.; Soria Fregozo, C.; Miranda Beltrán, M.L.; Gutiérrez Coronado, O.; Pérez Vega, M.I. Effects of the Fluoride on the Central Nervous System. Neurología (Engl. Ed.) 2011, 26, 297–300. [Google Scholar] [CrossRef]
  12. Peckham, S.; Lowery, D.; Spencer, S. Are Fluoride Levels in Drinking Water Associated with Hypothyroidism Prevalence in England? A Large Observational Study of GP Practice Data and Fluoride Levels in Drinking Water. J. Epidemiol. Community Health 2015, 69, 619–624. [Google Scholar] [CrossRef] [PubMed]
  13. Green, R.; Lanphear, B.; Hornung, R.; Flora, D.; Martinez-Mier, E.A.; Neufeld, R.; Ayotte, P.; Muckle, G.; Till, C. Association Between Maternal Fluoride Exposure During Pregnancy and IQ Scores in Offspring in Canada. JAMA Pediatr. 2019, 173, 940. [Google Scholar] [CrossRef]
  14. Malin, A.J.; Lesseur, C.; Busgang, S.A.; Curtin, P.; Wright, R.O.; Sanders, A.P. Fluoride Exposure and Kidney and Liver Function among Adolescents in the United States: NHANES, 2013–2016. Environ. Int. 2019, 132, 105012. [Google Scholar] [CrossRef]
  15. Meenakshi; Maheshwari, R.C. Fluoride in Drinking Water and Its Removal. J. Hazard. Mater. 2006, 137, 456–463. [Google Scholar] [CrossRef]
  16. Alharbi, T.; El-Sorogy, A.S. Health Risk Assessment of Nitrate and Fluoride in the Groundwater of Central Saudi Arabia. Water 2023, 15, 2220. [Google Scholar] [CrossRef]
  17. Begum, T.; Shareef, A.; Rafique, T.; Khwaja, H.A. Assessment of Groundwater Quality with Special Emphasis on Fluoride Contamination: A Case Study in Thar Desert, Pakistan. Sustain. Water Resour. Manag. 2024, 10, 53. [Google Scholar] [CrossRef]
  18. Jagtap, S.; Yenkie, M.K.; Labhsetwar, N.; Rayalu, S. Fluoride in Drinking Water and Defluoridation of Water. Chem. Rev. 2012, 112, 2454–2466. [Google Scholar] [CrossRef]
  19. Shortt, H.E.; Pandit, C.; Raghavachari, T. Endemic Fluorosis in the Nellore District of South India. Indian Med. Gaz. 1937, 72, 396–398. [Google Scholar]
  20. Chakraborti, D.; Das, B.; Murrill, M.T. Examining India’s Groundwater Quality Management. Environ. Sci. Technol. 2011, 45, 27–33. [Google Scholar] [CrossRef] [PubMed]
  21. NPPCF. National Programme for Prevention and Control of Fluorosis, Government of India (NPPCF): Revised Guidelines; Directorate General of Health Services: New Delhi, India, 2014. Available online: https://clinicalestablishments.mohfw.gov.in/sites/default/files/standard-treatment-guidelines/9711.pdf (accessed on 23 December 2024).
  22. Mukherjee, I.; Singh, U.K. Groundwater Fluoride Contamination, Probable Release, and Containment Mechanisms: A Review on Indian Context. Environ. Geochem. Health 2018, 40, 2259–2301. [Google Scholar] [CrossRef] [PubMed]
  23. Del Bello, L. Fluorosis: An Ongoing Challenge for India. Lancet Planet. Health 2020, 4, e94–e95. [Google Scholar] [CrossRef] [PubMed]
  24. Lacson, C.F.Z.; Lu, M.-C.; Huang, Y.-H. Fluoride-Containing Water: A Global Perspective and a Pursuit to Sustainable Water Defluoridation Management—An Overview. J. Clean. Prod. 2021, 280, 124236. [Google Scholar] [CrossRef]
  25. De, A.; Mridha, D.; Ray, I.; Joardar, M.; Das, A.; Chowdhury, N.R.; Roychowdhury, T. Fluoride Exposure and Probabilistic Health Risk Assessment Through Different Agricultural Food Crops from Fluoride Endemic Bankura and Purulia Districts of West Bengal, India. Front. Environ. Sci. 2021, 9, 713148. [Google Scholar] [CrossRef]
  26. Mondal, S. Modeling the Spatial Pattern of Household Quality of Living in West Bengal: An Approach of Hotspot and Cluster Analysis. Model. Earth Syst. Environ. 2020, 6, 833–851. [Google Scholar] [CrossRef]
  27. Roy, S.; Majumder, S.; Bose, A.; Chowdhury, I.R. The Rich-Poor Divide: Unravelling the Spatial Complexities and Determinants of Wealth Inequality in India. Appl. Geogr. 2024, 166, 103267. [Google Scholar] [CrossRef]
  28. ESSO. 2023 Southwest Monsoon End of Season Report; Earth System Science Organization (ESSO): New Delhi, India; Ministry of Earth Sciences (MoES) India Meteorological Department: New Delhi, India, 2023; pp. 1–24. Available online: https://internal.imd.gov.in/press_release/20231001_pr_2555.pdf (accessed on 23 December 2024).
  29. WBPHED. Status of Functional Household Tap Connection (FHTC). Available online: https://jjm.wbphed.gov.in/ (accessed on 29 July 2025).
  30. Chaudhuri, S.; Gupta, N. Levels of Living and Poverty Patterns: A District-Wise Analysis for India. Econ. Political Wkly. 2009, 44, 94–110. [Google Scholar]
  31. Asian Development Bank. West Bengal Drinking Water Sector Improvement Project: Report and Recommendation of the President (Project No. 49107-006). 2018. Available online: https://www.adb.org/projects/documents/ind-49107-006-rrp (accessed on 26 May 2025).
  32. Jal Jeevan Mission (JJM), Department of Drinking Water & Sanitation, Ministry of Jal Shakti, Government of India. Functionality Assessment of Household Tap Connection Under National Jal Jeevan Mission-2022. 2022; p. 24. Available online: https://jaljeevanmission.gov.in/sites/default/files/2022-11/FHTC_Purulia.pdf (accessed on 21 September 2023).
  33. Department of Drinking Water & Sanitation, Ministry of Jal Shakti, Government of India. Handbook on Drinking Water Treatment Technologies. 2023. Available online: https://jaljeevanmission.gov.in/sites/default/files/handbook-on-drinking-water-treatment-technologies-2023.pdf (accessed on 22 December 2024).
  34. Hossain, M.A.; Mukharjee, A.; Sengupta, M.K.; Ahamed, S.; Das, B.; Nayak, B.; Pal, A.; Rahman, M.M.; Chakraborti, D. Million Dollar Arsenic Removal Plants in West Bengal, India: Useful or Not? Water Qual. Res. J. 2006, 41, 216–225. [Google Scholar] [CrossRef]
  35. Hossain, M.A.; Sengupta, M.K.; Ahamed, S.; Rahman, M.M.; Mondal, D.; Lodh, D.; Das, B.; Nayak, B.; Roy, B.K.; Mukherjee, A.; et al. Ineffectiveness and Poor Reliability of Arsenic Removal Plants in West Bengal, India. Environ. Sci. Technol. 2005, 39, 4300–4306. [Google Scholar] [CrossRef] [PubMed]
  36. Chakrabarti, S.; Bhattacharya, H.N. Inferring the Hydro-Geochemistry of Fluoride Contamination in Bankura District, West Bengal: A Case Study. J. Geol. Soc. India 2013, 82, 379–391. [Google Scholar] [CrossRef]
  37. Marghade, D.; Malpe, D.B.; Duraisamy, K.; Patil, P.D.; Li, P. Hydrogeochemical Evaluation, Suitability, and Health Risk Assessment of Groundwater in the Watershed of Godavari Basin, Maharashtra, Central India. Environ. Sci. Pollut. Res. 2021, 28, 18471–18494. [Google Scholar] [CrossRef]
  38. Baral, U.; Saha, U.D.; Mukhopadhyay, U.; Singh, D. Drought Risk Assessment on the Eastern Part of Indian Peninsula—A Study on Purulia District, West Bengal. Environ. Monit. Assess. 2023, 195, 1364. [Google Scholar] [CrossRef]
  39. Kundu, A.; Nag, S.K. Assessment of Groundwater Quality in Kashipur Block, Purulia District, West Bengal. Appl. Water Sci. 2018, 8, 33. [Google Scholar] [CrossRef]
  40. Mwabi, J.K.; Adeyemo, F.E.; Mahlangu, T.O.; Mamba, B.B.; Brouckaert, B.M.; Swartz, C.D.; Offringa, G.; Mpenyana-Monyatsi, L.; Momba, M.N.B. Household Water Treatment Systems: A Solution to the Production of Safe Drinking Water by the Low-Income Communities of Southern Africa. Phys. Chem. Earth Parts A/B/C 2011, 36, 1120–1128. [Google Scholar] [CrossRef]
  41. Andey, S.; Labhasetwar, P.K.; Khadse, G.; Gwala, P.; Pal, P.; Deshmukh, P. Performance Evaluation of Solar Power Based Electrolytic Defluoridation Plants in India. In 5th International Conference on Water Resources and Arid Environments (ICWRAE 5); PSIPW: Riyadh, Saudi Arabia, 2013; Volume 2, pp. 139–145. Available online: https://psiewdr.org/article/341/IJWRAE_2(3)139-145.pdf (accessed on 12 May 2025).
  42. Yadav, M.; Singh, N.K.; Sinha, R.; Brighu, U.; Mathur, S.; Gupta, A.B. Performance Evaluation of Community Level Defluoridation Plants: A Case Study from Nagaur and Jodhpur, Rajasthan. Nat. Environ. Pollut. Technol. 2015, 14, 83. [Google Scholar]
  43. Shen, J.; Mkongo, G.; Abbt-Braun, G.; Ceppi, S.L.; Richards, B.S.; Schäfer, A.I. Renewable Energy Powered Membrane Technology: Fluoride Removal in a Rural Community in Northern Tanzania. Sep. Purif. Technol. 2015, 149, 349–361. [Google Scholar] [CrossRef]
  44. Das, A.; Joardar, M.; De, A.; Mridha, D.; Ghosh, S.; Das, B.; Mandal, J.; Thakur, B.K.; Roychowdhury, T. Appraisal of Treated Drinking Water Quality from Arsenic Removal Units in West Bengal, India: Approach on Safety, Efficiency, Sustainability, Future Health Risk and Socioeconomics. J. Hazard. Mater. 2024, 465, 133216. [Google Scholar] [CrossRef] [PubMed]
  45. Census of India Basic Population Figures of India, States, Districts and Sub-District. 2011. Available online: https://censusindia.gov.in/census.website/data/population-finder (accessed on 23 July 2023).
  46. Ratandeep; Dharmani, A.B.; Verma, M.; Rani, S.; Narang, A.; Singh, M.R.; Saya, L.; Hooda, S. Unravelling Groundwater Contamination and Health-Related Implications in Semi-Arid and Cold Regions of India. J. Contam. Hydrol. 2024, 261, 104303. [Google Scholar] [CrossRef]
  47. WBPHED. Fluoride Affected Habitations in West Bengal. Available online: https://maps.wbphed.gov.in/fluoride/index.html (accessed on 11 August 2023).
  48. WBPHED. Vision 2020. National SubMission for Arsenic and Fluoride Removal, Ministry of Drinking Water and Sanitation. Available online: https://wbphed.gov.in/en/pages/vision-2020 (accessed on 23 December 2024).
  49. Hazra, S.; Roy, S.; Mitra, S. Enhancing Adaptive Capacity and Increasing Resilience of Small and Marginal Farmers of Purulia and Bankura Districts, West Bengal to Climate Change; School of Oceanographic Studies, Jadavpur University: Kolkata, India, 2017. [Google Scholar]
  50. American Water Works Association, Water Environment Federation. Standard Methods for the Examination of Water and Wastewater, 20th ed.; American Public Health Association: Washington, DC, USA, 1999. [Google Scholar]
  51. Abraham, J. International Conference on Harmonisation Of Technical Requirements For Registration Of Pharmaceuticals For Human Use. In Handbook of Transnational Economic Governance Regimes; Tietje, C., Brouder, A., Eds.; Brill | Nijhoff: Leiden, The Netherlands, 2010; pp. 1041–1053. ISBN 978-90-04-18156-4. [Google Scholar] [CrossRef]
  52. Helsel, D.R.; Hirsch, R.M.; Ryberg, K.R.; Archfield, S.A.; Gilroy, E.J. Statistical Methods in Water Resources; U.S. Geological Survey Techniques and Methods, Book 4, Chapter A3; U.S. Geological Survey: Reston, VA, USA, 2020; 458p, ISBN 2328-7047 (print), ISSN 2328-7055 (online). [CrossRef]
  53. U.S. Environmental Protection Agency (USEPA). Statistical Analysis of Groundwater Monitoring Data at RCRA Facilities—Unified Guidance; EPA/530/R-09/007; Office of Resource Conservation and Recovery, U.S. EPA: Washington, DC, USA, 2009. Available online: https://nepis.epa.gov/Exe/ZyPURL.cgi?Dockey=P10055GQ.TXT (accessed on 12 May 2025).
  54. Cohen, J. Statistical Power Analysis for the Behavioral Sciences, 2nd ed.; Reprint; Psychology Press: New York, NY, USA, 2009; ISBN 978-0-8058-0283-2, 9780203771587 (ebook). [Google Scholar] [CrossRef]
  55. Montgomery, D.C.; Peck, E.A.; Vining, G.G. Introduction to Linear Regression, 5th ed.; John Wiley & Sons: Hoboken, NJ, USA, 2012. [Google Scholar]
  56. Waskom, M. Seaborn: Statistical Data Visualization. J. Open Source Softw. 2021, 6, 3021. [Google Scholar] [CrossRef]
  57. Richards, L.A.; Kumar, A.; Shankar, P.; Gaurav, A.; Ghosh, A.; Polya, D.A. Distribution and Geochemical Controls of Arsenic and Uranium in Groundwater-Derived Drinking Water in Bihar, India. Int. J. Environ. Res. Public Health 2020, 17, 2500. [Google Scholar] [CrossRef]
  58. Indian Standard Drinking Water-Specification (Second Revision). BIS Bureau of Indian Standards: New Delhi, India, 2012. Available online: https://law.resource.org/pub/in/bis/S06/is.10500.2012.pdf (accessed on 23 December 2024).
  59. De, A.; Das, A.; Joardar, M.; Mridha, D.; Majumdar, A.; Das, J.; Roychowdhury, T. Investigating Spatial Distribution of Fluoride in Groundwater with Respect to Hydro-Geochemical Characteristics and Associated Probabilistic Health Risk in Baruipur Block of West Bengal, India. Sci. Total Environ. 2023, 886, 163877. [Google Scholar] [CrossRef]
  60. Hossain, M.; Patra, P.K. Hydrogeochemical Characterisation and Health Hazards of Fluoride Enriched Groundwater in Diverse Aquifer Types. Environ. Pollut. 2020, 258, 113646. [Google Scholar] [CrossRef]
  61. Edmunds, W.M.; Smedley, P.L. Fluoride in Natural Waters. In Essentials of Medical Geology; Selinus, O., Ed.; Springer: Dordrecht, The Netherlands, 2013; pp. 311–336. ISBN 978-94-007-4374-8. [Google Scholar]
  62. Rajmohan, N.; Elango, L. Nutrient Chemistry of Groundwater in an Intensively Irrigated Region of Southern India. Environ. Geol. 2005, 47, 820–830. [Google Scholar] [CrossRef]
  63. Appelo, C.A.J.; Postma, D. Geochemistry, Groundwater and Pollution, 2nd ed.; 5th Corrected Reprint; CRC Press: London, UK, 2004; ISBN 978-0-415-36421-8, 9780429152320 (ebook). [Google Scholar] [CrossRef]
  64. Ayoob, S.; Gupta, A.K. Fluoride in Drinking Water: A Review on the Status and Stress Effects. Crit. Rev. Environ. Sci. Technol. 2006, 36, 433–487. [Google Scholar] [CrossRef]
  65. Edmunds, W.M.; Smedley, P.L. Groundwater Geochemistry and Health: An Overview. Geol. Soc. Lond. Spec. Publ. 1996, 113, 91–105. [Google Scholar] [CrossRef]
  66. Mohapatra, M.; Anand, S.; Mishra, B.K.; Giles, D.E.; Singh, P. Review of Fluoride Removal from Drinking Water. J. Environ. Manag. 2009, 91, 67–77. [Google Scholar] [CrossRef] [PubMed]
  67. Viswanathan, N.; Meenakshi, S. Role of Metal Ion Incorporation in Ion Exchange Resin on the Selectivity of Fluoride. J. Hazard. Mater. 2009, 162, 920–930. [Google Scholar] [CrossRef]
  68. Roshan, A.; Polya, D.A.; Kumar, A.; Ghosh, A.; Glenny, A.-M.; Sedighi, M.; Reichman, S.M.; Arora, M.; Richards, L.A. Performance of Field-Installed Groundwater Arsenic Remediation Systems in Bihar, India: Role of Source Water Chemistry, Technology Type and Other Factors. Groundw. Sustain. Dev. 2026, 33, 101597. [Google Scholar] [CrossRef]
  69. Majumder, S.; Datta, S.; Nath, B.; Neidhardt, H.; Sarkar, S.; Roman-Ross, G.; Berner, Z.; Hidalgo, M.; Chatterjee, D.; Chatterjee, D. Monsoonal Influence on Variation of Hydrochemistry and Isotopic Signatures: Implications for Associated Arsenic Release in Groundwater. J. Hydrol. 2016, 535, 407–417. [Google Scholar] [CrossRef]
  70. Nag, S.K.; Das, S. Assessment of Groundwater Quality from Bankura I and II Blocks, Bankura District, West Bengal, India. Appl. Water Sci. 2017, 7, 2787–2802. [Google Scholar] [CrossRef]
  71. Batabyal, A.K.; Gupta, S. Fluoride-Contaminated Groundwater of Birbhum District, West Bengal, India: Interpretation of Drinking and Irrigation Suitability and Major Geochemical Processes Using Principal Component Analysis. Environ. Monit. Assess. 2017, 189, 369. [Google Scholar] [CrossRef]
  72. Mohasin, P.; Kumar, G.S.; Arora, T.; Ray, S. Seasonal Changes in Subsurface Characteristics in the Lower Bengal Basin: Potential Impacts on Groundwater. Groundw. Sustain. Dev. 2024, 27, 101368. [Google Scholar] [CrossRef]
  73. Velazquez-Peña, G.C.; Solache-Ríos, M.; Martínez-Miranda, V. Competing Effects of Chloride, Nitrate, and Sulfate Ions on the Removal of Fluoride by a Modified Zeolitic Tuff. Water Air Soil Pollut. 2014, 226, 2236. [Google Scholar] [CrossRef]
  74. Millar, G.J.; Couperthwaite, S.J.; Dawes, L.A.; Thompson, S.; Spencer, J. Activated Alumina for the Removal of Fluoride Ions from High Alkalinity Groundwater: New Insights from Equilibrium and Column Studies with Multicomponent Solutions. Sep. Purif. Technol. 2017, 187, 14–24. [Google Scholar] [CrossRef]
  75. Tang, Y.; Guan, X.; Su, T.; Gao, N.; Wang, J. Fluoride Adsorption onto Activated Alumina: Modeling the Effects of pH and Some Competing Ions. Colloids Surf. A Physicochem. Eng. Asp. 2009, 337, 33–38. [Google Scholar] [CrossRef]
  76. Karunanidhi, D.; Rajan, M.; Roy, P.D.; Subramani, T. Seasonal Effects on Groundwater Fluoride and Evaluating Health Hazards: In-Situ Remediation via Managed Aquifer Recharge. Geosci. Front. 2025, 16, 102102. [Google Scholar] [CrossRef]
  77. Amiri, V.; Ali, S.; Sohrabi, N.; Amiri, F. Hydrogeochemical Evaluation with Emphasis on Nitrate and Fluoride in Urban and Rural Drinking Water Resources in Western Isfahan Province, Central Iran. Environ. Sci. Pollut. Res. 2023, 30, 108720–108740. [Google Scholar] [CrossRef]
  78. Osterwalder, L.; Johnson, C.A.; Yang, H.; Johnston, R.B. Multi-Criteria Assessment of Community-Based Fluoride-Removal Technologies for Rural Ethiopia. Sci. Total Environ. 2014, 488–489, 532–538. [Google Scholar] [CrossRef] [PubMed]
  79. Ndé-Tchoupé, A.I.; Crane, R.A.; Mwakabona, H.T.; Noubactep, C.; Njau, K.N. Technologies for Decentralized Fluoride Removal: Testing Metallic Iron-Based Filters. Water 2015, 7, 6750–6774. [Google Scholar] [CrossRef]
Figure 1. Geographic distribution of community water purification plants (CWPPs) sampling locations in Bankura district, West Bengal, India (top right), and Purulia district, West Bengal, India (bottom right). Black stars indicate locations of specific CWPPs from where samples were collected.
Water 18 00549 g001
Figure 2. Different drinking water sources and storage methods in the areas under study. (a) A traditional hand pump near a household, commonly used for groundwater extraction. (b) A community storage tank elevated on a platform with basic piping infrastructure for water distribution. (c) Community water purification plants (CWPPs) (noting that this type of system is the focus of the current manuscript). (d) A common household water filter used for drinking water purification. (e) An open well, still a primary water source in some regions, highlighting potential contamination risks. All images were taken in 2023 during field sampling by co-authors in the study areas of West Bengal, India.
Water 18 00549 g002
Figure 3. Box plot representation of pre-filter and post-filter concentrations of anions and TDS (n = 58). The y-axis is shown on a logarithmic scale to accommodate the wide range of values across parameters. All concentrations are in mg/L. Each box represents the interquartile range (IQR), with the black horizontal line within the boxes denoting the median concentration. The median values are annotated above the median lines. Bromide, nitrite and phosphate were not detected in the samples and are therefore represented at the minimum detection limits of the instrument. Whiskers extend to 1.5×IQR, and values beyond this range are shown as individual data points.
Water 18 00549 g003
Figure 4. Comparison of pre-filter and post-filter concentrations of selected anions (fluoride, bicarbonate, and nitrate) in groundwater samples collected from CWPPs in Bankura (a,c,e) and Purulia (b,d,f) districts of West Bengal, India. Error bars represent standard deviation of the duplicate analyses. Confidence ellipses (95%) highlight the spread and correlation of data points.
Water 18 00549 g004
Figure 5. Spearman correlation matrix showing the relationships between fluoride removal efficiency and selected pre-filter water quality parameters (concentrations in mg/L except for pH and ORP) in the study area (n = 58). Correlation coefficients are annotated within each cell, with statistical significance (using t-statistics) indicated by asterisks; p < 0.05 (*), p < 0.01 (**), and p < 0.001 (***).
Water 18 00549 g005
Figure 6. Relationship between fluoride removal efficiency (%) and pre-filter concentrations of analyzed water quality parameters in the study area (n = 58). Subplots (a–h) depict the influence of individual parameters: (a) fluoride, (b) bicarbonate, (c) chloride, (d) nitrate, (e) sulphate, (f) ORP, (g) pH, and (h) TDS on the percentage removal of fluoride by the community water purification plants (CWPPs). Data points are mean values of the duplicate analysis for Bankura (blue circles) and Purulia (orange squares). Dashed lines represent regression trends for each district, with shaded areas indicating 95% confidence intervals (CI). Regression lines and confidence intervals are shown for exploratory purposes only and do not imply predictive or causal relationships.
Water 18 00549 g006
Table 1. Pre-filter water chemistry in Bankura (n = 17). Concentrations (mg/L; unless mentioned otherwise) of anions (F, HCO3, Cl, NO3, SO42−), oxidation-reduction potential (ORP in mV), pH (no units), and total dissolved solids (TDS) measured in 17 pre-filter water samples (B-1 to B-17) from Bankura, and key statistical data, including minimum, maximum, mean, median, and standard deviation values across 17 samples, are tabulated for each parameter. The analytical detection and quantitation limits are summarized elsewhere (Table S1, Supplementary Information). Additionally, the table compares each parameter with the maximum permissible limit (MPL) for water quality standards.
Sample IDFHCO3ClNO3SO42−ORPpHTDS
B-14.4290170<0.1461807.8640
B-22.9520290341502407.41240
B-33.4400466201807.5490
B-42.33903501102302106.61450
B-53.333067<0.111508.0440
B-61.8220882642607.3420
B-71.839011026531206.9670
B-81.727033950806.7350
B-92.6470170331202107.4940
B-108.2150440<0.11302408.21100
B-111.716027691706.9170
B-125.4180190<0.11201707.8630
B-133.5270340<0.11501807.4940
B-145.22601807542106.7630
B-152.631086112007.3300
B-165.2430330<0.1851307.11040
B-176.32401206812007.3540
Min value1.71508<0.11806.6170
Max value8.25204401102302608.21450
Mean3.731117016771807.3710
Median3.32901706541807.3630
Stdev1.91091303164500.5360
MPL1.5 a,b-1000 a45 a/50 b400 a-(6.5–8.5) a2000 a
Samples exceeding
MPL (%)
100-05.80-00
Note: MPL values for each parameter are indicated with ‘a’ for Indian [58] and ‘b’ for international guidelines [3].
Table 2. Pre-filter water chemistry in Purulia (n = 41). Concentrations (mg/L; unless mentioned otherwise) of anions (F, HCO3, Cl, NO3, SO42−), oxidation-reduction potential (ORP in mV), pH (no units), and total dissolved solids (TDS) measured in 41 pre-filter water samples (P-1 to P-41) from Purulia, and key statistical data, including minimum, maximum, mean, median, and standard deviation values across 41 samples, are tabulated for each parameter. The analytical detection and quantitation limits are summarized elsewhere (Table S1, Supplementary Information). Additionally, the table compares each parameter with the maximum permissible limit (MPL) for water quality standards.
Sample IDFHCO3ClNO3SO42−ORPpHTDS
P-12.237011012491407.3630
P-21.9220126101007.0220
P-31.8510170611501507.0980
P-42.039020031361807.0800
P-51.927015088711806.5710
P-61.614061100851906.4480
P-72.62606<0.121207.4210
P-81.7230298141707.2240
P-91.9210377361706.9280
P-102.4410220<0.1531606.5810
P-112.025010892906.5250
P-123.9290509332606.7400
P-132.32108<0.1112306.5200
P-141.8420240321102306.81010
P-151.71303912323006.5240
P-161.91004819292606.5230
P-171.8240120301102107.0620
P-182.3170127112206.7170
P-192.11704792206.7140
P-202.423013024442806.8560
P-212.82106651107.4180
P-222.628024076642307.2900
P-232.32308538522307.7490
P-241.81004023262706.7220
P-252.936040<0.1341007.2450
P-262.81907951807.0180
P-273.82402016281707.6300
P-282.6350316441507.6420
P-292.849026025273306.7850
P-301.72204315302206.7340
P-312.02402411201606.9290
P-321.627082221302106.8600
P-331.82307516292107.4410
P-341.816020021361906.5620
P-352.734011032542606.8660
P-362.1390410140732706.91470
P-371.745055087712606.51640
P-381.712017074642606.1660
P-392.3200366201206.6300
P-402.1330440100872306.71450
P-412.11908240782106.5470
Min value1.61004<0.121006.1140
Max value3.95105501401503307.71640
Mean2.226411030462106.9540
Median2.12406116362106.8450
Stdev0.51041303435600.38370
MPL1.5 a,b-1000 a45 a/50 b400 a-(6.5–8.5) a2000 a
Samples exceeding
MPL (%)
100-0200-00
Note: MPL values for each parameter are indicated with ‘a’ for Indian [58] and ‘b’ for international guidelines [3].
Disclaimer/Publisher’s Note: The statements, opinions and data contained in all publications are solely those of the individual author(s) and contributor(s) and not of MDPI and/or the editor(s). MDPI and/or the editor(s) disclaim responsibility for any injury to people or property resulting from any ideas, methods, instructions or products referred to in the content.