Article

Evaluation and Management of Water Losses in Water Distribution Systems: Towards the Implementation of Directive (EU) 2020/2184


by
Iwona Deska
1,*,
Urszula Kępa
1 and
Agnieszka Ociepa-Kubicka
2
1
Department of Sanitary Networks and Installations, Faculty of Infrastructure and Environment, Czestochowa University of Technology, Brzeźnicka 60 A, 42-215 Czestochowa, Poland
2
Entrepreneurship Centre, Faculty of Management, Czestochowa University of Technology, Armii Krajowej 19 B, 42-218 Czestochowa, Poland
*
Author to whom correspondence should be addressed.
Water 2026, 18(5), 527; https://doi.org/10.3390/w18050527
Submission received: 17 December 2025 / Revised: 11 February 2026 / Accepted: 16 February 2026 / Published: 24 February 2026
(This article belongs to the Special Issue Optimal Design of Water Distribution Systems)

Abstract

In accordance with the provisions of Directive (EU) 2020/2184, the largest water supply companies in the European Union (EU) will be required to report real water losses starting from 2026. The recommended water loss performance indicators (PIs) are the infrastructure leakage index (ILI) rating method or “another appropriate method”. The article presents results of research aimed at examining the relationship between the ILI and other selected PIs for water losses in selected Polish water distribution systems (WDSs) located in southern Poland. The highest values of determination coefficients for the linear relationships between the ILI and PIs were obtained in the case of intermediate normalized PIs for real losses expressed both as a volume of water per km of mains per 1 m H2O of pressure (R2 = 0.951) and as a volume of water per service connection per 1 m H2O of pressure (R2 = 0.9365). A very strong linear correlation with the ILI was also obtained in the case of basic normalized PIs for real losses, expressed as the volume of water per service connection (R2 = 0.7336). The moderate linear correlation was detected in the case of the percentage PIs for water losses. Results show that the recommended indicators, which can be used when the ILI cannot be calculated, should be the intermediate or basic operational normalized indicators.

1. Introduction

The urbanization and excessive exploitation of freshwater resources contribute to water scarcity and stress [1,2,3]. Seasonal water scarcity is a common problem in the hot regions of the Earth, such as in East Asia and Central Africa. Still, it also occurs in some parts of South America and southern Europe [1,4]. The deteriorating surface and groundwater quality is an additional problem many countries face [3,5]. Unfortunately, due to climate change, water scarcity and degrading water quality issues may increase, especially in river basins that are currently very vulnerable to water stress [5].
According to the Special Edition of the Sustainable Development Goals (SDGs) Report from 2023 [4], in 2020, as many as 2.4 billion people lived in areas at risk of water scarcity. According to SDGs Report from 2025 [6], in 2024, 2.2 billion people still did not have access to safely managed drinking water. Strategies for improving water security include improving the efficiency of water use, taking into account changes in water availability over time. In regions affected by water scarcity, supply-driven planning is a much better solution than demand-driven planning [3].
Water losses in distribution systems are a serious global problem affecting developed countries [7,8]. For example, the average non-revenue water (NRW) level in European countries remains at 25%, while globally this figure is 30% [7,8,9]. However, NRW values may vary significantly across the EU countries. Taking into account the data for 2021, NRW expressed as a percentage of water supplied (WS) to the network in the Netherlands was approximately 5%, while in Poland it was 25%, and in Bulgaria this value reached as much as approximately 60% [9,10].
The water collection, treatment, and transport require significant energy inputs; for example, the entire water and wastewater sector in the EU accounts for 3.5% of electricity consumption [11]. Therefore, water losses are also inextricably linked to energy losses and additional greenhouse gas (GHG) emissions [12]. Water losses, therefore, negatively affect the environment, lead to waste of resources and energy [13], and thus generate additional, unnecessary costs for water supply companies [14]. Therefore, high energy efficiency of water supply systems (WSSs) is a priority in water sector management [11,15]. Regular inspection of pump systems, pressure management, and even energy recovery through pumps as turbines (PATs) [16,17,18] significantly increases the energy efficiency of water supply systems. Additionally, good results are achieved through effective monitoring, automation, and proper asset management [7,18].
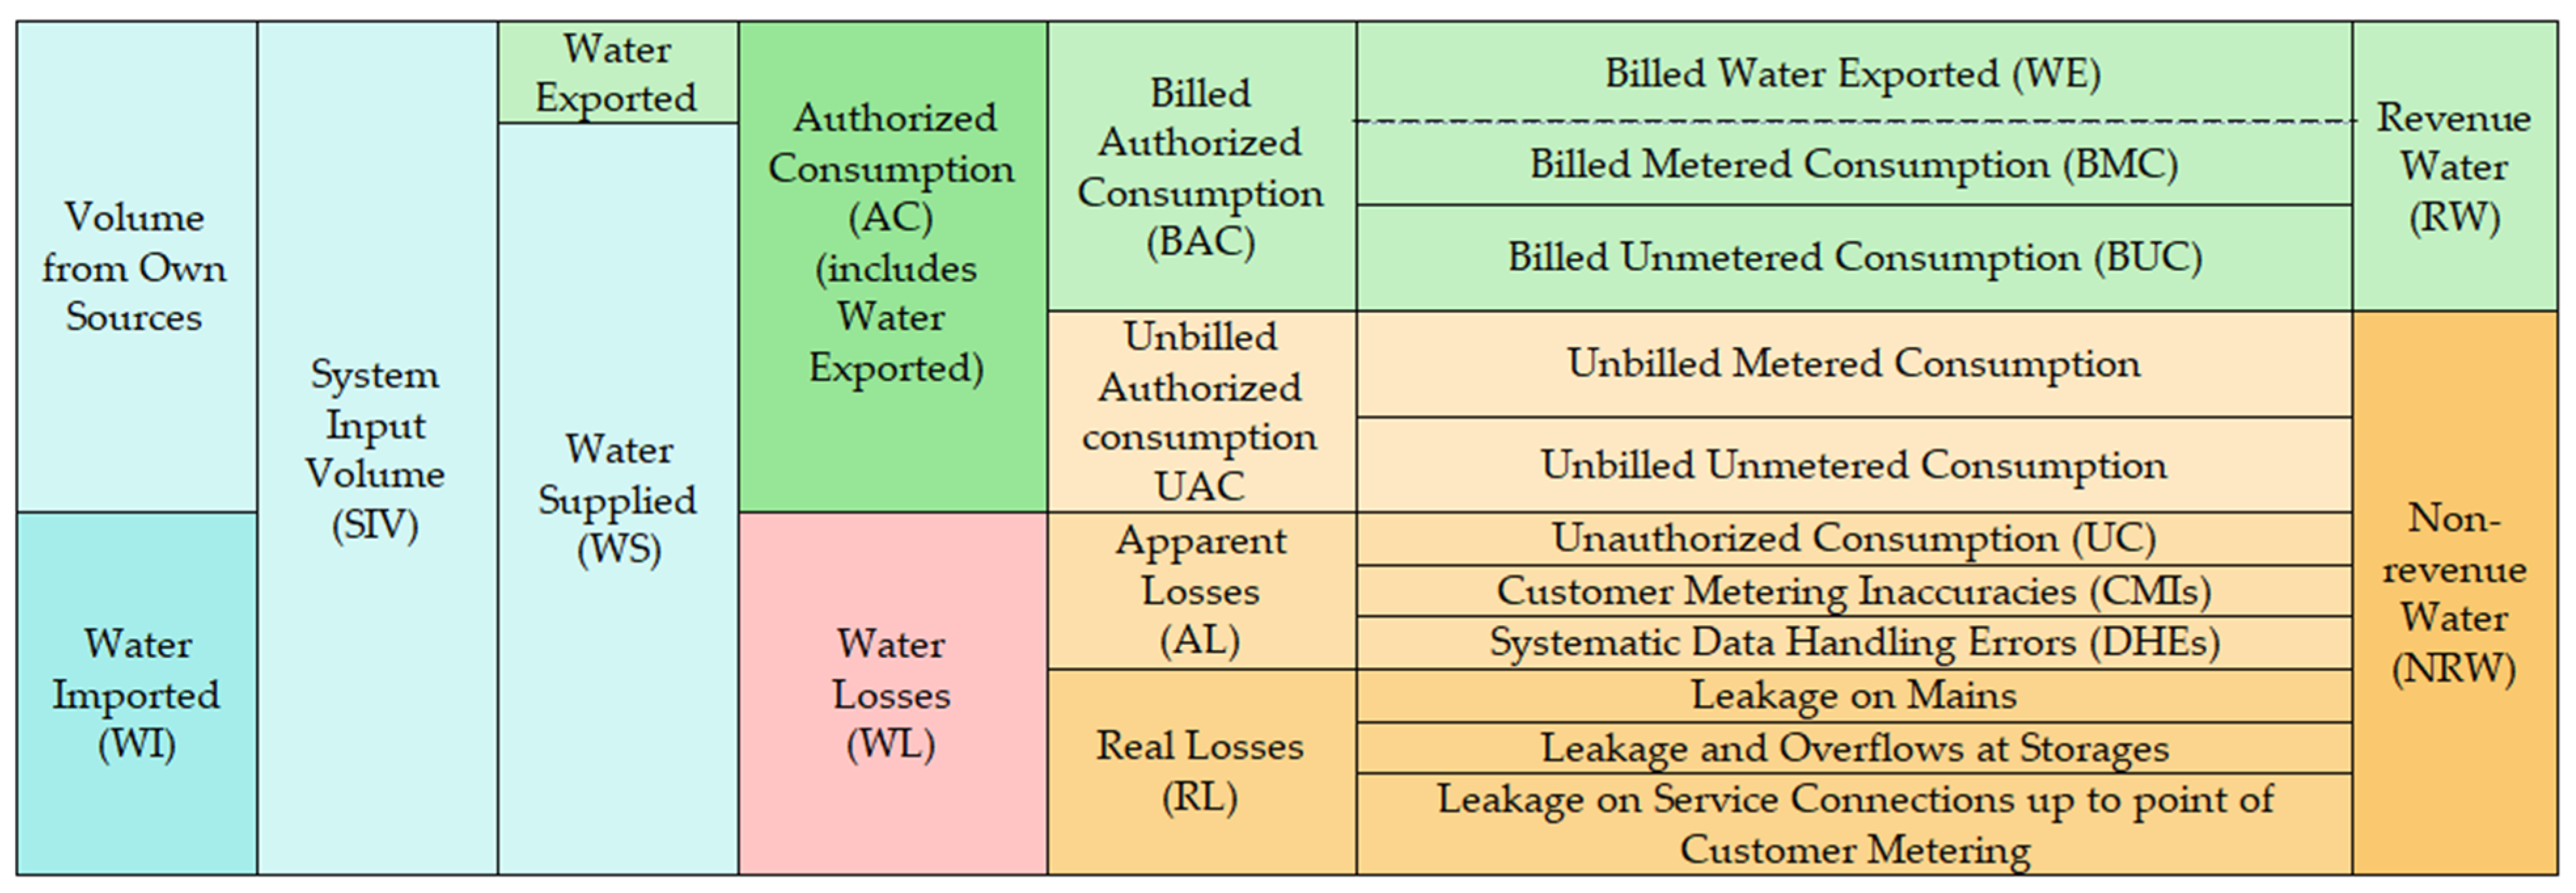
Monitoring and reporting water losses and implementing strategies to counteract leakages are essential elements of caring for the environment, promoting the sustainable use of water resources, and maintaining the company’s income and image. Water losses in the water distribution network (WDN) are determined based on a water balance (WB) prepared for a specific period of time (e.g., monthly or annually) [19]. The WB was first proposed and published in 2000 by the International Water Association (IWA) and is widely used by consultants and water supply companies [20,21]. Since its first publication, it has undergone modifications. The most significant change from the original version of WB is the inclusion of water imported (WI) and water exported (WE). The updated WB diagram is shown in Figure 1. Components of water losses and NRW are marked in red and orange colors.
The supplemented WB considers that the total volume of water produced by the company, referred to as system input volume (SIV), may come from its own sources or can be imported from other WSSs [20,21,22]. SIV is divided into WS, which is supplied to the WDN, and WE, which is sold to other WSSs. The WB presented in Figure 1 shows that total water losses are divided into apparent losses (AL) and real losses (RL) [23,24,25]. AL are caused by measurement inaccuracies as well as water theft [26,27]. The real losses depend on the volume of leaks caused by bursts and failures (in the water supply network, connections, and water tanks). Following the principles of the SDGs, to improve resource efficiency and water supply services, water supply companies should strive to reduce water losses caused by leaks [28].
Strategies aimed at preventing and minimizing real water losses include [17,18,28,29]:
  • the active leakage control to locate unreported leaks;
  • the pressure management;
  • the pipeline and asset management;
  • the speed and quality of repairs.
Real losses cannot be completely eliminated and, in theory, should not be reduced below the unavoidable level, e.g., unavoidable annual real losses (UARL). Reducing annual leakages to the UARL is not always economically justified, as the cost of measures aimed at minimizing such significant losses may be higher than the potential profit associated with water savings. Therefore, it is considered that water losses should primarily be reduced to the so-called Economic Leakage Level (ELL), which is higher than UARL [30,31,32,33].
In order to estimate water losses, various water loss performance indicators (WLPIs) have been developed by the IWA [23,24] and the American Water Works Association (AWWA) [34] and are used by water utilities. These indicators are divided into several categories, including percentage indicators, basic and intermediate operational normalized indicators, and detailed indicators. The examples of detailed indicators are the infrastructure leakage index (ILI), also known as Op29 and UARL [19,35,36]. The ILI was designed by the IWA Task Force in 1999 and is recommended for comparing leakage rates between different WSSs with diverse infrastructure characteristics, such as the length of mains, the length and density of service connections, and average operating pressures [24,37,38]. The ILI is considered one of the most effective and commonly used WLPIs for assessing RL [19,23,24,39]. This dimensionless index is derived from both the structural and operational characteristics of the WDN [40] and is calculated as the quotient of current annual real losses (CARL) and UARL (detailed equations are provided in Section 2) [39,41,42]. The ILI enables a reliable and credible assessment of the WSS condition and, in addition, is the only indicator that allows for comparison of different systems [19,39]. The ILI evaluation facilitates the development of potential action plans and measures [40,43]. Many companies believe that ILI can also be used in relation to separate district metered areas (DMAs) or pressure management areas (PMAs), allowing corrective strategies to be implemented in those parts of the WDNs that most require intervention. Nevertheless, there was also an ongoing debate about the ILI, with critical opinions regarding its use [42,44,45]. According to Alegre et al. [42], criticism of the ILI stems from the fact that, as the only indicator developed by the IWA, it is based on an empirical expression. Another problem associated with the ILI is the significant impact of operating pressure and the length of service connections on its value [42]. Giustolisi et al. [44,45] have emphasized that the ILI primarily applies to systems with 5000 or more service connections. They have proposed the use of the asset management support indicator (AMSI) in relation to smaller WDSs and DMAs.
However, it should be emphasized that the IWA Water Loss Specialists Group (WLSG) is constantly working on adapting the methodology for calculating ILI and UARL in order to extend their applicability to smaller WDSs (or DMAs) with fewer than 5000 service connections. Specialists from IWA WLSG recommend multiplying UARL by the system correction factor (SCF) to calculate ILI for smaller systems, zones, or DMAs with a number of service connections less than 5000, and/or average pressures less than 45 m H2O or higher than 60 m H2O [46,47,48]. The design of DMAs is an essential element for active leakage control, which aims to detect and eliminate unreported leaks, as well as to implement pressure management strategies [49]. Therefore, the ability to estimate the ILI for separate DMAs is crucial for the proper implementation of strategies aimed at reducing real water losses.
Reducing water and energy losses in WDNs is part of SDG 6.4, which is scheduled for implementation in 2030 [33,50]. The Directive (EU) 2020/2184 of the European Parliament and of the Council on the quality of drinking water, also known as the Drinking Water Directive (DWD) [51], is a regulation that requires operators of larger water supply networks in the EU to report water losses caused by leaks. Broadly understood initiatives and activities aimed at reducing water losses in water supply systems, as well as related water loss reporting, are part of ESG strategies in the water supply and sewage sector [52].
The Directive (EU) 2020/2184 entered into force on 25 December 1998 as the Council Directive 98/83/EC [53]. The European Commission announced the review of DWD in March 2014 as a follow-up to the Right2Water European Citizens’ Initiative [54]. The revised DWD (Directive (EU) 2020/2184 recast) [51] was formally adopted by the European Parliament (EP) on 16 December 2020 and entered into force in January 2021. Until 12 January 2023, the Directive (EU) 2020/2184 was to be transposed into national legislation in EU Member States [51,54].
The implementation of Directive (EU) 2020/2184 will require, among other things, the development of effective methods for assessing water losses and reducing leakages. According to the Directive, by 12 January 2026, EU Member States shall declare the use of the ILI rating method or other appropriate method to assess water leakage levels within their territories [51]. However, in accordance with the provisions of the Directive, the obligation to report WL applies to utilities supplying at least 10,000 m3 of water per day to consumers or serving at least 50,000 people [55].
By 12 January 2028, the Directive (EU) 2020/2184 should be supplemented by a delegated act [54,56] specifying detailed reporting guidelines. In accordance with Article 21 of the Directive, the European Commission should determine the threshold value (based on the ILI or another appropriate method) above which Member States are required to present an action plan. The threshold value should be determined based on both Member States’ assessments and the average leakage rate in the EU [57].
The Commission Delegated Regulation (EU) 2023/2486 of 27 June 2023 [45,46] specifies requirements for the ILI value for three distinct cases of the WDN operation [51,56,57]:
  • For the existing WDN, the leakage level should be calculated using the ILI (the threshold value in this case should be equal to or lower than 2.0) or using another appropriate method (the threshold value should be determined in accordance with Article 4 of Directive (EU) 2020/2184);
  • For the construction and operation of a new WDN, or an extension of an existing WDN, the requirements are similar to those for the existing WDN, but in this case the threshold value of the ILI should be equal to or lower than 1.5;
  • For the renewal of existing WDN, the activities undertaken shall reduce by at least 20 percent the gap between the current averaged three-year ILI value and a value of 1.5 (or the gap between the current leakage level averaged over three years, calculated using another appropriate method, and the threshold value established in accordance with Article 4 of Directive (EU) 2020/2184).
All of the above-described leakage rate calculations should be applied to both the entire WDN and the specified part of the system, where the works are carried out, e.g., at the water supply zone level, and at both DMAs and PMAs [51,56,57].
Previous studies show that not all water supply companies are ready to implement the requirements of Directive (EU) 2020/2184. Utilities are not always able to determine all the data necessary to calculate the ILI. For example, some companies struggle to determine the correct value of average operating pressure [37,58]. Therefore, the provisions of the Directive anticipate this situation and stipulate that the ILI or “another appropriate method” can be used for calculating water losses. However, neither the Directive [51] nor the Delegated Regulation [56] specifies which methods can be used when the ILI cannot be applied. It should be emphasized that the ILI is currently considered the most reliable indicator. By relating CARL to UARL, the ILI provides quick and reliable information on the WDS condition in terms of the volume of leaks that can be avoided by implementing corrective measures [19,59]. When it is not possible to calculate the ILI due to the lack of one or more parameters (e.g., the operating pressure, the length of mains, length and number of service connections), another optimal WLPI should be selected that allows the condition of the WDN to be estimated with a reliability similar to that provided by the ILI. Many indicators have been developed to estimate water losses. However, their accuracy and reliability vary significantly depending on the characteristics of the WDN, the volume of water produced and transported, and the purpose of the calculations [23,24,37,38]. Few studies in scientific publications have analyzed the correlation among different water loss indicators, including ILI. In addition, these studies usually focus on a limited number of indicators or on indicators other than those recommended by the IWA [44,60]. Giustolisi et al. (2024) [44] described a linear relationship between actual water losses and normalized WLPIs (defined as leakage density, expressed as the volume of leakage per unit length of the network per day). In their research, they also demonstrated a nonlinear relationship between leakage density and the percentage WLPI. In addition, they found that the water consumption density (consumption per unit length of network per day) significantly affects this relationship. Giustolisi et al. (2024) [44,45] proposed the use of the asset management support indicator (AMSI) that they developed. For several WSSs (and DMA zones), they compared the calculated AMSI and ILI values. Based on the results obtained, they concluded that the ILI values are several times higher than the AMSI values. In addition, they found that AMSI depends on operating pressure. Based on the calculation models presented in the publication, the AMSI formulas may be more complex for network operators than the ILI formulas [44].
In another publication, Oberascher et al. (2020) [60] analyzed the relationship between ILI and water demand, percentage indicator, and normalized WLPIs. They reported a very high Pearson’s correlation coefficient (r = 0.952) between the ILI and the percentage indicator. However, they emphasized that, according to Austrian law, percentage WLPIs (defined as volume-related indicators) are calculated as the percentage volume of water loss in relation to water demand, rather than as the volume of water loss in relation to SIV. Therefore, the percentage indicators calculated in [60] may differ from those determined using the methods proposed by the IWA. Oberascher et al. [60] also analyzed the correlation between the ILI and normalized WLPIs estimated as: (a) leakage volume in m3 per km of mains per hour, and (b) leakage volume in dm3 per service connection per day. Their results show a very strong correlation between ILI and the normalized WLPIs expressed per length of mains. However, they emphasized that such a strong correlation may result from relatively low levels of water losses in Austria, due to high standards and significant reductions in leaks, often even below the expected UARL value. Therefore, the results obtained by Oberascher et al. may be limited and applicable mainly to WDSs in Austria or to very well-managed WSSs with very low water losses [60].
Given that the results available in the literature may be limited and that there is still a gap in the current knowledge on this issue, it can be concluded that there is a need to continue and expand the analysis and research on the correlation between ILI and other water loss indicators recommended by the IWA.
In view of the above, the following research questions were formulated: (1) Can all water loss performance indicators be equally valuable for estimating the WDS condition for reporting purposes as a part of the implementation of the Directive (EU) 2020/2184? (2) Based on correlation analysis, is it possible to identify types of indicators that could be used when it is problematic to determine the ILI? (3) Is there a need to clarify which WLPIs should be used for reporting water losses in order to enable the comparison of the condition of different WDNs in the EU?
Taking into account these questions, the study’s primary objective was to analyze the correlation between the ILI and other PIs to identify groups of indices that could be recommended for reporting purposes related to the implementation of the Directive (EU) 2020/2184. The research results can be used by engineers and policy makers in preparing and implementing more detailed water loss reporting requirements.

2. Materials and Methods

The research described in the paper was conducted based on annual WBs covering the years 2017 and 2021, carried out for 12 Polish Water Supply and Sewerage Companies (analyzed in previously published papers [58,61]). Information regarding the location and names of plants is not publicly available. All analyzed companies are located in the EU, in southern Poland. Data no. 1, 2, and 3 refer to annual WBs for three water supply companies for 2017. Data numbered from 4 to 12 refer to the WBs for 2021 for nine water supply companies. Data initially obtained from companies (described in [58,61]) included WS, which in this case was equivalent to SIV due to the lack of exported or imported water. The following data included billed authorized consumption (BAC), unbilled authorized consumption (UAC), the average operating pressure (P), the length of mains (Lm), as well as the number and the total length of service connections (Nc and Lt, respectively). The characteristics of the WDNs and the data used to prepare the WBs are presented in Section 3.
WLPIs calculated based on data have been classified into the following groups (subscripts have been introduced to water loss labels in order to distinguish between different types of losses, e.g., %—percentage index, b—basic index, i—intermediate index, 1—losses per km of the network, 2—losses per service connection):
  • Annual water loss volumes, expressed in m3/year (marked as NRW, WL, RL, and AL);
  • Annual WLPIs expressed as percentages of SIV (marked as: NRW%, WL%, RL%, and AL%, respectively);
  • Annual basic operational normalized WLPIs expressed in m3 per km of mains per day (marked as NRWb1, WLb1, RLb1, and ALb1);
  • Annual basic operational normalized WLPIs expressed in dm3 per service connection per day (marked as NRWb2, WLb2, RLb2, and ALb2);
  • Annual intermediate operational normalized WLPIs expressed in m3 per km of mains per day per 1 m H2O of pressure (marked as NRWi1, WLi1, RLi1, and ALi1);
  • Annual intermediate operational normalized WLPIs expressed in dm3 per service connection per day per 1 m H2O of pressure (marked as NRWi2, WLi2, RLi2, and ALi2).
The volume of NRW is calculated from Equation (1) as the difference between the water supplied to the network WS (in this case, the volume of SIV) and BAC [23,24,35].
N R W = S I V B A C
where NRW is the volume of non-revenue water (m3/year), SIV is a system input volume (m3/year), and BAC is the billed authorized consumption (m3/year).
NRW as a percentage of SIV is calculated from Equation (2):
N R W % = N R W S I V · 100 %
where NRW% is the volume of non-revenue water expressed as a percentage of SIV (%), SIV, BAC, and NRW—as above.
The volume of total water loss (WL) is calculated using Equation (3) [23,35,62]:
W L = S I V B A C U A C
where WL is the total water loss (m3/year), UAC is unbilled authorized consumption (m3/year), and BAC is as above.
The total water loss as a percentage of SIV is calculated using Equation (4):
W L % = W L S I V · 100 %
where WL% is the total water loss as a percentage of SIV (%), SIV and WL—as above.
CARL are the physical water losses (RL) that occurred during the balance year. In order to calculate RL and CARL, AL must first be estimated for the same period as RL. The AL depends on both customer meter inaccuracies (CMIs), data handling errors (DHEs), and unauthorized consumption (UC). The approximated value of AL can be calculated as the sum of 0.2% of billed metered consumption (BMC) (which corresponds to UC) and 2% of BMC (which corresponds to the sum of CMIs and DHEs) [38]. Considering that 100% of the water sold was metered, it can be assumed that BMC = BAC. Therefore, the following Equations (5) and (6) are used to calculate the above-mentioned RL and AL [36,62]:
C A R L = R L = W L A L
A L = 0.02 · B M C + 0.002 · B M C = 0.022 · B M C
where RL is real water loss in m3/year, CARL is current annual real loss in m3/year (in this case CARL = RL), AL is apparent water loss in m3/year, BMC is billed metered consumption in m3/year (in this case BMC = BAC).
The annual percentage indicators RL% and AL% were calculated in a similar manner as shown in Equation (4), replacing WL with CARL or AL (in m3/year), respectively.
The ILI was calculated based on Equation (7) [19,23,24]:
I L I = C A R L U A R L
where ILI is infrastructure leakage index (−), UARL are unavoidable annual real losses in m3/year, CARL—as above in m3/year.
The UARL is calculated from Equations (8) or (9). Equation (8) is used if the service connection length is measured as a distance from the property line to the meter. Equation (9) is used if the service connection length is calculated as a distance from the main to the meter [39]. In this case, Equation (9) was used for the calculation of UARL:
U A R L = 6.57 · L m + 0.292 · N c + 9.132 · L p · P
U A R L = 6.57 · L m + 0.256 · N c + 9.13 · L t · P
where UARL—as above in m3/year, Lm is the length of mains in km, Lp is the total length of service connections (from property lines to meters) in km, Lt is the total length of service connections (from mains to meters) in km, Nc is the number of service connections, P is the average operating pressure in m.
The basic operational normalized PIs for real losses expressed per km of mains per day (RLb1) were calculated from Equation (10) [23]:
R L b 1 = C A R L 365 · L m
where RLb1 is the basic operational water loss indicator in m3/(km·d), CARL—as above (m3/year), Lm is the total length of mains (km).
The other basic operational PIs (NRWb1, WLb1, and ALb1) were calculated in a similar manner as in Equation (10) by replacing CARL with NRW, WL, and AL (in m3/year), respectively.
Basic operational normalized PIs for real losses (RLb2) expressed per service connection per day were calculated from Equation (11) [23,63]:
R L b 2 = C A R L 0.365 · N c
where RLb2 is the real water loss in dm3/(connection·d), Nc is the number of service connections (pcs), CARL—as above in m3/year.
Other basic operational indicators, NRWb2, WLb2, and ALb2, were calculated in a similar manner as in Equation (11) by replacing CARL with NRW, WL, or AL, respectively.
The intermediate operational normalized PIs for real losses (RLi1) expressed per km of mains per day per 1 m H2O of pressure were calculated from Equation (12) [23,63]:
R L i 1 = C A R L 365 · L m · P
where RLi1 is the real water loss in m3/(km·d·1mH2O), P is the average operating pressure in m H2O, CARL—as above (m3/year), Lm—as above (km).
The other intermediate operational PIs (NRWi1, WLi1, and ALi1) were calculated in a similar manner as in Equation (12) by replacing CARL with NRW, WL, and AL (in m3/year), respectively.
The intermediate operational normalized PIs for real losses (RLi2), expressed per service connection per day per 1 m H2O of pressure, were calculated from Equation (13) [23,63]:
R L i 2 = C A R L 0.365 · N c · P
where RLi2 is the real water loss in dm3/(conn.·d·1mH2O), CARL—as above in m3/year, P—as above in m H2O, and Nc—as above.
Other intermediate operational PIs (NRWi2, WLi2, and ALi2) were calculated in a similar manner to Equation (13) by replacing CARL with NRW, W, or AL, respectively.
As part of the research described in this article, an analysis of the correlation between the ILI and all estimated PIs was carried out. Based on the results obtained, linear, logarithmic, power, and exponential regression relationships between values of ILI and other PIs were analyzed. Correlation between each independent and dependent variable was estimated using Pearson’s correlation coefficient r (Equation (14)):
r = i = 1 n x i x ¯ y i y ¯ i = 1 n x i x ¯ 2 i = 1 n y i y ¯ 2 2
where r is Pearson’s correlation coefficient, n is the number of data points, xi is the x (independent) variable, x ¯ i is the mean of the x variables, yi is the y (dependent) variable, and the y ¯ i is the mean of the y variables.
Linear regression models were evaluated based on determination coefficients (R2) and the root mean squared errors RMSE (Equation (15)):
R M S E = 1 n i = 1 n y i y i 2
where n is the number of data points, yi is the i-th measurement, and y i is the i-th (corresponding) prediction.
Appropriate WLPIs were selected based on r, R2, and RMSE values, which can be used to reliably determine the water losses in WDS when ILI cannot be used.

3. Results

This section contains the results of WBs for analyzed WDNs and calculations of diverse WLPIs, including the ILI. The second part of the section presents an analysis of the correlation between the ILI and other calculated WLPIs.

3.1. The Annual Water Balances and the Calculation of Water Loss Performance Indicators

The data for the preparation of annual WBs, including the geometry and basic parameters of analyzed WDNs, are presented in Table 1. Values of average operating pressures in the case of WBs no. 1–7, 9, and 10 are provided by water supply companies. Average operating pressures in the case of WBs no. 8, 11, and 12 are calculated based on the range of maximal and minimal pressures provided by companies. The random uncertainties of average pressures were assumed as ±5% at 95% confidence limits. The uncertainties of Lm, Lp, and Nc were assumed as 1% and the calculated uncertainties of service connection densities (D) amounted to 2%.
Annual WBs for analyzed WDNs prepared based on [58,61] are presented in Table 2. The table contains data on: SIV, BAC, and UAC. Other table components: NRW and WL, expressed as both volume per year and percentage of SIV, were calculated based on Equations (1)–(4). For each component of WBs, the random uncertainties were calculated at 95% confidence limits. The maximum values of uncertainties for measured SIV (where water was supplied only from own sources) were assumed as less than ±2% due to the high resolution of main flow meters, which are used in Polish water utilities. These values were adopted based on the information provided in [35,64]. Random uncertainties of BAC and UAC volumes were set at 2% and 20%, respectively. Other uncertainties included in Table 2 were determined in accordance with the methodology given in [35,36,38,64,65] based on uncertainties for SIV, BAC, and UAC.
Table 3 presents calculated annual volumes and percentage values of RL and AL, as well as detailed WLPIs: UARL and ILI. The annual volume of RL (also referred to as CARL) was calculated based on Equation (5). Real losses were also calculated as a percentage of SIV (RL%). Apparent losses were estimated based on Equation (6) as volume of water lost per year (AL) and as a percentage of SIV (AL%). Table 3 also presents calculations of the components of AL: CMIs, DHEs, and UC. Assumed values of random uncertainties for RL and AL were equal to 20% (at 95% confidence limits). The random uncertainties for the ILI were estimated at 95% confidence limits in accordance with the methodology presented in [35,65].
Table 4 presents values of basic operational normalized WLPIs (also referred to as basic unit indicators), derived from Equations (10) and (11). The units of these indicators can be divided into two groups, marked with subscripts 1 and 2, respectively: (1) the volume of water lost per km of mains per day, and (2) the volume of water lost per service connection per day. Within the scope of the examination, calculations were performed for four types of PIs: NRW, WL, RL, and AL. In the case of each calculated indicator, the random inaccuracy was estimated at 95% confidence limits (in accordance with the methodology described in [35,65]).
Table 5 presents intermediate operational normalized WLPIs. Values of these indicators were calculated based on the basic operational unit indicators (presented in Table 4) by dividing their values by the operating pressure expressed in m H2O. Taking into account the units, these intermediate PIs can be divided into two groups, marked with subscripts 1 and 2, respectively: (1) the volume of water lost per km of mains per day per 1 m H2O, and (2) the volume of water lost per service connection per day per 1 m H2O. As part of the analysis, calculations were performed for four types of indicators: NRW, WL, RL, and AL. Calculations were performed based on Equations (12) and (13). Random inaccuracies were calculated at 95% confidence limits (in accordance with the methodology described in [35]).

3.2. Analysis of the Linear Correlation Between the ILI and Other Water Loss Indicators

Based on the calculated WLPIs shown in Table 2, Table 3, Table 4 and Table 5, a correlation analysis was performed between various PIs and the ILI. Various types of relationships were examined as part of the analysis. Results presented in Section 3.2.1, Section 3.2.2, Section 3.2.3, Section 3.2.4, Section 3.2.5 and Section 3.2.6 show linear, logarithmic, power, and exponential relationships between the ILI and:
  • annual volumes of NRW, WL, RL, and AL, expressed in 103 m3/year;
  • annual percentage WLPIs: NRW%, WL%, RL%, and AL%;
  • basic operational normalized WLPIs: NRWb1, WLb1, RLb1, ALb1, expressed in m3 of water lost per kilometer of mains per day, and NRWb2, WLb2, RLb2, ALb2, expressed in dm3 of water lost per service connection per day;
  • intermediate operational normalized WLPIs: NRWi1, WLi1, RLi1, and ALi1, expressed in m3 of water lost per kilometer of mains per day per 1 m H2O of pressure, as well as: NRWi2, WLi2, RLi2, and ALi2, expressed in dm3 of water lost per service connection per day per 1 m H2O of pressure.
Tables S1–S4 in the Supplementary Materials show the values of regression coefficients and determination coefficients for linear, exponential, logarithmic and power relationships between the ILI and other WLPIs.

3.2.1. The Correlation Between the ILI and Annual Volumes of Water Losses

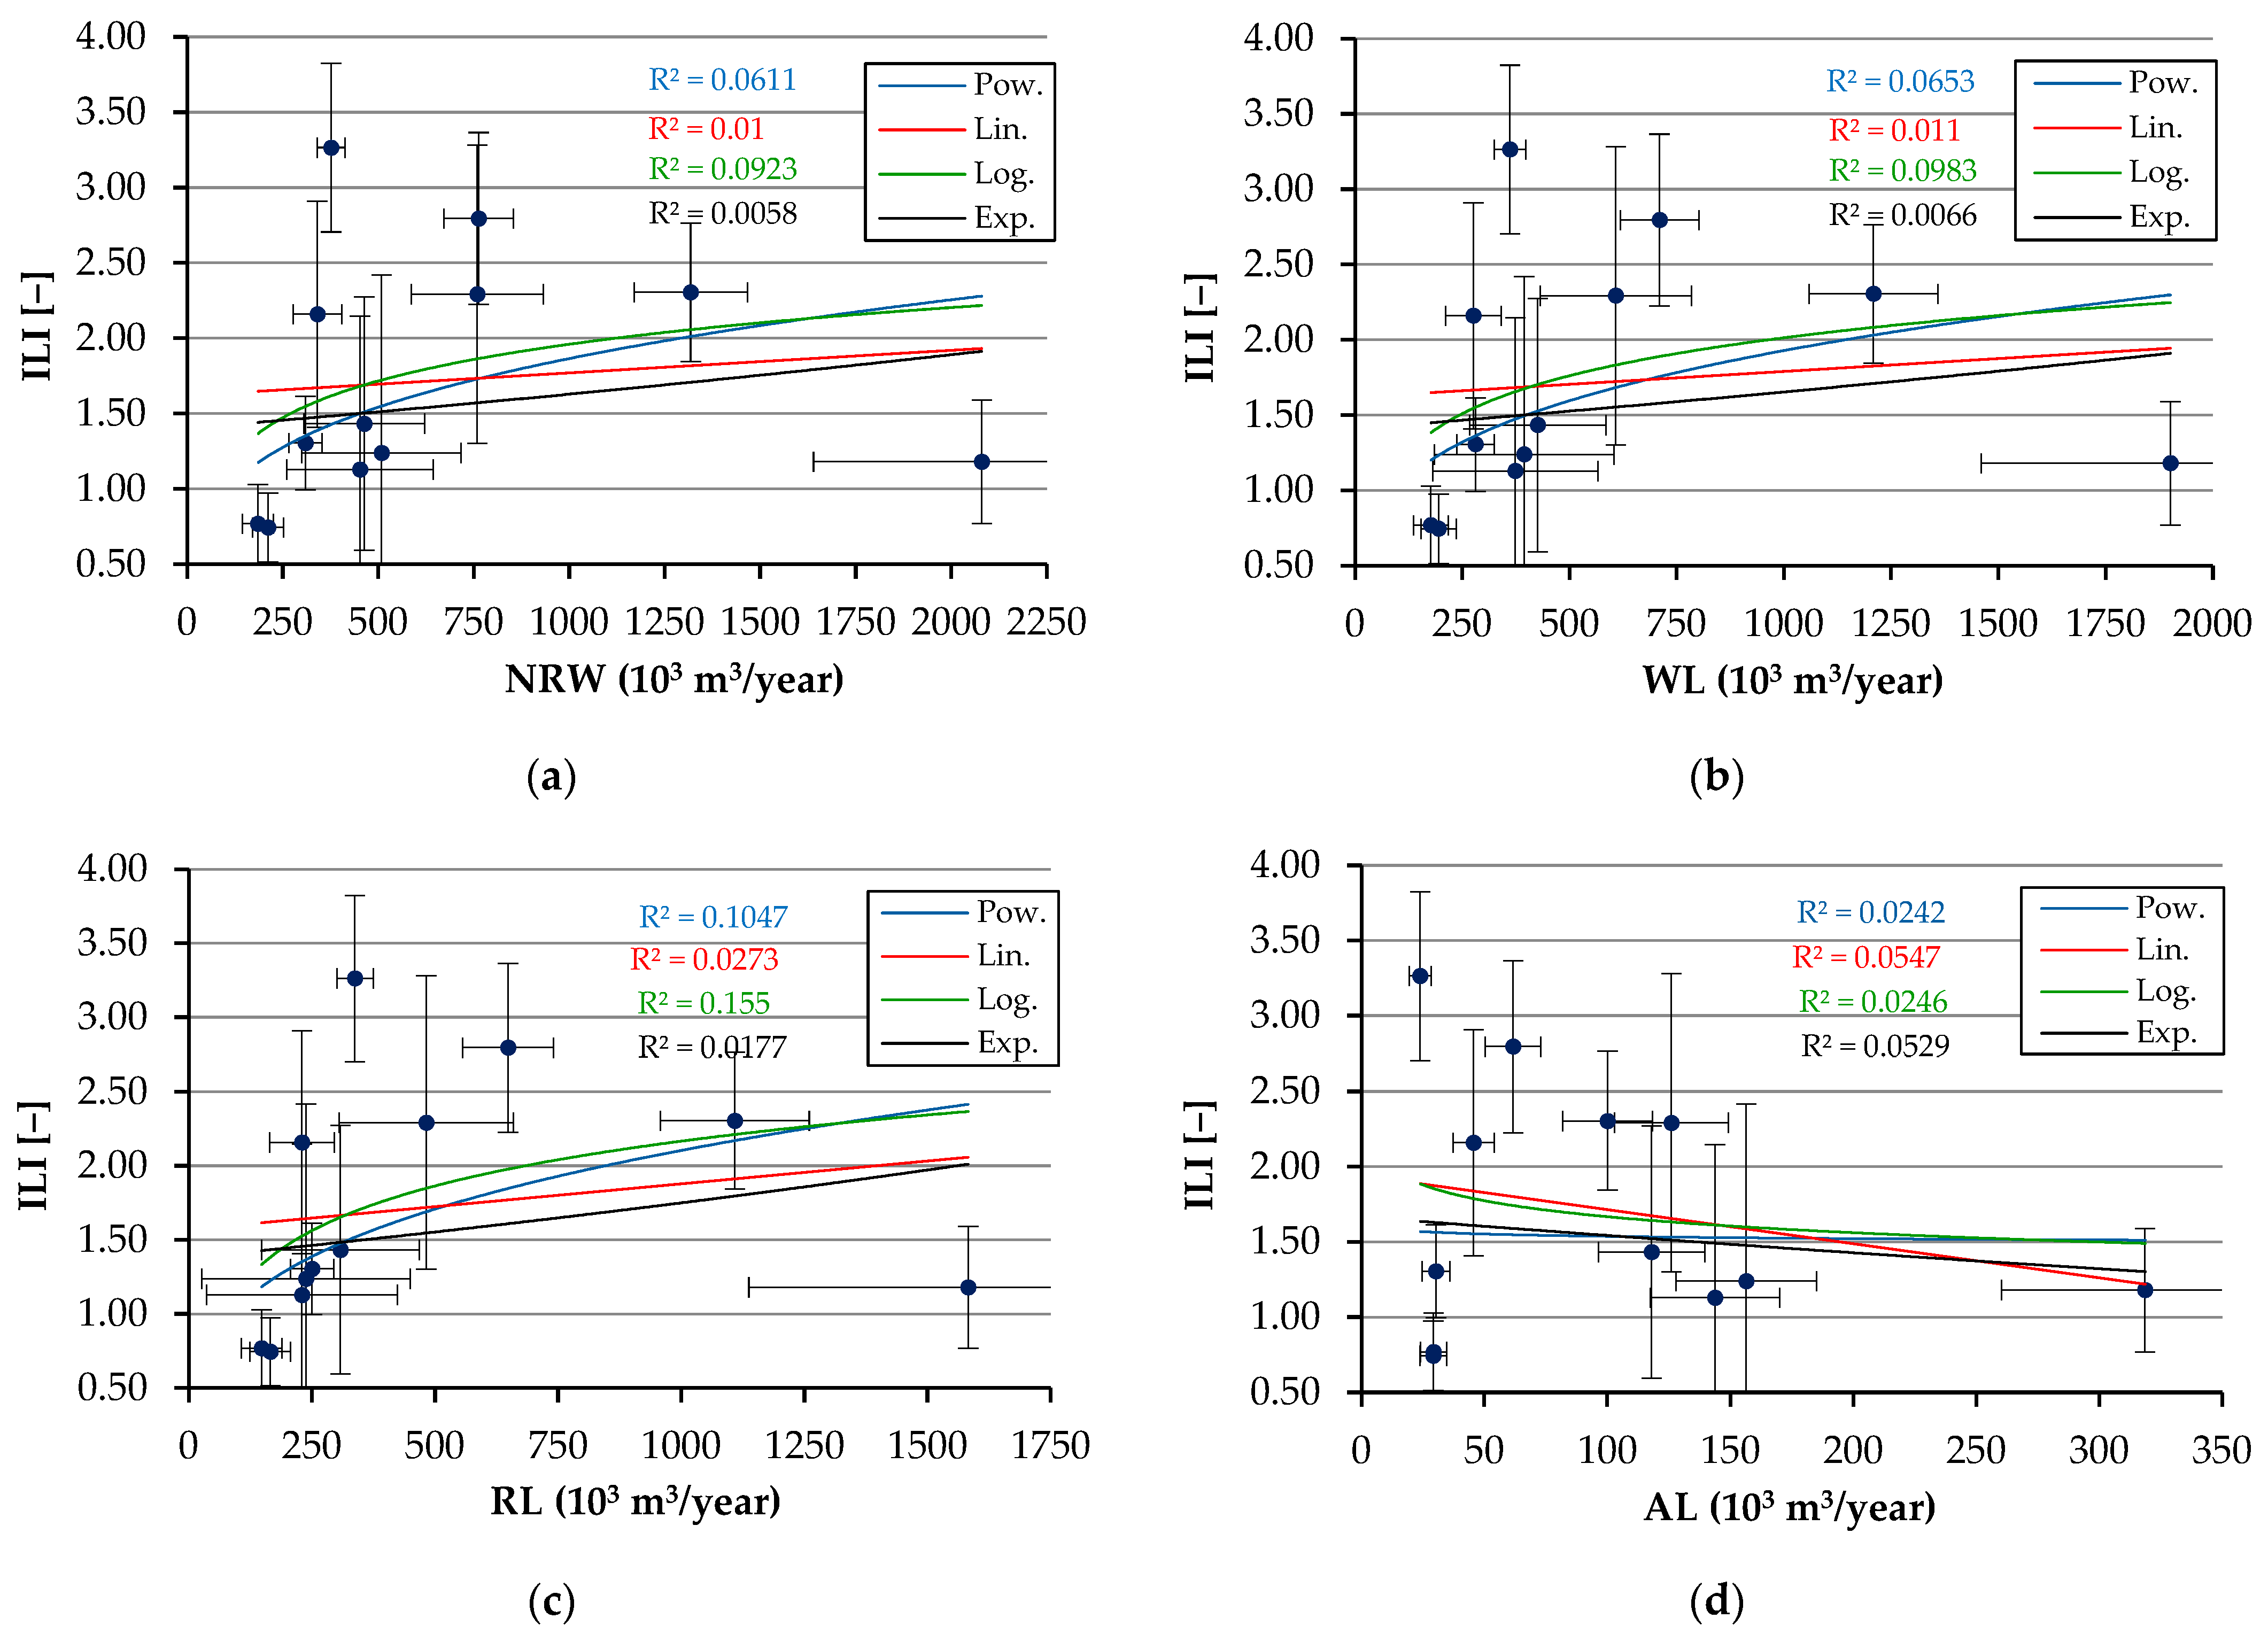
Figure 2 shows relationships between the ILI and calculated volumes of NRW, WL, RL, and AL (estimated based on data presented in Table 2 and Table 3).
Results presented in Figure 2 indicate that the correlation between the ILI and annual volumes of water losses is very weak (in this case, there is essentially no correlation). R2 for linear relationships ranged from 0.01 (for NRW) to 0.0547 (for AL). In the case of relationships between the ILI and NRW, WL, or RL, a weak positive correlation was observed, while in the case of AL, the observed weak correlation was negative. Obtained results confirm that data showing the volume of water losses or the volume of NRW, without additional information on the WDS’s size and the volume of WS, cannot be used as reliable PIs either to assess the condition of the WDN or for reporting purposes.

3.2.2. The Correlation Between the ILI and Percentage WLPIs

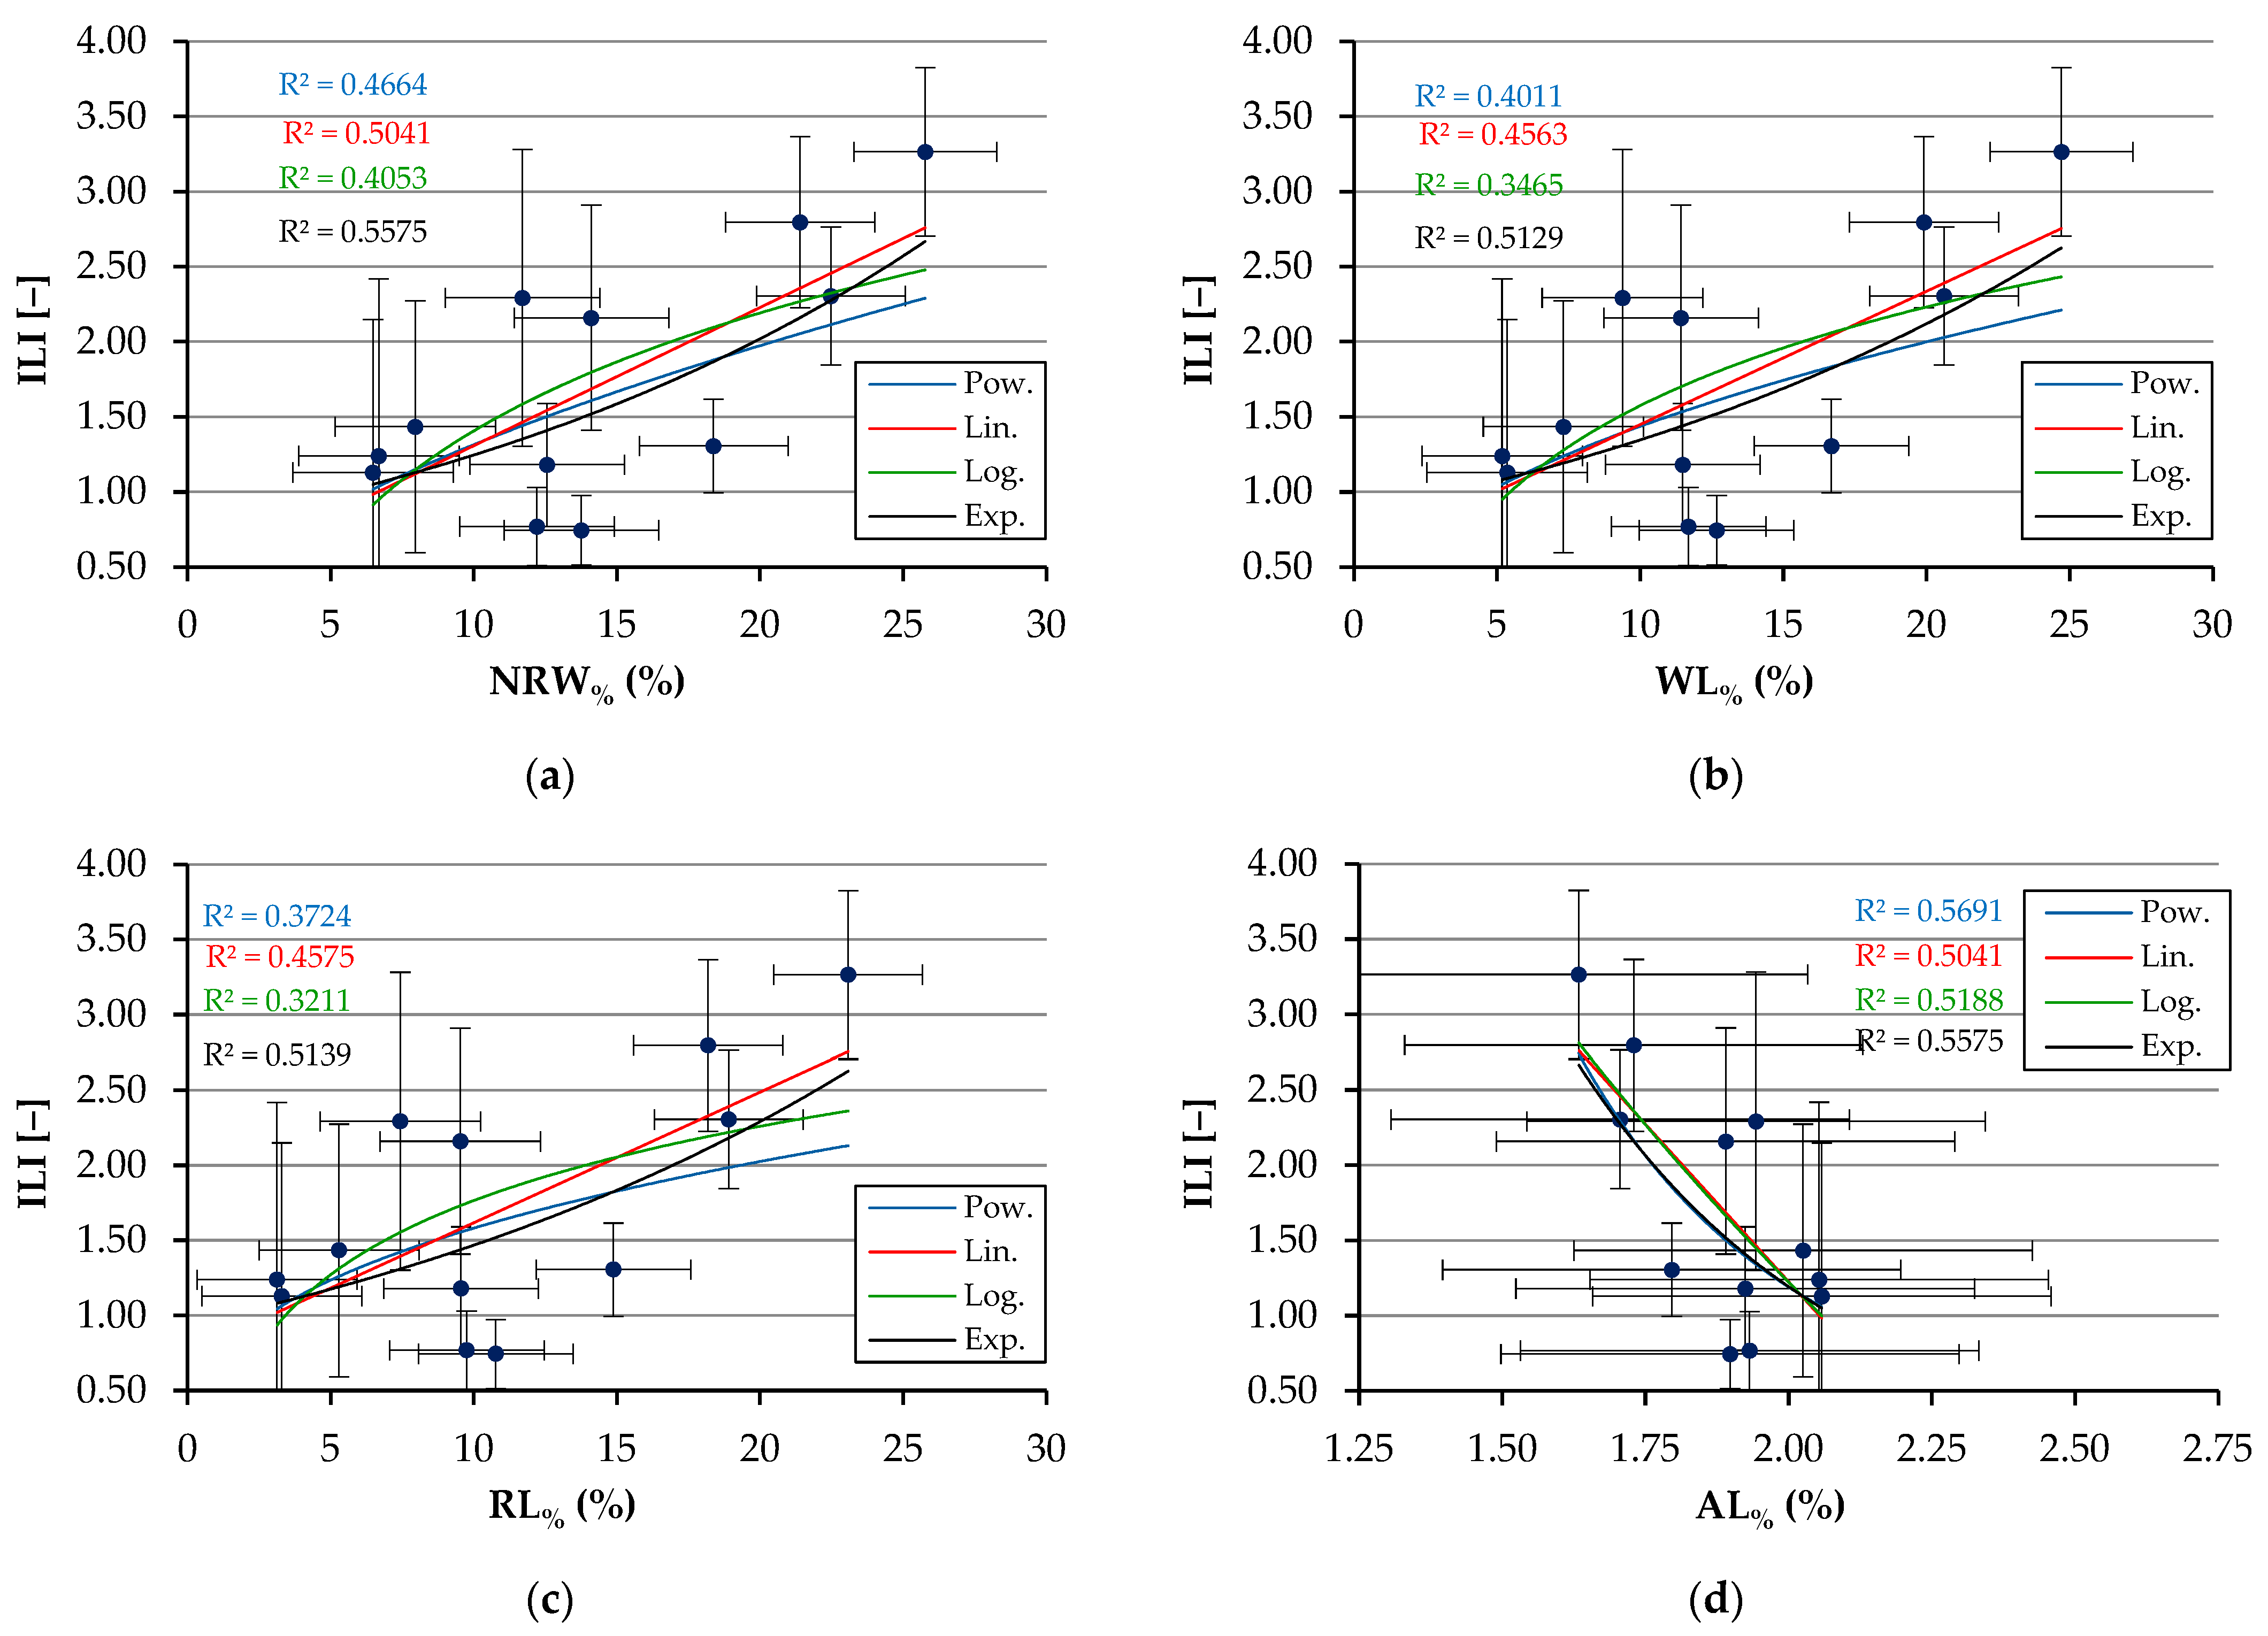
Figure 3 presents different kinds of relationships between the ILI and annual percentage WLPIs: NRW%, WL%, RL%, and AL% (also known as an indicator Op26). These plots were prepared based on the results presented in Table 2 and Table 3.
Results presented in Figure 3 indicate the existence of a moderate to strong correlation between the ILI and percentage PIs for water losses. The highest values of R2, ranging from 0.4563 (for WL%) to 0.5041 for both the NRW% (also known as an indicator Fi36) and AL%, were obtained for linear relationships. A positive correlation was obtained in the case of the dependence of ILI on the three analyzed indices: NRW%, WL%, and RL% (plots a, b, and c), while a negative correlation was obtained in the case of the relationship between ILI and AL%. Medium to strong negative correlation was also obtained for the logarithmic relationship between the ILI and AL% (R2 = 0.5188).

3.2.3. The Correlation Between the ILI and Basic Normalized WLPIs per Length of Mains

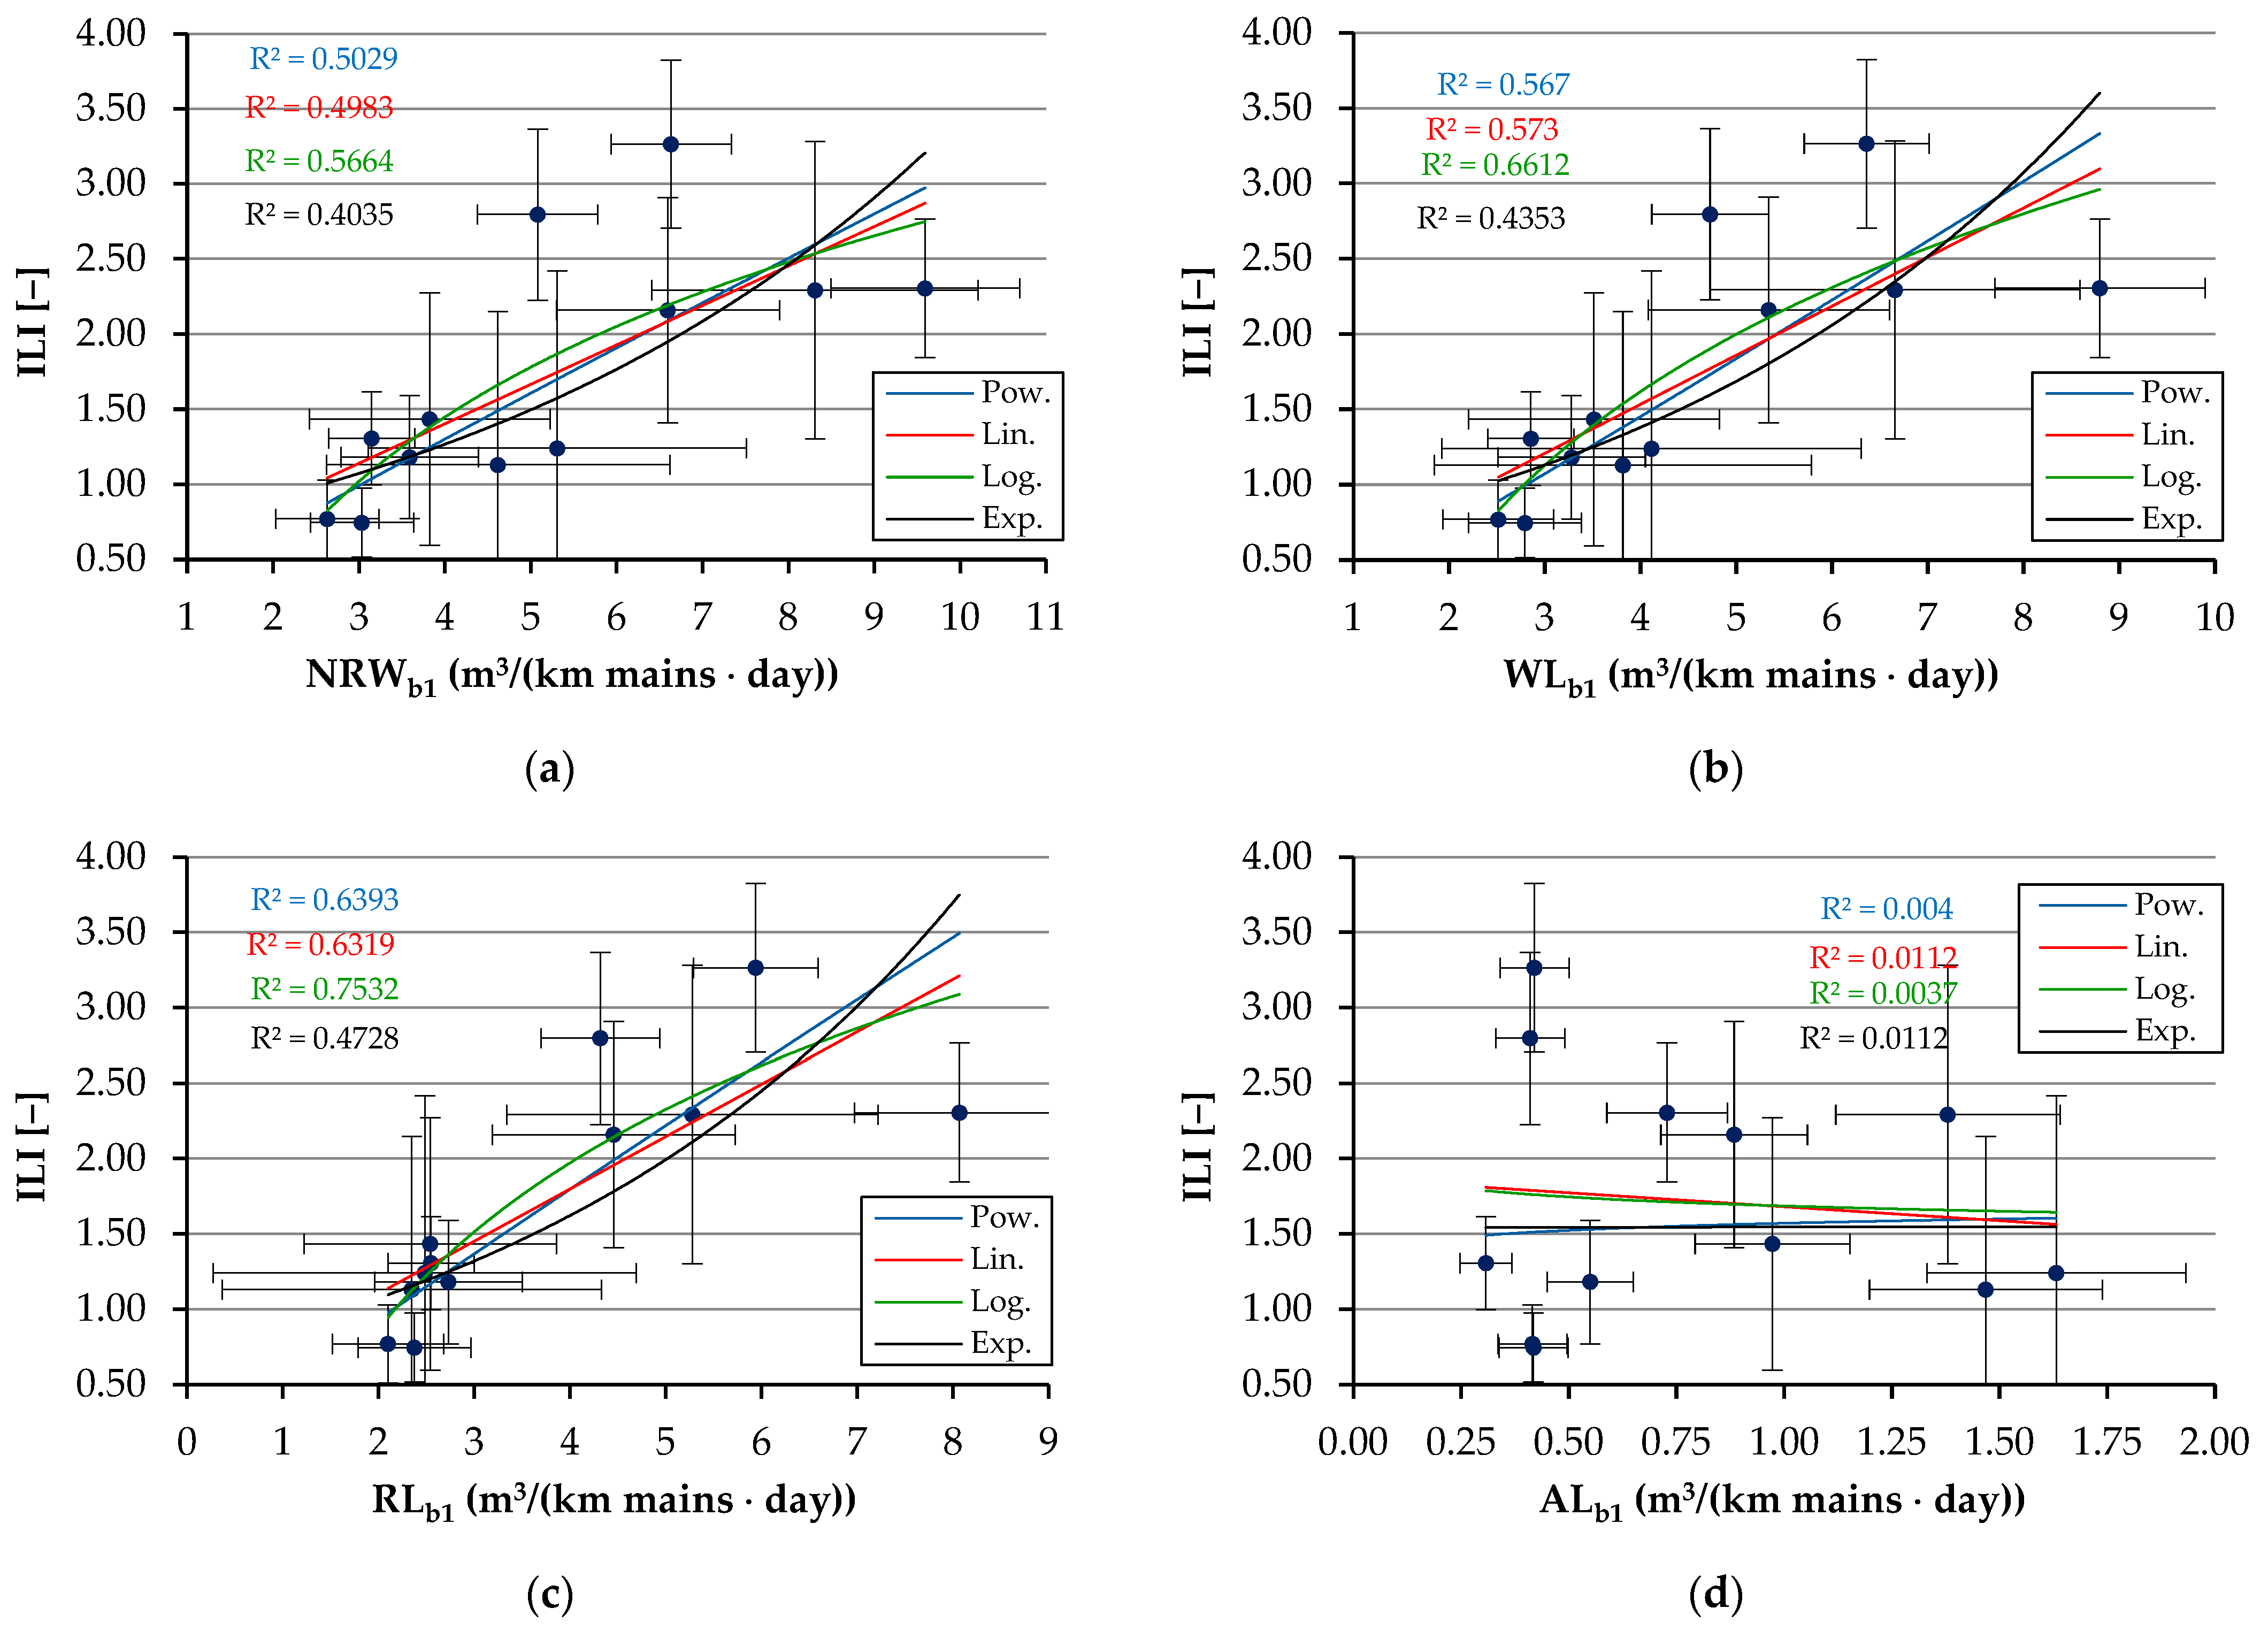
Figure 4 shows the linear relationships between the ILI and basic operational normalized WLPIs expressed as volume of water lost (in m3) per kilometer of mains per day. In order to properly distinguish between the analyzed coefficients presented in Figure 4, as well as in Figure 5, Figure 6 and Figure 7 in this section, different subscripts have been added to the indicator designations. The symbol “b” stands for basic index, while “i” stands for intermediate index. Additionally, symbols 1 and 2 indicate that water losses are related either to the length of mains or to the number of service connections, respectively. For the purposes of the analysis, typical and commonly used operational normalized basic real and total water loss indicators were calculated, marked as RLb1 (also known as Op28) and WLb1 (also known as Op24), respectively. Analysis also included non-revenue water (NRWb1) and apparent losses (ALb1), expressed in the same units. Calculated values of the above-mentioned indicators are included in Table 4.
The results presented in Figure 4 indicate a very strong positive correlation between the ILI and the basic operational indicator RLb1. The highest value of R2 was in this case obtained for both the power and logarithmic relationships (0.7561 and 0.7532, respectively). The strong positive correlation in the case of RLb1 was also obtained for linear and exponential relationships (R2 = 0.6319 and 0.6299, respectively). The strong positive correlations were also identified for both NRWb1 and WLb1. A very weak negative correlation (or no correlation) was observed for ALb1 (for the linear relationship, the R2 = 0.0112). The obtained results indicate that operational normalized WLPIs expressed as volume of water per km of mains per day (except for ALb1) are strongly correlated with the ILI than previously analyzed both volumes of water lost per year and percentages of SIV (presented in Figure 2 and Figure 3, respectively). The advantage of the discussed normalized indicators compared to those discussed earlier is that their values are determined taking into account the length of mains. Nevertheless, it should be noted that the commonly used basic operational real loss PI (in this analysis marked as RLb1), calculated per km of mains per day, is only recommended for water supply networks with a service connection density (D) less than 20 conn./km. Meanwhile, the current analysis covers WBs for WDNs whose D was mostly greater than 20 conn./km (only in one case D < 20 conn./km).

3.2.4. The Correlation Between the ILI and Basic Normalized WLPIs per Number of Service Connections

Figure 5 shows the linear dependence of the ILI on basic operational normalized WLPIs expressed as volume of water lost (in dm3) per service connection per day. For the purpose of the analysis, typical operational normalized basic WLPIs, referred to in this case as RLb2 (also known as Op27), ALb2, and WLb2 (also known as Op23), were calculated. The non-revenue water, which is rather the typical financial indicator, was also calculated and expressed in the same units as NRWb2. The calculations of these indicators are available in Table 4.
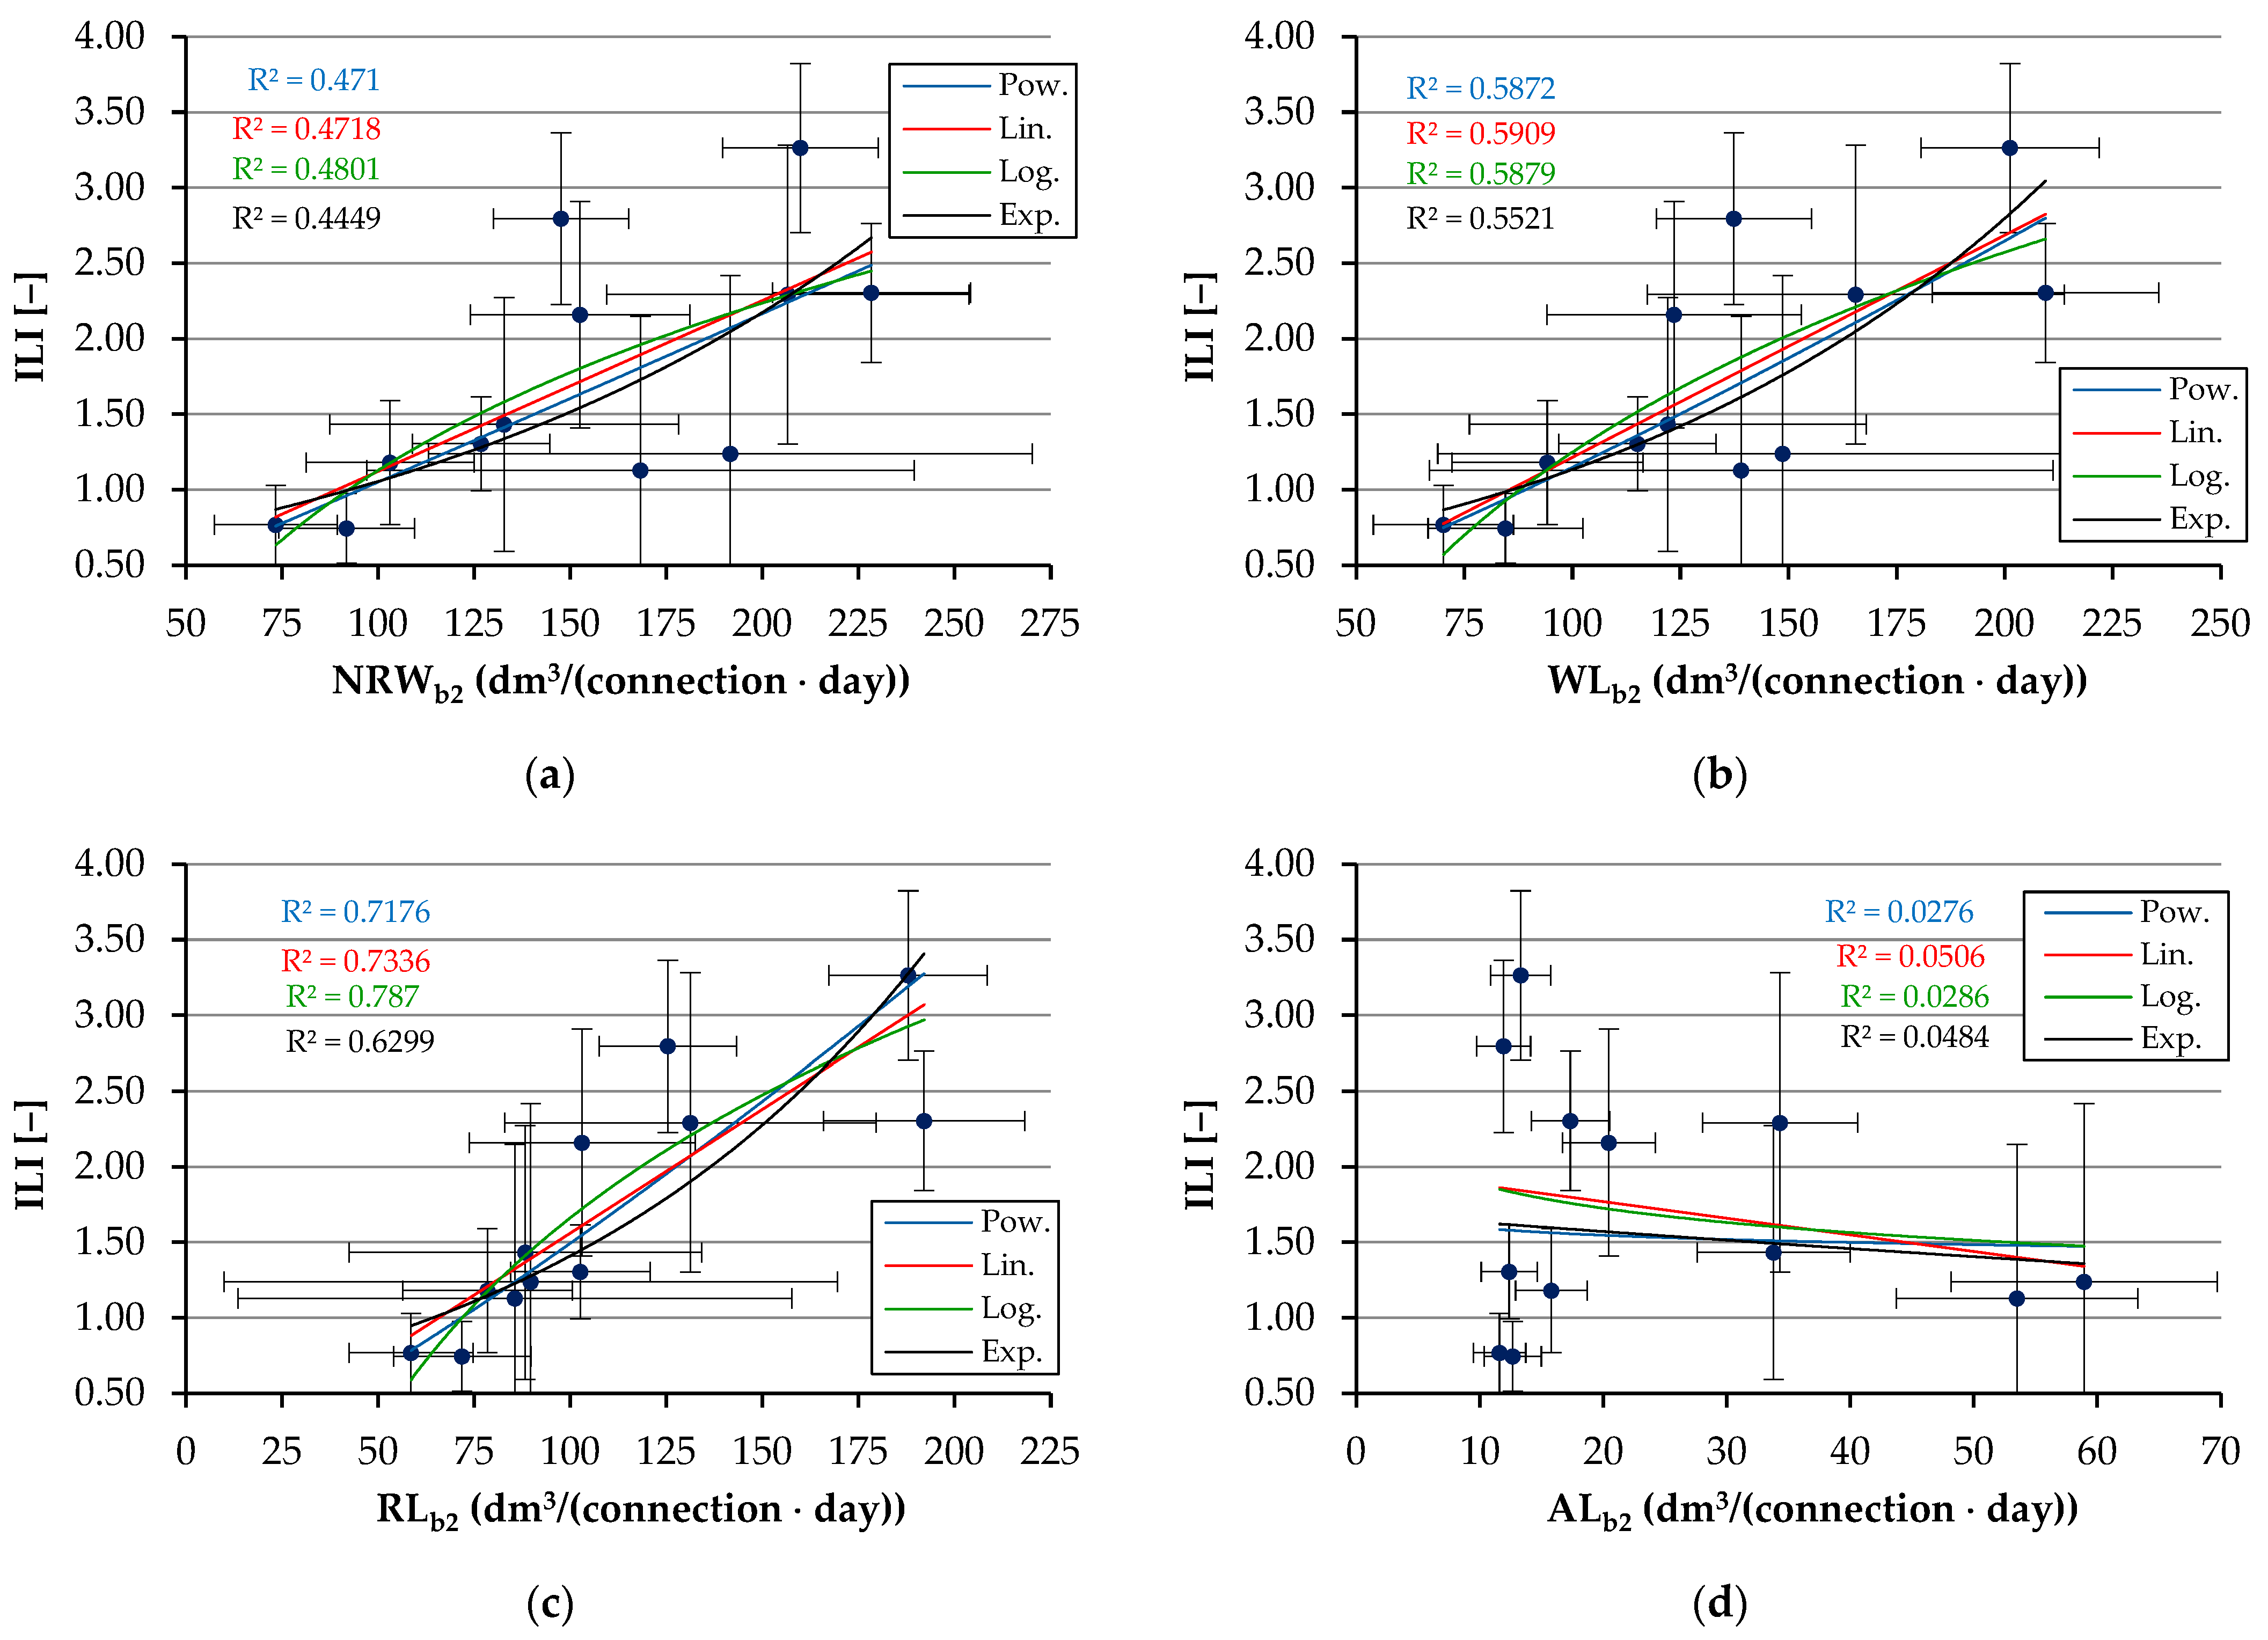
Figure 5. The linear (red line), logarithmic (green), exponential (black), and power (blue) relationships between ILI indexes and operational normalized basic WLPIs expressed in dm3 of water lost per service connection per day: (a) the non-revenue water (NRWb2); (b) the total water loss indicator (WLb2); (c) the real water loss indicator (RLb2); (d) the apparent water loss indicator (ALb2).
Water 18 00527 g005
Results presented in Figure 5 indicate that a very strong positive correlation was obtained for the relationship between the ILI and RLb2 (R2 for all types of relationships ranged from 0.7108 (the exponential function) to 0.8031 (the power function). The R2 for the linear relationship is 0.7336. The correlation obtained for RLb2 in the case of all types of dependencies is higher than that for RLb1, which may be due to the fact that connection densities in the analyzed WDNs were mostly higher than 20 conn./km. A strong positive correlation is also obtained for WLb2 (R2 = 0.5879–0.6619) and NRWb2 (R2 = 0.4718–0.5785). A very weak negative correlation was observed for ALb2 (R2 = 0.0165–0.0506).

3.2.5. The Correlation Between the ILI and Intermediate Normalized WLPIs per Length of Mains

Figure 6 shows the linear relationships between the ILI and intermediate operational normalized WLPIs expressed as volume of water lost (in m3) per km of mains per day per 1 m H2O of pressure. These PIs are marked in Figure 6 as: NRWi1, WLi1, RLi1, and Ali1. Plots presented in Figure 6 are prepared based on calculated values of PIs included in Table 5.
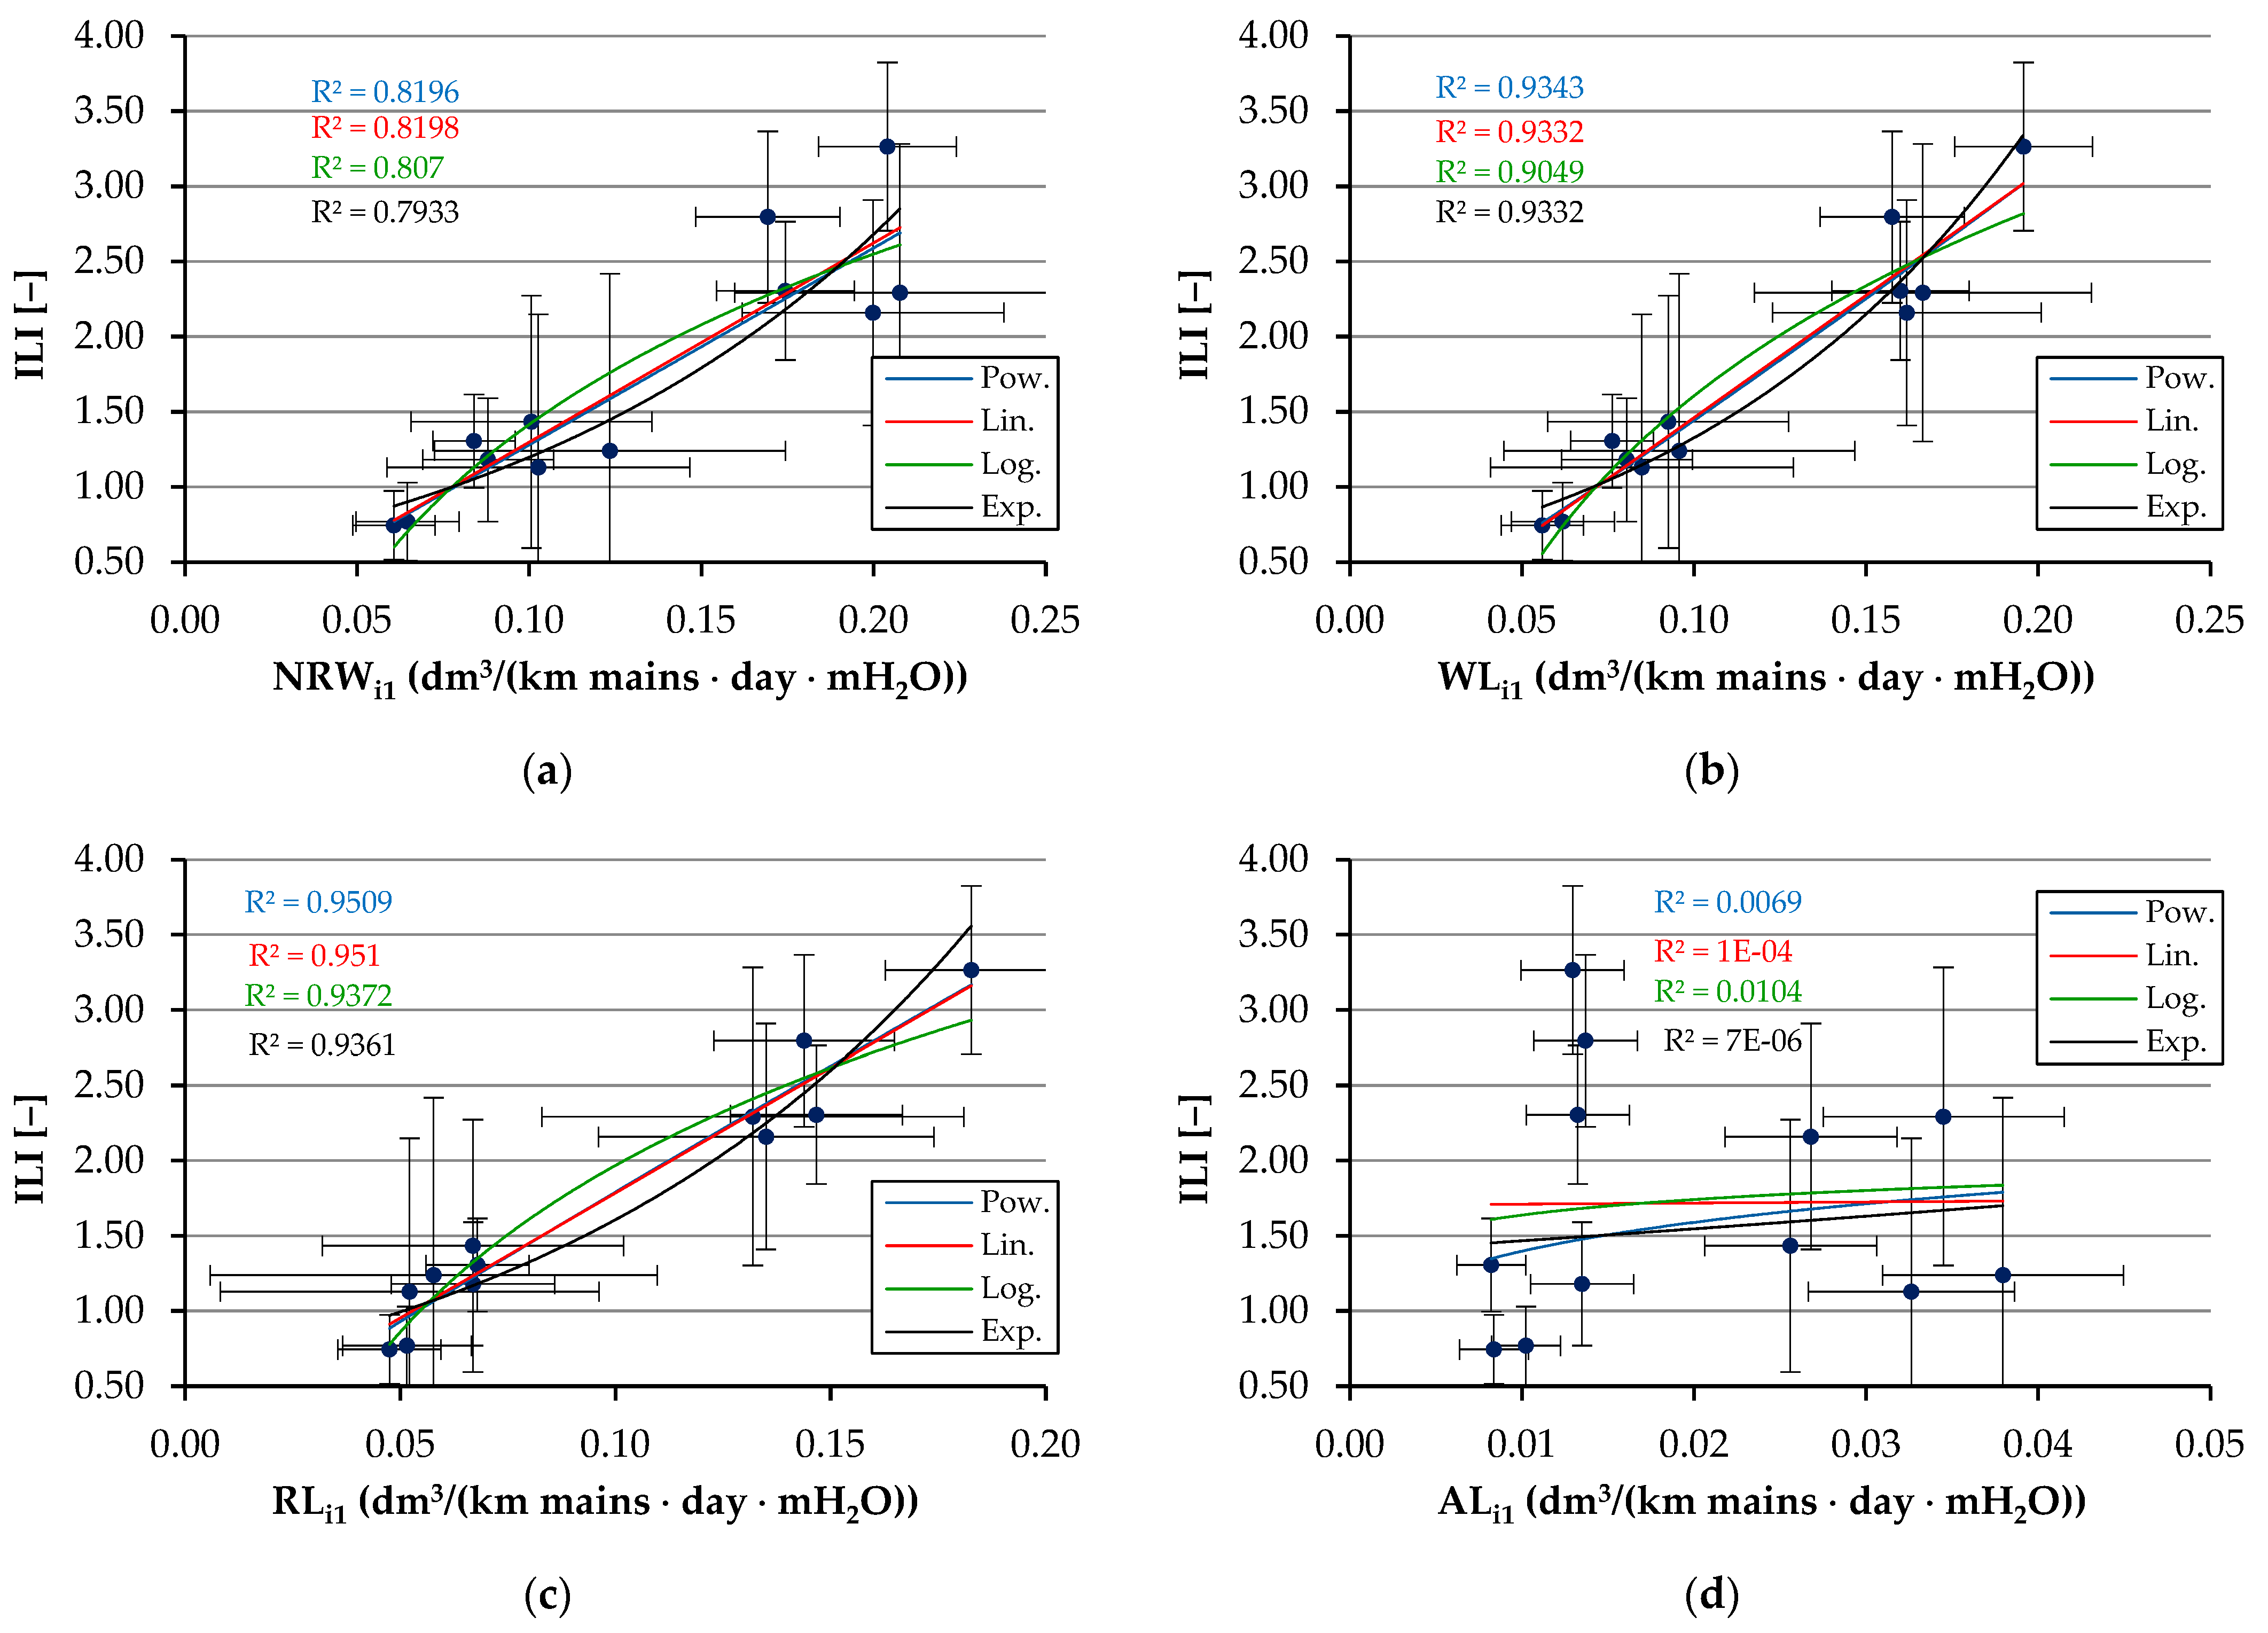
Figure 6. The linear (red line), logarithmic (green), exponential (black), and power (blue) relationships between ILI indexes and operational normalized intermediate WLPIs expressed in m3 of water lost per kilometer of mains per day per 1 m H2O of pressure: (a) the non-revenue water (NRWi1); (b) the total water loss indicator (WLi1); (c) the real water loss indicator (RLi1); (d) the apparent water loss indicator (ALi1).
Water 18 00527 g006
The results presented in Figure 6 indicate that the highest and a very strong positive correlation was obtained for RLi1. The R2 for the linear relationship is 0.9510, and the R2 for the logarithmic relationship is 0.9372. In regard to RLi1, very strong positive correlations were also obtained in the case of power and exponential relationships (R2 = 0.9287 and 0.8985, respectively). Very strong positive correlations were also obtained in the case of WLi1 (the maximal value of R2 = 0.9332 for the linear function) and in the case of NRWi1 (the maximal value of R2 = 0.8827 for the power function). The weakest linear correlation among all analyzed cases was recorded for the linear relationship between the ILI and ALi1. In fact, in this case, no correlation was found (R2 = 1 × 10⁻⁴).

3.2.6. The Correlation Between the ILI and Intermediate Normalized WLPIs per Number of Service Connections

Figure 7 shows different kinds of relationships between the ILI and intermediate operational normalized WLPIs expressed as volume of water lost (in dm3) per service connection per day per 1 m H2O of pressure. These indices are marked as: NRWi2, WLi2, RLi2, Ali2. Plots in Figure 7 were prepared based on the values presented in Table 5.
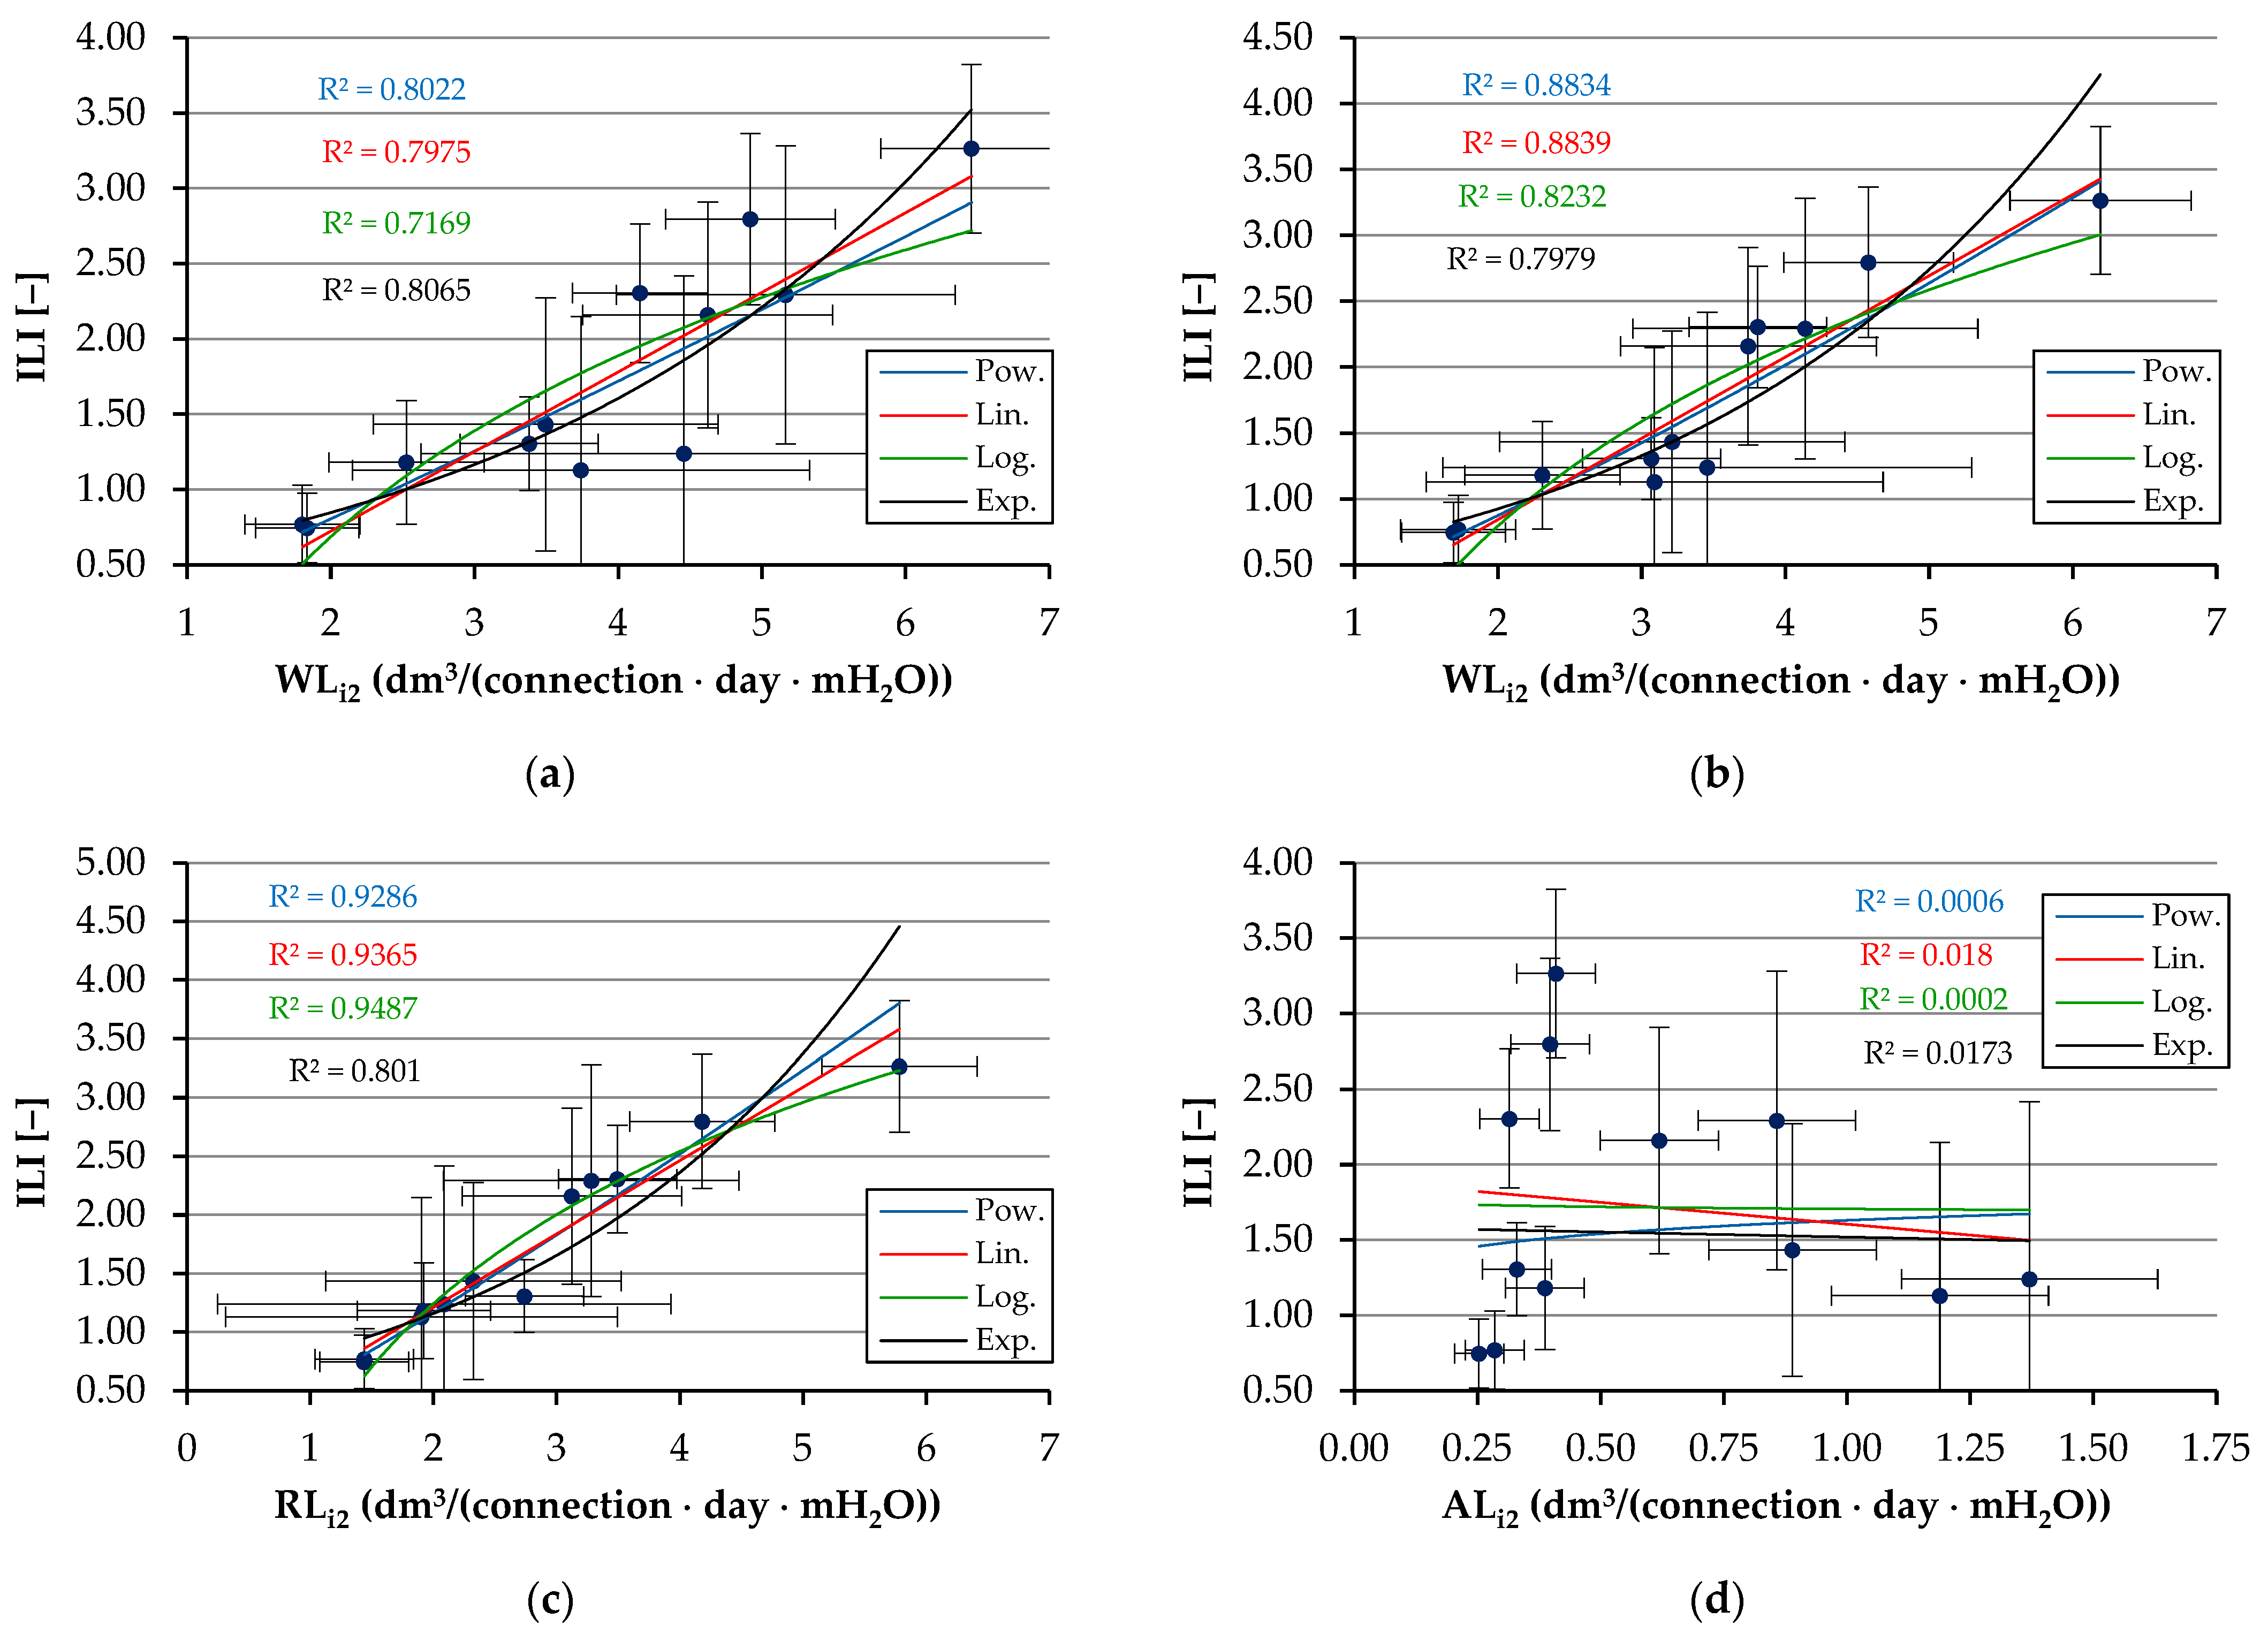
Figure 7. The linear (red line), logarithmic (green), exponential (black), and power (blue) relationships between ILI indexes and operational normalized intermediate water loss performance indicators expressed in dm3 of water lost per service connection per day per 1 m H2O of pressure: (a) non-revenue water (NRWi2); (b) the total water loss indicator (WLi2); (c) the real water loss indicator (RLi2); (d) the apparent water loss indicator (ALi2).
Water 18 00527 g007
The results presented in Figure 7 indicate that a very strong, and at the same time, the strongest positive correlation among all analyzed sets of scores was obtained for the power relationship between the ILI and RLi2 (R2 = 0.9502). In regard to RLi2, very strong correlations were also obtained for logarithmic and linear functions (0.9487 and 0.9365, respectively). It should be noted that the curves of the linear and power functions were very similar in this case. The second strongest correlation among the results presented in Figure 7 was obtained for the relationship between the ILI and WLi2 in the case of both linear and power functions (R2 = 0.8839 and 0.8836, respectively). The linear positive correlation obtained for the relationship between ILI and NRWi2 was slightly lower but also classified as very strong (R2 = 0.8262 for the exponential function, R2 = 0.8089 for the power function, and R2 = 0.7975 for the linear function). A very weak linear correlation (in fact, no correlation) was recorded for the relationship between ILI and ALi2 (R2 = 0.018 for the linear relationship).

4. Discussion

The results described in Section 3 indicate that in many cases the determination coefficients (R2) obtained for linear relationships between the ILI and other WLPIs were similar to values of R2 calculated for non-linear functions (power, logarithmic, or exponential). The graphs for non-linear relationships (especially for power functions) were also very similar to those for linear functions. This may indicate the existence of linear relationships between the ILI and other analyzed WLPIs. Therefore, further considerations focus primarily on the linear correlation between all analyzed indicators.
Table 6 presents a summary of statistical calculations for the linear correlation between the ILI and other WLPIs analyzed in the research. The table lists values of determination coefficients (R2), Pearson’s correlation coefficients (r) (calculated from Equation (14)), and root mean squared errors (RMSE) (calculated based on Equation (15)).

4.1. The Analysis of the Correlation Between the ILI and Annual Volumes of Water Losses

The results presented in Table 6 indicate that the weakest correlation was found for the relationship between the ILI and volumes of water loss per year (in 103 m3/year). The results confirm that water loss volumes cannot be classified as WLPIs and are not suitable for comparing the condition of different WDNs. The volume of water loss depends strongly on the network geometry and the amount of water produced, rather than on the condition of the WDN. However, this parameter plays an important role in the preparation of WB. On the other hand, the volume of water loss per unit of time can play a role in the evaluation of a particular WDS condition over different balance periods provided that the geometry of the system and the operating pressure remain relatively constant.

4.2. The Analysis of the Correlation Between the ILI and Percentage WLPIs

The second type of relationships discussed were correlations between ILI and WLPIs expressed as percentages of SIV. Among the analyzed indexes, WL%, RL%, and AL% are categorized as basic operational indicators, while NRW% is categorized as a basic financial indicator, according to the classification developed by the IWA [23,24] and AWWA [34]. Based on results obtained, a moderate correlation was found between the ILI and percentage WLPIs (in the case of AL%, this correlation was negative). The highest positive Pearson correlation coefficient (r) was recorded for NRW% (0.7100), while the highest negative r value was recorded for AL% (–0.7100). It is worth noting that the absolute values of r for the two linear functions mentioned above were identical (the same applies to R2 and RMSE), which resulted from the adopted methodology for calculating AL%. The values of RMSE ranged from 0.5526 to 0.5785. A higher correlation between the ILI and percentage WLPIs was found by Oberascher et al. (2020) [60] in the research conducted in Austria, but these results have limited applicability due to a different methodology for determining such indicators (in accordance with Austrian water law). But they have underlined that, according to recommendations of the IWA, this index is not suitable for determining the efficiency of measures regarding real losses of water.
Percentage indicators are, to some extent, better for comparing water losses in distribution systems than the previously described annual loss volumes, as they relate water losses to SIV. These PIs are commonly used by water supply companies to report water losses due to their simplicity, ease of use, and good availability of data necessary for their calculation [37]. Nevertheless, they are not recommended for comparing water losses in different WSSs [38]. Percentage indicators have many disadvantages: their reliability is limited, they do not directly relate to the geometry of WSS (e.g., the length of mains, length and number of service connections), and they are widely criticized by scientists and practitioners [66]. Lambert (2002) [67] has stated that the percentage of SIV is too strongly influenced by consumption, as well as changes in consumption, and therefore it is unsuitable for operational management of real losses. Giustolisi et al. (2024) [45] also concluded that the percentage of SIV is a very weak indicator at the DMA level due to its dependency on the density of consumption. These recommendations agree with the results of research conducted by Winarni in 2008 [19], where a weak correlation was found between the ILI and real losses expressed as a percentage of SIV. Winarni has concluded that the comparison of leakages between water supply companies should not be based on percentage indicators [19]. Giustolisi et al. (2024) [44] have emphasized that the weakness of the percentage PIs relies on their non-linear formulation (the volume of water losses appears not only in the numerator but also in the denominator).
The percentage indicators also do not take into account the operational parameters of the network, such as operating pressure [66,67]. Therefore, it is often suggested that they should be replaced with normalized indicators, which are more accurate and take into account the geometry of WDSs [66,68,69]. An additional problem associated with the use of percentage indicators, as pointed out by Lambert [20], is that the division of SIV into WS and WE is not taken into account in the calculation of these indicators (if the company exports water). If WE is relatively large in relation to SIV, the percentage loss indicator may be underestimated and will not reflect the actual condition of the system [20,24].
In view of the above issues and results of the analysis carried out, it can be concluded that percentage indicators should be considered inadvisable for the purpose of reporting water losses in connection with the implementation of the Directive (EU) 2020/2184. Both WI and WE play a significant role in WBs and should be reported in future investigations, according to expanded WB schemes [20].

4.3. The Analysis of the Correlation Between the ILI and Basic Normalized WLPIs

The next two groups of indicators discussed (Figure 4 and Figure 5) are basic normalized operational WLPIs, expressed using two different units: m3 of water per km of mains per day, as well as dm3 of water per service connection per day. The obtained results presented in Figure 4 and Figure 5, as well as in Table 6, confirm that in the case of both real and total losses, as well as NRW, their correlation with the ILI was very strong or strong. The highest positive very strong linear correlation (r = 0.8565) was obtained for the relationship between the ILI and RLb2 expressed as volume of water loss per service connection per day. A slightly lower very strong positive linear correlation (r = 0.7949) was recorded for the relationship between the ILI and RLb1 expressed as the water loss per km of mains per day. Also noteworthy are the relatively high values of r for the linear relationship between the ILI and total loss indicators WL1b and WL2b (0.7570 and 0.7687, respectively), referring to both the mains’ length and number of service connections. The results obtained are consistent with the findings of Liemberger et al. (2007) [24]. In their research they have stated that the most appropriate traditional operational PIs for real losses are normalized indicators expressed per length of mains (so-called indicator Op28), or per number of service connections (so-called indicator Op27) [24]. Wyatt, in his article published in 2020 [68], has stated that normalized (unit) PIs for both real and apparent losses, expressed in terms of volume, per connection per day, appear to be the key performance indicators (KPIs). He has concluded that the advantages of these indicators are their simplicity, ease of calculation, broad understandability, as well as high technical rigor, usefulness in planning interventions for control and reduction in water losses. Wyatt has underlined that the IWA also recommends these indicators [68].
According to available knowledge [38,70], the choice of one of these two types of indicators (e.g., RLb1 or RLb2) should be determined by the density of service connections (D). When D is higher than 20 connections per km, then the calculation of RLb2 is recommended (see Equation (11)). If D is less than 20 per km, it is recommended to use RLb1 (see Equation (10)). In the case of all the WBs analyzed in the current research, the connections’ densities D were greater than 20 per km, and the best correlation, among basic normalized PIs, was identified for RLb2 (expressed per number of service connections). The analysis confirmed that the results presented in the current article are consistent with the findings and results available in the literature [24,38,70]. Lambert has concluded in articles published in both 2002 [69] and in 2019 [71] that the IWA recommends the use of an operational real loss performance indicator expressed as a volume of water per connection per day as the ‘Best Practice’ basic PI for systems with a service connections density D greater than 20 per km (when the system is pressurized). He emphasizes that in large water supply systems with high D, most real losses are related to leaks occurring at service connections [69,71]. In turn, Oberascher et al. [60] also found a strong correlation between the ILI and the basic operational normalized WLPIs, but he found a better correlation for the indicator related to network length. It should be emphasized that basic operational normalized WLPIs, especially those calculated based on real water losses (also known as Op27 and Op28), can be recommended and used as a good alternative if there are insufficient data to determine the ILI. These indicators are very easy to calculate and, on the other hand, more accurate than percentage indicators, as they are determined based on data dependent on the characteristics of the water supply system [24,38,70,71].

4.4. The Analysis of the Correlation Between the ILI and Intermediate Normalized WLPIs

The intermediate operational normalized WLPIs are the last group of analyzed indices. They are expressed as both the volume of water lost per km of mains per day per 1 m H2O of pressure and the volume of water lost per service connection per day per 1 m H2O of pressure. Taking into account the results presented in Figure 6 and Figure 7, as well as in Table 6, the correlations between the ILI and these PIs (excluding apparent loss indices ALi1 and ALi2) were the strongest among all the indicators analyzed. The highest Pearson correlation coefficient for a linear function (r = 0.9752) was detected in the case of the relationship between the ILI and RLi1 (PI for real water loss expressed in volume per km of mains per day per 1 mH2O of pressure). A very high Pearson’s correlation coefficient (r = 0.9677), indicating a very strong correlation, was also obtained for the linear relationship between the ILI and RLi1 (expressed in volume per service connection per day per 1 mH2O of pressure). It should be emphasized that in the case of the correlation between the ILI and RLi1, as well as the correlation of the ILI and RLi2, the lowest RMSE values (0.1737 and 0.1976, respectively) were also obtained. The high RMSE values were also obtained for the total WLPIs: WLi1 (RMSE = 0.2028) and WLi2 (RMSE = 0.2673). These RMSE values also indicated a strong linear correlation between each of these two indicators and the ILI. When analyzing the results presented in Table 6, it should be noted that, unlike basic normalized indicators, in the case of intermediate indicators, no impact of service connection density on the correlation between specified real loss indicators and ILI was observed. Despite D > 20 connections per km (for all WBs), a higher correlation coefficient was obtained in this case for the RLi1, expressed in water volume per km of mains per day per 1 m H2O. Future research should therefore analyze whether this relationship applies only to these specific data or to a wider population of results. It can be concluded that intermediate operational normalized indices are more accurate and better correlated with the ILI than the basic ones, because they take into account not only the size of the water supply system but also the operating pressure in the network. They can be an alternative solution for estimating WLPIs when the ILI cannot be estimated, but it should be emphasized that the data required to calculate them are almost identical to those used to calculate the ILI.
Therefore, their use instead of the ILI may be only justified when, for example, the data on either the length of mains or the number of service connections are incomplete. Use of these indicators is very simple because their calculation does not require the determination of UARL. On the other hand, however, the inability to compare real losses (CARL) with UARL means that normalized indicators, both basic and intermediate, do not allow for a relatively quick and in-depth assessment of the condition of the WDN, which is currently possible thanks to the ILI (classified together with UARL as detailed WLPIs).
The use of the ILI allows for comparing the condition of different WDSs with each other, but also allows for estimating changes in the condition of a particular WDN (e.g., year-on-year), which helps in making decisions about the possible implementation of rehabilitation plans. Taking into account the reporting related to the implementation of the Directive (EU) 2020/2184, it can therefore be concluded that although normalized indices are good and relatively accurate indicators, they should only be used in situations where it is impossible to determine the ILI.
As part of the analysis, random uncertainties were also calculated (see Table 1, Table 2, Table 3, Table 4 and Table 5 and Figure 2, Figure 3, Figure 4, Figure 5, Figure 6 and Figure 7). In practice, uncertainties are rarely presented in WBs, but they provide valuable information on the accuracy of determining individual balance components and estimated PIs. Performing such analyses is recommended, among others, by Lambert [38,65], AL Washali et al. (2020) [35], AL Washali et al. (2019) [36], and Babić et al. (2014) [64]. The results presented in Table 2, Table 3, Table 4 and Table 5 and in Figure 2, Figure 3, Figure 4, Figure 5, Figure 6 and Figure 7 show that determined values of both the NRW and WLPIs (including the ILI) may be subject to considerable random uncertainties. Increasing the accuracy class of water meters used in water supply companies can significantly improve the precision of measurements and, therefore, diminish the random uncertainties and, additionally, diminish apparent water losses.
It should also be emphasized that environmental reporting can play a very important role in the pursuit of sustainable development of water supply companies [52]. van Thienen et al. (2025) [9] have underlined that Directive (EU) 2020/2184 focuses on larger utilities serving at least 50,000 people. On the other hand, they have concluded that smaller WDNs experience a higher percentage of water losses due to limited resources and aging infrastructure. Therefore, van Thienen et al. have recommended that small water supply companies (serving under 50,000 people) should also be included in water loss management initiatives [9]. Sakai (2024) [72] has emphasized that performance indicators used in the water supply industry can be very useful tools for assessing the operational, financial, environmental, and social aspects of WDSs. He has underlined the need to strive for improvement in the standardization of data collection and processing. According to Sakai, the carbon neutrality, as well as the material structure of the network and even soil properties, should be taken into account in future studies related to, among other things, water loss management [72]. Research conducted by Musz-Pomorska et al. (2017) [73] confirms the impact of soil and the material structure on the network failure rates. In their study, the authors have stated that real water losses in Polish cities are related to leaks caused by bursts. Other causes of failures include annual temperature fluctuations, ground freezing, and unstable foundations. Pipelines in areas affected by mining damage are particularly vulnerable to failures [73].
It should be underlined that both active leakage control and reporting of water losses should fulfill their role and lead to an improvement in the company’s condition. For this to happen, public awareness needs to be raised so that reporting is not just seen as a burdensome obligation, but as an opportunity to accurately diagnose problems and take appropriate corrective action plans.
It should be emphasized that the results and conclusions of the research described in this article are limited, as the study only took into account WBs calculated for water supply companies from one region (southern Poland). Further research is planned, which will cover a larger number of water supply companies with more diverse amounts of water produced and sold, in which real losses are characterized by different values of the ILI indexes.

5. Conclusions

Conclusions formulated based on the results of the research and the literature review are presented below:
  • The results of the conducted research indicate that, in the case of analyzed WBs, the strongest linear correlation was obtained for the relationship between the ILI and the intermediate operational normalized PIs for real water losses RLi1 (R2 = 0.9510). The results suggest that normalized intermediate PIs for real losses expressed as volume of water lost per time, per 1 m H2O of pressure, and, respectively, per length of mains or number of service connections, may be an alternative to the ILI in situations where it is impossible to calculate the ILI. However, it should be emphasized that both the ILI and normalized average indices require determining almost the same parameters, including operating pressure. Therefore, if a water supply company has all the necessary data, the ILI should be the index of the first choice.
  • The research results also suggest a very strong correlation for the linear relationship between the ILI and basic normalized operational PIs for real losses. The best results in this category of PIs were recorded for the relationship between the ILI and PIs for real losses, RLb2 (R2 = 0.7336). The results indicate that basic unit operational PIs for real losses expressed as volume of water lost per time, per length of mains (or per the number of service connections) can be a very good alternative to the ILI indicator in situations where a company does not have all the data necessary to determine the ILI. Compared to intermediate normalized operational indicators, the advantage of basic indicators is that average pressure is not required for their calculation.
  • The results indicate a moderate linear correlation between the ILI and percentage indicators (calculated as a percentage of SIV). Based on the literature review and on the research, it can be concluded that results obtained using these indicators may not be reliable and should not be recommended as an alternative to the ILI for water loss reporting purposes in connection with the implementation of Directive (EU) 2020/2184.
The results of the study confirmed that not all water loss indicators can be reliable PIs used for the evaluation of water losses in WDSs and for reporting purposes within the framework of the implementation of the Directive (EU) 2020/2184. The correlation analysis conducted in this research enabled the identification of the most reliable and easily determined PIs for water losses, which can be used in situations where the ILI is not applicable. The authors postulate that the possibility of using water loss performance indicators other than the ILI should be defined more precisely, e.g., in a delegated act or other documents regulating the reporting process related to the implementation of Directive (EU) 2020/2184. Specifying which water loss indicators can be used if ILI cannot be estimated would increase the reliability and credibility of water network condition assessments. Authors propose that normalized operational indicators (basic and intermediate) should be the preferred PIs, and that the determination of the density of service connections should precede the choice of appropriate indicator type.

Supplementary Materials

The following supporting information can be downloaded at: https://www.mdpi.com/article/10.3390/w18050527/s1, Table S1. The regression coefficients (a,b) and determination coefficients (R2) for linear relationships between the ILI and other WLPIs. Explanations (y = ILI, x = WLPI, a,b—regression coefficients). Table S2. The regression coefficients (a,b) and determination coefficients (R2) for exponential relationships between the ILI and other WLPIs. Explanations (y = ILI, x = WLPI, a,b—regression coefficients). Table S3. The regression coefficients (a,b) and determination coefficients (R2) for logarithmic relationships between the ILI and other WLPIs. Explanations (y = ILI, x = WLPI, a,b—regression coefficients). Table S4. The regression coefficients (a,b) and determination coefficients (R2) for power relationships between the ILI and other WLPIs. Explanations (y = ILI, x = WLPI, a,b—regression coefficients).

Author Contributions

Conceptualization, I.D., U.K. and A.O.-K.; methodology, I.D.; software, I.D. and U.K.; validation, I.D., U.K. and A.O.-K.; formal analysis, I.D.; investigation, I.D., U.K. and A.O.-K.; resources, I.D. and A.O.-K.; data curation, I.D., U.K. and A.O.-K.; writing—original draft preparation, I.D.; writing—review and editing, I.D., U.K. and A.O.-K.; visualization, I.D. and U.K.; supervision, I.D. All authors have read and agreed to the published version of the manuscript.

Funding

The scientific research was funded by the statutory subvention of Czestochowa University of Technology, Faculty of Infrastructure and Environment (BS/PB-400/301/26).

Data Availability Statement

Data are contained within the article. The original contributions presented in this study are included in the article. Further inquiries can be directed to the corresponding author.

Conflicts of Interest

The authors declare no conflicts of interest.

Abbreviations

The following abbreviations are used in this manuscript:
ALApparent losses
AMSIAsset management support indicator
AWWAAmerican Water Works Association
BACBilled authorized consumption
BMCBilled metered consumption
CARLCurrent annual real losses
CMIsCustomer meter inaccuracies
DHEsData handling errors
DWDDrinking Water Directive
ELLEconomic leakage level
EUEuropean Union
GHGGreenhouse gas
ILIInfrastructure leakage index
IWAInternational Water Association
KPIKey performance indicator
NRWNon-revenue water
PATPump as turbine
PIPerformance indicator
RLReal losses
SCFSystem correction factor
SDGSustainable Development Goal
SIVSystem input volume
UACUnbilled authorized consumption
UARLUnavoidable annual real losses
UCUnauthorized consumption
WBWater balance
WDNWater distribution network
WDSWater distribution system
WEWater exported
WIWater imported
WLWater losses
WLPIWater loss performance indicator
WLSGWater Loss Specialists Group
WSWater supplied
WSSWater supply system

References

  1. European Environment Agency (Ed.) Water Resources Across Europe—Confronting Water Stress: An Updated Assessment; EEA Report No 12/2021; Publications Office of the European Union: Luxembourg, 2021; Available online: https://www.eea.europa.eu/publications/water-resources-across-europe-confronting (accessed on 28 July 2025). [CrossRef]
  2. Kummu, M.; Guillaume, J.H.A.; de Moel, H.; Eisner, S.; Flörke, M.; Porkka, M.; Siebert, S.; Veldkamp, T.I.E.; Ward, P.J. The world’s road to water scarcity: Shortage and stress in the 20th century and pathways towards sustainability. Sci. Rep. 2016, 6, 38495. [Google Scholar] [CrossRef]
  3. Amparo-Salcedo, M.; Pérez-Gimeno, A.; Navarro-Pedreño, J. Water Security Under Climate Change: Challenges and Solutions Across 43 Countries. Water 2025, 17, 633. [Google Scholar] [CrossRef]
  4. United Nations. The United Nations World Water Development Report 2023: Partnerships and Cooperation for Water; UNESCO: Paris, France, 2023; Available online: https://www.unesco.org/reports/wwdr/2023/en/download (accessed on 25 July 2025).
  5. Estrela-Segrelles, C.; Pérez-Martín, M.Á.; Wang, Q.J. Adapting Water Resources Management to Climate Change in Water-Stressed River Basins—Júcar River Basin Case. Water 2024, 16, 1004. [Google Scholar] [CrossRef]
  6. UN DESA. The Sustainable Development Goals Report 2025; United Nations: New York, NY, USA, 2025. [Google Scholar] [CrossRef]
  7. Sharif, M.N.; Haider, H.; Farahat, A.; Hewage, K.; Sadiq, R. Water–energy nexus for water distribution systems: A literature review. Environ. Rev. 2019, 27, 519–544. [Google Scholar] [CrossRef]
  8. Barry, J.A. Watergy: Energy and Water Efficiency in Municipal Water Supply and Wastewater Treatment—Cost-Effective Savings of Water and Energy. The Alliance to Save Energy. 2007. Available online: https://www.ase.org/sites/ase.org/files/watergy_handbook.pdf (accessed on 20 September 2025).
  9. van Thienen, P.; Steffelbauer, D.B.; Vertommen, I. Water loss management in Europe: Perceptions, drivers, responses/strategies, and results. Water Pract. Technol. 2025, 20, 1921–1938. [Google Scholar] [CrossRef]
  10. EurEau. Europe’s Water in Figures. An Overview of the European Drinking Water and Waste Water Sectors. 2021. Available online: https://www.eureau.org/resources/publications/eureau-publications/5824-europe-s-water-in-figures-2021/file (accessed on 25 August 2023).
  11. Directive (EU) 2023/1791 of the European Parliament and of the Council of 13 September 2023 on Energy Efficiency and Amending Regulation (EU) 2023/955. Available online: https://eur-lex.europa.eu/legal-content/EN/TXT/PDF/?uri=CELEX:32023L1791&qid=1698344986352 (accessed on 20 July 2025).
  12. United Nations. The Sustainable Development Goals Report 2023: Special Edition. 2023. Available online: https://unstats.un.org/sdgs/report/2023/The-Sustainable-Development-Goals-Report-2023.pdf (accessed on 15 June 2025).
  13. Choi, S.H.; Shin, B.; Shin, E. Managing Apparent Loss and Real Loss from the Nexus Perspective Using System Dynamics. Water 2022, 14, 231. [Google Scholar] [CrossRef]
  14. Wilson, L.; Lichinga, K.N.; Kilindu, A.B.; Masse, A.A. Water utilities’ improvement: The need for water and energy management techniques and skills. Water Cycle 2021, 2, 32–37. [Google Scholar] [CrossRef]
  15. Andraka, D.; Kruszyński, W.; Tyniec, J.; Gwoździej-Mazur, J.; Kaźmierczak, B. Practical Aspects of the Energy Efficiency Evaluation of a Water Distribution Network Using Hydrodynamic Modeling—A Case Study. Energies 2023, 16, 3340. [Google Scholar] [CrossRef]
  16. Ramos, H.M.; Mello, M.; De, P.K. Clean power in water supply systems as a sustainable solution: From planning to practical implementation. Water Sci. Technol. Water Supply 2010, 10, 39–49. [Google Scholar] [CrossRef]
  17. Ávila, C.A.M.; Sánchez-Romero, F.-J.; López-Jiménez, P.A.; Pérez-Sánchez, M. Leakage Management and Pipe System Efficiency. Its Influence in the Improvement of the Efficiency Indexes. Water 2021, 13, 1909. [Google Scholar] [CrossRef]
  18. Giudicianni, C.; Herrera, M.; Nardo, A.d.; Adeyeye, K.; Ramos, H.M. Overview of Energy Management and Leakage Control Systems for Smart Water Grids and Digital Water. Modelling 2020, 1, 134–155. [Google Scholar] [CrossRef]
  19. Winarni, W. ILI as Water Losses Indicator. Civ. Eng. Dimens. 2009, 11, 126–134. Available online: https://api.semanticscholar.org/CorpusID:55039172 (accessed on 16 December 2025).
  20. Lambert, A. IWA Water Balance. The LEAKSSuite Library. 2019. Available online: https://www.leakssuitelibrary.com/iwa-water-balance/ (accessed on 5 September 2025).
  21. Kanakoudis, V.; Tsitsifli, S.; Samaras, P.; Zouboulis, A. Assessing the performance of urban water networks across the EU Mediterranean area: The paradox of high NRW levels and absence of respective reduction measures. Water Supply 2013, 13, 939–950. [Google Scholar] [CrossRef]
  22. Lambert, A.; Hirner, W. Losses from Water Supply Systems: Standard Terminology and Recommended Performance Measures. IWA. Blue Pages. 2000. Available online: https://www.wes-med.eu/wp-content/uploads/2023/01/RW-6-REGST-2023.01.16-IWA-2000.pdf (accessed on 20 August 2025).
  23. Lambert, A.; Charalambous, B.; Fantozzi, M.; Kovac, J.; Rizzo, A.; St John, S.G. 14 years’ experience of using IWA best practice water balance and water loss performance indicators in Europe. In Proceedings of the Specialized Conference: Water Loss 2014, Vienna, Austria, 30 March–2 April 2014; Available online: https://www.semanticscholar.org/paper/14-Years-Experience-of-using-IWA-Best-Practice-and-Lambert-Charalambous/bed71a37d56e232a13847b52cf68a1d6affdb25c (accessed on 18 May 2025).
  24. Liemberger, R.; Brothers, K.; Lambert, A.; McKenzie, R.; Rizzo, A.; Waldron, T. Water Loss Performance Indicators. 2007. Available online: https://www.miya-water.com/fotos/artigos/15_water_loss_performance_indicators_6560934665a32619c8808b.pdf (accessed on 14 April 2025).
  25. Liemberger, R.; Wyatt, A. Quantifying the global non-revenue water problem. Water Supply 2019, 19, 831–837. [Google Scholar] [CrossRef]
  26. Arregui, F.J.; Cobacho, R.; Soriano, J.; Jimenez-Redal, R. Calculation Proposal for the Economic Level of Apparent Losses (ELAL) in a Water Supply System. Water 2018, 10, 1809. [Google Scholar] [CrossRef]
  27. Rizzo, A. Apparent Water Loss Control: Theory and Application. In Proceedings of the Water Conference, Ferrara, Italy, 17–19 May 2006; Available online: https://www.mcast.edu.mt/wp-content/uploads/2006-Apparent-Water-Loss-Control-Theory-and-Application-Rizzo-A-IWA-Ferrara-Italy-2006H_4-1.pdf (accessed on 20 June 2025).
  28. Ahopelto, S.; Vahala, R. Cost–Benefit Analysis of Leakage Reduction Methods in Water Supply Networks. Water 2020, 12, 195. [Google Scholar] [CrossRef]
  29. Gupta, A.; Kulat, K.D. A Selective Literature Review on Leak Management Techniques for Water Distribution System. Water Resour. Manag. 2018, 32, 3247–3269. [Google Scholar] [CrossRef]
  30. Yilmaz, S.; Ateş, A.; Firat, M.; Özdemir, Ö.; Cinal, H. Determination of economic loss levels in water distribution systems with different network conditions by a district stochastic optimization algorithm. Water Supply 2023, 23, 1349–1361. [Google Scholar] [CrossRef]
  31. Moslehi, M.I.; Jalili-Ghazizadeh, M.; Yousefi-Khoshqalb, E. Developing a framework for leakage target setting in water distribution networks from an economic perspective. Struct. Infrastruct. Eng. 2021, 17, 821–837. [Google Scholar] [CrossRef]
  32. Haider, H.; Al-Salamah, I.S.; Ghazaw, Y.M.; Abdel-Maguid, R.H.; Shafiquzzaman, M.; Ghumman, A.R. Framework to establish economic level of leakage for intermittent water supplies in arid environments. J. Water Resour. Plan. Manag. 2018, 145, 05018018. [Google Scholar] [CrossRef]
  33. Heryanto, T.; Sharma, S.K.; Daniel, D.; Kennedy, M. Estimating the Economic Level of Water Losses (ELWL) in the Water Distribution System of the City of Malang, Indonesia. Sustainability 2021, 13, 6604. [Google Scholar] [CrossRef]
  34. AWWA. The State of Water Loss Control in Drinking Water Utilities. A White Paper From the American Water Works Association. 2016. Available online: https://www.awwa.org/Portals/0/AWWA/ETS/Resources/WLCWhitePaper.pdf?ver=2017-09-11-153507-487 (accessed on 14 August 2025).
  35. AL-Washali, T.; Sharma, S.; Lupoja, R.; Al-Nozaily, F.; Haidera, M.; Kennedy, M. Assessment of water losses in distribution networks: Methods, applications, uncertainties, and implications in intermittent supply. Resour. Conserv. Recycl. 2020, 152, 104515. [Google Scholar] [CrossRef]
  36. AL-Washali, T.; Sharma, S.; AL-Nozaily, F.; Haidera, M.; Kennedy, M. Monitoring Nonrevenue Water Performance in Intermittent Supply. Water 2019, 11, 1220. [Google Scholar] [CrossRef]
  37. Ramm, K.; Bylka, J. Nowe wymagania w zakresie jakości usług wodociągowych dotyczące strat wody (New Requirements for the Quality of Water Supply Services to Curb Water Loss). Zesz. Nauk. Uniw. Ekon. Krakowie 2021, 4, 47–65. (In Polish) [Google Scholar] [CrossRef]
  38. European Commission, Directorate-General for Environment. EU Reference Document Good Practices on Leakage Management WFD CIS WG PoM—Main Report; Publications Office: Luxembourg, 2015; Available online: https://data.europa.eu/doi/10.2779/102151 (accessed on 2 September 2025). [CrossRef]
  39. Lambert, A. UARL and ILI. The LEAKSSuite Library. 2020. Available online: https://www.leakssuitelibrary.com/uarl-and-ili/ (accessed on 3 September 2025).
  40. Lenzi, C.; Bragalli, C.; Bolognesi, A.; Fortini, M. Infrastructure Leakage Index Assessment in Large Water Systems. Procedia Eng. 2014, 70, 1017–1026. [Google Scholar] [CrossRef]
  41. Lambert, A.O.; Brown, T.G.; Takizawa, M.; Weimer, D. A review of performance indicators for real losses from water supply systems. J. Water Supply Res. Technol.—AQUA 1999, 48, 227–237. [Google Scholar] [CrossRef]
  42. Alegre, H.; Baptista, J.M.; Cabrera, E., Jr.; Cubillo, F.; Duarte, P.; Hirner, W.; Merkel, W.; Parena, R. Performance Indicators for Water Supply Services, 3rd ed.; IWA Publishing: London, UK, 2017. [Google Scholar]
  43. Berardi, L.; Laucelli, D.B.; Ripani, S.; Piazza, S.; Freni, G. Using water loss performance indicators to support regulation and planning in real water distribution systems. Digit. Water 2025, 3, 1–20. [Google Scholar] [CrossRef]
  44. Giustolisi, O.; Ciliberti, F.G.; Mazzolani, G.; Laforgia, D. Effectiveness of water loss performance indicators for asset management. Digit. Water 2024, 2, 1–31. [Google Scholar] [CrossRef]
  45. Giustolisi, O.; Mazzolani, G.; Berardi, L.; Laucelli, D.B. From advanced hydraulic modelling to performance indicator for the efficiency of investments in leakage management of pressurized water systems. Water Res. 2024, 258, 121765. [Google Scholar] [CrossRef] [PubMed]
  46. Lambert, A. Low ILIs and Small Systems. The LEAKSSuite Library. 2020. Available online: https://www.leakssuitelibrary.com/low-ilis-and-small-systems/ (accessed on 19 November 2025).
  47. Koelbl, J.; Lambert, A. Experiences in Real Loss Assessment 10-years after implementing the ILI as decisive Key-PI in Austria. In Proceedings of the Southeast Europe Regional Conference Water Loss 2019, Bucharest, Romania, 23 September 2019; Available online: https://www.bluenetworks.at/BlueNetworks/Pub-WL_files/WL23_WaterLoss2019-Bucharest_Koelbl_Lambert-final.pdf (accessed on 19 November 2025).
  48. Stanton-Davies, K.; Shepherd, M. System Correction Factors—SCFs in Action in Europe, North America, UK and South Africa. In Proceedings of the Water Loss 2022 Conference, Prague, Czech Republic, 19–22 June 2022; Available online: https://www.wlranda.com/iwa-water-loss-2022-prague/ (accessed on 19 November 2025).
  49. Kowalska, B.; Suchorab, P.; Kowalski, D. Division of district metered areas (DMAs) in a part of water supply network using WaterGEMS (Bentley) software: A case study. Appl. Water Sci. 2022, 12, 166. [Google Scholar] [CrossRef]
  50. Ávila, C.A.M.; Sánchez-Romero, F.-J.; López-Jiménez, P.A.; Pérez-Sánchez, M. Improve leakage management to reach sustainable water supply networks through by green energy systems. Optimized case study. Sustain. Cities Soc. 2022, 83, 103994. [Google Scholar] [CrossRef]
  51. Drinking Water Directive 2020/2184 (DWD). Directive (EU) 2020/2184 of the European Parliament and of the Council of 16 December 2020 on the Quality of Water Intended for Human Consumption. Document 32020L2184. Available online: https://eur-lex.europa.eu/eli/dir/2020/2184/oj (accessed on 18 July 2025).
  52. Minea, G.; Lakatos, E.S.; Druta, R.M.; Moldovan, A.; Lupu, L.M.; Cioca, L.I. The Role of ESG in Driving Sustainable Innovation in Water Sector: From Gaps to Governance. Water 2025, 17, 2259. [Google Scholar] [CrossRef]
  53. COUNCIL DIRECTIVE 98/83/EC of 3 November 1998 on the Quality of Water Intended for Human Consumption. Available online: https://eur-lex.europa.eu/legal-content/EN/TXT/PDF/?uri=CELEX:31998L0083 (accessed on 15 July 2025).
  54. WAREG. European Water Regulators. Available online: https://www.wareg.org/articles/4-navigating-the-evolutions-of-the-eu-drinking-water-directive/ (accessed on 20 July 2025).
  55. COMMISSION DELEGATED REGULATION (EU) 2021/2139 of 4 June 2021 Supplementing Regulation (EU) 2020/852 of the European Parliament and of the Council by Establishing the Technical Screening Criteria for Determining the Conditions Under Which an Economic Activity Qualifies as Contributing Substantially to Climate Change Mitigation or Climate Change Adaptation and for Determining Whether that Economic Activity Causes no Significant Harm to Any of the Other Environmental Objectives. Available online: https://eur-lex.europa.eu/eli/reg_del/2021/2139/oj/eng (accessed on 16 September 2025).
  56. COMMISSION DELEGATED REGULATION (EU) 2023/2486 of 27 June 2023 Supplementing Regulation (EU) 2020/852 of the European Parliament and of the Council by Establishing the Technical Screening Criteria for Determining the Conditions Under Which an Economic Activity Qualifies as Contributing Substantially to the Sustainable Use and Protection of Water and Marine Resources, to the Transition to a Circular Economy, to Pollution Prevention and Control, or to the Protection and Restoration of Biodiversity and Ecosystems and for Determining Whether that Economic Activity Causes no Significant Harm to any of the Other Environmental Objectives and Amending Commission Delegated Regulation (EU) 2021/2178 as Regards Specific Public Disclosures for Those Economic Activities. Available online: https://eur-lex.europa.eu/eli/reg_del/2023/2486/oj/eng (accessed on 16 September 2025).
  57. IWA Water Loss Specialist Group Position Statement. Use of the Infrastructure Leakage Index (ILI) in EU Directives and Regulations. 2022. Available online: https://iwa-website-assets.s3.eu-west-2.amazonaws.com/blogs_1750245155507_6757b78552.pdf (accessed on 10 August 2025).
  58. Ociepa-Kubicka, A.; Deska, I.; Ociepa, E. Issues in Implementation of EU Regulations in Terms of Evaluation of Water Losses: Towards Energy Efficiency Optimization in Water Supply Systems. Energies 2024, 17, 633. [Google Scholar] [CrossRef]
  59. Seago, C.J.; McKenzie, R.S.; Liemberger, R. International Benchmarking of Leakage from Water Reticulation Systems. In Proceedings of the IWA Leakage 2005 Conference, Halifax, NS, Canada, 12–14 September 2005; Available online: https://www.miya-water.com/fotos/artigos/06_international_benchmarking_of_leakage_from_water_reticulation_systems_1017893235a325e2b03b5c.pdf (accessed on 25 June 2025).
  60. Oberascher, M.; Möderl, M.; Sitzenfrei, R. Water Loss Management in Small Municipalities: The Situation in Tyrol. Water 2020, 12, 3446. [Google Scholar] [CrossRef]
  61. Ociepa, E.; Mrowiec, M.; Deska, I. Analysis of Water Losses and Assessment of Initiatives Aimed at Their Reduction in Selected Water Supply Systems. Water 2019, 11, 1037. [Google Scholar] [CrossRef]
  62. Serafeim, A.V.; Fourniotis, N.T.; Deidda, R.; Kokosalakis, G.; Langousis, A. Leakages in Water Distribution Networks: Estimation Methods, Influential Factors, and Mitigation Strategies—A Comprehensive Review. Water 2024, 16, 1534. [Google Scholar] [CrossRef]
  63. Kanakoudis, V.; Tsitsifli, S.; Samaras, P.; Zouboulis, A.; Banovec, P. A new set of water losses-related performance indicators focused on areas facing water scarcity conditions. Desalin. Water Treat. 2013, 51, 2994–3010. [Google Scholar] [CrossRef]
  64. Babić, B.; Stanić, M.; Prodanović, D.; Džodanović, B.; Đukić, A. Reducing Uncertainty of Infrastructure Leakage Index—A Case Study. Procedia Eng. 2014, 89, 1577–1584. [Google Scholar] [CrossRef][Green Version]
  65. Lambert, A. Random Uncertainty in Water Balance. The LEAKSSuite Library. 2020. Available online: https://www.leakssuitelibrary.com/random-uncertainty-in-water-balance/ (accessed on 2 September 2025).
  66. Lambert, A. Professionals Abandon %s of System Input Volume. The LEAKSSuite Library. 2019. Available online: https://www.leakssuitelibrary.com/pros-abandon-percents-of-siv/ (accessed on 2 September 2025).
  67. Lambert, A.O. International Report on Water Losses Management and Techniques. In Proceedings of the IWA Berlin Congress, Berlin, Germany, 15–19 October 2001; Available online: http://www.studiomarcofantozzi.it/IntRepWaterLossesMan%26TechniquesBerlin.pdf (accessed on 25 September 2025).
  68. Wyatt, A.S. The use of Frontier Analysis to assess the technical rigor of water loss performance indicators. H2Open J. 2020, 3, 102. [Google Scholar] [CrossRef]
  69. Kwietniewski, M. Application of Water Loss Indicators as a Measure of its Distribution Effectiveness in Water Supply Systems. Environ. Prot. 2013, 35, 9–16. Available online: http://www.os.not.pl/docs/czasopismo/2013/4-2013/Kwietniewski_4-2013.pdf (accessed on 20 August 2025). (In Polish)
  70. Lambert, A.O.; McKenzie, R.D. Practical Experience in Using the Infrastructure Leakage Index. The International Water Association Conference ‘Leakage Management: A Practical Approach’ in Lemesos, Cyprus in November 2002. Available online: http://www.studiomarcofantozzi.it/IWACyprusNov2002Lambert&McKenziepaper.pdf (accessed on 2 September 2025).
  71. Lambert, A. Reliable Operational PIs for Real Losses. The LEAKSSuite Library. 2019. Available online: https://www.leakssuitelibrary.com/reliable-operational-pis-for-real-losses/ (accessed on 2 September 2025).
  72. Sakai, H. Review of research on performance indicators for water utilities. AQUA—Water Infrastruct. Ecosyst. Soc. 2024, 73, 168. [Google Scholar] [CrossRef]
  73. Musz-Pomorska, A.; Iwanek, M.; Parafian, K.; Wójcik, K. Analysis of water losses in two selected water distribution systems. E3S Web Conf. 2017, 17, 00062. [Google Scholar] [CrossRef]
Figure 1. The water balance (prepared based on [20,21,22]).
Water 18 00527 g001
Figure 2. The linear (red line), logarithmic (green), power (blue), and exponential (black) relationships between values of the ILI and calculated annual volumes of: (a) NRW; (b) WL; (c) RL (CARL); (d) AL.
Water 18 00527 g002
Figure 3. The linear (red line), logarithmic (green), exponential (black), and power (blue) relationships between values of the ILI and percentage WLPIs: (a) non-revenue water (NRW%); (b) total water losses (WL%); (c) real water losses (RL%); (d) apparent water losses (AL%).
Water 18 00527 g003
Figure 4. The linear (red line), logarithmic (green), exponential (black), and power (blue) relationships between ILI indexes and operational normalized basic WLPIs expressed in dm3 of water lost per kilometer of mains per day: (a) the non-revenue water (NRWb1); (b) the total water loss indicator (WLb1); (c) the real water loss indicator (RLb1); (d) the apparent water loss indicator (ALb1).
Water 18 00527 g004
Table 1. The characteristics of analyzed WDSs (based on [58,61]).
No. of WBLength of Mains,
Lm (km)
Length of Service Connections, Lp (km)Number of Service Connections, NcService Connections Density, D (conn./km)Average Operating Pressure,
p (m H2O)
1332.3 ± 3.4112.1 ± 1.29565 ± 95.728.8 ± 0.638.0 ± 1.9
2250.3 ± 2.5113.5 ± 1.210,067 ± 100.740.2 ± 0.840.0 ± 2.0
3262.7 ± 2.796.4 ± 1.07273 ± 72.827.7 ± 0.643.0 ± 2.2
41587.8 ± 15.9905.2 ± 9.155,287 ± 552.934.8 ± 0.740.8 ± 2.1
5191.3 ± 2.0172.6 ± 1.86321 ± 63.333.0 ± 0.750.0 ± 2.5
6376.5 ± 3.8243.7 ± 2.515,812 ± 158.242.0 ± 0.955.0 ± 2.8
7411.6 ± 4.2153.3 ± 1.614,163 ± 141.734.4 ± 0.730.0 ± 1.5
8141.5 ± 1.580.3 ± 0.86118 ± 61.243.2 ± 0.933.0 ± 1.7
9268.4 ± 2.796.0 ± 1.07365 ± 73.727.4 ± 0.645.0 ± 2.3
10193.1 ± 2.0184.7 ± 1.96922 ± 69.335.9 ± 0.840.7 ± 2.1
11155.7 ± 1.698.4 ± 1.04920 ± 49.231.6 ± 0.732.5 ± 1.7
12269.5 ± 2.7179.2 ± 1.86690 ± 66.924.8 ± 0.637.5 ± 1.9
Table 2. Data on system input volume (SIV), billed authorized consumption (BAC), unbilled authorized consumption (UAC), non-revenue water (NRW), and total losses for analyzed WDSs (on the basis of [58,61]). The random uncertainties were calculated at 95% confidence limits.
No. of WBSIV
(103 m3/year)
BAC
(103 m3/year)
UAC
(103 m3/year)
NRW
(103 m3/year)
NRW%
(%)
WL
(103 m3/year)
WL%
(%)
15825.9 ± 116.65362.4 ± 107.337.4 ± 7.5463.5 ± 158.48.0 ± 2.8426.1 ± 158.67.3 ± 2.8
26488.1 ± 129.85729.0 ± 114.6150.9 ± 30.2759.1 ± 173.211.7 ± 2.7608.2 ± 175.89.4 ± 2.8
37619.1 ± 152.47110.3 ± 142.3114.3 ± 22.9508.8 ± 208.56.7 ± 2.8394.5 ± 209.75.2 ± 2.8
416,563.4 ± 331.314,483.7 ± 289.7178.8 ± 35.82079.7 ± 440.112.6 ± 2.71900.9 ± 441.611.5 ± 2.7
51539.3 ± 30.81327.6 ± 26.616.8 ± 3.4211.7 ± 40.713.8 ± 2.71945.0 ± 40.812.7 ± 2.7
65864.8 ± 117.34546.8 ± 91.0109.1 ± 21.91318.0 ± 148.522.5 ± 2.61208.8 ± 150.120.6 ± 2.6
73566.0 ± 71.42803.0 ± 56.153.0 ± 10.6763.0 ± 90.821.4 ± 2.6710.0 ± 91.419.9 ± 2.6
82415.3 ± 48.42074.6 ± 41.564.9 ± 13.0340.6 ± 63.714.1 ± 2.7275.8 ± 65.011.4 ± 2.7
96988.5 ± 139.86536.1 ± 130.878.6 ± 15.8452.3 ± 191.46.5 ± 2.8373.7 ± 192.15.4 ± 2.8
101517.4 ± 30.41332.1 ± 26.78.0 ± 1.6185.2 ± 40.412.2 ± 2.7177.2 ± 40.511.7 ± 2.7
111462.7 ± 29.31085.8 ± 21.815.5 ± 3.1376.9 ± 36.525.8 ± 2.5361.4 ± 36.624.7 ± 2.5
121684.4 ± 33.71374.9 ± 27.528.6 ± 5.8309.5 ± 43.518.4 ± 2.6280.9 ± 43.916.7 ± 2.7
Table 3. Calculated values of real losses (RL and RL%), apparent losses (AL and AL%), unavoidable annual real losses (UARL), the infrastructure leakage index (ILI), and two components of apparent losses: the unauthorized consumption (UC) calculated as 0.2% of BAC, and sum of the water lost due to customer meter inaccuracies (CMIs) and data handling errors (DHEs), calculated as 2% of BAC. The random uncertainties were calculated at 95% confidence limits.
No. of WBRL = CARL
(103 m3/year)
RL%
(%)
UC
(103 m3/year)
CMIs + DHEs
(103 m3/year)
AL
(103 m3/year)
AL%
(%)
UARL
(103 m3/year)
ILI
(−)
1308.2 ± 160.05.3 ± 2.810.7 ± 2.2107.3 ± 21.5118.0 ± 21.62.0 ± 0.4214.9 ± 12.91.43 ± 0.84
2482.2 ± 177.37.4 ± 2.811.5 ± 2.3114.6 ± 23.0126.0 ± 23.12.0 ± 0.4210.3 ± 12.72.29 ± 0.99
3238.1 ± 211.73.1 ± 2.814.2 ± 2.9142.2 ± 28.5156.4 ± 28.62.1 ± 0.4192.1 ± 11.61.24 ± 1.18
41582.3 ± 445.49.6 ± 2.729.0 ± 5.8289.7 ± 58.0318.6 ± 58.31.9 ± 0.41340.3 ± 80.51.18 ± 0.41
5165.8 ± 41.210.8 ± 2.72.7 ± 0.626.6 ± 5.429.2 ± 5.41.9 ± 0.4222.5 ± 13.40.74 ± 0.23
61108.8 ± 151.218.9 ± 2.69.1 ± 1.990.9 ± 18.2100.0 ± 18.31.7 ± 0.4481.1 ± 28.92.30 ± 0.46
7648.3 ± 92.118.2 ± 2.65.6 ± 1.256.1 ± 11.361.7 ± 11.31.7 ± 0.4231.9 ± 14.02.80 ± 0.57
8230.1 ± 65.69.5 ± 2.84.2 ± 0.941.5 ± 8.345.6 ± 8.41.9 ± 0.4106.6 ± 6.42.16 ± 0.75
9229.9 ± 193.93.3 ± 2.813.1 ± 2.7130.7 ± 26.2143.8 ± 26.32.1 ± 0.4203.6 ± 12.31.13 ± 1.02
10147.9 ± 40.89.8 ± 2.72.7 ± 0.626.6 ± 5.429.3 ± 5.41.9 ± 0.4192.4 ± 11.60.77 ± 0.26
11337.5 ± 36.923.1 ± 2.62.2 ± 0.521.7 ± 4.423.9 ± 4.41.6 ± 0.3103.4 ± 6.23.26 ± 0.56
12250.6 ± 44.314.9 ± 2.72.8 ± 0.627.5 ± 5.530.3 ± 5.61.8 ± 0.4192.0 ± 11.61.31 ± 0.31
Table 4. Calculated values of basic operational normalized (unit) water loss performance indicators. Denotations: NRW—non-revenue water, WL—total losses, RL—real losses, AL—apparent losses; denotations of subscripts: b—basic index; 1, 2—the unit type. The random uncertainties were calculated at 95% confidence limits.
No. of WBNRWb1 (m3/(km mains·d))NRWb2 (dm3/(conn. ·d))WLb1 (m3/(km mains·d))WLb2 (dm3/(conn. ·d))RLb1
(m3/(km mains·d))
RLb2
(dm3/(conn. ·d))
ALb1
(m3/(km mains·d))
ALb2
(dm3/(conn. ·d))
13.8 ± 1.4132.8 ± 45.43.51 ± 1.31122.6 ± 45.52.54 ± 1.3288.3 ± 45.90.97 ± 0.1833.79 ± 6.18
28.3 ± 1.9206.6 ± 47.26.66 ± 1.93165.5 ± 47.95.28 ± 1.94131.2 ± 48.31.38 ± 0.2634.30 ± 6.27
35.3 ± 2.2191.7 ± 78.64.11 ± 2.19148.6 ± 79.02.48 ± 2.2189.7 ± 79.81.63 ± 0.3058.93 ± 10.77
43.6 ± 0.8103.1 ± 21.93.28 ± 0.7794.2 ± 21.92.73 ± 0.7778.4 ± 22.10.55 ± 0.1015.79 ± 2.89
53.0 ± 0.691.8 ± 17.72.79 ± 0.5984.5 ± 17.72.37 ± 0.5971.8 ± 17.90.42 ± 0.0812.66 ± 2.32
69.6 ± 1.1228.4 ± 25.88.80 ± 1.10209.5 ± 26.08.07 ± 1.10192.1 ± 26.20.73 ± 0.1417.33 ± 3.17
75.1 ± 0.7147.6 ± 17.64.73 ± 0.61137.3 ± 17.74.32 ± 0.62125.4 ± 17.90.41 ± 0.0811.93 ± 2.18
86.6 ± 1.3152.5 ± 28.65.34 ± 1.26123.5 ± 29.24.46 ± 1.27103.1 ± 29.40.88 ± 0.1720.44 ± 3.74
94.6 ± 2.0168.3 ± 71.23.81 ± 1.97139.0 ± 71.52.35 ± 1.9885.5 ± 72.11.47 ± 0.2753.49 ± 9.78
102.6 ± 0.673.3 ± 16.02.51 ± 0.5870.1 ± 16.02.10 ± 0.5858.5 ± 16.20.42 ± 0.0811.60 ± 2.12
116.6 ± 0.7209.9 ± 20.36.36 ± 0.65201.3 ± 20.45.94 ± 0.65188.0 ± 20.60.42 ± 0.0813.30 ± 2.43
123.2 ± 0.5126.8 ± 17.92.86 ± 0.45115.0 ± 18.02.55 ± 0.45102.6 ± 18.20.31 ± 0.0612.39 ± 2.27
Table 5. Calculated values of intermediate operational normalized (unit) water loss performance indicators. Denotations: NRW—non-revenue water, WL—total losses, RL—real losses, AL—apparent losses; denotations of subscripts: i—intermediate index; 1, 2—the unit type. The random uncertainties were calculated at 95% confidence limits.
No. of WBNRWi1 (m3/(km mains·d· 1mH2O))NRWi2 (dm3/(conn. ·d·1mH2O))WLi1
(m3/(km mains·d· 1mH2O))
WLi2 (dm3/(conn. ·d·1mH2O))RLi1
(m3/(km mains·d· 1mH2O))
RLi2
(dm3/(conn. ·d·1mH2O))
ALi1
(m3/(km mains·d· 1mH2O))
ALi2
(dm3/(conn. ·d·1mH2O))
10.101 ± 0.0353.49 ± 1.200.092 ± 0.0353.21 ± 1.200.067 ± 0.0352.32 ± 1.210.026 ± 0.0050.89 ± 0.17
20.208 ± 0.0485.16 ± 1.180.166 ± 0.0494.14 ± 1.200.132 ± 0.0493.28 ± 1.210.034 ± 0.0070.86 ± 0.16
30.123 ± 0.0514.46 ± 1.830.096 ± 0.0513.46 ± 1.840.058 ± 0.0522.09 ± 1.860.038 ± 0.0071.37 ± 0.26
40.088 ± 0.0192.53 ± 0.540.080 ± 0.0192.31 ± 0.540.067 ± 0.0191.92 ± 0.550.013 ± 0.0030.39 ± 0.08
50.061 ± 0.0121.84 ± 0.360.056 ± 0.0121.69 ± 0.360.047 ± 0.0121.44 ± 0.360.008 ± 0.0020.25 ± 0.05
60.174 ± 0.0204.15 ± 0.470.160 ± 0.0203.81 ± 0.480.147 ± 0.0203.49 ± 0.480.013 ± 0.0030.32 ± 0.06
70.169 ± 0.0214.92 ± 0.590.158 ± 0.0214.58 ± 0.590.144 ± 0.0214.18 ± 0.600.014 ± 0.0030.40 ± 0.08
80.200 ± 0.0384.62 ± 0.870.162 ± 0.0393.74 ± 0.890.135 ± 0.0393.12 ± 0.890.027 ± 0.0050.62 ± 0.12
90.103 ± 0.0443.74 ± 1.590.085 ± 0.0443.09 ± 1.590.052 ± 0.0441.90 ± 1.610.033 ± 0.0061.19 ± 0.22
100.065 ± 0.0151.80 ± 0.400.062 ± 0.0151.72 ± 0.400.052 ± 0.0151.44 ± 0.400.010 ± 0.0020.29 ± 0.06
110.204 ± 0.0206.46 ± 0.630.196 ± 0.0206.19 ± 0.630.183 ± 0.0205.78 ± 0.640.013 ± 0.0030.41 ± 0.08
120.084 ± 0.0123.38 ± 0.480.076 ± 0.0123.07 ± 0.480.068 ± 0.0122.74 ± 0.490.008 ± 0.0020.33 ± 0.07
Table 6. The summary of coefficients describing the correlation between ILI indexes and all water loss performance indicators (WLPIs): Pearson’s correlation coefficients (r), determination coefficients (R2), and root mean squared errors (RMSE).
WLPIUnit rR2RMSEWLPIUnit rR2RMSE
Volume of Water Lost per YearBasic Water Loss Performance Indicators as a Percentage of SIV
NRW103 m3/year0.10000.01000.7818NRW%%0.71000.50410.5526
WL0.10490.01100.7806WL%0.67550.45630.5785
RL0.16520.02730.7739RL%0.67640.45750.5780
AL−0.23390.05470.7629AL%−0.71000.50410.5526
Operational basic water loss indicators in water volume
per km of mains per day
Operational basic water loss indicators in water volume
per connection per day
NRWb1m3/(km mains·d)0.70590.49830.5558NRWb2dm3/(conn.·d)0.68690.47180.6517
WLb10.75700.57300.5127WLb20.76870.59090.5019
RLb10.79490.63190.4761RLb20.85650.73360.4050
ALb1−0.10580.01120.7802ALb2−0.22490.05060.7645
Operational intermediate water loss indicators in water volume
per km of mains per day per mH2O
Operational intermediate water loss indicators in water volume
per connection per day per mH2O
NRWi1m3/(km mains·d· mH2O)0.90540.81980.3331NRWi2dm3/(conn.·d·m H2O)0.89300.79750.3531
WLi10.96600.93320.2028WLi20.94020.88390.2673
RLi10.97520.95100.1737RLi20.96770.93650.1976
ALi10.01001E-040.7846ALi2−0.13420.01800.7775
Disclaimer/Publisher’s Note: The statements, opinions and data contained in all publications are solely those of the individual author(s) and contributor(s) and not of MDPI and/or the editor(s). MDPI and/or the editor(s) disclaim responsibility for any injury to people or property resulting from any ideas, methods, instructions or products referred to in the content.