Article

Enhancing Detection of Pharmaceuticals in Environmental Waters via 3D-Printed Extraction and ESI-HPLC-MS/MS

by
Verónica Rodríguez-Saldaña
1,†,
César Castro-García
1,2,†,
Jennifer M. Luna-Díaz
1,2,
Rogelio Rodríguez-Maese
1 and
Luz O. Leal-Quezada
1,*
1
Centro de Investigación en Materiales Avanzados, S.C. (CIMAV), Av. Miguel de Cervantes 120, Chihuahua C.P. 31136, Mexico
2
Environmental Analytical Chemistry Group, University of Balearic Islands, Cra. Valldemossa 7.5 km, 07122 Palma de Mallorca, Spain
*
Author to whom correspondence should be addressed.
These authors contributed equally to this work.
Water 2026, 18(4), 501; https://doi.org/10.3390/w18040501
Submission received: 3 December 2025 / Revised: 31 January 2026 / Accepted: 11 February 2026 / Published: 17 February 2026

Abstract

Ibuprofen (IBU), paracetamol (PARA), and diclofenac (DIC) are three of the most used non-opioid analgesics and are most frequently detected in the environment. Some methods to analyze these compounds in water have been previously reported, but they have limitations such as long analysis time, high reagent consumption, and lack of sensitivity. An electrospray ionization high-performance liquid chromatography–mass spectrometry (ESI-HPLC-MS/MS)-based method was developed for the determination of these analgesics, applying 3D printing to improve the extraction process. The method was validated and applied to quantify the target pharmaceuticals using commercial tablets. For PARA and DIC, a gradient elution with 0.1% formic acid in water (A) and 0.1% formic acid in acetonitrile (B) was employed. For the analysis of IBU, an isocratic elution with 10 mM acetate in water (A) and acetonitrile (B) was used. ESI-MS/MS spectra were obtained in positive polarity to identify DIC and PARA, while negative polarity was used for IBU. LOD were 40.91, 3.64, and 1.96, and the LOQ were 136.36, 12.15, and 6.52 ng/L for IBU, PARA, and DIC, respectively. R2 was >0.99 and RSD < 10% in all cases. The 3D-printed extraction device can be used for up to 10 cycles. This method demonstrated a remarkable performance compared to previous studies, mainly in terms of precision (RSD = 0.6–4.16%), mobile phase consumption (4 mL), and analysis time (<7 min), and was applied in the analysis of surface water samples.

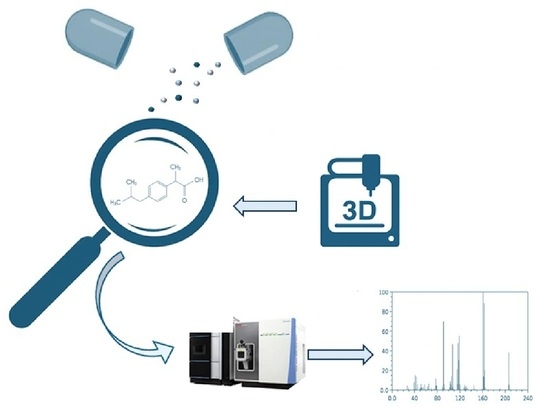
Graphical Abstract

1. Introduction

Non-steroidal anti-inflammatory drugs (NSAIDs), commonly used as analgesics, provide pain relief and reduce inflammation with minor adverse effects [1,2,3,4,5]. The most frequently detected NSAIDs in the environment include diclofenac (DIC) and ibuprofen (IBU) [6,7]. Recently, there has been a growing interest in emerging contaminants, particularly pharmaceuticals, used in human and veterinary medicine [2,3]. Some studies show that NSAIDs persist in effluents in wastewater treatment plants, ranging from a few ng/L to several µg/L [8]. NSAIDs can enter the environment through discharge from wastewater and hospital treatment plants, and directly from pharmaceutical industries [9,10,11]. In most countries, there are no current regulations for the levels of NSAIDs in water [4].
While not classified as an NSAID, acetaminophen (paracetamol; PARA) is commonly associated with them because of its analgesic and antipyretic effects, and it is one of the most used over-the-counter pain relievers. NSAIDs and PARA are found in rivers, lakes, and drinking water sources worldwide, and due to their ubiquitous presence in aquatic environments and ecotoxic effects on organisms, they are emerging contaminants of concern [12,13,14,15]. Another problem is that these drugs have been produced on a large scale worldwide, and most importantly, they are sold without a prescription in almost all countries [16,17].
Given the widespread use of these pollutants in the environment, it is imperative to establish methodologies capable of their detection; however, their low concentrations in the environment, as well as the presence of other contaminants in the water, can make their detection and regulation challenging [18]. Some emerging technologies have been used recently in the monitoring of water quality and the determination of pharmaceuticals in water. 3D printing has been one of the most versatile technologies in this sense, as it can be customized, miniaturized, and reused [19,20]. The 3D-printed extraction devices, such as pipettes with integrated extraction resins, microextraction fibers, and sorbent-based devices, are used to process and preconcentrate analytes from the sample and improve the analysis, helping with the low concentration and the matrix interference challenges.
Moreover, liquid chromatography–tandem mass spectrometry (LC-MS/MS) has largely replaced previous chromatographic techniques, offering superior selectivity, sensitivity, and faster analysis times [21,22,23,24]. There is a need to incorporate emerging technologies into sample processing and preconcentration to reduce sample volume and waste, minimize solvent use, and decrease hazard exposure, while improving the sensitivity of the analysis method.
In addition to the technical considerations, environmental sustainability is increasingly becoming a critical factor in the development of analytical methods. Considering this, the AGREE tool (a green analytical chemistry evaluation) is employed to assess the environmental impact of the developed methods, focusing on factors such as waste production, energy consumption, and the use of hazardous materials. This tool helps to evaluate the “greenness” of an analytical approach and guide the design of more sustainable methodologies. This study aimed to develop, optimize, and apply a methodology that integrates 3D printing along with LC-MS/MS analysis to determine three non-opioid analgesics of major environmental concern and most frequently encountered in aquatic ecosystems: DIC, IBU, and PARA, with emphasis on improving precision and reducing mobile phase consumption and analysis time.

2. Materials and Methods

2.1. Reagents and Standard Solutions

Individual analytical-grade standards of IBU, PARA, and DIC (sodium salt) (purity > 99% for the 3 standards), acetonitrile, methanol, formic acid (all of three LC-MS/MS grade), ammonium acetate (purity > 99%), polyvinylidene fluoride (PVDF, MW ~ 180.000), water (LC-MS/MS grade), 1.5 mL HPLC vials, and syringe filters with nylon membrane (pore size of 0.22 µm) were all purchased from Sigma-Aldrich (Sigma-Aldrich Chem. Co., Saint Louis, MO, USA) and were used during method development and validation. For method evaluation, commercial tablets of IBU (800 mg), PARA (750 mg), and DIC (200 mg) were pulverized using a ceramic mortar. Subsequently, 20 mL of methanol was used to solubilize the compounds, and the solution was filtered using 0.22 μm nylon syringe filters. Then, dilutions were performed to adjust the PARA concentration to 25 ng/mL and the concentrations of IBU and DIC to 50 ng/mL.
Standard solutions of the analytes were prepared by diluting the stock solution (100 µg/mL) with methanol. Calibration points for each analyte (and for the 3 analytes mixture) ranged from 0.1 to 100 ng/mL.

2.2. Water Samples Collection

The environmental surface water samples were obtained from northern Mexico. Lagoon and river water samples were collected during the dry season (24°50′15″ N 104° 51′ 35″ W and 25°16′32″ N 103°44′ W, respectively). Samples were collected (n = 3 in each of the 3 sampling sites) using amber glass containers at a depth of 0.5 m. Samples were preserved at cool temperatures, transported to the lab, and kept at 4° C until analysis.

2.3. SPE Resins

Solid phase extraction (SPE) was performed comparing 3 different extraction resins that have been reported in the literature as most effective for preconcentration of analgesics: Oasis Hlb (60 mg, 3 mL), Oasis MCX (150 mg, 6 mL) from Waters Corp., (Milford, MA, USA), and C18 (500 mg, 3 mL; Hengoed, Mid-Glamorgan, UK) [25,26,27]. We also tested different configurations of volumes, time, and solvents for the SPE steps.

2.4. Elaboration of 3D-Printed Device

Rhinoceros® 6 software (McNeel & Associates) was used to design several extraction device prototypes, which were subsequently fabricated by stereolithography using a FormLabs Form 3 printer equipped with a 405 nm laser (Formlabs, Somerville, MA, USA). The devices were printed with clear photopolymer resin (Formlabs, Somerville, MA, USA). After selecting the most suitable extraction resin, it was used to coat the fabricated device.
The 3D-printed extraction device, operated in stirred-batch mode, consists of 205 layers of interconnected cubes created with a 0.05 mm resolution. The design of the device consisted of a pipette tip with an array of connected cubes (Supplementary Figure S1). These devices are printed within 50 min and require 0.59 milliliters of liquid resin.

2.5. LC-MS/MS Method Description

The analysis was performed using the Vanquish Binary Pump N system, connected to the QqQ TSQ Altis mass spectrometer (ThermoFisher Scientific, Waltham, MA, USA) with electrospray ionization (ESI). For chromatographic separation, a C18 column was used (100 mm, 4.6 mm I.D., 5 µm P.Z.). The mobile phase and elution conditions are listed in Table 1.

2.6. Optimization of Chromatographic and MS Conditions

Chromatographic conditions, such as the composition of the mobile phases, gradient, flow rate, and injection volume, were optimized to achieve the best analytical performance in terms of peak shape, chromatographic separation, and maximum signal-to-noise ratio, as well as to shorten analysis time. To determine the precursor and product ions of the analytes, 10 µL of standard solutions containing 100 ng/mL of the target compounds were directly injected into the mass spectrometer. To establish optimal parameters for the source and the instrument, we employed the ThermoFisher Source Optimizer (XCalibur 4.2 software package) (Table 2).

2.7. Method Validation

Selectivity, linearity, range, accuracy, precision, limits of detection (LOD), and limits of quantitation (LOQ) were determined according to international guidelines (ICH Q2(R1), 1996; IUPAC, 2002; FDA, 2013) [28,29,30]. To investigate potential interferences, 10 methanol blank samples were analyzed. A standard solution (0.1 ng/mL) was added, and the analyses were repeated to confirm the absence of compounds with similar masses/chromatographic peaks overlapping at the same retention time. The linearity and range were determined with three different concentration ranges (0.1–5, 10–100, and 0.1–100 ng/mL), aiming to ensure that the method would provide accurate and reliable results across the full spectrum of concentrations expected in real-world environmental samples, from trace contamination to more concentrated levels. The LOD and LOQ were calculated on the signal-to-noise ratio (S/N = 3 for LOD and 10 for LOQ) on the chromatograms of the lowest level used in the calibration curve [31,32]. The intra-day precision was determined using 3 concentration levels (1.0, 20, and 100 ng/mL; n = 6), while the inter-day precision was calculated with the same concentrations on 3 separate days. In addition, the matrix effect was evaluated by calculating the ratio between the analytical response of a standard 1 μg/L prepared in water and the response obtained when the analytes were present in wastewater.

2.8. Proof-of-Concept Application

The developed method was applied to analyze different types of surface water (n = 9). The samples were filtered using a No. 2 paper filter (Whatman, Maidstone, UK) to remove most organic matter particles, and we performed a second filtration process using 0.22 µm pore-size filters. Samples were subjected to an extraction procedure using the developed 3D-printed devices coated with the extraction resin Oasis Hlb. After the extraction, the eluates were placed into HPLC 1.5 mL vials before analysis.

3. Results and Discussion

3.1. Impregnation of Oasis Hlb Resin on the 3D-Printed Device

Oasis Hlb, which is composed of a specific ratio of two monomers, the hydrophilic N-vinylpyrrolidone and the lipophilic divinylbenzene (Waters Corporation), demonstrated the highest extraction efficiency for the analytes of interest and stability compared to the other resins, with % values of 91, 86, and 97 for paracetamol, ibuprofen, and diclofenac, respectively. The resin type and SPE conditions used in this work were adapted from a previously reported and validated protocol developed by members of our group [33], which served as the methodological basis for the present study.
The device’s resin coating was performed using the immobilization technique of “stick and cure” [34], which consisted of applying the Oasis Hlb resin on the printed device, carrying out the following steps: after printing out the device, it was washed with 2-propanol, repeating this process three times to remove uncured resin, and then dried with air flow until residual solvent is completely evaporated (approx. 1 min). After this step, the device was placed in a 50 mL centrifuge tube containing the Oasis Hlb resin, and the tube was shaken manually for about 2 min. Subsequently, the coated 3D-printed device was cured with UV crosslinking for 4 h to promote surface sealing and structural reinforcement. The final step is washing the coated device with Milli-Q water three times to remove any residuals of resin. The result is a 3D printed device coated with 40 ± 5 mg of Oasis Hlb resin (n = 10).

3.2. Final Protocol of SPE

The 3D-printed devices were employed for solid-phase extraction (SPE) of water samples, standards, and blank solutions. The procedure began with a conditioning step, where the 3D-printed device, coated with Oasis HLB resin, was conditioned using 3 mL of methanol followed by 3 mL of deionized water, with each step lasting 2 min. Next, the extraction and preconcentration step was carried out by submerging the device in 10 mL of the sample or standard solution for 25 min. To remove residual sample matrix, the device underwent a washing step, during which it was rinsed with 5 mL of 5% methanol in deionized water, maintaining a pH of 7. The elution step involved immersing the 3D-printed device in 5 mL of methanol/acetonitrile (60:40, v/v) for 10 min. The eluates were then collected and stored at 4 °C until analysis, which was performed by HPLC-MS according to the method described in the following section.

3.3. HPLC and MS/MS Conditions

The separation and detection of the analytes took <3 min, allowing separation efficiency while maintaining method speed. Conditions of collision energy and cone voltage were also optimized. The mass spectrogram of the 3 NSAIDs of interest is shown in Supplementary Figure S2a.

3.4. Method Validation Results

There were no chromatographic interferences observed at the retention time of the target compounds. The LOD obtained were 0.041, 0.004, and 0.002 (µg/L), and the LOQ were 0.136, 0.012, and 0.007 (µg/L) for IBU, PARA, and DIC, respectively. The overall mean recovery was between 96 and 103%. The analytical signal was linearly correlated in the concentration range of 10–100 ng/mL for IBU and 0.1–100 ng/mL for PARA and DIC, with R2 values of >0.996 (Supplementary Figure S2b) for the three compounds. The intra-day precision was <4.5% for all the target analytes, while the inter-day precision was <4.5, 10, and 7.5% for all the compounds of interest on days 1, 2, and 3, respectively (Table 3). The matrix effect (ME) values obtained for ibuprofen (IBU), paracetamol (PARA), and diclofenac (DIC) were −11, −17, and −14%, respectively, indicating a slight suppression of the analytical signal in wastewater samples. According to widely accepted criteria in analytical chemistry, matrix effects below 20% are considered acceptable for environmental water analysis.
These results confirm that the proposed method shows adequate robustness against matrix interferences, despite the complexity of wastewater matrices. The low ME values suggest that matrix components do not significantly affect the analytical performance, supporting the suitability of the method for the determination of the studied analytes in environmental water samples.

3.5. Method Evaluation

The determinations for the target analytes were compared with the actual values (Table 4). The maximum observed error was 3.4% (a mean recovery of 103.3% among the three target compounds), which is comparable with the recoveries reported in previous studies (from 65.5 to 102.0%, Table 5). The LOD obtained in this study was lower than previously reported, usually found in the range of µg/mL (Table 5). Another important aspect was mobile phase consumption. The overall consumption during the analysis was 4 mL, and the mobile phase flow rate was between 0.3 and 0.8 mL/min, which is also lower than or equal to the flow rate reported in the studies compared here (between 0.3 and 1.0 mL/min, not displayed in Table 5).

3.6. Proof-of-Concept Application Results

Surface water (lake and river; n = 9) samples from three sites were analyzed using the developed method. The results of the measurements are shown in Table 6. In site 1 (lake water samples), diclofenac was detectable in all the samples, paracetamol was present in about 66% of the samples, and ibuprofen remained below the detection limits (<0.04 µg/L). Only paracetamol was detected in one of the river samples (site 2), while the other target compounds were absent. Finally, in site 3 (lake water), ibuprofen was detected in two samples, diclofenac in one sample, and paracetamol remained below the limits of quantification. The highest concentrations in the surface water were found for ibuprofen (0.06 µg/L (61.5 ng/L)). Ibuprofen was one of the most used anti-inflammatory medicines, with more than 20% of the global NSAID sales, followed by diclofenac (which had the second-highest concentration in the samples) with around 17% [40]. Therefore, although both sampling areas are semi-restricted, the presence of these specific pharmaceuticals is consistent with an anthropogenic influence, such as originating from the nearby populations, and the high tourist affluence in the zones, potentially having an impact on the water quality.

3.7. Reusability of the 3D-Printed Devices

Furthermore, experiments were performed to assess the reusability of the 3D-printed device. Multiple aliquots of the same sample were analyzed using a single device over twenty consecutive runs of the analytical procedure. The resulting analytical responses, expressed as peak areas of PARA, were then compared. The outcomes obtained with five devices are encouraging, indicating that it can be reused for up to ten cycles. The analytical signal remained essentially stable during the first twelve runs, whereas a decrease of approximately 15% was observed in the final cycle (Figure 1).

3.8. Method Greenness Evaluation

The developed method was evaluated for environmental greenness or sustainability using the AGREE tool and compared with methodologies from other studies focused on the analysis of analgesics in water samples. The sections in the AGREE pictogram represent (1) sampling procedure, (2) amount of sample, (3) device positioning, (4) sample preparation steps, (5) degree of automation, (6) derivatization, (7) amount of waste, (8) number of analytes in a single run, (9) total power consumption, (10) type of reagents, (11) use of toxic reagents, (12) safety of the operator and the score ranges from 0 to one, with a higher score indicating a greener method (closer to one) [41]. The developed method obtained a score of 0.56, primarily affected by the offline analysis (less energy-efficient), the use of high-energy consumption equipment, such as HPLC-MS, and the amount of waste generated, and having some benefits such as miniaturization, few steps in the sample preparation procedure, high sample throughput, and the use of some bio-based reagents (Figure 2). Comparing this score with previously developed methods, we can observe that the score of the proposed method is higher than or equal to other recently developed methodologies for the analysis of analgesics in water samples, with AGREE scores ranging from 0.49 to 0.58 [42,43,44,45].

4. Conclusions

The developed method, based on 3D printing technology, SPE, and LC-MS/MS, has demonstrated high precision and reliability in quantifying IBU, PARA, and DIC, even at ultra-trace concentrations. These concentrations are particularly relevant for environmental monitoring due to the low concentrations of these compounds in the environment, especially in surface water from protected areas. The current methodology offers advantages compared to previously reported methods for the analysis of these compounds, whether analyzed separately or simultaneously, following pre-concentration with SPE. Some of these benefits include a reduction in analysis time, with the method allowing for efficient separation of the target compounds in less than 7 min (3 min for ESI+ and 4 min for ESI−), lowered reagent volume, requiring minimal mobile phase consumption (4 mL per analysis), and remarkable sensitivity, reaching very low limits of detection and among the lowest RSD values (see Table 5). It is important to acknowledge that although the proposed method showed satisfactory precision and limited matrix effects for the evaluated environmental waters, the use of isotopically labeled internal standards could further improve accuracy and robustness, particularly for applications involving more complex wastewater matrices. Finally, the proof-of-concept application of the developed methodology for analyzing water samples demonstrated its potential for monitoring surface water bodies for the presence of the pharmaceuticals of interest; however, a more extensive monitoring study is required to fully assess the method’s robustness and reliability across a broader range of environmental conditions. This method will be further evaluated in future studies with more complex matrices, such as wastewater samples.

Supplementary Materials

The following supporting information can be downloaded at: https://www.mdpi.com/article/10.3390/w18040501/s1, Figure S1: PreForm® Software view of the 3D printed designs (a) customized pipets; (b) tips made of a network of interconnected cubes; Figure S2: (a) Characteristic ion mass chromatograms of IBU, PARA, and DIC. (b) Calibration curves of (A) Ibuprofen; (B) Paracetamol and (C) Diclofenac.

Author Contributions

V.R.-S.: project administration, conceptualization, investigation, writing—original draft preparation; C.C.-G.: conceptualization, investigation, formal analysis, writing—original draft preparation; J.M.L.-D.: investigation, writing—review and editing; R.R.-M.: writing—review and editing; L.O.L.-Q.: project administration, writing—review and editing, funding acquisition. All authors have read and agreed to the published version of the manuscript.

Funding

We want to thank the Centro de Investigación en Materiales Avanzados, S.C. (CIMAV) for providing financial support. C.C.-G., M.L.-D., and V.R.-S. are supported by SECIHTI doctorate and postdoctoral fellowship programs, respectively, and the Fondo Estatal de Ciencia, Tecnología e Innovación of Gobierno del Estado de Chihuahua (Mexico) funding project FECTI/2024/CV-CDF/015.

Data Availability Statement

The original contributions presented in this study are included in the article/Supplementary Materials. Further inquiries can be directed to the corresponding author.

Conflicts of Interest

The authors declare that no competing financial interests or personal relationships could have influenced the work reported in this paper.

References

  1. Mejías, C.; Martín, J.; Santos, J.L.; Aparicio, I.; Alonso, E. Occurrence of pharmaceuticals and their metabolites in sewage sludge and soil: A review on their distribution and environmental risk assessment. Trends Environ. Anal. Chem. 2021, 30, e00125. [Google Scholar] [CrossRef]
  2. Świacka, K.; Maculewicz, J.; Kowalska, D.; Caban, M.; Smolarz, K.; Świeżak, J. Presence of pharmaceuticals and their metabolites in wild-living aquatic organisms—Current state of knowledge. J. Hazard. Mater. 2022, 424, 127350. [Google Scholar] [CrossRef]
  3. Sathishkumar, P.; Meena, R.A.A.; Palanisami, T.; Ashokkumar, V.; Palvannan, T.; Gu, F.L. Occurrence, interactive effects and ecological risk of diclofenac in environmental compartments and biota—A review. Sci. Total Environ. 2020, 698, 134057. [Google Scholar] [CrossRef]
  4. Lin, J.Y.; Zhang, Y.; Bian, Y.; Zhang, Y.X.; Du, R.Z.; Li, M.; Tan, Y.; Feng, X.S. Non-steroidal anti-inflammatory drugs (NSAIDs) in the environment: Recent updates on the occurrence, fate, hazards and removal technologies. Sci. Total Environ. 2023, 904, 166897. [Google Scholar] [CrossRef] [PubMed]
  5. Smith, H.S. Potential analgesic mechanisms of acetaminophen. Pain Physician 2009, 12, 269–280. [Google Scholar] [CrossRef] [PubMed]
  6. Naidu, R.; Espana, V.A.A.; Liu, Y.; Jit, J. Emerging contaminants in the environment: Risk-based analysis for better management. Chemosphere 2016, 154, 350–357. [Google Scholar] [CrossRef] [PubMed]
  7. Jurado, A.; Vázquez-Suñé, E.; Pujades, E. Urban Groundwater Contamination by Non-Steroidal Anti-Inflammatory Drugs. Water 2021, 13, 720. [Google Scholar] [CrossRef]
  8. Feo, M.L.; Bagnati, R.; Passoni, A.; Riva, F.; Manta, D.S.; Sprovieri, M.; Traina, A.; Zuccato, E.; Castiglioni, S. Pharmaceuticals and other contaminants in waters and sediments from Augusta Bay (southern Italy). Sci. Total Environ. 2020, 739, 139827. [Google Scholar] [CrossRef]
  9. Paíga, P.; Santos, L.H.; Ramos, S.; Jorge, S.; Silva, J.G.; Delerue-Matos, C. Presence of pharmaceuticals in the Lis river (Portugal): Sources, fate and seasonal variation. Sci. Total Environ. 2016, 573, 164–177. [Google Scholar] [CrossRef]
  10. Aus der Beek, T.; Weber, F.A.; Bergmann, A.; Hickmann, S.; Ebert, I.; Hein, A.; Küster, A. Pharmaceuticals in the environment—Global occurrences and perspectives. Environ. Toxicol. Chem. 2016, 35, 823–835. [Google Scholar] [CrossRef]
  11. Bagnis, S.; Fitzsimons, M.F.; Snape, J.; Tappin, A.; Comber, S. Processes of distribution of pharmaceuticals in surface freshwaters: Implications for risk assessment. Environ. Chem. Lett. 2018, 16, 1193–1216. [Google Scholar] [CrossRef]
  12. Rastogi, A.; Tiwari, M.K.; Ghangrekar, M.M. A review on environmental occurrence, toxicity and microbial degradation of Non-Steroidal Anti-Inflammatory Drugs (NSAIDs). J. Environ. Manag. 2021, 300, 113694. [Google Scholar] [CrossRef]
  13. Ying, G.G.; Zhao, J.L.; Zhou, L.J.; Liu, S. Fate and Occurrence of Pharmaceuticals in the Aquatic Environment (Surface Water and Sediment). In Comprehensive Analytical Chemistry, 2nd ed.; Elsevier B.V.: Amsterdam, The Netherlands, 2013. [Google Scholar] [CrossRef]
  14. Fekadu, S.; Alemayehu, E.; Dewil, R.; Van der Bruggen, B. Pharmaceuticals in freshwater aquatic environments: A comparison of the African and European challenge. Sci. Total Environ. 2019, 654, 324–337. [Google Scholar] [CrossRef]
  15. Parolini, M. Toxicity of the Non-Steroidal Anti-Inflammatory Drugs (NSAIDs) acetylsalicylic acid, paracetamol, diclofenac, ibuprofen and naproxen towards freshwater invertebrates: A review. Sci. Total Environ. 2020, 740, 140043. [Google Scholar] [CrossRef]
  16. Wilkinson, J.; Hooda, P.S.; Barker, J.; Barton, S.; Swinden, J. Occurrence, fate and transformation of emerging contaminants in water: An overarching review of the field. Environ. Pollut. 2017, 231, 954–970. [Google Scholar] [CrossRef]
  17. Awodele, O.; Fadipe, A.O.; Adekoya, M.; Adeyemi, O.O. Prescribing Pattern of Non-Steroidal Anti-Inflammatory Drugs at the Outpatient Pharmacy Department of a University Teaching Hospital in Nigeria. Ghana. Med. J. 2015, 49, 25–29. [Google Scholar] [CrossRef]
  18. Izadi, P.; Izadi, P.; Salem, R.; Papry, S.A.; Magdouli, S.; Pulicharla, R.; Brar, S.K. Non-steroidal anti-inflammatory drugs in the environment: Where were we and how far we have come? Environ. Pollut. 2020, 267, 115370. [Google Scholar] [CrossRef]
  19. Nadagouda, M.N.; Ginn, M.; Rastogi, V. A review of 3D printing techniques for environmental applications. Curr. Opin. Chem. Eng. 2020, 28, 173–178. [Google Scholar] [CrossRef] [PubMed]
  20. Rodriguez-Saldana, V.; Castro-Garcia, C.; Rodriguez-Maese, R.; Leal-Quezada, L.O. Advances in the extraction methods for the environmental analysis of non-steroidal anti-inflammatory drugs (NSAIDs). TrAC Trends Anal. Chem. 2023, 169, 117409. [Google Scholar] [CrossRef]
  21. Rodriguez-Mozaz, S.; de Alda, M.J.L.; Barceló, D. Advantages and limitations of on-line solid phase extraction coupled to liquid chromatography-mass spectrometry technologies versus biosensors for monitoring of emerging contaminants in water. J. Chromatogr. A 2007, 1152, 97–115. [Google Scholar] [CrossRef]
  22. Primel, E.G.; Caldas, S.S.; Escarrone, A.L.V. Multi-residue analytical methods for the determination of pesticides and PPCPs in water by LC-MS/MS: A review. Cent. Eur. J. Chem. 2012, 10, 876–899. [Google Scholar] [CrossRef]
  23. Topuz, E.; Sari, S.; Ozdemir, G.; Aydin, E.; Pehlivanoglu-Mantas, E.; Tas, D.O. Optimization of diclofenac quantification from wastewater treatment plant sludge by ultrasonication assisted extraction. J. Chromatogr. B 2014, 958, 48–54. [Google Scholar] [CrossRef]
  24. Ashfaq, M.; Li, Y.; Wang, Y.; Chen, W.; Wang, H.; Chen, X.; Wu, W.; Huang, Z.; Yu, C.P.; Sun, Q. Occurrence, fate, and mass balance of different classes of pharmaceuticals and personal care products in an anaerobic-anoxic-oxic wastewater treatment plant in Xiamen, China. Water Res. 2017, 123, 655–667. [Google Scholar] [CrossRef]
  25. Karubothula, B.; Kota, V.V.; Shinde, D.; Tadala, R.; Cheerala, V.; Salem, S.B.; Elamin, W.F.; Brudecki, G. Next-Generation Wastewater-Based Epidemiology: Green Automation for Detecting 69 Multiclass Pharmaceutical and Personal Care Products in Wastewater Using 96-Well Plate Solid-Phase Extraction by LC-MS/MS. Molecules 2025, 30, 3694. [Google Scholar] [CrossRef]
  26. Gros, M.; Petrović, M.; Barceló, D. Development of a multi-residue analytical methodology based on liquid chromatography–tandem mass spectrometry (LC–MS/MS) for screening and trace level determination of pharmaceuticals in surface and wastewaters. Talanta 2006, 70, 678–690. [Google Scholar] [CrossRef]
  27. Manzo, V.; Honda, L.; Navarro, O.; Ascar, L.; Richter, P. Microextraction of non-steroidal anti-inflammatory drugs from wastewater samples by rotating-disk sorptive extraction. Talanta 2014, 128, 486–492. [Google Scholar] [CrossRef]
  28. ICH Q2(R1). Validation of Analytical Procedures: Text and Methodology; International Conference on Harmonisation (ICH): Geneva, Switzerland, 1996. [Google Scholar]
  29. IUPAC. Harmonized Guidelines for the Use of Performance Characteristics in Method Validation; Pure and Applied Chemistry: Geneva, Switzerland, 2002. [Google Scholar]
  30. FDA. Guidance for Industry: Bioanalytical Method Validation; U.S. Food and Drug Administration (FDA): Rockville, MD, USA, 2013.
  31. McNaught, A.D.; Wilkinson, A. Compendium of Chemical Terminology-Gold Book; IUPAC: Zürich, Switzerland, 2012; p. 1670. [Google Scholar] [CrossRef]
  32. Olech, M.; Pietrzak, W.; Nowak, R. Characterization of Free and Bound Phenolic Acids and Flavonoid Aglycones in Rosa rugosa Thunb. Leaves and Achenes Using LC–ESI–MS/MS–MRM Methods. Molecules 2020, 25, 1804. [Google Scholar] [CrossRef] [PubMed]
  33. Castro-García, C.; Palermo, A.; Palacio, E.; Leal, L.O.; Ferrer, L. In-situ simultaneous extraction of non-steroidal anti-inflammatory drugs from wastewater using 3D-printed device and UHPLC-DAD/FLD analysis. Adv. Sample Prep. 2025, 16, 100210. [Google Scholar] [CrossRef]
  34. Calderilla, C.; Maya, F.; Cerdà, V.; Leal, L.O. Direct photoimmobilization of extraction disks on “green state” 3D printed devices. Talanta 2019, 202, 67–73. [Google Scholar] [CrossRef]
  35. Pereira, F.J.; Rodríguez-Cordero, A.; López, R.; Robles, L.C.; Aller, A.J. Development and validation of an RP-HPLC-PDA method for determination of paracetamol, caffeine and tramadol hydrochloride in pharmaceutical formulations. Pharmaceuticals 2021, 14, 466. [Google Scholar] [CrossRef] [PubMed]
  36. Zhou, S.; Zhao, T.; Wang, J.; Wang, L.; Zhang, Z.; Zhu, J.; Zhao, Y.; Zhu, Y.; Sun, H.; Shao, F. Rapid identification of potential nonsteroidal anti-inflammatory drug overdose–induced liver toxicity and prediction of follow-up exposure: Integrating bioanalytical and population pharmacokinetic assay. Biomed. Chromatogr. 2024, 38, e5877. [Google Scholar] [CrossRef]
  37. Gallego-Ríos, S.E.; Peñuela, G.A. Evaluation of ibuprofen and diclofenac in the main rivers of Colombia and striped catfish Pseudoplatystoma magdaleniatum. Environ. Monit. Assess. 2021, 193, 210. [Google Scholar] [CrossRef]
  38. Sibeko, P.A.; Naicker, D.; Mdluli, P.S.; Madikizela, L.M. Naproxen, ibuprofen, and diclofenac residues in river water, sediments and Eichhornia crassipes of Mbokodweni river in South Africa: An initial screening. Environ. Forensics 2019, 20, 129–138. [Google Scholar] [CrossRef]
  39. Ngubane, N.P.; Naicker, D.; Ncube, S.; Chimuka, L.; Madikizela, L.M. Determination of naproxen, diclofenac and ibuprofen in Umgeni estuary and seawater: A case of northern Durban in KwaZulu–Natal Province of South Africa. Reg. Stud. Mar. Sci. 2019, 29, 100675. [Google Scholar] [CrossRef]
  40. Conaghan, P.G. A turbulent decade for NSAIDs: Update on current concepts of classification, epidemiology, comparative efficacy, and toxicity. Rheumatol. Int. 2012, 32, 1491–1502. [Google Scholar] [CrossRef] [PubMed]
  41. Pena-Pereira, F.; Wojnowski, W.; Tobiszewski, M. AGREE—Analytical GREEnness metric approach and software. Anal. Chem. 2020, 92, 10076–10082. [Google Scholar] [CrossRef]
  42. Elbalkiny, H.T.; El-Zeiny, M.B.; Saleh, S.S. Analysis of commonly prescribed analgesics using in-silico processing of spectroscopic signals: Application to surface water and industrial effluents, and comparative study via green and white assessments. Environ. Chem. 2023, 19, 446–459. [Google Scholar] [CrossRef]
  43. Zang, L.; He, M.; Wu, Z.; Chen, B.; Hu, B. Imine-linked covalent organic frameworks coated stir bar sorptive extraction of non-steroidal anti-inflammatory drugs from environmental water followed by high performance liquid chromatography-ultraviolet detection. J. Chromatogr. A 2021, 1659, 462647. [Google Scholar] [CrossRef] [PubMed]
  44. Hsen, E.B.; Latrous, L. Magnetic solid-phase extraction based on magnetite-multiwalled carbon nanotubes of non-steroidal anti-inflammatories from water followed by LC–ESI–MS/MS. J. Chromatogr. Sci. 2023, 61, 186–194. [Google Scholar] [CrossRef]
  45. Castro-García, C.; Palacio, E.; Rodríguez-Maese, R.; Leal, L.O.; Ferrer, L. Green On-Site Diclofenac Extraction from Wastewater Matrices Using a 3D-Printed Device Followed by PTV-GC-MS Determination. Chemosensors 2025, 13, 212. [Google Scholar] [CrossRef]
Figure 1. Maximum number of cycles of use per 3D-printed device. The vertical lines at each data point indicate the variability in the peak area measurements across the runs.
Water 18 00501 g001
Figure 2. AGREE pictograms comparison of this study and other studies reported for the analysis of analgesics in water samples [42,43,44,45].
Water 18 00501 g002
Table 1. Gradient elution conditions used for chromatography.
ESI+: PARA and DIC
Time (min)011.523
Eluent (A)Ultrapure water + 0.1% formic acid (vol./vol.)20%20%100%20%20%
Eluent (B)Acetonitrile
+0.1% formic acid (vol./vol.)
80%80%0%80%80%
Flow(mL/min)0.80.80.80.80.8
ESI−: IBU
Time (min)04
Eluent (A)Ultrapure water + 10 mM ammonium acetate10%10%
Eluent (B)Acetonitrile90%90%
Flow(mL/min)0.30.3
Table 2. Conditions used for mass spectrometry.
CompoundIonization Mode
(ESI)
Precursorion
(m/z)
Production
(m/z)
Dwell Time
(ms)
CE (V)Source Parameters
Paracetamol+152.01quantifier 110.110016.64Ionization mode+
(PARA, DIC)

(IBU)
qualifier 93.110018.2capillary voltage (V)3790.93727.2
Diclofenac+296.21quantifier 215.110018.9ion transfer tube temperature (°C)120170
qualifier 250.110012.5vaporizer temperature (°C)35050
Ibuprofen205.0quantifier 161.21006.6sheath gas (u.a.)31.80.8
Auxiliary gas (u.a.)24.83.7
Note(s): ESI: electrospray ionization; m/z: mass-to-charge ratio; ms: milliseconds; V: voltage.
Table 3. Intra- and inter-day precision (n = 6) by concentration level and target compounds.
Intra-Day PrecisionInter-Day Precision
Day 1Day 2Day 3
CompoundLevel (ng/mL)CV (%)Level (ng/mL)CV (%)CV (%)CV (%)
Ibuprofen14.4914.494.095.24
204.16204.164.167.48
1001.481001.481.803.73
Paracetamol13.2213.229.743.01
201.89201.899.920.70
1001.361001.363.091.26
Diclofenac14.5114.514.832.57
201.83201.834.211.19
1000.601000.601.271.01
Table 4. Percent error of theoretical vs. measured concentrations for each target compound (n = 3).
Diclofenac 50 µg/LParacetamol 25 µg/LIbuprofen 50 µg/L
nAreaMeasured
Concentration
AreaMeasured
Concentration
AreaMeasured
Concentration
1548,515.0050.73539,512.7126.0131,943.0050.90
2564,857.0052.01525,855.0525.5632,546.0051.83
3568,956.0052.33537,809.7225.9632,897.0052.37
Average51.6025.8451.70
Error %3.303.373.40
Table 5. Comparison of validation parameters reported by previous studies focused on non-opioid analgesics in water samples and the current study *.
CompoundTechniqueR2Linear Range
(µg/mL, Otherwise Indicated)
LOD
(ng/L,
Otherwise Indicated)
LOQ (ng/L,
Otherwise Indicated)
%
Recovery
Intra-Day
Precision
(RSD %)
Inter-Day
Precision
(RSD %)
Ref
ParacetamolRP-HPLC-PDA>0.9980.8–270.0 0.2 (µg/mL)0.8 (µg/mL)98.47–99.853.5 (overall)3.5 (overall)[35]
ParacetamolHPLC-MS>0.99020.0–4000.0 ng/mL675822,300-Three levels (60, 300, and 3000 µg L−1) between 1.4 and 8.1 (min flurbiprofen, max ibuprofen).Three consecutive days, three levels (60, 300, and 3000 µg/L) RSD between 0.6 and 7.48 (min diclofenac, max ibuprofen).[36]
Ibuprofen618220,400-
DiclofenacUHPLC-MS0.9990.5–10162.0486.086.2–99.5-Three consecutive days, three levels (0.5, 5.0, and 10 µg/L) between 6.36 and 12.86 and 7.38–11.76, respectively[37]
Ibuprofen164.0492.090.5–102.1
NaproxenHPLC-DAD0.995
0.998
0.993
100–1000
µg/L
11044095.71–17% (overall)1–17% (overall)[38]
Ibuprofen15022091.1
Diclofenac110270102.0
NaproxenHPLC-DAD0.9990.1–5.0 mg/L8.025.082.3One level (0.025 µg/L) between 1.84 and 9.94 (min diclofenac, max naproxen)-[39]
Diclofenac11.036.065.5
Ibuprofen11.035.079.5
DiclofenacHPLC-MS>0.998
>0.999
>0.996
10–100
0.1–100 ng/L
0.1–100
1.966.52103.3Two levels (20 and 100 µg/L) between 0.6 and 4.16 (min diclofenac, max ibuprofen).Three consecutive days, two levels (20 and 100 µg/L) RSD between 0.6 and 7.48 (min diclofenac, max ibuprofen).This study
Paracetamol3.6412.15102.3
Ibuprofen 40.91136.36103.4
Note(s): * Compilation of studies obtained from a Google Scholar search from the last 5 years (2020–2025), using the following search terms and Boolean operators: method AND analgesics AND (paracetamol OR diclofenac OR ibuprofen) AND HPLC AND water (OR environmental water). The most relevant studies that satisfied the criteria (peer-reviewed studies focused on analgesics determination in water samples by HPLC analysis) were included in this table.
Table 6. Range of measurements (µg/L; min–max values) of the target pharmaceuticals (IBU, PARA, DIC) in surface water samples from three sample sites (n = 9).
CompoundSite 1 (Lake Water)Site 2 (River Water)Site 3 (Lake Water)
IBU<0.041 a<0.041 a<0.041–0.06 b
PARA<0.003–0.02 b< 0.003–0.01 b<0.003 a
DIC0.01–0.05 b<0.001 a<0.001–0.02 b
Note(s): Concentrations of target compounds are presented in µg/L to facilitate comparison with previous studies. a All measurements below the limit of detection. b Range of concentrations (µg/L) per sample site.
Disclaimer/Publisher’s Note: The statements, opinions and data contained in all publications are solely those of the individual author(s) and contributor(s) and not of MDPI and/or the editor(s). MDPI and/or the editor(s) disclaim responsibility for any injury to people or property resulting from any ideas, methods, instructions or products referred to in the content.