Article

A Novel Approach to the Evaluation of Sediment Basin Floating Surface Skimmer Flow Rates

Department of Civil and Environmental Engineering, Auburn University, Auburn, AL 36849, USA
*
Author to whom correspondence should be addressed.
Water 2026, 18(4), 500; https://doi.org/10.3390/w18040500
Submission received: 31 December 2025 / Revised: 10 February 2026 / Accepted: 13 February 2026 / Published: 17 February 2026
(This article belongs to the Section Water Erosion and Sediment Transport)

Abstract

A floating surface skimmer is a device that regulates dewatering in a sediment basin. Skimmers decant from the top of the water column, allowing for greater capture of suspended sediment. Skimmer dewatering rates depend on design and vary by manufacturer. Theoretical flow rates yield errors when estimating dewatering times; therefore, there is a need to conduct experimental testing to obtain accurate flow rates. This study evaluated the discharge rates of eight skimmers with varying inlet sizes across different orifice openings using an adjustable slider. Testing was conducted in a 29.8 m3 (1053 ft3) evaluation tank assessing inlet sizes ranging from 3.8 cm (1.5 in.) to 20.3 cm (8 in.). For the five largest skimmers, four adjustable slider configurations were assessed, while three slider configurations were assessed for the three smallest skimmers. Each configuration was triplicated for 87 total experiments. Results indicate that skimmers can achieve flow rates ranging as high as 2622 m3/d (92,585 ft3/d) to as low as 28 m3/d (981 ft3/d) across all sizes. Collected data was used to model flow characteristics and develop two interactive skimmer sizing tools for designers and engineers. An alternative flow rate calculation method was also considered to maximize data analysis efficiency.

1. Introduction

It is necessary to properly manage land-disturbing activities throughout construction operations. Sediment is a significant pollutant of concern in the context of construction site management. Construction sites discharge approximately 10 to 20 times the amount of sediment-laden runoff than agricultural lands and 1000 to 2000 times that of forested lands [1]. Substantial amounts of sediment deposition from runoff into conveyance systems and natural waterways severely impacts aquatic ecosystems and overall water quality. Construction sites are particularly susceptible to erosive forces due to activities such as land grading and the removal of existing vegetation. An effective method in mitigating damage caused by erosive forces and ensuring compliance with environmental regulations is the implementation of construction stormwater practices. A common construction stormwater practice used to prevent sediment-laden runoff from impacting off-site areas is a sediment basin.
Sediment basins are temporary sediment control structures designed to intercept and detain stormwater runoff so that water may be treated via sedimentation [2]. Sedimentation is the process by which suspended sediment particles settle to the basin floor via gravitational forces. To minimize the amount of sediment present in treated effluent, the sediment deposition efficiency of a sediment basin is influenced by several design parameters: size, geometry, sediment characteristics, energy dissipators, dewatering mechanisms, etc. [2]. Sediment basin design and performance vary by jurisdiction due to soil properties, along with the frequency and severity of precipitation events. One study indicated that sediment control systems with sediment basins along highway construction sites effectively remove 35% to 60% of incoming sediment [3]. Another study determined that, overall, sediment basins utilizing sediment control systems are capable of removing up to 98% of suspended sediment after rainfall events [2]. It is imperative that sediment basins be designed properly so there is adequate storage volume available for capture after rain events, while also allowing sufficient time for sedimentation. In addition to storage and time considerations, dewatering methods used to treat stormwater from sediment basins must be considered.
Sediment basin dewatering is a process in which captured stormwater runoff is slowly released off-site after detention time has been met. Dewatering in a sediment basin has a two-to-five-day requirement to ensure proper sediment basin functionality [4]. To allow for greater control of dewatering, principal spillways such as riser structures, auxiliary spillways, and floating surface skimmers have been adopted to improve the quality of water discharged from sediment basins [5]. Recently, floating surface skimmers have emerged as the leading dewatering mechanism adopted by state and federal environmental regulatory agencies for sediment basin dewatering.

1.1. Background

Perforated riser structures have been historically used as the principal spillway in regulating sediment basin dewatering [5]. Perforated riser structures are passive flow systems that dewater throughout the water column. These mechanisms are fashioned using corrugated aluminum pipe or a plywood box with a geotextile wrapping and aggregate backfill for filtration [6]. Holes are drilled into the sides to allow for water to flow through. Studies have shown that perforated riser structures are capable of intercepting sediment at a rate of 88% or greater if correctly designed [7,8,9]. Despite the potential for a high rate of sediment capture, perforated riser structures are usually inadequately designed due to a lack of design guidance, and consequently, will dewater sediment basins too quickly [10]. Additionally, hydrostatic head above the holes affects discharge rates depending on water levels; when the sediment basin is closer to capacity, dewatering occurs more rapidly, thus more sediment is present in the effluent than desired [6]. An alternative device utilized for sediment basin dewatering is a floating surface skimmer.
A floating surface skimmer is a device designed to float at the water surface and decant from the top of the water column, dewatering through an inlet [6]. Floating surface skimmers are the most efficient mechanism for sediment basin dewatering, not only because skimmers allow for increased settling time, but also because they facilitate control over discharge rates [11]. Researchers have indicated that with a skimmer installed, most sediment loss in a sediment basin occurred in the first five to nine hours following the start of a storm event [9,12]. Several studies have been conducted to verify skimmer performance compared to traditional dewatering methods. Skimmers consistently outperform riser structures in terms of reducing sediment present in sediment basin effluent: one study conducted by Millen et al. [9] found that skimmers have a sediment retention efficiency of 97%, while two additional studies showed a retention efficiency of over 99% [13,14]. Furthermore, in a study performed by Jarret [15], perforated riser spillways had a sediment loss of 1.8 times greater than that of a skimmer. With these advancements, the Construction General Permit issued by the United States Environmental Protection Agency currently mandates that outlet structures in sediment basins must drain from the top of the water column [16]. Though skimmers are effective in controlling dewatering of sediment basins, they must be properly sized to meet detention requirements.
Skimmer design is often based on sediment basin detention requirements. The required skimmer size is calculated using the required discharge volume from the sediment basin and detention time. It is also increasingly common for skimmers to have a customizable orifice. In a study performed by Perez et al. [5], a tool was constructed for sediment basin design using Microsoft Excel. When considering floating surface skimmer sizing, the tool calculates the discharge rate and the orifice diameter using Equation (1).
O s k i m = x Q s k i m 2 / 5
where Oskim is the orifice diameter (cm or in.), x = 2.8166 using SI units or x = 0.2665 using U.S. customary units, and Qskim is the required discharge rate (m3/h or ft3/h). The author specifies that users should verify the orifice size with the manufacturer to confirm the skimmer is properly sized for the designed outflow rate, as outputs are approximations [5].
Additionally, Faircloth Skimmer® offers a method for selecting skimmer size by obtaining maximum flow capacities based on drawdown times [17]. Skimmer size may be selected in two steps. The first step involves calculating the outflow rates from the sediment basin. The second step in determining skimmer size is calculating the orifice size. Jarrett [18] offers a method for determining orifice size for a Faircloth Skimmer®, seen in Equation (2).
D = Q 2310 H
where D is the diameter of the orifice (cm or in.), Q is the required discharge rate (m3/h or ft3/h), and H is the head (m or ft). This step may not be necessary if calculated outflow rates are equal or near the required outflow rates based on sediment basin parameters. It should be noted that calculated flow rates are theoretical and may not accurately reflect skimmer performance throughout the water column.
Skimmer designs differ across manufacturers, which results in varied performance, even with similar orifice sizes [19]. Therefore, there is a need to conduct experimental testing on skimmers as discharge rates are dependent on design. Experimental testing is the optimal approach to obtain accurate flow rates, as theoretically calculated flow rates can lead to errors in determining dewatering times and result in increased sediment concentration in discharge. Furthermore, it is increasingly common for skimmers to feature an adjustable or customizable orifice that enables supplementary control over sediment basin dewatering. Altering the size and shape of the inlet impacts hydraulic performance, thus providing additional need for experimental testing to define discharge rates and assess skimmer behavior.
A study performed by Sharpe et al. [19] evaluated a skimmer specifically designed for post-construction detention basins. The objective of this study was to verify that experimental testing is the most effective method to determine skimmer outflow rates. This study was conducted in the skimmer evaluation tank at the Auburn University Stormwater Research Facility (AU-SRF) in Opelika, Alabama. J.W. Faircloth & Son, Inc. provided one post-construction skimmer for assessment. The skimmer featured an adjustable sluice gate that can be used to meet required detention times. Six sluice gate openings ranging from 15.2 cm (6 in.) to 2.54 cm (1 in.) were tested across two different barrel lengths, 2.44 m (8 ft) and 3.66 m (12 ft), in triplicate for 36 total tests. Experimental data was plotted as a function of flow vs. depth to find average flow rates of each configuration and create models. The post-construction skimmer was determined to be capable of achieving outflow rates as high as 6048 m3/d (216,000 ft3/d) to as low as 1469 m3/d (43,200 ft3/d) for the 15.2 cm (6 in.) and 2.54 cm (1 in.) openings, respectively. Flow rates were used to construct a skimmer sizing tool in Microsoft Excel for engineers and designers to assist in determining skimmer parameters based on sediment basin dimensions.

1.2. Research Objectives

This research aims to define how an adjustable orifice slider influences the discharge rates of eight variably sized floating surface skimmers designed for use in sediment basins on construction sites. Experimental testing was performed in a controlled environment to obtain reliable flow rates and observe skimmer behavior throughout the water column. Once flow rate data was obtained, two tools were developed to aid engineers and estimators in appropriately sizing skimmers based on known sediment basin parameters.

2. Materials and Methods

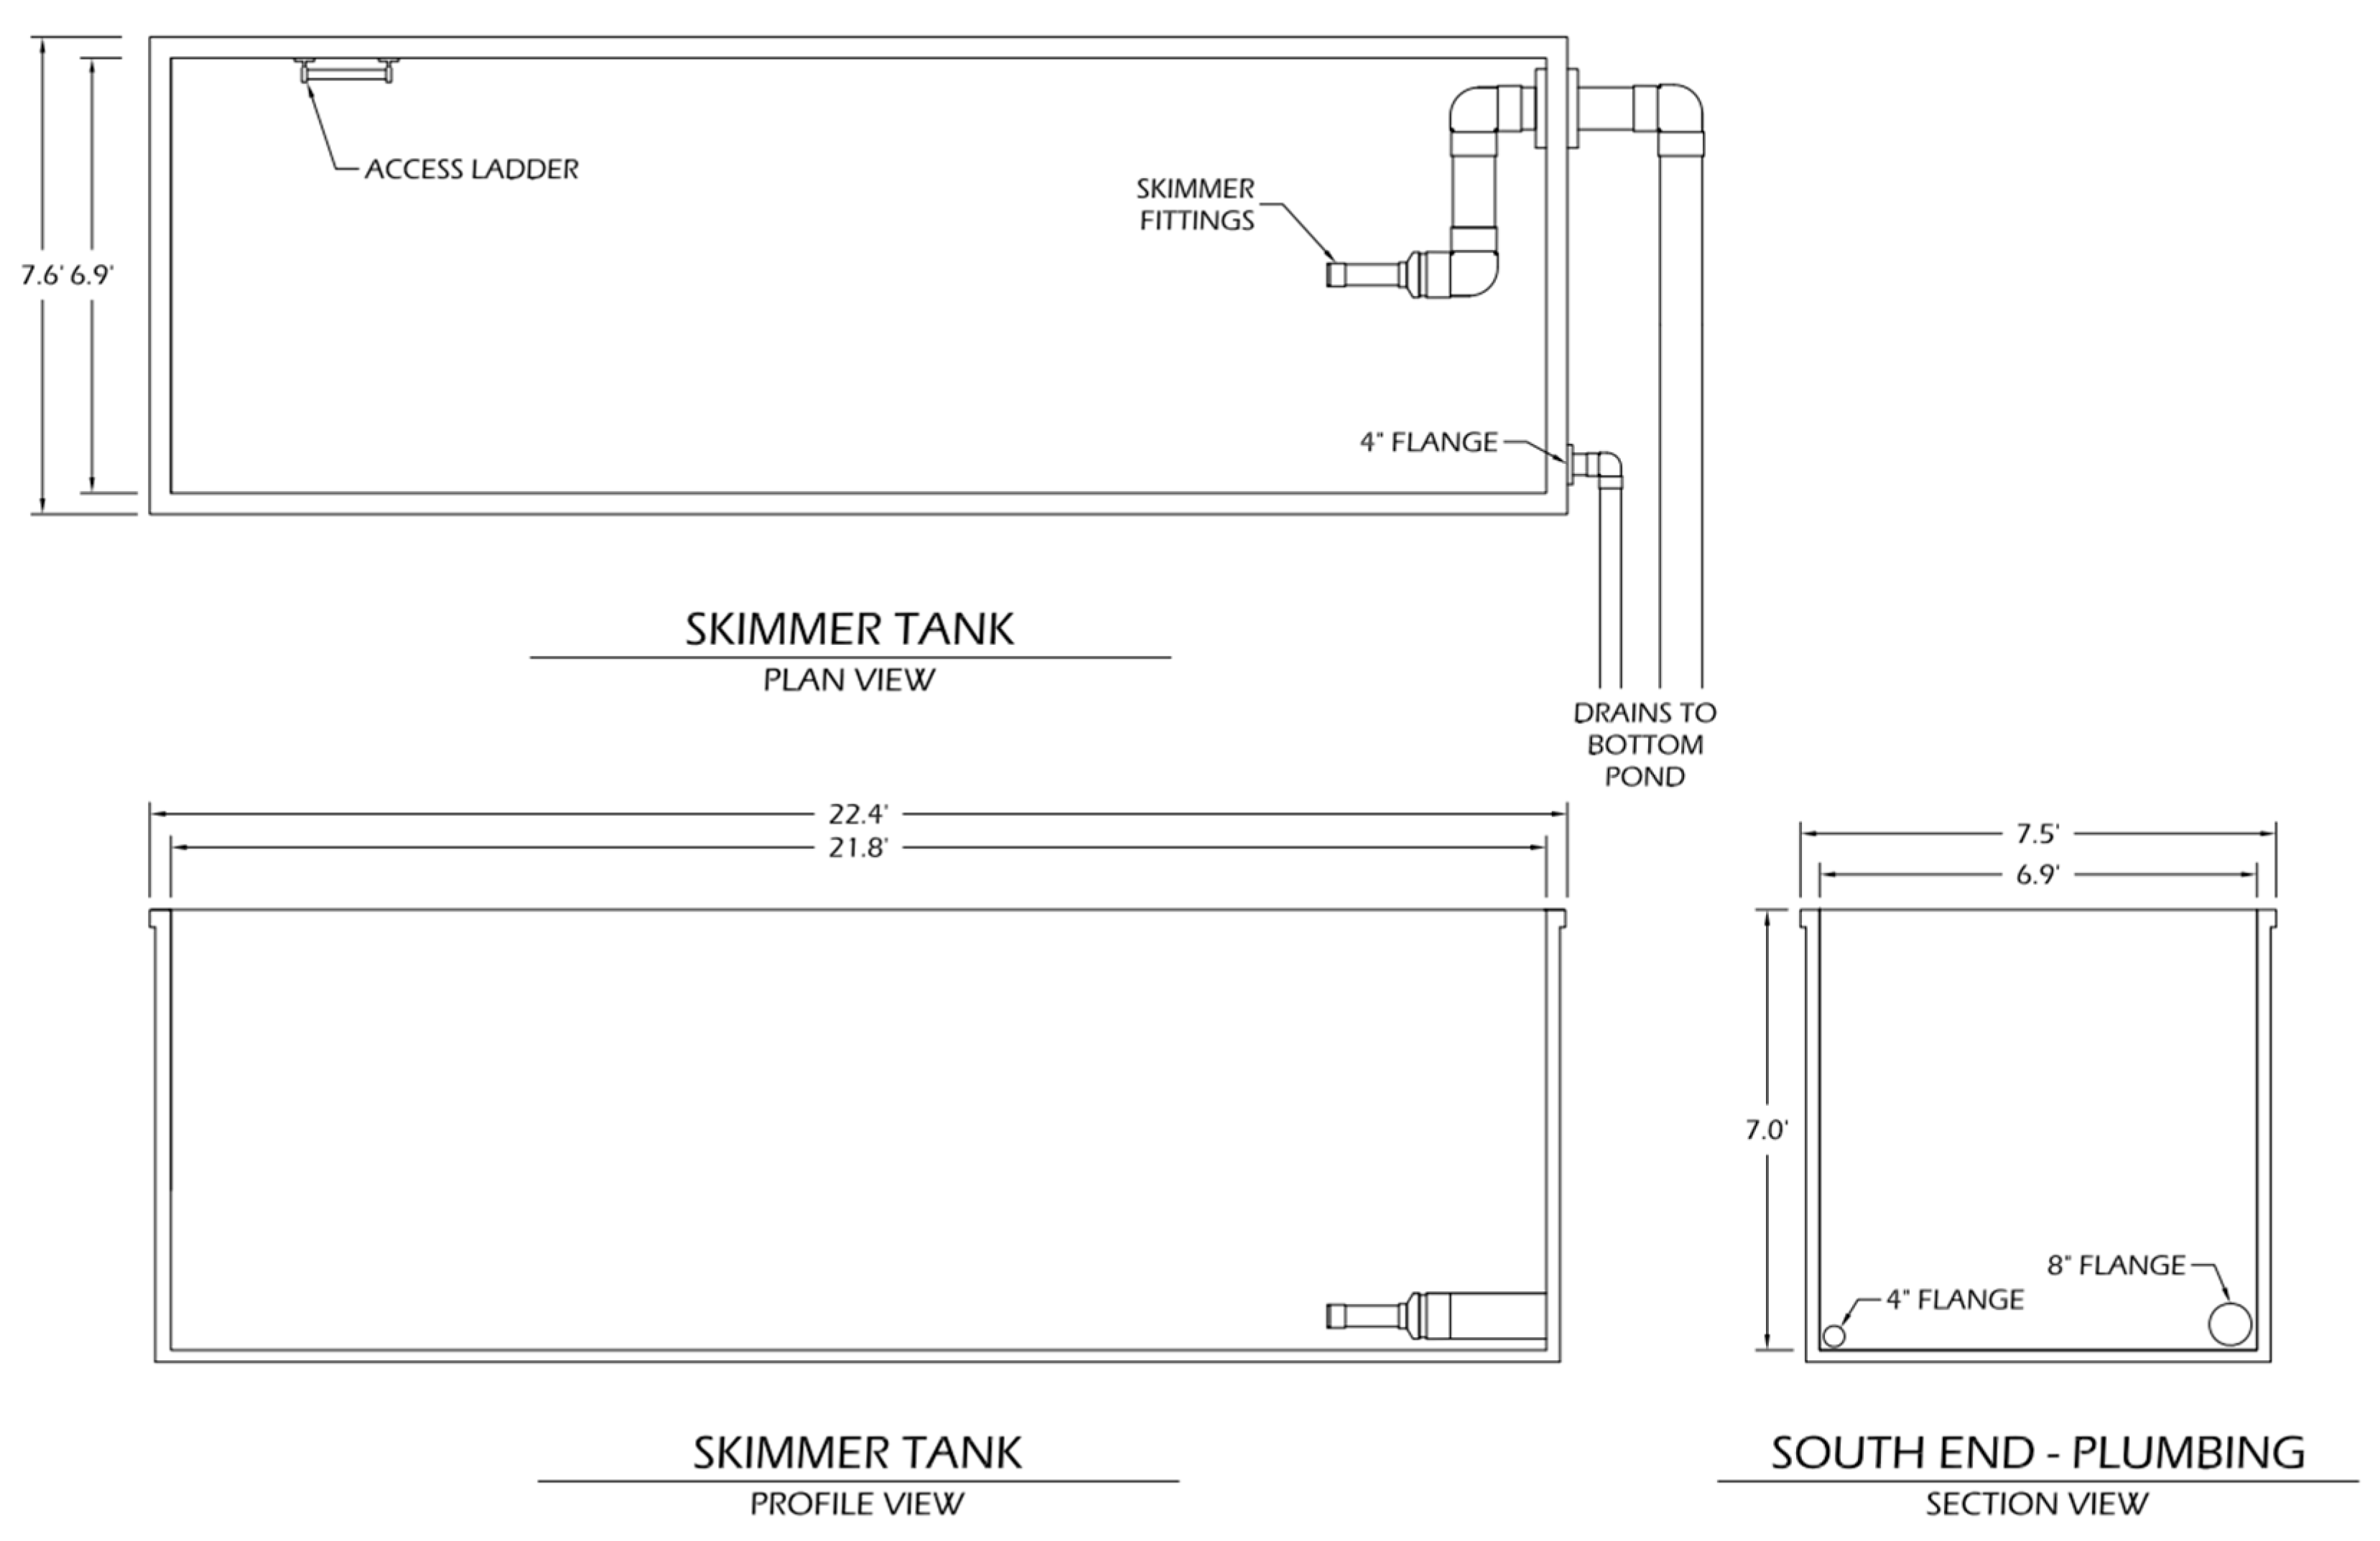
To effectively evaluate skimmer flow rates, an enhanced version of the ASTM D8107-18 Standard Practice was followed to enable greater apparatus depth and more comprehensive data collection [20]. Testing was performed at AU-SRF, a 4.0 ha (10-acre) outdoor testing facility dedicated to training, research, and evaluation of stormwater management practices. The skimmer evaluation apparatus used for testing is a refurbished and sealed 30.6 m3 (40 yd3) steel roll-off dumpster. The tank is 6.6 m (21.8 ft) in length, 2.1 m (6.9 ft) in width, and 2.1 m (7.0 ft) in height. Based on these measurements, the tank has a bottom surface area of 14.0 m2 (150.4 ft2) and a volume of 29.8 m3 (1053 ft3). The tank features 20.3 cm (8 in.) and 10.2 cm (4 in.) flanges on the bottom of the south wall. Figure 1 illustrates the evaluation tank and a skimmer installation within the tank. Each skimmer was connected to the 20.3 cm (8 in.) flange; if necessary, appropriately sized connection reducers were used. The flange connects to an underground outlet pipe that discharges to an adjacent retention pond.
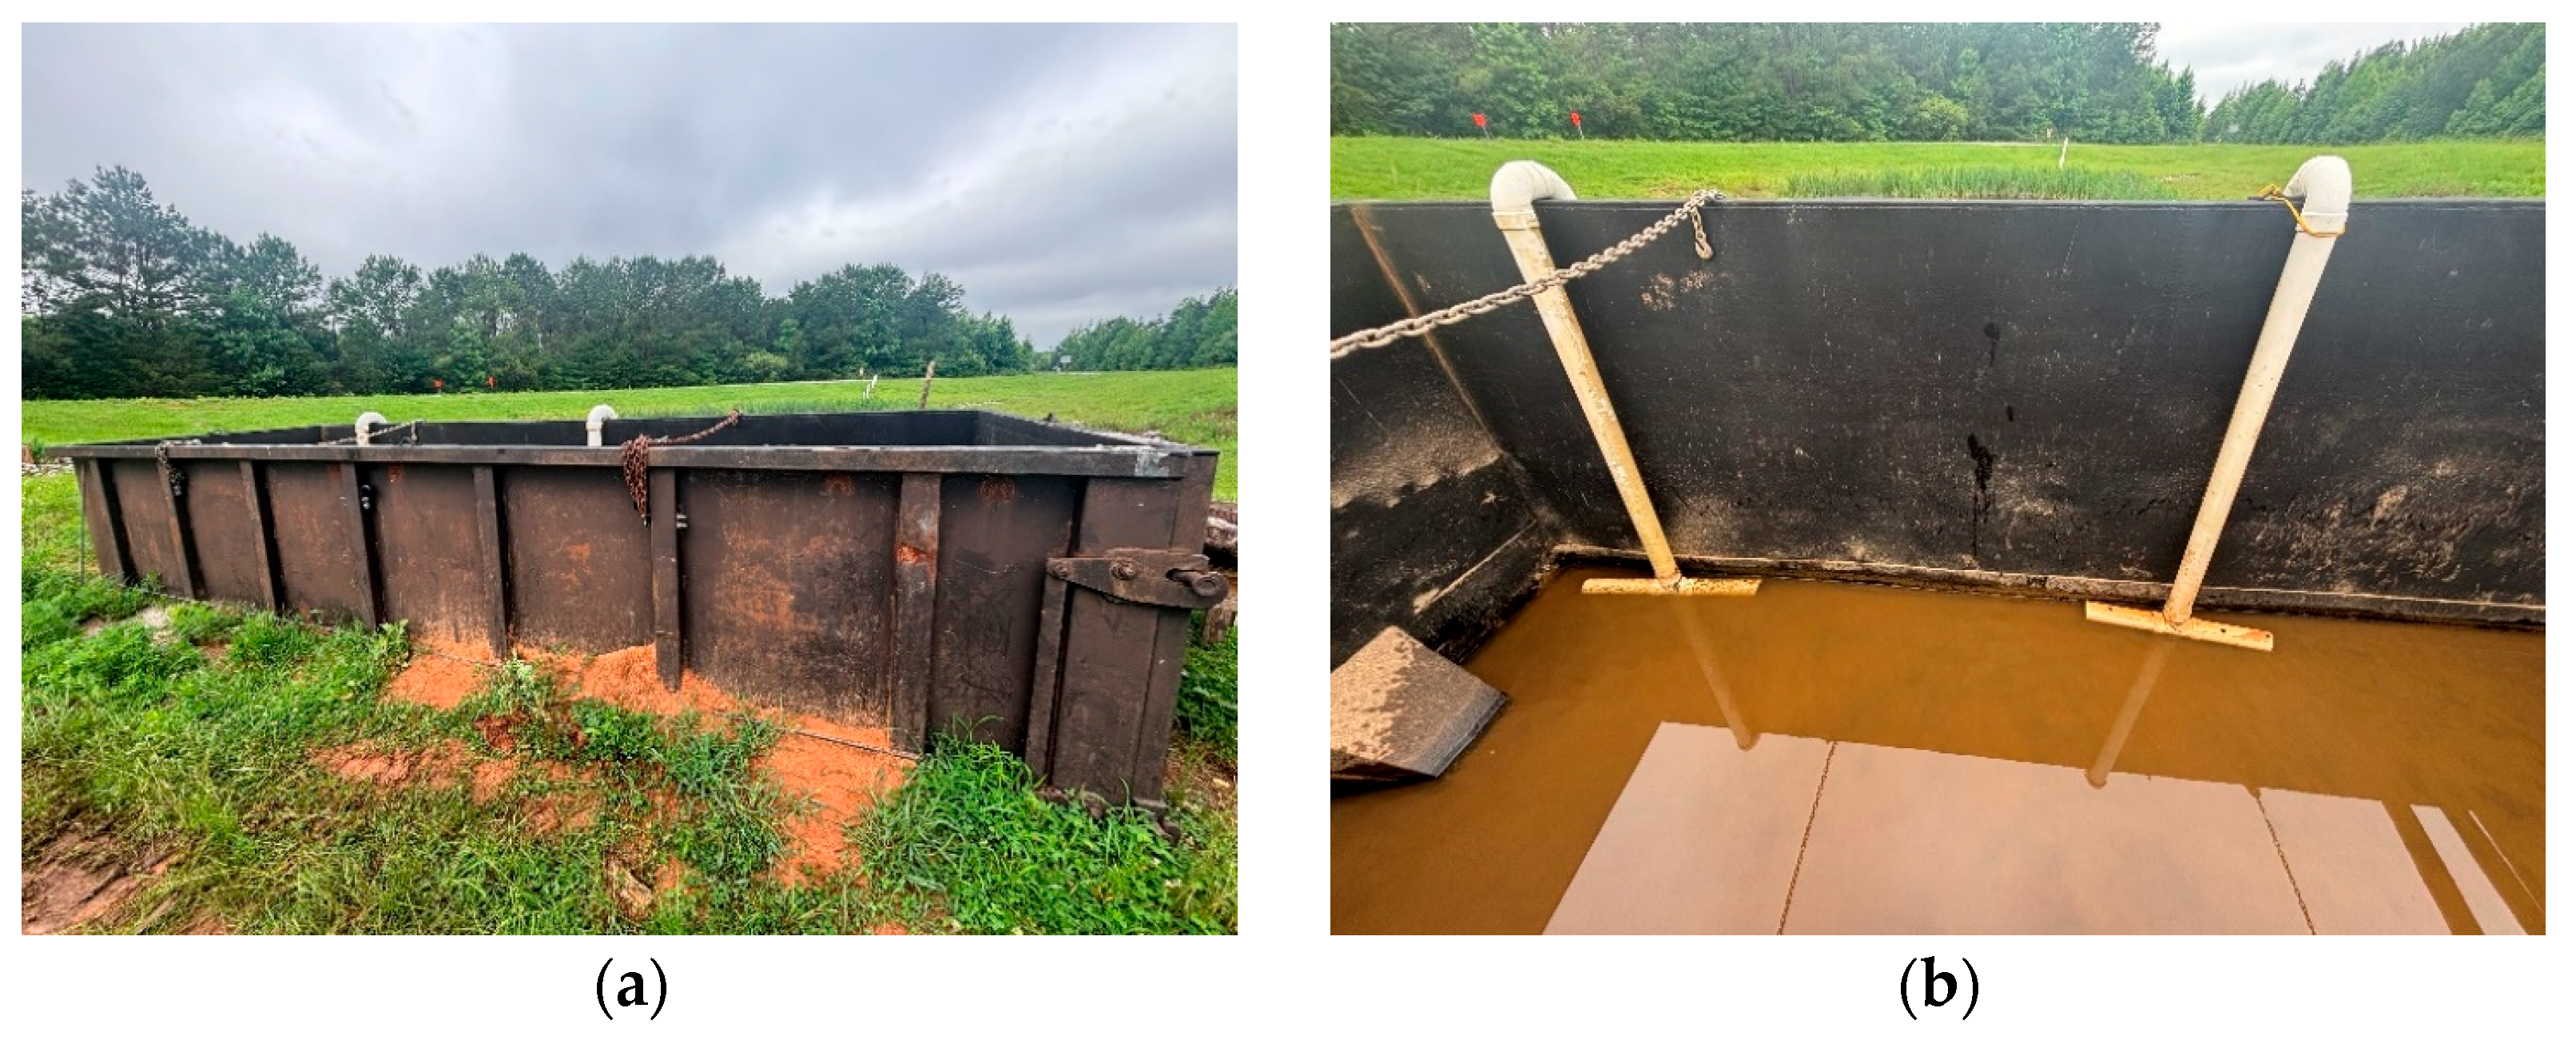
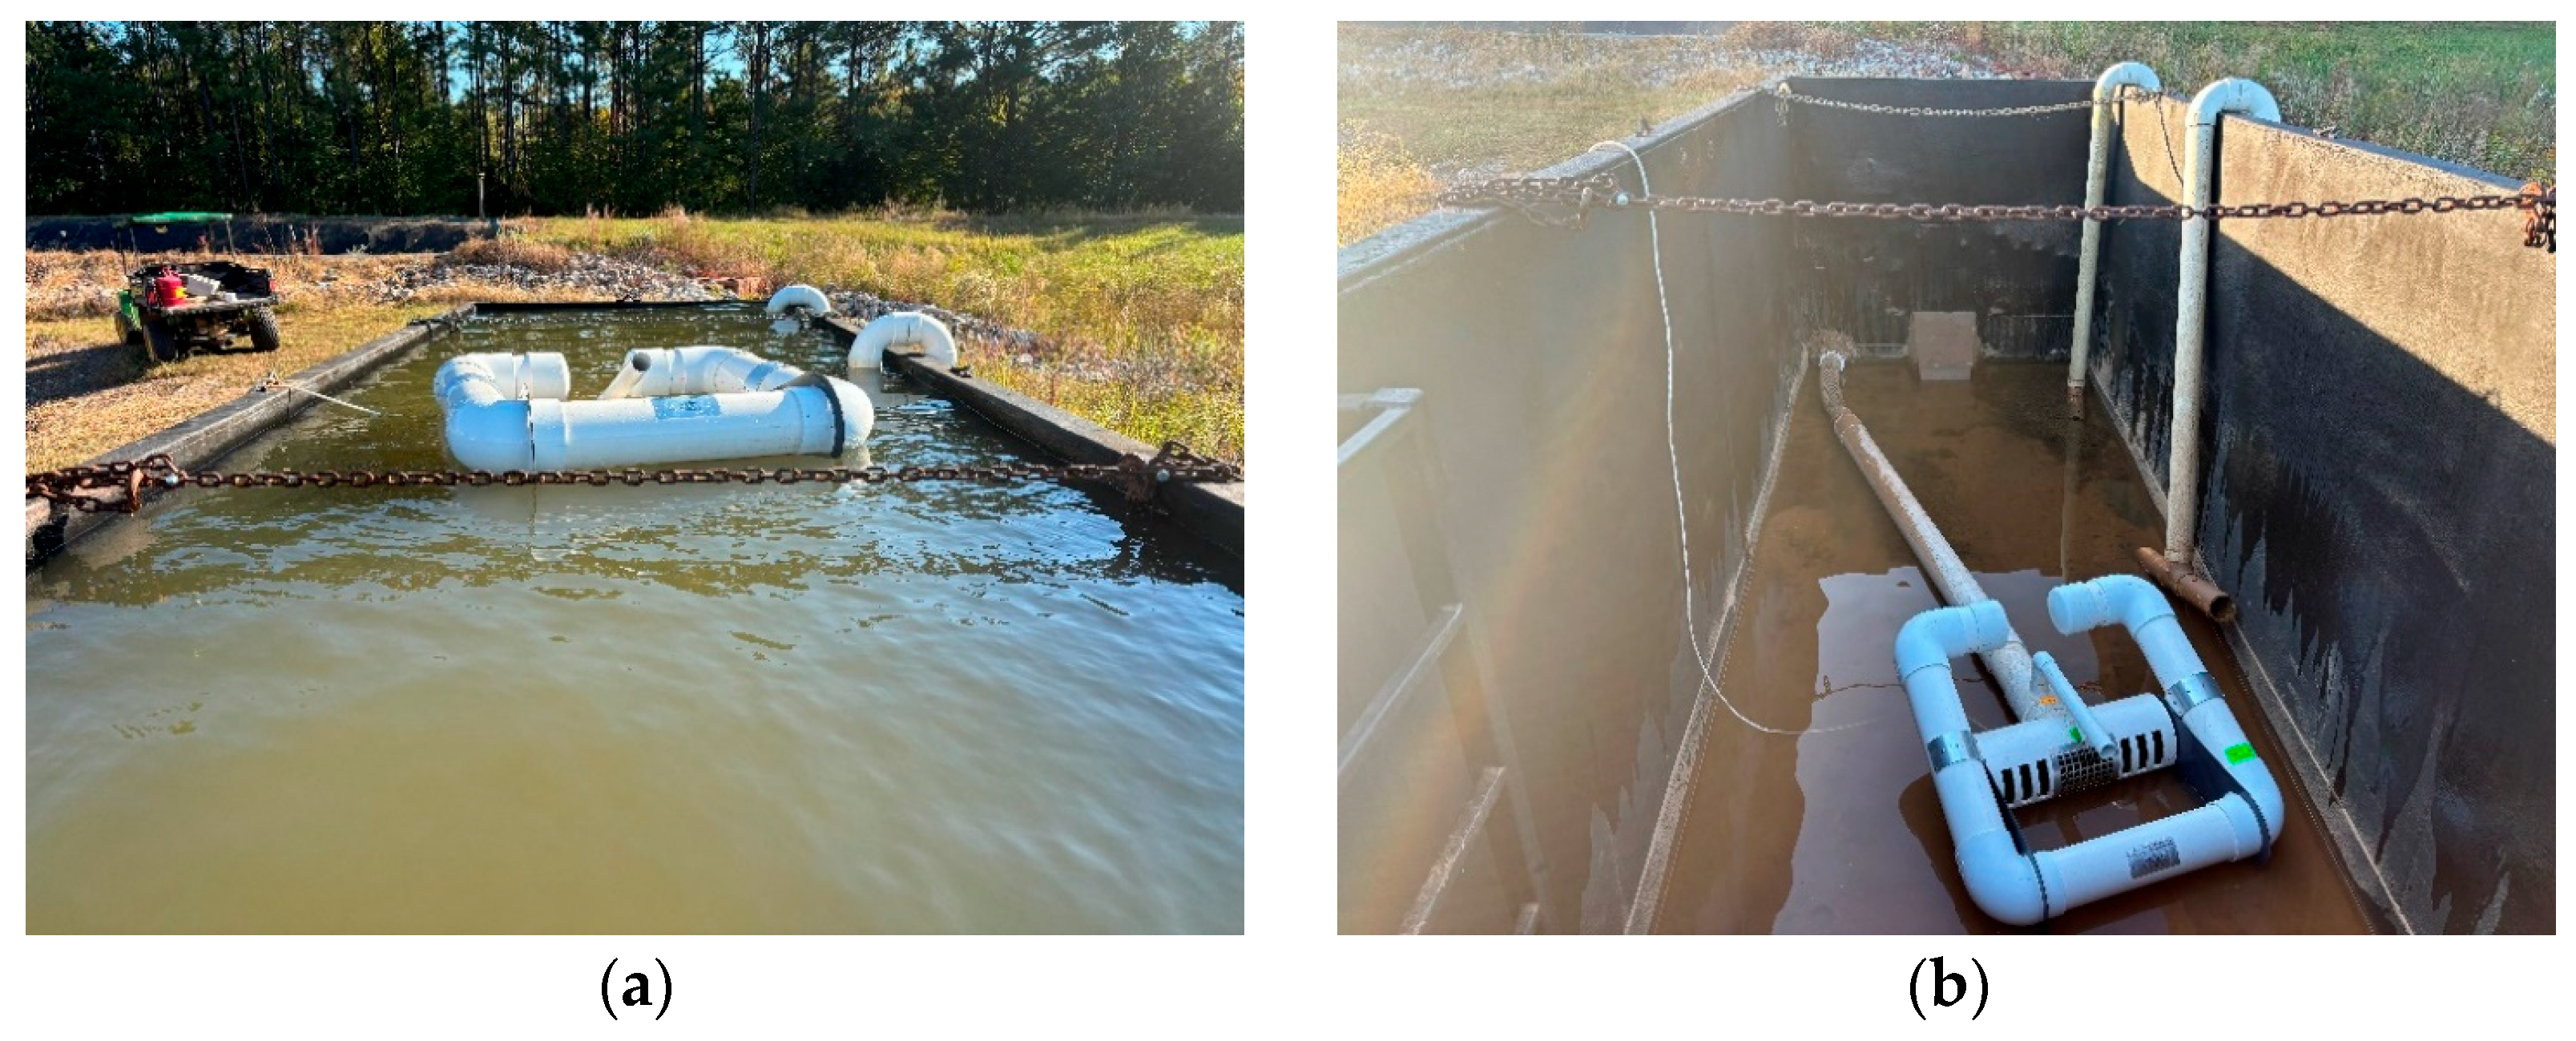
Figure 2a displays a photo of the outside view of the evaluation tank. Water was delivered to the evaluation tank using two 10.2 cm (4 in.) polyvinyl chloride (PVC) pipes outfitted in a “T” configuration. The pipes were placed on the wall of the tank for minimal buoyancy effects while the tank was being filled for testing, as seen in Figure 2b. The PVC delivery pipes were connected using 10.2 cm (4 in.) hoses to two Honda GX 270 pumps (Northern Tool + Equipment, Burnsville, MN, USA). The pumps delivered water with an approximate flow rate of 0.03 m3/s (1.0 ft3/s) each, resulting in a total flow rate of 0.06 m3/s (2.0 ft3/s) when filling the tank for each test.
Eight floating surface skimmers (J.W. Faircloth & Son, Inc., Hillsborough, NC, USA) were evaluated throughout experimental testing. The skimmers are manufactured specifically for use in sediment basins on construction sites. Skimmer sizes are based on the maximum orifice size: 3.8 cm (1.5 in.), 5.1 cm (2 in.), 6.4 cm (2.5 in.), 7.6 cm (3 in.), 10.2 cm (4 in.), 12.7 cm (5 in.), 15.2 cm (6 in.), and 20.3 cm (8 in.). Each skimmer consists of a head, barrel, and flexible hose. The head floats at the water surface and is where the inlet is located. There is a metal grate fastened to the head to trap debris, and can be opened for easy access to the inlet. The head is attached to a drainage pipe or “barrel,” which is glued to a flexible hose. The flexible hose allows for proper flotation as the basin is filled and is connected to the outlet flange in the evaluation tank. Before each test, the skimmer was assembled accordingly and installed in the evaluation tank.
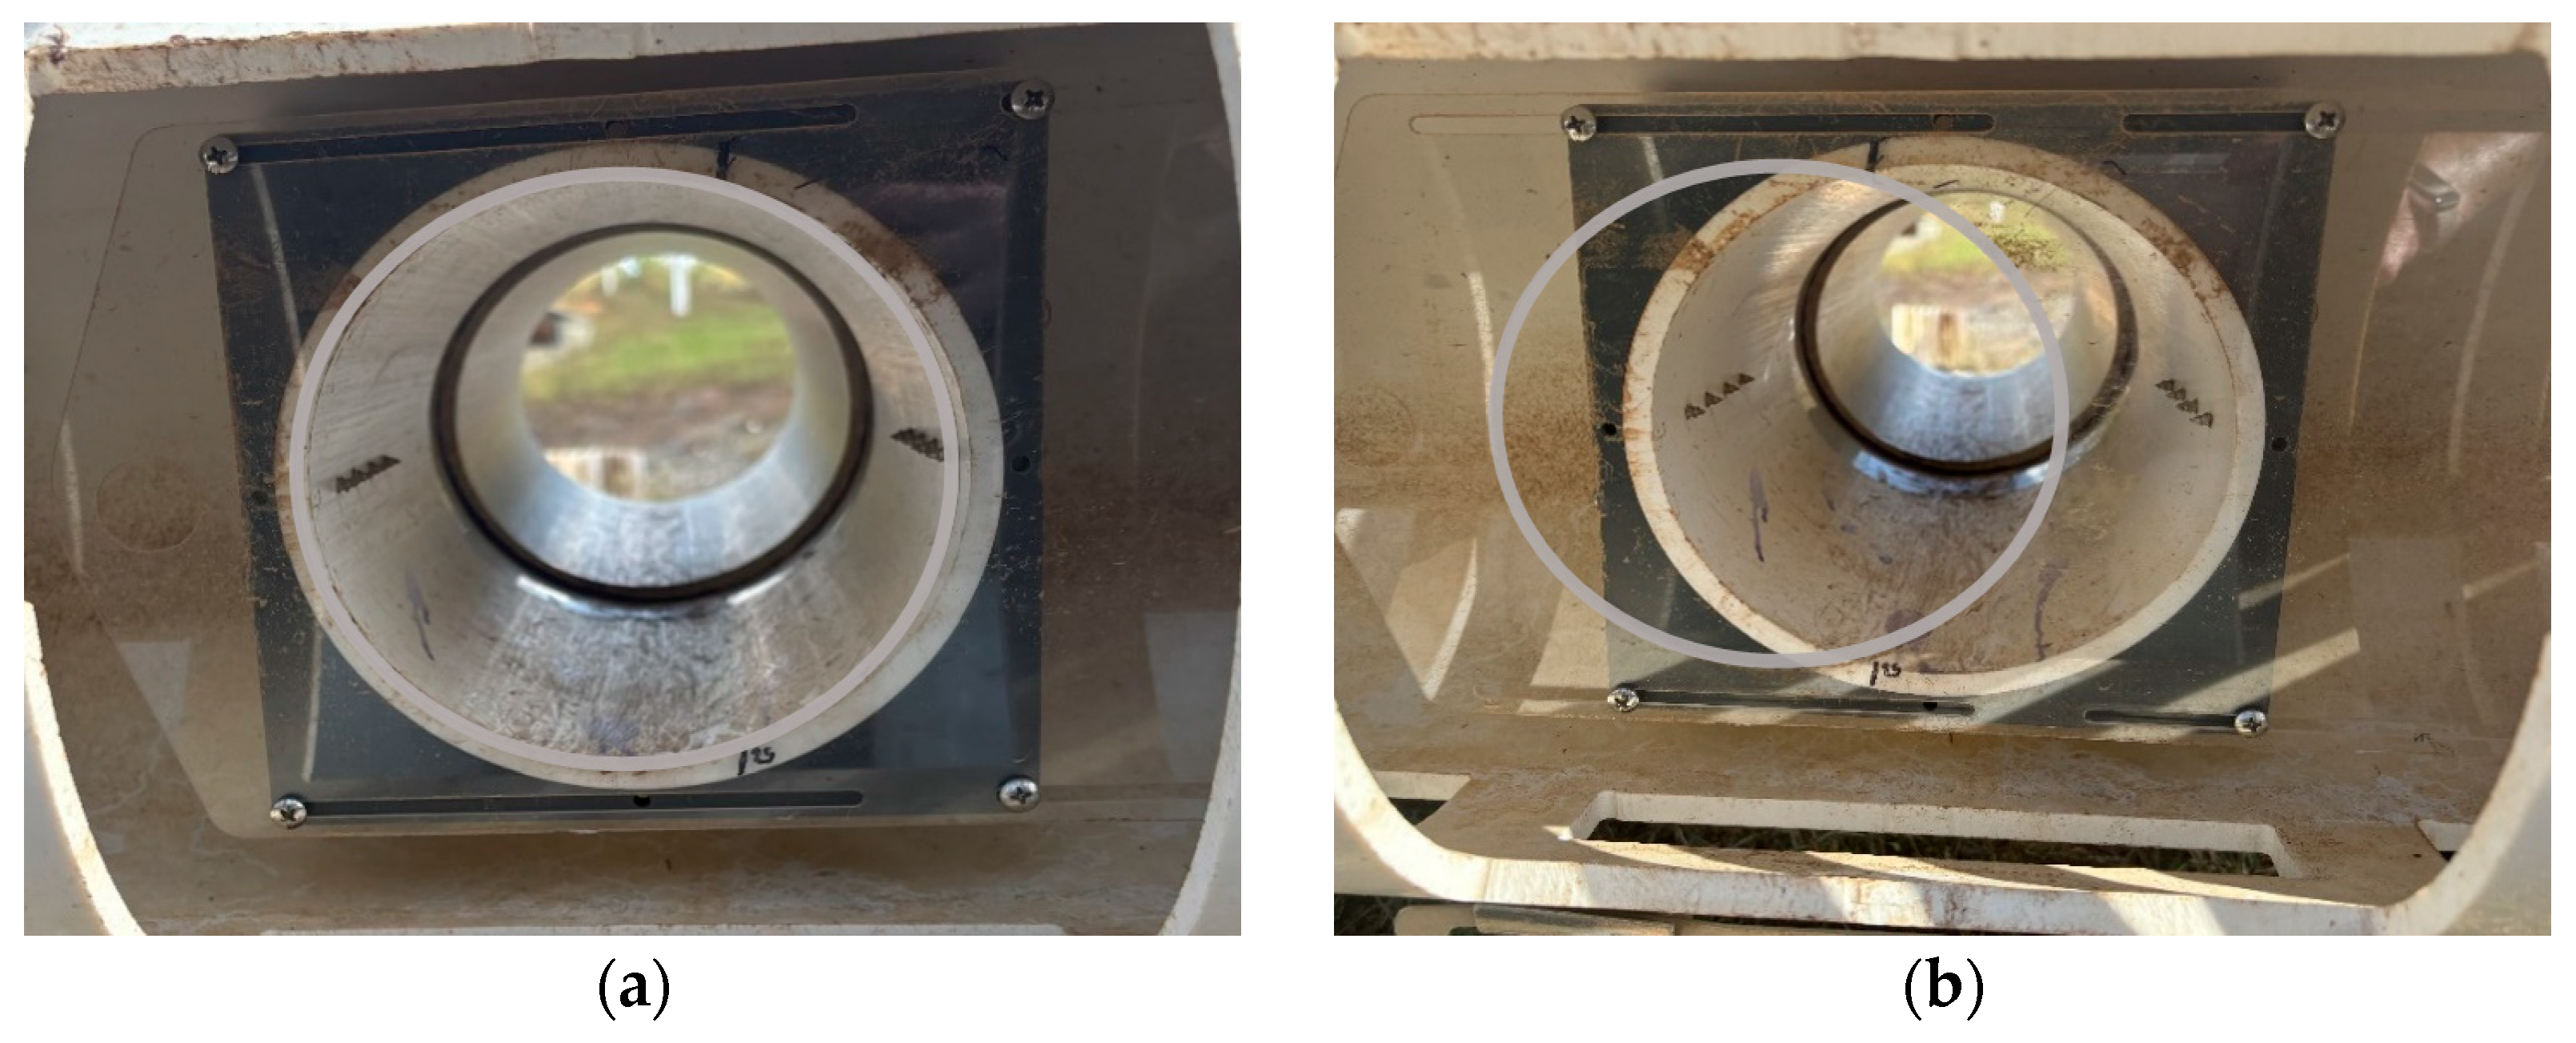
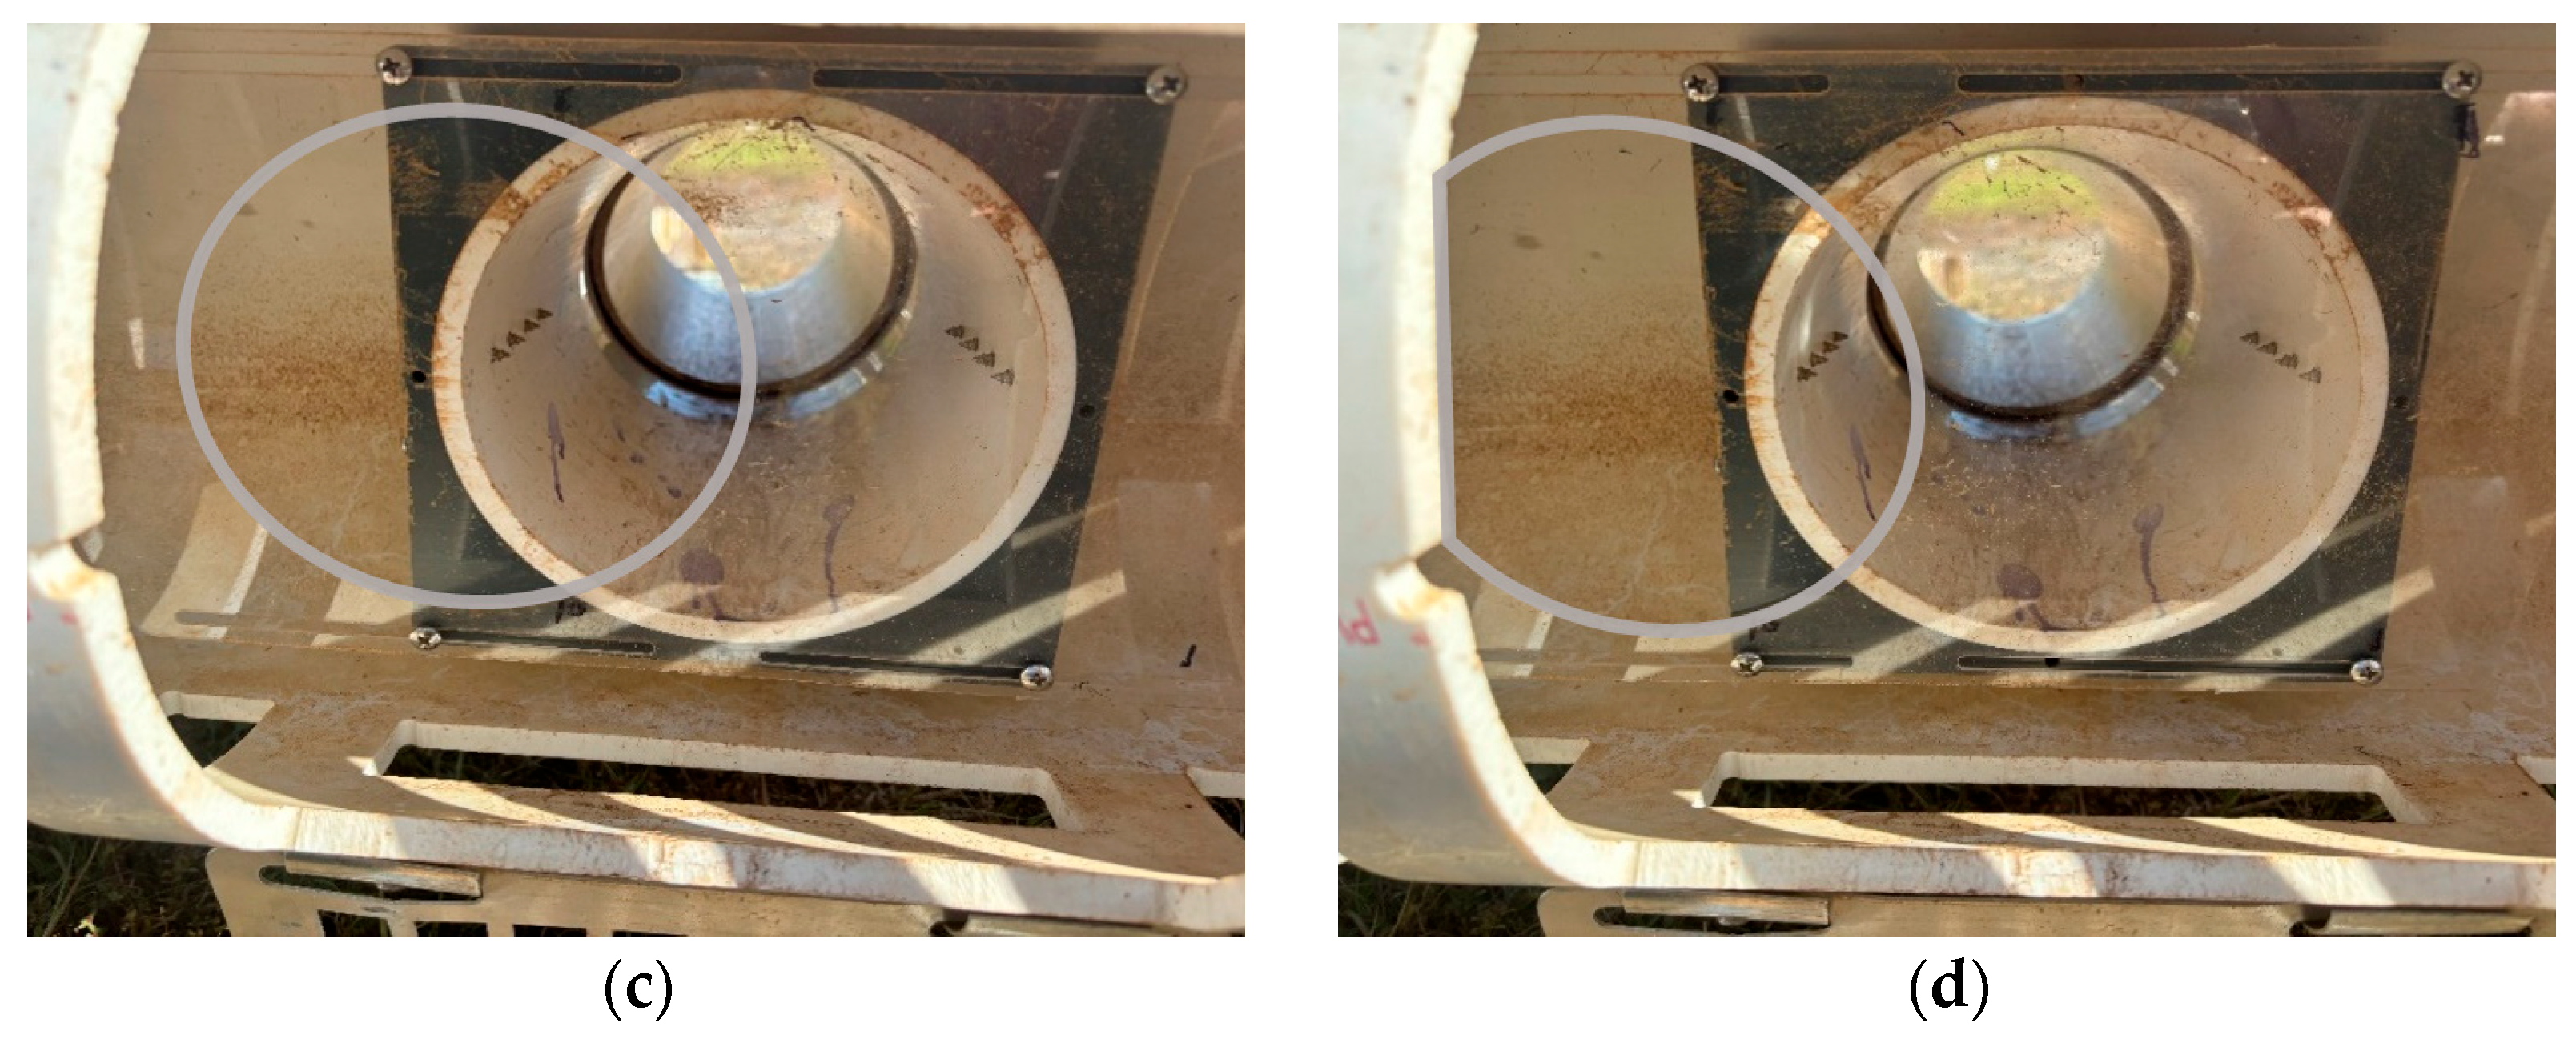
An adjustable orifice slider was evaluated for each of the eight skimmers. The adjustable slider is attached to the skimmer’s inlet and is used to control the discharge rate. Of the five largest skimmers, four orifice openings were assessed using the adjustable slider: 100% open, 75% open, 50% open, and 25% open. The 25% open setting was omitted for the three smallest skimmers, as the orifice limits flow rates below any meaningful application. Figure 3 exhibits the adjustable slider set to each desired opening on the 15.2 cm (6 in.) skimmer.
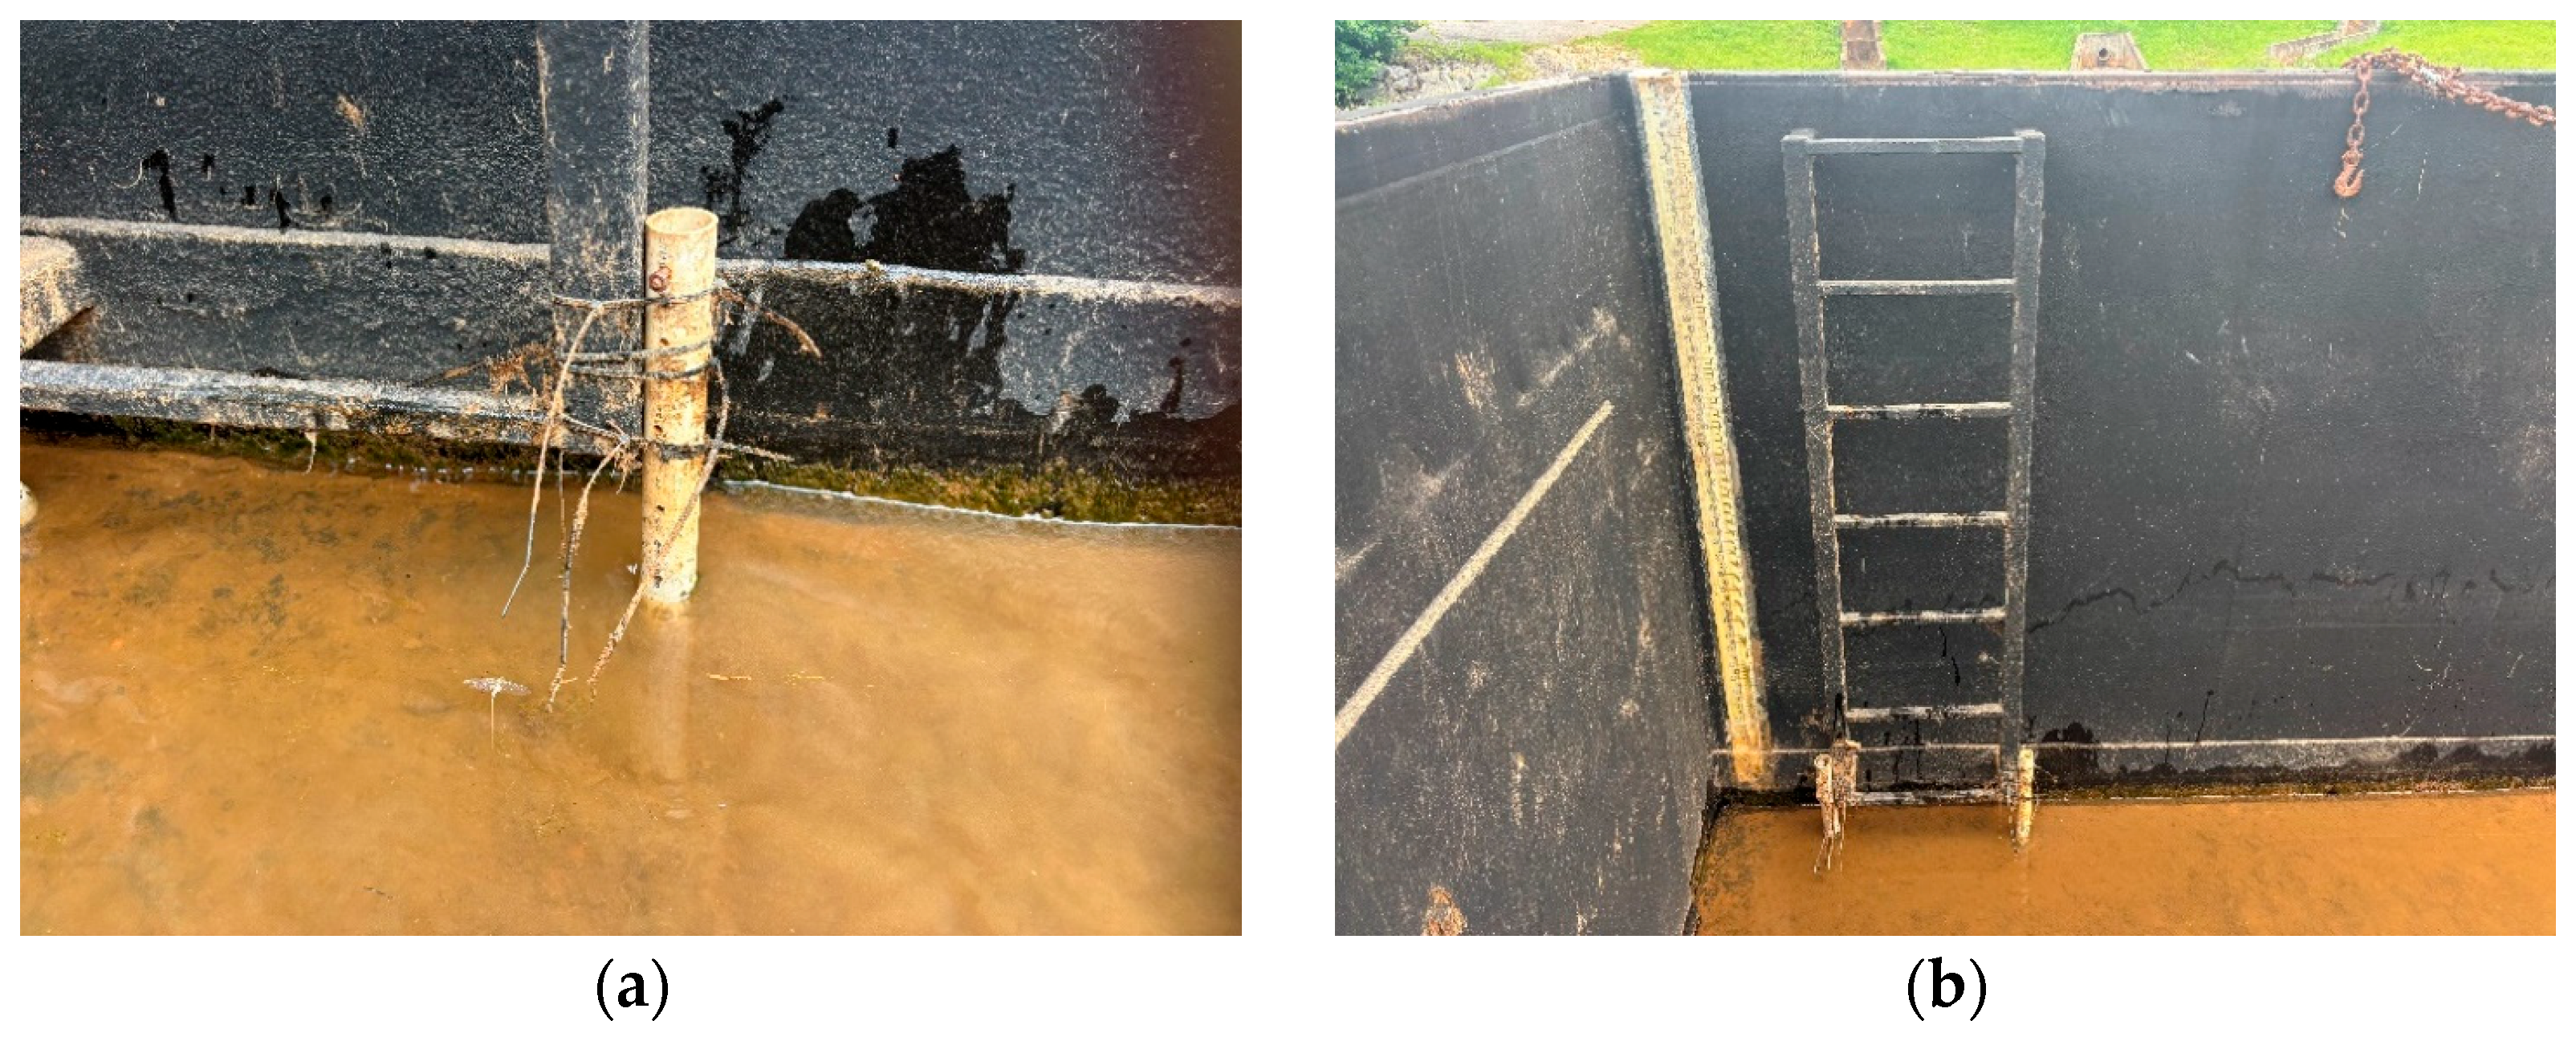
Flow rate data was collected using a Solinst Levelogger® 5 Model 3001 and a Solinst Barologger® 5 Model 3001 (Solinst Canada Ltd., Georgetown, ON, Canada). A Solinst Levelogger® is a pressure gauge datalogger that measures and records the changes in water levels as the tank is filled and emptied. A Solinst Barologger® is a datalogger that records atmospheric pressure and is used to compensate the water level readings collected from the Levelogger®. According to the manufacturer, the resolution of the Levelogger® ranges from 0.002% full scale to 0.0006% full scale [22]. The Levelogger® was programmed to record changes in water level every 15 s; in addition, an offset was adjusted to 0.0127 m (0.0417 ft) to account for the shape of the bottom of the sensor to the floor of the evaluation tank. Throughout testing, the Levelogger® was placed inside a small PVC pipe attached to the bottom of the access ladder using zip ties. The sensor was secured using a bolt inserted through the PVC pipe, as seen in Figure 4a. Visual observations of water level changes throughout testing were made using the tape measure attached to the wall next to the access ladder shown in Figure 4b. Following each test, data collected from the dataloggers was uploaded to Solinst Levelogger Software (version 4.6.3), where the data was compensated for atmospheric pressure and exported to Microsoft Excel for flow rate calculations.
After the experimental setup was completed, the adjustable slider was positioned to the desired opening. The orifice was blocked, or the skimmer was suspended to prevent discharge as the tank filled. The pumps were turned on, and the tank was filled via the water delivery system. Once the tank reached maximum capacity, the pumps were switched off, and obstructions were removed so the skimmer could begin dewatering the tank. Figure 5a provides a photo showing the beginning of a 15.2 cm (6 in.) skimmer evaluation. The skimmer was allowed to fully drain the tank until the water level reached approximately 10.8 cm (4.25 in.), the point at which the skimmer was unable to continue discharging water, which can be seen in Figure 5b. Once the test was completed, the data was collected from the dataloggers. To address measurement uncertainty and assess repeatability, each skimmer configuration was evaluated in triplicate, yielding 12 tests for the five largest skimmers and 9 for the three smallest. A total of 87 tests were completed across all skimmers.
Data collected from the dataloggers were exported to Microsoft Excel for analysis after each test. The data was ultimately used to create plots representing flow rate as a function of depth. To begin constructing these plots, the flow rate was calculated. The volume of the tank was computed by multiplying the tank’s surface area by the recorded water depth at a point in time. Flow rates were obtained by calculating the volume change every 15 s.

3. Results and Discussion

3.1. Flow Rate Analysis

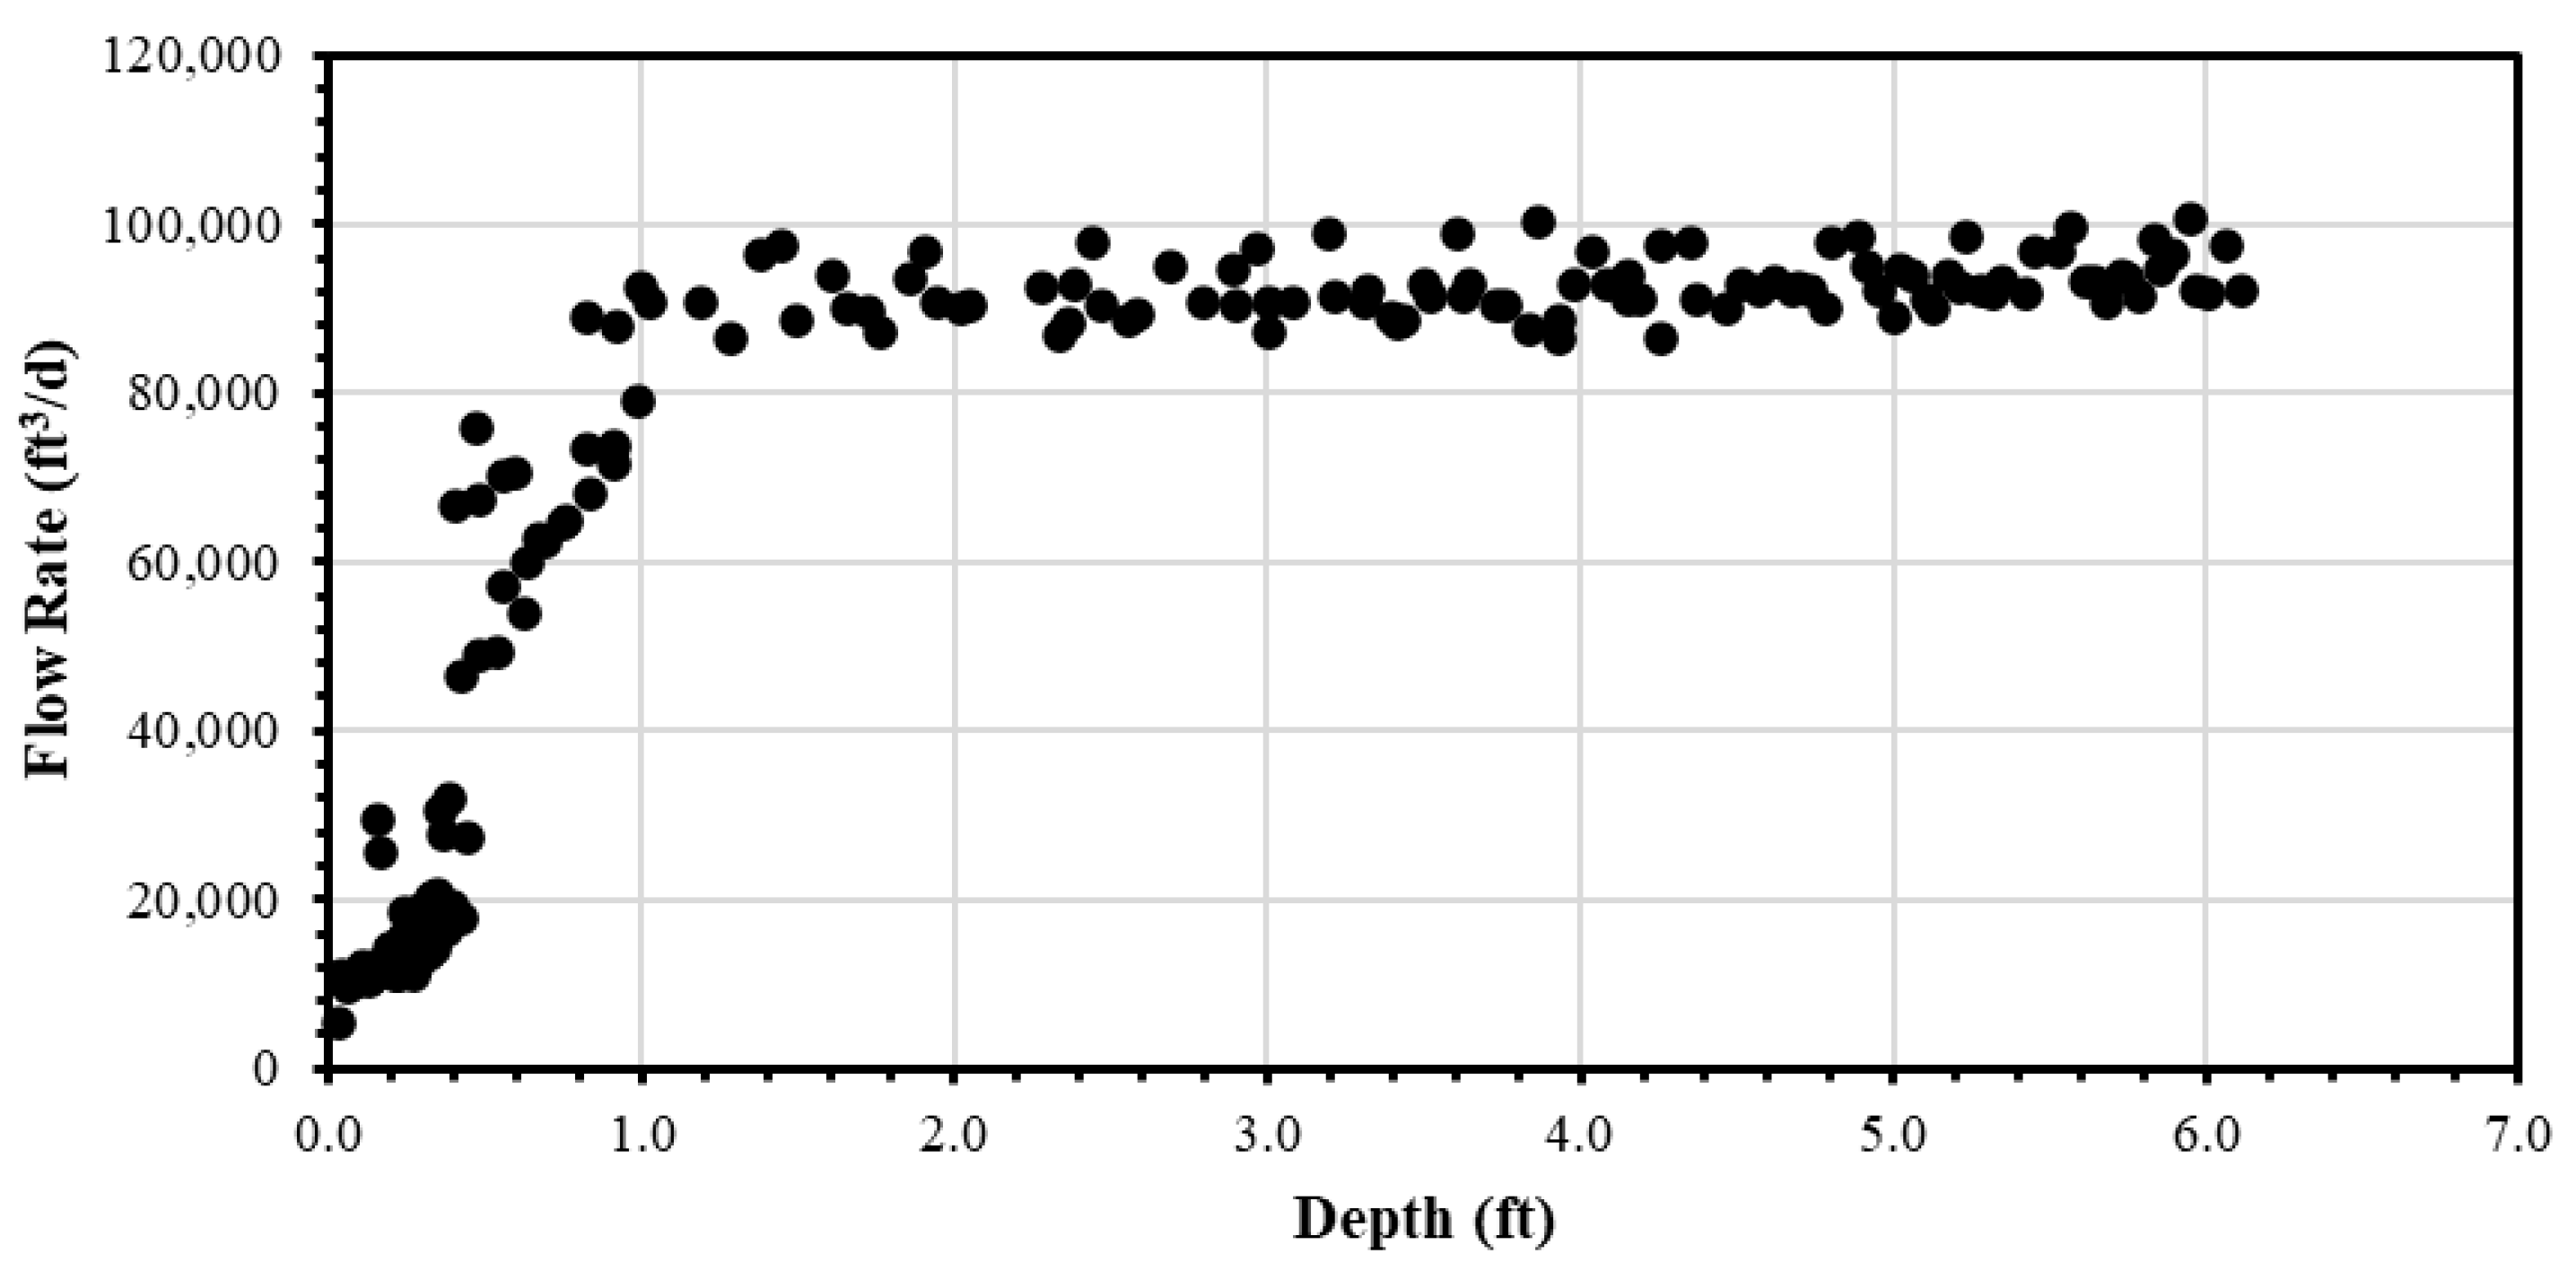
Using the data measured from the Levelogger®, plots were created for each of the eight sediment basin skimmers. The plots feature flow rate as a function of depth for each of the 87 skimmer tests performed. Plots from each triplicate test were combined to observe trends in the data and ultimately create a model to predict the skimmer flow rate at depths below 2.1 m (7 ft). Outliers in each dataset were removed based on a combination of visual observations and the z-score method when constructing the plots. Figure 6 depicts an example of a flow rate versus depth graph plotted for the 8 in. (20.3 cm) skimmer with a 100% open slider configuration. This graph features combined data from each of the three tests performed for this configuration, represented by the black dots.
For all evaluated skimmer configurations, a similar trend was observed: the plots could be divided into two sections (labeled as Zone 1 and Zone 2). Zone 1 reflects the section in which the flow rate decreases to zero, while Zone 2 reflects the section starting at the greatest depth until a turn is observed, where the flow rate begins to decline more rapidly. For example, in the 100% open configuration data set shown in Figure 6, Zone 2 ranges from 1.86 m (6.1 ft) to 0.34 m (1.1 ft). The start of Zone 1 occurs at 0.34 m (1.1 ft) and encompasses depths less than 0.34 m (1.1 ft). The transition point observed in the plot represents the shift from subcritical to supercritical flow, as confirmed by the dataset and by visual and auditory observations throughout testing. Since the transition describes a gradual shift in flow behavior and varied slightly among individual tests in a triplicate, the transition point was selected visually for consistency and repeatability. The plot was divided into two linear sections for modeling purposes and to better portray flow behavior, particularly in Zone 2, which accounts for the majority of dewatering time and is most applicable to real-world performance. Zone 2 behaves approximately linearly due to factors such as entrance and friction losses, barrel angle, and the presence of air in the barrel. With dominating losses, flow does not simulate ideal simple orifice flow conditions; instead, the system responds linearly as depth decreases.
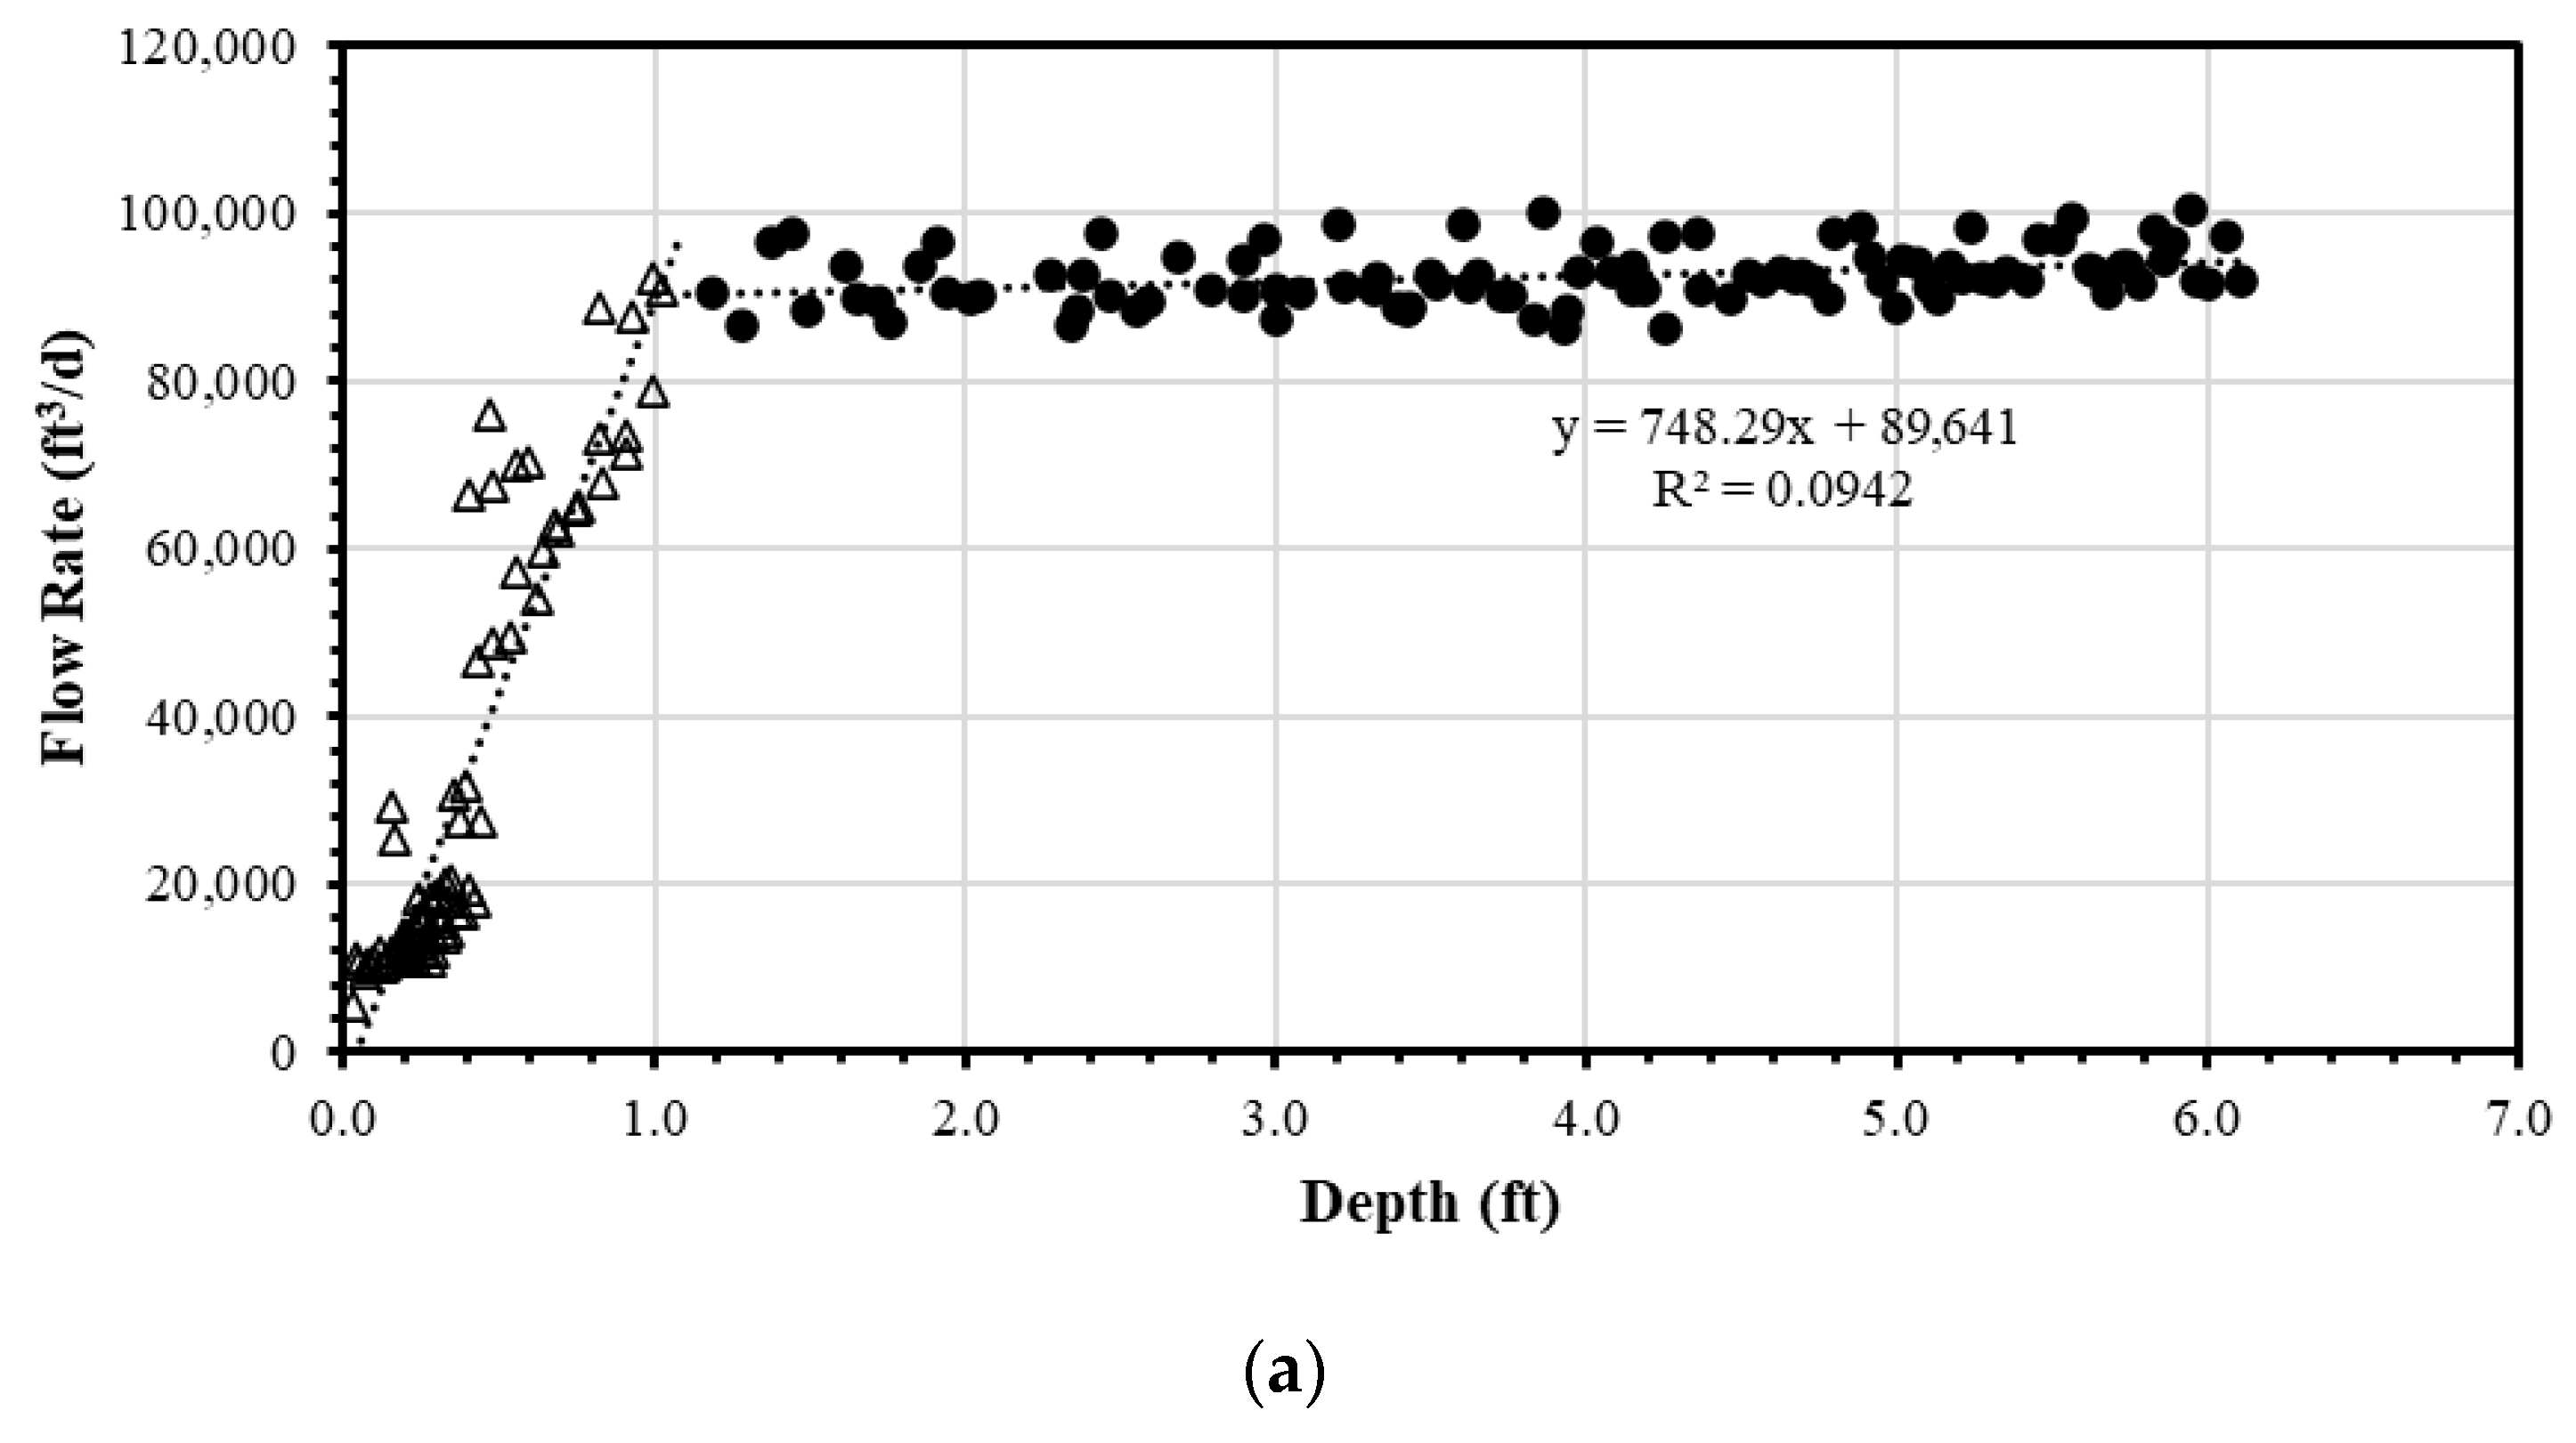
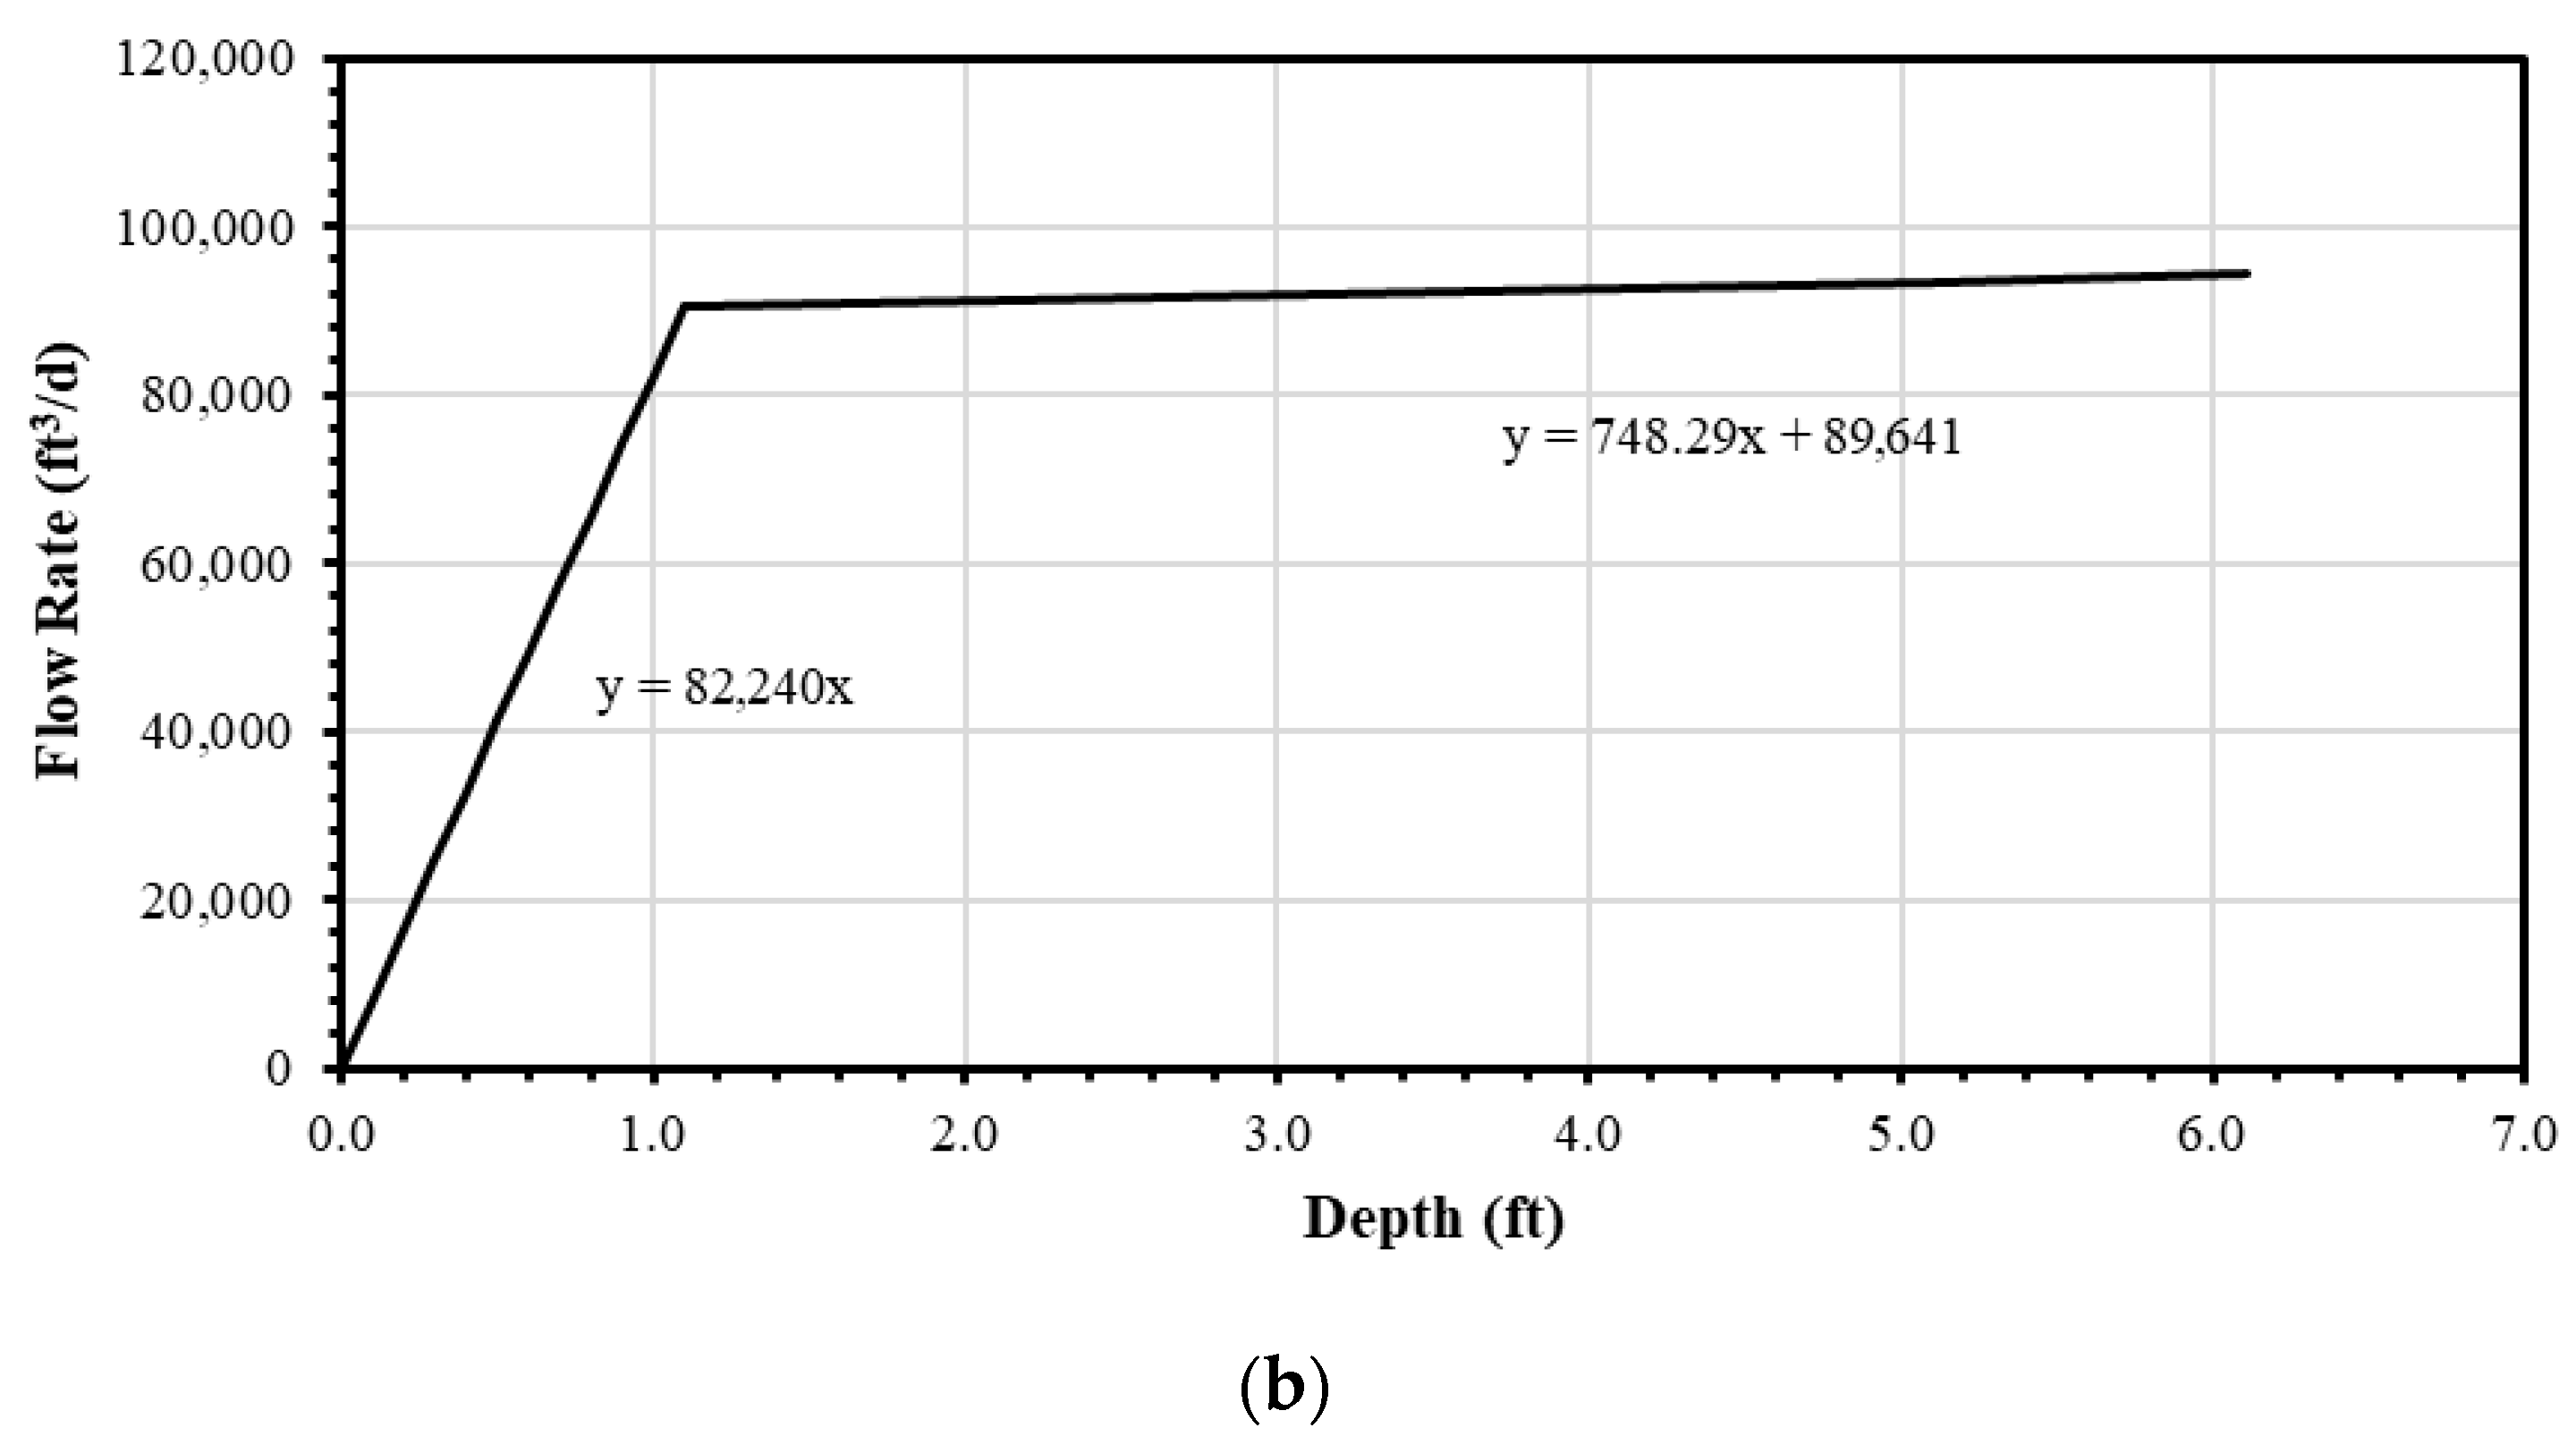
The linear equation extracted from the Zone 2 section was used to create a model to predict the flow rate at a given depth in the evaluation tank. Using the linear equation from Zone 2 and the transition depth, a new slope was calculated to model Zone 1 as the flow decreases to zero. Figure 7a displays a plot featuring the same data set shown in Figure 6; however, it depicts Zone 1 and Zone 2 split into two individual linear sections. Zone 2 is represented by the black dots, while Zone 1 is represented by the triangles. The dotted lines represent the best-fit linear trendline. Figure 7b exhibits the model created using the linear equations acquired from the plot in Figure 7a.
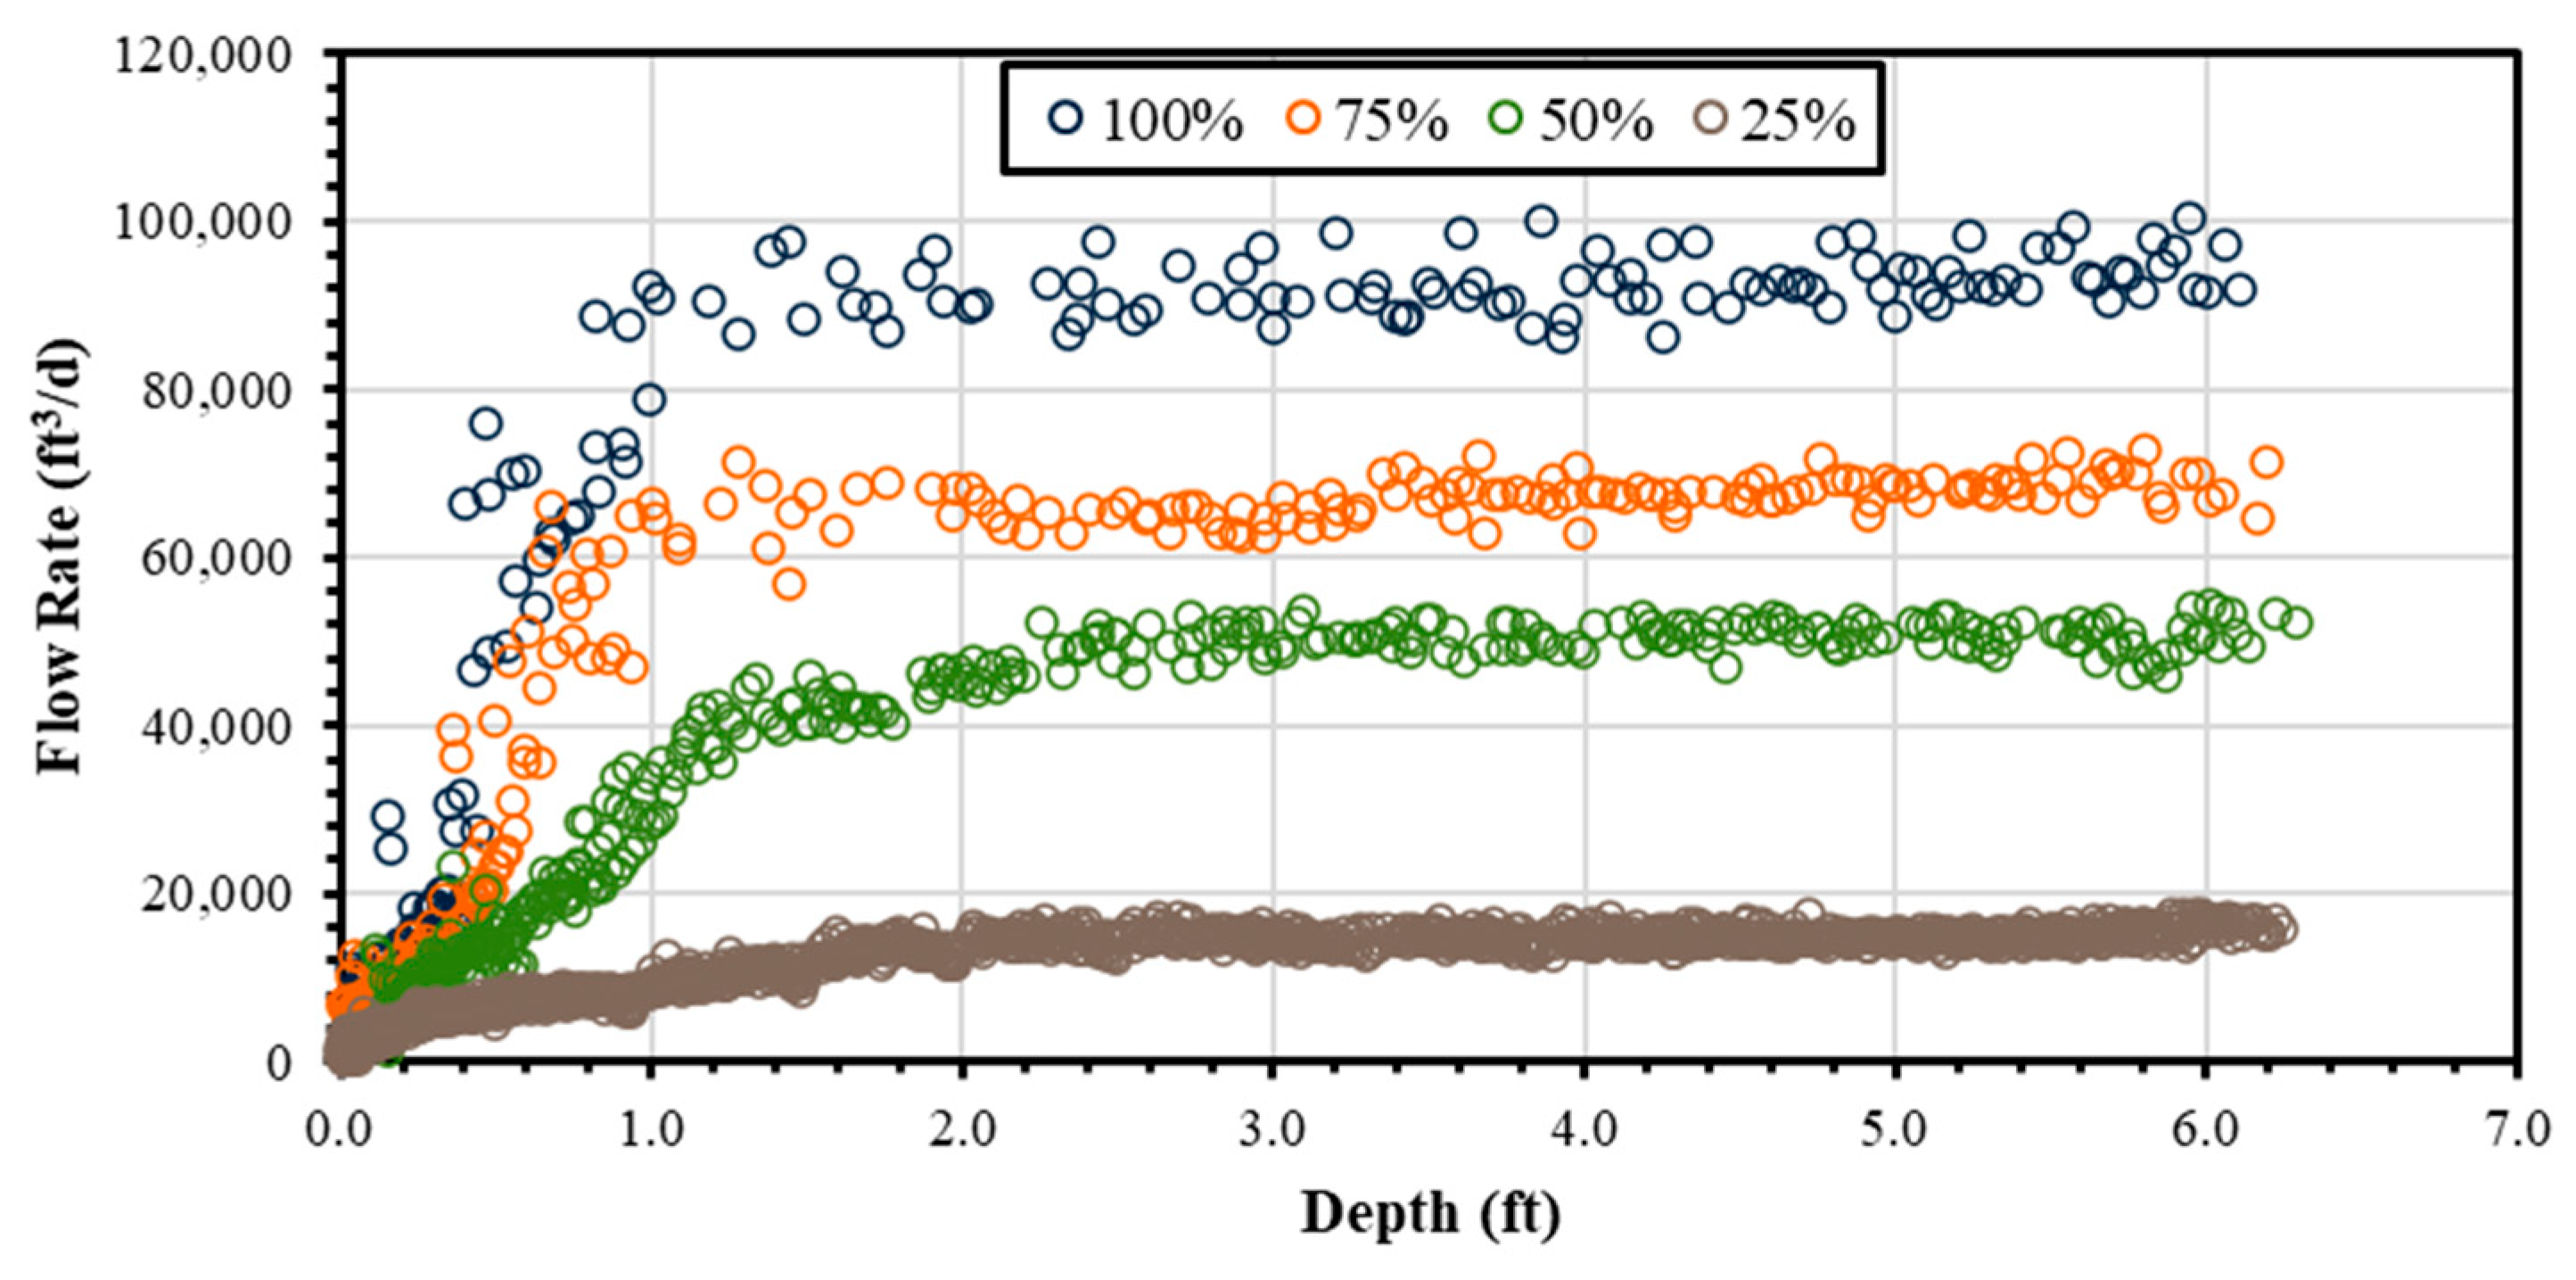
It should be noted that the R2 value is relatively low in Figure 7a due to the low variability in the dataset. Therefore, Mean Absolute Percentage Error (MAPE) was used to better describe the variance in Zone 2. The Zone 2 trendline equation was used to predict flow rate values. The MAPE of this skimmer configuration is 2.75%, indicating a low magnitude of error. This process was repeated for all skimmer configurations. Once all slider openings were tested for each skimmer, the datasets were combined to examine the differences in skimmer behavior across all slider configurations. Figure 8 shows the data sets for all four slider configurations assessed for the 8 in. (20.3 cm) skimmer.
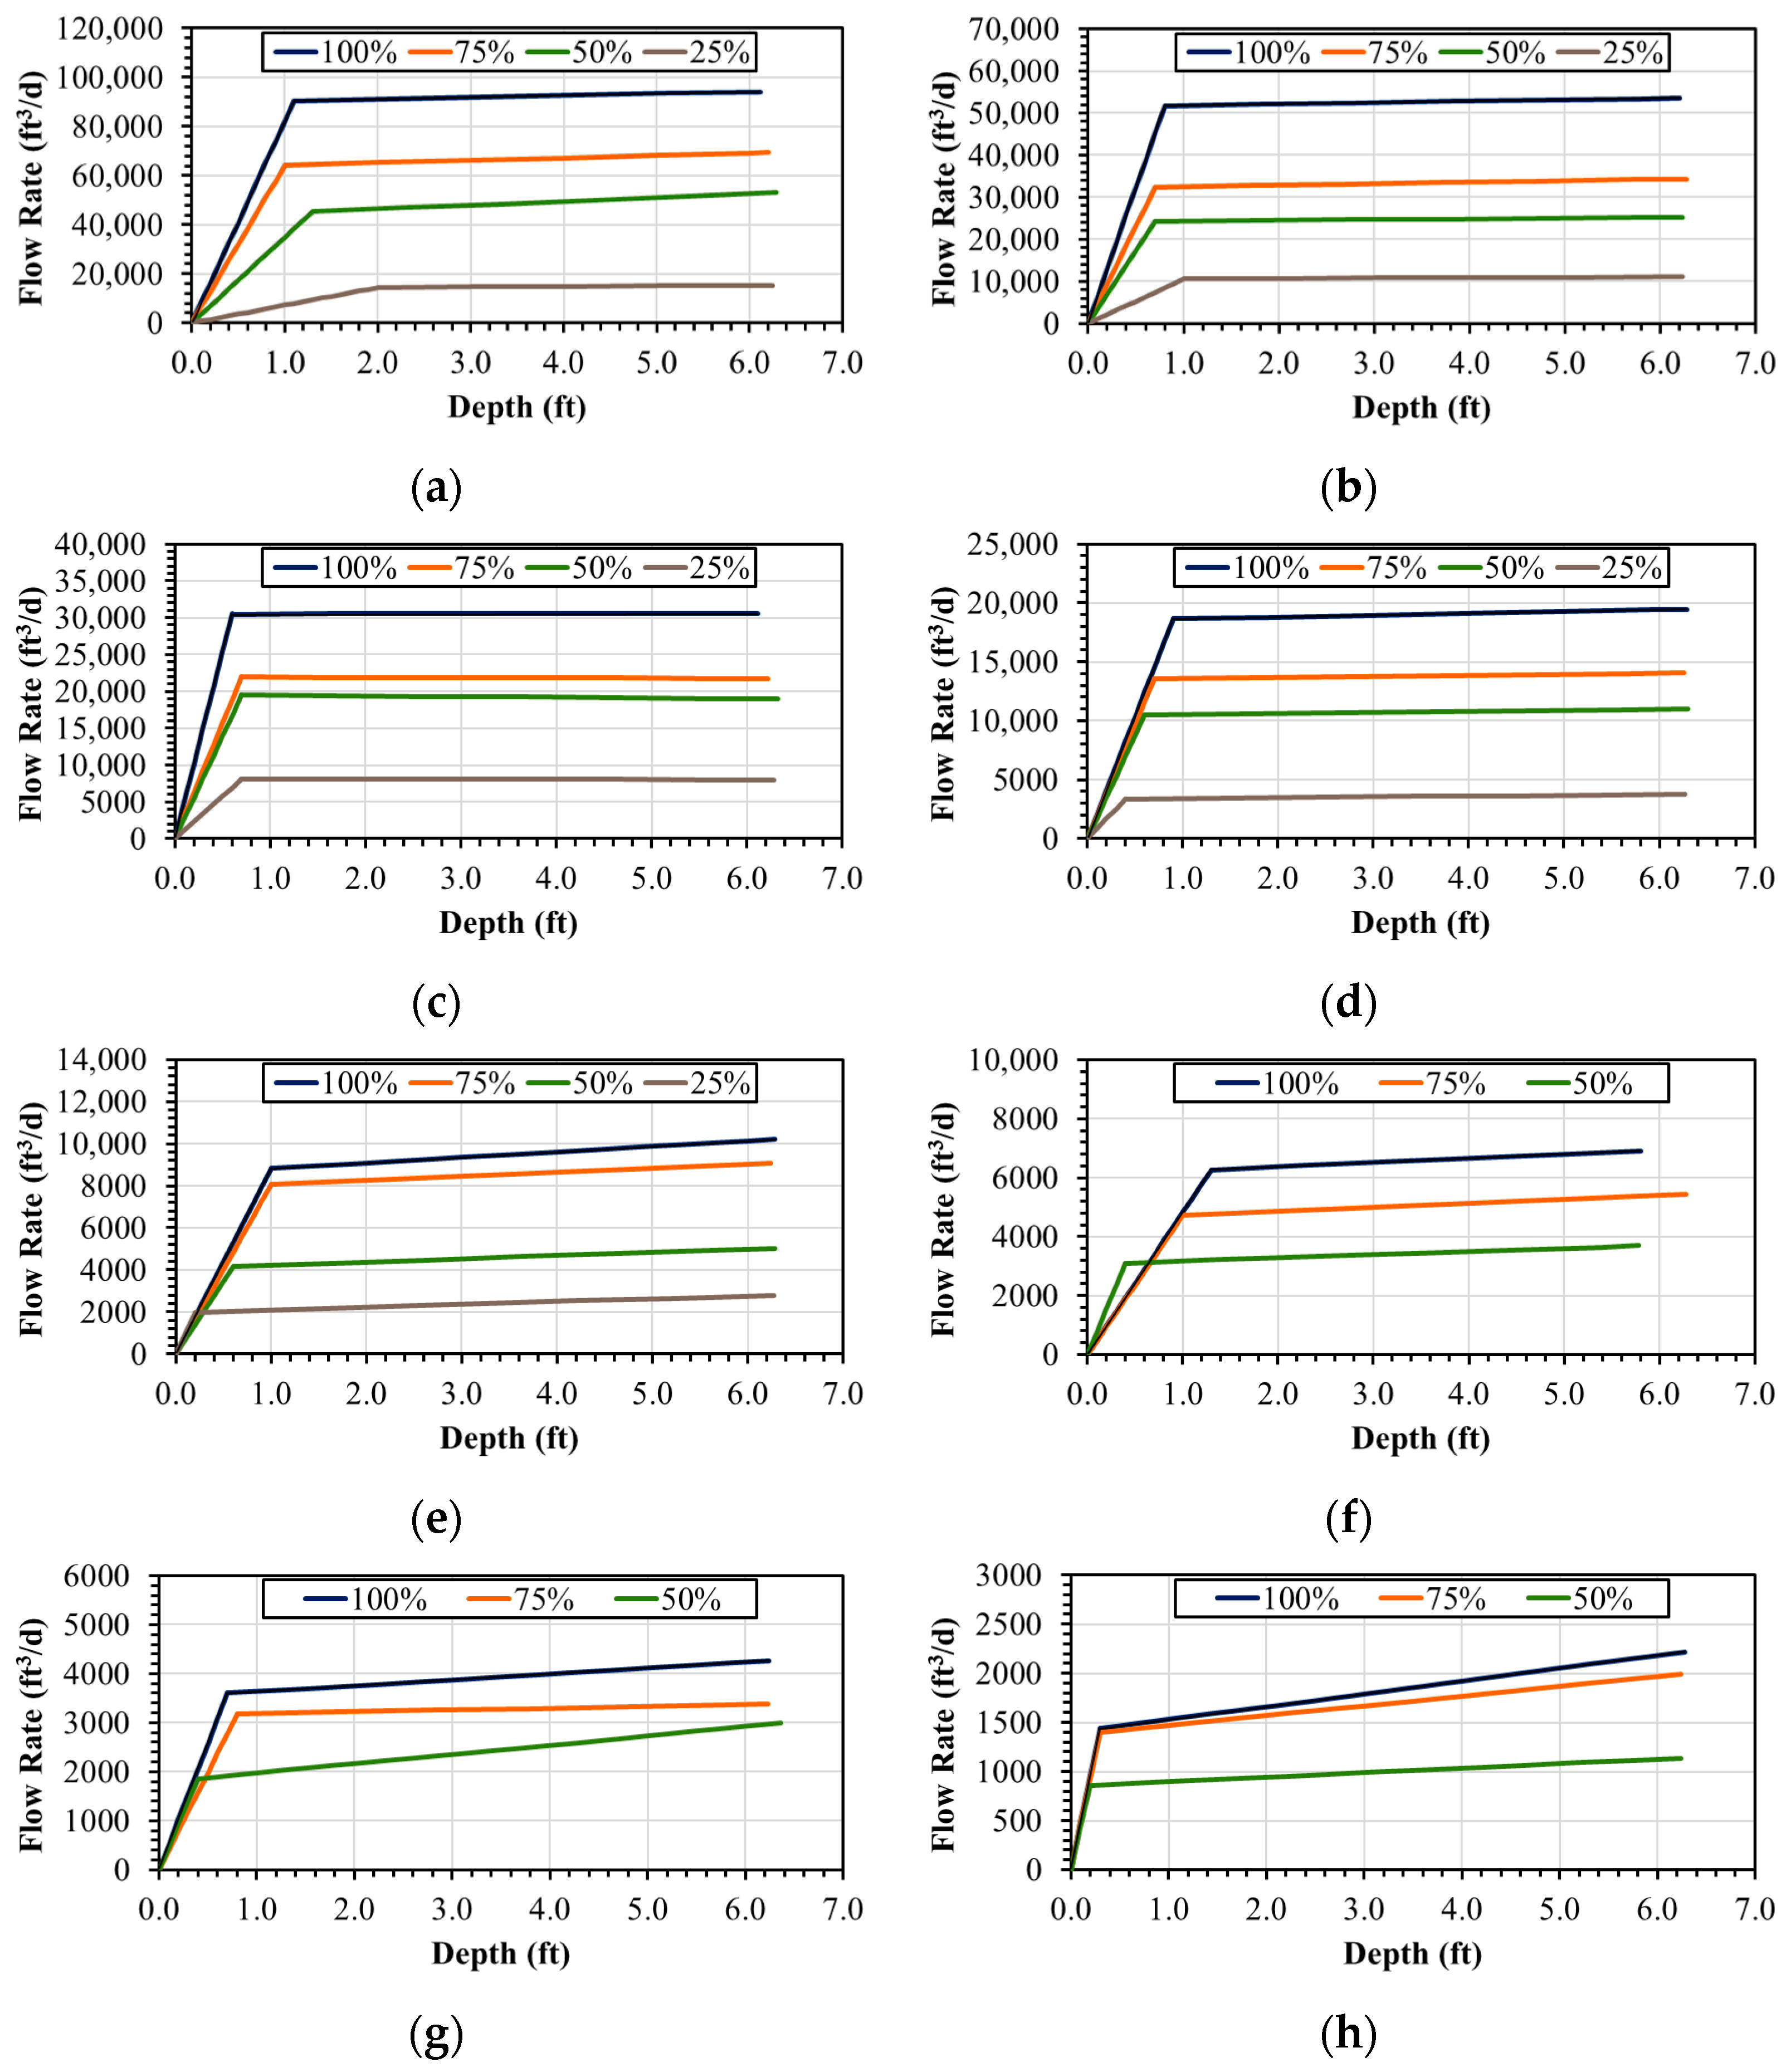
Skimmer performance varied across slider configurations. The depth at which the transition occurred between Zone 1 and Zone 2 differed for each opening. When the slider was set to 100% open, the transition happened at 0.34 m (1.1 ft), 0.30 m (1.0 ft) at 75% open, 0.40 m (1.3 ft) at 50% open, and 0.61 m (2.0 ft) at 25% open. The transition depths likely varied due to the change in the angle of the barrel, changes in head acting on the orifice, and airflow impacting water velocity flowing through the inlet. This study did not evaluate the hydrodynamic activity at the inlet. Figure 9 presents flow rate versus depth models for all skimmer sizes and slider configurations assessed.
Figure 9 illustrates how each skimmer configuration resulted in a unique relationship between flow and depth. Performance among certain slider configurations was not necessarily evenly distributed. For example, Figure 9c shows less variation between the 75% and 50% open configurations on the 12.7 cm (5 in.) skimmer than the other opening configurations. However, this is not the case across all skimmer sizes. The model for the 7.6 cm (3 in.) skimmer, as seen in Figure 9e, demonstrates that the 100% and 75% open configurations are much closer in proximity, as well as the 50% and 25% open configurations. Another observation made during testing is how the slider shape alters the orifice. When the slider is set to limit flow, the orifice becomes a weir, which impacts expected skimmer behavior and flow. In addition, the orientation of the slider may impact skimmer performance; since water is no longer being collected through the center of an orifice, air is more likely to enter the inlet on one side. Table 1 presents an example of the linear equations and transition depths used to create the models for the 20.3 cm (8 in.) skimmer configuration shown in Figure 9.
Once testing was completed and plots were constructed for each skimmer and slider configuration, average flow rates were calculated using data from each triplicate test. Average flow rates were taken using only Zone 2 data. Zone 2 data was used because it most accurately represents skimmer behavior throughout the majority of the test’s duration and, likewise, their usage in sediment basins. Table 2 displays the Zone 2 average flow rates for each evaluated skimmer configuration
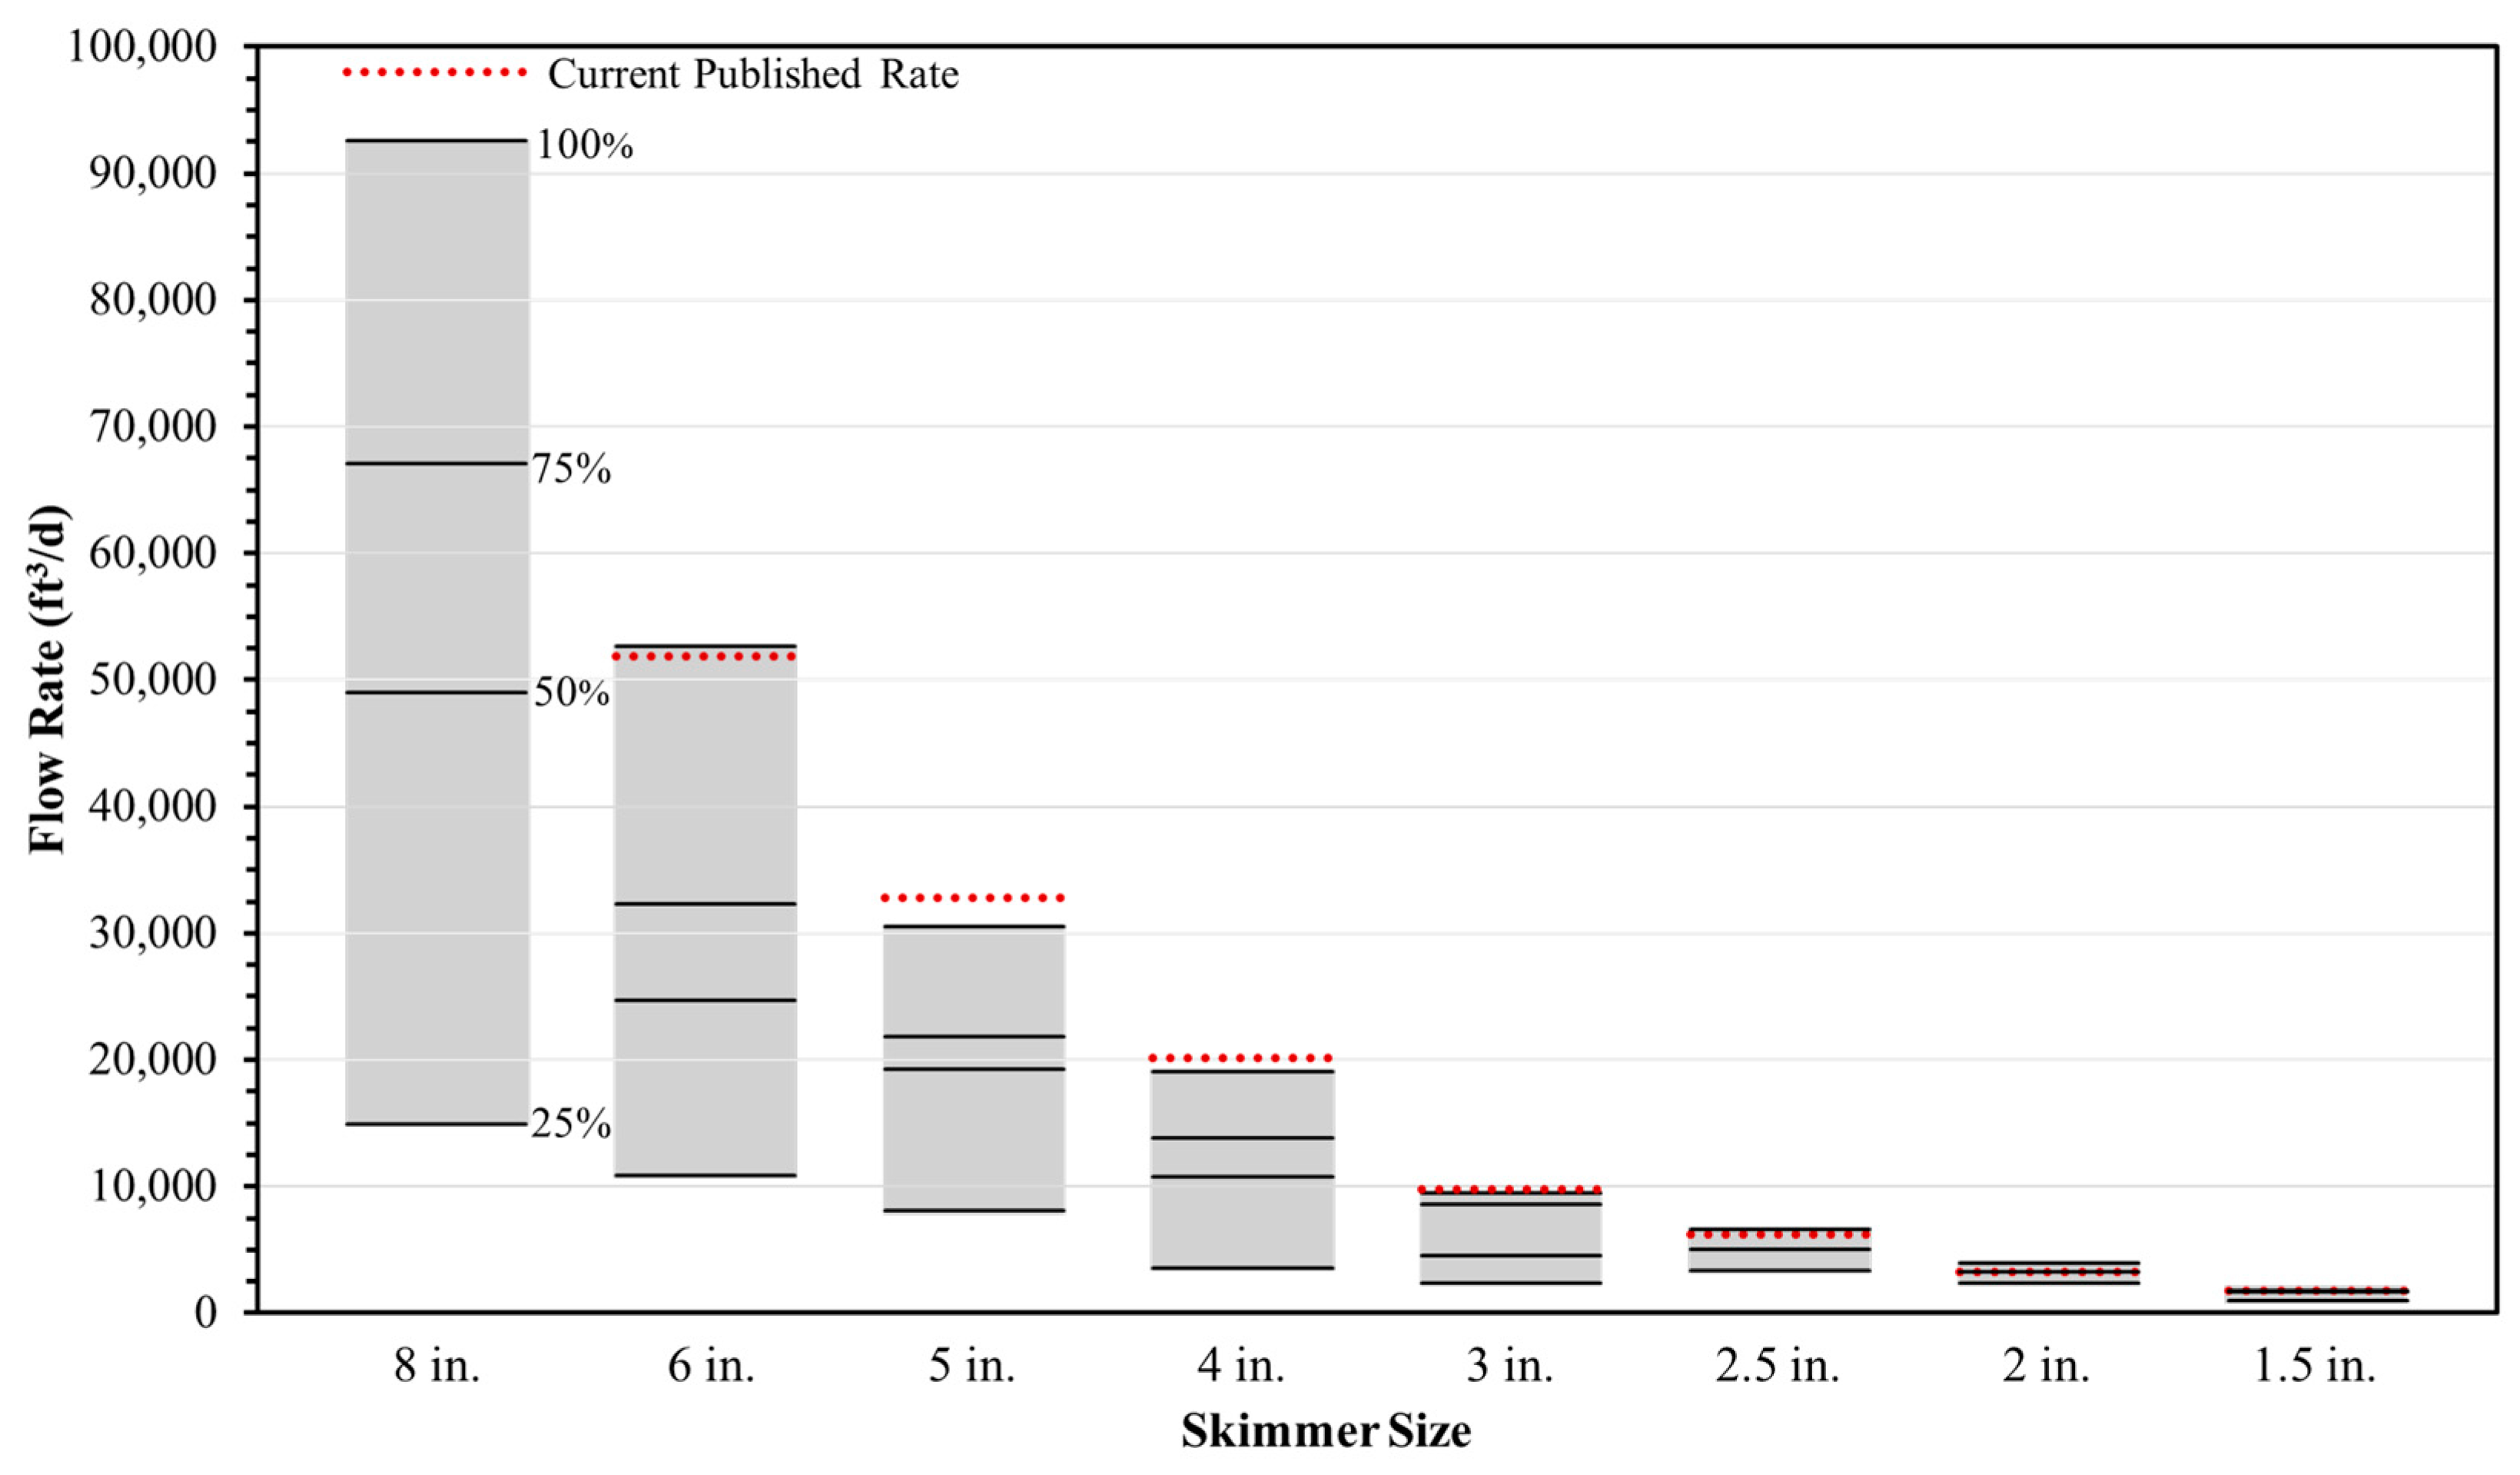
Table 2 shows that flow rates range from as high as 2622 m3/d (92,585 ft3/d) on the 20.3 cm (8 in.) skimmer set to 100% open to as low as 28 m3/d (981 ft3/d) on the 3.8 cm (1.5 in.) skimmer set to 50% open. Compared to previously published flow rates excluding an adjustable orifice slider or plug, the 15.2 cm (6 in.), 6.4 cm (2.5 in.), 5.1 cm (2 in.), and 3.8 cm (1.5 in.) skimmers had greater experimentally tested flow rates. Conversely, the 20.3 cm (8 in.), 12.7 cm (5 in.), 10.2 cm (4 in.), and 7.6 cm (3 in.) skimmers had lower experimentally tested flow rates. Average flow rates were then used to create a visual representation to distinguish how the flow rates overlap among each skimmer configuration, as seen in Figure 10.
Once average flow rates were obtained for each skimmer configuration, experimental flow rates were compared to theoretical flow rates. Theoretical flow rates were computed using Equation (2) and the orifice flow equation as seen in Equation (3).
Q = C d A 2 g h
where Q is the discharge rate (m3/s or ft3/s), Cd is the coefficient of discharge, A is the orifice area (m2 or ft2), g is the acceleration due to gravity (9.81 m/s2 or 32.2 ft/s2), and h is the head acting on the orifice (m or ft) [23]. The Cd value selected is 0.6 for sharp orifices. Head values used in Equations (2) and (3) were derived from those found in a study by Jarrett [18], which are based on a given skimmer size. In addition, areas of inlets configured to non-100% openings were calculated by summing the areas of two circular segments. Table 3 compares the computed theoretical flow rates from Equations (2) and (3) with the experimentally obtained flow rates for the 20.3 cm (8 in.) skimmer across all slider configurations.
The percentage errors for Equation (2) flow rates compared to experimental flow rates are 11.4%, 14.0%, 87.7%, and 128.1% for the 100%, 75%, 50%, and 25% slider openings, respectively. Conversely, the percent error for Equation (3) flow rates are 9.8%, 4.7%, 22.2%, and 0.6% for the 100%, 75%, 50%, and 25% slider openings, respectively. Both equations fail to account for changes in head during drawdown and changes in flow behavior. Equation (2), though based on empirical findings, exhibits greater variability because inlet characteristics and flow conditions differ from those accounted for in this equation.

3.2. Skimmer Sizing Tools

Once testing and analysis were completed for all skimmer configurations, flow rate models were utilized to create an interactive and user-friendly skimmer sizing tool for engineers and designers. The aim of developing a skimmer sizing tool is to apply the experimentally tested flow rate data and simplify the process of selecting an appropriate skimmer and adjustable slider opening based on sediment basin parameters. Two sizing tools were ultimately made: one for engineers and the other for estimators. Both tools were constructed using Microsoft Excel and were designed to be simple and intuitive.
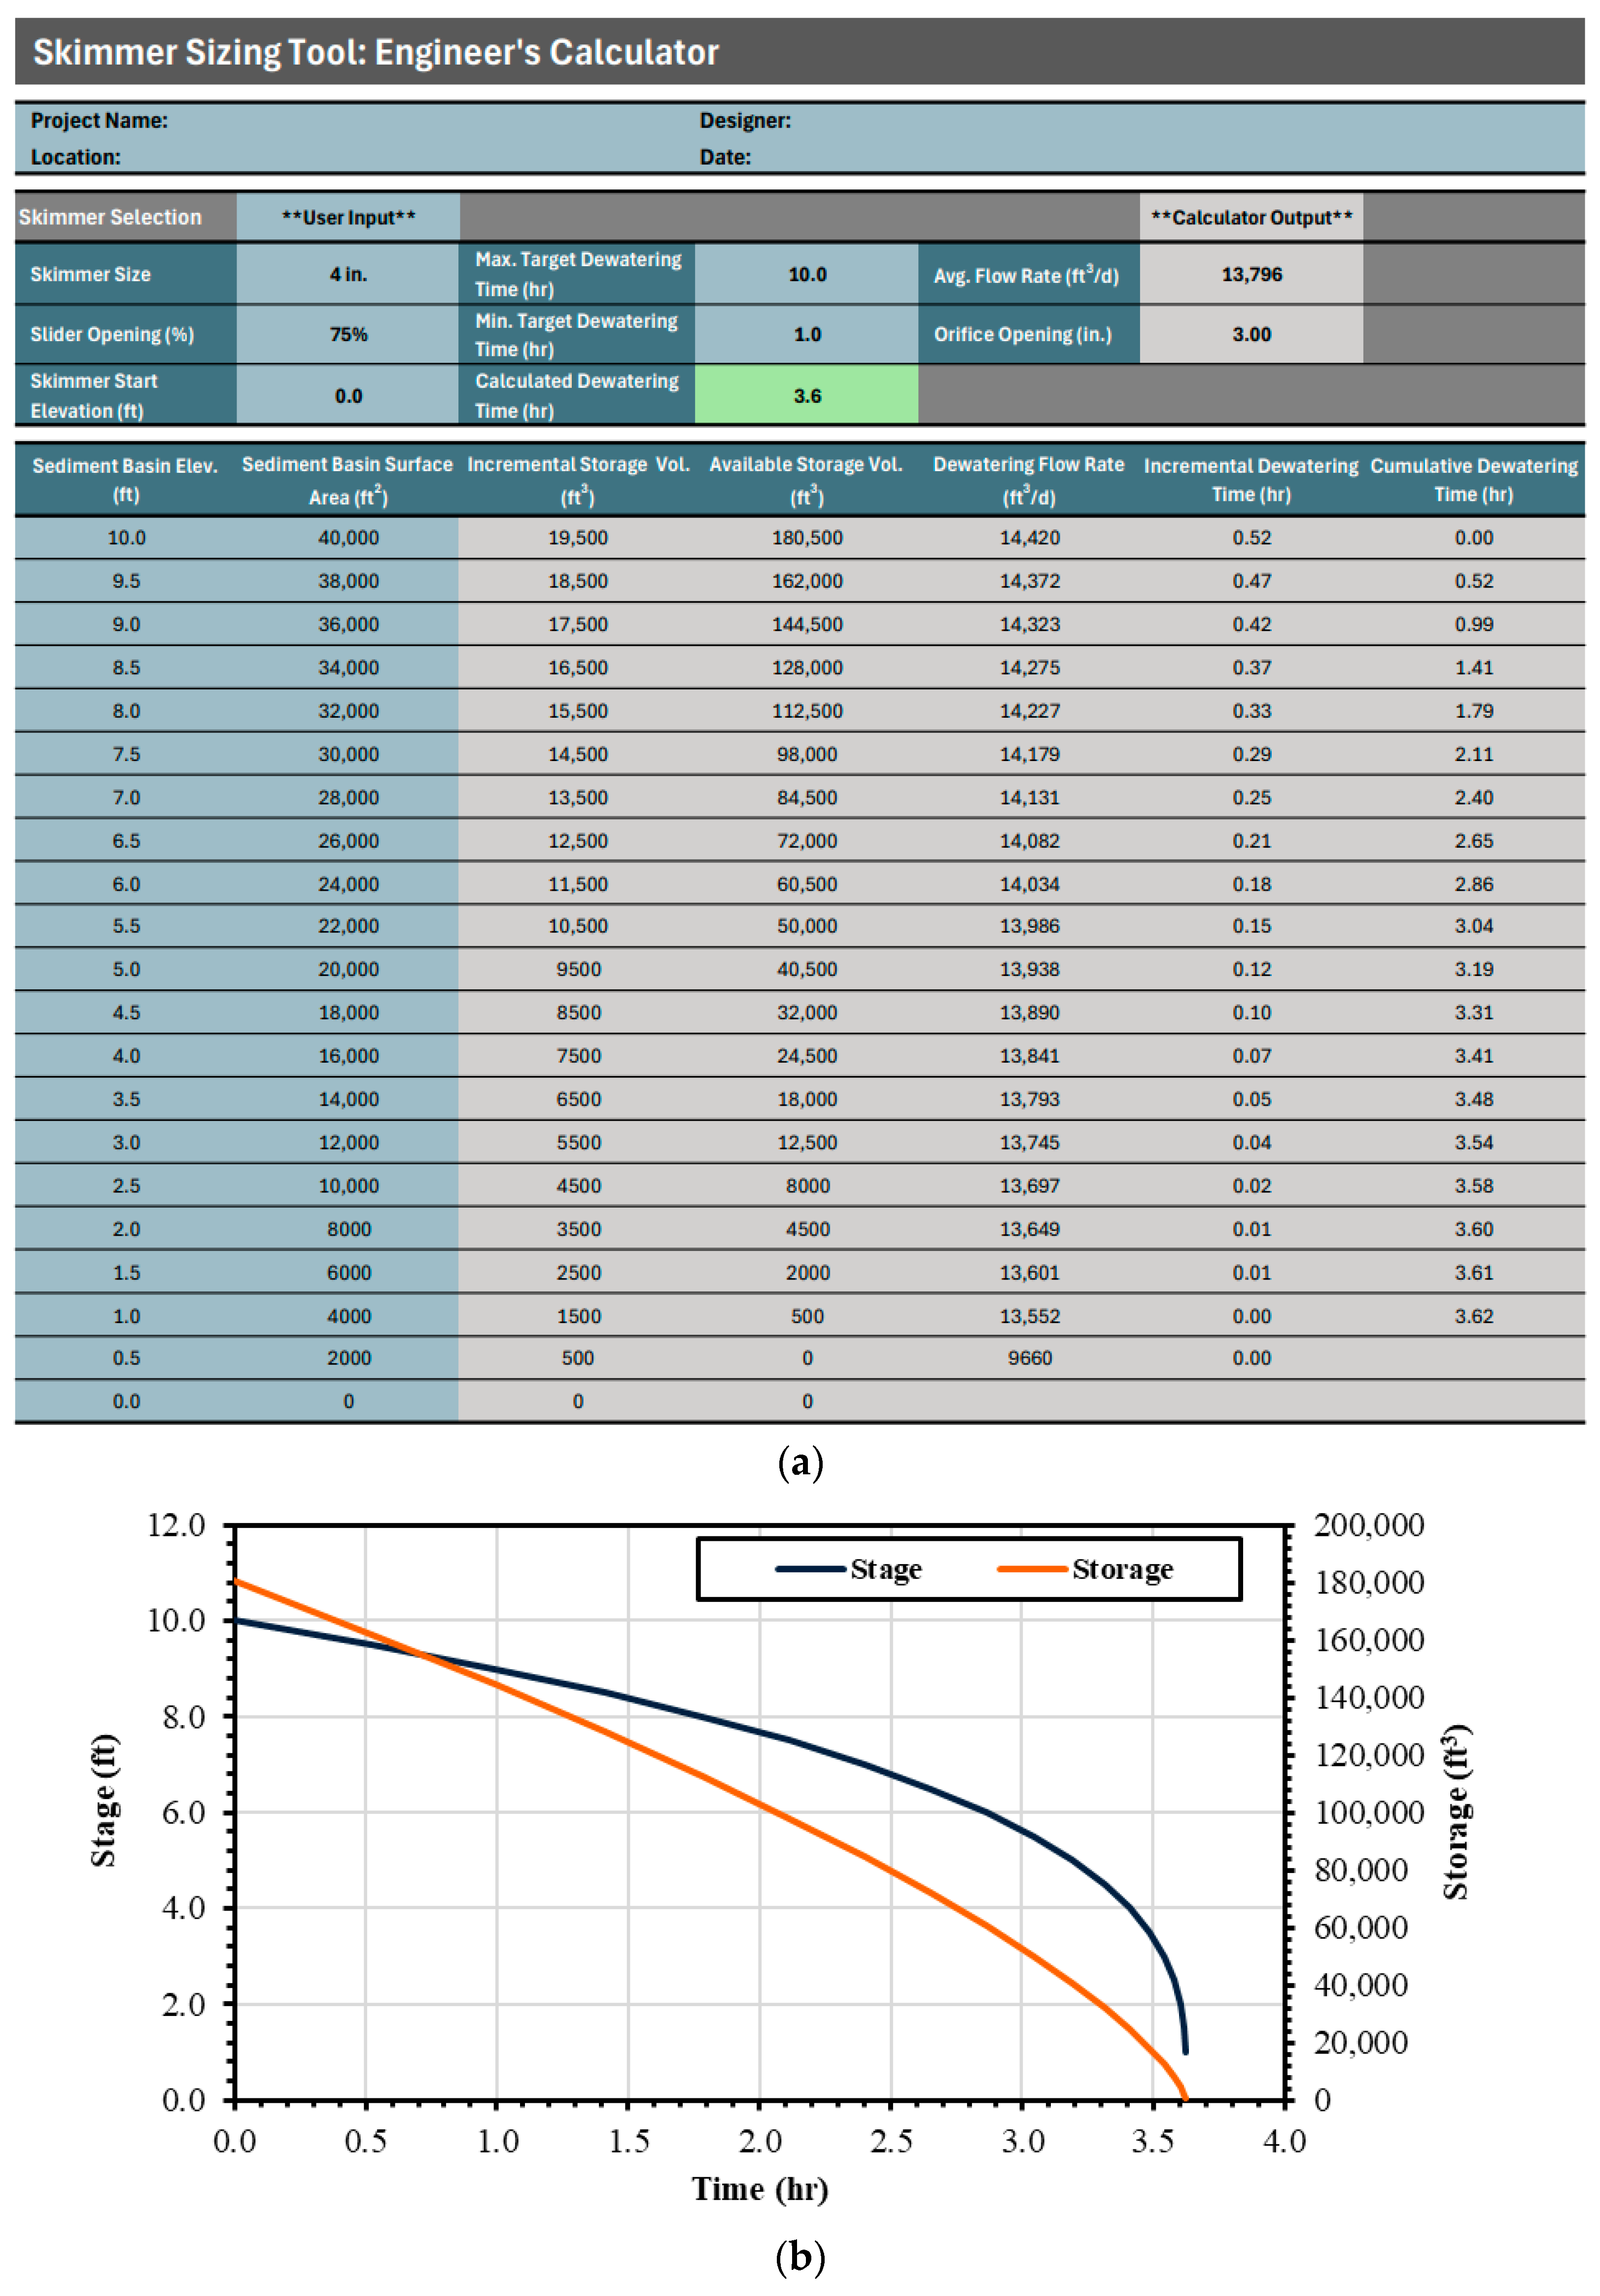
Flow rate models developed during data analysis were used to predict the flow rates provided by the sizing tools. Equations obtained from flow rate models, along with the depth at which the transition from Zone 2 to Zone 1 takes place, were the basis of constructing both sizing tools. The adjustable slider openings range from 50% open to 100% open in 5% increments. Furthermore, 25% open data was not programmed into the sizing tools, as flow rates typically fell within the range of the next smallest skimmer. Linear interpolation was used to estimate flow rates in 5% increments falling between experimentally obtained data at 50%, 75%, and 100% openings. The engineer’s calculator describes the stage–storage relationship that occurs as a skimmer is dewatering a sediment basin. Figure 11a illustrates an example of the engineer’s calculator interface after all necessary information is entered. Cells requiring user input are highlighted in blue, while values provided by the tools are highlighted in gray. In addition, Figure 11b shows a stage–storage relationship graph generated by the engineer’s calculator based on the values input in Figure 11a.
The tool provides the average flow rate, available storage, and dewatering time. The user must input their sediment basin parameters, including elevation and corresponding surface area at each stage. Next, the user selects their desired skimmer size and slider opening, along with anticipated maximum and minimum dewatering times. The user also has the option to choose a skimmer start elevation, which dictates the depth at which the skimmer will begin dewatering in the sediment basin. The calculator will also present the adjustable slider opening in inches and a graph that illustrates the stage–storage discharge over time. Additionally, the tool indicates if the calculated dewatering time falls within the maximum and minimum target dewatering times; the cell will turn red if the value falls outside the desired range or green if the value falls within the range.
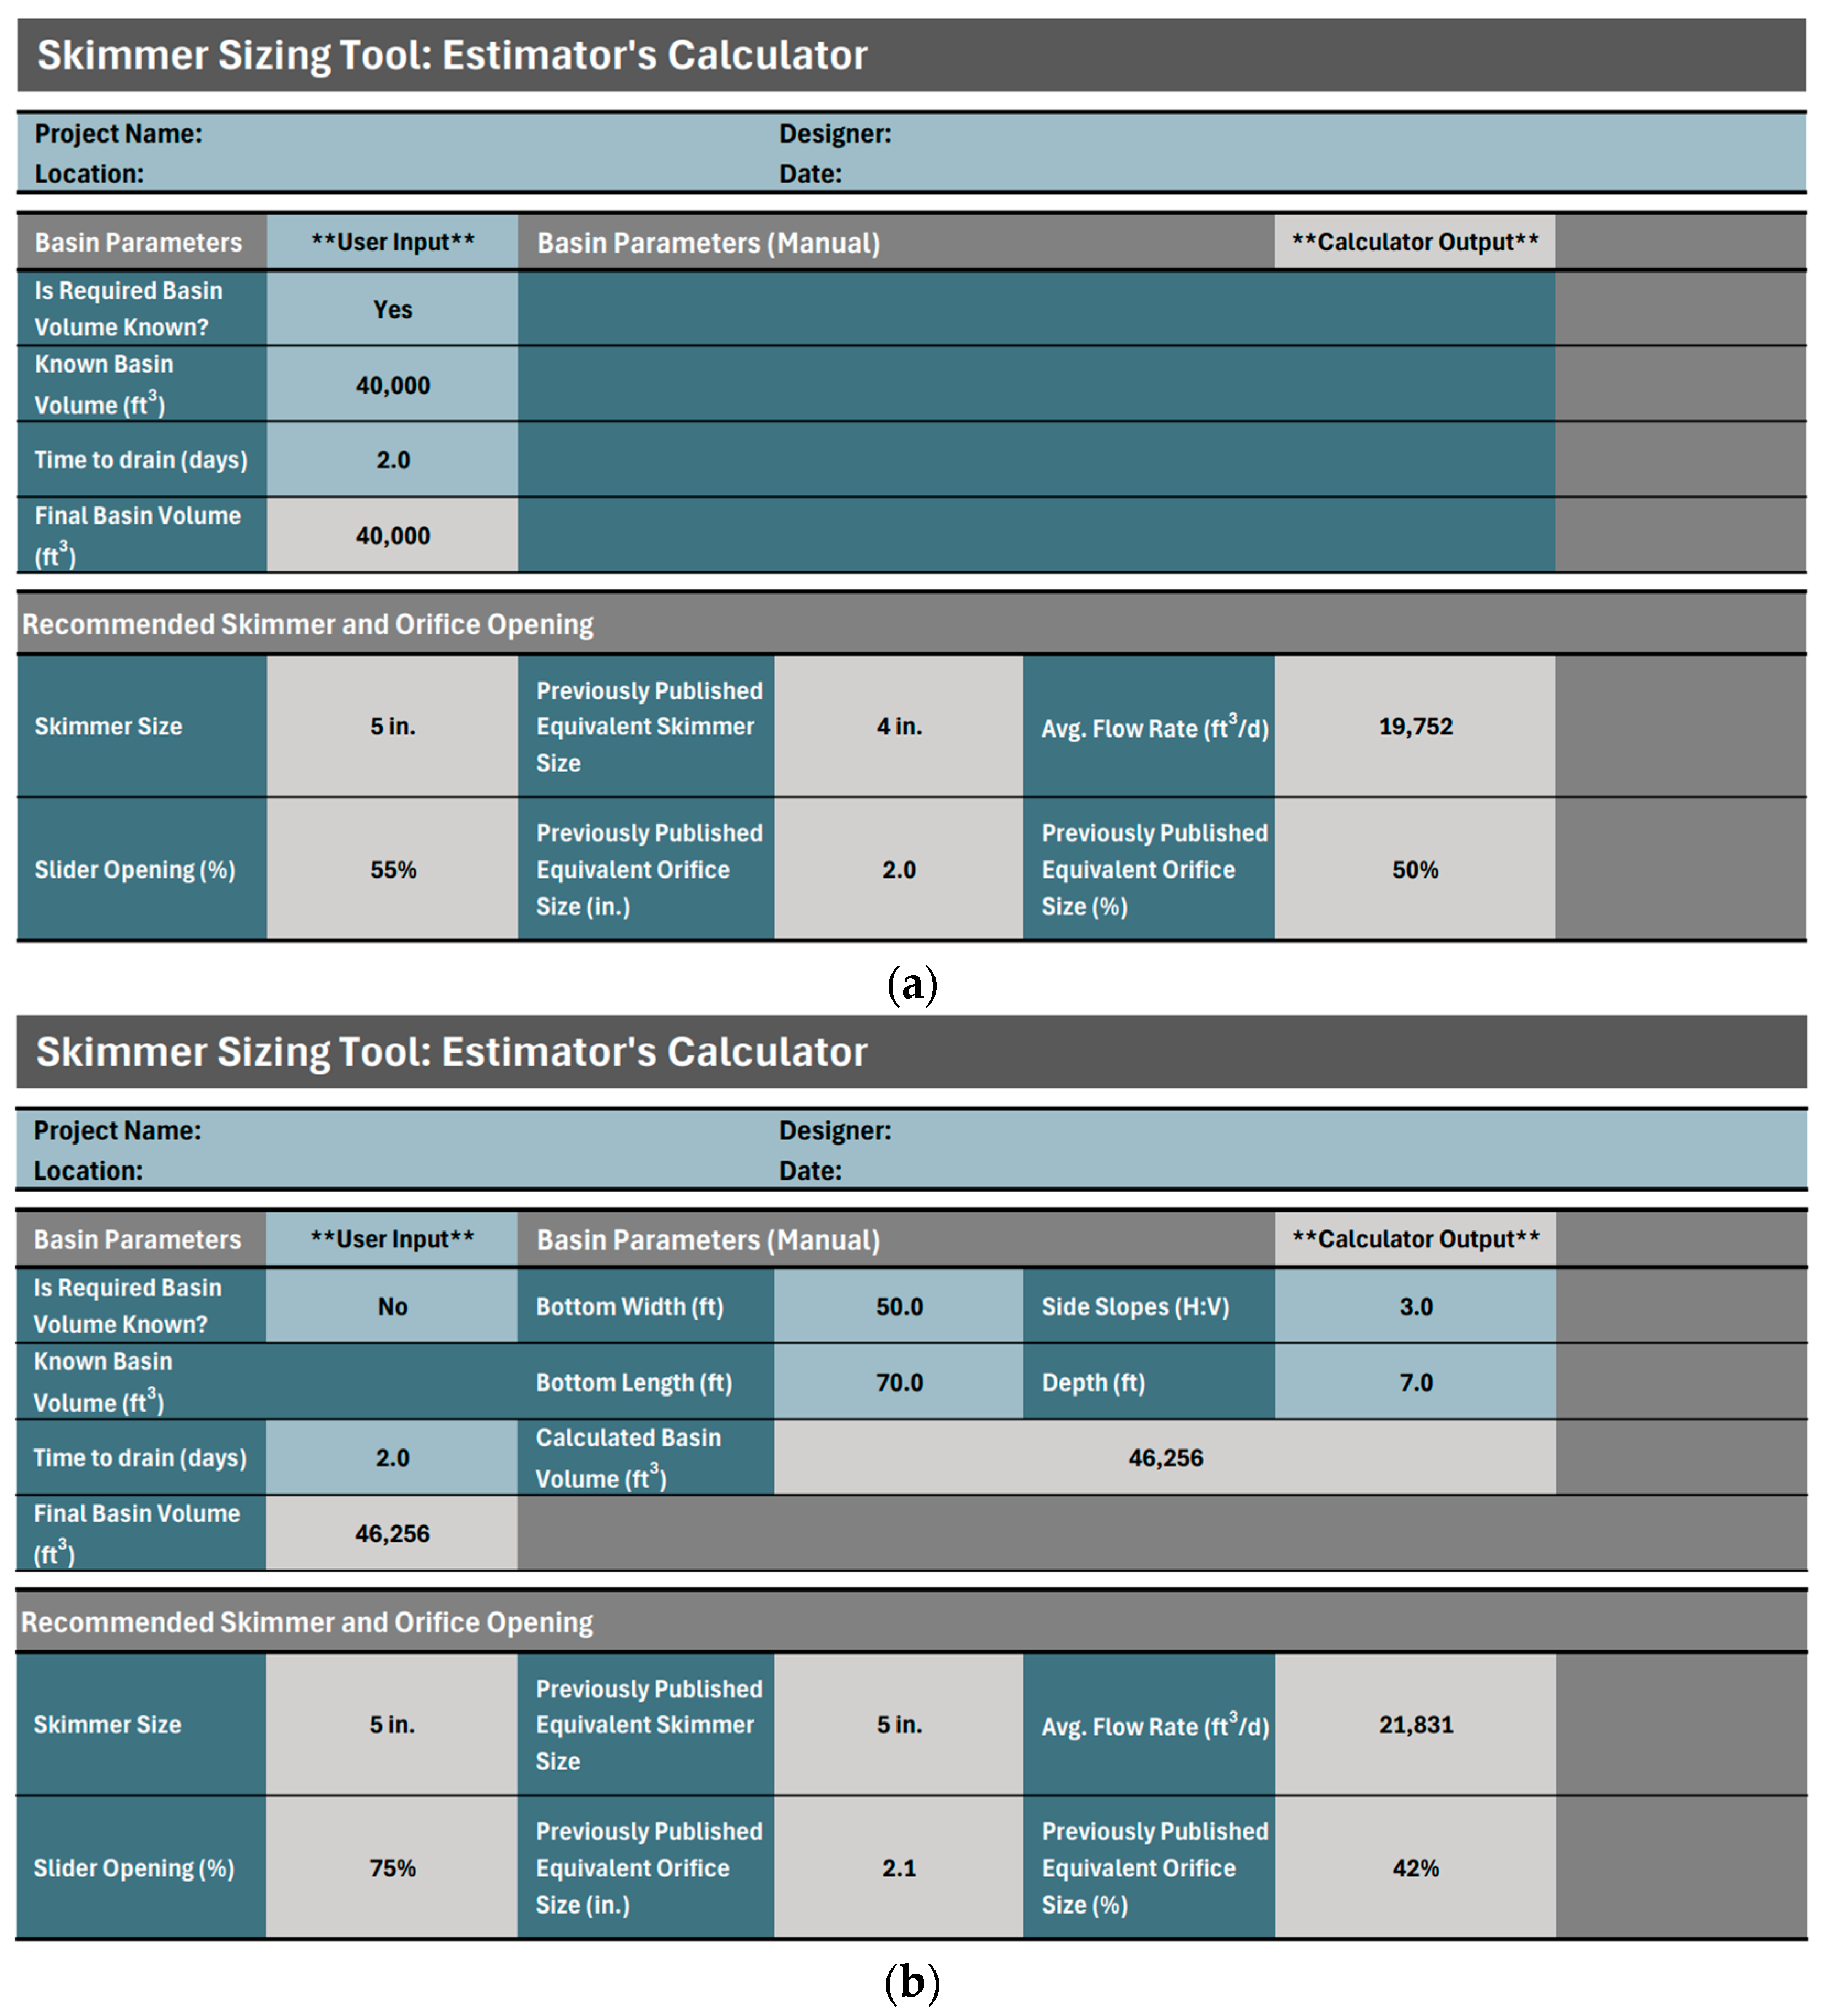
The estimator’s calculator is much simpler than the engineer’s calculator. This tool provides the skimmer size and adjustable slider opening for a given sediment basin volume and time to dewater input by the user. This tool offers users the option of entering a known basin volume, as seen in Figure 12a, or calculating the sediment basin volume based on geometry parameters, as seen in Figure 12b. If the volume of the sediment basin is unknown, the user will input additional geometry parameters used in Equation (4) to determine an approximate volume.
V = L W D + L + W Z D 2 + 4 3 Z 2 D 3
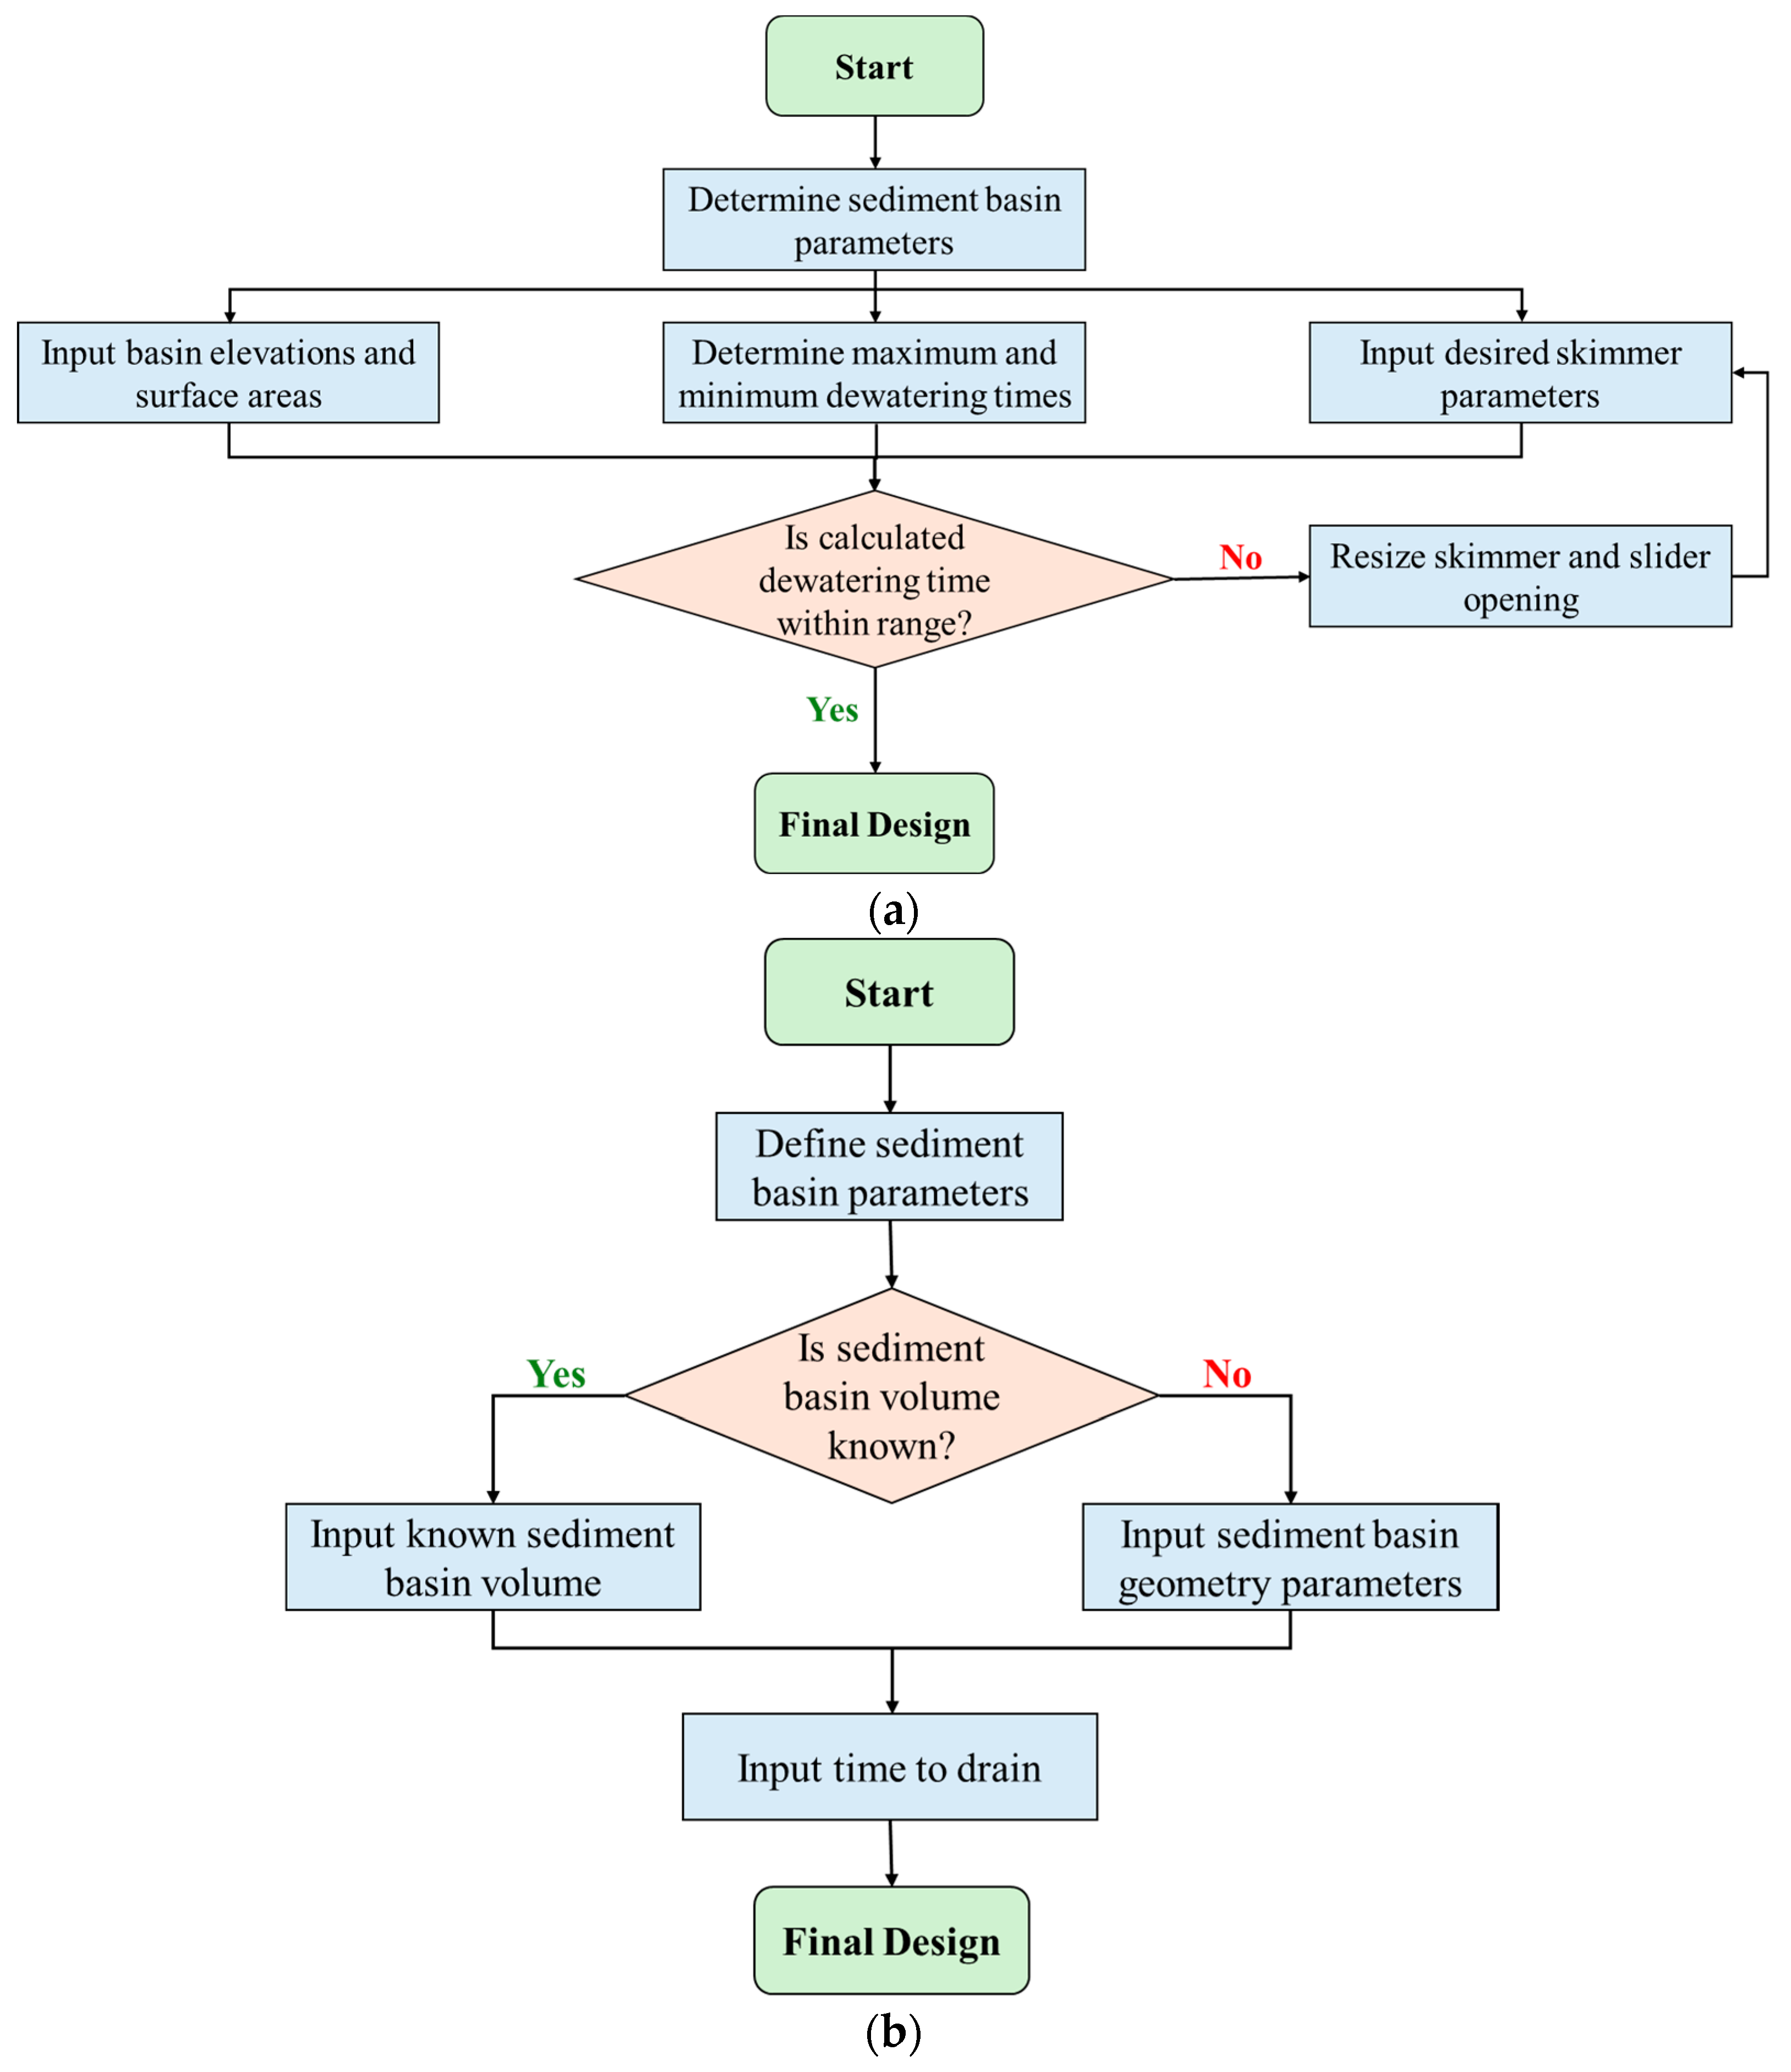
where V is the volume of the sediment basin at a specific depth (m3 or ft3), L is the bottom length of the basin in (m or ft), W is the bottom width of the basin (m or ft), D is the depth of the basin (m or ft), and Z is the horizontal-to-vertical ratio of the side slopes in the basin [24]. It should be noted that this tool provides the total volume, not the required volume of the sediment basin, and professional judgment should be applied when selecting skimmer size. Additionally, this calculator provides the equivalent skimmer size and orifice opening using previously published data and orifice opening calculations. Like the engineer’s calculator, user input boxes are highlighted in blue while values yielded by the sizing tool are highlighted in gray. Figure 13a,b show a logical flowchart depicting the steps needed to use the engineer’s calculator and the estimator’s calculator, respectively.

3.3. Flow Rate Analysis Using Alternative Methods

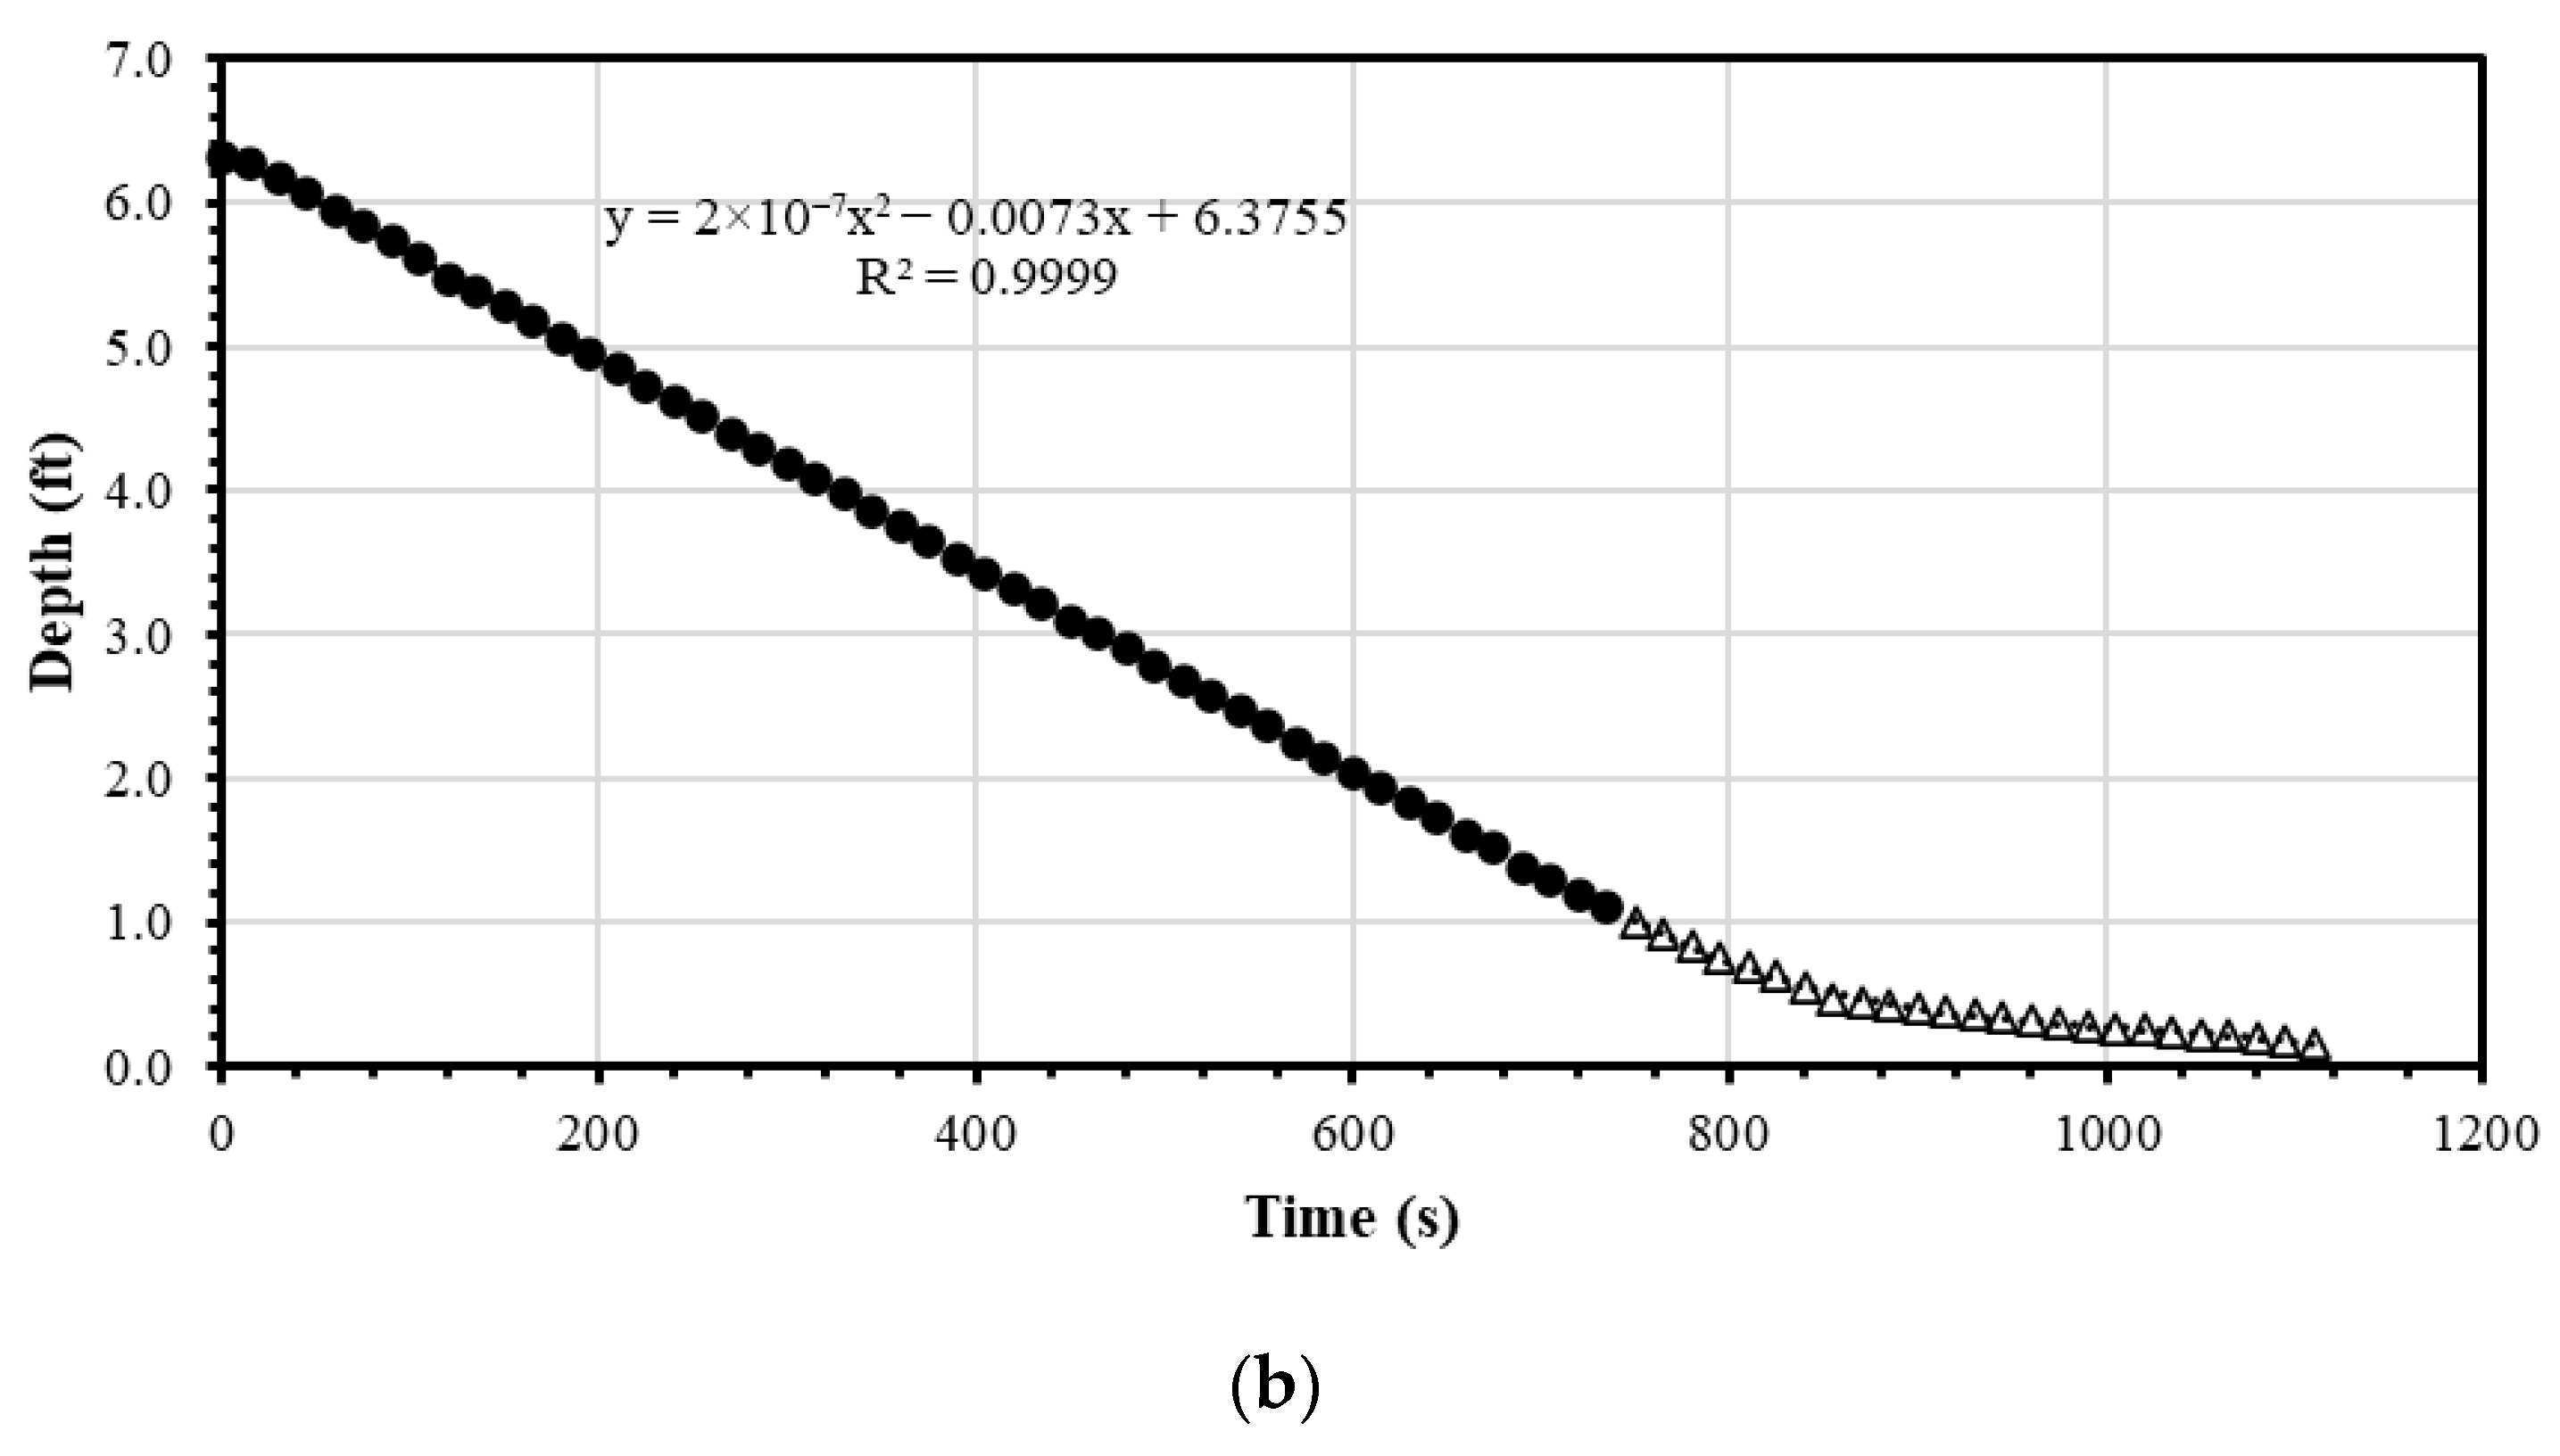
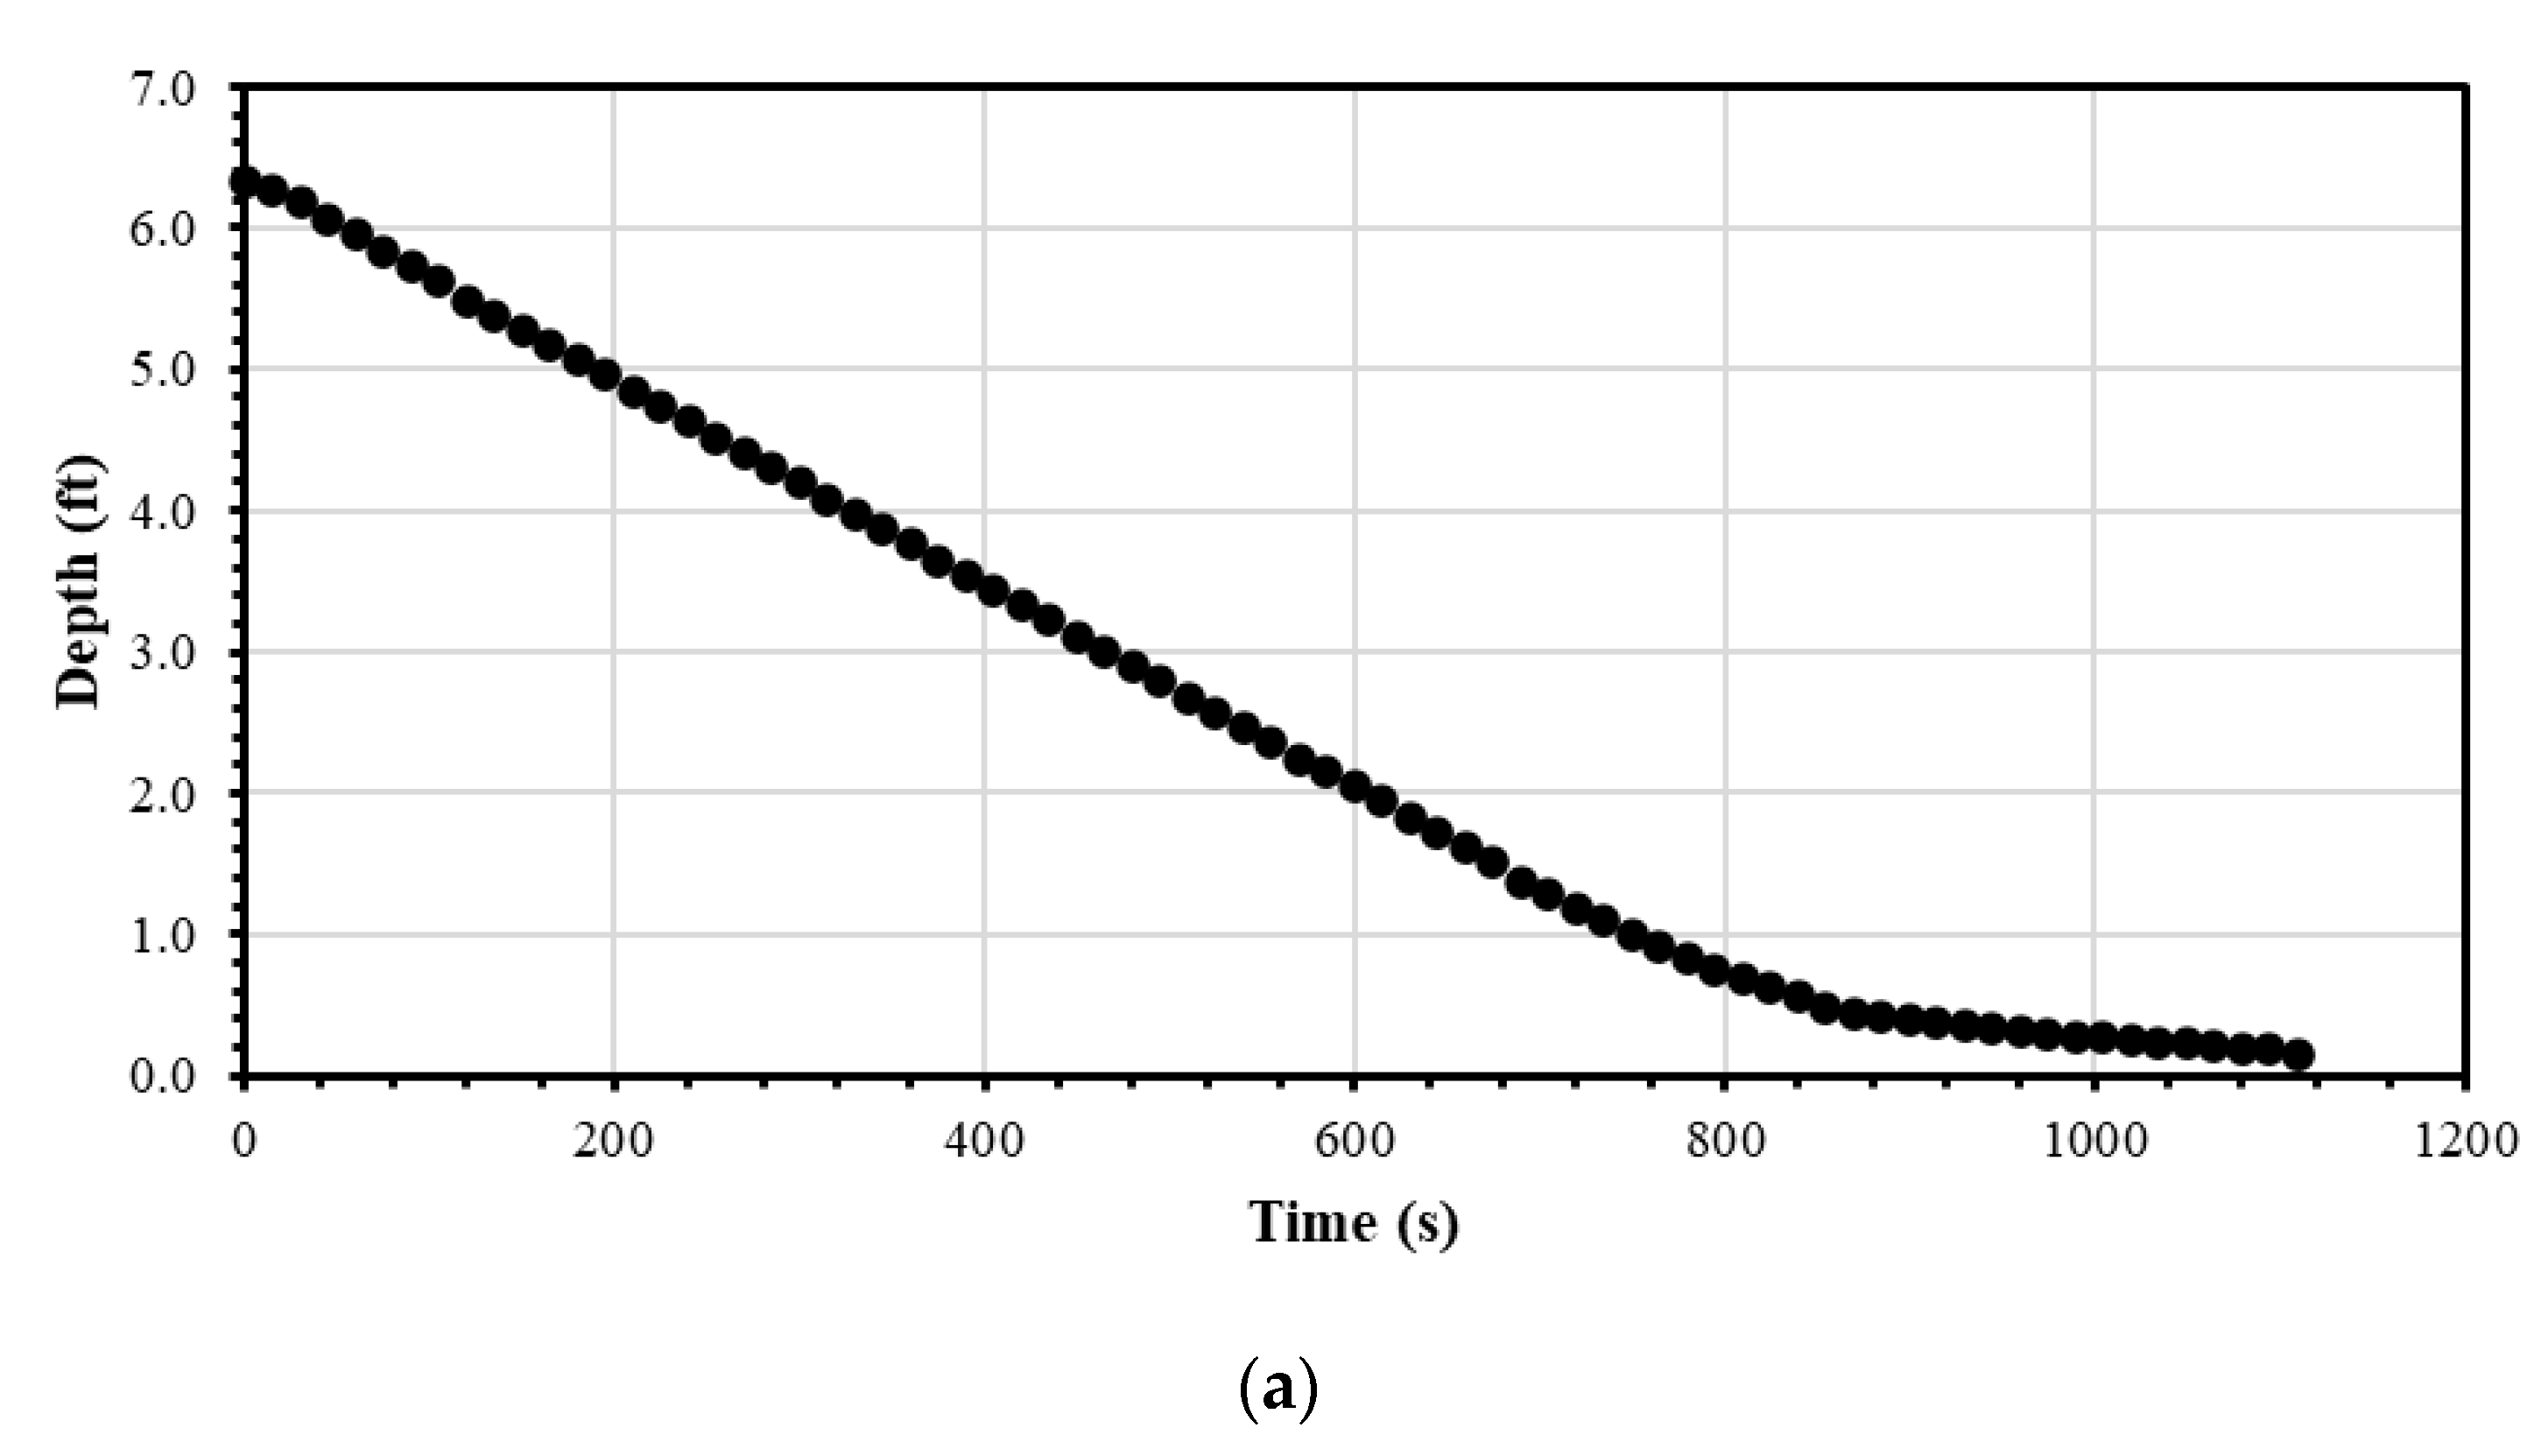
An alternative derivative-based method developed for flow rate calculations was considered to reduce outlier values recorded by the Levelogger® and assess the robustness of the trends identified in the previous section. Instead of calculating flow rates using the change in volume every 15 s, depth vs. time plots were constructed using the raw data recorded by the Levelogger® as seen in Figure 14a. The curve depicted in the depth vs. time plot was divided into two sections: an approximately linear section representing Zone 2 and a section where the line begins to curve and flatten, representing Zone 1. Figure 14b illustrates an example of the trendlines obtained from Test 1 performed on the 20.3 cm (8 in.) skimmer. Zone 2 is represented by the black dots, while Zone 1 is represented by the triangles. The dotted lines represent the fitted trendline.
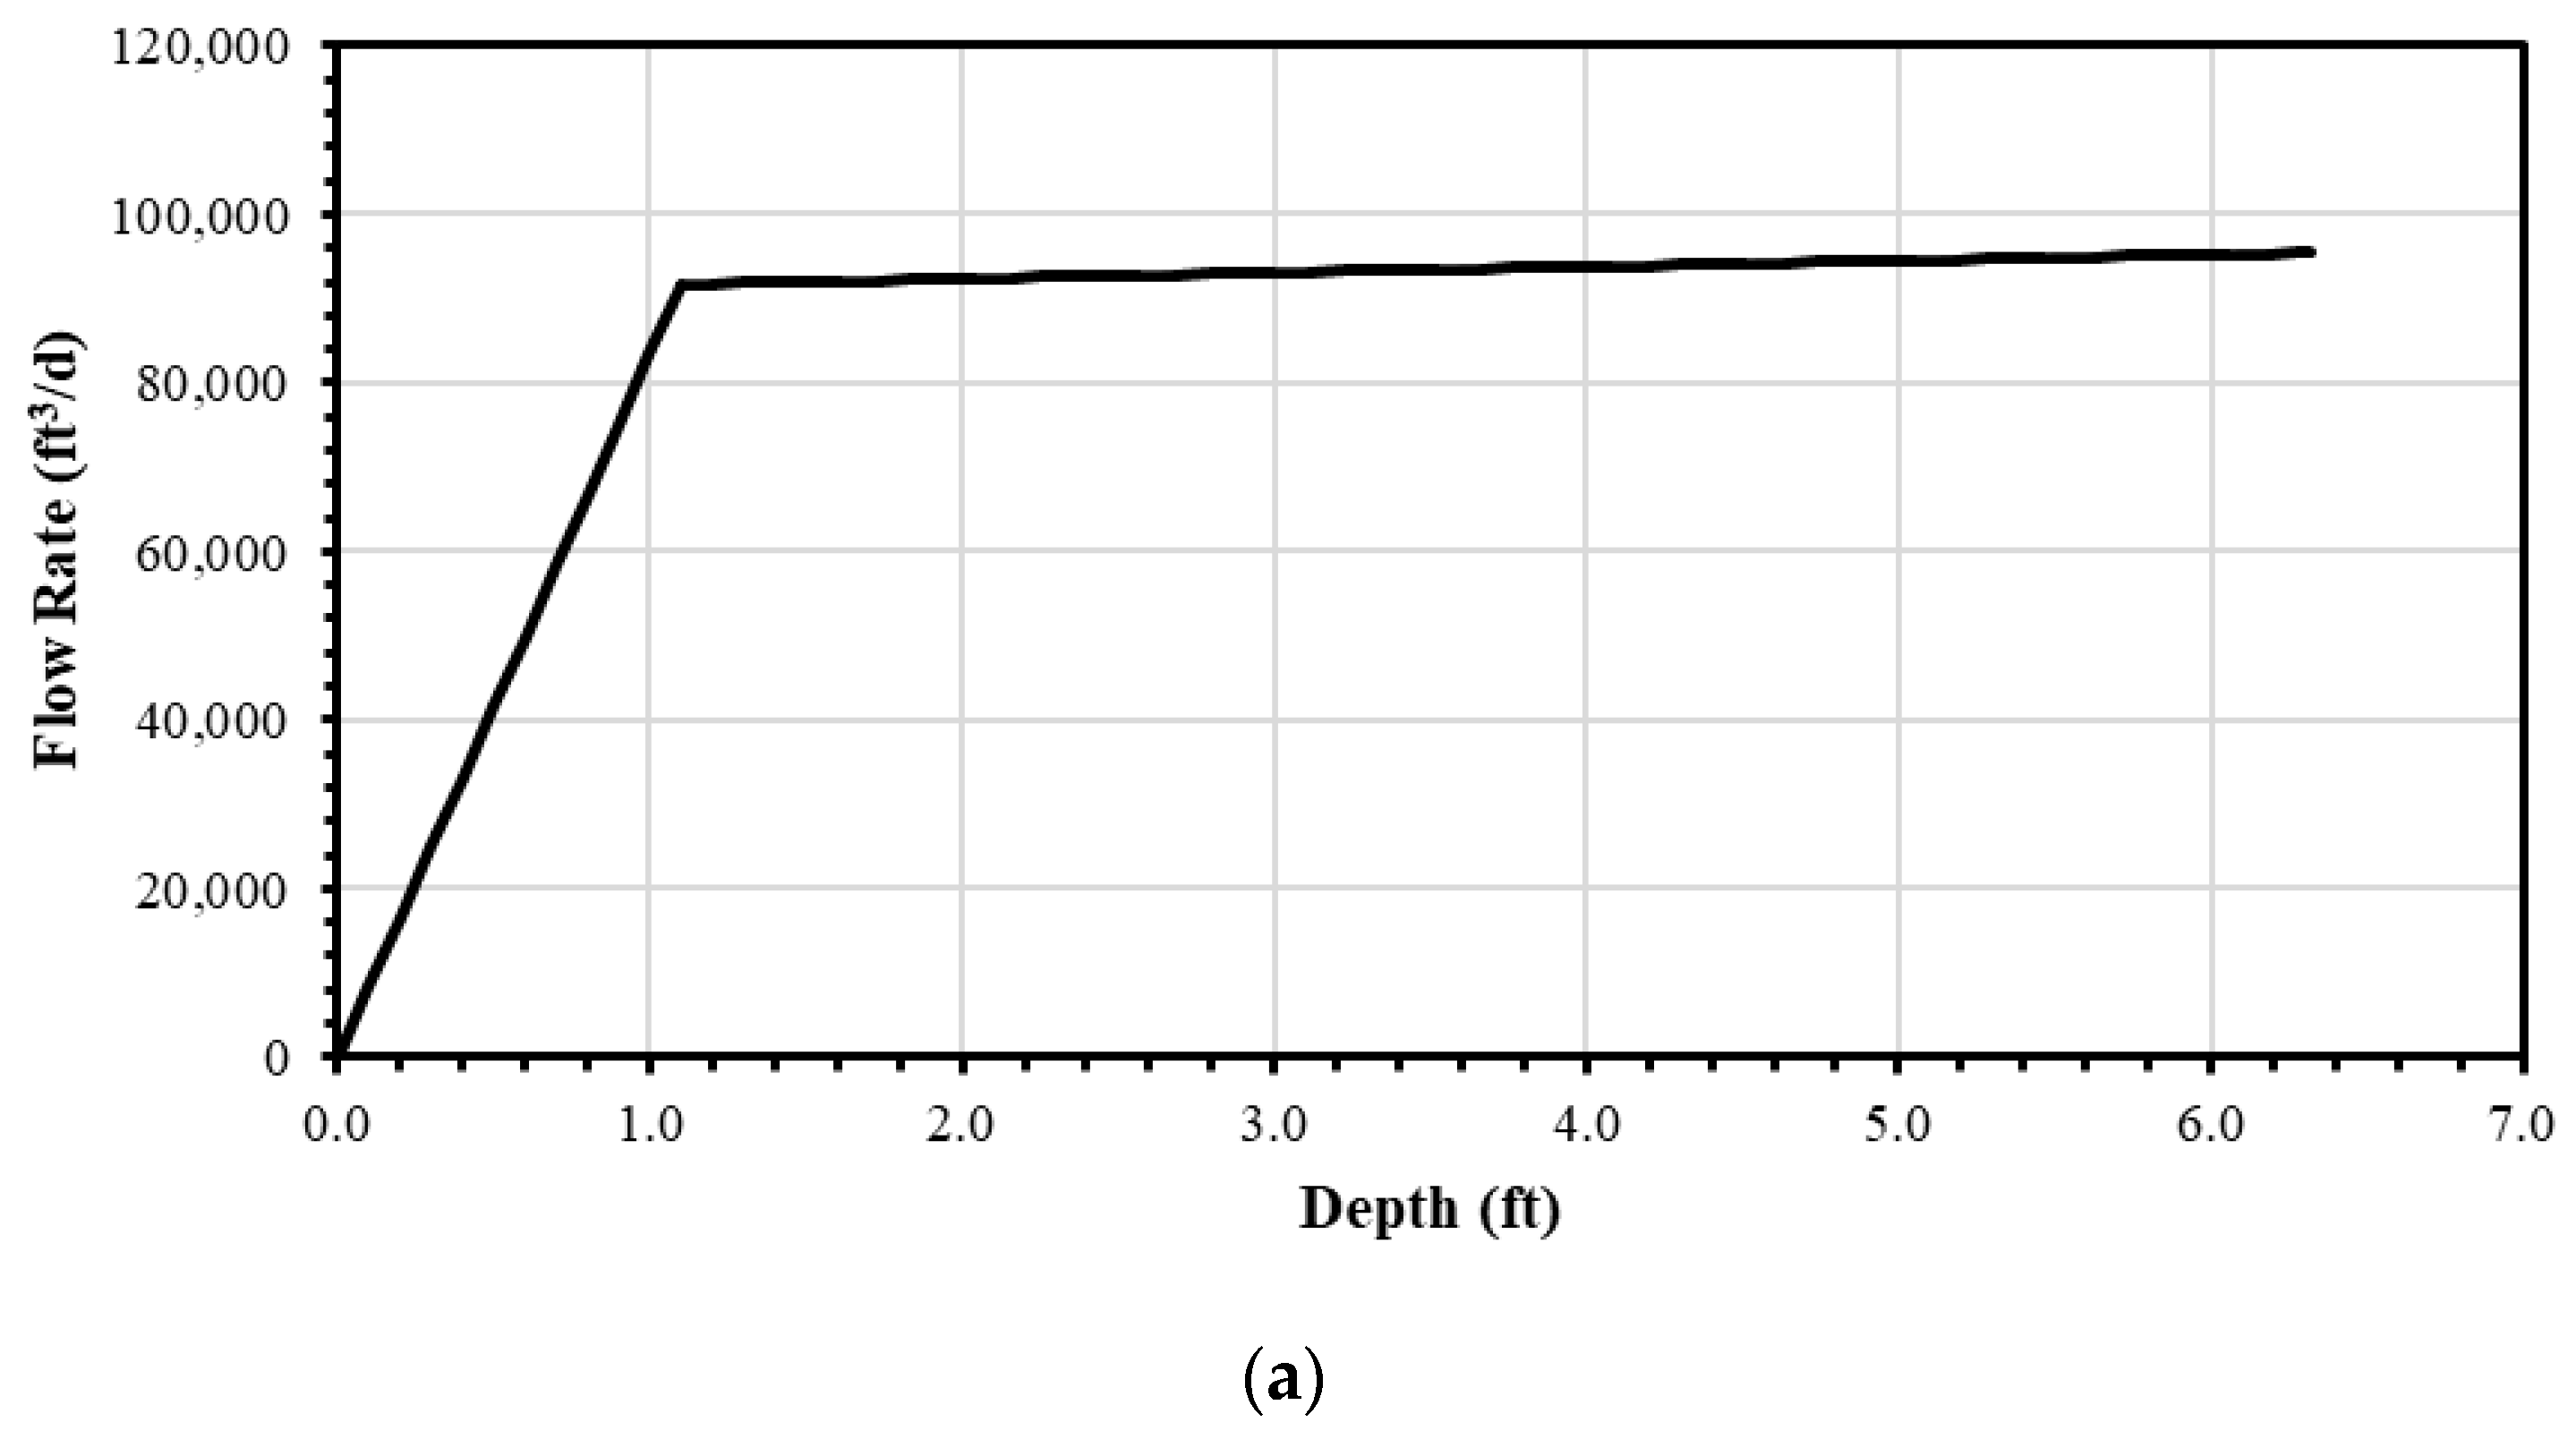
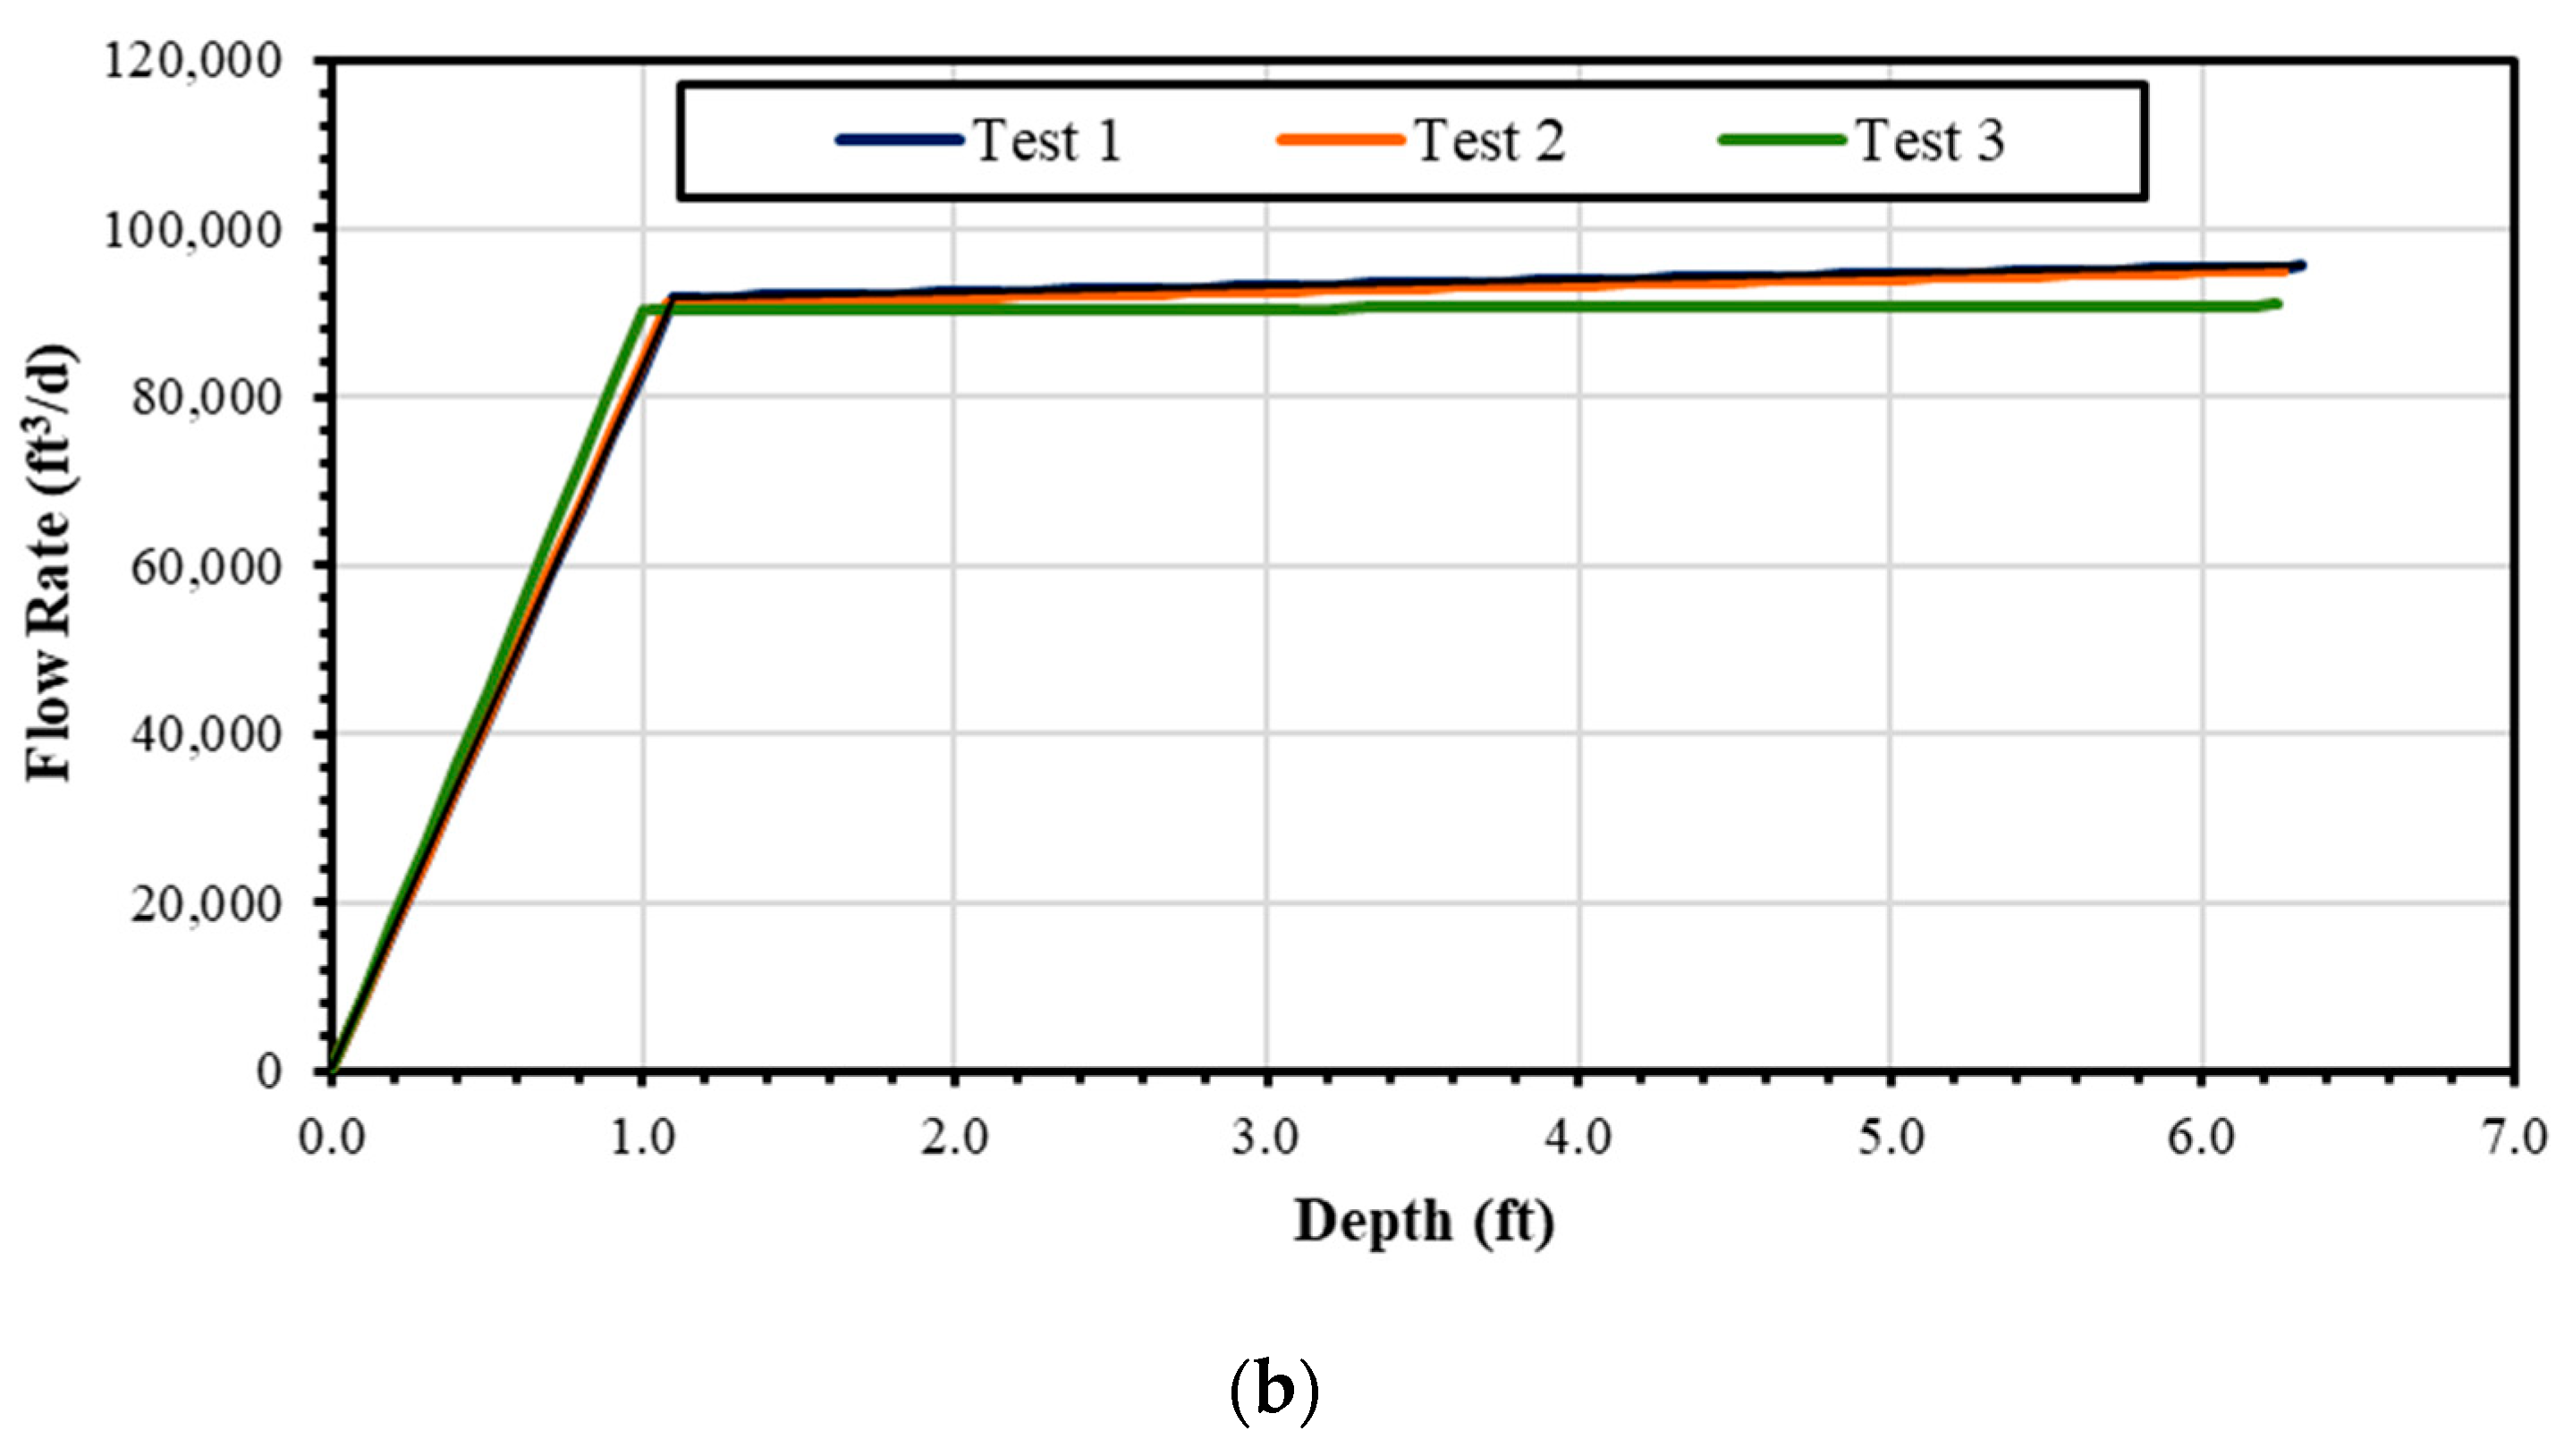
The trendlines from the Zone 2 section of the depth vs. time plot were used to obtain an equation. The derivative of this trendline equation was taken to determine a flow rate at a given depth. Additionally, computed flow rates were used to observe the overall trend that describes skimmer behavior. As mentioned earlier, only the Zone 2 trendline equation was used as Zone 2 most accurately reflects overall skimmer performance. Figure 15a shows the flow rate vs. depth plot created using the newly calculated flow rate values for Test 1 of the 20.3 cm (8 in.) skimmer, 100% open. Flow rate vs. depth plots from each test were then combined to observe differences in each triplicate, as seen in Figure 15b.
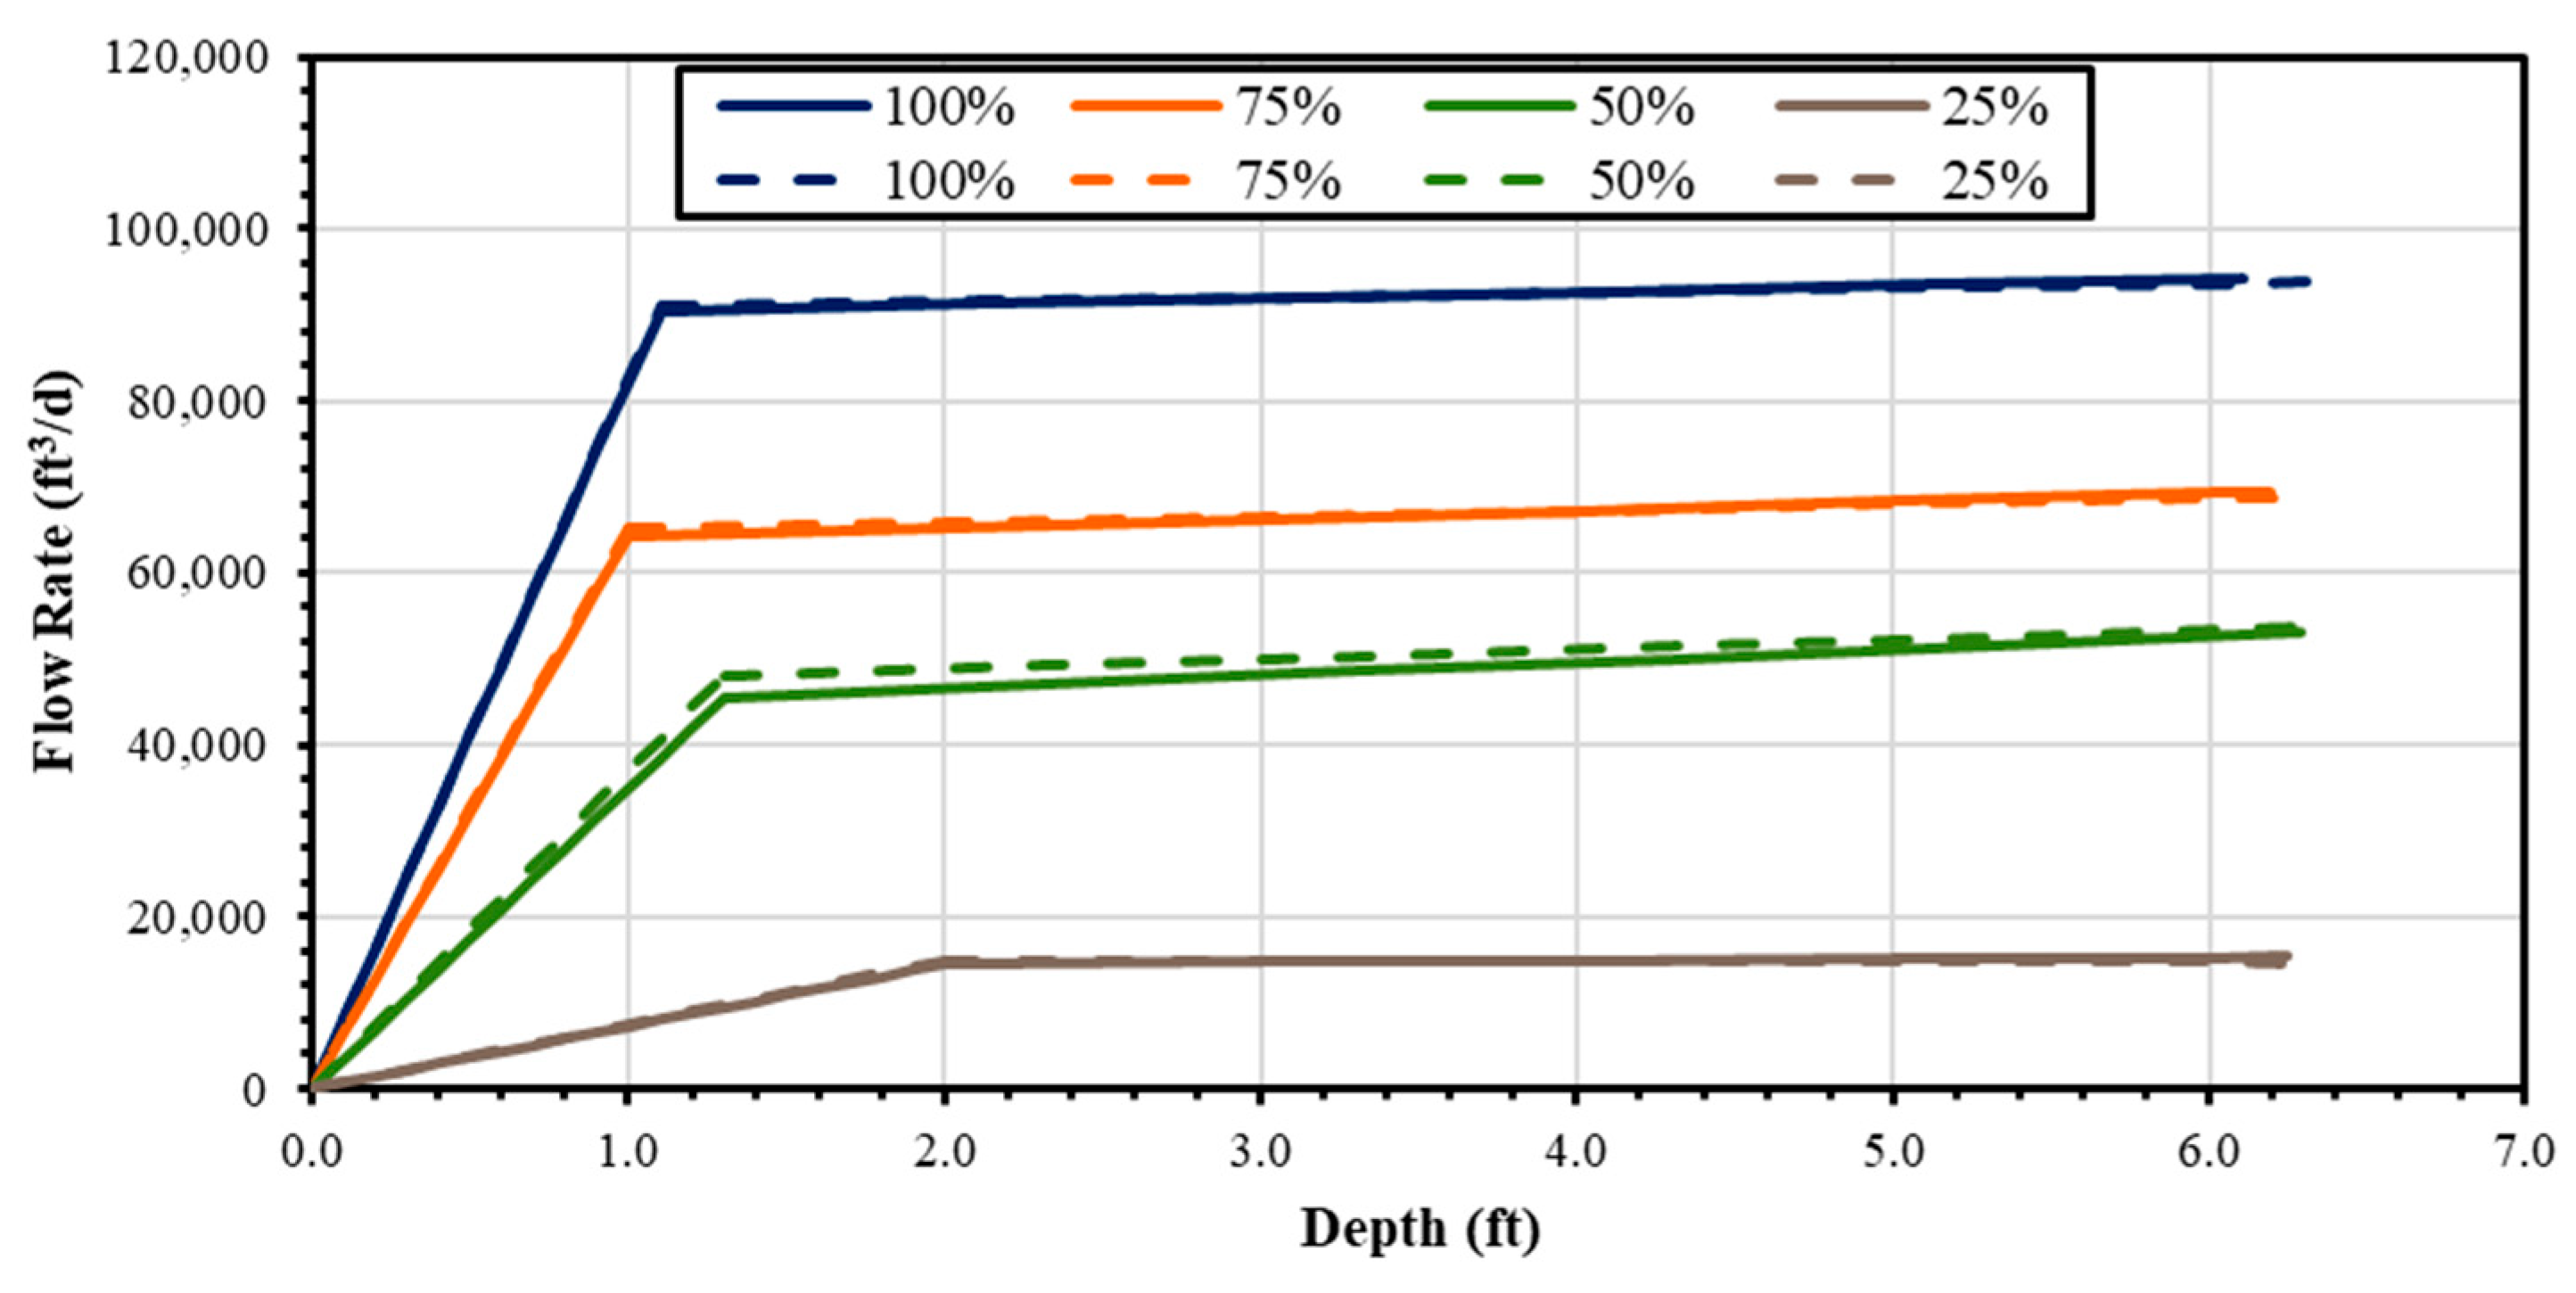
Combined flow rate vs. depth plots were then used to obtain a new trendline representing all three tests. This new trendline was used to create a flow rate model similar to that depicted in Figure 7b. This process was repeated for all slider configurations tested on the 20.3 cm (8 in) skimmer. Flow rate models using this method, referred to as Method 2, were compared with those created using the traditional flow rate calculation method, referred to as Method 1. Figure 16 shows a side-by-side comparison of the models created using Method 1 and Method 2.
Results from each method were found to be similar, as the flow rate model comparison seen in Figure 16 shows considerable overlap for each slider configuration. Average flow rates were also computed using Method 2 and were compared to those calculated using Method 1. Table 4 displays a comparison of the average flow rates calculated using each method for the 20.3 cm (8 in.) skimmer.
It should be noted that the process of calculating flow rates using Method 2 is still being optimized. There was difficulty determining where to split the depth vs. time plot to obtain the trendline equation used for derivation. Quantitative methods, such as a second derivative test, were also employed to determine the transition depth. However, these methods yielded transition depths inconsistent with observed skimmer behavior throughout testing. Determining the depth where Zone 2 transitions to Zone 1 is more obvious using Method 1. The main advantage of using Method 2 is eliminating the need to remove outliers, a step that is necessary when calculating flow rates using Method 1. While each method provides relatively similar outflow rates that describe skimmer performance, Method 2 is an approximation with greater ambiguity, while Method 1 provides a more accurate representation of skimmer behavior throughout a given test. It is recommended that Method 2 be further reviewed for future testing.

4. Conclusions

The purpose of this study is to assess the dewatering rates of eight floating surface skimmers with a re-engineered adjustable orifice slider for application in sediment basins on construction sites. Testing followed a modified version of ASTM D8107-18 [20], and was conducted in the skimmer evaluation tank at AU-SRF in Opelika, Alabama. A pressure gauge was used to record changes in water depth in 15 s intervals. These depth changes, along with the surface area of the evaluation tank floor, were used to calculate flow rates. Four slider configurations were examined for each skimmer: 100% open, 75% open, 50% open, and 25% open. However, the 25% open setting was excluded for the three smallest skimmers due to their size. Triplicate tests were completed for each skimmer configuration, and data from each test was combined to observe trends. Flow rate data from each triplicate was plotted, and two linear sections were observed. Linear equations from Zone 2 were used to create flow rate models that predict flow rate at a given depth in the evaluation tank. Results from this testing indicated that evaluated skimmers can achieve flow rates as high as 2622 m3/d (92,585 ft3/d) to as low as 28 m3/d (981 ft3/d) across all configurations assessed.
Flow rate models were utilized to develop two interactive skimmer sizing tools in Microsoft Excel. Both sizing tools are intended to support engineers and designers in selecting the most suitable skimmer size and slider opening based on sediment basin parameters. The engineer’s calculator allows users to discern the stage–storage relationship through the dewatering process. The tool provides storage volume, average slow rate, and cumulative dewatering time. The estimator’s calculator is a simple, intuitive tool that yields skimmer size, slider opening, average flow rate, and previously published flow rate and orifice opening information. This tool has the option for users to enter a known sediment basin volume or calculate volume based on sediment basin dimensions. There is opportunity for both sizing tools to be used with skimmers outside of those assessed in this study.
An alternative method for calculating outflow rates was also considered. This method presents an approximate flow rate by taking the derivative of a trendline equation provided by a depth vs. time plot. Average flow rates and flow rate models are similar between the two methods used during analysis; however, the primary advantage of using this alternative method is eliminating the need to remove outliers.
This research advances understanding of floating surface skimmer behavior, improving selection guidance and resulting in enhanced overall sediment basin functionality. The limitations of this study include a controlled experimental setup, which may not adequately simulate conditions in a sediment basin, as skimmers also drain while the basin fills with water; the location of the adjustable orifice slider when configured as the opening is no longer located at the center of the inlet; and the shape made by the adjustable slider when configured as the opening is no longer circular. This study did not evaluate sediment capture efficacy; future studies may include introducing sediment loads to skimmer tests and assessing the water quality of the effluent, along with evaluating the flow rate variability across different water temperatures.

Author Contributions

The authors confirm that the contributions to this paper were as follows: Conceptualization and design, M.A.P., W.N.D., A.R.B. and C.G.H.; data collection: C.G.H. and A.R.B.; analysis and interpretation of results: C.G.H., M.A.P., W.N.D. and A.R.B.; draft manuscript preparation: C.G.H., M.A.P., W.N.D. and A.R.B. All authors have read and agreed to the published version of the manuscript.

Funding

This research was funded by J.W. Faircloth & Son, Inc.

Data Availability Statement

Data, including photos and videos from testing and other testing data, is available by request from the authors. The data is not publicly available due to privacy restrictions.

Conflicts of Interest

The authors declare that this study received funding from J.W. Faircloth & Son, Inc. The funder was not involved in the study design, collection, analysis, interpretation of data, the writing of this article or the decision to submit it for publication.

References

  1. United States Environmental Protection Agency. Stormwater Phase II Final Rule: Construction Site Runoff Control Minimum Control Measure; United States Environmental Protection Agency: Washington, DC, USA, 2018. [Google Scholar]
  2. Fang, X.; Zech, W.C.; Logan, C.P. Stormwater Field Evaluation and Its Challenges of a Sediment Basin with Skimmer and Baffles at a Highway Construction Site. Water 2015, 7, 3407–3430. [Google Scholar] [CrossRef] [Scilit]
  3. McLaughlin, R.A.; Hayes, S.A.; Clinton, D.L.; McCaleb, M.S.; Jennings, G.D. Water Quality Improvements Using Modified Sediment Control Systems on Construction Sites. Am. Soc. Agric. Biol. Eng. 2009, 52, 1859–1867. [Google Scholar] [CrossRef] [Scilit]
  4. Alabama Soil and Water Conservation Committee. Erosion Control, Sediment Control and Stormwater Management on Construction Sites and Urban Areas. Volume 1 Developing Plans and Designing Best Management Practices; Alabama Soil and Water Conservation Committee: Montgomery, AL, USA, 2022. [Google Scholar]
  5. Perez, M.A.; Zech, W.C.; Donald, W.N.; Fang, X. SEDspread: Sediment-Basin Design Tool for Construction Sites. J. Irrig. Drain. Eng. 2016, 142, 04016064. [Google Scholar] [CrossRef] [Scilit]
  6. Perez, M.; Fang, X.; Zech, W.C.; Vasconcelos, J. Design and Construction of a Large-Scale Sediment Basin and Preliminary Testing Results; Highway Research Center, Harbert Engineering Center: Auburn, AL, USA, 2015. [Google Scholar]
  7. Edwards, C.L.; Shannon, R.D.; Jarrett, A.R. Sedimentation Basin Retention Efficiencies for Sediment, Nitrogen, and Phosphorus from Simulated Agricultural Runoff. Am. Soc. Agric. Eng. 1999, 42, 403–409. [Google Scholar] [CrossRef] [Scilit]
  8. Fennessey, L.A.J.; Jarrett, A.R. Influence of Principal Spillway Geometry and Permanent Pool Depth on Sediment Retention of Sedimentation Basins. Am. Soc. Agric. Biol. Eng. 1997, 40, 53–59. [Google Scholar]
  9. Millen, J.A.; Jarrett, A.R.; Faircloth, J.W. Experimental Evaluation of Sedimentation Basin Performance for Alternative Dewatering Systems. Am. Soc. Agric. Eng. 1997, 40, 1087–1095. [Google Scholar] [CrossRef] [Scilit]
  10. Jarrett, A.R. Design of Perforated Risers to Control Dewatering of Sedimentation Basins. Am. Soc. Agric. Biol. Eng. 1993, 9, 37–42. [Google Scholar]
  11. Zech, W.C.; Logan, C.P.; Fang, X. State of the Practice: Evaluation of Sediment Basin Design, Construction, Maintenance, and Inspection Procedures. Pract. Period. Struct. Des. Constr. 2014, 19, 04014006. [Google Scholar] [CrossRef] [Scilit]
  12. Vaughan, B.T.; Jarrett, A.R. Experimental Evaluation of Alternative Configurations for Floating Riser Sedimentation Basin Dewatering Devices; American Society of Agricultural Engineers: Sacramento, CA, USA, 2001. [Google Scholar]
  13. Hoechst, L.M. Evaluating the Effectiveness of the Skimmer Versus the Perforated Riser in Sedimentation Basins. Master’s Thesis, Virginia Polytechnic Institute and State University, Blacksburg, VA, USA, 1997. [Google Scholar]
  14. McCaleb, M.M.; McLaughlin, R.A. Sediment Trapping by Five Different Sediment Detention Devices on Construction Sites. Am. Soc. Agric. Biol. Eng. 2008, 51, 1613–1621. [Google Scholar] [CrossRef] [Scilit]
  15. Jarrett, A.R. Designing Sedimentation Basins for Better Sediment Capture. In Proceedings of the American Society of Agricultural Engineers International Symposium, Honolulu, HI, USA, 3–5 January 2001. [Google Scholar]
  16. United States Environmental Protection Agency. 2022 Construction General Permit (CGP)—Fact Sheet; United States Environmental Protection Agency: Washington, DC, USA, 2022. [Google Scholar]
  17. Faircloth, J.W. Determining the Skimmer Size and the Required Orifice for the Faircloth Skimmer® Surface Drain. Available online: https://fairclothskimmer.com/ (accessed on 20 July 2025).
  18. Jarrett, A.R. Controlling the Dewatering of Sedimentation Basins; College of Agricultural Sciences, Pennsylvania State University: University Park, PA, USA, 2016. [Google Scholar]
  19. Sharpe, C.; Perez, M.A.; Donald, W.N. Evaluation of Surface Skimmer Flow Rates and Size Selection. Transp. Res. Rec. 2023, 2677, 199–211. [Google Scholar] [CrossRef] [Scilit]
  20. ASTM D8107-18; Standard Practice for Determining Sediment Pond Skimmer Flow Rate. ASTM International: West Conshohocken, PA, USA, 2018.
  21. Sharpe, C.D. Two-Part Master’s Thesis Part One: Evaluation of Cool Roof Reflectivity Impacts Part Two: Surface Skimmer Flow Rates. Master’s Thesis, Auburn University, Auburn, AL, USA, 2022. [Google Scholar]
  22. Solinst Canada Ltd. Solinst Levelogger 5 Specifications. Available online: https://www.solinst.com/instruments/dataloggers-and-telemetry-systems/3001-levelogger/levelogger-water-level-dataloggers/solinst-levelogger-specifications/ (accessed on 31 January 2026).
  23. Wanielista, M.P.; Kersten, R.; Eaglin, R. Hydrology: Water Quantity and Quality Control, 2nd ed.; Wiley: Hoboken, NJ, USA, 1996; ISBN 978-0-471-07259-1. [Google Scholar]
  24. Connecticut Department of Transportation. ConnDOT Drainage Manual; Connecticut Department of Transportation: Newington, CT, USA, 2000. [Google Scholar]
Figure 1. Skimmer evaluation tank schematic [21]. Note: 1 in. = 2.54 cm; 1 ft = 0.30 m.
Water 18 00500 g001
Figure 2. Skimmer evaluation tank components at AU-SRF: (a) skimmer evaluation tank; (b) water delivery system.
Water 18 00500 g002
Figure 3. Adjustable slider configuration photos on 15.2 cm (6 in.) skimmer: (a) 100% open configuration; (b) 75% open configuration; (c) 50% open configuration; (d) 25% open configuration.
Water 18 00500 g003aWater 18 00500 g003b
Figure 4. Data collection components in skimmer evaluation tank: (a) PVC pipe holder for Levelogger®; (b) access ladder and ruler.
Water 18 00500 g004
Figure 5. Photos of 15.2 cm (6 in.) skimmer test: (a) skimmer at start of test; (b) skimmer after test.
Water 18 00500 g005
Figure 6. Flow rate vs. depth: 20.3 cm (8 in.) skimmer, 100% open. Note: figure reflects data after outliers were removed; this plot represents combined results of the three replicate tests; 1 ft = 0.30 m; 1 ft3 = 0.03 m3.
Water 18 00500 g006
Figure 7. Flow rate vs. depth linear trendlines and model for 20.3 cm (8 in.) skimmer, 100% open: (a) flow rate vs. depth linear trendlines; (b) flow rate vs. depth model. Note: these plots represent combined results of the three replicate tests; 1 ft = 0.30 m; 1 ft3 = 0.03 m3.
Water 18 00500 g007aWater 18 00500 g007b
Figure 8. Combined flow rate vs. depth data sets for all 20.3 cm (8 in.) skimmer configurations: Note: Each slider configuration represents combined results of the three replicate tests; 1 ft = 0.30 m; 1 ft3 = 0.03 m3.
Water 18 00500 g008
Figure 9. Flow rate vs. depth models for all skimmer configurations: (a) 20.3 cm (8 in.) combined model; (b) 15.2 cm (6 in.) combined model; (c) 12.7 cm (5 in.) combined model; (d) 10.2 cm (4 in.) combined model; (e) 7.6 cm (3 in.) combined model; (f) 6.4 cm (2.5 in.) combined model; (g) 5.1 cm (2 in.) combined model; (h) 3.8 cm (1.5 in.) combined model. Note: Each slider configuration represents combined results of the three replicate tests; 1 ft = 0.30 m; 1 ft3 = 0.03 m3.
Water 18 00500 g009
Figure 10. Skimmer flow rate overlap chart. Note: 1 in. = 2.54 cm; 1 ft3 = 0.03 m3.
Water 18 00500 g010
Figure 11. Engineer’s calculator sizing tool: (a) sizing tool interface; (b) stage–storage graph based on calculator output. Note: 1 ft = 0.30 m; 1 ft3 = 0.03 m3.
Water 18 00500 g011
Figure 12. Estimator’s calculator sizing tool: (a) known required basin example; (b) unknown basin volume example.
Water 18 00500 g012
Figure 13. Logical flowcharts for skimmer sizing tool use: (a) engineer’s calculator flowchart; (b) estimator’s calculator flowchart.
Water 18 00500 g013
Figure 14. Depth vs. time charts for the 20.3 cm (8 in.) skimmer, 100% open, Test 1: (a) depth vs. time plot; (b) separated depth vs. time plot with linear trendlines. Note: 1 ft = 0.30 m.
Water 18 00500 g014aWater 18 00500 g014b
Figure 15. Flow rate vs. depth models for the 20.3 cm (8 in.) skimmer, 100% open: (a) Test 1 model; (b) combined triplicate model. Note: 1 ft = 0.30 m; 1 ft3 = 0.03 m3.
Water 18 00500 g015aWater 18 00500 g015b
Figure 16. Comparison of flow rate vs. depth models: 20.3 cm (8 in.) skimmer. Note: solid lines represent Method 1 flow rate models, dashed lines represent Method 2 flow rate models; 1 ft = 0.30 m; 1 ft3 = 0.03 m3.
Water 18 00500 g016
Table 1. Equations used for flow rate vs. depth model.
Slider
Configuration
Zone 1Zone 2
Linear EquationParameter, m (ft)Linear EquationParameter, m (ft)
100%y = 82,240.11x0 ≤ x ≤ 0.34 (1.1)y = 748.29x + 89,641x ≥ 0.34 (1.1)
75%y = 64,323.20x0 ≤ x ≤ 0.30 (1.0)y = 977.20x + 63,346x ≥ 0.30 (1.0)
50%y = 34,931.26x0 ≤ x ≤ 0.40 (1.3)y = 1522.80x + 43,431x ≥ 0.40 (1.3)
25%y = 7249.06x0 ≤ x ≤ 0.61 (2.0)y = 190.56x + 14,117x ≥ 0.61 (2.0)
Table 2. Average flow rates for each skimmer configuration.
Skimmer Size,
cm (in.)
Average Flow Rate, m3/d (ft3/d)
100%75%50%25%
20.3 (8.0)2622 (92,585)1899 (67,051)1389 (49,052)422 (14,906)
15.2 (6.0)1491 (52,645)916 (32,337)700 (24,731)308 (10,875)
12.7 (5.0)864 (30,526)618 (21,831)545 (19,232)228 (8059)
10.2 (4.0)540 (19,063)391 (13,796)304 (10,747)101 (3562)
7.6 (3.0)269 (9517)243 (8586)130 (4580)66 (2347)
6.4 (2.5)187 (6605)143 (5062)96 (3402)N/A *
5.1 (2.0)111 (3928)93 (3282)67 (2363)N/A *
3.8 (1.5)50 (1782)47 (1655)28 (981)N/A *
Note: * N/A = not applicable.
Table 3. Theoretical and experimental flow rate comparison for the 20.3 cm (8 in.) skimmer.
Orifice OpeningAverage Flow Rate, m3/d (ft3/d)
ExperimentalEquation (2) *Equation (3) *
100%2622 (92,585)2960 (104,539)2908 (102,683)
75%1899 (67,051)1665 (58,803)1992 (70,342)
50%1389 (49,052)740 (26,135)1137 (40,149)
25%422 (14,906)185 (6534)420 (14,817)
Note: * h = 0.15 m (0.5 ft) for theoretical flow rate calculations for the 20.3 cm (8 in.) skimmer [18].
Table 4. Average flow rate comparison: 20.3 cm (8 in.) skimmer.
Slider ConfigurationAverage Flow Rate, m3/d (ft3/d)
Method 1Method 2
100%2615 (92,585)2622 (92,348)
75%1899 (67,051)1897 (67,004)
50%1389 (49,052)1441 (50,884)
25%422 (14,906)423 (14,950)
Disclaimer/Publisher’s Note: The statements, opinions and data contained in all publications are solely those of the individual author(s) and contributor(s) and not of MDPI and/or the editor(s). MDPI and/or the editor(s) disclaim responsibility for any injury to people or property resulting from any ideas, methods, instructions or products referred to in the content.