1. Introduction
The interaction between electric fields and polar molecules in liquids manifests itself in a variety of effects that can be described within the framework of electrohydrodynamics [
1,
2], which is widely used in engineering. Such molecules possess a permanent electric dipole moment, resulting in one end being slightly positively charged and the other slightly negatively charged. Water and alcohol are prime examples of this type of molecule. In a non-homogeneous electric field, an electric force acts on each electric dipole, which is the sum of the forces acting on the two individual charges in the dipole. If sufficiently strong, such electric fields can have the capacity to elevate polar dielectric liquids, defying the force of gravity [
3]. This lifting effect can ultimately be described by the Maxwell stress tensor, whereby the occurrence of shear stresses in the boundary layer between two dielectrics in inhomogeneous electric fields can additionally lead to complex electroconvective flow patterns [
4]. A detailed understanding of these effects in water is important in many technological applications and biology. In this work, we investigate water exposed to a field strength of approximately 10
6 V m
−1 in a free-hanging horizontal electrohydrodynamic bridge. These bridges, shaped like catenaries, are formed between two beakers filled with deionized water when a high voltage is applied [
5,
6,
7,
8]. This phenomenon was a research topic at the European Competence Centre WETSUS for more than a decade and has led to the discovery of non-stochiometric, electrically charged water which has been patented for industrial applications [
9]. The phenomenon is well understood from the perspectives of electrohydrodynamics and direct current (DC) high-voltage (HV) electrolysis [
9,
10]. In this type of high-voltage aqueous bridge, an electric current flows through the bridge, while its high ohmic resistance prevents dielectric breakdown. It is only at higher field strengths of around 10
9 V m
−1 that water dipoles align and the well-known Kerr effect occurs [
11]. Various authors have researched these aqueous electrohydrodynamic bridges, which operate in DC and alternating currents (AC), and have found evidence of effects in the mesoscopic range [
12,
13,
14].
Mesoscopic physics deals with materials of intermediate size, ranging from the nanoscale to the micrometre scale, and their interactions. Mesoscopic ordering phenomena in water have been discussed using a variety of theoretical descriptions, ranging from cooperative hydrogen-bond network dynamics [
15] and phenomenological multi-state models [
16] to classical electrohydrodynamic approaches [
17]. In this context, quantum field theoretical treatments of electrically driven symmetry breaking offer a coherent framework for interpreting the spectroscopic signatures observed in this work [
18].
In order to explain some of the reported mesoscopic effects observed in the bridge, a structural anisotropy was proposed [
13], but this proposal was rejected by others [
19]. As early as 2010, the authors attempted to conduct investigations using Raman spectroscopy in horizontal electrohydrodynamic bridges with moderate DC HV applied. Despite the fact that the effects under discussion in this article had already been observed by 2010, at that time these effects could not be reliably reproduced. In 2010, other authors also reported that bridges undergo changes in the intensity ratios of stretching vibrations due to polarisation effects when operating under AC high-voltage [
12]. As further investigations using Raman spectroscopy on DC-powered systems yielded no new findings for the authors, investigations using a high-voltage (20 kV) point-plane electrode system were conducted from 2013 onwards. In this purely electrostatic experiment, a high-voltage needle was immersed in a cuvette containing deionised water, with the counter electrode positioned beneath the cuvette. For these investigations, the Raman spectra of water in the presence and absence of an electric field were compared. During these electrostatic tests, the water temperature did not change due to the absence of ohmic heating by a current. The results, which revealed sidebands in the isotropic component of water’s vibrational oscillations, were published in 2016 [
20]. In the same year, other authors reported that the hydrogen bond network of water supports propagating optical phonon-like modes [
21]. However, it was not until 2019 that quantum field theory provided a solid theoretical basis for explaining these sidebands in electrically charged water [
22]. These investigations of deionized water in inhomogeneous electric fields suggest that, although no structural anisotropies occur in electrically stressed water, dynamic couplings of the OH stretching vibrations do occur under the influence of these electric fields [
22]. This phenomenon has been interpreted as a phase-transition-like process involving the breaking of rotational symmetry due to the applied fields, for which quantum field theoretical descriptions have been proposed [
18].
Concurrently with the investigation of the point-plane electrode system, Raman measurements were conducted on the water in the beakers into which the electrodes were immersed. As a result, high-voltage electrolysis of water was observed in the aqueous bridges when a high positive DC voltage is applied. This phenomenon causes the water in the anolyte beaker to become positively charged and the water in the catholyte to become negatively charged, while the charge neutrality of the overall system is maintained [
8]. The hydronium ions that reach the water surface in the anolyte disrupt the network of hydrogen bonds [
23], thereby reducing surface tension [
24]. This reduction in surface tension has been confirmed by others [
25] and is well suited for commercial applications in water treatment, where it could potentially reduce the use of detergents or other chemicals. It has been shown that the pH difference induced by electrolysis during the operation of the water bridge is very small, only about 0.1 units [
26], due to the low current of the immediate recombination of hydronium and hydroxyl ions to water in the catholyte. The conductivity of the water during bridge operation was investigated indirectly by assessing the proton mobility using quasi-elastic neutron scattering [
27]. Here, two proton populations could be distinguished, one consisting of protons strongly bound to oxygen atoms and a second one of quasi-free protons. The associated proton mobility in the proton channel of the bridge was reported as 9.34 × 10
−7 m
2 V
−1 s
−1, twice as fast as diffusion-based proton mobility in bulk water, matching the so-called electrohydrodynamic or “apparent” charge mobility, an experimental quantity which so far had lacked molecular interpretation. The formation of proton channels as described in that work has also been predicted before [
28] based on the infrared emission of the system. Other authors [
14] also found an enhanced proton mobility in the bridge.
Thanks to this earlier research, we now understand that the centuries-old electrohydrodynamic experiment is a means of investigating changes in water under the influence of moderate high-voltage fields. However, reproducible Raman measurements in the bridge have been missing until now. Complicating the Raman measurements further, investigations into the mid-infrared emission of these bridges have revealed that proton transfer results in changes to the bridge’s emissivity in this spectral range [
28]. As the authors use high-resolution thermographic systems for all their investigations, it is nearly impossible to determine the precise temperature of the bridge water. This makes it difficult to compare the spectra from the bridge with those from bulk water at the same temperature.
For the first time, the Raman study presented in this article employs comparative measurements within the same DC HV bridge. This comparison ensures that the results are not influenced by temperature or dissolved gases such as H
2, O
2 and CO
2 (whose Raman modes do not coincide with the observed features [
29]). Overall, the research presented focuses in particular on the experimentally accessible physicochemical signatures of such mesoscopic ordering, while theoretical interpretations are discussed in relation to established water structure models.
2. Materials and Methods
An electric field was generated using a planar electrode configuration consisting of two platinum electrodes (25 mm × 12 mm × 0.25 mm), which were immersed 10 mm deep in deionized water (6 cm diameter, 3 cm height, 100 mL, ILmABOR
® Laborglas, Technische Glaswerke Ilmenau GmbH, Ilmenau, Germany), each filled with deionized water (18.3 MΩ-cm, Barnstead
TM NANOpure
TM water purification systems, Thermo Fisher Scientific, Waltham, MA, USA). The electrodes were arranged symmetrically around the spouts of the cups at a distance of 50 mm and connected to a high-voltage amplifier (10/40A-HS, Trek, Inc., Lockport, NY, USA). For AC operation, this amplifier was driven by a direct digital synthesis (DDS) function generator (FG708S, Voltcraft, Conrad Electronic GmbH & Co. KG, Hirschau, Germany). The voltage output was controlled by a digital storage oscilloscope (IDS 8204, 200 MHz, 1GS/s, ISO-TECH, RS Components GmbH, Frankfurt am Main, Germany) and recorded by a voltage input module (NI 9215, 4 channels, ±10 V, 100 kS/s per channel, 16 bits, National Instruments Corporation, Austin, TX, USA) to facilitate impedance measurements at all operating points. The exact procedure for commissioning the electrohydrodynamic bridge can be found elsewhere [
6]. The AC voltage was applied at a peak value of 11 kV, and the DC voltage was set to +11 kV for the anode, with the cathode always grounded. In all the images shown, the cathode is positioned to the left.
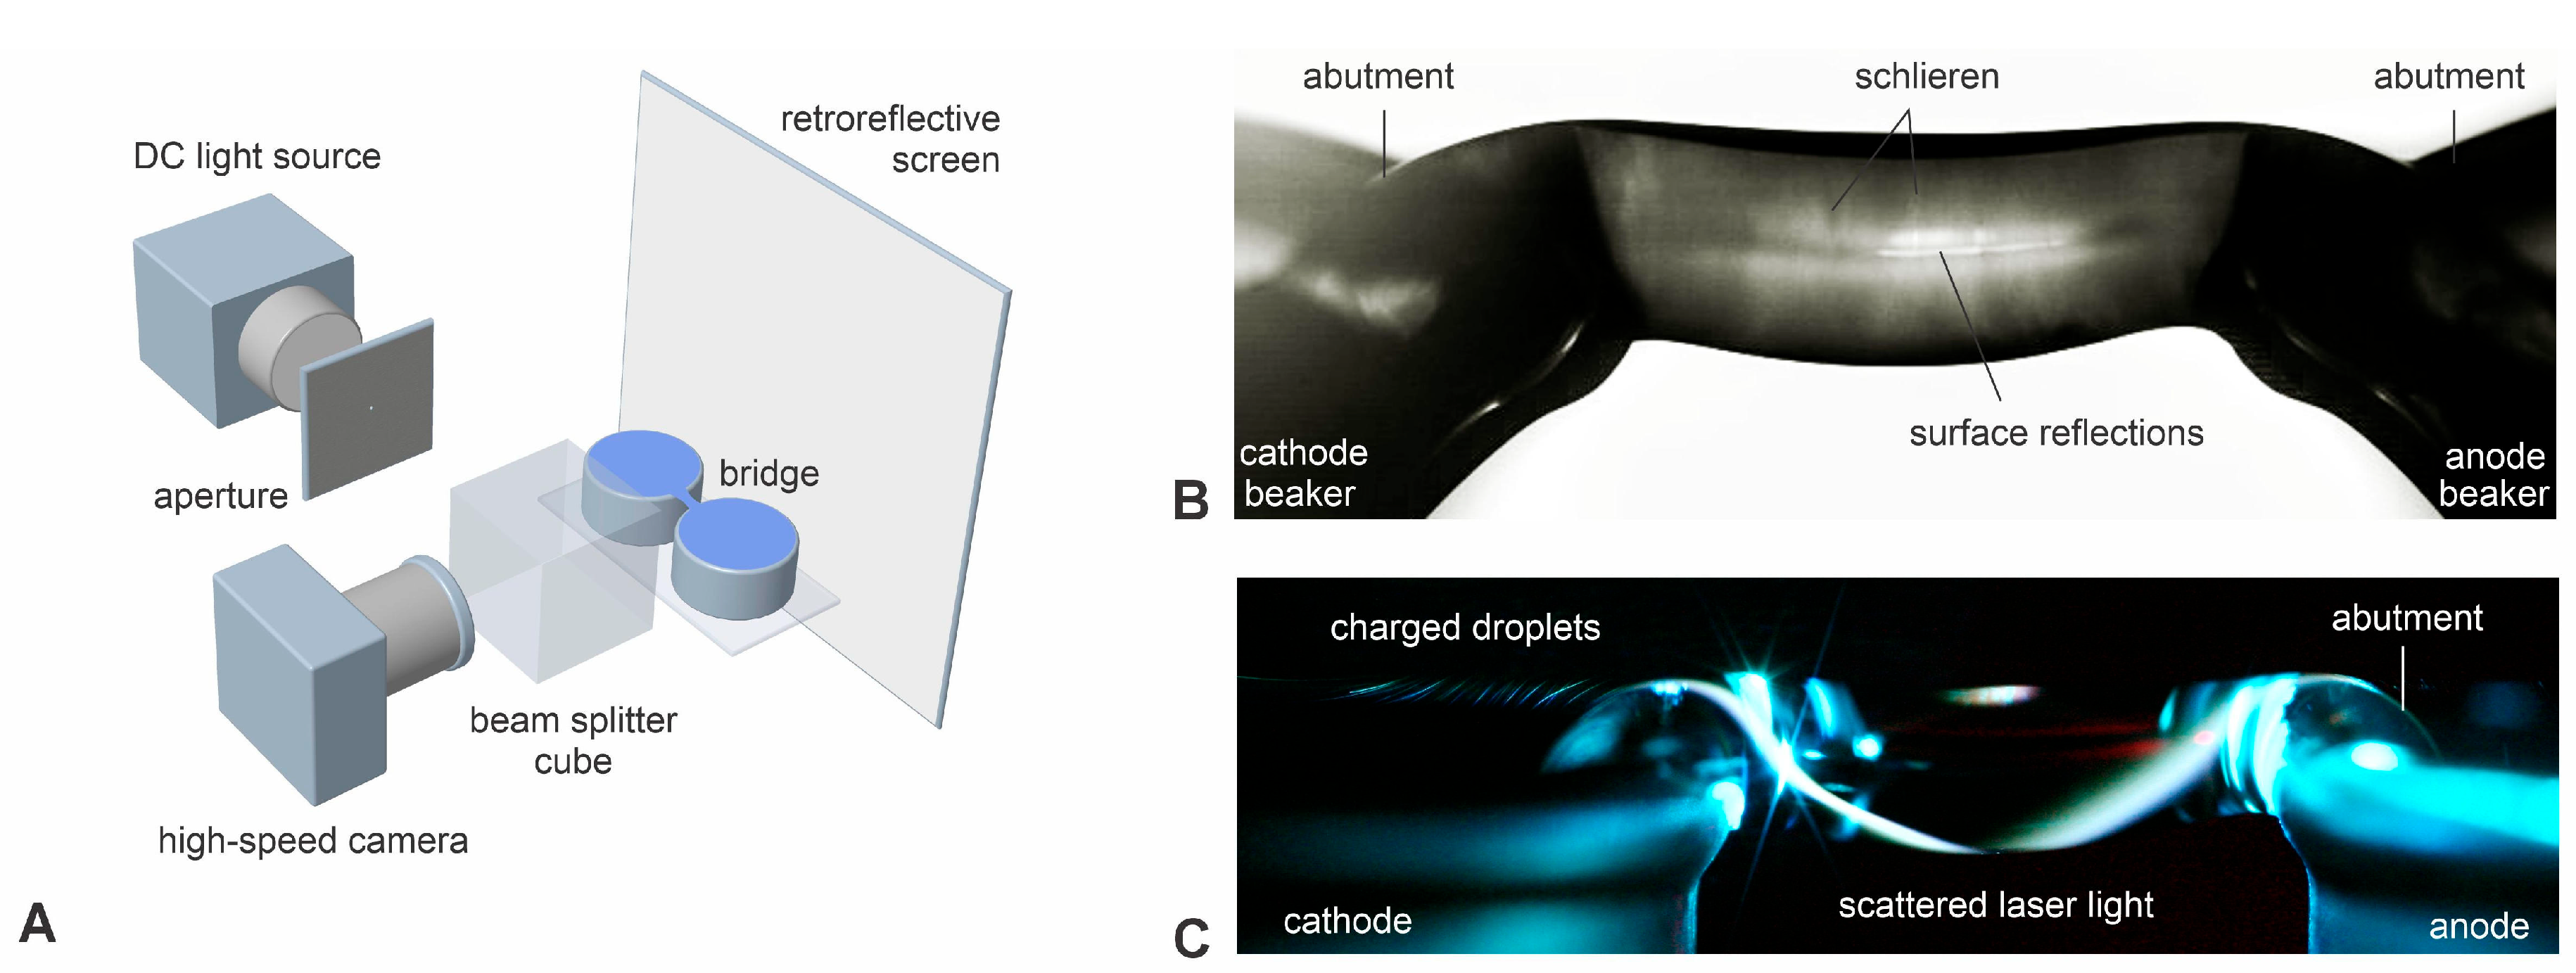
To visualize the schlieren, an approximately 1 mm diameter aperture covered with matte transparent adhesive tape (Scotch Magic
TM Tape, 3M, Saint Paul, MN, USA) as a diffuser was illuminated by a DC-powered light source (tungsten halogen lamp, 50 W, 12 V). A 50 mm × 50 mm × 50 mm beam splitter cube was directing the light beam through the bridge and onto a fine-grained retroreflective foil (A-RET-S001-5, Polytec GmbH, Waldbronn, Germany) which was mounted on a 5 mm thick glass plate. After the beam had passed through the bridge twice and repeatedly through the beam splitter, images were recorded using a high-speed camera (Photron SA1, 10,000 fps, 1/10,000 s exposure time, 768 × 640 px, Photron, Tokyo, Japan) and a photographic lens (Mamiya Sekor SX, f = 135 mm, F 2.8, Mamiya Digital Imaging Co., Ltd., Tokyo, Japan).
Figure 1A depicts this setup, and
Figure 1B shows a characteristic image recorded with this setup.
A digital single-lens reflex (SLR) camera (Canon EOS 250D, 6000 × 4000 px, with a Canon zoom lens, EF-S 18–135 mm, 1:3.5–5.6 IS USM, Canon Inc., Tokyo, Japan) was used to take the photograph shown in
Figure 1C.
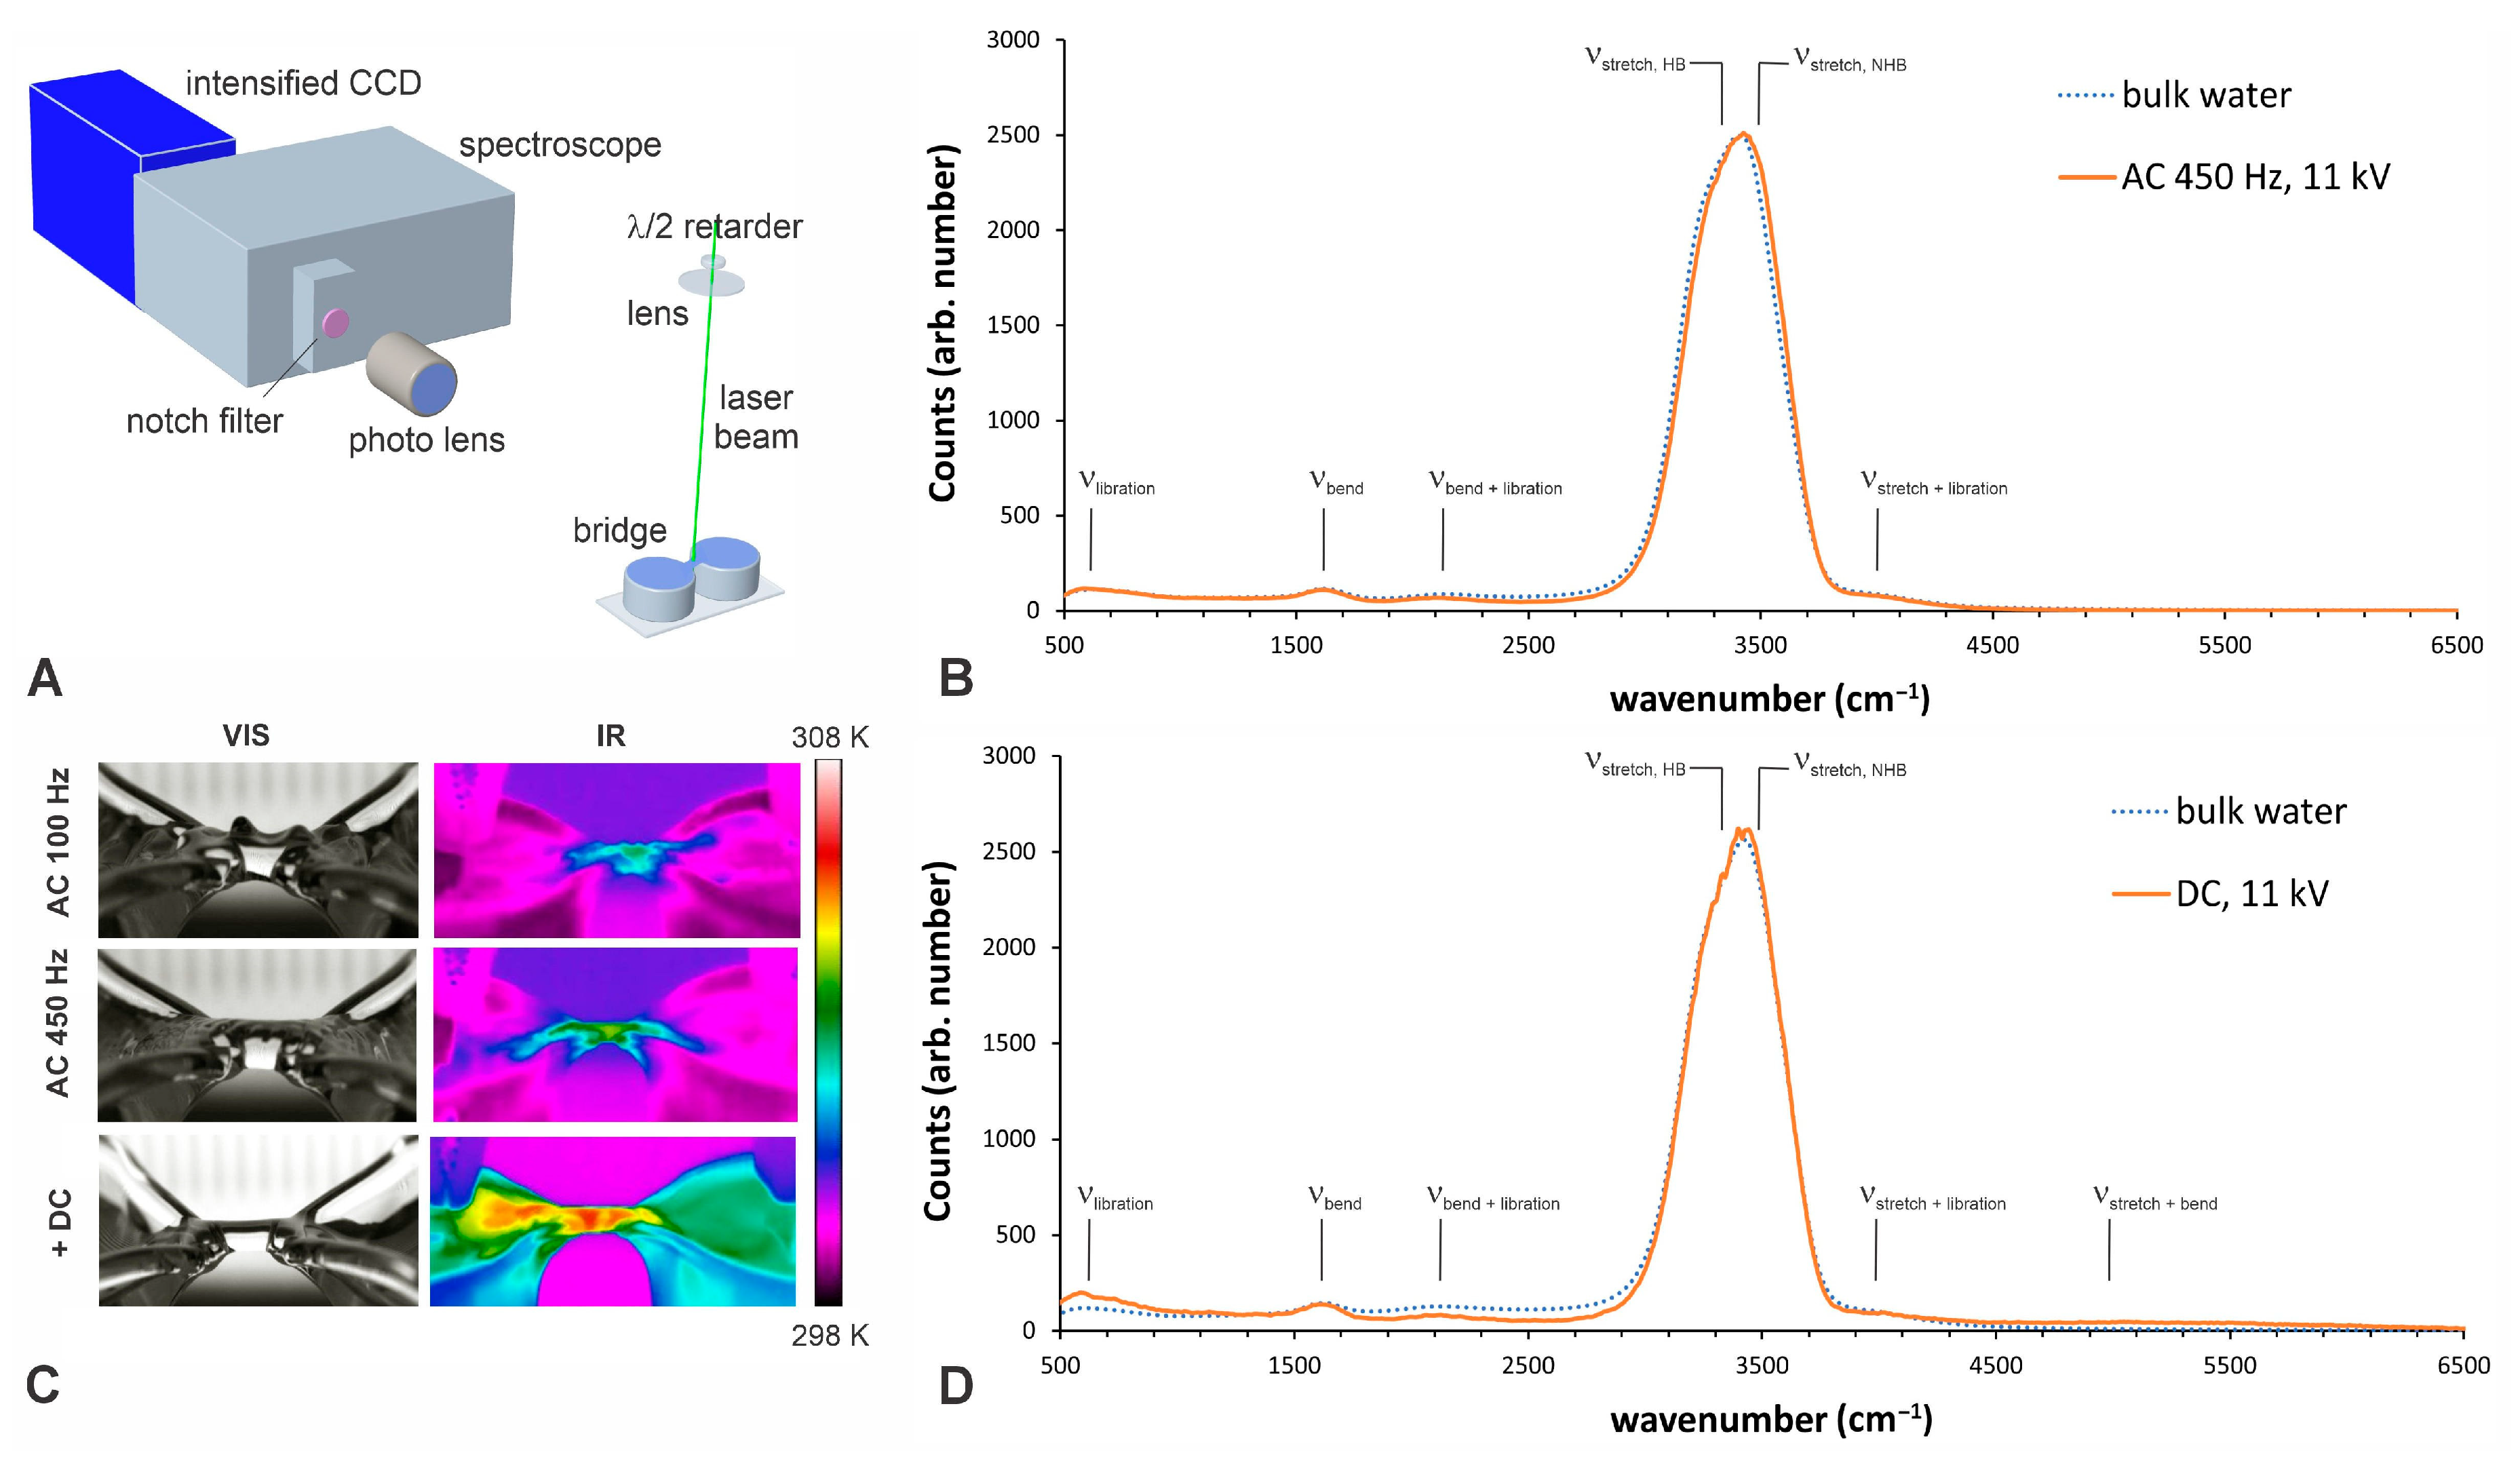
Figure 2C shows high-speed recordings captured with the high-speed camera (Photron SA1, 5000 fps, 1/10,000 s exposure time, 1024 × 1024 px, Photron, Tokyo, Japan), equipped with a macro lens (AF MICRO NIKKOR 60 mm 1:2.8, Nikon Cooperation, Tokio, Japan) and a macro close-up conversion lens (Raynox DCR-150, Yoshida Industry Co., Ltd., RAYNOX House, Tokyo, Japan).
The surfaces of interest were observed using a thermal imaging camera (T650sc, 640 × 480 px, Teledyne FLIR LLC, Wilsonville, OR, USA) that is sensitive in the IR range from 7.5 to 13.0 μm and has a thermal sensitivity of 20 mK. The thermograms shown in
Figure 2C were captured by this camera.
For the Raman measurements a collimated and polarized beam from an argon ion laser (Innova 6W Ar+, P = 200 mW, 488 nm, 1.5 mm beam diameter, 0.5 mrad divergence, Coherent, Inc., Santa Clara, CA, USA) was guided into the bridge perpendicular to the liquid surface (
Figure 2A). The incident beam was always horizontally polarized (H) in all experiments using a half-wave plate (λ/2 retarder, Thorlabs Inc., Newton, NJ, USA) to ensure consistent polarization. A converging lens with a focal length of one meter was used to focus the laser beam into the bridge. This produced a focal spot with a Gaussian intensity distribution in cross-section, measuring approximately 400 μm, and a Rayleigh length of more than one meter in water. Thus, the illumination power and beam shape are uniform within the bridge and within the interrogated spectral imaging region. The Stokes-shifted Raman scattered light was collected using a photographic lens (Mamiya Sekor SX, f = 135 mm, F 2.8, Mamiya Digital Imaging K.K., Tokyo, Japan), which was positioned to image the fluid region in the middle of the bridge (
Figure 2B), as well as at the anode (
Figure 2D) and cathode (
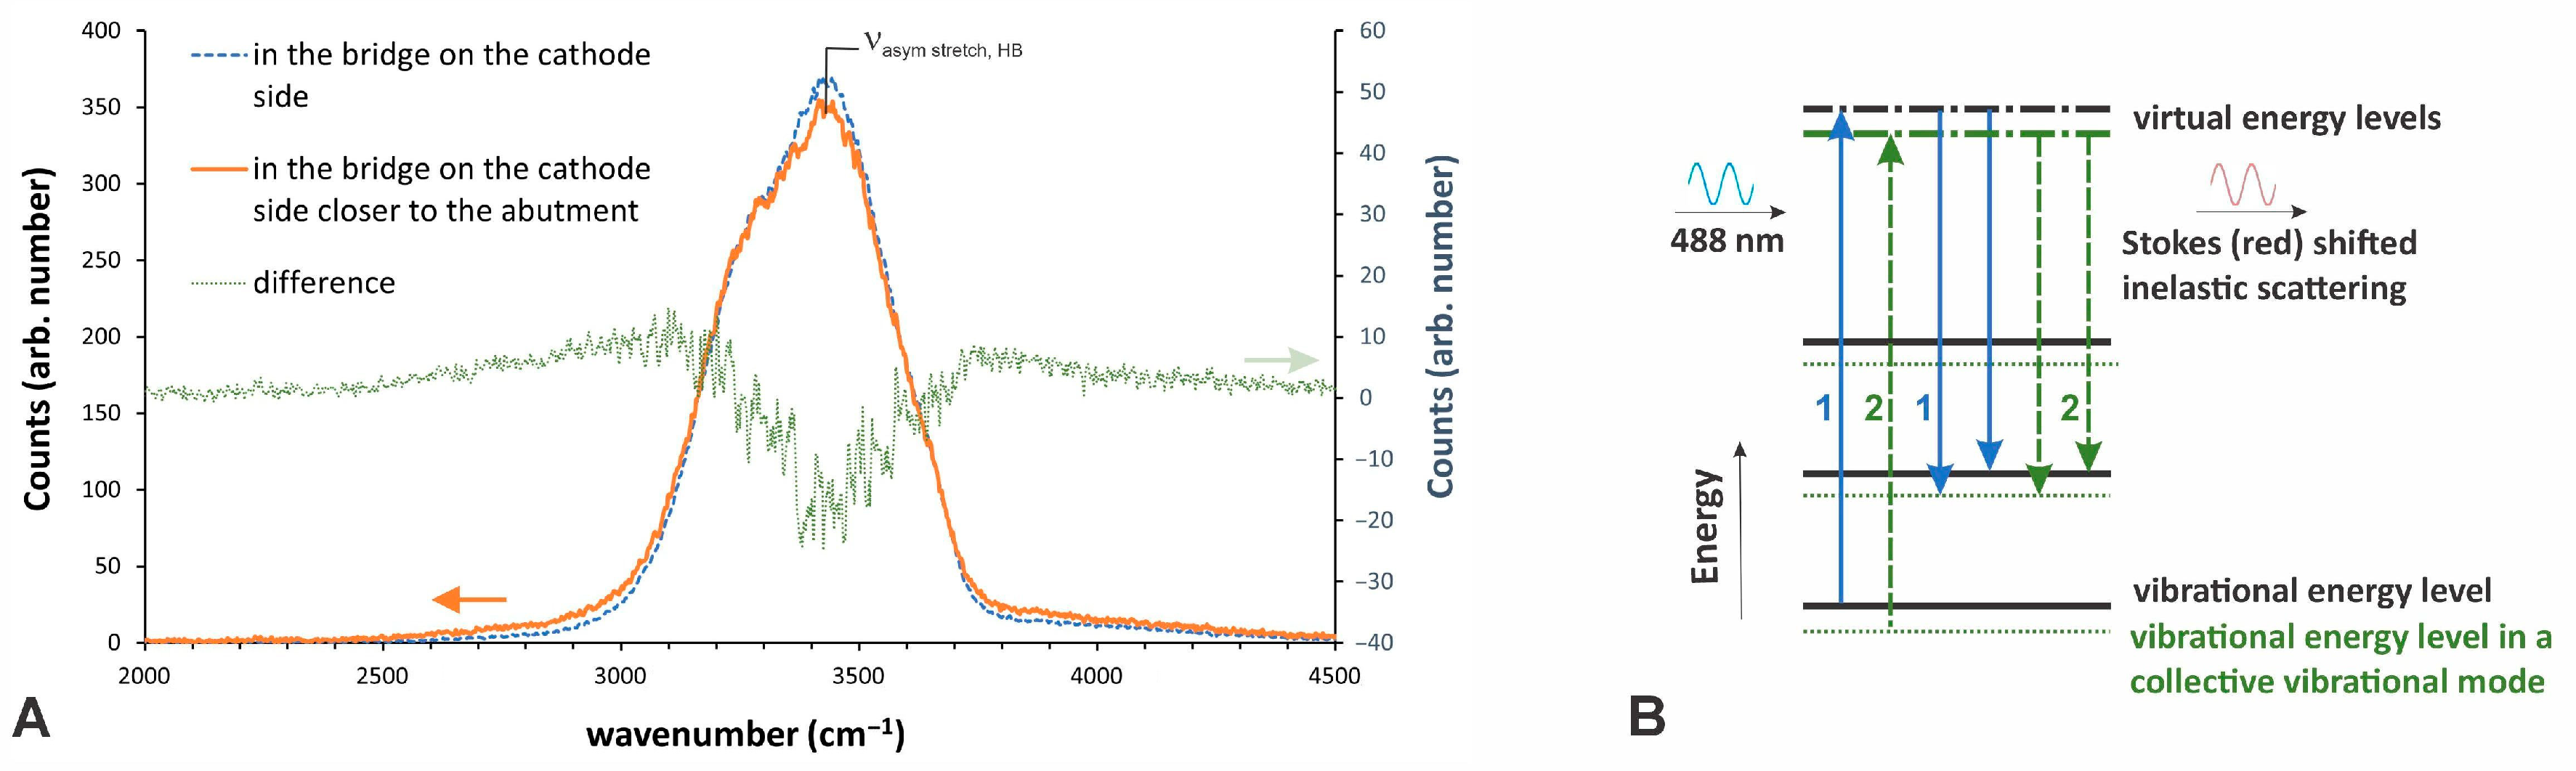
Figure 3A) sides above the abutment of the bridge, onto the entrance slit of the spectrograph (Acton SpectraPro 2300i, Acton Research Corporation, Acton, MA, USA). A notch filter (ZET488NF, OD ≥ 6, FWHM 17 nm, AHF Analysentechnik AG, Tübingen, Germany) was placed in front of the spectrograph’s 10 μm wide entrance slit to reduce the intensity of the Rayleigh-scattered light from the bridge. Spectral images were acquired using a cooled, image-intensified, 12-bit camera sensitive to the optical range of 190 nm (UV) to 900 nm (NIR). The camera has a resolution of 1280 × 1024 px, a pixel size of 6.7 × 6.7 μm, is single-photon sensitive, and is used for imaging and spectroscopy (VC–NanoStar, Art. No. 1101001, LaVision GmbH, Göttingen, Germany). The 150 G mm
−1 grating with a resolution of 0.9 nm at 435.8 nm and a dispersion of 21.2 nm/mm was used to obtain an overview on all the Raman lines of water with the Raman spectra presented in
Figure 2. The 600 G mm
−1 grating with a resolution of 0.2 nm at 435.8 nm and a dispersion of 5.12 nm/mm was used to record the spectra presented in
Figure 3 with a focus on the stretching vibrations. All spectra are cantered at a wavelength of 590 nm. A total of 256 burst spectra were averaged at a gain of 30, with a gate opening time of 20 ms for each. This resulted in a recording time of 5.12 s for one spectral frame. Three such frames were averaged and background subtraction was performed using a recording taken with the same parameters, but without the laser beam. Background frames were recorded without laser light but with the same parameters as the recording. The DC-powered bridge was mapped across approximately 70 lines, and the AC-powered bridge was mapped across about 90 lines. Then, the Raman spectra of the bridges were averaged line by line within this section, and the result was normalized. All image recording and postprocessing were carried out using LaVision DaVis software (V 7.2, LaVision GmbH, Göttingen, Germany). The calibration of the wavelength scale was performed using a Hg/Ar pen-ray lamp (LSP035, L.O.T.—Oriel GmbH & Co. KG, Darmstadt, Germany). Reference measurements on water at different temperatures and without high-voltage were taken with a glass cuvette (52 mm × 52 mm × 1 mm, Cat. No. 704.003, Hellma GmbH & Co. KG, Müllheim, Germany).
3. Results
Figure 1 shows the shadow visualization setup in section A, which is impaired by the strong effect of the bridge as a cylindrical lens. For this reason, the setup involves two passages of light through the bridge, with reflection on a retroreflective foil. This method highlights areas where the refractive index and thus the polarizability of the liquid water change. Secondly, we present and discuss the quantitative results of Raman spectroscopy in order to analyse the effects within the mesoscopic range. In Raman spectroscopy, a laser beam—here, with a wavelength of 488 nm—first forces the electrons of the molecules to oscillate relative to the nuclei. If the molecule is Raman-active, part of this excitation energy can be transferred to the vibrational states of the intramolecular partners. The difference in energy between the inelastically scattered and the initial light waves is characteristic of the vibrational state, and is specified as a wave number. As illustrated in
Figure 2A, these red-shifted Stokes lines in the Raman spectrum were recorded using an intensified CCD camera connected to a spectrograph.
Figure 1B shows a one-centimetre-long bridge that operated under a DC voltage of +16 kV and a current of 1 mA. Electrohydrodynamic bridges form when the water surface becomes electrically overcharged. This causes droplets and jets to detach from the surface [
13]. Once an aqueous connection is established between the water-filled beakers, the electrohydrodynamic pressure generated by the existing field gradients propels the flow through the bridge. Deflecting the aqueous flow into the bridge causes a vortex system to form at the bridge’s abutment, which modulates the protonated water flow from the anode beaker at about 100 Hz [
24]. Due to the different refractive indices of protonated and bulk water, a speeding schlieren system becomes visible, moving with velocities between 30 and 40 cm·s
−1 [
24]. This velocity is slightly higher than the diffusion-based proton velocity when using the proton mobility in water at 50 °C, which is about 25 cm·s
−1. The schlieren are accompanied by surface waves that are visible due to changes in reflection caused by variations in the surface tension of protonated water compared to bulk water. On the cathode side of the bridge, the charges are neutralized, causing turbulent mixing and the disappearance of the ring-shaped schlieren. These schlieren are too small to be explained by local temperature gradients. At the same time, a laser beam coupled into the bridge exhibited increased scattering in the vicinity of these ring-shaped structures of protonated water.
Figure 1C shows this light scattering, which was captured using an SLR camera with a long exposure time. X-ray scattering studies refuted the initial assumption that these scatterers were outgassing nanobubbles [
19].
To better understand how ion movement and proton conduction influence this type of electrohydrodynamic phenomenon, we examined the performance of bridges operating with both DC and AC voltages at peak voltages of +11 kV. The AC bridges were operated at frequencies ranging from 50 to 6000 Hz. The DC bridges, which were approximately 6 mm long, exhibited a resistance of about 10 MΩ. The AC bridges of the same length had a lower Ohmic resistance and a capacitance of approximately 100 pF. The distance between the two symmetrically arranged electrodes was 50 mm.
In
Figure 2, the 150 G mm
−1 grating was used to present an overview of all Raman lines of water within one recording.
Figure 2B compares the Stokes lines of the Raman spectrum of bulk water (dashed blue line) with the Raman spectrum of water from the centre of the bridge (solid orange line). The latter was operated at an AC frequency of 450 Hz with an Ohmic resistance of 0.5 MΩ and 120 pF. The temperature of the water under investigation was stable at 25 °C for both the bulk water and the electrified bridge water. The assignment of Raman wave number to the vibrational states of the water molecule follows the established literature [
12,
14,
30]. As can be seen, the bending vibrations and librations of the water molecule remain unchanged, while the ratio of hydrogen-bonded (HB) to non-hydrogen-bonded (NHB) stretching vibrations slightly changes, causing a shift in peak intensity of about 50 cm
−1. This change can be caused by either an increase in temperature, or in response to the high-voltage polarization current, which interferes with the hydrogen bond network. The details of this effect, observed in AC-operated HV bridges, are presented elsewhere [
12]. As outlined in this publication, polarisation effects caused by the external field distort the hydrogen bonds in bulk water, resulting in a shift in the vibrational spectrum towards that of free water. A comparable phenomenon is the thermal effect of temperature acting in the same direction, which may also yield the observed outcome. As reported in [
12], at temperatures of around 50 °C, any temperature-related effects become too severe to clearly identify the polarisation effect. In the experiments presented here, working temperatures are lower than that, so polarisation effects are detectable.
Figure 2C illustrates why a frequency above 400 Hz was chosen. Meaningful measurements are difficult to obtain at lower frequencies due to significantly higher oscillations in the bridge diameter. Temperature distributions on the surface of the aqueous bridge, as observed with a thermographic camera in
Figure 2C, also reveal uniform inductive heating of the bridge at 450 Hz; however, this heating is significantly lower than at higher frequencies or due to the Ohmic heating in a DC-operated bridge. The AC bridge operating at 450 Hz stabilises at a temperature of approximately 25 °C due to cooling by air convection and generally lower heat production. In contrast, DC bridges might stabilise at temperatures above 40 °C depending on their length and applied voltage [
6]. Measuring the temperature of the DC-operated bridge is also problematic due to the effect of a change in emissivity, as mentioned in the introduction and discussed in [
28]. In the case of the DC voltage-operated bridge, significant mass transport from the anode beaker (+11 kV) to the grounded cathode beaker can be observed in the thermograms.
The Raman spectra in
Figure 2D compare the signals from a position near the anode spout with the signal from the centre of the DC-operated bridge at an applied voltage of +11 kV. This way of comparing the two spectra makes sure that the temperature and compositional changes due to electrolysis do not affect the comparison. These measurements were done at the same bridge, but in different positions. This comparison demonstrates the influence of proton conduction at the anode side of the DC-driven bridge, as evidenced by increased molecular librations and their combinations with bending and stretching vibrations [
24,
30].
The Raman spectra of the OH stretching vibrations of the water molecule are compared in
Figure 3A for two different positions at the cathode side of the bridge operated at +11 kV DC. These spectra were recorded using a 600 G mm
−1 grating, which has a significantly higher resolution than the 150 G mm
−1 grating used in
Figure 2 for the overview spectra. The Raman spectrum plotted as an orange solid line stems from a position approximately 2 mm closer to the abutment of the bridge than the blue dashed line. The dashed blue line plots the second spectrum, which was recorded closer to the centre of the bridge, so the spectrum represented by the orange solid line was recorded in a region with a higher electric field strength. The overview spectrum in
Figure 2D indicates that proton conduction through the bridge has decreased significantly in this area, meaning that water is being examined at different field strengths in the two positions compared. As for
Figure 2D, both spectra were recorded in the same bridge to eliminate the effects of temperature and compositional effects on the observed results. In
Figure 3A the difference between the two spectra is shown as a green dotted line. Two sidebands are visible, centred around the asymmetrical HB stretch vibration of the OH bond. To obtain a zero level on both sides of the spectrum, the area under the spectral distribution was used to normalise the spectra compared. As previous research has shown that the sidebands are not in thermal equilibrium [
22], no peak fitting was performed. As this measurement involves differential investigation in an electrohydrodynamically-driven turbulent fluid flow, the signal-to-noise ratio is lower than that of electrostatic investigations, in which the Raman spectra of deionised water with and without an applied voltage were examined [
20,
22].
4. Discussion
The existence of sidebands in the electrohydrodynamic bridge is supported by investigations of water in the vicinity of a needle subjected to a moderately high-voltage [
22]. Among several theoretical descriptions proposed for mesoscopic ordering in water, including hydrogen-bond network models, phenomenological multi-state descriptions, and classical electrohydrodynamic approaches, quantum field theoretical treatments of electrically driven symmetry breaking provide a consistent framework for interpreting the observed vibrational coupling and spectral sidebands [
22]. These frameworks are not mutually exclusive and may describe different aspects or regimes of electrically stressed water.
Numerical simulations of electrohydrodynamic flow through the bridge indicate that the highest field strength is found above the beaker spout [
31]. The area of the bridge facing the cathode beaker is of particular interest because it contains bulk water in the presence of strong electric fields and field gradients.
From a quantum field perspective, molecular dipole vibrations represent states, the rotational symmetry of which might be spontaneously broken by an electric field [
22]. The loss of rotational degrees of freedom results in the formation of a new, energetic ground state characterized by boson condensation and in-phase molecular dipole vibrations. This state is characterized by Nambu–Goldstone bosons that are coherently located in the newly created ground state resulting from spontaneous symmetry breaking. This state can extend beyond the microscopic range, manifesting in
Figure 3A as sidebands in the OH stretching vibrations. Another interesting feature of the spectra shown in
Figure 3A is that the sidebands are centred on the frequency of the asymmetric stretching vibration. Therefore, it is likely that transverse polar modes exist in this phase, which have been predicted for some time theoretically [
21] and would also be Raman-active due to a change in polarizability in this mode. The change in refractive index associated with changes in polarizability has been discussed elsewhere [
32] using the Ginzburg–Landau theory. In this electrohydrodynamic bridge driven by a +11 kV DC voltage, the vibrationally coupled mode is located approximately 400 cm
−1 below the energy of the asymmetric stretching vibration. The number density of these phase-coupled modes cannot be determined because the Raman cross section for this state is unknown.
Figure 3B shows an attempt to explain the different intensities of the sidebands of the asymmetric OH stretching vibration of the water molecule. When electrons are forcibly excited to oscillations by an incident laser beam, the molecule’s total energy increases. In a purely schematic and non-scale representation,
Figure 3B illustrates the increase in energy by plotting a virtual energy level of the molecule. Exciting phase-coupled OH stretching vibrations appears to be more difficult than transitioning from a non-coupled to a coupled state via inelastic Raman scattering. Therefore, transition 1, as shown in
Figure 3B, seems more likely. This transition reduces the Stokes shift of the Raman-scattered light by about 400 cm
−1. The transition from a phase-coupled state to a free vibrational state, marked 2 in
Figure 3B, appears less likely and increases the Stokes shift by about 400 cm
−1.
One could hypothesize that the increased jump distance observed in proton conduction, as tested through quasi-elastic neutron scattering in the type of electrohydrodynamic bridge discussed here [
27], is due to these correlated vibrational states in electrically charged water. Theoretical studies demonstrate that protons can experience wild fluctuations in the hydrogen bond network when driven by quantum fluctuations [
33]. These events are strongly correlated across neighbouring bonds, so that perturbations influencing the HB network alter water’s behaviour in a concerted way. The quantum field approach is further supported by an investigation of the electrohydrodynamic bridge via femtosecond pump-probe spectroscopy in the mid-infrared range [
34]. Domains containing an intermediate state of water that exists between solid (ice) and liquid states in this type of electrohydrodynamic bridge were proposed by this study, with the HB network strengthened inside of these domains. An ice-like structure in water was also found in interfacial water on the surfaces of various materials and has gained widespread attention due to its importance for many water-treatment devices [
35,
36].
Another issue for discussion is the impact of the significantly stronger electric field of protons and hydronium ions on the phase coupling of the vibrational states of water molecules within their hydration shells. According to the above results, these domains will appear quantum-entangled, and their refractive indices and scattering cross sections will differ from those of the surrounding water. This idea could explain the observations shown in
Figure 1B,C. Attempts are being made to understand the domain formation process, in which correlated molecular oscillations are observed, within the framework of quantum field theory, predicting an increase in density and other physical properties of interest to biology and engineering within these domains [
37].
Overall, the spectroscopic, optical, and electrohydrodynamic observations presented in this work in combination with previous work, especially on Raman spectroscopy of electrified water [
12,
14,
20,
22], ultrafast infrared relaxation spectroscopy on the water bridge [
34], and quasi-elastic neutron scattering investigations [
27], provide experimental evidence that electrically stressed water in the water bridge supports dynamically ordered mesoscopic states whose emergence is consistently described within a quantum field theoretical framework of symmetry breaking and collective molecular dynamics [
22,
32,
38,
39].
6. Outlook
From a fundamental perspective, liquid water occupies a special position among condensed phases. Considering the molecular mass of the H
2O molecule alone, water would be expected to behave as a gas under ambient conditions. Its existence as a dense liquid at room temperature is instead a direct consequence of strong intermolecular interactions mediated by hydrogen bonding, which exhibit a significant degree of covalent character and lead to pronounced cooperative behavior across extended molecular ensembles [
40,
41]. As a result, liquid water cannot be adequately described as a collection of weakly interacting molecules, but rather as a dynamically connected network in which collective rearrangements dominate its structural and dynamical properties. In this sense, macroscopic volumes of water can be viewed as forming a single, continuously reconfiguring supramolecular entity, whose cooperative coupling can be further enhanced and biased by external electric fields [
42].
Conceptually, the dynamically ordered mesoscopic water domains discussed in this work can be compared to phenomena known as quantum time crystals [
43]. Time crystals are characterized by the emergence of temporal periodicity associated with the breaking of time-translational symmetry under driven, non-equilibrium conditions. Notably, such effects have been reported to persist on mesoscopic length scales and to be inducible by external electromagnetic driving [
44].
Against this background, the periodically modulated and spectroscopically distinct mesoscopic structures observed in electrically stressed water can be viewed as manifestations of driven collective dynamics in the time domain. While the available data are not sufficient to support a direct realization of time-crystalline order in water, the present observations highlight potential conceptual parallels between non-equilibrium ordering phenomena across different physical systems. Further experimental and theoretical work will be required to clarify the extent to which quantum-inspired frameworks can contribute to a unified description of mesoscopic ordering in water that is relevant for biological, interfacial, and water-engineering applications.