Article

Optimization of Electrical Resistivity Tomography Monitoring for Weak Electrical Response Pollutants: A Coupled Field–Sand Tank Experimental Study Taking Nitrate as an Example


1
Key Laboratory of Groundwater Resources and Environment, Ministry of Education, Jilin University, Changchun 130021, China
2
Jilin Provincial Key Laboratory of Water Resources and Environment, Jilin University, Changchun 130021, China
3
Hebei Institute of Geological Survey, Shijiazhuang 050200, China
4
College of Geo-Exploration Science and Technology, Jilin University, Changchun 130015, China
*
Author to whom correspondence should be addressed.
Water 2026, 18(3), 404; https://doi.org/10.3390/w18030404
Submission received: 7 January 2026 / Revised: 29 January 2026 / Accepted: 30 January 2026 / Published: 4 February 2026
(This article belongs to the Section Water Quality and Contamination)

Abstract

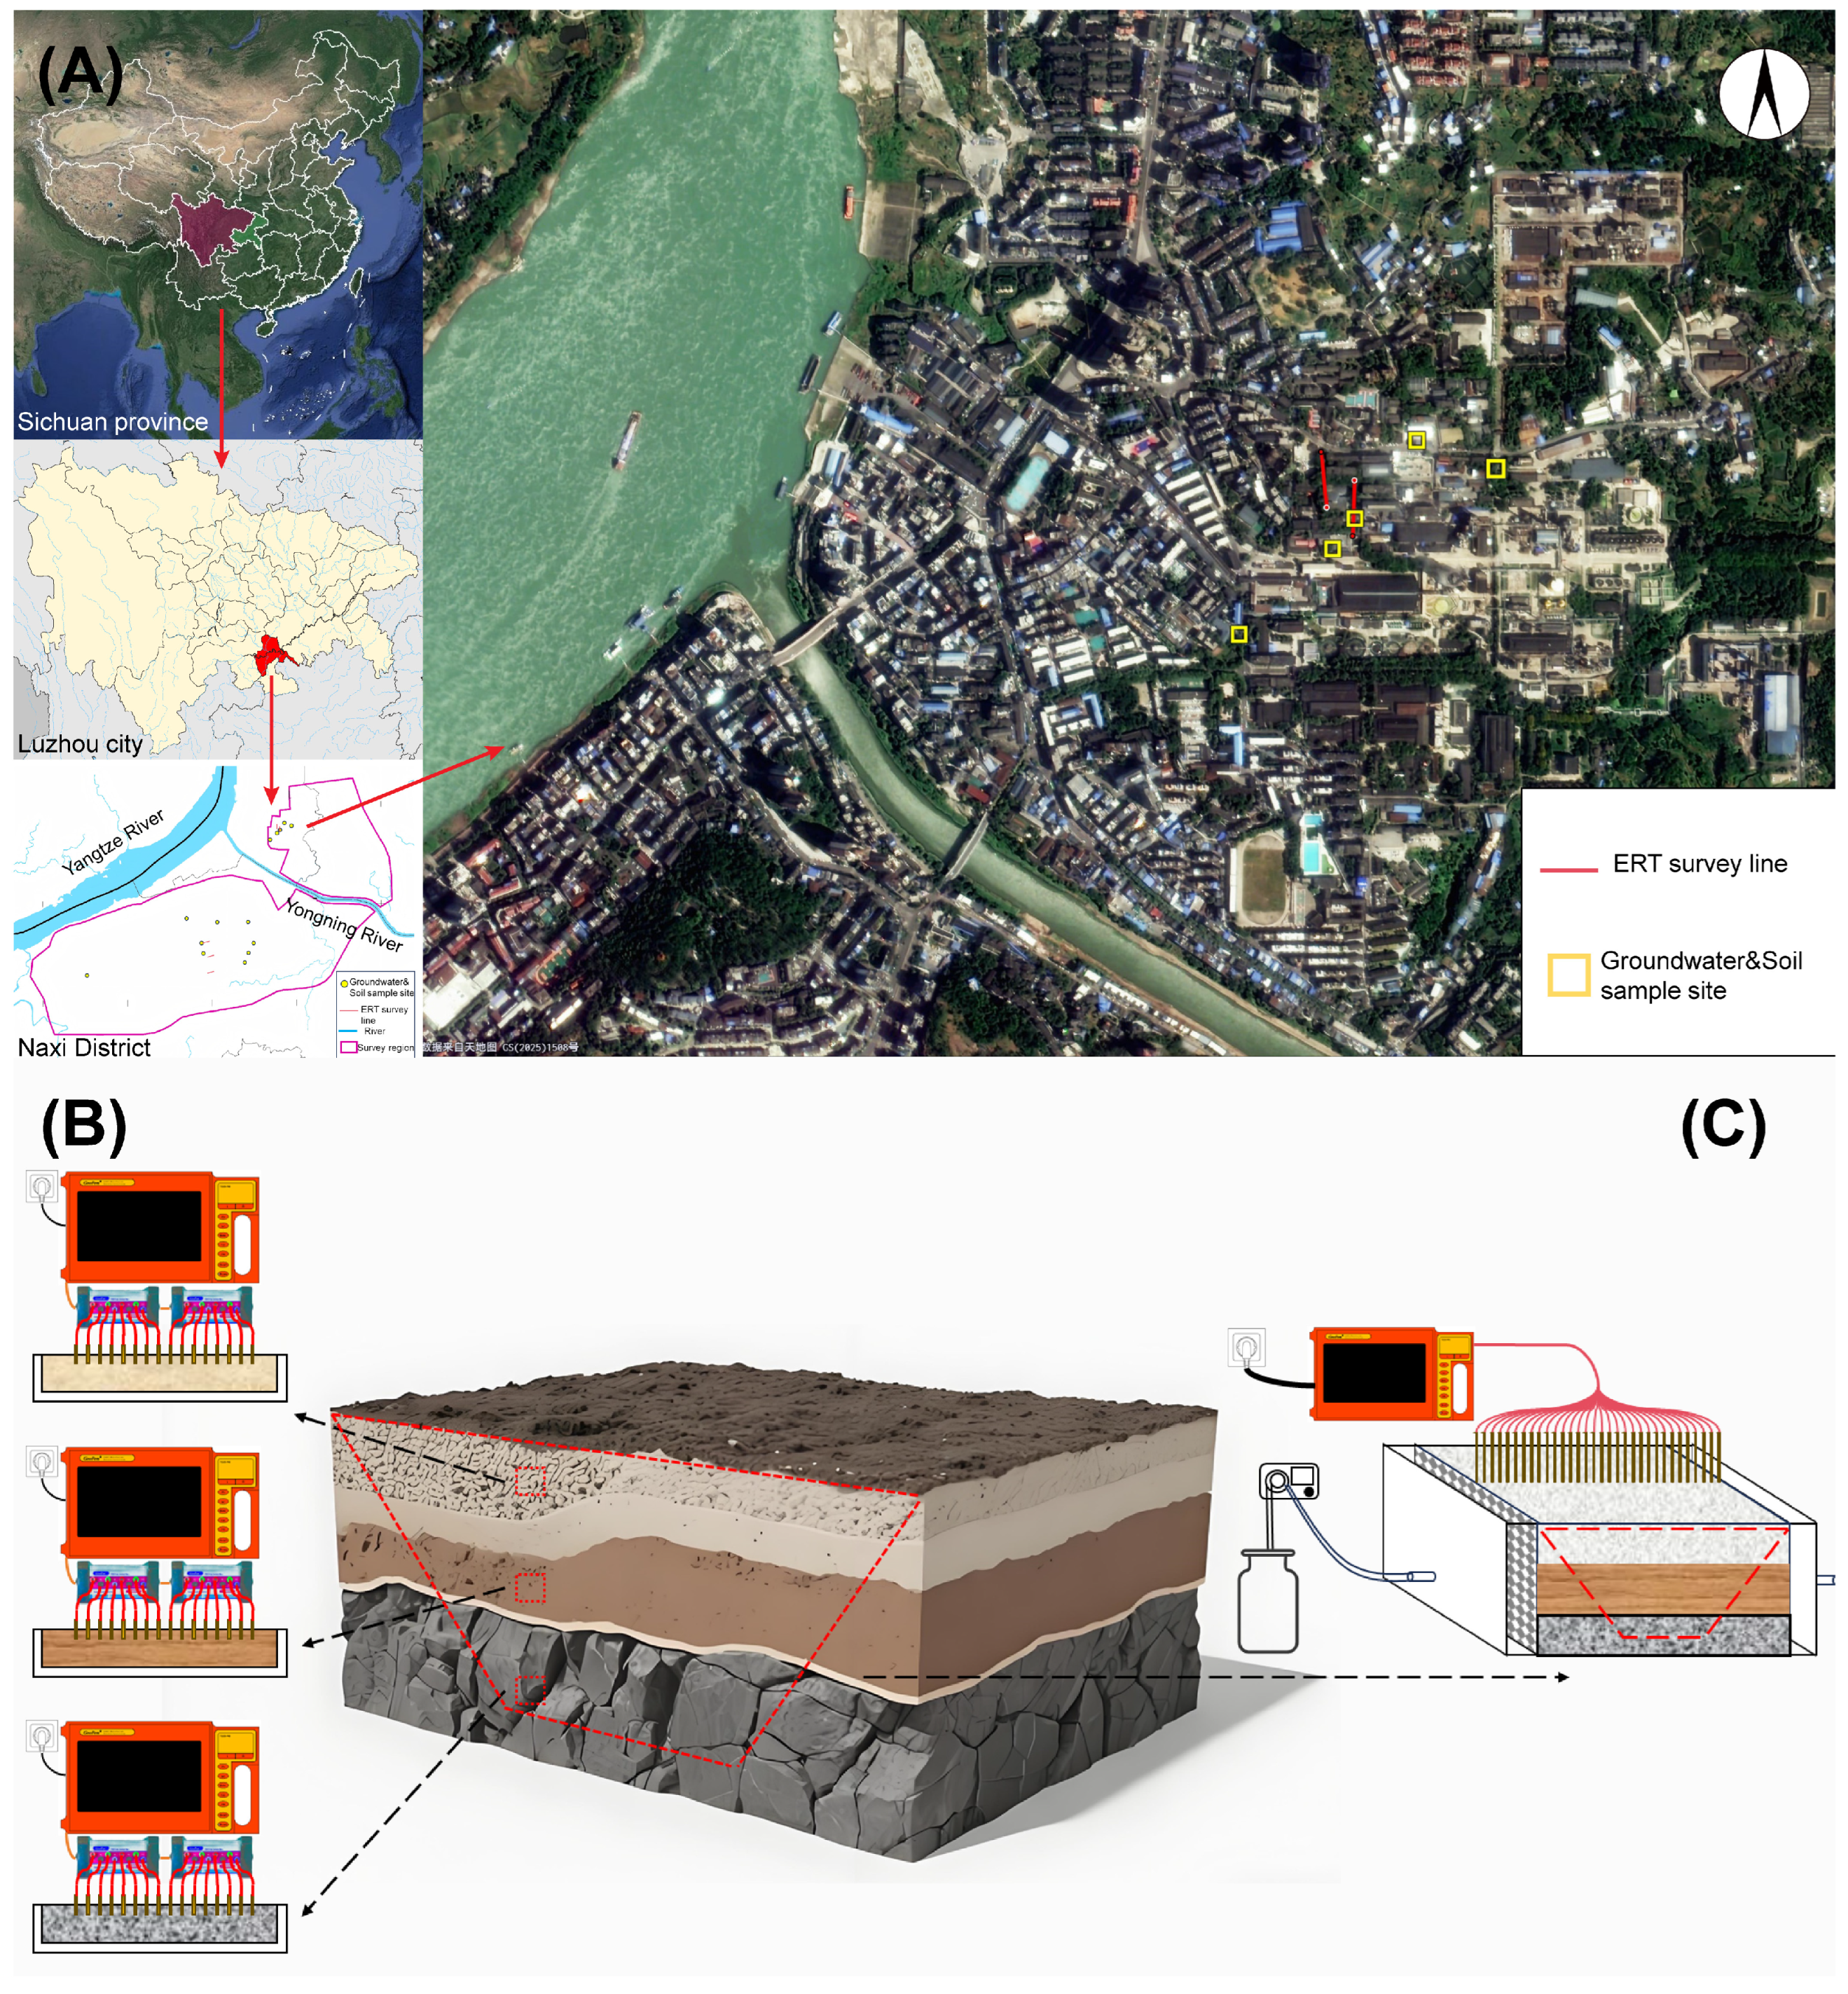
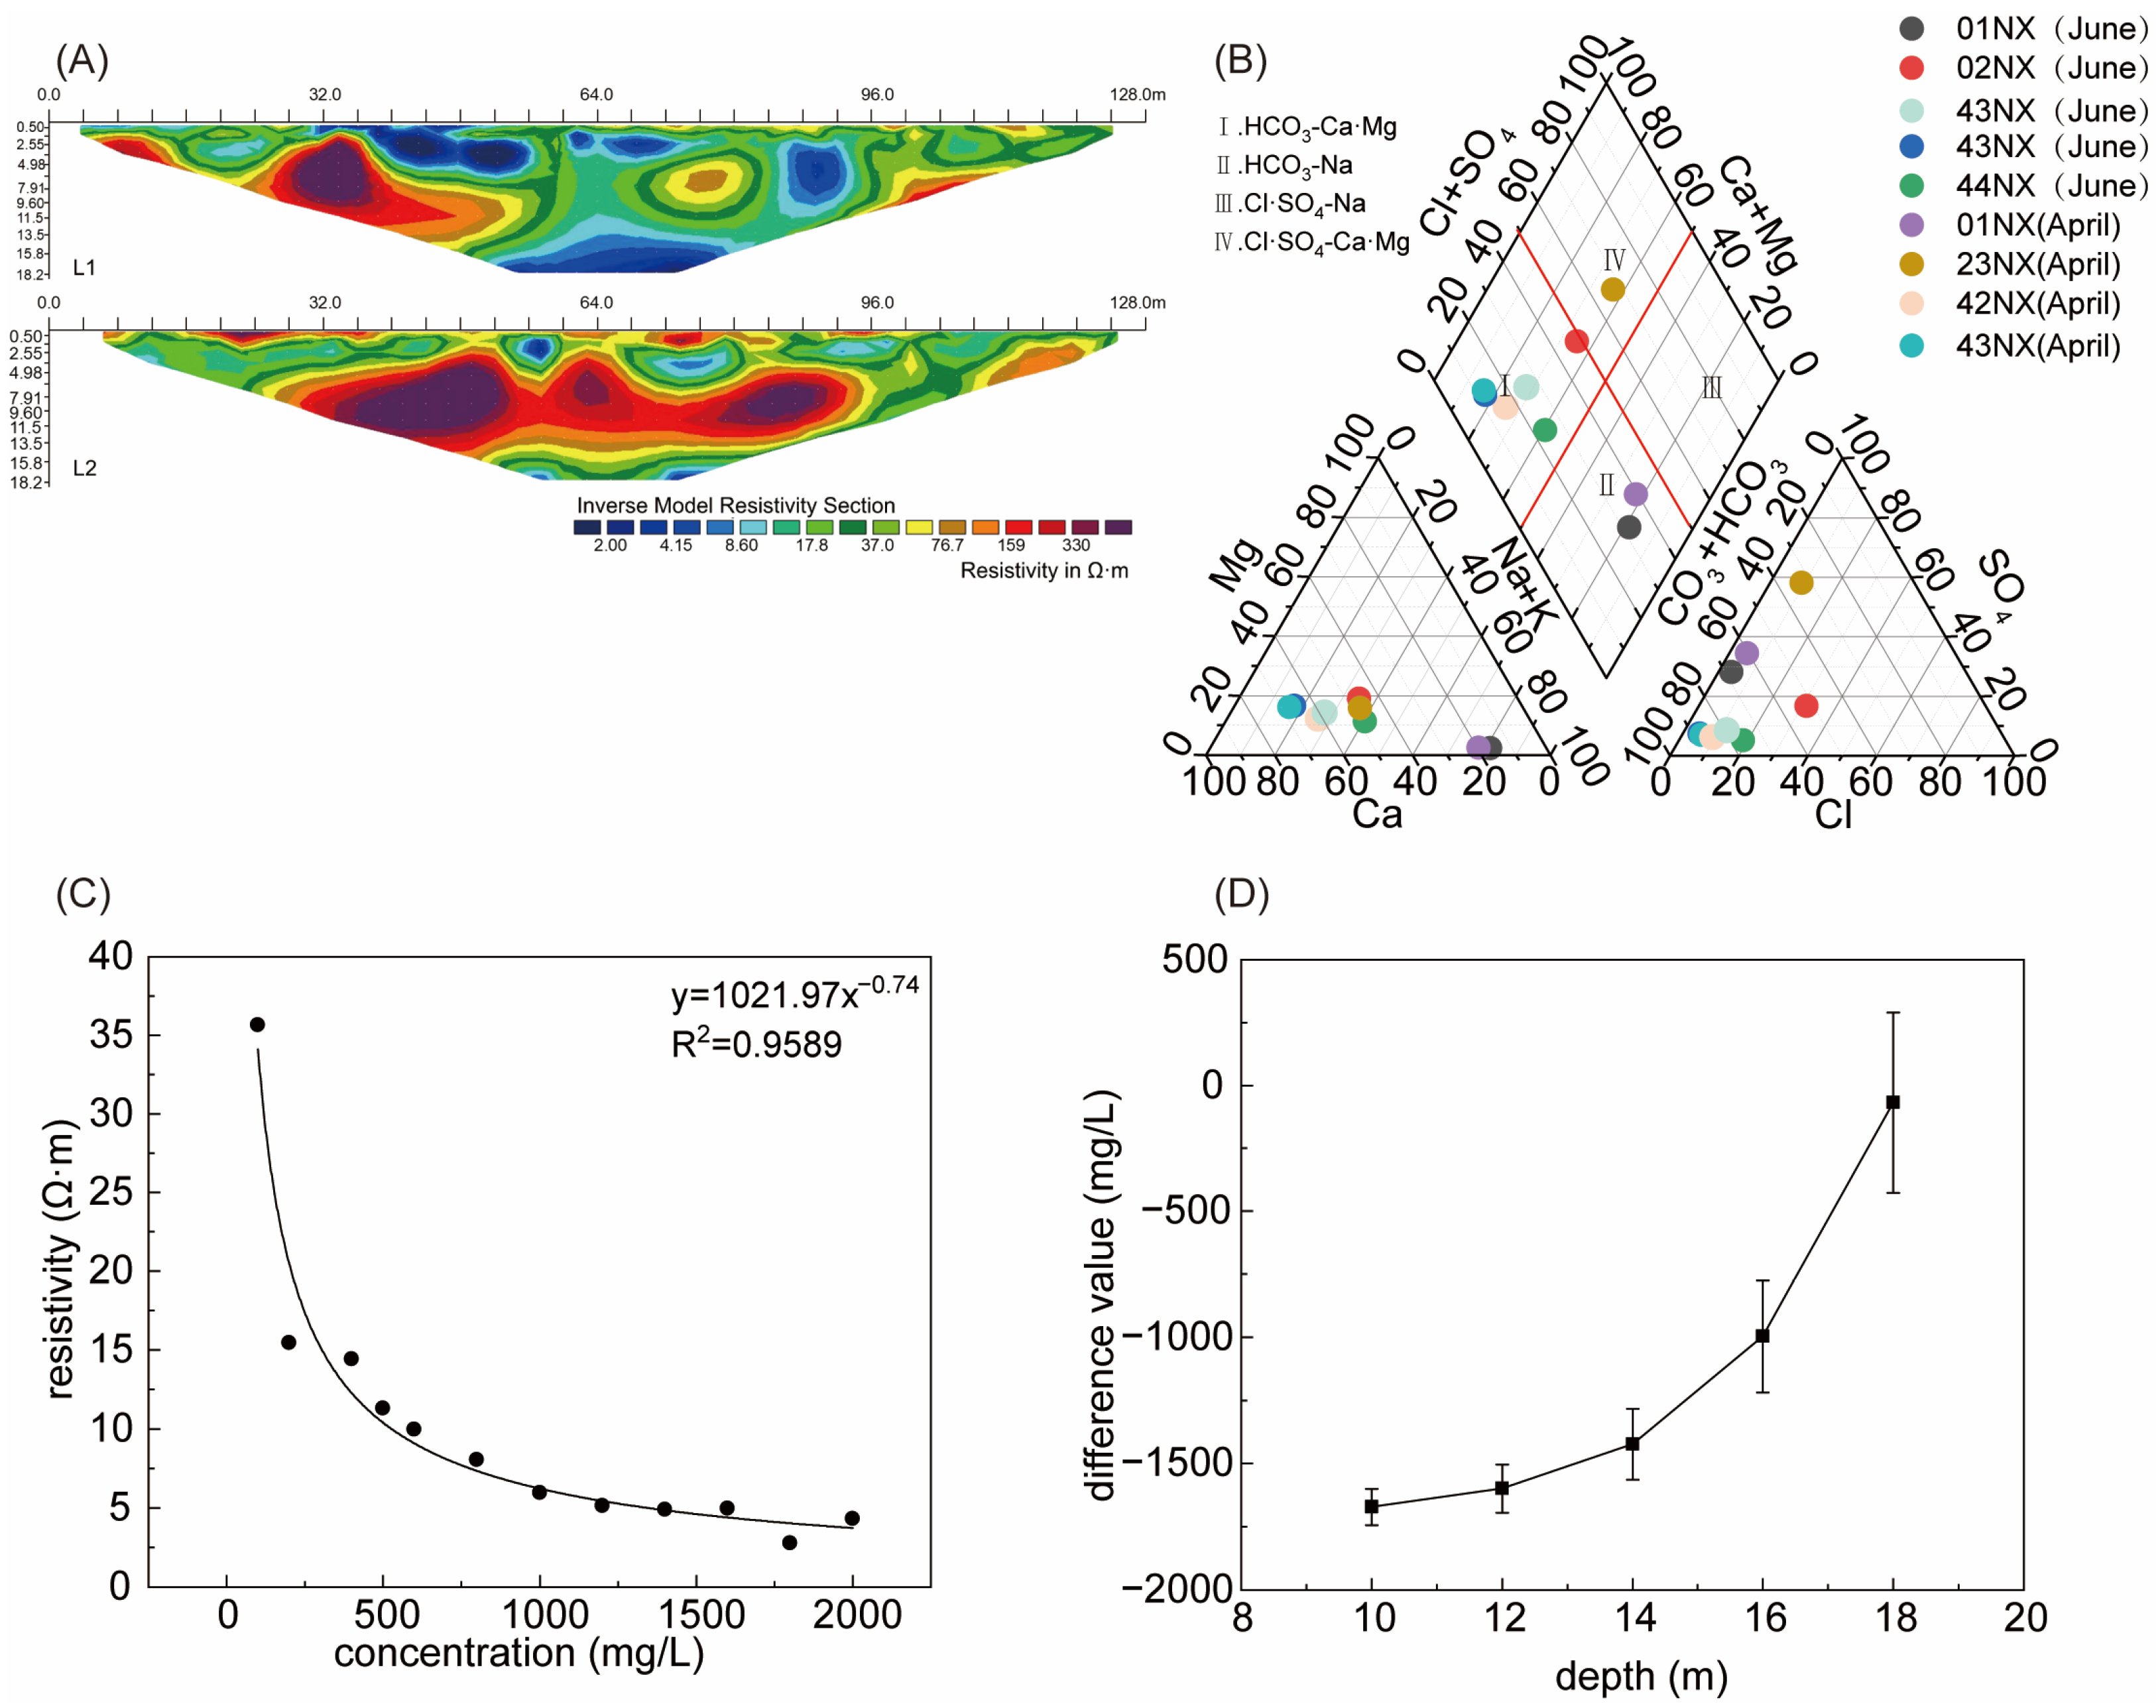
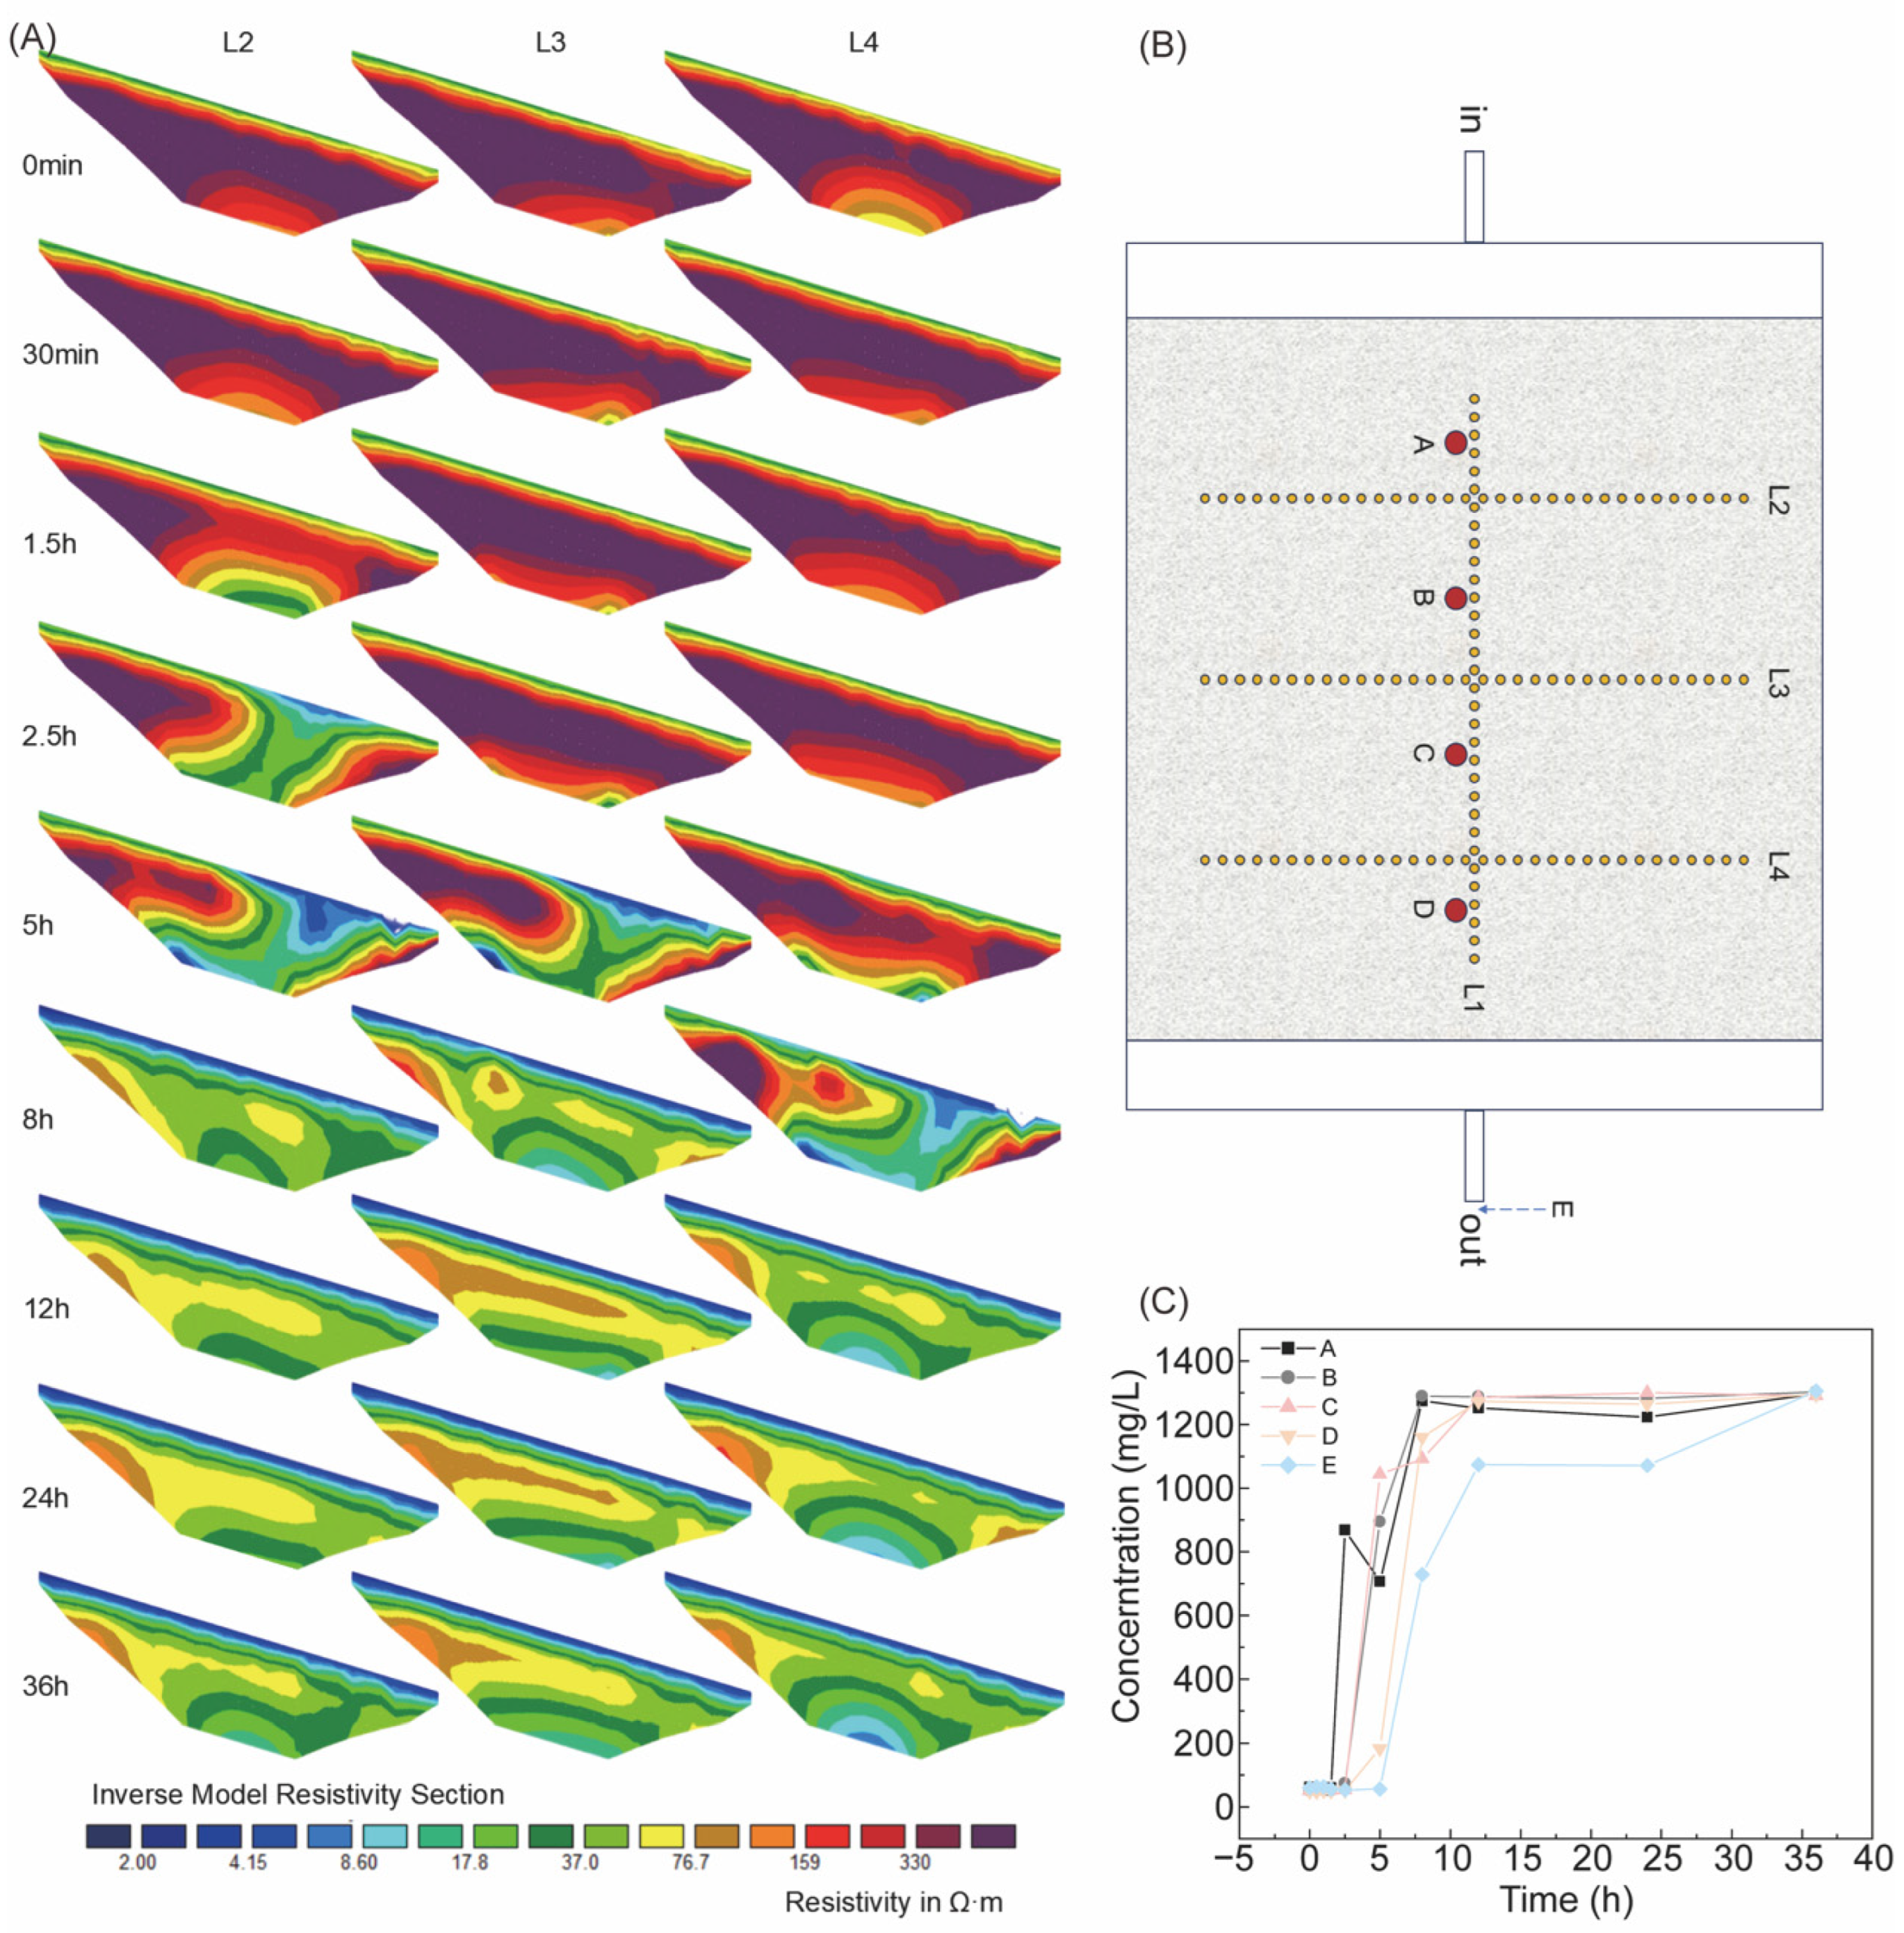
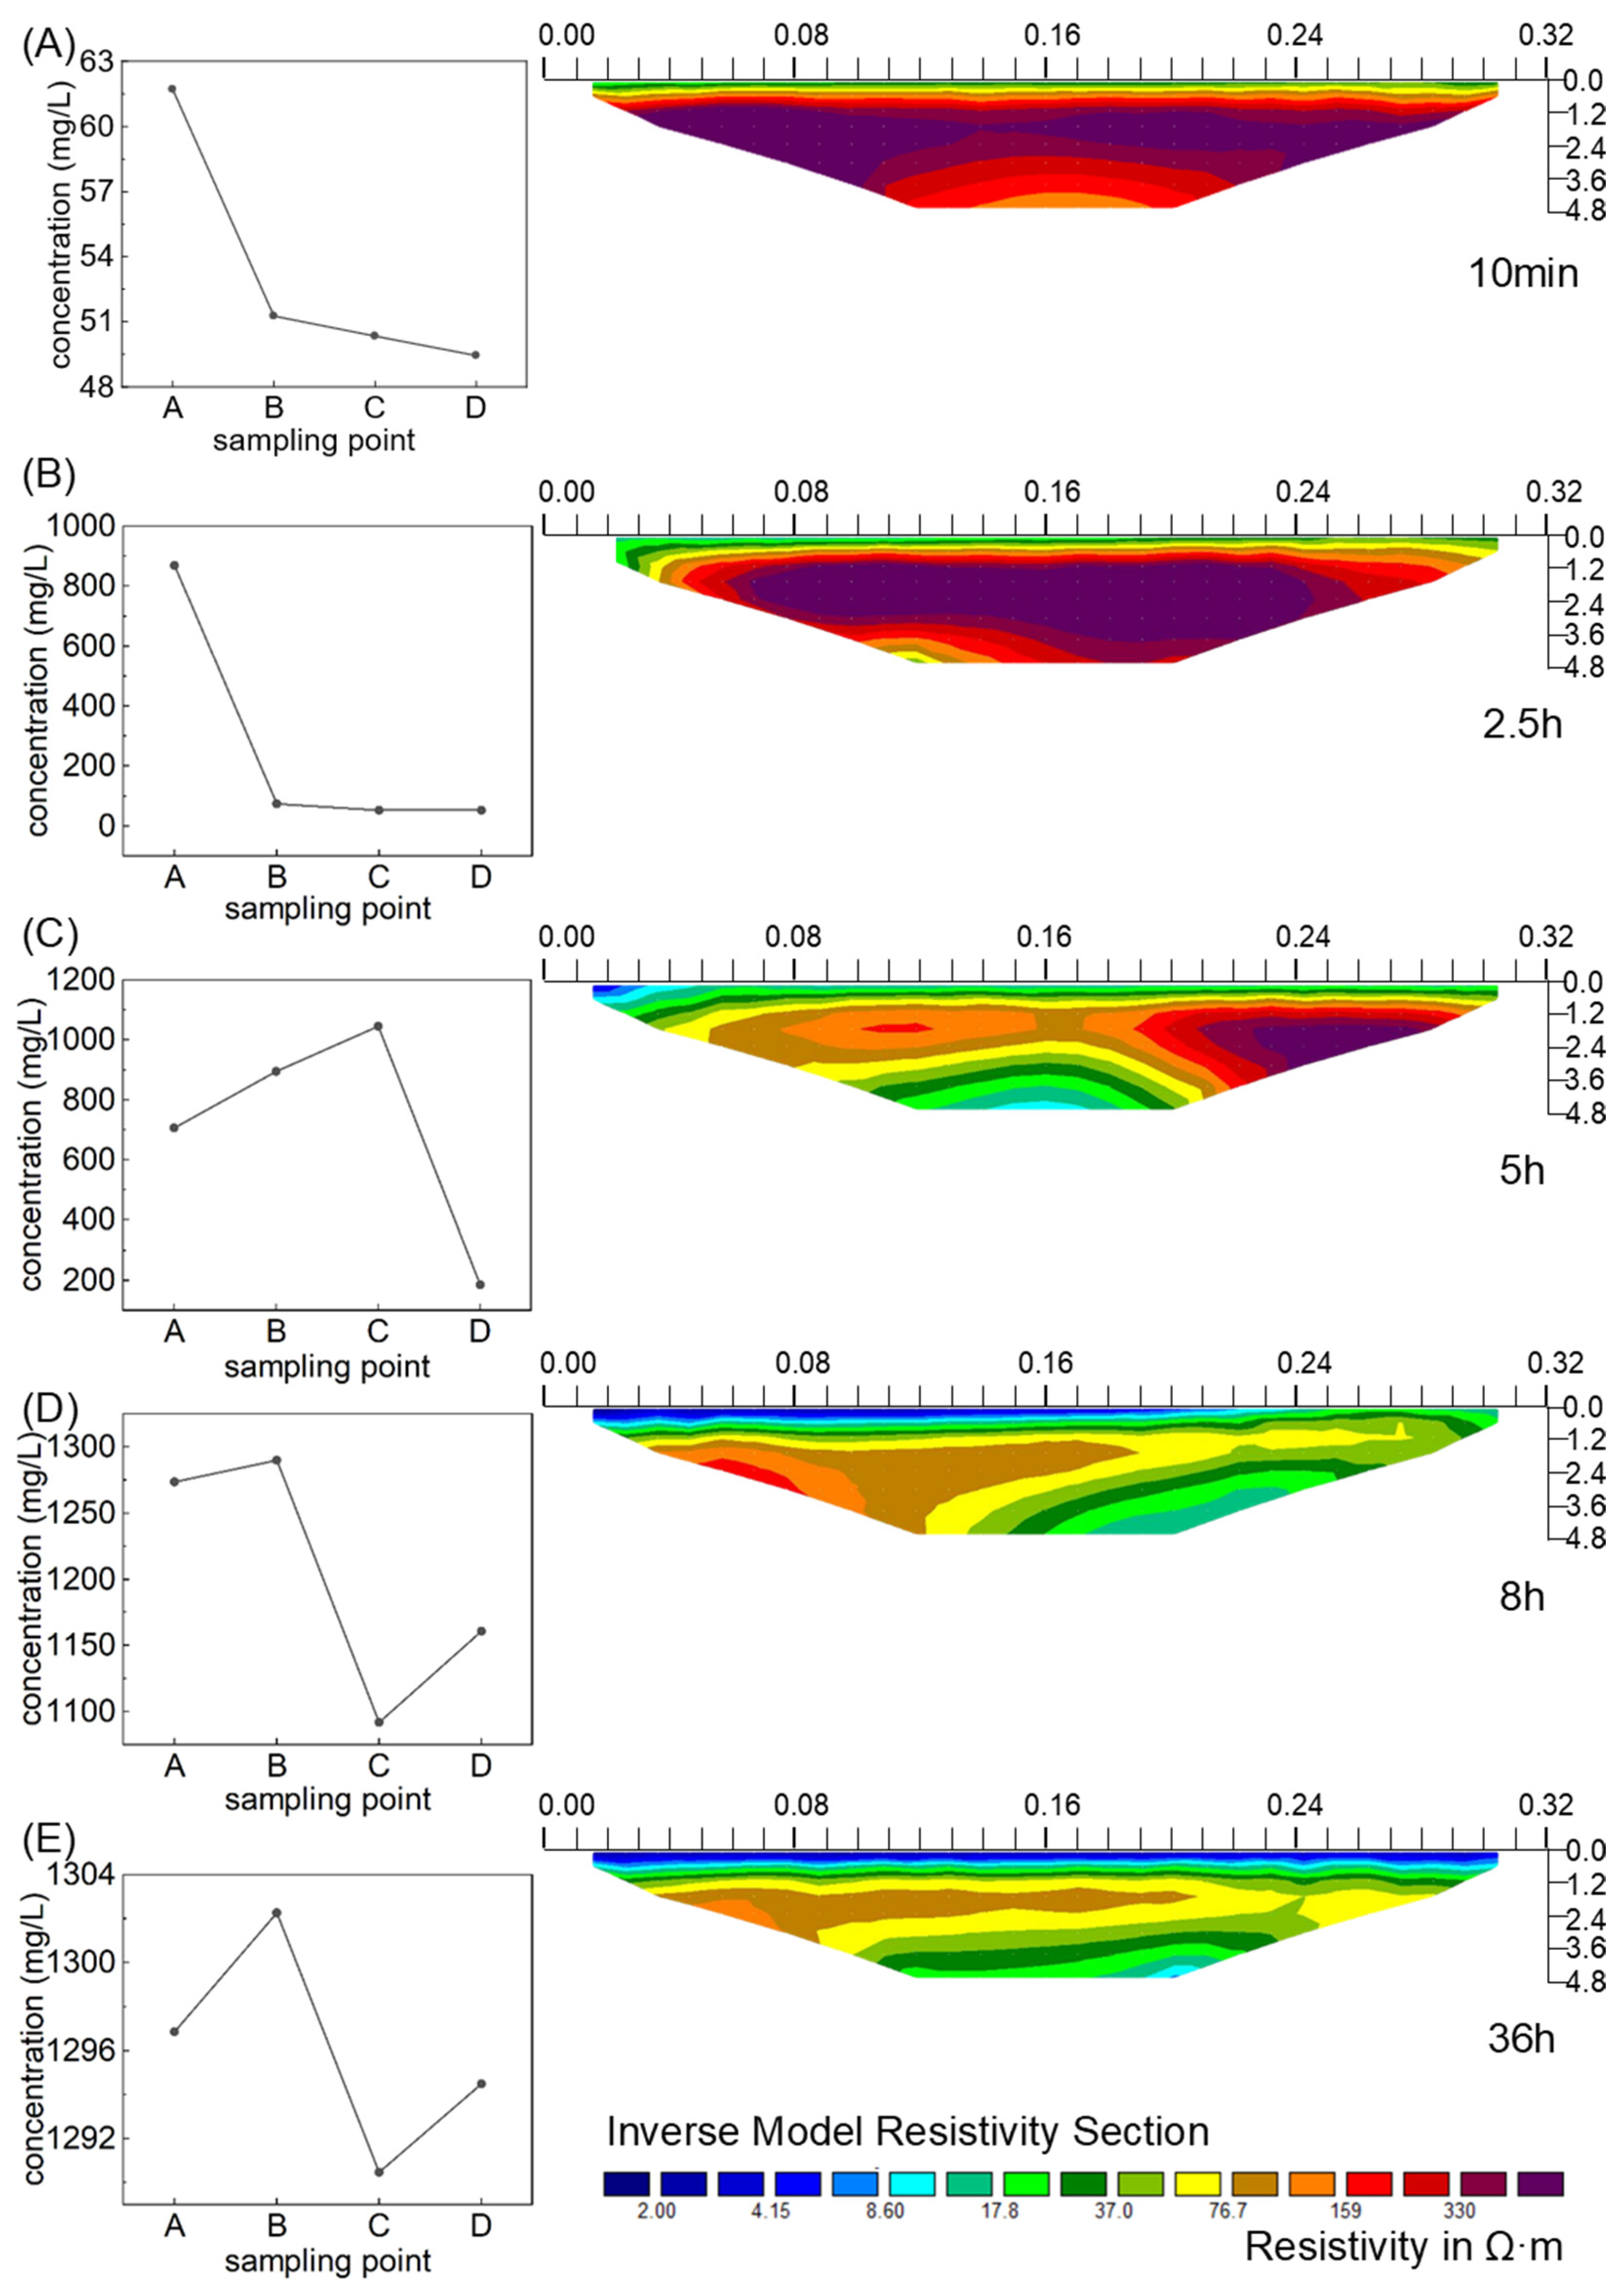
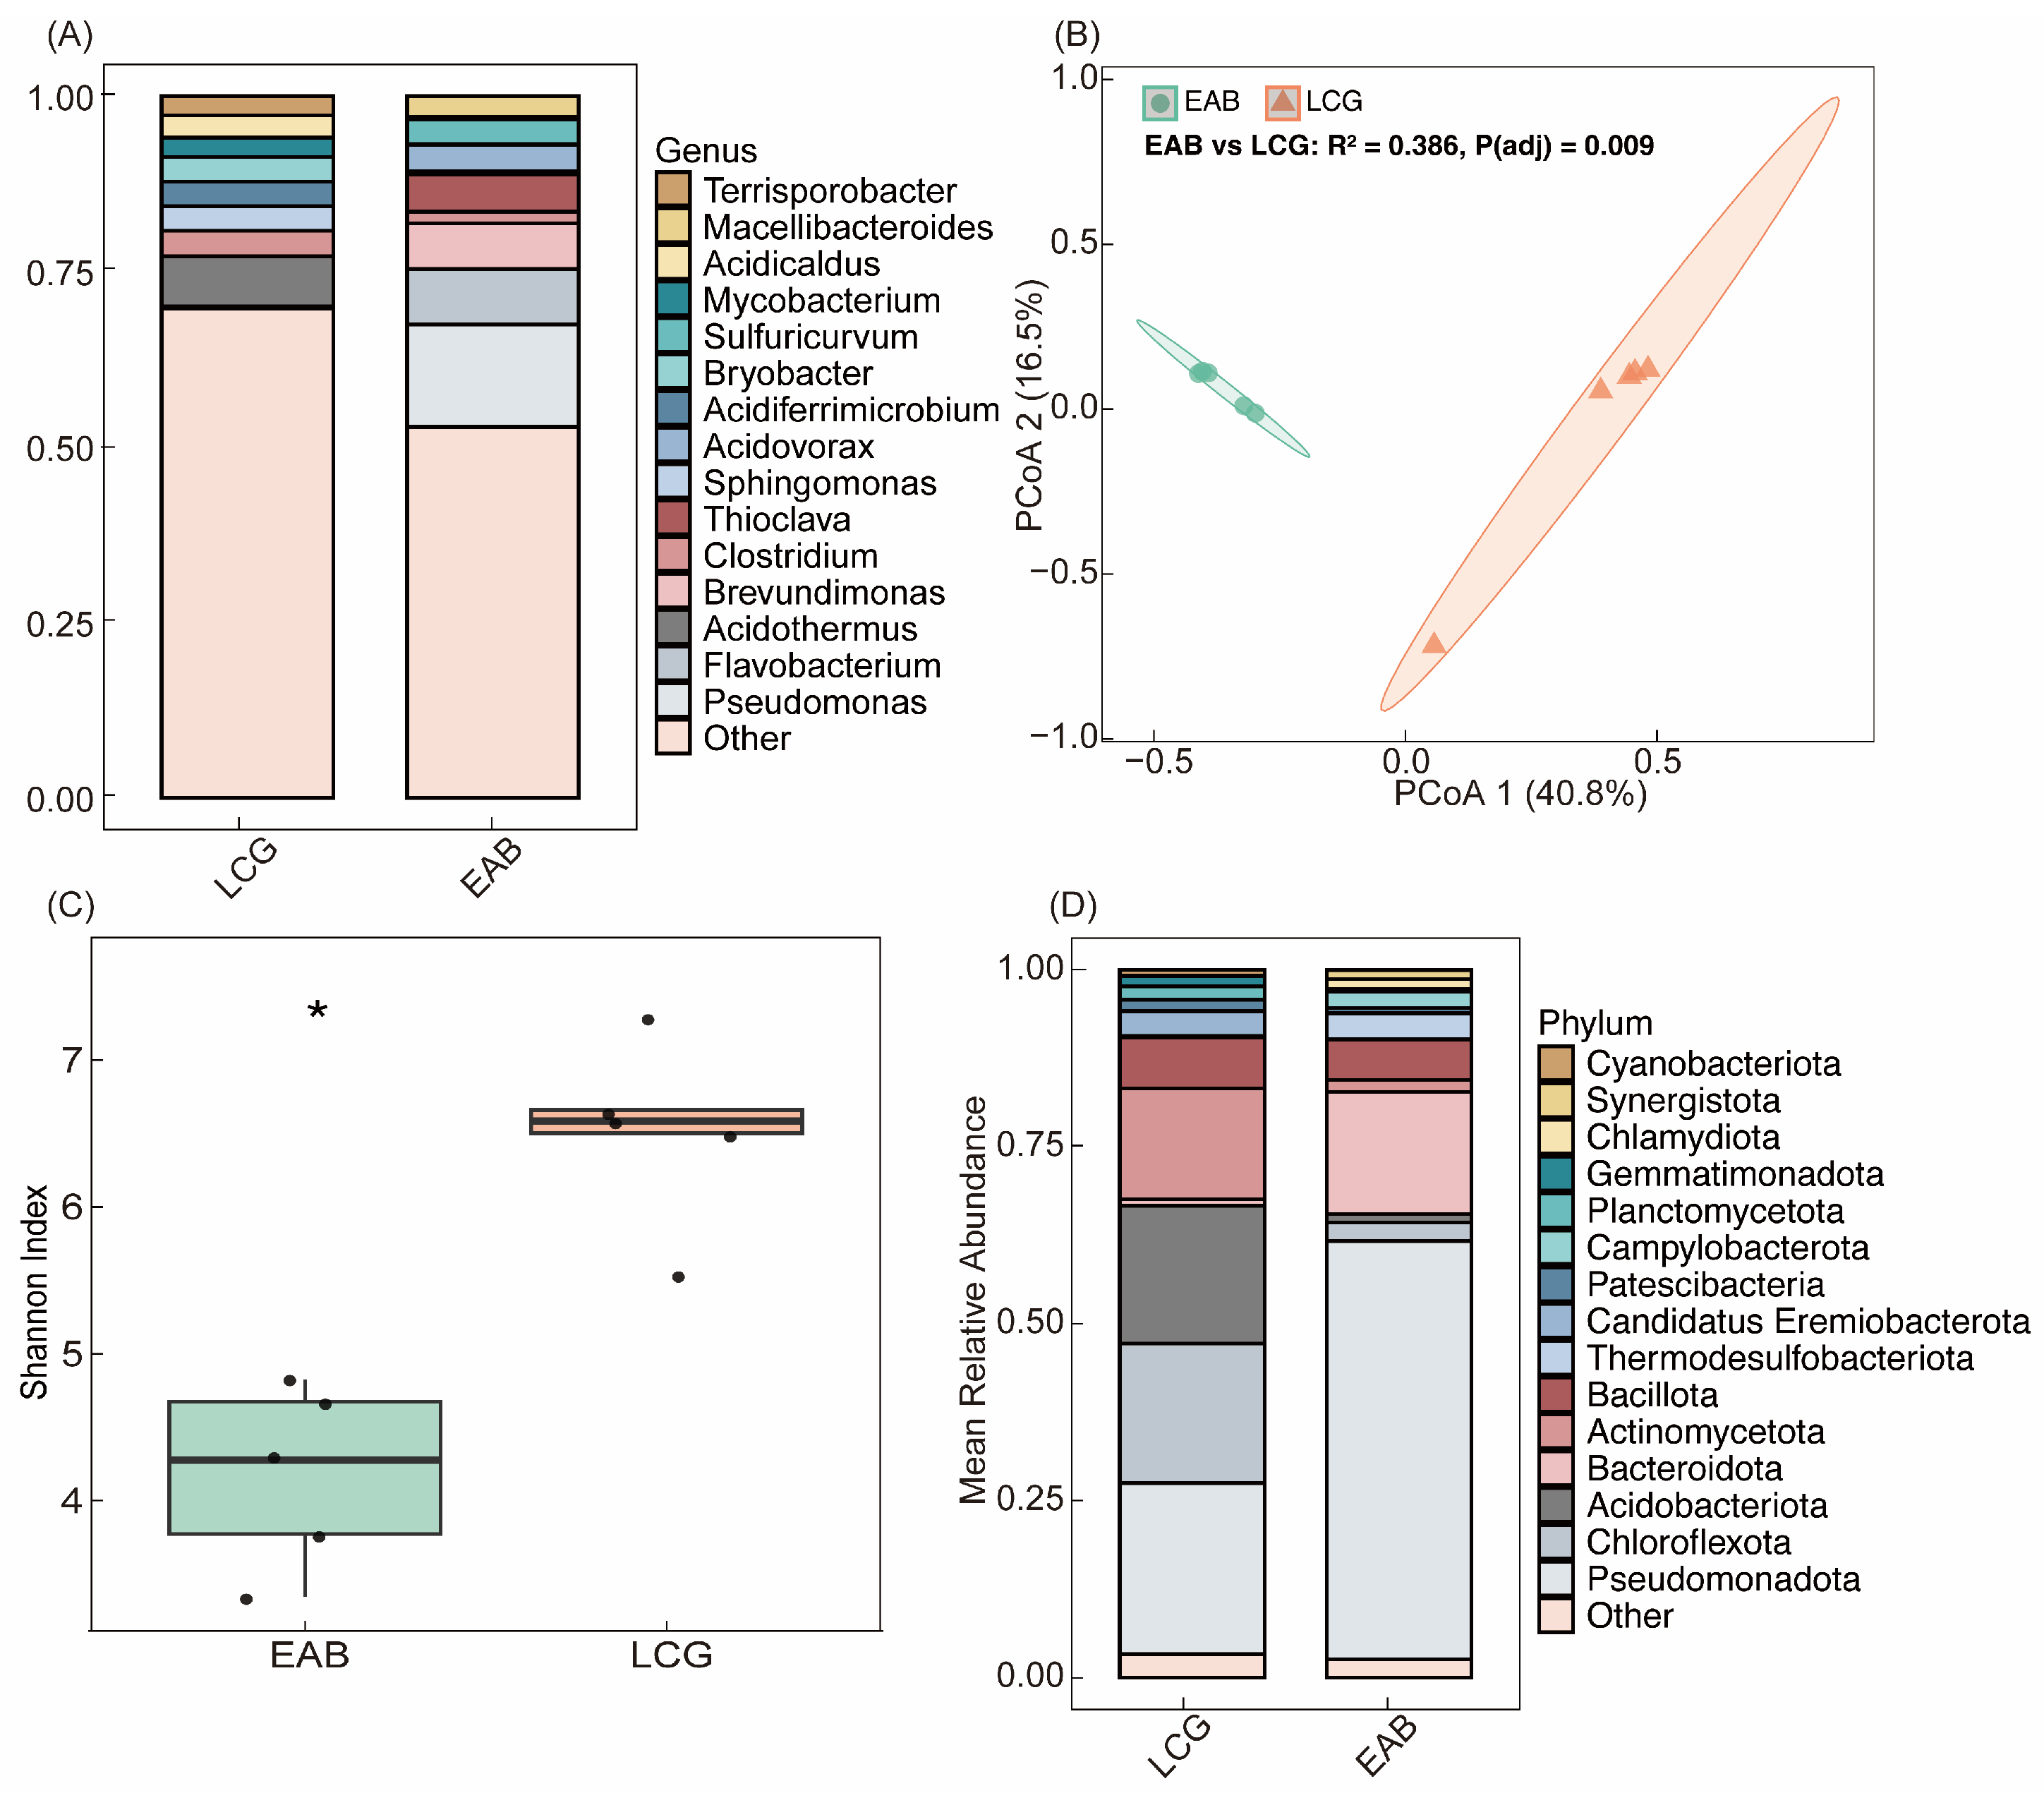
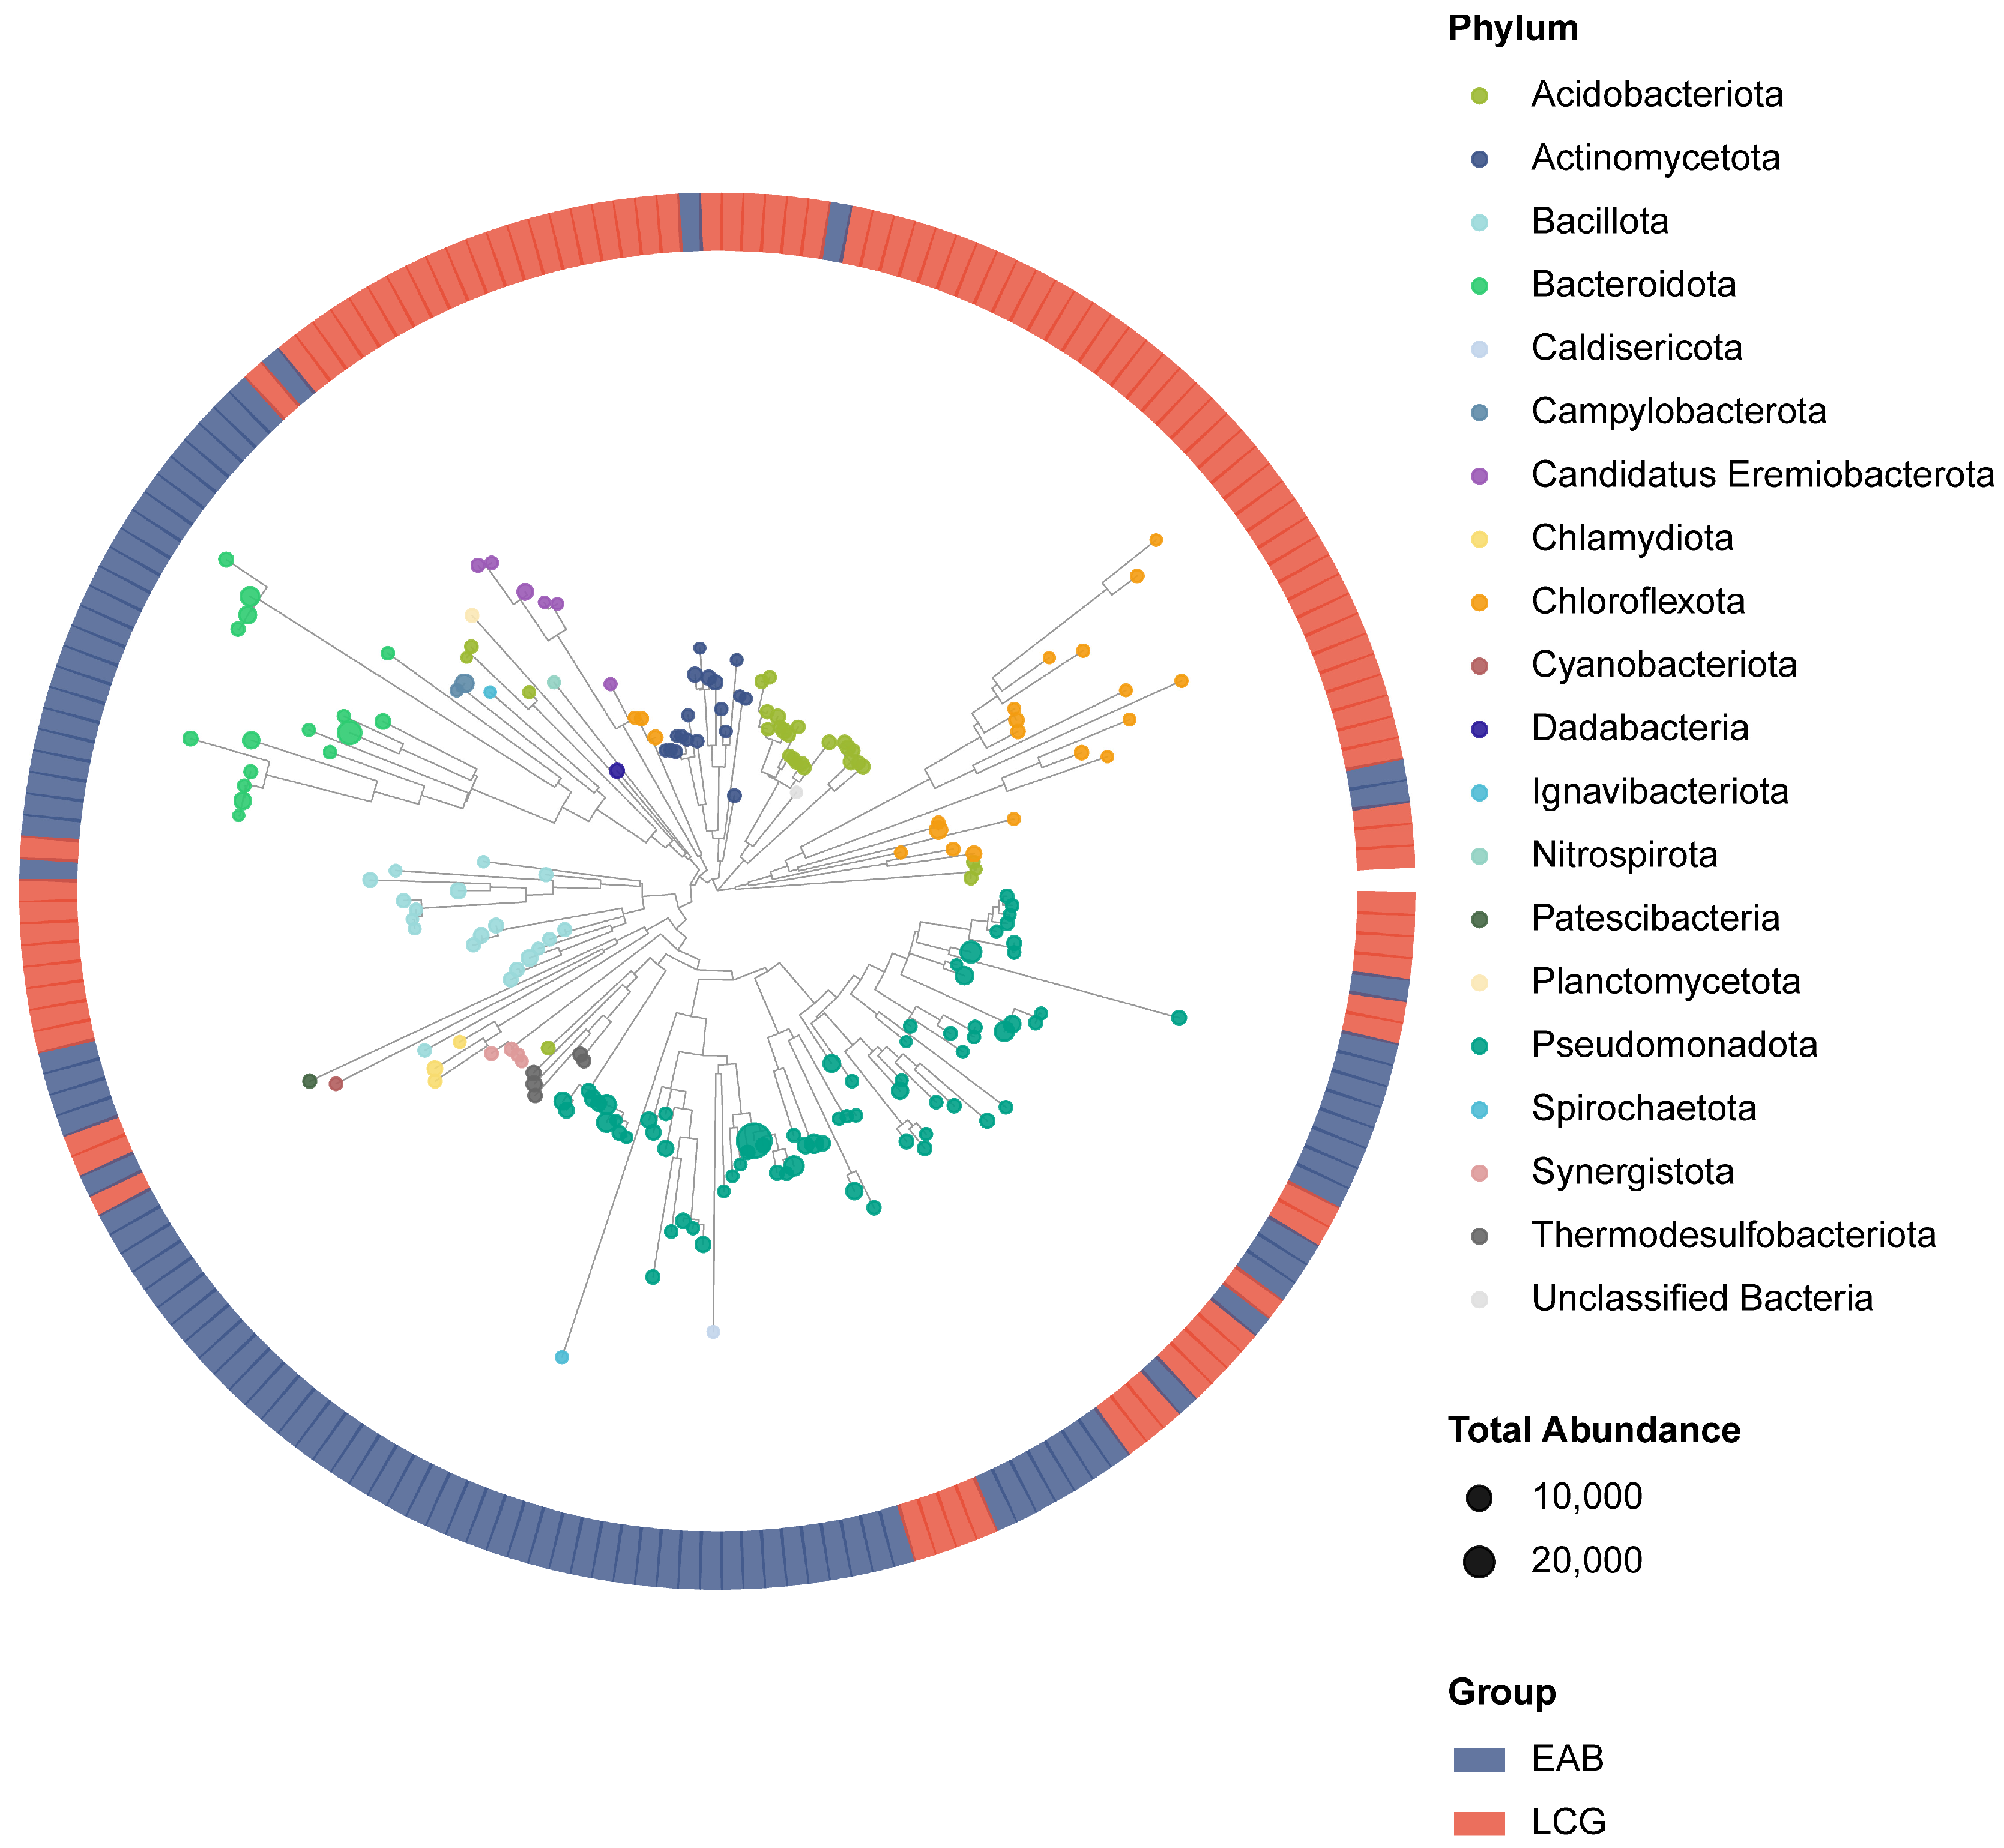
Due to the weak electrical response characteristics of groundwater nitrate contamination, traditional monitoring and remediation assessment methods are limited by low spatiotemporal resolution, high cost, and strong subjectivity. To address this issue, this study proposed an integrated technical framework combining field detection, laboratory-controlled experiments, and remediation process monitoring, aiming to explore the application potential of Electrical Resistivity Tomography (ERT) in nitrate pollution monitoring and remediation evaluation. First, ERT survey lines (L1 and L2) were deployed at a chemical-contaminated site in Luzhou, Sichuan Province, and groundwater samples were collected. Coupled with hydrochemical analysis, the feasibility of ERT for identifying nitrate plumes was verified. Second, a quantitative response model between nitrate concentration and resistivity was established through Miller box experiments, and a multi-line layout was optimized via sand tank experiments to mitigate boundary effects and improve monitoring accuracy. Finally, grouped sand tank experiments involving electroactive bacteria (EAB) and magnetite were conducted. Combined with 16S rRNA sequencing, the coupling mechanism between ERT electrical responses and biogeochemical processes was elucidated. The results showed that the low-resistivity anomaly zones identified by field ERT were accurately consistent with the high-nitrate contamination zones, and Piper diagrams confirmed that nitrate-related ions were the primary cause of the low-resistivity anomalies. The power function quantitative model established by the Miller box experiment (y = 1021.97x−0.74, R2 = 0.9589) enabled the indirect inversion of nitrate concentrations, with a small deviation between theoretical and measured values in the deep layer (16–18 m). The optimized layout of one main and three auxiliary survey lines effectively characterized the spatiotemporal migration of the contamination plume. Under high-water level conditions, the ternary system of nitrate–magnetite–EAB exhibited the strongest low-resistivity response. Microbial analysis indicated that electroactive groups (e.g., Pseudomonas and Flavobacterium) enriched in the EAB group were the core drivers of enhanced electrical conductivity. The integrated ERT monitoring technology system constructed in this study realizes the visual identification of nitrate plumes and dynamic tracking of remediation processes, providing technical support for the precise monitoring and in situ remediation of nitrate contamination in agricultural non-point sources and industrial sites.
Keywords: Electrical Resistivity Tomography; electroactive bacteria; empirical coefficient; groundwater monitoring; nitrate contamination Electrical Resistivity Tomography; electroactive bacteria; empirical coefficient; groundwater monitoring; nitrate contamination