Article

Temporal and Spatial Variation in B and Sr Isotopic Composition in the Erren River, Southwestern Taiwan


Department of Earth Sciences and Earth Dynamic System Research Center (EDSRC), National Cheng Kung University, Tainan 70101, Taiwan
*
Author to whom correspondence should be addressed.
Water 2026, 18(3), 368; https://doi.org/10.3390/w18030368
Submission received: 15 December 2025 / Revised: 26 January 2026 / Accepted: 29 January 2026 / Published: 31 January 2026
(This article belongs to the Special Issue Advances in Research on Hydrology and Water Resources)

Abstract

River water is a vital component of the hydrological cycle, sustaining ecosystems and serving as the most accessible freshwater resource for human use. Beyond elemental concentrations, isotopic tracers such as boron (δ11B) and radiogenic strontium (87Sr/86Sr) provide insights into weathering processes and anthropogenic impacts. This study examines spatial and temporal variations in the chemical composition of the Erren River to distinguish natural contributions from human-derived inputs and assess recent pollution. Samples collected from upstream to downstream were processed by micro-sublimation or column chromatography, with isotopes measured using MC-ICP-MS. Results show δ11B values from +4.8‰ to +30.4‰ (variation ~26‰) and 87Sr/86Sr ratios from 0.709679 to 0.710446. Major ion and isotopic data indicate upstream waters are dominated by silicate weathering, while downstream areas reflect seawater and salt spray influence, consistent with regional geology and hydrology. Furthermore, δ11B patterns combined with Cl/Na and NO3/B ratios suggest that tributaries in the mid-to-lower basin remain affected by anthropogenic pollution, likely linked to agricultural and urban activities. These findings highlight both natural controls and ongoing human impacts on the Erren River system.

1. Introduction

Rivers are a vital component of the water cycle and an indispensable resource for human survival and development. The chemical composition of river water reflects changes in the natural environment and human activities within a region. Beyond the concentration ratios of various elements, advancements in technology and instrumentation have enabled researchers to use isotopes as tracers in river water studies. These isotopic analyses, corroborated by elemental composition and other chemical data, help elucidate the role of rivers in the water cycle and assess the impacts of environmental changes and anthropogenic activities. Stable isotopes of hydrogen and oxygen, for example, have been widely applied to characterize hydrological processes and ecological patterns across global river systems [1,2,3]. The mechanisms governing riverine chemical compositions have been extensively investigated, as rivers serve as the primary conduits transporting dissolved elements and particulate matter from continental crusts to the oceans. To quantify both physical and chemical erosion rates across diverse continental settings, numerous major river systems worldwide have been examined [4,5,6,7,8,9]. The composition of dissolved constituents in river waters is largely controlled by a combination of factors, including atmospheric precipitation, weathering of bedrock, water–sediment interactions within catchments, anthropogenic inputs, biological activity, and prevailing redox conditions [5,6,10,11,12,13,14,15,16,17,18,19,20,21]. Climatic variability further exerts a critical influence on the extent of chemical weathering. For instance, West et al. [22], in a case study of the Himalaya, demonstrated that even under conditions of high physical erosion, chemical weathering remains constrained unless climatic conditions promote reaction kinetics. As one of the major rivers in southwestern Taiwan, the Erren River serves as a crucial water source for sustaining the surrounding ecosystem. During Taiwan’s industrial development period, improper wastewater discharge led to severe contamination by heavy metals and dioxins, resulting in widespread biological mortality. After decades of remediation efforts and attention from both governmental and civil organizations, the Erren River has gradually regained vitality. However, recent reports still highlight issues such as the accumulation of scrap metal and wastewater discharge from livestock operations along its banks. Therefore, understanding and continuously monitoring the current state of the Erren River remains a critical issue for local ecological health and sustainable development.
Boron (B), with atomic number 5, is a relatively light metalloid element. Its stable isotopes are 10B and 11B, with natural abundances of 19.9% and 80.1%, respectively [23,24]. In previous literature, boron isotope values are commonly expressed as δ11B (‰). Currently, the internationally recognized standard is the SRM-951 boric acid solid (H3BO3, 10B/11B = 4.044 ± 0.003, derived from Searles Lake borax) provided by the National Institute of Standards and Technology (NIST) [25]. The δ11B of a sample is calculated by comparing its 11B/10B ratio to that of the standard using the following equation:
δ 11 B   ( ,   SRM - 951 ) = B 11 / B 10 Sample B 11 / B 10 Standard 1 × 1000
In nature, boron typically forms B–O bonds and exists as borate species, primarily in two structural forms: the tetrahedral B(OH)4 and the planar trigonal B(OH)3. The relative proportions of these two borate species depend on factors such as pH, concentration, temperature, and salinity [26,27,28,29]. Changes in environmental conditions can shift the equilibrium between these species, governed by the following reaction:
B(OH)3 + H2O ←→ B(OH)4 + H+
From an isotopic perspective, 10B preferentially associates with the B(OH)4 species, whereas 11B is more likely to be found in the B(OH)3 form. The structural form of borate in different substances is also influenced by the chemical composition of the host material. Consequently, boron isotope ratios often differ between substances, especially between liquid and solid phases. The isotopic exchange reaction between these species is represented as:
10B(OH)3 + 11B(OH)4 ←→ 11B(OH)3 + 10B(OH)4
In natural environments, δ11B values typically range from −30‰ to +60‰ [30], with a total variation exceeding 80‰. However, the range of δ11B values varies across different substances. Notably, seawater exhibits a relatively stable δ11B value (IAPSO, δ11B = +39.64 ± 0.42‰). In addition, boron concentrations differ among various materials, making boron isotopes a useful tracer in geochemical and environmental studies. The primary natural inputs to river water—seawater and rock weathering—exhibit δ11B differences of approximately 40‰ [30,31]. Although some anthropogenic sources may have δ11B values similar to seawater, their elemental ratios (e.g., Cl/Na+, NO3/B, Cl/B) differ from those of seawater or rock-derived inputs [32,33]. Therefore, boron isotopes can be used to trace the sources influencing the chemical composition of the Erren River.
Strontium (Sr), with atomic number 38, occurs naturally in four stable isotopes: 84Sr, 86Sr, 87Sr, and 88Sr, with respective abundances of 0.56%, 9.86%, 7.00%, and 82.58% [29]. Among these, only 87Sr has a radiogenic origin. It is produced through the β-decay of 87Rb (rubidium-87), which occurs naturally in the environment. The half-life of this decay process is approximately 48.8 billion years [34]. Compared with boron, the mass difference between 87Sr and 86Sr is small (approximately 1.16%), due to its relatively large atomic mass. As a result, isotopic fractionation during chemical reactions or physical processes is minimal. Furthermore, the similar abundances of these two isotopes make the 87Sr/88Sr ratio a reliable tracer. This ratio is widely applied in fields such as stratigraphy, archeology, hydrology, and food provenance analysis. Sr isotopes have been utilized in watershed studies to trace fluid pathways and weathering reactions [35,36,37,38,39,40]. Silicate rocks with high Rb/Sr ratios typically show a wider range of 87Sr/86Sr values (approximately 0.705 to 0.735), which are generally higher than those found in carbonates (approximately 0.707 to 0.709). In addition to seawater (87Sr/86Sr = 0.709192), the geological composition of the river basin also influences the 87Sr/86Sr ratio in river water. Supplementary elemental ratios such as Ca/Na and Sr/Na from seawater, silicates, and carbonates can further aid in distinguishing the sources affecting the river’s strontium isotopic composition [41,42].
In addition to commonly studied pollution indicators in the Erren River—such as heavy metals, dioxins, and ecological restoration—previous research has also employed stable isotope analyses to further investigate the impacts of natural environmental conditions and anthropogenic pollution. Liu et al. [32] explored the relationship between boron isotopes and human-induced pollution in the Erren River. The authors reported that in 2010, the middle and lower reaches of the river were influenced by agricultural activities (fertilizers and pig manure), characterized by low δ11B values (+7‰ to +17‰) and elevated Cl/Na and Cl/B ratios. In contrast, industrial effluents typically exhibit δ11B values ranging from −0.27‰ to +2.84‰, which differ significantly from the δ11B values observed in the river water (+12.2‰ to +38.6‰), suggesting that industrial pollution had a limited impact on the river.
Additionally, the upstream catchment area of the Erren River includes the Gutingkeng Formation, which is dominated by mudstone and features mud volcano structures. Fluids from these mud volcanoes are known to have high boron concentrations and elevated δ11B values [43,44]. If substantial inputs from these mud volcano sources enter the river, they could significantly influence both boron concentrations and isotopic composition in the river water.
Given the history of severe heavy metal contamination in the Erren River, heavy metal isotopes have also been used to trace pollution sources. Previous studies examined correlations among concentrations of heavy metals (Cu, Cd, Cr, Pb) in various industrial wastewater discharges. These analyses revealed that elevated zinc concentrations in the downstream section of the river primarily originated from anthropogenic sources, specifically electroplating (EP) and metal surface treatment (MST) industries. By examining the relationship between zinc concentrations and δ66Zn values, researchers identified natural weathering and these two industrial sources as the main contributors to zinc levels in the river, helping to explain the mixing behavior of zinc in the aquatic system [45].
This study conducted systematic sampling of the Erren River from upstream to downstream, accounting for geological variability and differences in anthropogenic activities at each site to evaluate the spatial heterogeneity of river water chemistry. The objective was to evaluate spatial heterogeneity in river water chemistry and to establish a framework for interpreting long-term environmental change. To strengthen this analysis, we integrated findings from two key prior investigations: the boron isotope study of the Erren River conducted by Liu et al. [32] in 2010, and the strontium isotope ratios and geochemical dataset collected and analyzed by Chung [46] during 2000–2001. Together, these works provide a valuable preliminary foundation for understanding δ11B and 87Sr/86Sr signatures, as well as concentration ratios of major and trace elements derived from diverse natural and anthropogenic sources. In Chung’s study, river water samples were collected at nineteen sites across the Erren River basin during both the wet season (May to November 2000) and the dry season (December 2000 to April 2001), yielding a dataset that captures seasonal contrasts in hydrochemistry. In contrast, Liu’s investigation focused on samples obtained along the main channel and five tributaries during the wet season in August 2010, with an emphasis on boron isotopes and their utility in tracing seawater intrusion and anthropogenic inputs. Although the number of samples collected in these earlier studies differs from that of the present work, all sampling campaigns employed bridge-based collection, thereby ensuring consistency in sampling locations. This methodological alignment enhances the comparability of datasets across two decades and provides a robust basis for examining spatiotemporal variations in river water chemistry. By situating the present dataset within the context of these earlier studies, we aim to evaluate temporal shifts in hydrochemical characteristics under the combined effects of geological substrates, monsoon-driven hydrology, and ongoing anthropogenic pressures.

2. Study Area

2.1. Erren River System

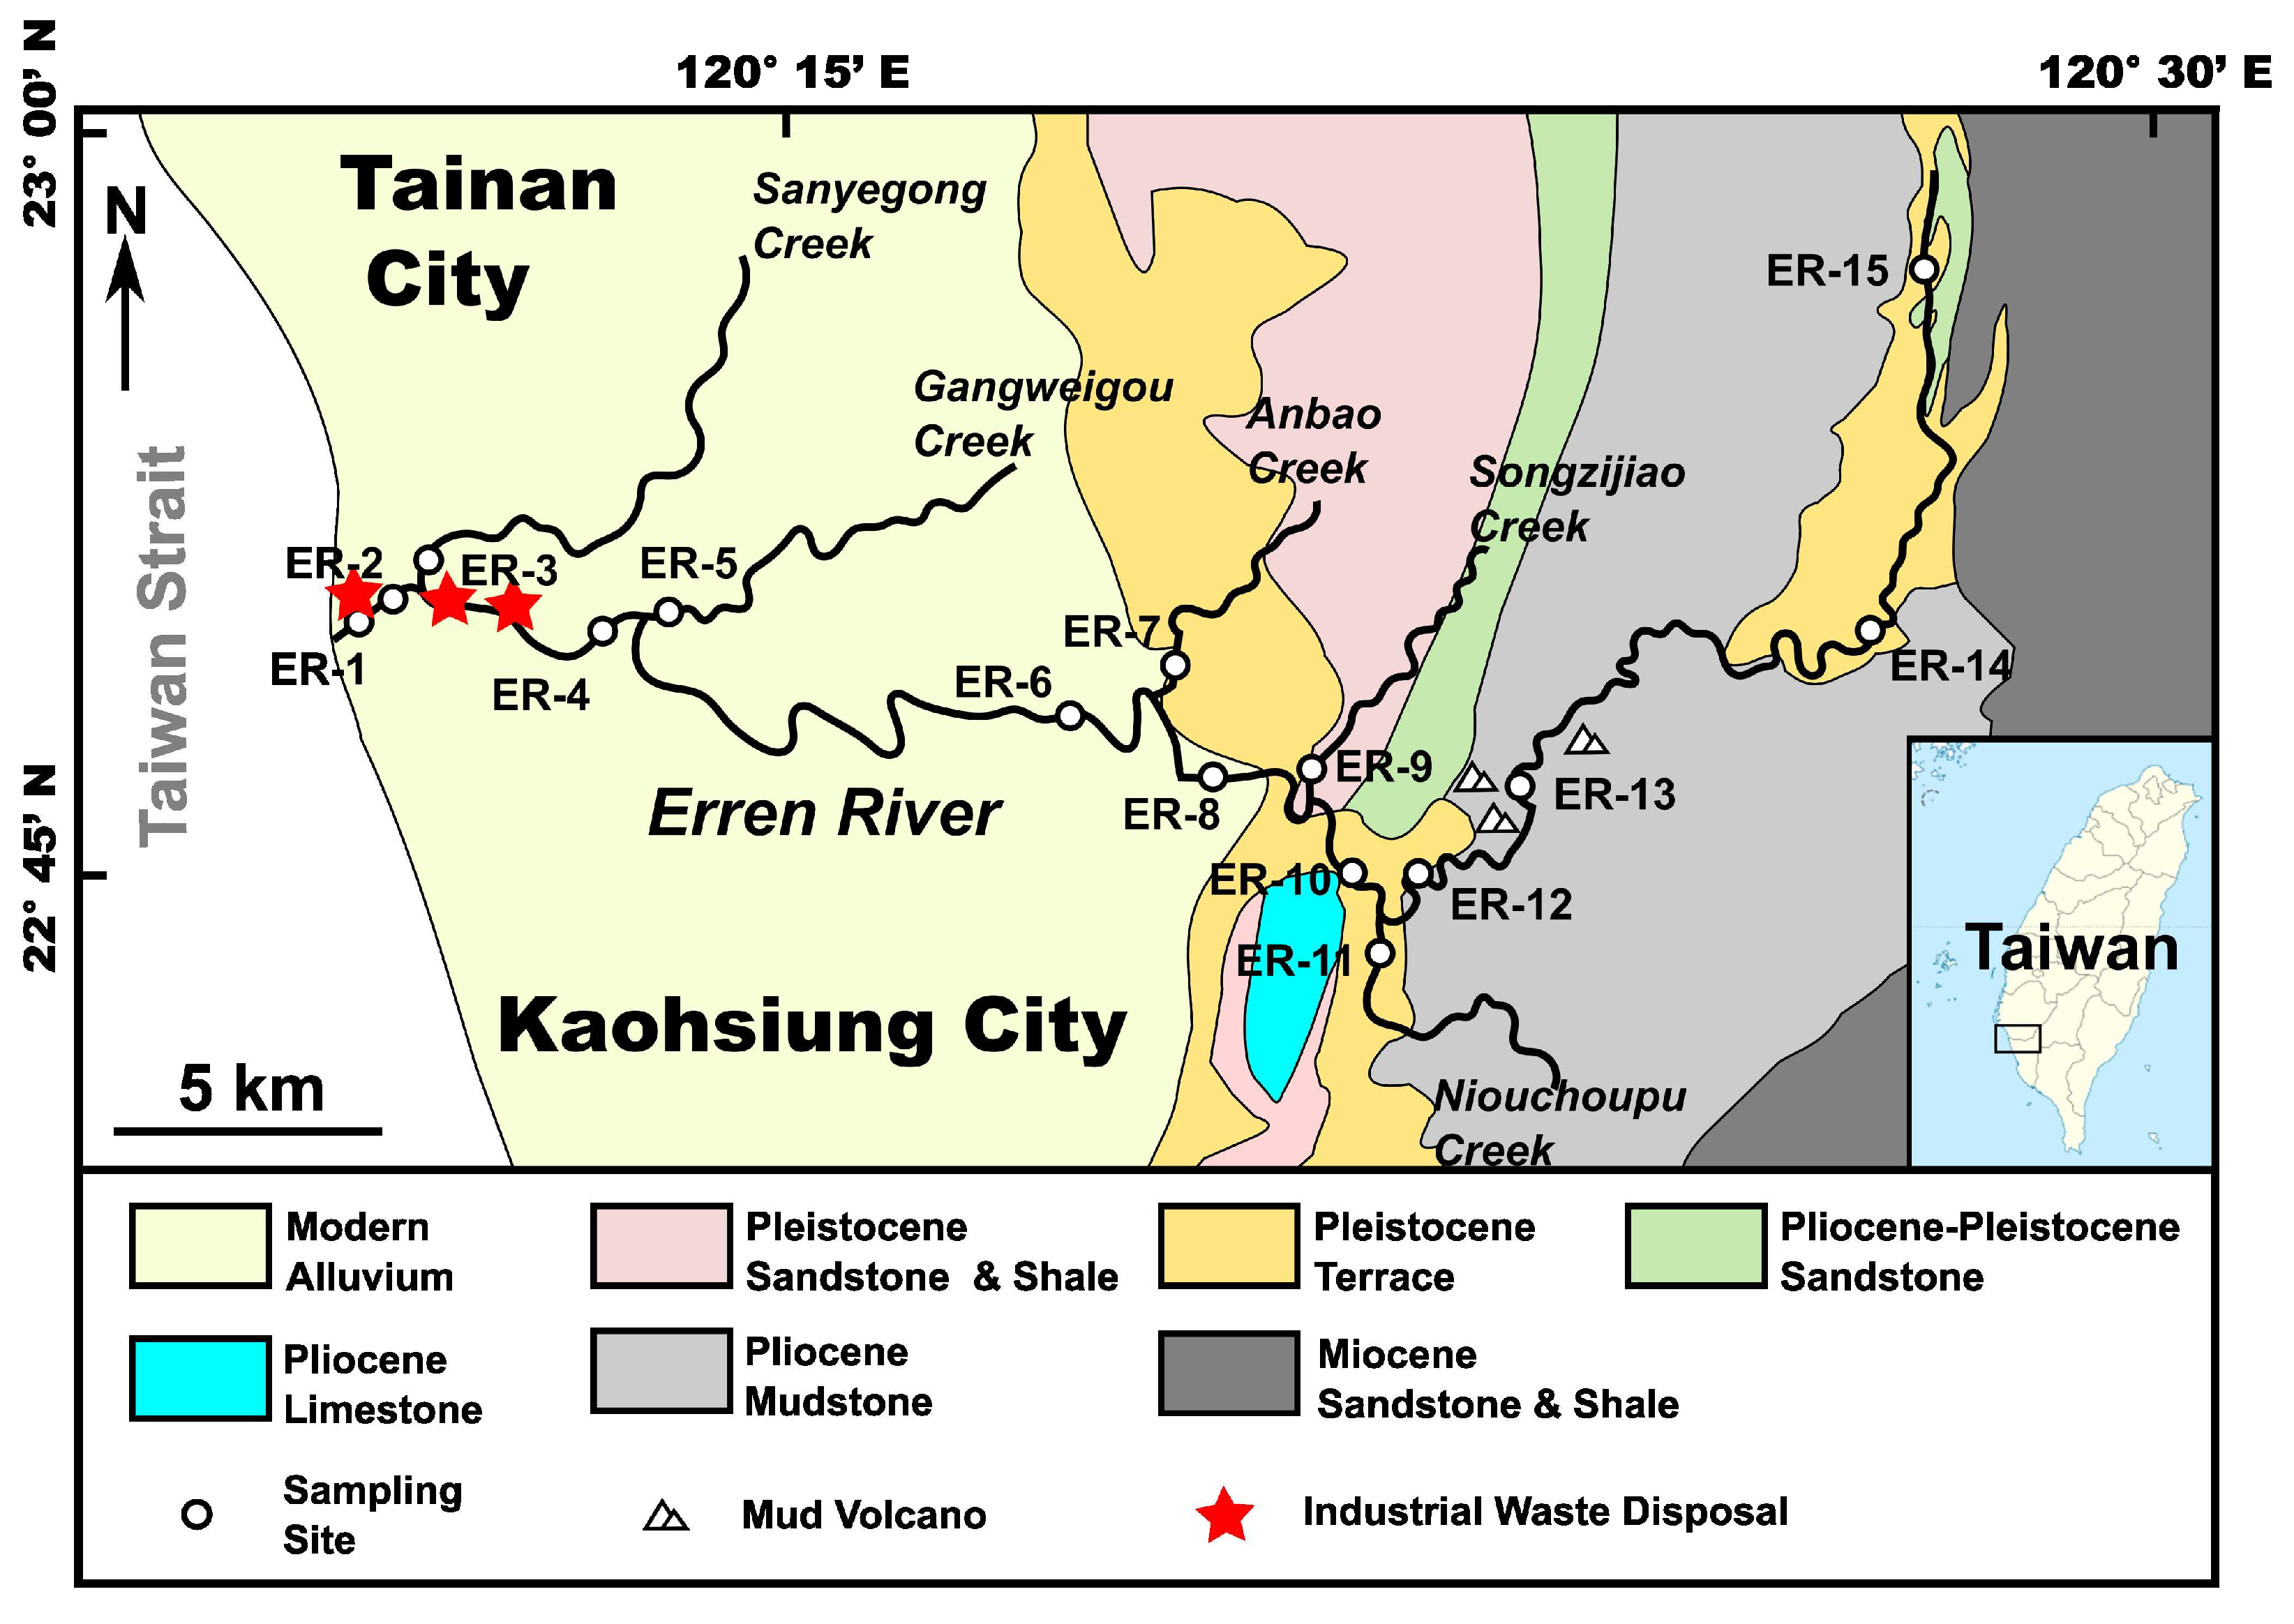
The Erren River is one of the major rivers in southern Taiwan and serves as a boundary between Tainan City and Kaohsiung City. It originates from Neimen District, Kaohsiung City, at an elevation of approximately 460 m, and flows westward from the Alishan mountain range into the Taiwan Strait. Its main watershed spans areas in Tainan City and Kaohsiung City. The basin covers an area of approximately 339.20 square kilometers, with a river length of about 61.20 km. The Erren River basin encompasses geological formations ranging in age from the Late Miocene to the Quaternary period. The main lithologies and their distributions in the ER basin are presented in Figure 1. In stratigraphic succession, the principal units include the Gutingkeng Formation, the Chiting Formation, Pleistocene terrace deposits, and Holocene alluvial deposits. The dominant lithologies are sandstone, mudstone, and shale, with minor occurrences of limestone. The Gutingkeng Formation, a thick mudstone unit of Late Miocene to Early Pleistocene age, is extensively exposed in southwestern Taiwan and is notable for its badland landscapes and associated mud volcanoes. Overlying the Gutingkeng, the Chiting Formation consists primarily of alternating sandstone and mudstone beds deposited in coastal–fluvial environments during the Pliocene–Pleistocene. The Pleistocene terrace deposits of southern Taiwan comprise ancient riverine and coastal sediments uplifted by tectonic activity during the Quaternary glacial cycles, forming step-like geomorphic surfaces that preserve records of past environments, sea-level fluctuations, and neotectonic movements. These terrace deposits are not primary carbonate units but may contain reworked lithic fragments depending on provenance. Carbonate material occurs predominantly within mapped limestone formations or carbonate-cemented sandstones, whereas mudstone and shale are generally siliciclastic with variable carbonate cement. The Dagangshan Limestone, in contrast, represents a true carbonate unit and is distinguished accordingly [47].
In the upstream region, the primary formations are the Gutingkeng Formation and terrace deposits, composed mainly of sandstone and mudstone. This region also hosts several well-known mud volcanoes in southern Taiwan, such as Moon World, Dagunshui, and Xiaogunshui [48,49,50]. The midstream section is characterized by the Chiting Formation, alluvial deposits, and terrace deposits, with exposures of the Dagangshan limestone. The dominant lithologies here include sandstone, mudstone, shale, and some limestone. In the downstream region, the main geological unit is alluvial deposits, primarily composed of sandstone and mudstone [47]. Previous studies using whole-rock X-ray diffraction analysis identified the major minerals in the Erren River basin as quartz, albite, orthoclase, and various clay minerals [46]. Calcite, a carbonate mineral, was also detected in the midstream section, consistent with the stratigraphic distribution shown on geological maps. Further analysis using oriented clay mineral X-ray diffraction revealed that clay minerals in the upstream region are primarily composed of illite and chlorite, with minor amounts of montmorillonite and kaolinite [46]. These findings indicate spatial variability in the geological composition across the Erren River basin, which may influence the ionic composition of the river water and affect boron and strontium isotope signatures.

2.2. Factors Influencing the Chemical Composition of the Erren River

Geology, seawater, and meteoric water are common factors that influence the chemical composition of rivers. Rainwater plays a critical role in shaping the chemical composition of river waters through both natural and anthropogenic pathways. The chemistry of precipitation reflects interactions between atmospheric gases, aerosols, and terrestrial sources, and when deposited into river systems, these inputs alter ionic balances and geochemical signatures. Naturally, rainwater contributes major ions such as Ca2+, Na+, Mg2+, K+, HCO3, SO42−, and Cl, derived from marine spray, soil dust, and volcanic emissions [51,52]. These inputs can dilute or enrich river solutes depending on rainfall intensity and catchment lithology. Anthropogenic activities further modify rainwater chemistry, introducing acidic components (H+, NO3, SO42−) from industrial emissions and fossil fuel combustion, which lower pH and enhance chemical weathering of rocks and soils [53]. Such acid deposition accelerates the mobilization of trace metals (e.g., Pb, Zn, Cu) and nutrients (e.g., N, P), thereby influencing river water quality and ecological health. Seawater intrusion and mixing exert a profound influence on river water chemistry, particularly in estuarine and coastal environments. The addition of marine-derived ions such as Na+, Cl, Mg2+, and SO42− elevates salinity and alters the ionic balance of river waters, often resulting in increased alkalinity and hardness [52].
In Taiwan, which lies within a seismically active zone, geothermal activity or other geological processes may also affect river chemistry. The main geological formations of the Erren River basin consist of sandstone, mudstone, shale, and some limestone. These rocks can influence river water through weathering processes and may also cause isotopic fractionation through water–rock interactions. Silicate weathering contributes major cations (Na, K, Ca, Mg) and dissolved silica, while simultaneously consuming atmospheric CO2 through bicarbonate formation, thereby acting as a long-term carbon sink. In contrast, carbonate weathering is characterized by rapid dissolution of Ca2+, Mg2+, and HCO3, exerting a dominant influence on river alkalinity and hardness but primarily recycling carbon rather than sequestering it [54,55]. Isotopic tracers further distinguish these processes: silicate-derived strontium exhibits radiogenic 87Sr/86Sr ratios, whereas carbonate-derived strontium reflects lower, marine-like values [8]. In addition, boron isotopes (δ11B) have emerged as powerful tracers of weathering regimes, with carbonate dissolution typically yielding higher δ11B values, while silicate weathering input can lower δ11B in river waters [56,57]. Collectively, these geochemical and isotopic fingerprints enable robust source attribution in mixed catchments and underscore the fundamental role of weathering processes in regulating river chemistry and global biogeochemical cycles. In addition, the well-known mud volcano structures of southwestern Taiwan are also present within the Erren River basin, mainly distributed in the middle to upper reaches (northeast of Niouchoupu Creek), along the structural zone of the Kutingkeng Fault. Mud volcanoes develop along convergent plate margins where thick sequences of fine-grained sediments are rapidly deposited and subjected to tectonic compression [58,59]. With increasing burial depth, pore fluids become overpressured as a result of compaction [60], hydrocarbon generation [61], and clay mineral dehydration (e.g., smectite-to-illite transformation; [62]). These processes reduce sediment strength and drive buoyant fluids upward through faults, fractures, or anticline axes. The discharge of mud volcano fluids exerts a pronounced influence on surface water chemistry. Elemental enrichment is commonly observed for boron, barium, lithium, and strontium, reflecting deep water–rock interaction and clay dehydration [44]. In contrast, chloride, magnesium, and sulfate concentrations are often depleted relative to seawater due to diagenetic alteration and dilution [63]. Isotopic signatures further highlight these processes: δ18O enrichment and δD depletion indicate progressive water–rock interaction, while strontium isotope ratios (87Sr/86Sr, δ88Sr) trace fluid sources and distinguish sedimentary from igneous contributions [48]. Carbonate precipitation during fluid ascent can additionally modify Sr isotope ratios and alkalinity, thereby influencing downstream hydrochemistry.
Seasonal hydrological variability exerts a fundamental control on riverine weathering processes and associated carbon fluxes. During the wet season, high-discharge conditions dilute conservative solutes but simultaneously enhance sulfuric-acid-mediated carbonate weathering through pyrite oxidation and the mobilization of fresh mineral surfaces [64,65]. In contrast, the dry season promotes longer water–rock interaction times, favoring carbonate-weathering pathways that act as a net CO2 sink [54]. Importantly, wet-season flow can shift weathering dynamics toward a net CO2 source, driven by enhanced sulfuric acid contributions and complex mixing processes [64]. These contrasting seasonal regimes underscore the dynamic interplay between hydrology, geochemical reactions, and carbon cycling in fluvial systems.
Beyond natural environmental factors such as meteoric water, seawater, and rock weathering, historical records and previous studies indicate that the Erren River has also been affected by anthropogenic pollution sources, including industrial wastewater, electronic waste accumulation, livestock wastewater, agricultural fertilizers, and domestic sewage [66]. During the 1970s and 1980s, scrap metal recycling became one of the major industries near the Erren River. This industry extracted precious metals (such as gold, palladium, platinum, and silver) from waste materials using acid leaching, or recovered copper from discarded wires and cables through incineration. The waste acid, wastewater, and sludge containing toxic substances and heavy metals (including lead, copper, and zinc) were directly discharged into the Erren River. Additionally, the incineration of plastic insulation from wires and cables produced ash with high concentrations of dioxins. In 1993, the government officially banned the import of scrap metals, intensified crackdowns on illegal operations along the Erren River, and launched a series of investigations and remediation efforts—including the construction of wastewater treatment plants and water purification facilities. However, river pollution was not fully resolved. Large quantities of scrap metal still piled along the riverbanks and channels. These materials, through weathering and runoff, continued to contaminate the soil and water, with the most severely affected area being the Sanyegong Creek tributary. The government allocated additional funding and manpower to remove and transport scrap metal waste, and by 2018, the extent of pollution in the Erren River basin had significantly improved. Nevertheless, aged scrap metal piles still remain along the riverbanks, with hazardous waste (including dioxins and heavy metals) totaling 7627 metric tons, and an additional 18,733 metric tons of soil mixed with printed circuit board waste.
Beyond pollution from the scrap metal industry, the Erren River is also impacted by agricultural fertilization, livestock manure (primarily from pigs and chickens, but also cattle, sheep, ducks, and geese), industrial wastewater (from metal surface treatment, electroplating, and leather processing), and domestic sewage [66]. In 2013, the government began promoting a sewage pipeline system to reduce industrial and domestic wastewater discharge into the river. However, the construction of the sanitary sewer system has not yet been completed, and to this day, household wastewater continues to be discharged directly into the river. In 2016, ecological wetland projects were initiated to mitigate domestic sewage and restore the river’s ecosystem. Wetlands function as natural biofilters, where physical sedimentation, microbial activity, and plant uptake collectively degrade organic matter, remove nutrients such as nitrogen and phosphorus, and immobilize heavy metals and other contaminants [67,68]. These processes reduce pollutant loads and improve water quality, while simultaneously enhancing biodiversity and ecological resilience. However, despite their recognized potential, there has not yet been a systematic evaluation of the effectiveness of these wetland projects, and comprehensive studies are still needed to quantify their long-term performance and sustainability. To this day, the government continues to monitor water quality to protect the Erren River’s environment. Civil organizations and schools also remain actively engaged, dedicating time, effort, and resources to ecological restoration and promoting environmental awareness through various activities. Field surveys, reports, and satellite imagery show that agriculture and livestock activities are mainly concentrated in the middle to upper reaches, while industrial facilities and electronic waste deposits are located from the middle to lower reaches. Urban domestic sewage is primarily discharged in the lower reaches.

2.3. Sampling Location

In July 2021, river water samples were collected from the Erren River, following the sampling locations referenced in Liu et al. [32]. A total of 15 samples were taken sequentially from upstream to downstream (Figure 1). The sample codes range from ER-15 at the uppermost site to ER-1 near the estuary. Among them, 10 samples were collected along the main stream, while 5 samples were taken from five tributaries of the Erren River (Niouchoupu Creek, Songzijiao Creek, Anbao Creek, Gangweigou Creek, and Sanyegong Creek), coded as ER-11, ER-9, ER-7, ER-5, and ER-3, respectively. Table 1 presents site-specific information, including coordinates, elevation, and discharge, for the Erren River sampling points.

3. Materials and Methods

3.1. Sampling and Sample Preparation

In this study, river water samples were collected from the Erren River in July 2021. Because the river discharge of the Erren River decreased significantly during the dry season in 2021, some upstream reaches even dried up completely, which rendered representative sampling impractical at certain localities. In addition, logistical and project constraints limited our fieldwork to the wet-season campaign. Consequently, dry-season data are absent in this study, direct comparison with earlier dry-season datasets cannot be performed, and a full annual interpretation is not possible. Our results therefore represent wet-season conditions only, and future investigations should incorporate dry-season sampling to provide a more comprehensive understanding of river water quality dynamics. A total of 15 samples were taken sequentially from upstream to downstream (Figure 1). The 2021 estuarine sample was collected during low tide, coinciding with ~40.0 mm of rainfall recorded at the Kutingkeng meteorological station (Central Weather Bureau, Taiwan). River water sampling followed general protocols guidelines for rivers, lakes, and reservoirs [70]. Samples were collected by lowering pre-cleaned bottles from the center of bridges using a rope, thereby obtaining water from the midstream flow. At each site, bottles were first rinsed with river water before sample collection. In situ measurements of water temperature and pH were conducted using a handheld pH meter (Hanna Instruments, Woonsocket, RI, USA, Hanna HI9829 multi-parameter meter). Two types of polypropylene (PP) bottles were prepared in the laboratory: 1 L bottles rinsed with ultrapure water for anion analysis, and 2 L bottles acid-washed for other chemical and isotopic analyses. Concentrated double-distilled nitric acid was added to the acid washed bottle to adjust the sample pH to <2, ensuring stability prior to instrumental analysis. After collection, river water samples were immediately returned to the laboratory and filtered using 0.45 μm membrane filters with a vacuum filtration system. The filtrates were stored at 4 °C in a refrigerated cabinet until subsequent analyses.

3.2. Chemical Analysis

All chemical experiments in this study were conducted inside a class-1000 cleanroom and on class-10 workbenches in the Isotope Geochemistry Laboratory (IGL) at National Cheng Kung University. All vials and consumables required for the experiment were pre-cleaned with acid to minimize the risk of contamination. Acids used throughout the experimental procedures were purified using Sub-Boiling Distillation Systems (Savillex, Eden Prairie, MN, USA, DST-1000).
The analysis of major anion concentrations is performed using ion chromatography (IC). Additionally, the other concentrations of major elements and trace elements are determined using inductively coupled plasma optical emission spectrometry (ICP-OES, Thermo Fisher Scientific, Waltham, MA, USA, iCAP 6500) and inductively coupled plasma quadrupole mass spectrometry (ICP-QMS, Thermo Fisher Scientific, Waltham, MA, USA, iCAP Q), respectively.

3.3. Boron and Strontium Isotope Analysis

Prior to boron isotope analysis, boron was extracted from river water samples using the micro-sublimation method (adapted from [71]), which takes advantage of the high volatility and relatively low sublimation point of boron, allowing boron to be preferentially separated from sodium- and calcium-rich solutions during the heating of liquid samples [72]. This method, offering the added benefits of a low procedural B blank (~8 pg) and straightforward operation, is applicable to seawater, river water, and biogenic calcium carbonate samples. However, excessively high sodium concentrations may lead to the formation of sodium borate, thereby affecting the results. Therefore, the sodium concentration in the solution should be maintained within the range of 100–5000 mg L−1 and the calcium concentration within 500–8000 mg L−1 during micro-sublimation [71].
Samples for strontium isotope measurement require strontium purification through column chromatography. The procedure was adapted and modified from Liu et al. [73]. Prior to column chromatography, the sample containing approximately 450 ng of Sr was evaporated to dryness and subsequently dissolved in 0.8 mL of 3 M HNO3 (Fluka, Buchs, Switzerland) for storage. A polypropylene column with an inner diameter of 5–5.5 mm was packed with 0.25 mL of Eichrom SrSPEC resin (Eichrom, Lisle, IL, USA). The resin was sequentially conditioned with 5 mL of 6 M HCl, 10 mL of Milli-Q water, 5 mL of 3 M HNO3, and 10 mL of Milli-Q water (18.3 MΩ cm, MilliQ, Molsheim, France). To equilibrate the resin with the sample matrix, 1 mL of 3 M HNO3 was added prior to sample loading. The sample, pre-dissolved in 0.8 mL of 3 M HNO3, was then introduced into the column. Matrix elements including Na, K, Mg, Ca, Ba, and Rb were removed using 6 mL of 3 M HNO3 as the eluent. Finally, Sr was eluted with 5 mL of Milli-Q water, collected, and evaporated to dryness on a hotplate. The residue was re-dissolved in an appropriate volume of 0.3 N HNO3 to yield a Sr concentration of approximately 150 ppb, suitable for subsequent strontium isotope analysis
Both boron isotopes (δ11B) and strontium isotopes (87Sr/86Sr) are measured using Thermo-Fisher Scientific (Waltham, MA, USA) NEPTUNE MC-ICP-MS at the Department of Earth Sciences, National Cheng Kung University. The instrument was equipped with a Cyclone-Scott tandem-type spray chamber, a Ni sampler cone and an X-skimmer Ni cone. The sample solutions were aspirated into the Ar plasma by a pneumatic nebulizer with a flow rate of 100 µL·min−1, and an autosampler was used to change the sample, wash solution, etc. Boron isotope ratios of samples are measured in the standard-sample bracketing approach to calibrate the mass bias of the instrument and correct for fluctuations in the instrument’s performance by following the sequence blank–standard–sample–standard–sample–standard–blank, with 0.1 M HNO3 used as a blank as well as wash solution. To further reduce the blank contribution, the averaged background intensity determined using a 0.3 N HNO3 blank was subtracted before processing the data using SSB approach. Each strontium isotope analysis consisted of baseline measurement and forty-eight (6 blocks/8 cycles) 2.097s of integration. Moreover, 83Kr and 85Rb were determined to evaluate and correct the 86Kr contribution to 86Sr (83Kr/86Kr = 0.664740) and 87Rb to 87Sr (87Rb/85Rb = 0.385617). These isobaric interferences were corrected by exponential fractionation law. The measured 87Sr/86Sr ratio was normalized to measured 88Sr/86Sr ratios of 8.37521 for instrumental mass fractionation correction. Performances of δ11B and 87Sr/86Sr measurements were monitored by duplicated analysis of SRM 951 and SRM 987, respectively. The averaged δ11B value of SRM 951 was +0.08 ± 0.5‰ (2SD). SRM-987 has an average 87Sr/86Sr ratio of 0.710224 ± 0.000016 (2SD, n = 5).

4. Results and Discussion

4.1. Major Element Concentrations in Erren River Water

The results of major components of collected Erren River samples are presented in Table 2. The concentration ranges of the Cl, NO3, and SO42− in river water were 0.09–9.82 mM, 0.03–0.13 mM, and 0.15–1.25 mM, respectively. In addition, PO43− concentration is often used as an indicator of biological activity or fertilizer input to rivers; in this study, measurable concentrations were detected only at ER-7 and ER-5, with values of 10.72 μM and 7.96 μM, respectively. The major elements Na, K, Mg, and Ca typically occur in river water as cations, with concentration ranges of 0.29–8.64 mM, 0.08–0.33 mM, 0.17–1.58 mM, and 0.37–1.03 mM, respectively. The measured major anions (Cl, NO3, SO42−) and major cations (Na, K, Mg, Ca) represent the dominant ionic species in river water. Based on the principle of electroneutrality, charge balance was calculated by assuming that the remaining anion was HCO3, thereby yielding the [HCO3] concentration in river water. The charge balance equation is as follows:
H C O 3 = 2 × M g 2 + + 2 × C a 2 + + N a + + K + 2 × S O 4 2 C l
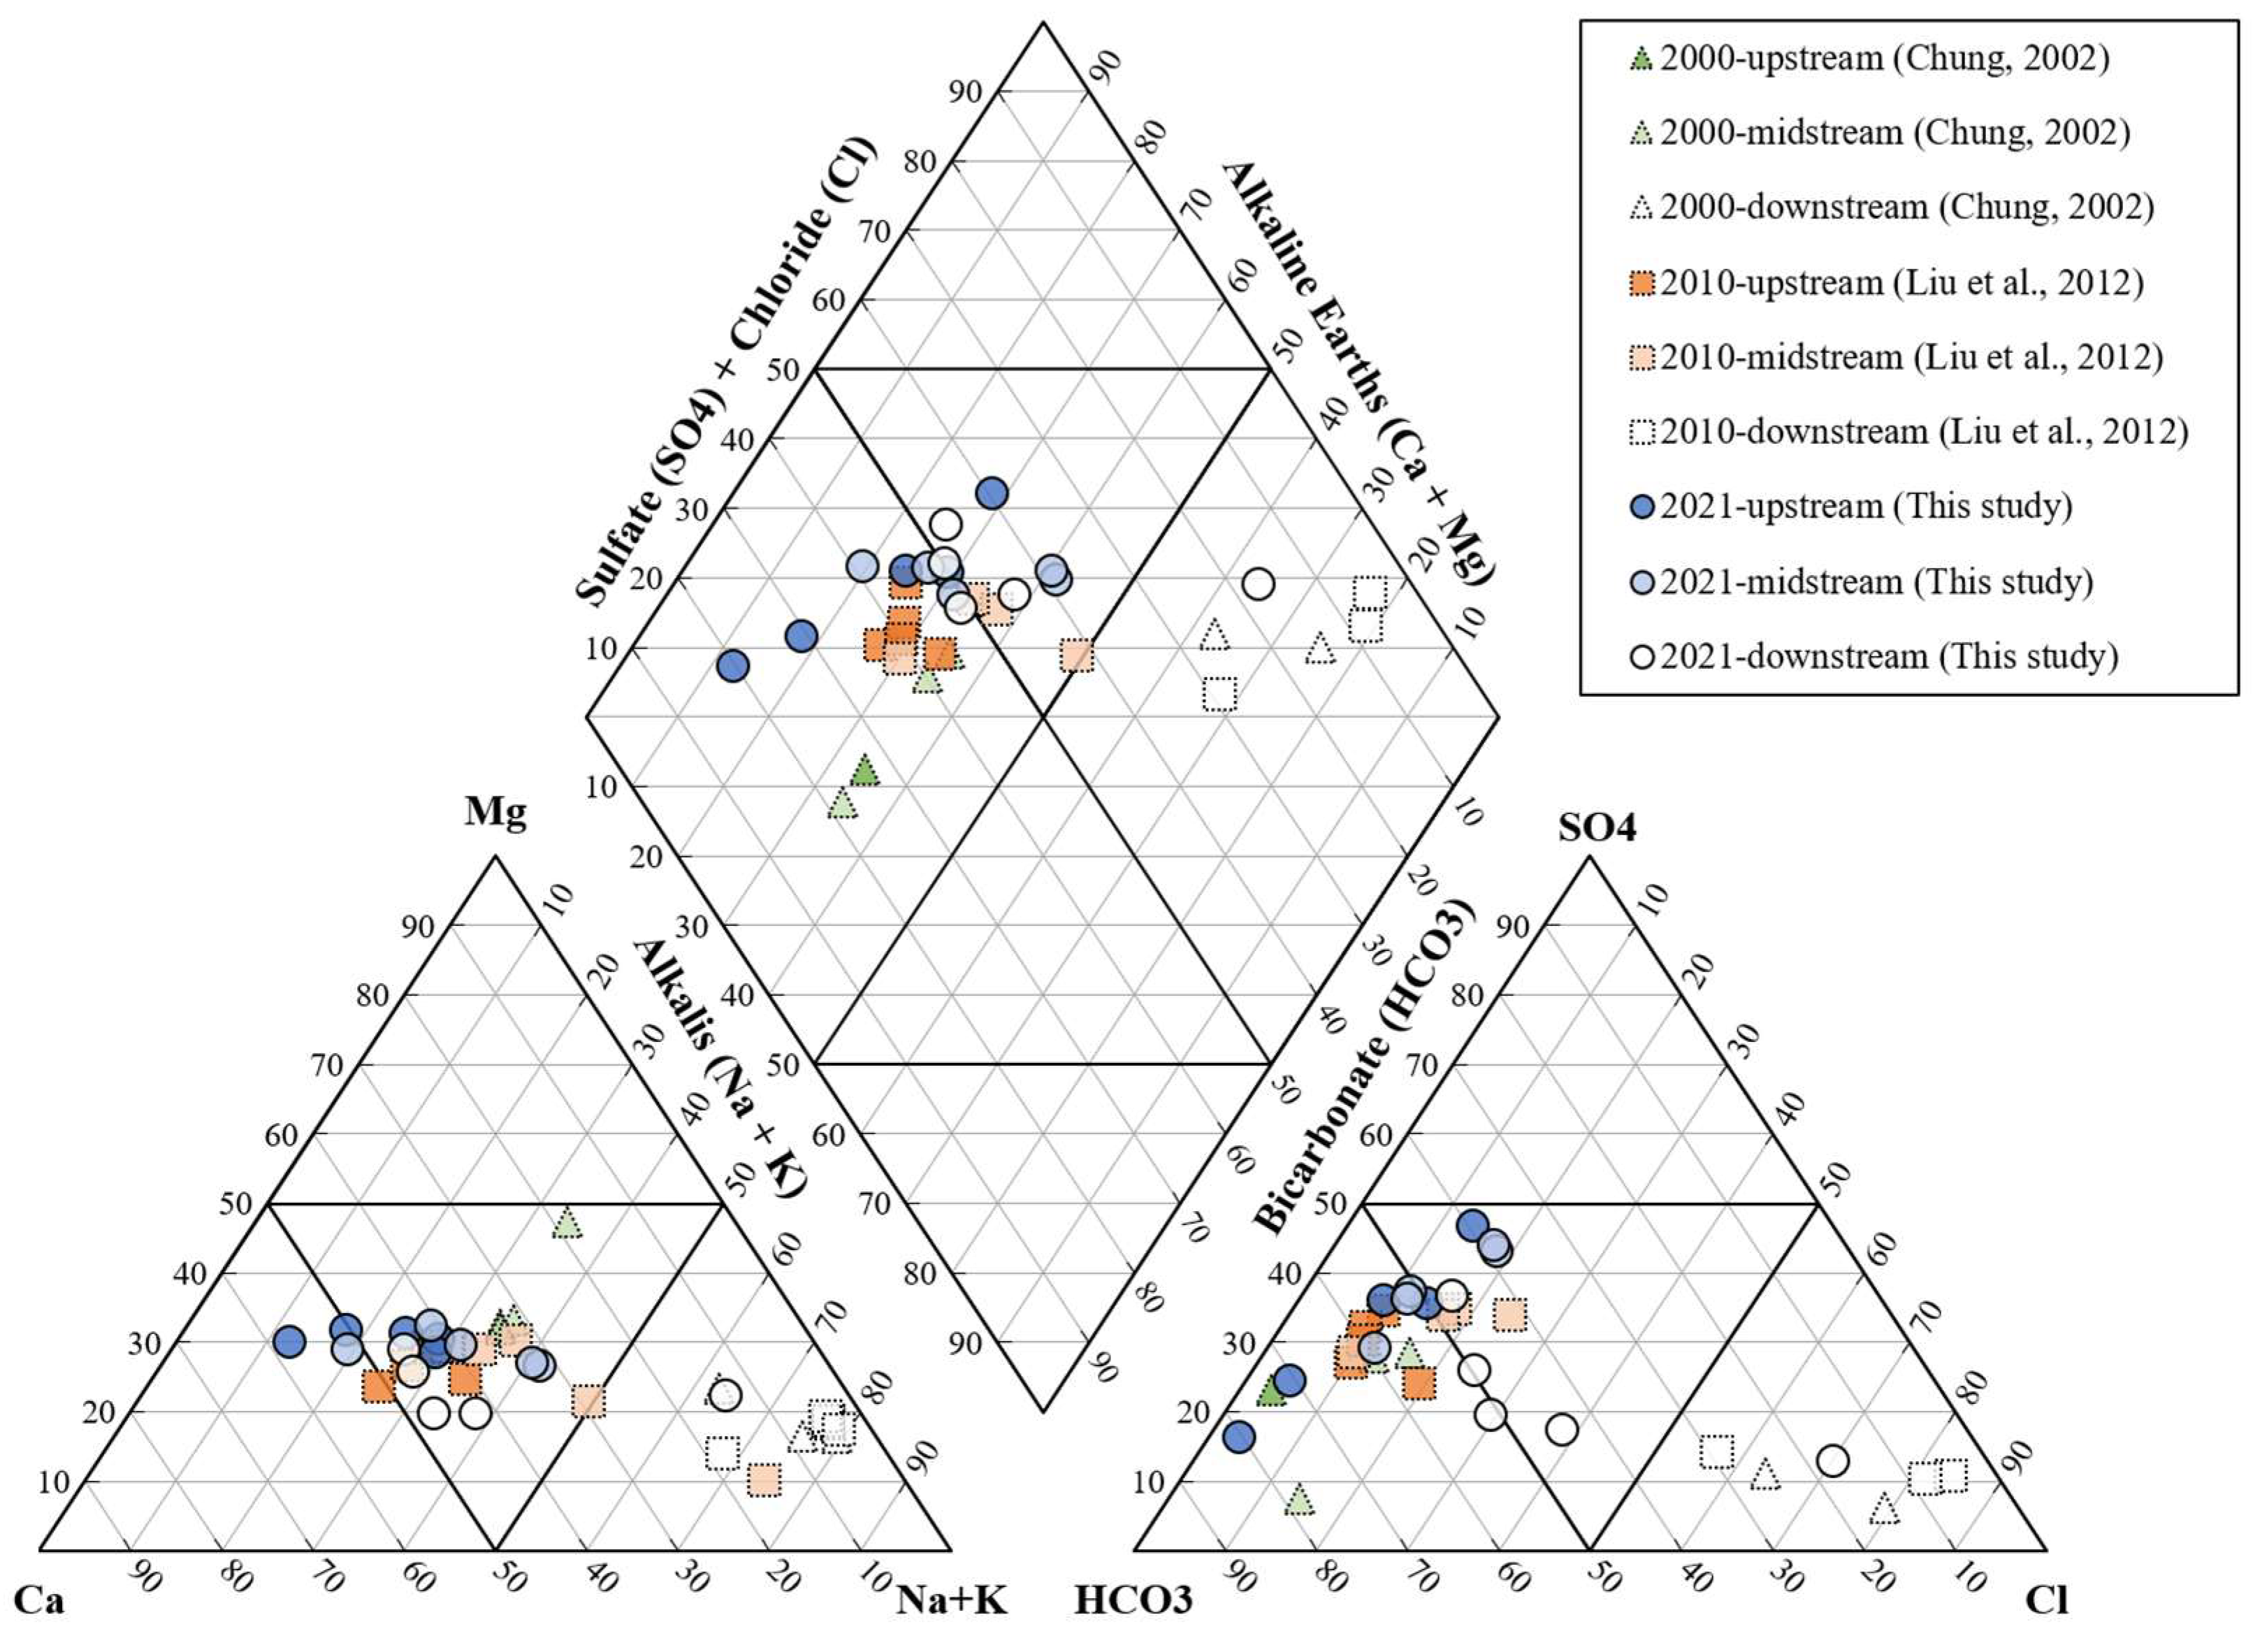
A Piper diagram (Figure 2) was constructed based on the results of this study and previous studies to illustrate the compositional proportions of the major anions and cations in the Erren River water (Table 2). Most of the samples collected in 2021 exhibit distribution patterns similar to those collected in 2000 Most samples in this study exhibit patterns similar to those reported in 2000 [46] and 2010 [32]. Samples from the middle to upper reaches are predominantly of the Ca–Mg–HCO3 type, indicating a stronger influence from rock weathering. In contrast, samples collected near the estuary are mainly of the Na–Cl–SO4 type, reflecting the impact of sea spray enriched in Na and Cl or direct mixing with seawater.
The Cl/Na ratios of samples collected closer to the estuary approach that of seawater (Cl/Na = 1.17). This indicates that the proportion of sources influenced by sea spray or direct seawater mixing increases with proximity to the ocean. Liu et al. [32] observed stronger downstream seawater influence, while our single-site downstream sample shows lower influence, despite nominally identical sites. The higher seawater contribution in the 2012 downstream samples can be attributed to tidal conditions, as sampling coincided with high tide, which enhanced marine intrusion into the river channel. In contrast, most samples from the middle to upper reaches exhibit Cl/Na ratios less than 1, with values decreasing further upstream and deviating from the seawater dilution line. This suggests that, relative to Cl contributions primarily derived from seawater or precipitation, the proportion of Na input is elevated, likely due to silicate weathering or anthropogenic contributions [74].

4.2. Contributions of Seawater and Weathering to River Chemistry

The elemental ratios Ca/Na, Mg/Na, and Sr/Na in river water are primarily controlled by rock weathering, in addition to inputs from seawater and meteoric water [54,74]. Consequently, the chemical composition of river water varies with basin geology. Literature values indicate that silicate weathering yields average ratios of Ca/Na = 0.35 ± 0.15, Mg/Na = 0.24 ± 0.12, and Sr/Na = 3 ± 1 × 10⁻³, whereas carbonate weathering produces much higher values (Ca/Na ≈ 50, Mg/Na ≈ 10, Sr/Na ≈ 35–40 × 10−3). Seawater also contributes to river chemistry, with IAPSO seawater ratios of Ca/Na = 0.02, Mg/Na = 0.11, and Sr/Na = 0.19 × 10⁻³. Meteoric water exhibits wide variability (Ca/Na ≈ 0.01–0.15, Mg/Na ≈ 0.01–0.14, Sr/Na ≈ 0.03–22.5 × 10⁻³; [75]). Seasonal meteoric water data (April–September) show ratios (Ca/Na = 0.02–0.15, Mg/Na = 0.10–0.14, Sr/Na = 0.16–0.46 × 10⁻³) closely resembling seawater, and thus seawater ratios are adopted here to represent combined seawater/salt spray and meteoric inputs.
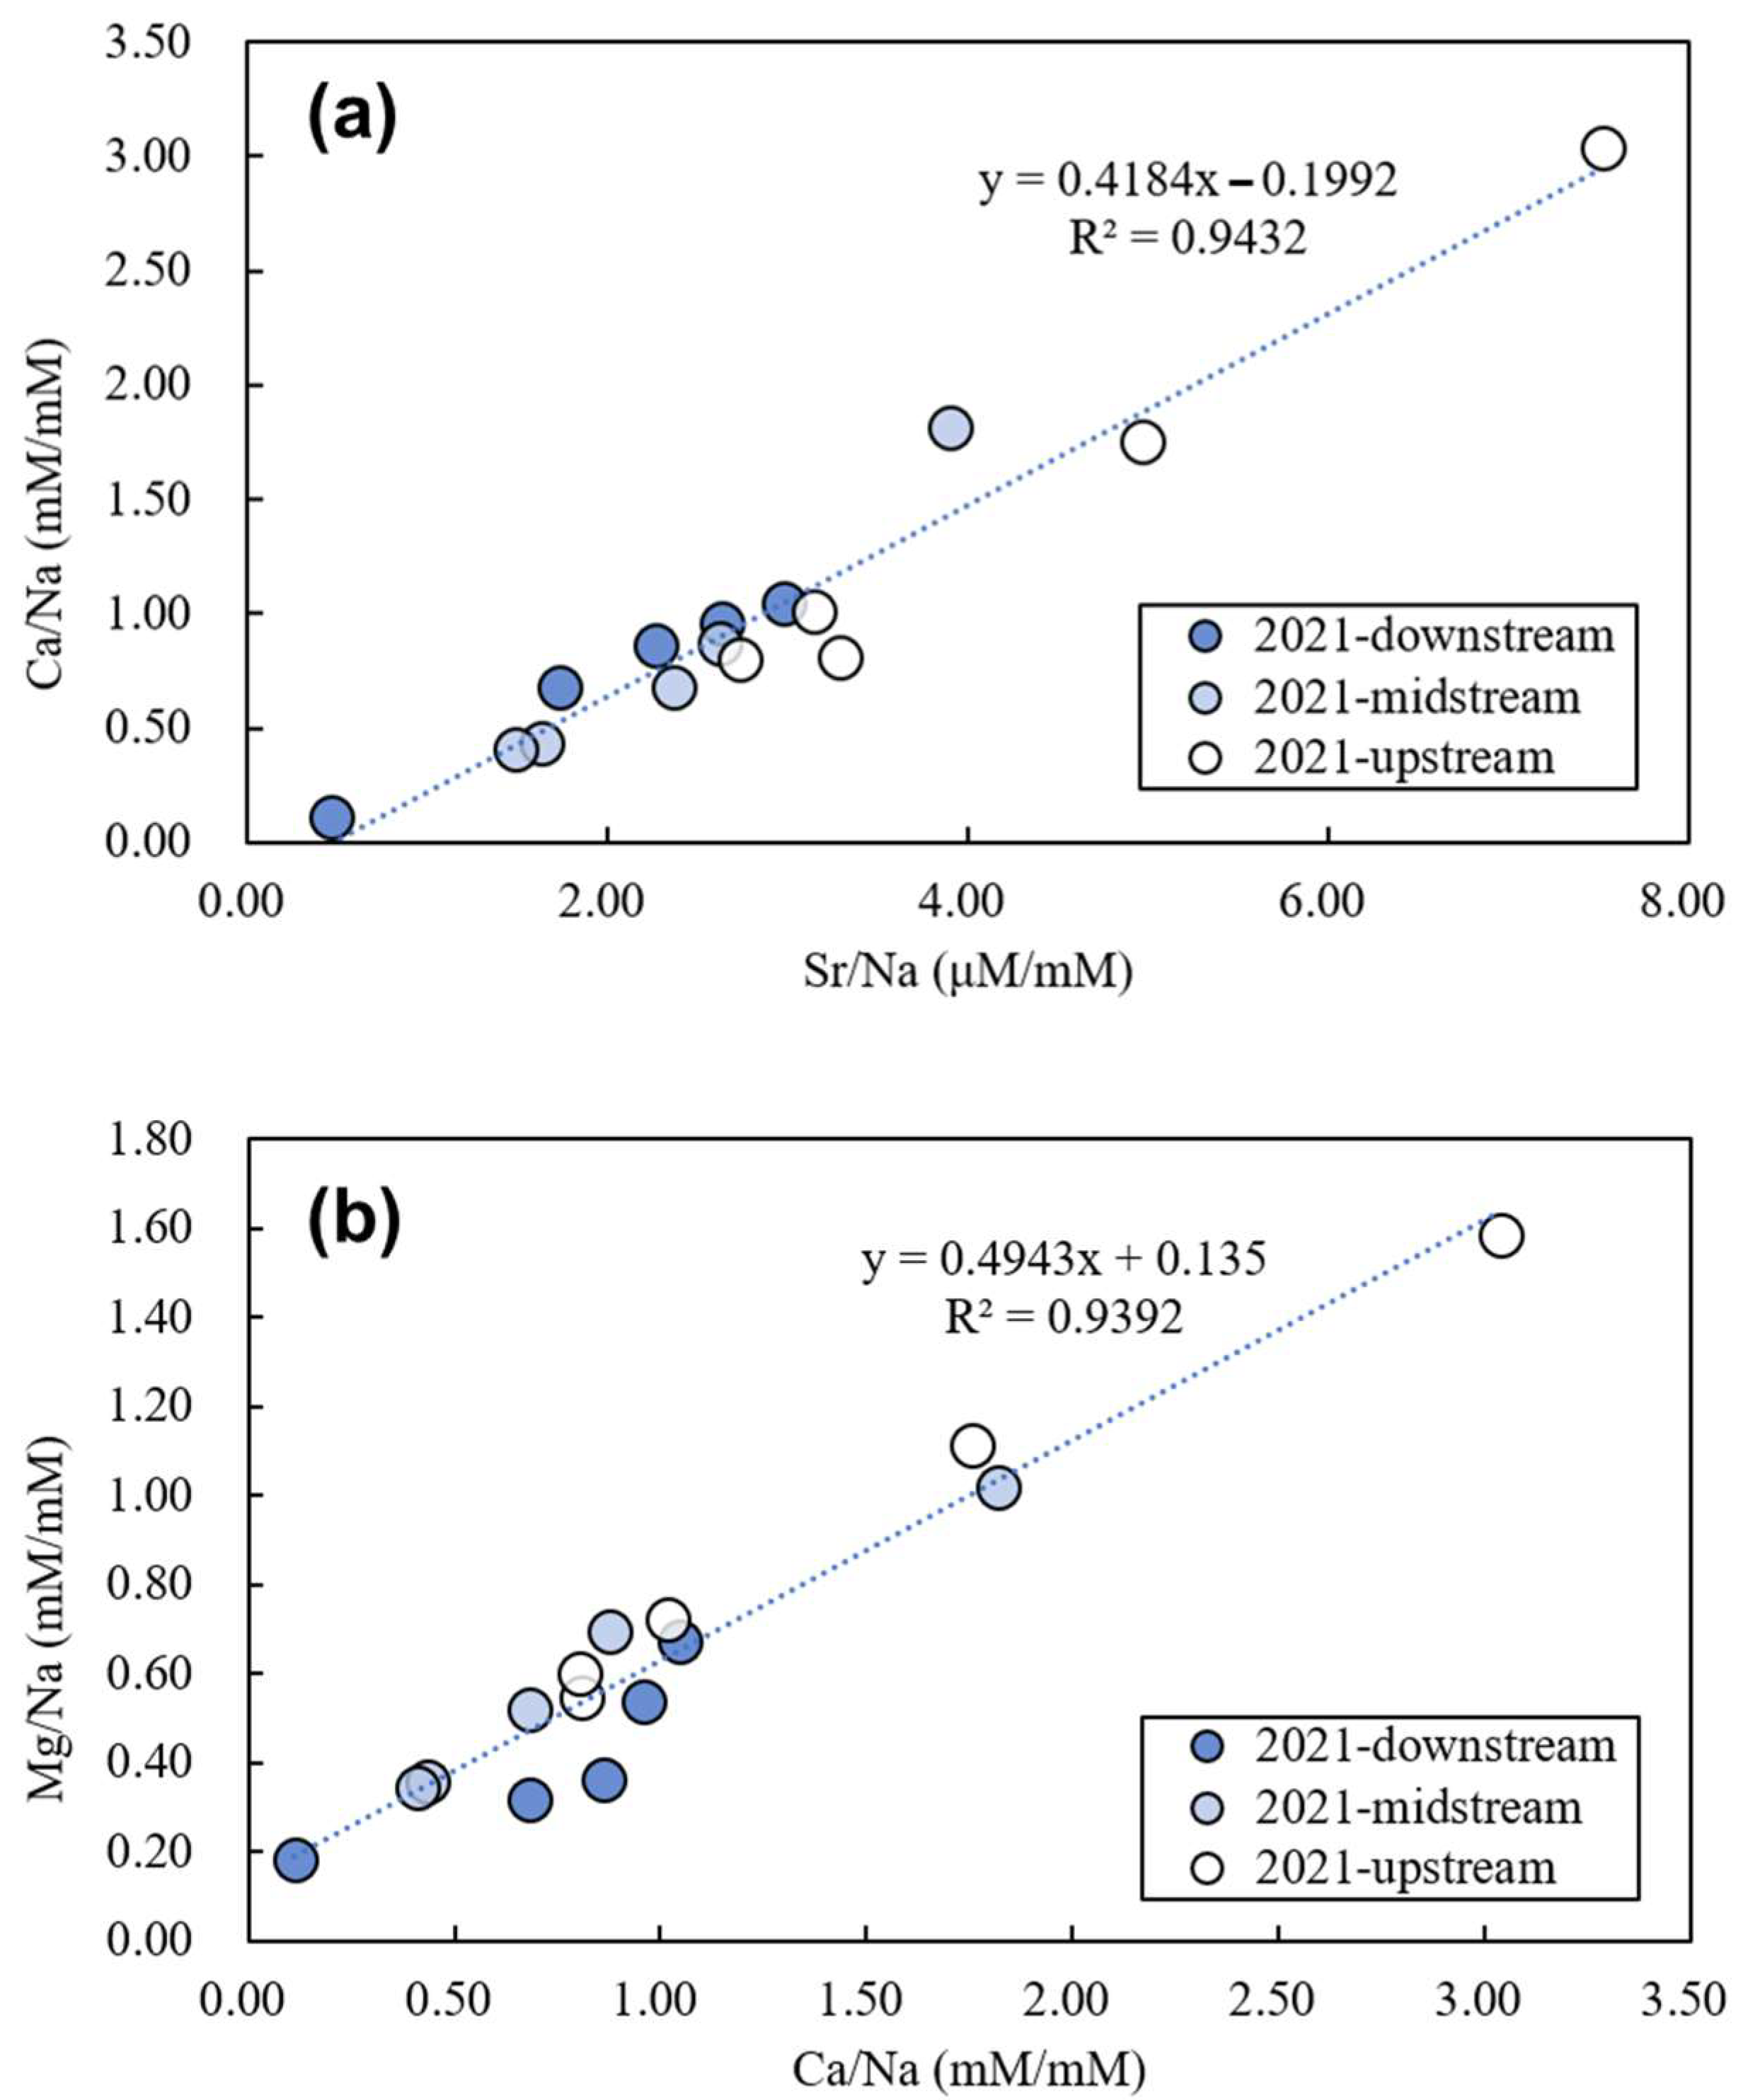
The Erren River water samples collected in 2021 exhibited Ca/Na ratios of 0.11–3.04, Mg/Na of 0.18–1.59, and Sr/Na of 0.46–7.52 × 10⁻³. Minimum values for all three ratios occurred at ER-1, while maximum values were observed at ER-15. Plots of Ca/Na versus Sr/Na (Figure 3a) and Ca/Na versus Mg/Na (Figure 3b) revealed strong linear correlations (R2 = 0.9432 and 0.9392, respectively), indicating that the river’s chemical composition is predominantly governed by silicate and carbonate weathering. This interpretation is consistent with the regional geological map (Figure 1), although contributions from seawater and meteoric water to Ca/Na, Mg/Na, and Sr/Na cannot be excluded.
In silicate-dominated catchments, the higher solubility of Na relative to Ca typically results in river water Ca/Na ratios lower than those of silicate rocks. Because carbonate minerals weather more rapidly than silicates [54], upstream waters in geologically uniform basins often exhibit elevated Ca/Na, Mg/Na, and Sr/Na due to preferential carbonate dissolution. Downstream, increasing contributions from silicate weathering reduce these ratios. In addition, seawater, salt spray, and meteoric water (Ca/Na = 0.02; Mg/Na = 0.11) exert stronger influence in lower reaches, further lowering Ca/Na, Mg/Na, and Sr/Na.
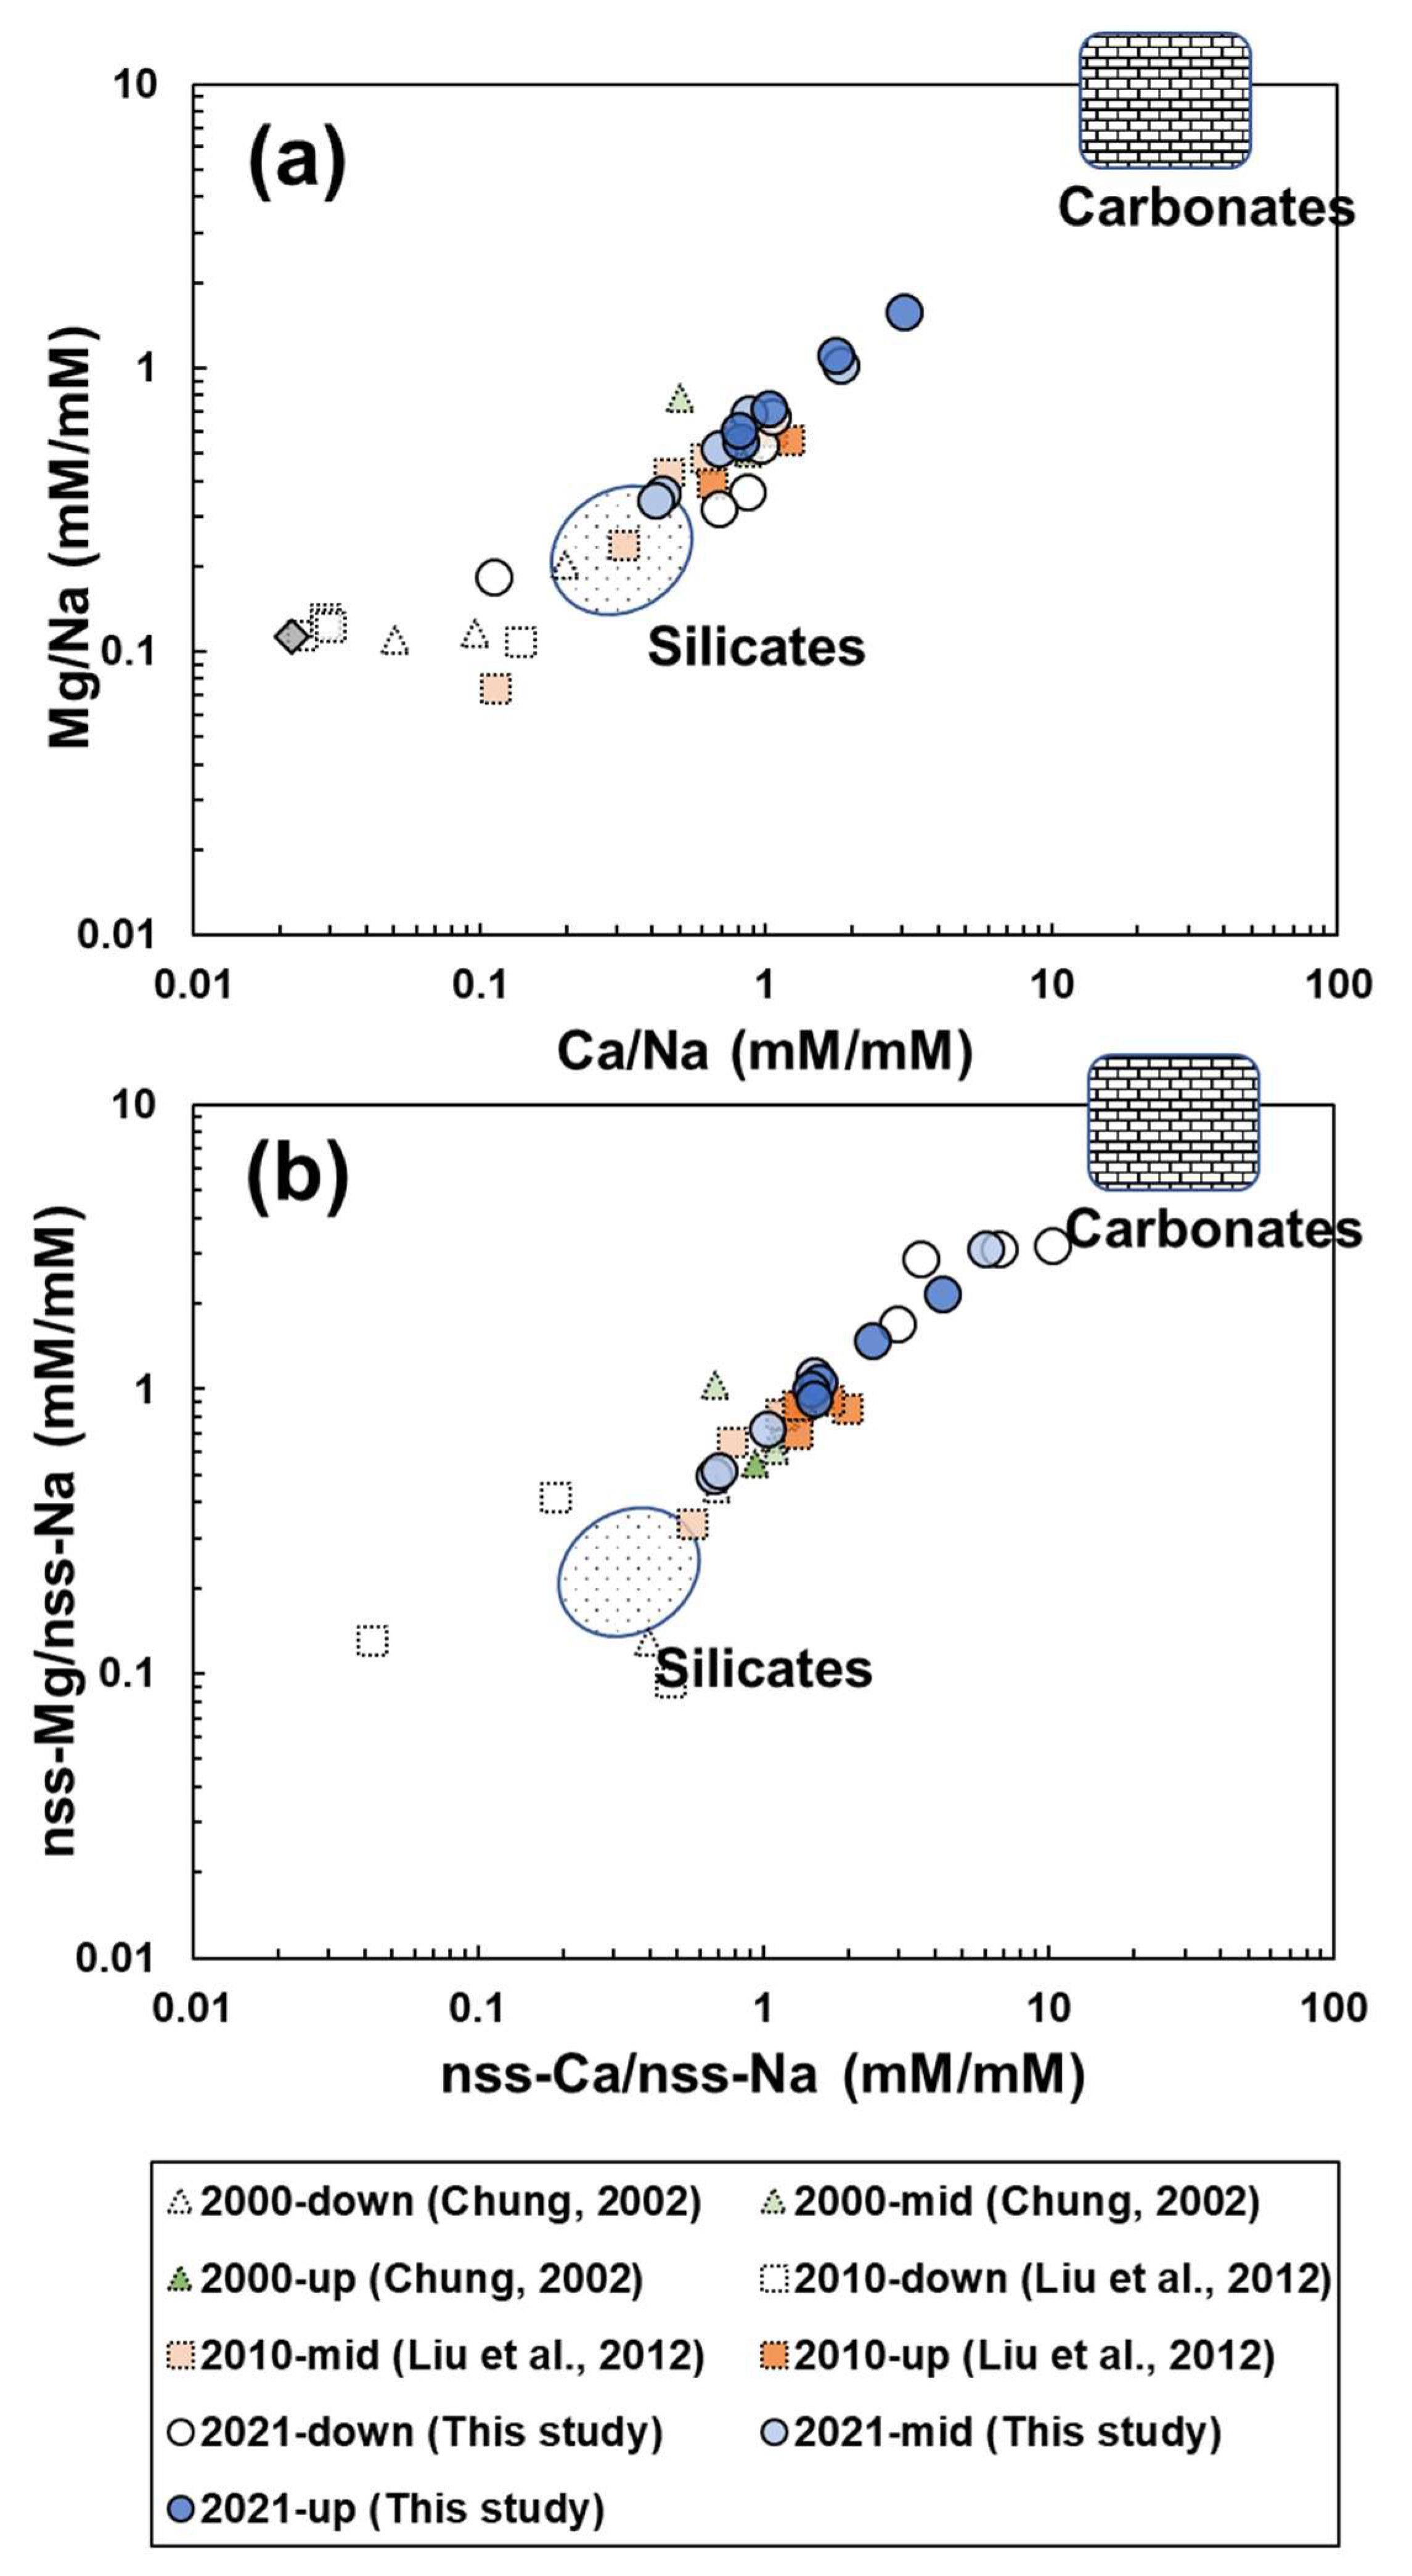
Comparative Ca/Na–Mg/Na plots of the Erren River from 2000, 2012, and 2021 (Figure 4a) demonstrate that the river’s chemical composition remains predominantly controlled by silicate weathering. Upstream waters show higher carbonate weathering contributions, whereas downstream waters reflect stronger inputs from silicate weathering combined with seawater/salt spray and meteoric sources.
Since silicate and carbonate rocks are not enriched in Cl and evaporite deposits are absent in the Erren River basin, chloride in river water is attributed to seawater/salt spray or meteoric inputs influenced by marine aerosol evaporation (rich in NaCl and MgSO4). In this study, meteoric water is assumed to exhibit the same Na/Cl, Mg/Cl, and Ca/Cl ratios as seawater. Based on the molar concentrations of each element relative to Cl, seawater reference ratios (IAPSO: Na/Cl = 8.58 × 10⁻¹, Mg/Cl = 9.72 × 10⁻², Ca/Cl = 1.88 × 10⁻²) were used to calculate non-sea-salt (nss) contributions according to [nss-X] = [X]river − [Cl]river × [X]/[Cl]seawater, where X represents the element of interest, and nss denotes concentrations corrected for sea-salt influence. This correction quantifies seawater and meteoric contributions to Na, Mg, and Ca in river water, yielding element concentrations adjusted for dilution by Cl inputs. Relationship plots of nss-Ca/nss-Na and nss-Mg/nss-Na (Figure 4b) show that most samples fall between silicate and carbonate weathering end-members. After removing the low Mg/Na and Ca/Na seawater component, 2021 river water ratios shift markedly toward carbonate weathering sources, with ranges of Ca/Na = 0.67–10.28 and Mg/Na = 0.50–3.19. These elevated ratios indicate that, compared with 2000 and 2010 datasets, the 2021 chemical composition reflects a higher relative influence of seawater and meteoric inputs.

4.3. Boron Isotopes in Erren River Water

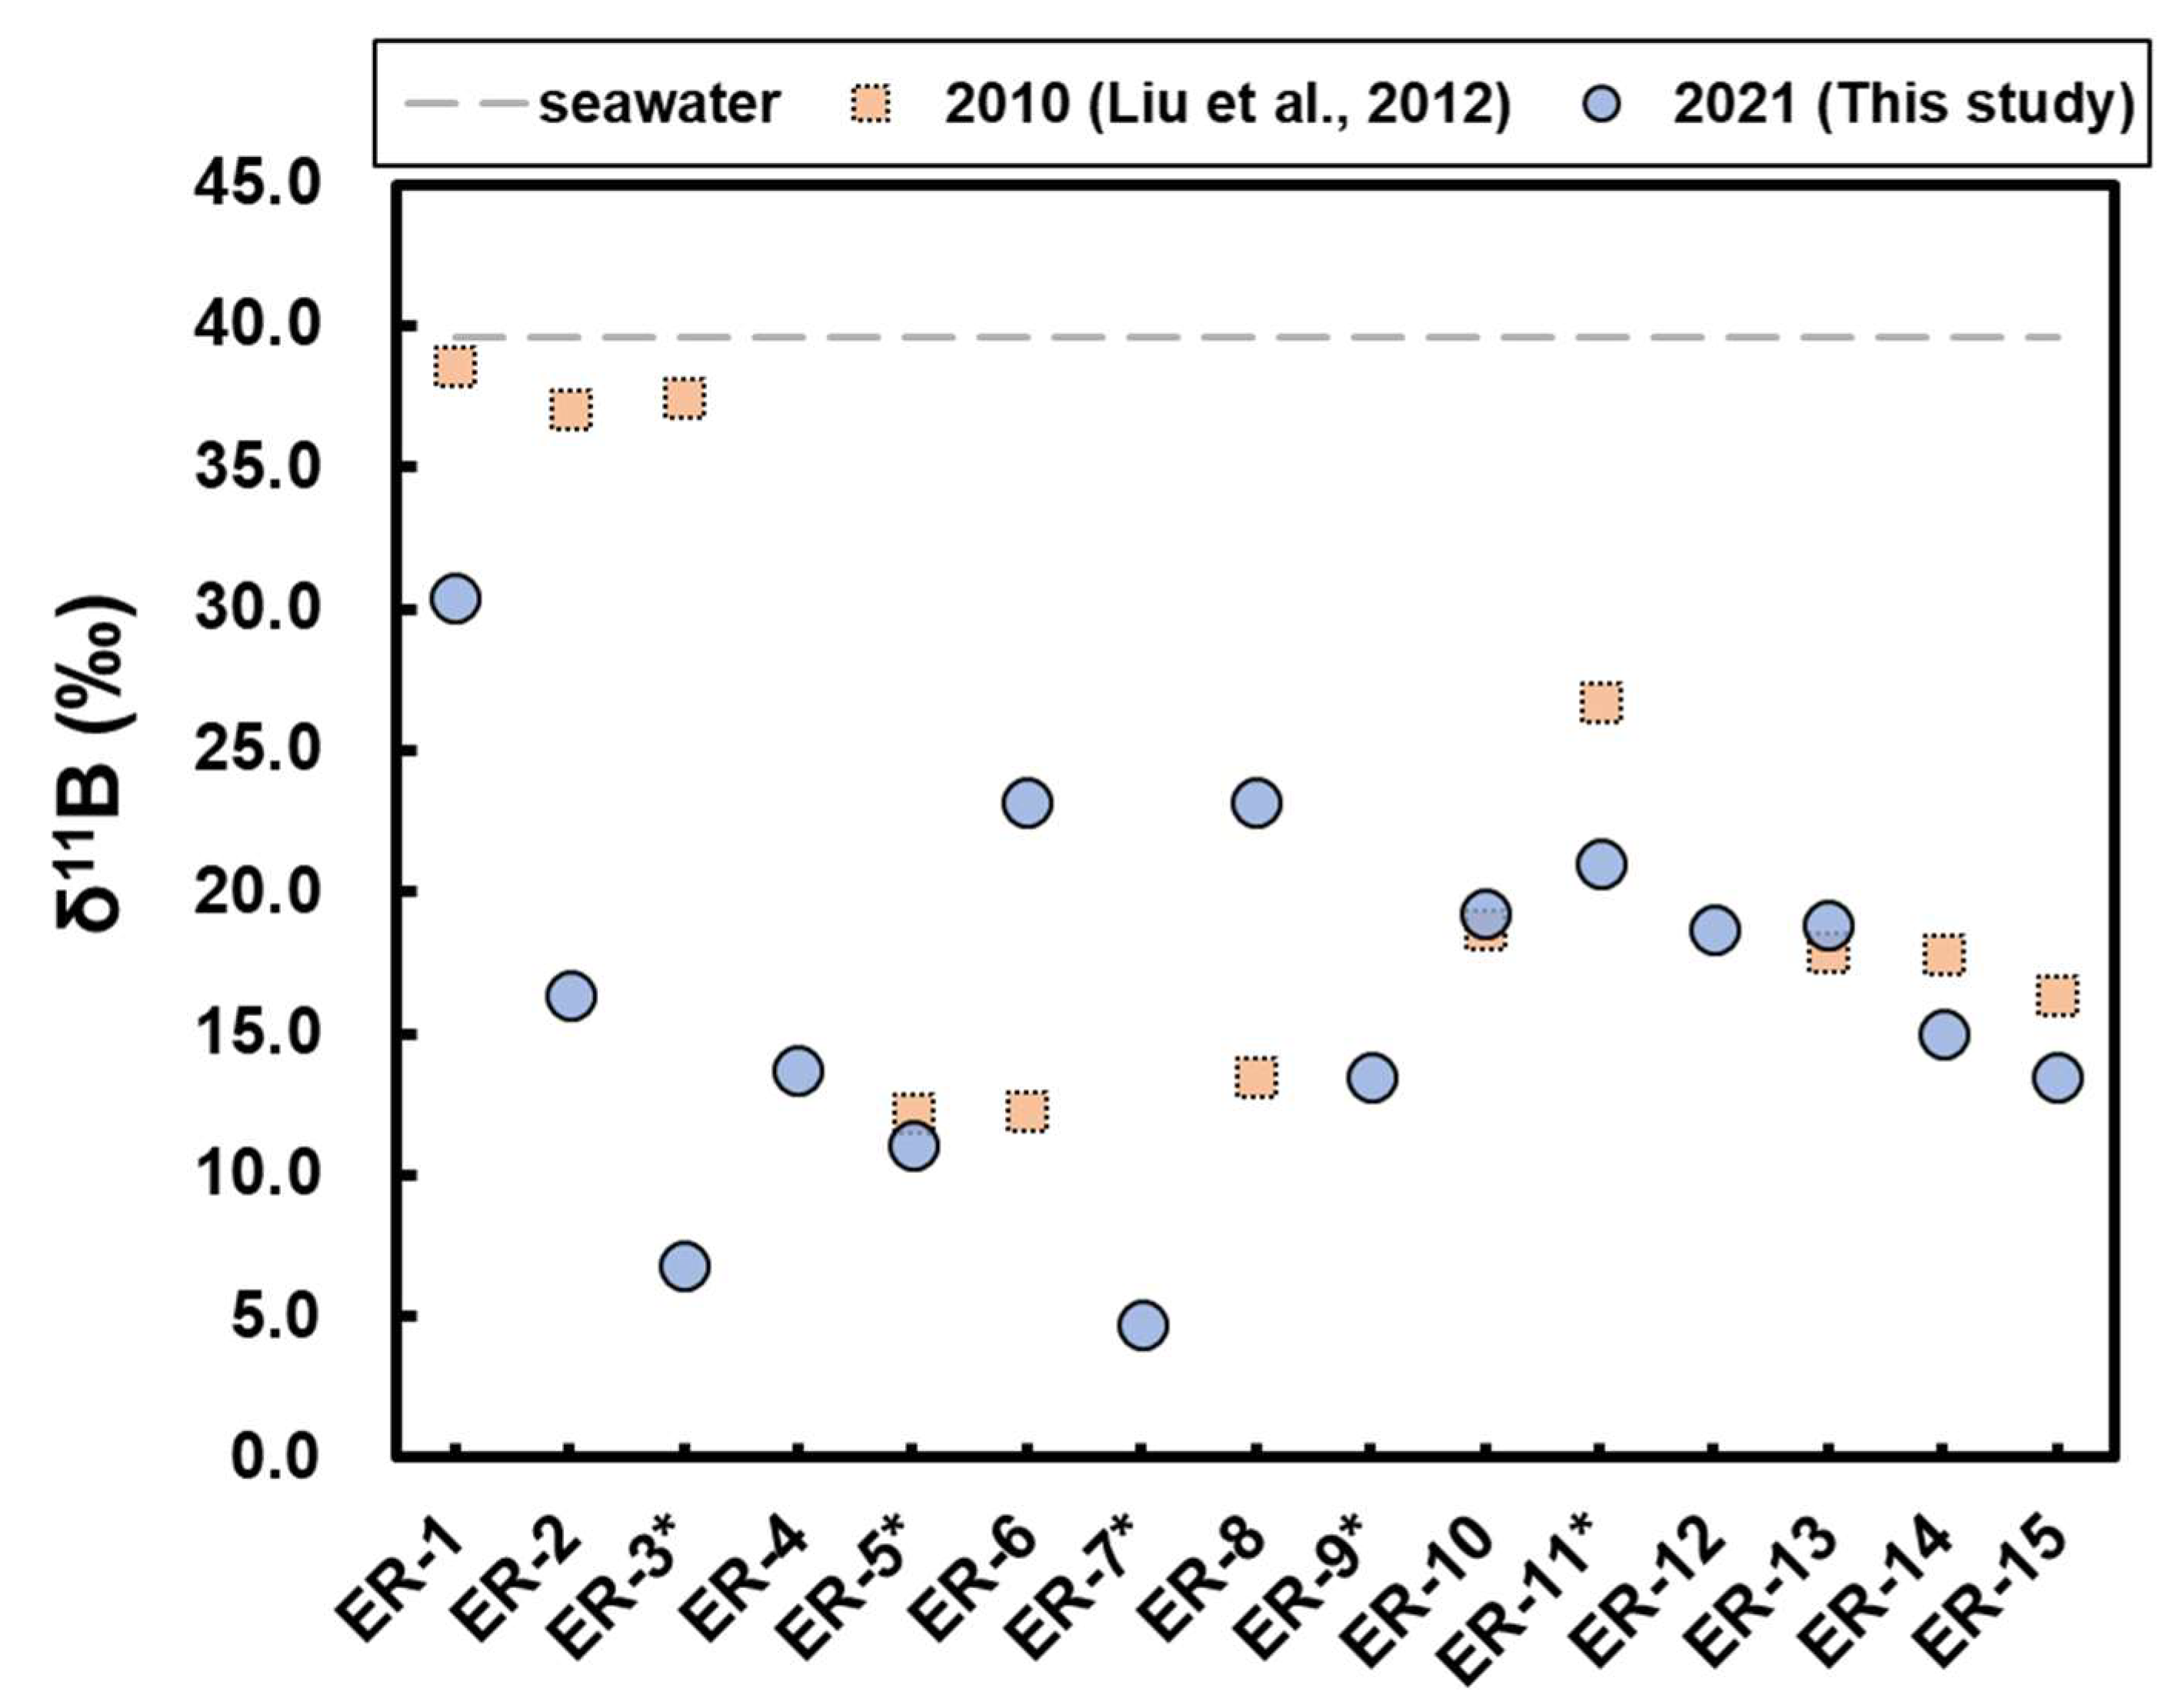
A total of 15 river water samples were analyzed for boron isotopes. The measured δ11B values ranged from a minimum of +4.8 ± 0.7‰ (2SD) at ER-7 in the midstream to a maximum of +30.4 ± 0.6‰ (2SD) at ER-1 near the estuary (Figure 5; Table 3), representing a spatial variation of ~26‰ across the basin. The highest δ11B values at the estuary (ER-1) indicate a significant seawater influence, given that silicates typically exhibit lower δ11B [27], whereas seawater is characterized by elevated δ11B (+39.61 ± 0.04‰, 2SD; [76]). The average δ11B of the Erren River was +18.4‰, reflecting this mixed contribution.
In the upstream section (ER-15 to ER-11), δ11B values increased progressively downstream. Beyond seawater/salt spray inputs, two additional processes may explain this trend: (1) water–rock interactions, whereby 10B-enriched B(OH)4 is preferentially adsorbed onto solids, elevating δ11B in solution; and (2) carbonate-derived inputs, which typically yield intermediate δ11B values in river waters relative to seawater [77] (further evaluated using 87Sr/86Sr ratios in following section). In the mid-to-downstream region, tributary samples (ER-3, ER-5, ER-7, ER-9) consistently exhibited lower δ11B than adjacent main-channel sites (ER-4, ER-6, ER-8, ER-10). This pattern suggests weaker seawater/salt spray influence in tributaries or stronger water–rock interaction effects. Comparison with samples collected in July 2010 at identical sites [32] shows broadly similar δ11B values in the upstream, but notable differences at downstream sites (ER-1, ER-2, ER-3) (Figure 5). These discrepancies likely reflect temporal variability in environmental factors such as precipitation and tidal conditions, which modulate seawater contributions.
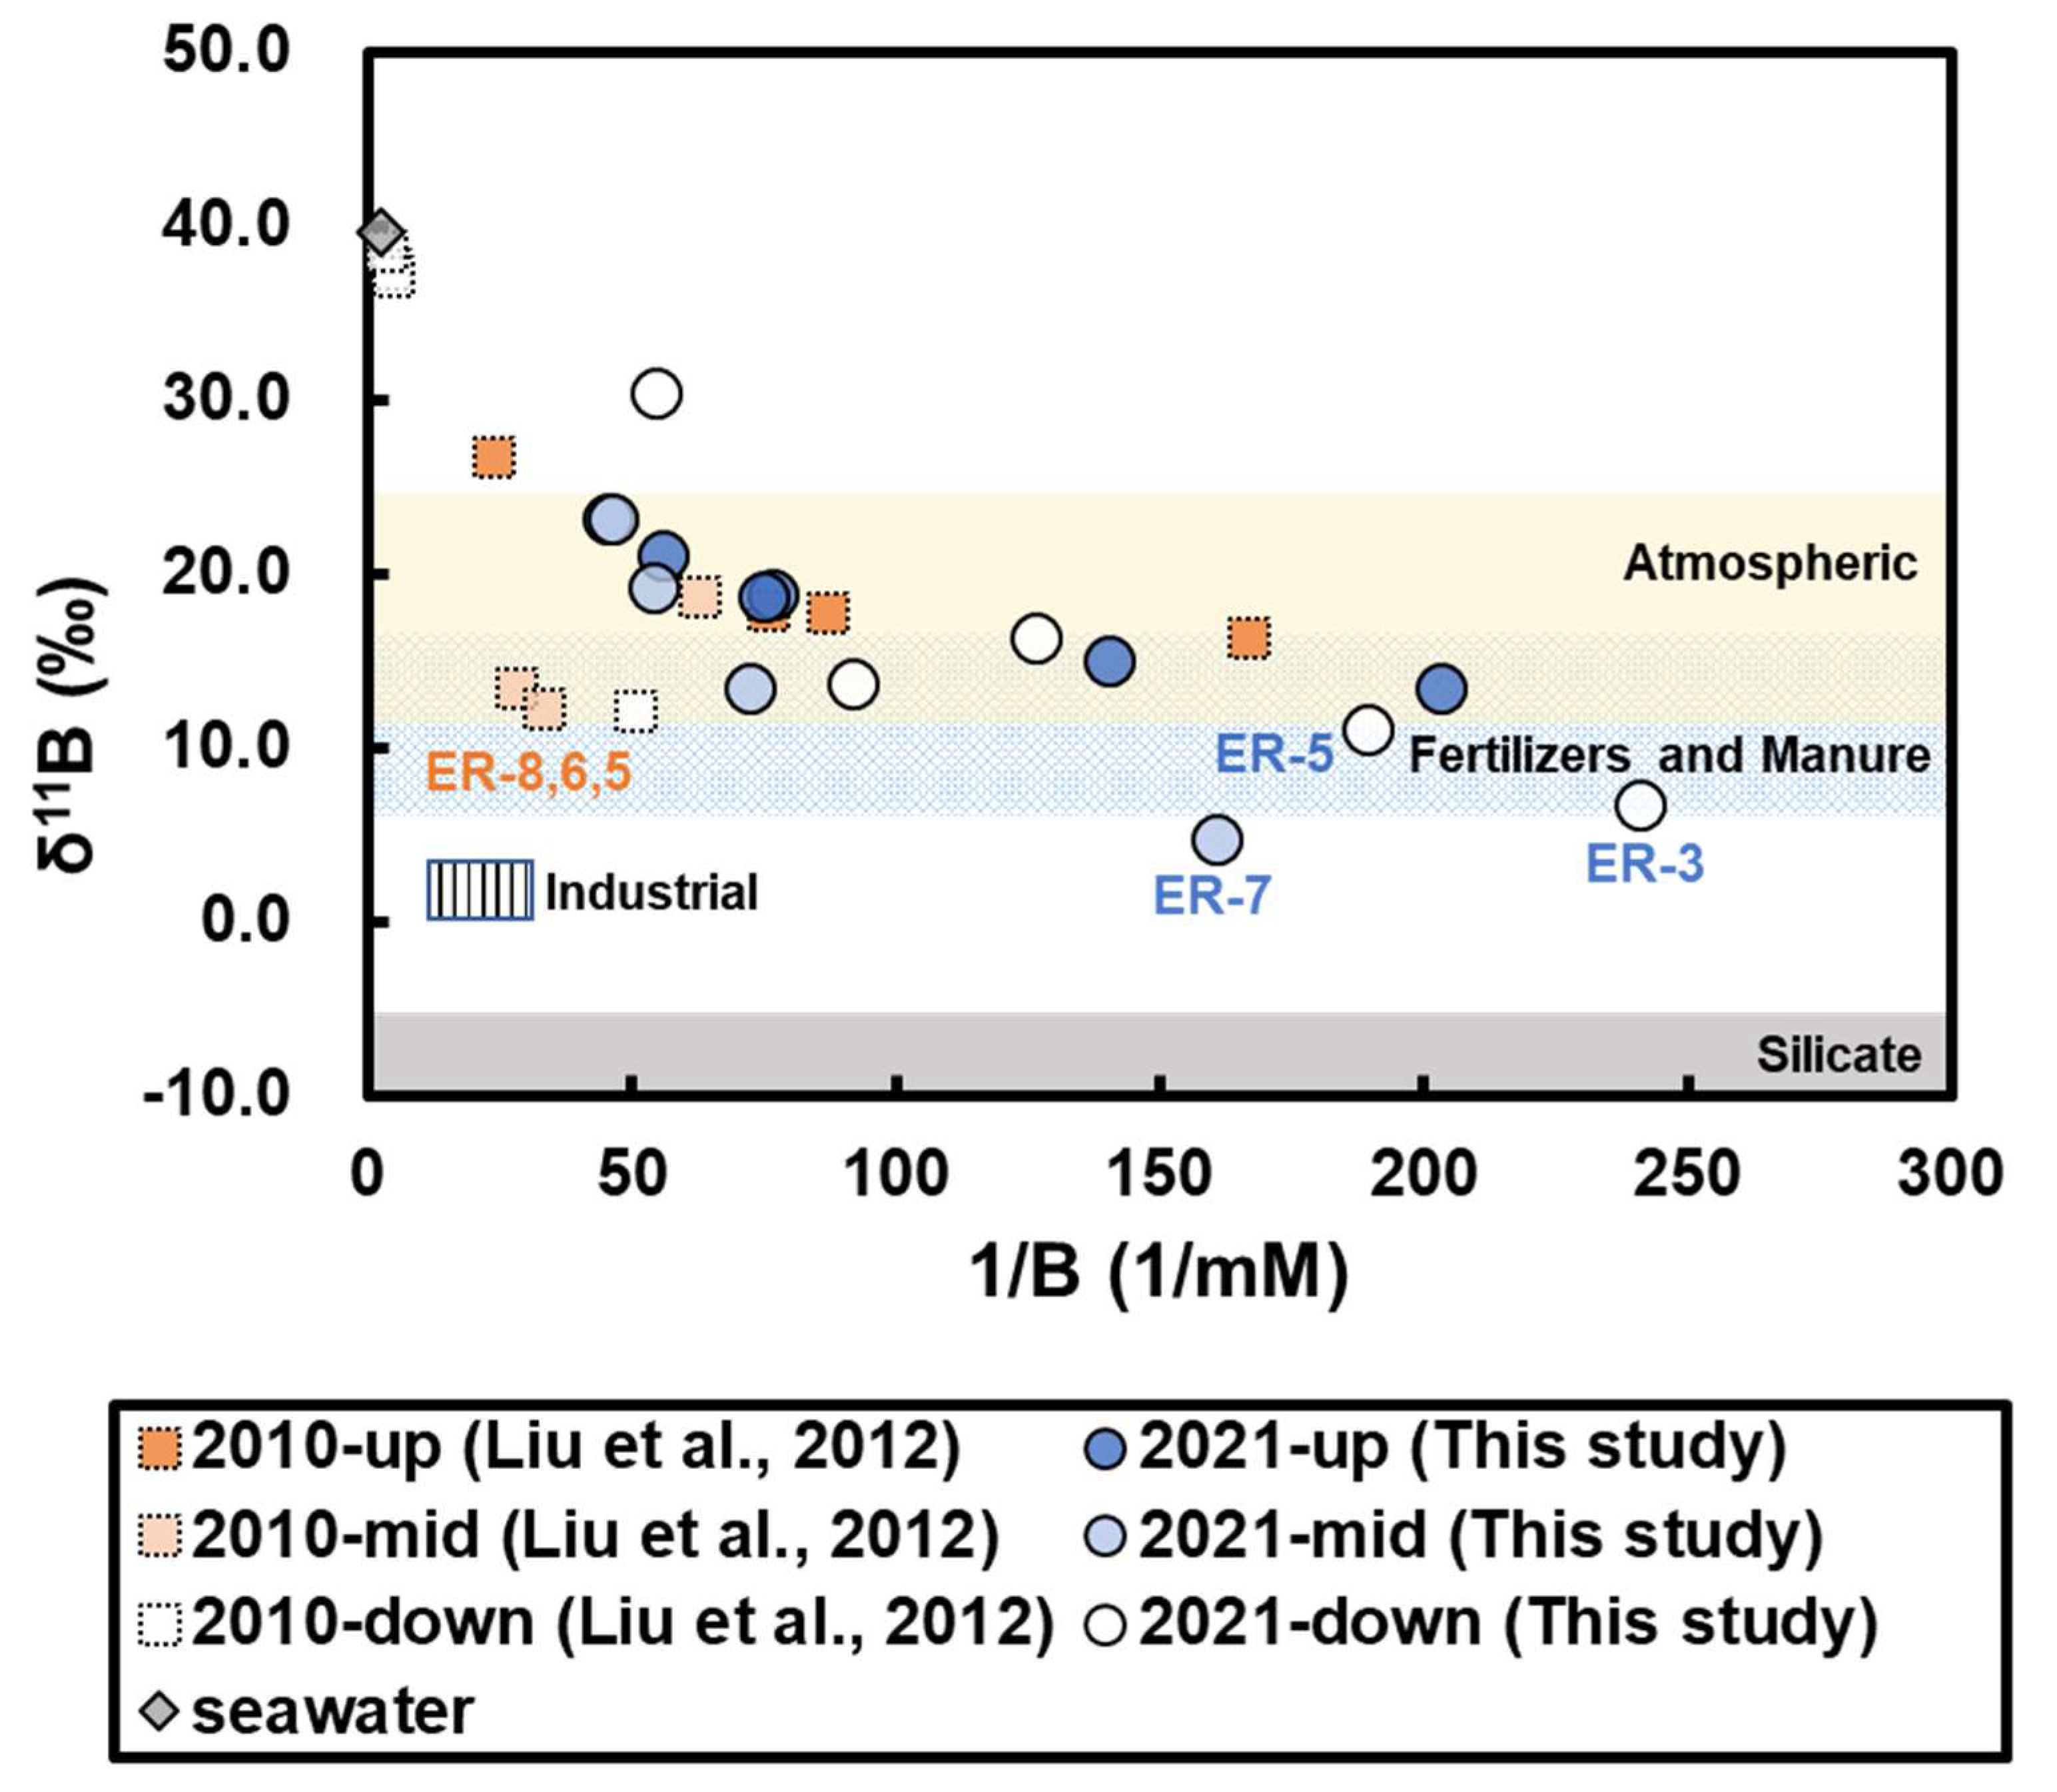
The δ11B–1/B plot (Figure 6) indicates that samples collected near the estuary (ER-1) exhibit the highest δ11B (+30.4 ± 0.6‰) and elevated B concentrations (lower 1/B values), reflecting a strong seawater influence. Upstream, the impact of seawater inputs on the main channel diminishes with increasing distance from the coast. In contrast, tributary samples (ER-3, ER-5, ER-7) consistently show lower δ11B values and reduced B concentrations. Several factors may account for these observations: (1) Reduced seawater/salt spray influence (δ11B = +39.64 ± 0.42‰; 1/B = 2.40). (2) Meteoric inputs from aerosols (δ11B = 10.9–24.3‰). (3) Silicate weathering and water–rock interactions, particularly involving clay minerals (δ11B =−5.1 ± 0.87‰) and shale (δ11B =−12 ± 5‰; 1/B ≈ 55–900). (4) Anthropogenic sources, including chemical fertilizers and animal waste (δ11B = +6.3–15.6‰), as well as industrial inputs (δ11B =−0.3–2.8‰; 1/B ≈ 11.91–36.98). These findings highlight pronounced spatial variability in boron isotopes across the basin and suggest that tributaries are more strongly influenced by local geochemical processes and potential anthropogenic inputs than by seawater. Further analyses will explore δ11B in relation to elemental ratios to better constrain the extent of human-derived contributions.
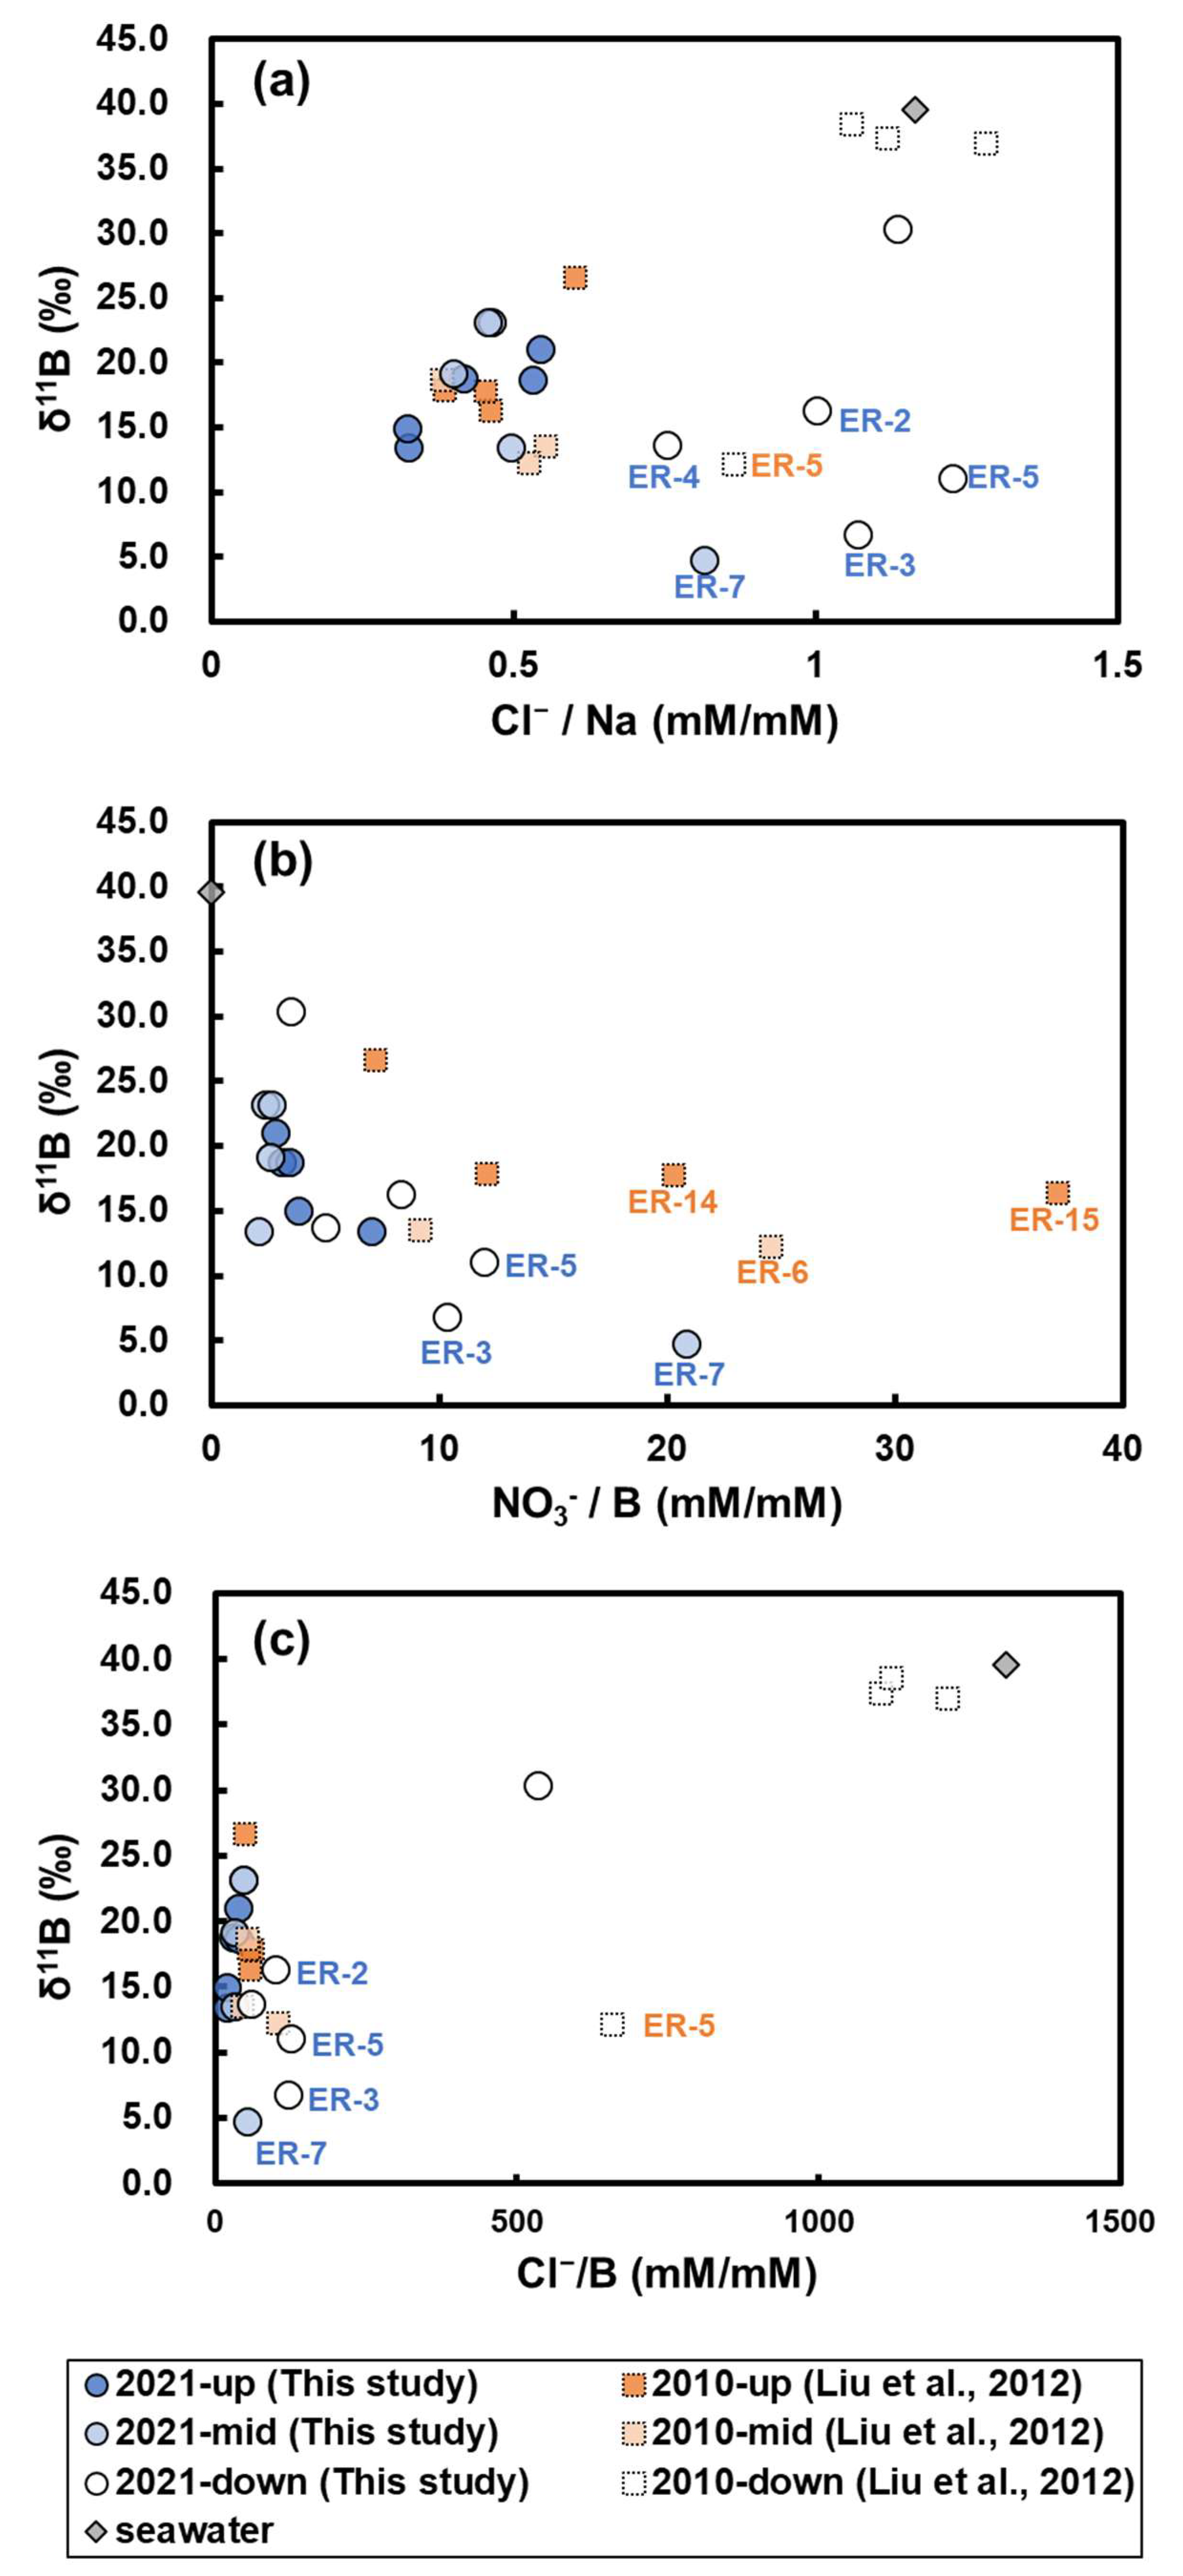
The δ11B–Cl/Na (Figure 7a) and δ11B–NO3/B plots (Figure 7b) indicate that tributary samples ER-3, ER-5, and ER-7 in 2021 were influenced by sources characterized by low δ11B and elevated Cl/Na and NO3/B ratios. In addition, δ11B–Cl/Na (Figure 7a) and δ11B–Cl/B (Figure 7c) relationships show that ER-5 was strongly affected by high Cl/Na and Cl/B inputs in 2010. By 2021, ER-5 still exhibited relatively high Cl/Na values, while Cl/B ratios were slightly elevated compared to other samples but markedly lower than in 2010. Previous studies have demonstrated that excess Cl and NO3 in river water typically originate from anthropogenic and biological activities [57,74]. Chloride is commonly derived from agricultural fertilizers (e.g., potassium chloride, KCl) or domestic wastewater enriched in NaCl, whereas nitrate is largely associated with biological metabolism and recycling, including domestic sewage, animal waste, and organic fertilizers. Taken together, these results suggest that tributaries of the Erren River in 2021 were still subject to minor inputs of Cl from agricultural fertilizers and NO3 from biological metabolism and reuse processes, highlighting ongoing anthropogenic influences on river water chemistry.

4.4. Strontium Isotopes in Erren River Water

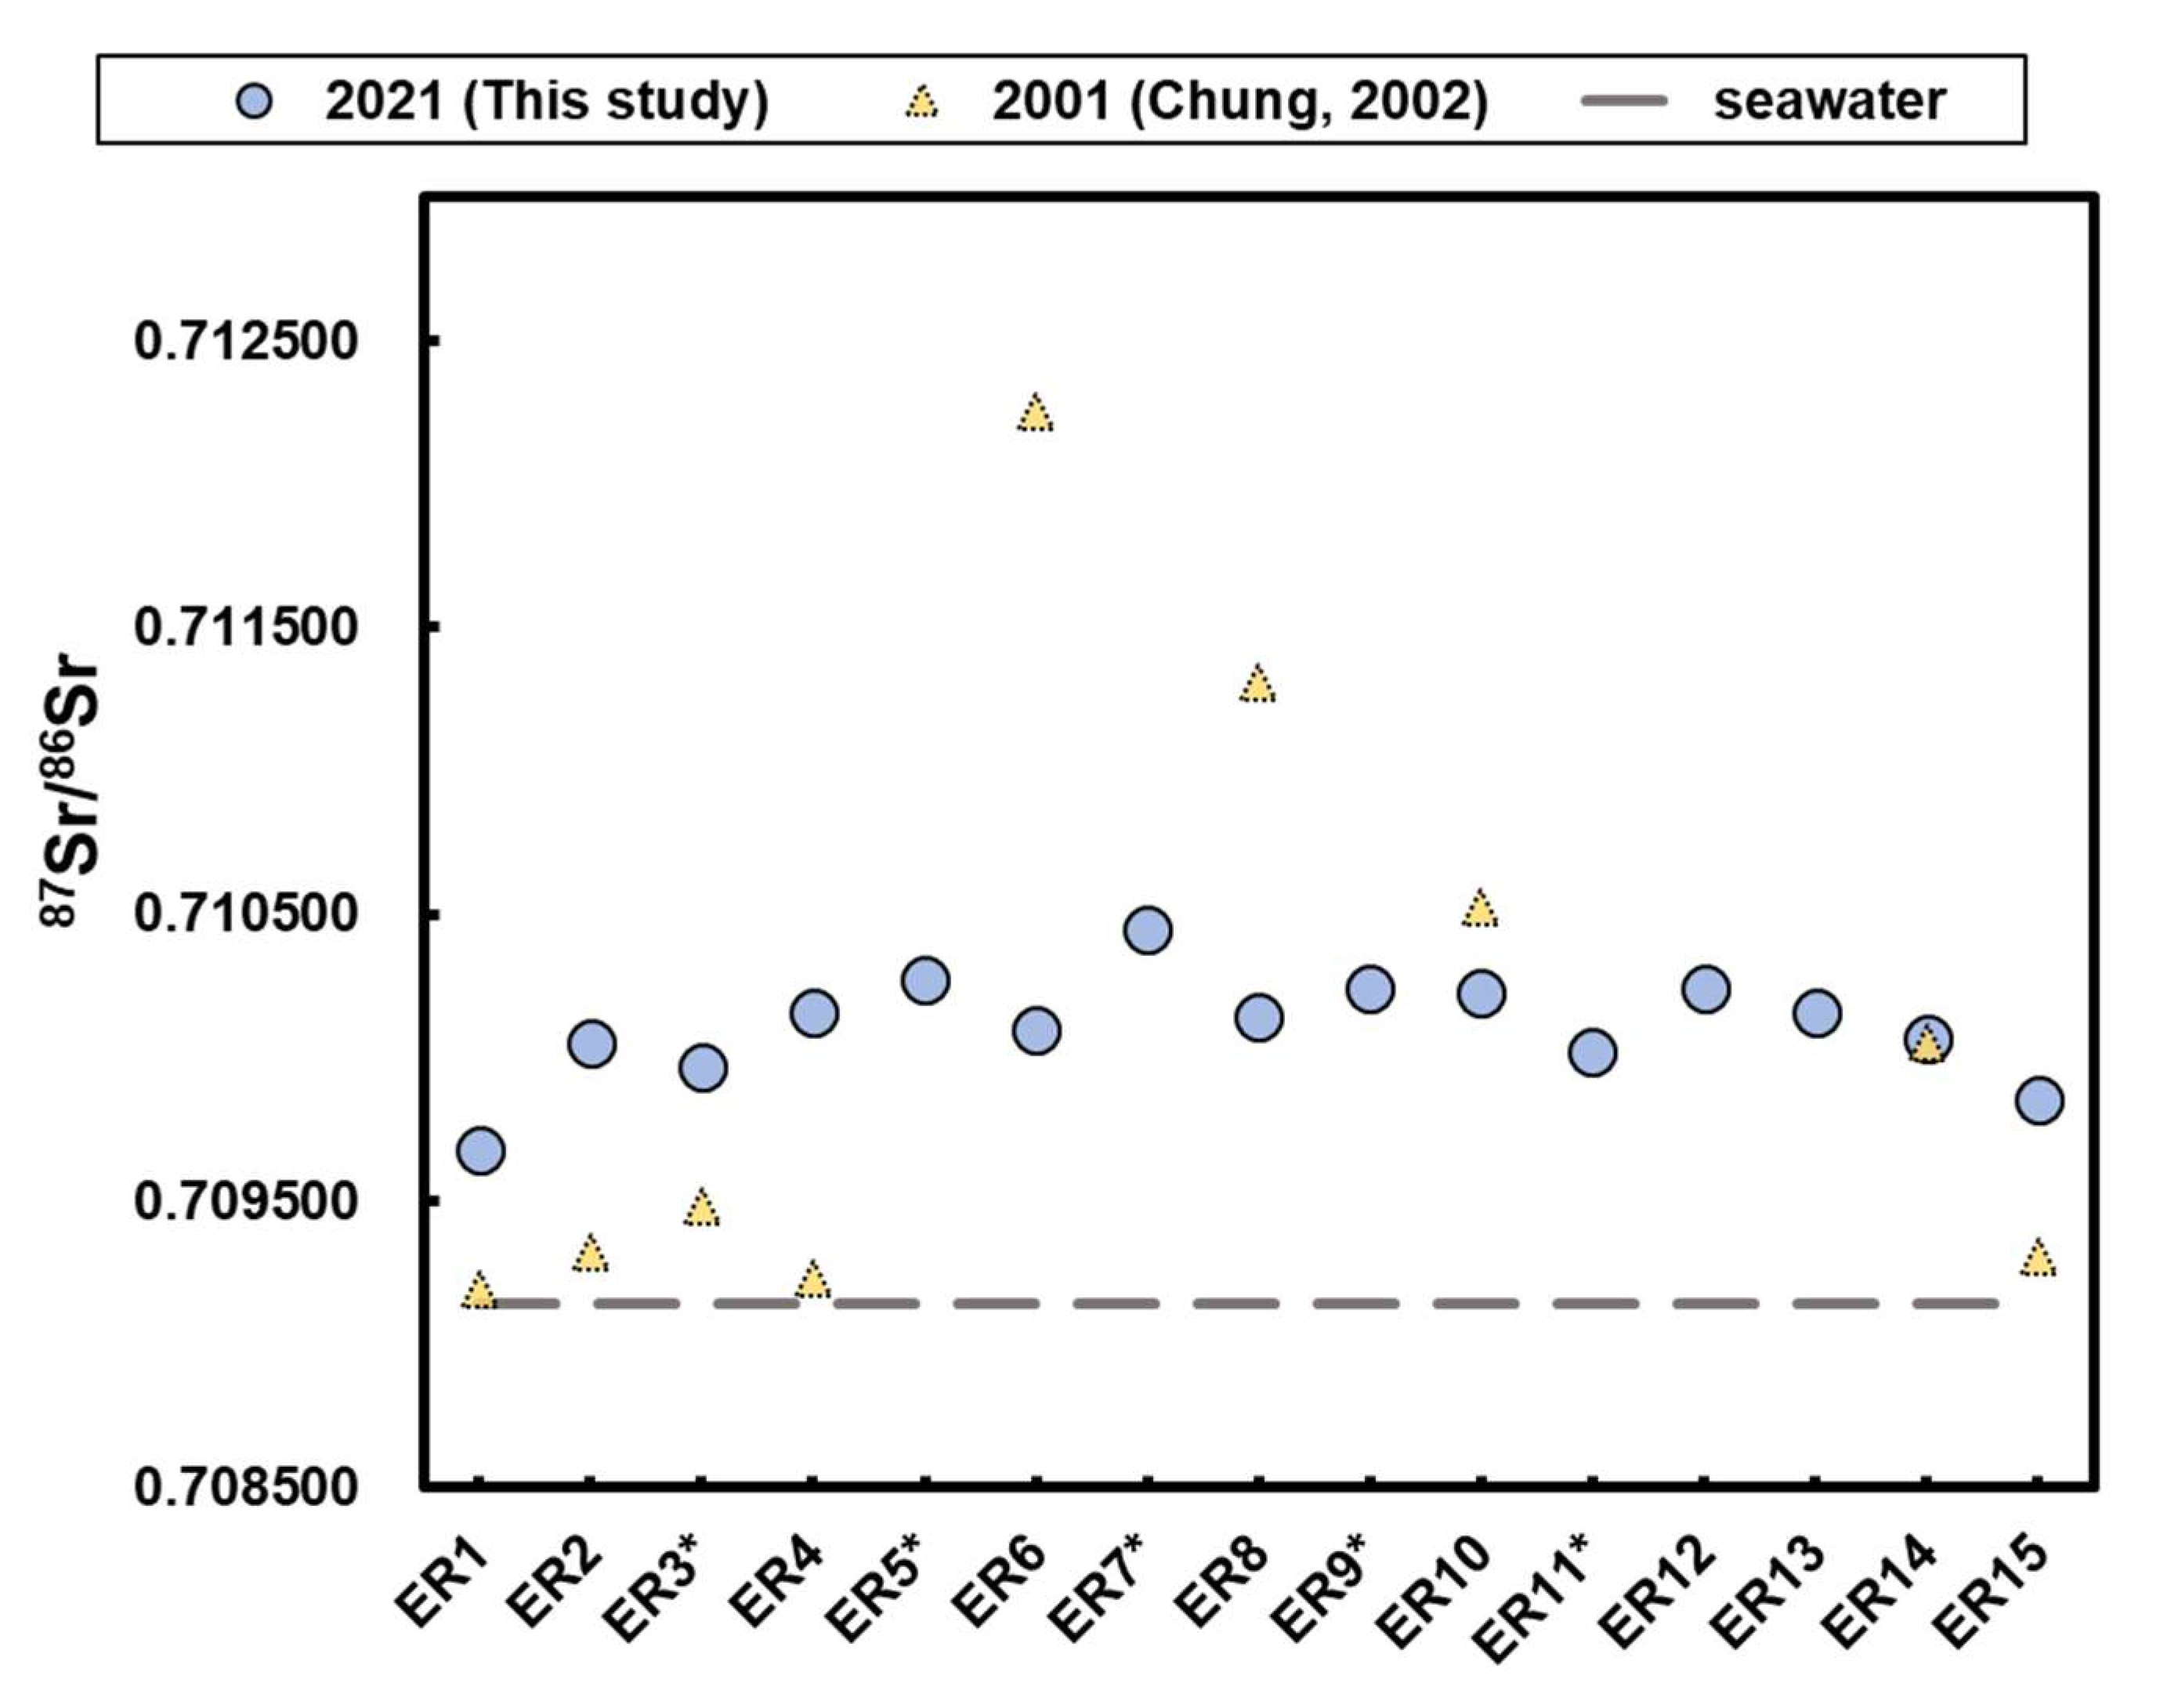
Fifteen Erren River water specimen collected in 2007 yielded 87Sr/86Sr ratios ranging from 0.709679 to 0.710446 (Table 3), with a mean value of 0.710108. By comparison, samples collected in April 2001 exhibited a broader range of 0.709191–0.712251, with a mean of 0.710074 [46]. Sediment samples from silicate-dominated strata within the basin display significantly higher 87Sr/86Sr values (0.715578–0.720206), and are considered representative of the silicate weathering end-member. Literature values indicate that meteoric water has 87Sr/86Sr ratios of 0.70434–0.71003 (mean = 0.70923; [75]), closely resembling seawater (87Sr/86Sr = 0.70918; [81]). For subsequent discussion, meteoric water and seawater/salt spray are treated as a single end-member.
To evaluate spatial variability, samples were grouped by distance from the estuary: downstream (ER-1–ER-5), midstream (ER-6–ER-10), and upstream (ER-11–ER-15). Midstream waters exhibited higher 87Sr/86Sr values relative to upstream and downstream sites (Figure 8). This pattern likely reflects preferential carbonate weathering in the upper reaches, followed by increasing silicate weathering contributions downstream. Continuous water–rock interactions with surrounding silicate lithologies during transport further elevate midstream 87Sr/86Sr. Toward the estuary, seawater/salt spray and meteoric inputs exert stronger influence, lowering downstream 87Sr/86Sr values. However, these remain above the seawater baseline, indicating persistent silicate weathering contributions.
Although the mean 87Sr/86Sr values for the 2001 dry season (0.710074) and 2021 wet season (0.710108) are nearly identical, the 2001 dataset shows a wider range. Spatial trends in 2001 resemble those of 2021, but differences between midstream and upstream/downstream sites were more pronounced. This may reflect enhanced rock weathering intensity during the dry season, increasing silicate contributions in the midstream and yielding higher 87Sr/86Sr values. Conversely, lower downstream ratios in 2001 (ER-1–ER-4) suggest stronger seawater/salt spray and meteoric influence, though lithological variability cannot be excluded.
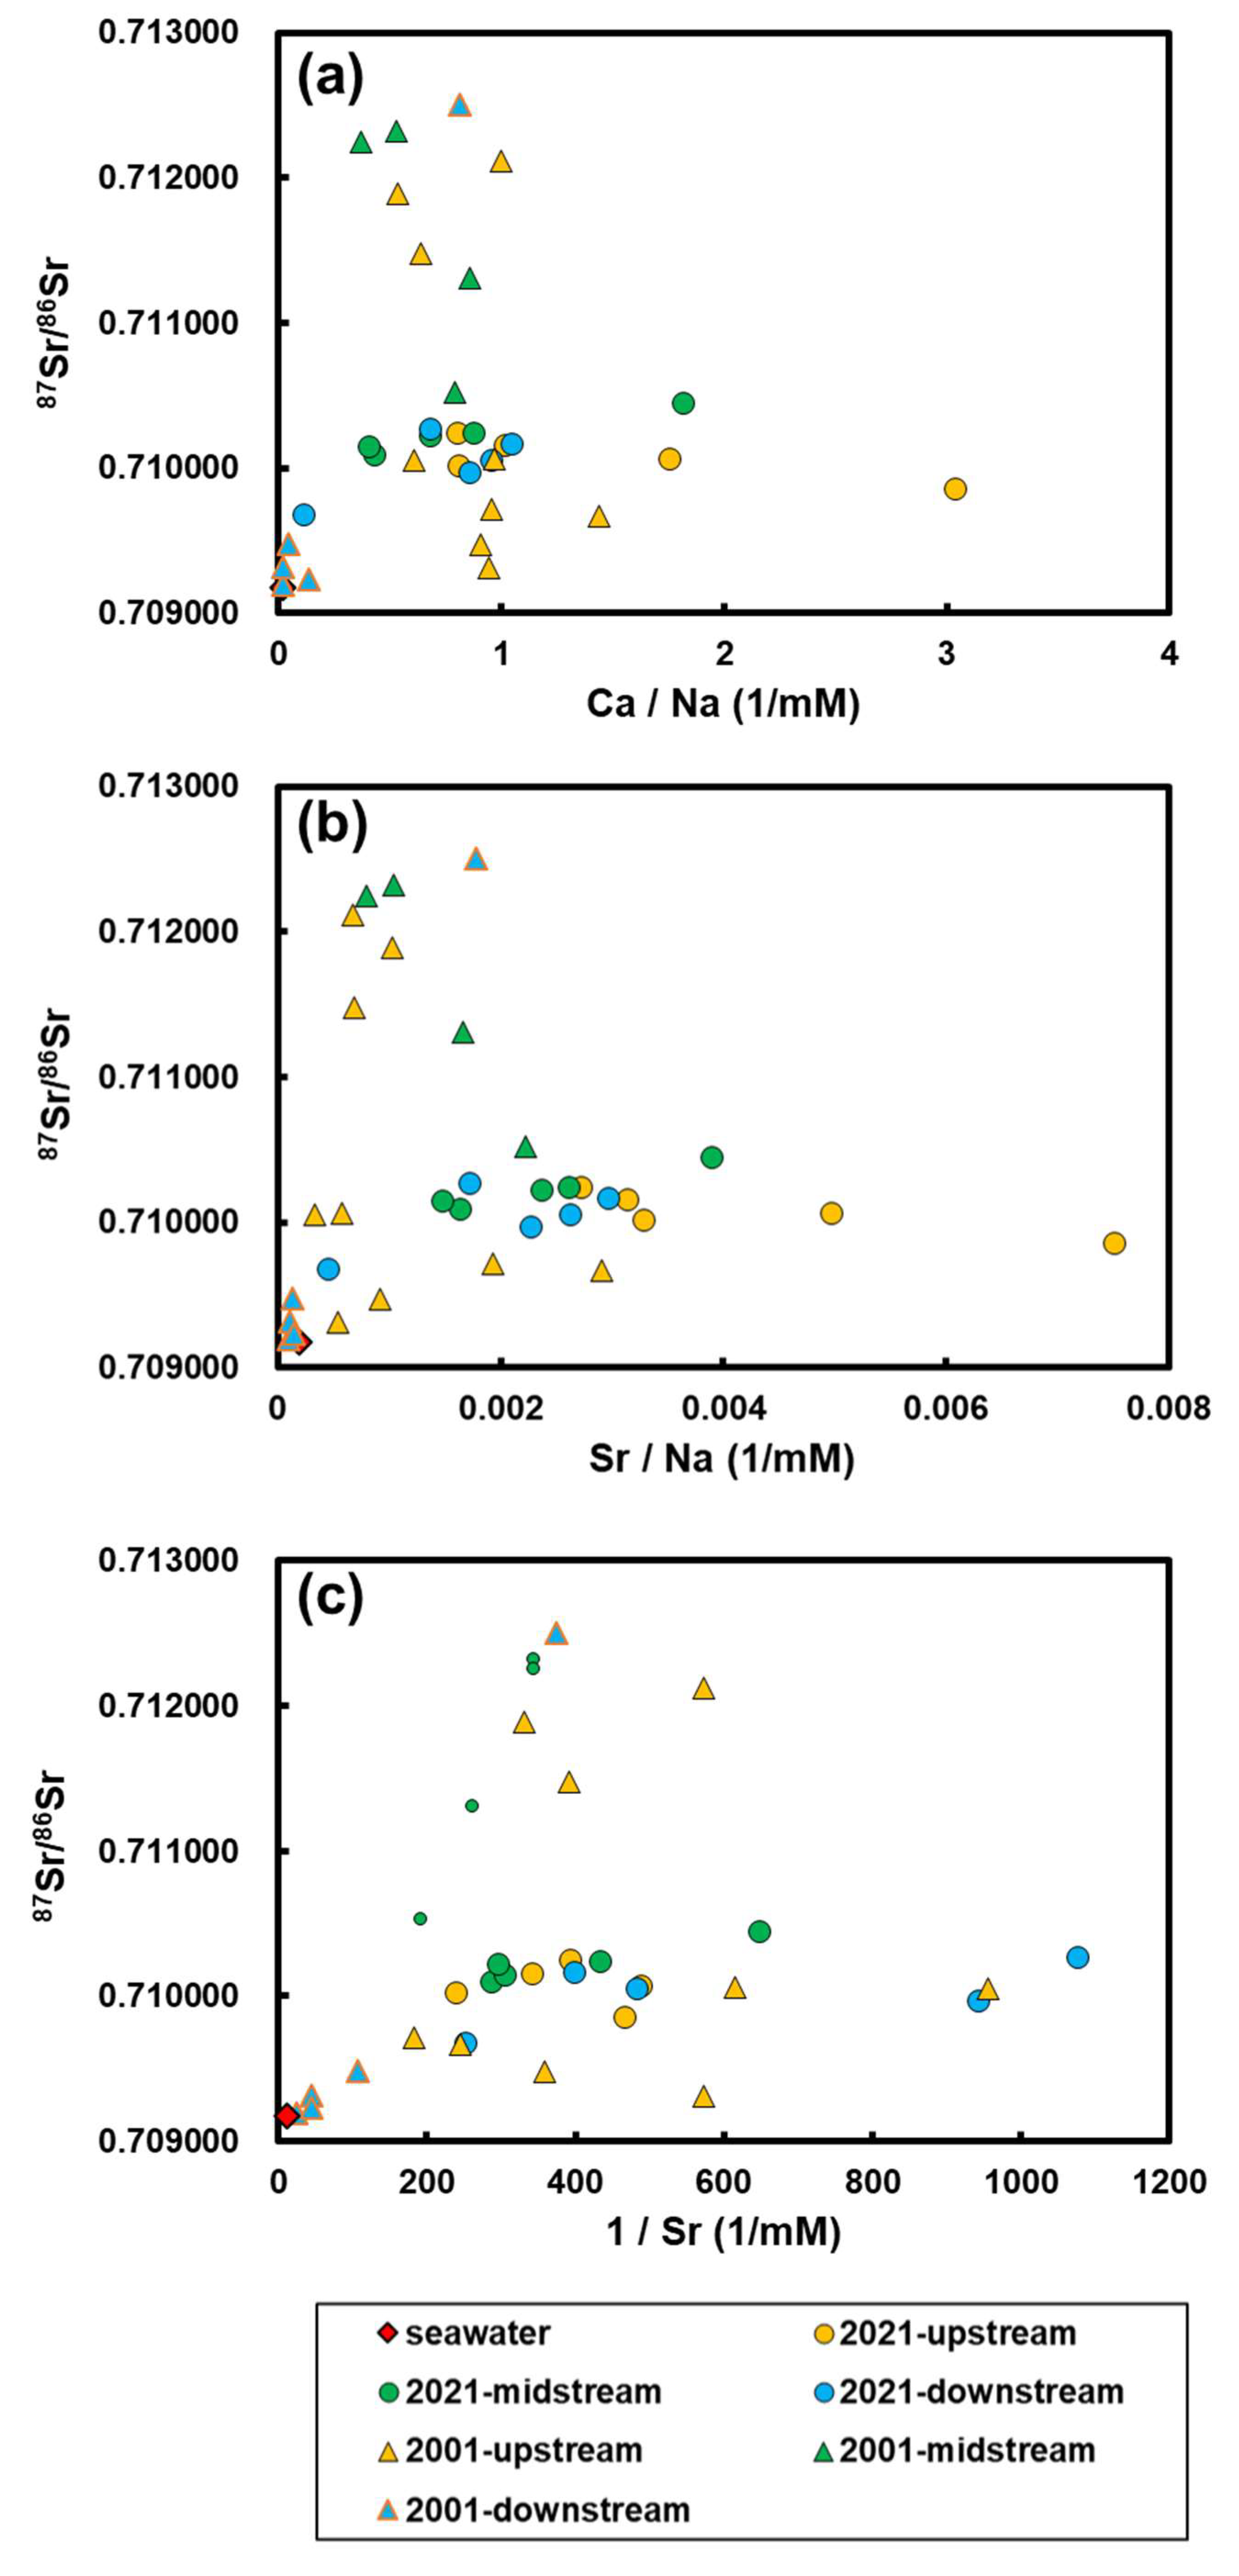
To further evaluate the spatial and temporal variability of 87Sr/86Sr in the Erren River, relationships between 87Sr/86Sr and the inverse of Sr concentration, as well as 87Sr/86Sr and Ca/Na, were examined. As noted previously (Section 4.2), average elemental ratios for silicate weathering are Ca/Na = 0.35 ± 0.15, Mg/Na = 0.24 ± 0.12, and Sr/Na = 3 ± 1 × 10⁻³, whereas carbonate weathering yields much higher values (Ca/Na ≈ 50, Mg/Na ≈ 10, Sr/Na ≈ 35–40 × 10−3). Seawater and meteoric water also contribute significantly to riverine elemental concentrations [54].
In upstream region, the 87Sr/86Sr–1/Sr plot (Figure 9a) shows a positive correlation, indicating that Sr concentrations are primarily controlled by silicate weathering. Elevated Sr concentrations correspond to lower 87Sr/86Sr values, consistent with silicate-derived inputs. The 87Sr/86Sr–Ca/Na relationship (Figure 9b) further supports this interpretation: from ER-15 to ER-11, Ca/Na decreases from 3.0 to 0.8, while 87Sr/86Sr increases from 0.709855 to 0.710020. Although silicates dominate the lithology, preferential carbonate weathering [54] contributes more strongly at ER-15 than at ER-11. This can be explained by sulfuric-acid-mediated weathering, driven by pyrite oxidation, which substantially amplifies carbonate dissolution. In the upper reaches of the Erren River, where rapid erosion and anthropogenic disturbance continually expose fresh mineral surfaces, sulfuric acid enhances carbonate dissolution beyond the levels expected under carbonic-acid weathering alone. This process, strongly modulated by hydrological variability, alters solute fluxes and can shift weathering dynamics toward a net CO2 source. Such behavior is consistent with observations from Taiwan and other rapidly eroding catchments [64,82,83].
Previous studies indicate that carbonate sources typically exhibit lower 87Sr/86Sr values (≈0.707–0.709) and higher Sr/Na (~40–50 × 10−3), whereas silicates yield higher 87Sr/86Sr (≈0.705–0.735) and lower Sr/Na (~3 × 10⁻³) [42,54]. In 2021, midstream samples show that increasing Sr concentrations correspond to decreasing 87Sr/86Sr and lower Sr/Na (Figure 9c), suggesting dominant contributions from seawater/salt spray and meteoric inputs, which are characterized by low 87Sr/86Sr and Sr/Na [42,75]. By contrast, midstream samples collected in April 2001 (dry season) yielded much higher 87Sr/86Sr values (0.710525–0.712251), likely reflecting reduced precipitation and discharge, which prolonged water–rock interaction with surrounding silicate lithologies. Another possible reason is that in 2009, Typhoon Morakot struck Taiwan, bringing intense rainfall and triggering numerous new landslides in the mountainous areas of southern Taiwan [84,85]. This event drastically altered the surface vegetation cover in southern Taiwan [86]. Consequently, the zones of weathering shifted, and the balance between carbonate and silicate weathering also changed. These changes led to differences in the distribution trend of strontium isotope compositions in the Erren River over the past two decades. However, the extent of these changes still requires further investigation. Field investigations reveal the presence of exposed carbonate strata (Dagangshan Limestone) in the midstream basin. In 2001, 87Sr/86Sr values were inversely correlated with Ca/Na (Figure 9b) and Sr/Na (Figure 9c), consistent with carbonate inputs (low 87Sr/86Sr, high Ca/Na). However, such carbonate influence was not evident in the 2021 wet-season dataset, which instead reflects stronger seawater and meteoric contributions. As noted in the previous section, the reason why the strontium isotopes of samples collected near Dagangshan Limestone (ER8-11) are less influenced by the carbonate compared to upstream samples can be attributed to sulfuric-acid-mediated weathering. This process, driven by pyrite oxidation, enhances carbonate dissolution and modifies the isotopic signal, thereby reducing the direct imprint of limestone on nearby samples. Furthermore, because the boron concentration in limestone is inherently low, its contribution to the boron isotope composition of adjacent samples is negligible when compared with that derived from silicate rocks [77].
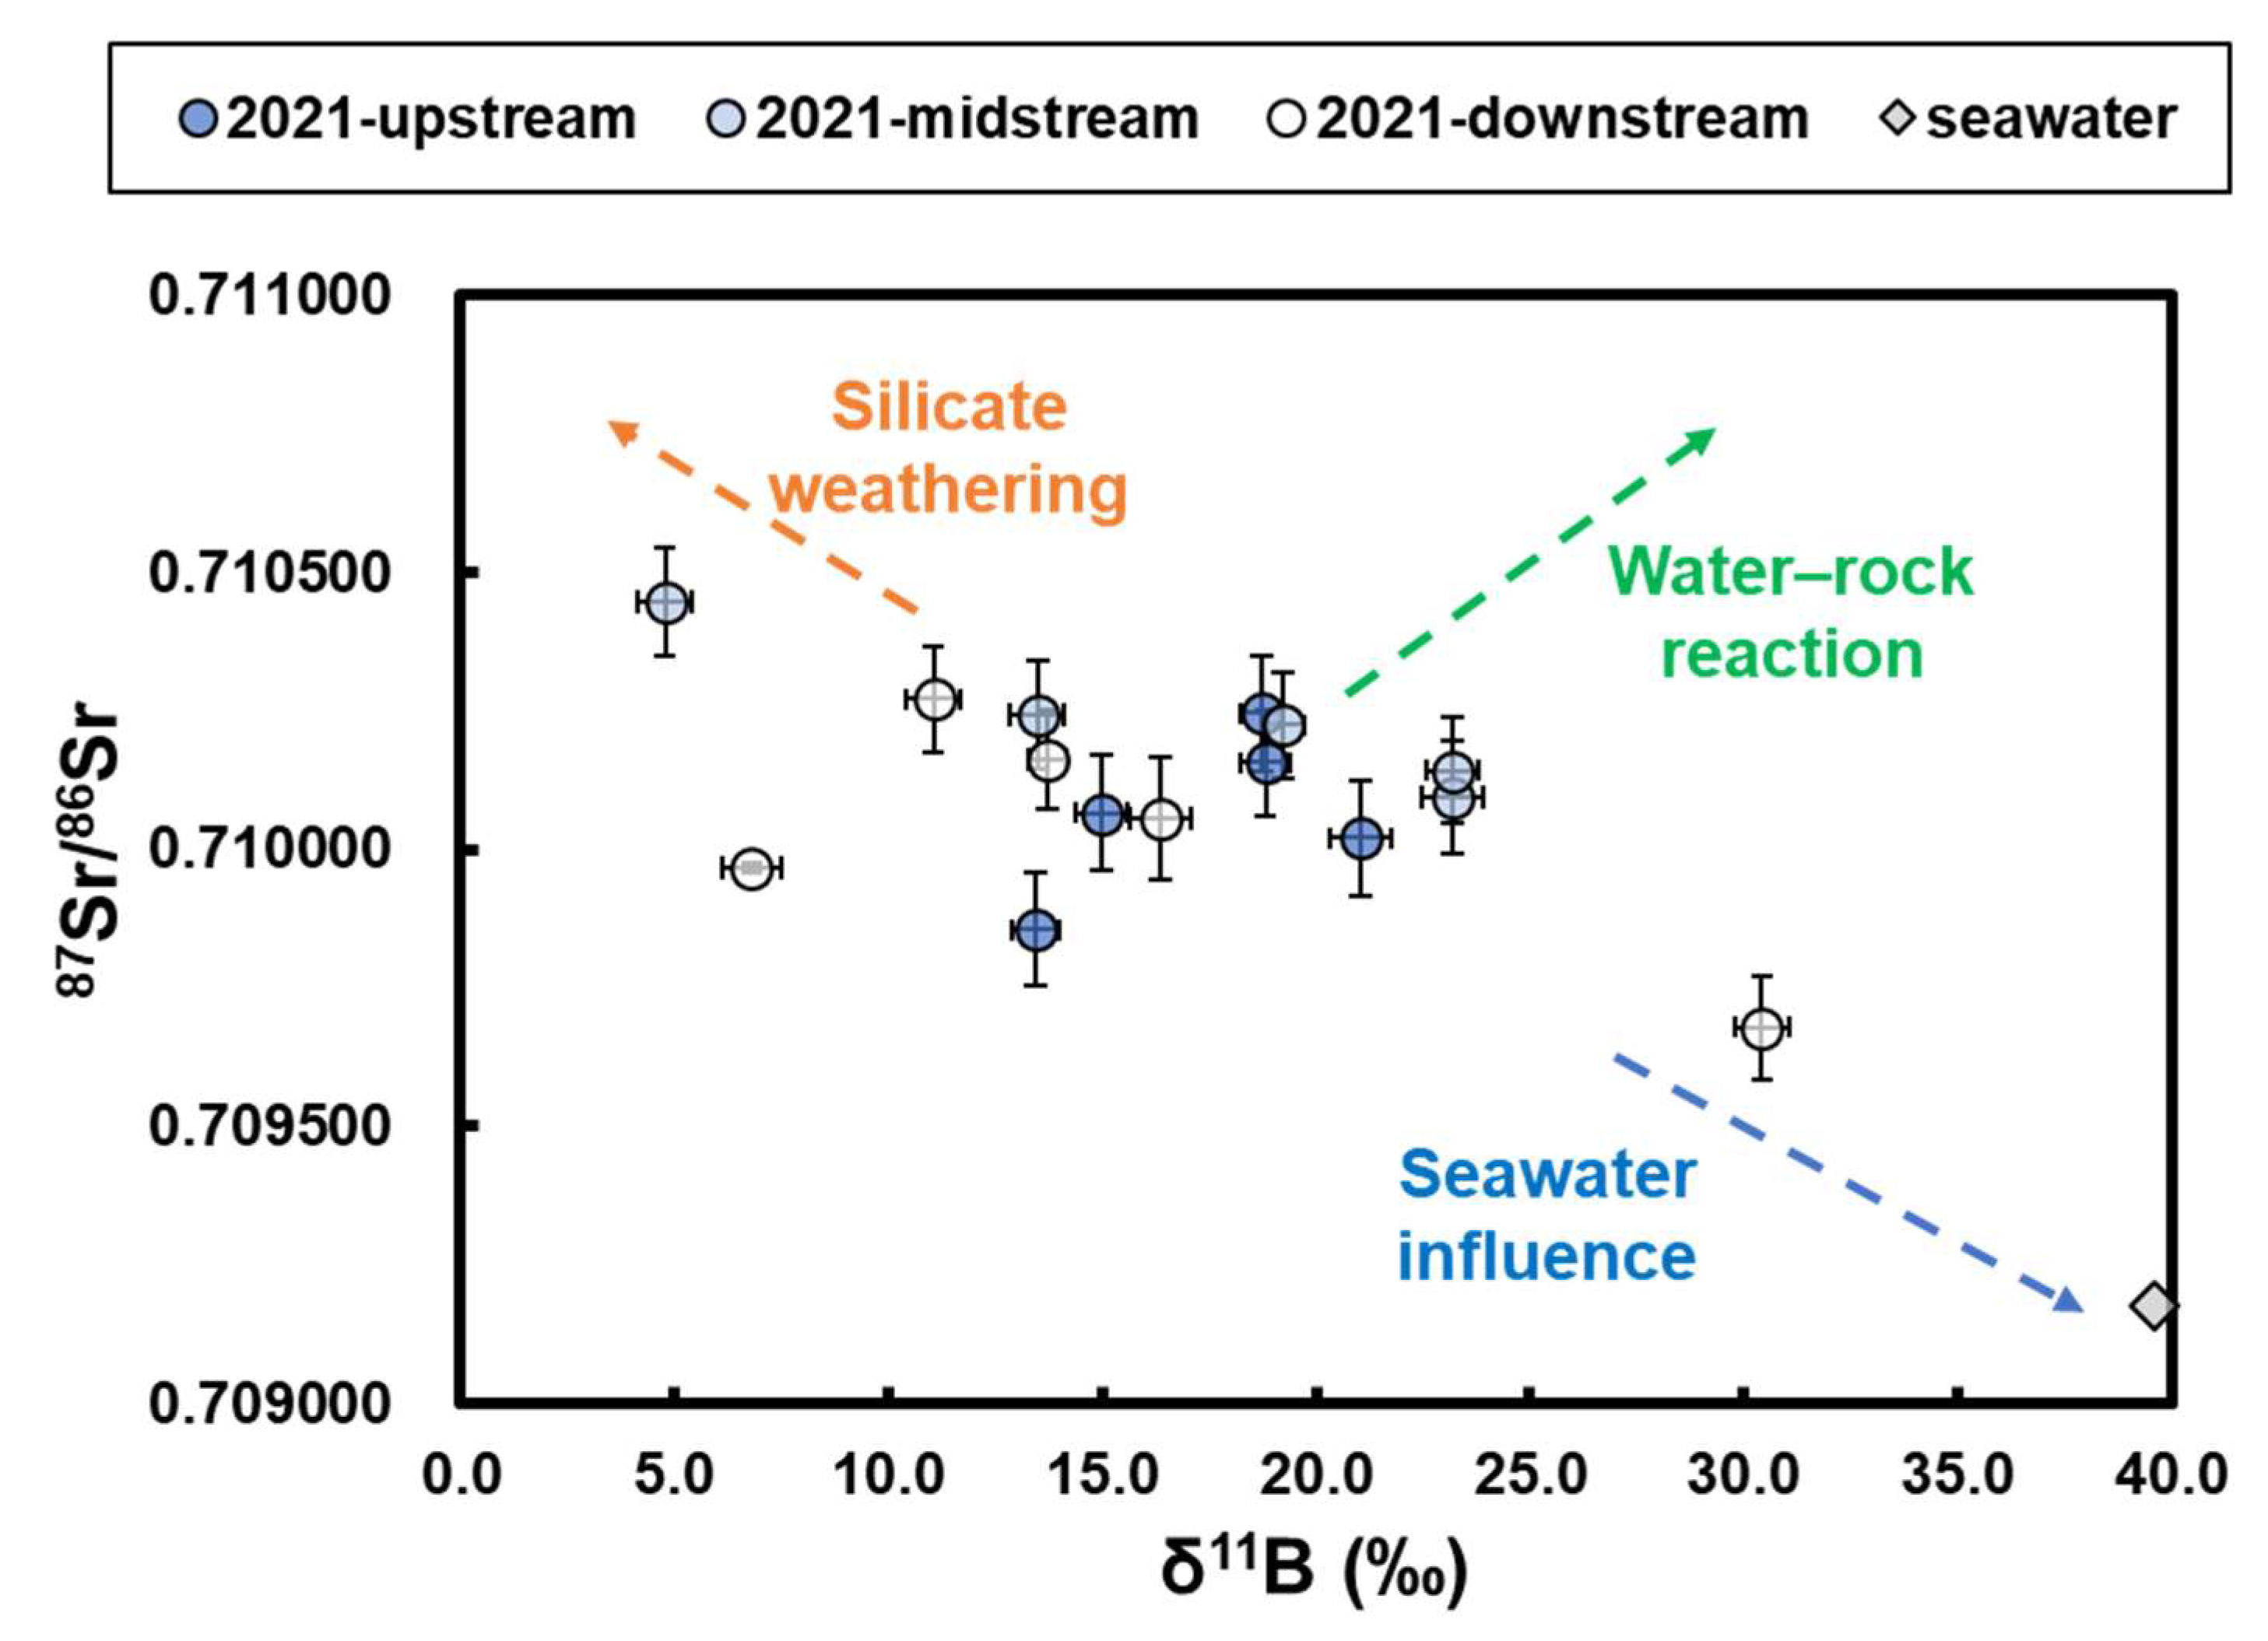
Figure 10 illustrates the relationship between 87Sr/86Sr and δ11B in Erren River water samples collected in 2021. The results indicate that the downstream and midstream regions are primarily influenced by seawater/salt spray inputs characterized by low 87Sr/86Sr and high δ11B, as well as by silicate weathering contributions marked by high 87Sr/86Sr and low δ11B. In contrast, upstream samples exhibit a negative correlation between 87Sr/86Sr and δ11B when progressing downstream (from ER-15 to ER-11). This trend may reflect boron isotope fractionation induced by water–rock interactions. The relationship between boron isotopes and rock weathering rates is strongly modulated by the degree of water–rock interaction [77,87]. In upstream reaches, river water often originates from groundwater, springs, or small tributaries. Flow velocities are lower, and water spends more time percolating through soils and bedrock. This extended contact enhances adsorption, ion exchange, and desorption processes, which fractionate boron isotopes and result in elevated δ11B in river water. At the same time, the increasing proportion of silicate weathering inputs simultaneously raises 87Sr/86Sr values.

5. Conclusions

In this study, river water samples from the Erren River basin were collected during the wet season of 2021 and analyzed for major anions (Cl, NO3, PO43−, SO42−), major cations (Na, K, Mg, Ca), trace elements (B, Li, Mn, Fe, Cu, Zn, Sr, Ba), as well as boron and strontium isotopes. The results indicate that the relative proportions of major ions and elements during the wet seasons of 2000, 2012, and 2021 are broadly comparable. Upstream and midstream waters are dominated by the Ca–Mg–HCO3 type, reflecting strong rock-weathering influence, whereas downstream samples near the estuary exhibit Na–Cl–SO4 signatures, consistent with seawater inputs via salt spray or direct mixing.
Geological surveys confirm the absence of evaporite outcrops in the basin, suggesting that Cl in river water is derived primarily from seawater, meteoric inputs, or anthropogenic sources. Assuming limited anthropogenic influence on major element concentrations, seawater average elemental ratios were applied to correct for dilution effects, and nss-Ca/nss-Na and nss-Mg/nss-Na plots were constructed. These results indicate higher Ca/Na, Mg/Na, and Sr/Na ratios upstream, consistent with preferential carbonate weathering, while downstream waters reflect increasing contributions from silicate weathering and seawater inputs.
Coupled analyses of elemental ratios, 87Sr/86Sr, and δ11B reveal that upstream waters are influenced by carbonate weathering (lower 87Sr/86Sr) and boron isotope fractionation through water–rock interactions (adsorption). In contrast, downstream waters show stronger contributions from silicate weathering and seawater/salt spray. Comparison of dry-season (April 2001) and wet-season (July 2021) samples indicates that reduced precipitation and discharge during the dry season enhanced water–rock interaction, leading to higher carbonate contributions to 87Sr/86Sr in midstream waters. δ11B–element ratio relationships also suggest that tributaries ER-3, ER-5, and ER-7 in 2021 were influenced by sources with low δ11B and high Cl/Na and NO3/B, likely linked to agricultural and urban activities.
Overall, integration of datasets from 2001, 2012, and 2021 demonstrates that the chemical composition of the Erren River varies temporally with precipitation, tidal influence, and anthropogenic inputs. Spatially, upstream waters are dominated by carbonate and silicate weathering, while downstream waters are more strongly influenced by seawater. In 2021, several tributaries (ER-3, ER-5, ER-7) exhibited clear evidence of anthropogenic contamination. However, the present study did not include dry-season sampling, which limits direct comparison with earlier investigations; future work will incorporate dry-season samples to address this limitation. To further distinguish specific human-derived sources, future work should include targeted sampling and geochemical characterization of livestock wastewater, agricultural drainage, and industrial, urban, and domestic effluents.

Author Contributions

Conceptualization, C.-H.C.; methodology, C.-H.C. and C.-F.Y.; validation, C.-H.C. and C.-F.Y.; investigation, C.-H.C., C.-F.Y. and T.-J.S.; writing—original draft preparation, C.-H.C.; writing—review and editing, C.-H.C. and C.-F.Y.; visualization, T.-J.S.; supervision, C.-F.Y. All authors have read and agreed to the published version of the manuscript.

Funding

This research was funded by National Science and Technology Council, R.O.C., grant number 110-116-M-006-008- to C.-F.Y.

Data Availability Statement

The original contributions presented in this study are included in the article. Further inquiries can be directed to the corresponding author.

Acknowledgments

We thank the reviewers and the editor provide us with constructive comments/suggestions in the earlier draft, which have improved this paper significantly.

Conflicts of Interest

The authors declare no conflicts of interest.

References

  1. Jin, K.; Lu, Y.; Zhang, Q.; Hu, Y.; Wu, Y.; Wan, D.; Hou, R. Stable Isotopes and Hydrochemical Characteristics of Surface Water in the Water-Level Fluctuation Zone of the Jinsha River Basin. J. Radioanal. Nucl. Chem. 2025, 334, 8067–8081. [Google Scholar] [CrossRef]
  2. Nan, Y.; Tian, F.; Hu, H.; Wang, L.; Zhao, S. Stable Isotope Composition of River Waters across the World. Water 2019, 11, 1760. [Google Scholar] [CrossRef]
  3. Zhou, J.; Liu, G.; Meng, Y.; Xia, C.; Chen, K.; Chen, Y. Using Stable Isotopes as Tracer to Investigate Hydrological Condition and Estimate Water Residence Time in a Plain Region, Chengdu, China. Sci. Rep. 2021, 11, 2812. [Google Scholar] [CrossRef] [PubMed]
  4. Martin, J.M.; Meybeck, M. Elemental Mass-Balance of Material Carried by Major World Rivers. Mar. Chem. 1979, 7, 173–206. [Google Scholar] [CrossRef]
  5. Stallard, R.F.; Edmond, J.M. Geochemistry of the Amazon: 1. Precipitation Chemistry and the Marine Contribution to the Dissolved Load at the Time of Peak Discharge. J. Geophys. Res. Ocean. 1981, 86, 9844–9858. [Google Scholar] [CrossRef]
  6. Meybeck, M. Global Chemical Weathering of Surficial Rocks Estimated from River Dissolved Loads. Am. J. Sci. 1987, 287, 401–428. [Google Scholar] [CrossRef]
  7. Négrel, P.; Allègre, C.J.; Dupré, B.; Lewin, E. Erosion Sources Determined by Inversion of Major and Trace Element Ratios and Strontium Isotopic Ratios in River: The Congo Basin Case. Earth Planet. Sci. Lett. 1993, 120, 59–76. [Google Scholar] [CrossRef]
  8. Blum, J.D.; Erel, Y.; Brown, K. 87Sr/86Sr Ratios of Sierra Nevada Stream Waters: Implications for Relative Mineral Weathering Rates. Geochim. Cosmochim. Acta 1993, 57, 5019–5025. [Google Scholar] [CrossRef]
  9. Probst, J.L.; Mortatti, J.; Tardy, Y. Carbon River Fluxes and Weathering CO2 Consumption in the Congo and Amazon River Basins. Appl. Geochem. 1994, 9, 1–13. [Google Scholar] [CrossRef]
  10. Elbaz-Poulichet, F.; Seyler, P.; Maurice-Bourgoin, L.; Guyot, J.L.; Dupuy, C. Trace Element Geochemistry in the Upper Amazon Drainage Basin (Bolivia). Chem. Geol. 1999, 157, 319–334. [Google Scholar] [CrossRef]
  11. Viers, J.; Dupré, B.; Braun, J.J.; Deberdt, S.; Angeletti, B.; Ngoupayou, J.N.; Michard, A. Major and Trace Element Abundances, and Strontium Isotopes in the Nyong Basin Rivers (Cameroon): Constraints on Chemical Weathering Processes and Elements Transport Mechanisms in Humid Tropical Environments. Chem. Geol. 2000, 169, 211–241. [Google Scholar] [CrossRef]
  12. Huang, K.M.; Lin, S. Consequences and Implication of Heavy Metal Spatial Variations in Sediments of the Keelung River Drainage Basin, Taiwan. Chemosphere 2003, 53, 1113–1121. [Google Scholar] [CrossRef]
  13. Santos, A.; Alonso, E.; Callejón, M.; Jiménez, J.C. Heavy Metal Content and Speciation in Groundwater of the Guadiamar River Basin. Chemosphere 2002, 48, 279–285. [Google Scholar] [CrossRef] [PubMed]
  14. Smolders, A.J.P.; Hudson-Edwards, K.A.; Van Der Velde, G.; Roelofs, J.G.M. Controls on Water Chemistry of the Pilcomayo River (Bolivia, South-America). Appl. Geochem. 2004, 19, 1745–1758. [Google Scholar] [CrossRef]
  15. Gault, A.G.; Cooke, D.R.; Townsend, A.T.; Charnock, J.M.; Polya, D.A. Mechanisms of Arsenic Attenuation in Acid Mine Drainage from Mount Bischoff, Western Tasmania. Sci. Total Environ. 2005, 345, 219–228. [Google Scholar] [CrossRef] [PubMed]
  16. Xie, Z.; Sun, L.; Zhang, P.; Zhao, S.; Yin, X.; Liu, X.; Cheng, B. Preliminary Geochemical Evidence of Groundwater Contamination in Coral Islands of Xi-Sha, South China Sea. Appl. Geochem. 2005, 20, 1848–1856. [Google Scholar] [CrossRef]
  17. Yuan, F.; Miyamoto, S. Dominant Processes Controlling Water Chemistry of the Pecos River in American Southwest. Geophys. Res. Lett. 2005, 32, L17406. [Google Scholar] [CrossRef]
  18. Gibbs, R.J. Mechanisms Controlling World Water Chemistry. Science 1970, 170, 1088–1090. [Google Scholar] [CrossRef]
  19. Li, Y.-H. Seasalt and Pollution Inputs over the Continental United States. Water Air Soil Pollut. 1992, 64, 561–573. [Google Scholar] [CrossRef]
  20. Öztürk, M. Trends of Trace Metal (Mn, Fe, Co, Ni, Cu, Zn, Cd and Pb) Distributions at the Oxic-Anoxic Interface and in Sulfidic Water of the Drammensfjord. Mar. Chem. 1995, 48, 329–342. [Google Scholar] [CrossRef]
  21. Edmond, J.M.; Palmer, M.R.; Measures, C.I.; Brown, E.T.; Huh, Y. Fluvial Geochemistry of the Eastern Slope of the Northeastern Andes and Its Foredeep in the Drainage of the Orinoco in Colombia and Venezuela. Geochim. Cosmochim. Acta 1996, 60, 2949–2974. [Google Scholar] [CrossRef]
  22. West, A.J.; Bickle, M.J.; Collins, R.; Brasington, J. Small-Catchment Perspective on Himalayan Weathering Fluxes. Geology 2002, 30, 355–358. [Google Scholar] [CrossRef]
  23. De Bièvre, P.J.; Debus, G.H. Absolute Isotope Ratio Determination of a Natural Boron Standard. Int. J. Mass Spectrom. Ion Phys. 1969, 2, 15–23. [Google Scholar] [CrossRef]
  24. Rosman, K.J.R.; Taylor, P.D.P. Isotopic Compositions of the Elements 1997 (Technical Report). Pure Appl. Chem. 1998, 70, 217–235. [Google Scholar] [CrossRef]
  25. Holden, N.E.; Brookhaven National Lab., Upton, NY (United States). The Atomic Weight and Isotopic Composition of Boron and Their Variation in Nature. In Proceedings of the 37 International Union of Pure and Applied Chemistry (IUPAC) Meeting, Lisbon, Portugal, 5–12 August 1993. [Google Scholar]
  26. Dickson, A.G. Thermodynamics of the Dissociation of Boric Acid in Synthetic Seawater from 273.15 to 318.15 K. Deep Sea Res. Part A Oceanogr. Res. Pap. 1990, 37, 755–766. [Google Scholar] [CrossRef]
  27. Foster, G.L.; Lécuyer, C.; Horst, R.; De Lyon, L.D.G.; Umr, C.; France, U. De Boron Stable Isotopes; Springer: Cham, Switzerland, 2016; pp. 1–6. [Google Scholar] [CrossRef]
  28. Hemming, N.G.; Hönisch, B. Chapter Seventeen Boron Isotopes in Marine Carbonate Sediments and the pH of the Ocean. In Proxies in Late Cenozoic Paleoceanography; Hillaire–Marcel, C., De Vernal, A., Eds.; Elsevier: Amsterdam, The Netherlands, 2007; Volume 1, pp. 717–734. ISBN 1572-5480. [Google Scholar]
  29. Hoefs, J. Stable Isotope Geochemistry; Springer: Cham, Switzerland, 2021. [Google Scholar]
  30. Barth, S. Boron Isotope Variations in Nature: A Synthesis. Geol. Rundsch. 1993, 82, 640–651. [Google Scholar] [CrossRef]
  31. Park, H.; Schlesinger, W.H. Global Biogeochemical Cycle of Boron. Glob. Biogeochem. Cycles 2002, 16, 11–20. [Google Scholar] [CrossRef]
  32. Liu, Y.C.; You, C.F.; Huang, K.F.; Wang, R.M.; Chung, C.H.; Liu, H.C. Boron Sources and Transport Mechanisms in River Waters Collected from Southwestern Taiwan: Isotopic Evidence. J. Asian Earth Sci. 2012, 58, 16–23. [Google Scholar] [CrossRef]
  33. Mao, H.-R.; Liu, C.-Q.; Zhao, Z.-Q. Source and Evolution of Dissolved Boron in Rivers: Insights from Boron Isotope Signatures of End-Members and Model of Boron Isotopes during Weathering Processes. Earth-Sci. Rev. 2019, 190, 439–459. [Google Scholar] [CrossRef]
  34. Veizer, J. Strontium Isotopes in Seawater through Time. Annu. Rev. Earth Planet. Sci. 1989, 17, 141–167. [Google Scholar] [CrossRef]
  35. Palmer, M.R.; Edmond, J.M. Controls over the Strontium Isotope Composition of River Water. Geochim. Cosmochim. Acta 1992, 56, 2099–2111. [Google Scholar] [CrossRef]
  36. Bain, D.C.; Bacon, J.R. Strontium Isotopes as Indicators of Mineral Weathering in Catchments. CATENA 1994, 22, 201–214. [Google Scholar] [CrossRef]
  37. Bullen, T.D.; Krabbenhoft, D.P.; Kendall, C. Kinetic and Mineralogic Controls on the Evolution of Groundwater Chemistry and 87Sr/86Sr in a Sandy Silicate Aquifer, Northern Wisconsin, USA. Geochim. Cosmochim. Acta 1996, 60, 1807–1821. [Google Scholar] [CrossRef]
  38. Grosbois, C.; Négrel, P.; Fouillac, C.; Grimaud, D. Dissolved Load of the Loire River: Chemical and Isotopic Characterization. Chem. Geol. 2000, 170, 179–201. [Google Scholar] [CrossRef]
  39. Basu, A.R.; Jacobsen, S.B.; Poreda, R.J.; Dowling, C.B.; Aggarwal, P.K. Large Groundwater Strontium Flux to the Oceans from the Bengal Basin and the Marine Strontium Isotope Record. Science 2001, 293, 1470–1473. [Google Scholar] [CrossRef]
  40. Rose, S.; Fullagar, P.D. Strontium Isotope Systematics of Base Flow in Piedmont Province Watersheds, Georgia (USA). Appl. Geochem. 2005, 20, 1571–1586. [Google Scholar] [CrossRef]
  41. Chung, C.H.; You, C.F.; Chu, H.Y. Weathering Sources in the Gaoping (Kaoping) River Catchments, Southwestern Taiwan: Insights from Major Elements, Sr Isotopes, and Rare Earth Elements. J. Mar. Syst. 2009, 76, 433–443. [Google Scholar] [CrossRef]
  42. Roy, S.; Gaillardet, J.; Allègre, C.J. Geochemistry of Dissolved and Suspended Loads of the Seine River, France: Anthropogenic Impact, Carbonate and Silicate Weathering. Geochim. Cosmochim. Acta 1999, 63, 1277–1292. [Google Scholar] [CrossRef]
  43. Chao, H.C.; You, C.F.; Wang, B.S.; Chung, C.H.; Huang, K.F. Boron Isotopic Composition of Mud Volcano Fluids: Implications for Fluid Migration in Shallow Subduction Zones. Earth Planet. Sci. Lett. 2011, 305, 32–44. [Google Scholar] [CrossRef]
  44. You, C.-F.; Gieskes, J.M.; Lee, T.; Yui, T.-F.; Chen, H.-W. Geochemistry of Mud Volcano Fluids in the Taiwan Accretionary Prism. Appl. Geochem. 2004, 19, 695–707. [Google Scholar] [CrossRef]
  45. Tu, Y.J.; You, C.F.; Kuo, T.Y. Source Identification of Zn in Erren River, Taiwan: An Application of Zn Isotopes. Chemosphere 2020, 248, 126044. [Google Scholar] [CrossRef]
  46. Chung, S.-L. Preliminary Geochemical and Isotopes Study of the Erren River Water. Master’s Thesis, National Cheng Kung University, Tainan, Taiwan, 2002. [Google Scholar]
  47. Lin, C. Explanatory Text of the Geologic Map of Taiwan: Qishan-Sheet; Central Geological Survey: Taipei, Taiwan, 2012; pp. 57–65. [Google Scholar]
  48. Chao, H.C.; You, C.F.; Liu, H.C.; Chung, C.H. The Origin and Migration of Mud Volcano Fluids in Taiwan: Evidence from Hydrogen, Oxygen, and Strontium Isotopic Compositions. Geochim. Cosmochim. Acta 2013, 114, 29–51. [Google Scholar] [CrossRef]
  49. Sun, C.-H.; Chang, S.-C.; Kuo, C.-L.; Wu, J.-C.; Shao, P.-H.; Oung, J.-N. Origins of Taiwan’s Mud Volcanoes: Evidence from Geochemistry. J. Asian Earth Sci. 2010, 37, 105–116. [Google Scholar] [CrossRef]
  50. Sung, Q.-C.; Chang, H.-C.; Liu, H.-C.; Chen, Y.-C. Mud Volcanoes along the Chishan Fault in Southwestern Taiwan: A Release Bend Model. Geomorphology 2010, 118, 188–198. [Google Scholar] [CrossRef]
  51. Galloway, J.N.; Likens, G.E.; Keene, W.C.; Miller, J.M. The Composition of Precipitation in Remote Areas of the World. J. Geophys. Res. Ocean. 1982, 87, 8771–8786. [Google Scholar] [CrossRef]
  52. Vet, R.; Artz, R.S.; Carou, S.; Shaw, M.; Ro, C.-U.; Aas, W.; Baker, A.; Bowersox, V.C.; Dentener, F.; Galy-Lacaux, C.; et al. A Global Assessment of Precipitation Chemistry and Deposition of Sulfur, Nitrogen, Sea Salt, Base Cations, Organic Acids, Acidity and PH, and Phosphorus. Atmos. Environ. 2014, 93, 3–100. [Google Scholar] [CrossRef]
  53. Likens, G.E.; Driscoll, C.T.; Buso, D.C. Long-Term Effects of Acid Rain: Response and Recovery of a Forest Ecosystem. Science 1996, 272, 244–246. [Google Scholar] [CrossRef]
  54. Gaillardet, J.; Dupré, B.; Louvat, P.; Allègre, C.J. Global Silicate Weathering and CO2 Consumption Rates Deduced from the Chemistry of Large Rivers. Chem. Geol. 1999, 159, 3–30. [Google Scholar] [CrossRef]
  55. Das, A.; Krishnaswami, S.; Sarin, M.M.; Pande, K. Chemical Weathering in the Krishna Basin and Western Ghats of the Deccan Traps, India: Rates of Basalt Weathering and Their Controls. Geochim. Cosmochim. Acta 2005, 69, 2067–2084. [Google Scholar] [CrossRef]
  56. Lemarchand, D.; Gaillardet, J.; Lewin; Allégre, C.J. The Influence of Rivers on Marine Boron Isotopes and Implications for Reconstructing Past Ocean PH. Nature 2000, 408, 951–954. [Google Scholar] [CrossRef]
  57. Chetelat, B.; Gaillardet, J. Boron Isotopes in the Seine River, France:  A Probe of Anthropogenic Contamination. Environ. Sci. Technol. 2005, 39, 2486–2493. [Google Scholar] [CrossRef]
  58. Moore, J.C.; Vrolijk, P. Fluids in Accretionary Prisms. Rev. Geophys. 1992, 30, 113–135. [Google Scholar] [CrossRef]
  59. Kopf, A.; Robertson, A.H.F.; Clennell, M.B.; Flecker, R. Mechanisms of Mud Extrusion on the Mediterranean Ridge Accretionary Complex. Geo-Mar. Lett. 1998, 18, 97–114. [Google Scholar] [CrossRef]
  60. Yassir, N.A. Mud Volcanoes and the Behaviour of Overpressured Clays and Silts. Ph.D. Thesis, University of London, London, UK, 1989. [Google Scholar]
  61. Lavrushin, V.Y.; Polyak, B.G.; Prasolov, R.M.; Kamenskii, I.L. Sources of Material in Mud Volcano Products. Lithol. Miner. Resour. 1996, 31, 557–578. [Google Scholar]
  62. Milkov, A. V Worldwide Distribution of Submarine Mud Volcanoes and Associated Gas Hydrates. Mar. Geol. 2000, 167, 29–42. [Google Scholar] [CrossRef]
  63. Joye, S.B.; MacDonald, I.R.; Montoya, J.P.; Peccini, M. Geophysical and Geochemical Signatures of Gulf of Mexico Seafloor Brines. Biogeosciences 2005, 2, 295–309. [Google Scholar] [CrossRef]
  64. Calmels, D.; Gaillardet, J.; Brenot, A.; France-Lanord, C. Sustained Sulfide Oxidation by Physical Erosion Processes in the Mackenzie River Basin: Climatic Perspectives. Geology 2007, 35, 1003–1006. [Google Scholar] [CrossRef]
  65. Li, S.-L.; Calmels, D.; Han, G.; Gaillardet, J.; Liu, C.-Q. Sulfuric Acid as an Agent of Carbonate Weathering Constrained by Δ13CDIC: Examples from Southwest China. Earth Planet. Sci. Lett. 2008, 270, 189–199. [Google Scholar] [CrossRef]
  66. Yuan, S.Y.; Chang, B. V Anaerobic Degradation of Five Polycyclic Aromatic Hydrocarbons from River Sediment in Taiwan. J. Environ. Sci. Health Part B 2007, 42, 63–69. [Google Scholar] [CrossRef]
  67. Marzo, A.; Silva, J.R.M.; Masi, F.; Rizzo, A.; Cirelli, G.L. A Review of the Full-Scale Constructed Wetlands for the Treatment and Management of Winery Wastewater. Curr. Opin. Environ. Sci. Health 2025, 48, 100680. [Google Scholar] [CrossRef]
  68. Vymazal, J. Constructed Wetlands for Wastewater Treatment: Five Decades of Experience. Environ. Sci. Technol. 2011, 45, 61–69. [Google Scholar] [CrossRef]
  69. Hydrological Yearbook of Taiwan: Republic of China (II) 2021; Ministry of Economic Affairs: Taipei, Taiwan, 2022; pp. 412–413.
  70. Berg, E.L. Handbook for Sampling and Sample Preservation of Water and Wastewater; U.S. Environmental Protection Agency, Office of Research and Development: Washington, DC, USA, 1992.
  71. Wang, B.S.; You, C.F.; Huang, K.F.; Wu, S.F.; Aggarwal, S.K.; Chung, C.H.; Lin, P.Y. Direct Separation of Boron from Na- and Ca-Rich Matrices by Sublimation for Stable Isotope Measurement by MC-ICP-MS. Talanta 2010, 82, 1378–1384. [Google Scholar] [CrossRef]
  72. Gaillardet, J.; Lemarchand, D.; Göpel, C.; Manhès, G. Evaporation and Sublimation of Boric Acid: Application for Boron Purification from Organic Rich Solutions. Geostand. Newsl. 2001, 25, 67–75. [Google Scholar] [CrossRef]
  73. Liu, H.C.; You, C.F.; Huang, K.F.; Chung, C.H. Precise Determination of Triple Sr Isotopes (δ 87Sr and δ 88Sr) Using MC-ICP-MS. Talanta 2012, 88, 338–344. [Google Scholar] [CrossRef]
  74. Xiao, J.; Lv, G.; Chai, N.; Hu, J.; Jin, Z. Hydrochemistry and Source Apportionment of Boron, Sulfate, and Nitrate in the Fen River, a Typical Loess Covered Area in the Eastern Chinese Loess Plateau. Environ. Res. 2022, 206, 112570. [Google Scholar] [CrossRef] [PubMed]
  75. Cheng, M.C.; You, C.F.; Lin, F.J.; Chung, C.H.; Huang, K.F. Seasonal Variation in Long-Range Transported Dust to a Subtropical Islet Offshore Northern Taiwan: Chemical Composition and Sr Isotopic Evidence in Rainwater. Atmos. Environ. 2010, 44, 3386–3393. [Google Scholar] [CrossRef]
  76. Foster, G.L.; Pogge von Strandmann, P.A.E.; Rae, J.W.B. Boron and Magnesium Isotopic Composition of Seawater. Geochem. Geophys. Geosystems 2010, 11, Q08015. [Google Scholar] [CrossRef]
  77. Rose, E.F.; Chaussidon, M.; France-Lanord, C. Fractionation of Boron Isotopes during Erosion Processes: The Example of Himalayan Rivers. Geochim. Cosmochim. Acta 2000, 64, 397–408. [Google Scholar] [CrossRef]
  78. Brand, W.A.; Coplen, T.; Vogl, J.; Rosner, M.; Prohaska, T. Assessment of International Reference Materials for Isotope-Ratio Analysis (IUPAC Technical Report). Pure Appl. Chem. 2014, 86, 425–467. [Google Scholar] [CrossRef]
  79. Horst Marschall, G.F. Boron Isotopes: The Fifth Element; Springer: Berlin/Heidelberg, Germany, 2018. [Google Scholar]
  80. Lin, Y.-P.; You, C.-F.; Kao, T.-Y.; Chung, C.-H.; Hung, C.-C.G. Boron Isotopic Analysis of Representative Atmospheric Aerosols Derived From Long-Range Transported/Local Emission on an Islet Offshore NE Taiwan. Front. Environ. Sci. 2021, 9, 230. [Google Scholar] [CrossRef]
  81. Peucker-Ehrenbrink, B.; Fiske, G.J. A Continental Perspective of the Seawater 87Sr/86Sr Record: A Review. Chem. Geol. 2019, 510, 140–165. [Google Scholar] [CrossRef]
  82. Liu, H.-C.; Li, M.-X.; You, C.-F.; Chen, Y.-H.; Huang, K.-F.; Chung, C.-H.; Lin, G.-W. Hydrology Controls Sulfuric Acid-Mediated Weathering in an Orogenic Regime of Southwestern Taiwan. Sci. Total Environ. 2024, 951, 175630. [Google Scholar] [CrossRef] [PubMed]
  83. Das, A.; Chung, C.H.; You, C.F. Disproportionately High Rates of Sulfide Oxidation from Mountainous River Basins of Taiwan Orogeny: Sulfur Isotope Evidence. Geophys. Res. Lett. 2012, 39, L12404. [Google Scholar] [CrossRef]
  84. Lin, C.-W.; Chang, W.-S.; Liu, S.-H.; Tsai, T.-T.; Lee, S.-P.; Tsang, Y.-C.; Shieh, C.-L.; Tseng, C.-M. Landslides Triggered by the 7 August 2009 Typhoon Morakot in Southern Taiwan. Eng. Geol. 2011, 123, 3–12. [Google Scholar] [CrossRef]
  85. Wu, C.-H.; Chen, S.-C.; Chou, H.-T. Geomorphologic Characteristics of Catastrophic Landslides during Typhoon Morakot in the Kaoping Watershed, Taiwan. Eng. Geol. 2011, 123, 13–21. [Google Scholar] [CrossRef]
  86. Sparkes, R.B.; Lin, I.-T.; Hovius, N.; Galy, A.; Liu, J.T.; Xu, X.; Yang, R. Redistribution of Multi-Phase Particulate Organic Carbon in a Marine Shelf and Canyon System during an Exceptional River Flood: Effects of Typhoon Morakot on the Gaoping River–Canyon System. Mar. Geol. 2015, 363, 191–201. [Google Scholar] [CrossRef]
  87. Ercolani, C.; Lemarchand, D.; Dosseto, A. Insights on Catchment-Wide Weathering Regimes from Boron Isotopes in Riverine Material. Geochim. Cosmochim. Acta 2019, 261, 35–55. [Google Scholar] [CrossRef]
Figure 1. Geological map and sample location in the ER catchment. Water samples were collected along geographical transects from the headwater to the estuary, as well as several major tributaries This geological map was created utilizing open data sourced from the Geological Survey and Mining Management Agency, Taiwan.
Water 18 00368 g001
Figure 2. The Piper diagram of the Erren River water samples illustrates distinct hydrochemical facies along the river course. Near the estuarine outlet, the samples are characterized by a sodium–chloride (Na–Cl)-type composition, whereas those collected from the middle-to-upper reaches predominantly exhibit a calcium–magnesium–bicarbonate (Ca–Mg–HCO3)-type signature [32,46].
Water 18 00368 g002
Figure 3. Correlation plots of (a) Ca/Na versus Sr/Na and (b) Ca/Na versus Mg/Na for the 2021 river water samples demonstrate robust linear relationships, indicating consistent geochemical associations among these elemental ratios.
Water 18 00368 g003
Figure 4. The (a) Ca/Na versus Mg/Na and (b) nss-Ca/nss-Na versus nss-Mg/nss-Na correlation plots of Erren River water samples reveal that, in addition to minor marine end-member input, the hydrochemistry is predominantly governed by silicate and carbonate weathering processes [32,46].
Water 18 00368 g004
Figure 5. Temporal variations in δ11B of Erren River water between 2010 and 2021 are presented. The 2021 δ11B measurements carry an analytical uncertainty of 0.5–0.7‰ (2SD) [32]. Asterisks denote samples collected from tributaries.
Water 18 00368 g005
Figure 6. The δ11B versus 1/B relationship plot of Erren River water highlights contrasting hydrochemical signatures along the river course. The estuarine sample (ER-1) is characterized by elevated δ11B and reduced 1/B, closely approximating seawater composition, while the upstream sample (ER-15) displays comparatively lower δ11B and higher 1/B. End-member references include industrial sources [32,33], chemical fertilizers and animal effluents [33], silicate weathering inputs [33,78,79], and atmospheric aerosols [80].
Water 18 00368 g006
Figure 7. δ11B versus Cl/Na (a), NO3/B (b), and Cl/B (c) in Erren River water samples [32].
Water 18 00368 g007
Figure 8. Variations in 87Sr/86Sr of Erren River water between 2021 (wet season) and 2001 (dry season) [46]. The 2021 87Sr/86Sr measurements carry an uncertainty of 0.000009–0.000111 (2SD). Asterisks denote tributary samples.
Water 18 00368 g008
Figure 9. (a) 87Sr/86Sr versus 1/Sr, (b) 87Sr/86Sr versus Ca/Na, and (c) 87Sr/86Sr versus Sr/Na in Erren River water samples. Circles represent samples collected in 2021 during the wet season, while triangles denote samples from 2001 during the dry season [46].
Water 18 00368 g009
Figure 10. Relationship between 87Sr/86Sr and δ11B in Erren River water. The isotopic compositions are influenced by three primary end-members: (1) seawater/salt spray characterized by low 87Sr/86Sr and high δ11B, (2) silicate weathering with high 87Sr/86Sr and low δ11B, and (3) variations in carbonate versus silicate weathering contributions combined with boron isotope fractionation induced by water–rock interactions.
Water 18 00368 g010
Table 1. Overview of Sampling Locations for Erren River Water Samples.
Sampling SiteCoordinatesElevation (m)Distance from Coastline (km)Average Flow of Dry Season (m3/s)Average Flow of Wet Season (m3/s)
Downstream ER122.9144N120.1773E10.55
ER222.9182N120.1844E21.35
ER322.9254N120.1913E42.65
ER422.9143N120.2251E46.18
ER522.9174N120.2322E46.85
MidstreamER622.9006N120.3103E619.2
ER722.9044N120.3216E1023.1
ER822.8893N120.3383E1124.412.73112.2
ER922.8899N120.3544E2126.5
ER1022.8758N120.3621E1629.69.0989.42
UpstreamER1122.8653N120.3761E2231.5
ER1222.9714N120.3742E2132.8
ER1322.8880N120.3964E2237.1
ER1422.9167N120.4605E5953.8
ER1522.9748N120.4655E8062.6
Notes: 1. “–” denotes missing data. 2. Dry season: November–April; Wet season: May–October. 3. Discharge data sourced from Hydrological Yearbook of Taiwan (II), 2021 [69].
Table 2. Concentrations of major anions and cations in the Erren River water samples.
2021pHTemp.CINO3PO43−SO42−NaKMgCa
°CmMmMμMmMmMmMmMmM
ER157.9529.80.090.03-0.250.290.080.450.87
ER148.0526.40.130.03-0.350.410.090.460.72
ER137.8927.00.390.04-0.780.930.110.670.95
ER127.8727.10.490.05-0.860.930.100.560.75
ER117.9227.30.690.05-0.871.270.140.701.03
ER107.7732.70.570.05-0.941.430.130.740.97
ER97.9526.60.440.03-0.690.880.120.610.77
ER87.9527.11.020.05-1.222.200.140.760.90
ER77.6427.30.320.1310.720.410.400.140.400.72
ER67.8827.20.970.06-1.252.130.140.770.92
ER57.3927.60.660.067.960.150.540.120.170.37
ER47.7725.00.640.05-0.710.840.140.570.88
ER37.5428.00.500.04-0.170.470.100.170.40
ER27.8727.80.790.07-0.430.790.130.420.75
ER17.8227.79.820.06-0.928.640.331.580.96
Note: The symbol “-” denotes concentrations below the analytical method detection limit.
Table 3. Boron isotopic composition (δ11B) and strontium isotopic ratios (87Sr/86Sr) of Erren River water samples.
2021δ11B (‰)2SD87Sr/86Sr2SD
ER1513.50.50.7098550.000022
ER1415.00.60.7100650.000043
ER1318.80.60.7101550.000042
ER1218.70.50.7102440.000027
ER1121.00.70.7100200.000027
ER1019.20.50.7102230.000020
ER913.50.60.7102420.000030
ER823.20.60.7101420.000031
ER74.80.70.7104460.000032
ER623.20.70.7100940.000012
ER511.00.60.7102700.000017
ER413.70.50.7101620.000027
ER36.80.70.7099670.000026
ER216.40.70.7100550.000048
ER130.40.60.7096790.000023
Disclaimer/Publisher’s Note: The statements, opinions and data contained in all publications are solely those of the individual author(s) and contributor(s) and not of MDPI and/or the editor(s). MDPI and/or the editor(s) disclaim responsibility for any injury to people or property resulting from any ideas, methods, instructions or products referred to in the content.