Article

Complexity of Hydroclimatic Changes in the Mediterranean: Exploring Climate Drivers Using ERA5 Reanalysis


by
Theano Iliopoulou
*,
Marianna Lada
,
Christina-Ioanna Stavropoulou
,
Dimitra-Myrto Tourlaki
,
Nikos Tepetidis
,
Panayiotis Dimitriadis
and
Demetris Koutsoyiannis
Department of Water Resources and Environmental Engineering, School of Civil Engineering, National Technical University of Athens, 157 72 Zographou, Greece
*
Author to whom correspondence should be addressed.
The authors contributed equally to this work.
Water 2026, 18(3), 331; https://doi.org/10.3390/w18030331
Submission received: 28 November 2025 / Revised: 14 January 2026 / Accepted: 21 January 2026 / Published: 29 January 2026
(This article belongs to the Section Water and Climate Change)

Abstract

The Mediterranean region has experienced pronounced hydroclimatic variability over recent decades, motivating a closer examination of the physical processes underlying these changes. This study analyzes ERA5 reanalysis data for 1950–2024 to investigate long-term trends and interrelations among temperature, precipitation, evaporation, wind, sensible heat, and column water, distinguishing between land and sea domains and multiple atmospheric layers. Results show a strong warming signal in the lower troposphere, with temperatures increasing by 0.03 °C year−1 over land and 0.015 °C year−1 over sea, and near-stagnancy in the upper troposphere, which indicates a steepening lapse rate. Unlike temperature, evaporation shows no strong long-term increase: over sea, it rises only slightly, and over land, it declines modestly, with both weak tendencies dominated by strong interannual variability and consistent with declining winds. Over land, sensible heat flux increases, while over the sea, it decreases, revealing divergent energy-partition regimes. Precipitation exhibits no significant long-term change, suggesting that the atmosphere has become warmer and slightly moister but less effective in converting vapor into rainfall. Correlation analyses indicate that wind speed exerts a stronger control on evaporation and precipitation than temperature across the whole region. The Hurst–Kolmogorov stochastic framework further reveals persistent long-term variability in Mediterranean hydroclimatic processes, underscoring that the region’s climate behavior is shaped by dynamic and complex interactions rather than by temperature trends alone.

1. Introduction

The Mediterranean region has been widely characterized as a “climate change hotspot”, following Giorgi [1] and subsequent IPCC assessments [2]. This designation reflects climate model projections indicating amplified regional sensitivity to global warming, hydrological-cycle intensification, and widespread drying [3]. Observational data, however, confirm the regional warming trend, but indicate a more complex hydroclimatic response, with long-term precipitation remaining relatively stable and deviating from model-projected drying [4,5].
Understanding Mediterranean climate dynamics—including the discrepancies between projected and observed hydroclimatic signals—is particularly important in a region spanning diverse climatic regimes and socioeconomic settings. Recent flood, drought, and cyclone events highlight that regional climate risks emerge from complex interactions among sea surface conditions, atmospheric circulation, and moisture availability [6,7,8,9,10,11]. This reinforces the need to examine Mediterranean climate variability across spatial domains and atmospheric variables governing the hydrological cycle. Advances in reanalysis and satellite-based observing systems now enable consistent, long-term examination of climate variables across both land and sea. High-resolution reanalysis products such as ERA5 are particularly useful in the Mediterranean, where sparse in situ measurements have historically limited basin-wide climate assessment [12,13]. By providing temporally continuous and spatially complete information, these datasets help address observational discontinuities and support integrated analyses of regional hydroclimatic variability. Recent ERA5-based studies have documented notable changes in components of the global and Mediterranean water cycle, including shifts in precipitation, evaporation, and runoff [14,15,16,17].
Despite extensive research on Mediterranean climatic changes, the spatial coherence and interdependence between atmospheric and surface processes across the land–sea interface remain insufficiently quantified. The roles of large-scale atmospheric circulation, surface temperature trends, and precipitation variability have been examined [4,5,18,19,20], and recent studies have also begun to analyze the Mediterranean moisture and energy budgets, air–sea fluxes, and land evaporation using modern reanalysis and satellite-informed products [14,21]. However, most existing analyses address individual components of the water or energy budget, or focus on specific sub-domains (e.g., the sea surface or single atmospheric levels), rather than examining the joint co-variability of circulation, thermodynamic variables, and surface fluxes across both land and sea. As a result, our understanding of how interconnected hydroclimatic processes—and their land and sea components—collectively respond to regional warming remains incomplete.
The present study addresses this gap by using the ERA5 reanalysis dataset for 1950–2024 to systematically examine the co-variability of temperature, precipitation, evaporation, sensible heat, column water, and wind variables across the Mediterranean. The analysis distinguishes between land and sea domains, evaluates the vertical temperature structure—particularly the lapse rate—and characterizes long-term variability using the Hurst–Kolmogorov stochastic framework [22].
This study addresses the following research questions:
  • Q1: How have key hydroclimatic variables evolved over land, sea, and the integrated Mediterranean domain during 1950–2024, and to what extent do their patterns of change exhibit synchronization or divergence across the region?
  • Q2: How has the vertical temperature structure of the Mediterranean atmosphere evolved during 1950–2024, and what does the resulting change in the lapse rate reveal about the distribution of warming across atmospheric layers?
  • Q3: To what extent do Mediterranean hydroclimatic processes exhibit long-term persistence, and how does the Hurst–Kolmogorov framework characterize their temporal variability beyond deterministic trends?
The results highlight the complexity of the Mediterranean climate system, in which warming, moisture accumulation, and energy partitioning do not evolve uniformly or linearly. By revealing both dominant patterns and counterintuitive behaviors, this study offers new insights into the coupled dynamics of the Mediterranean climate system and the challenges they pose for process representation in models.

2. Data

Reanalysis datasets are essential in atmospheric science, providing a unified and detailed view of atmospheric conditions by integrating large amounts of observational data into weather prediction models. In the present study, the data processing was performed using the Climate Explorer (Climexp) platform [23], developed and maintained by the Royal Netherlands Meteorological Institute (Koninklijk Nederlands Meteorologisch Instituut—KNMI). Climexp is a versatile system that provides access to a wide range of datasets, including most of those employed in this analysis, as well as station-based observational data. The platform supports various processing capabilities such as temporal averaging, geographical aggregation using predefined or custom-defined spatial masks (polygons defined by coordinate points), computation of zonal means, and generation of time series along with associated statistical analyses and visualizations.
For the purposes of this research, monthly reanalysis data from the ERA5 dataset were used. ERA5 is the fifth generation of reanalysis produced by the European Centre for Medium-Range Weather Forecasts (ECMWF), and represents a substantial advancement over its previous version, ERA-Interim, particularly in terms of spatial and temporal resolution. It offers a horizontal resolution of approximately 31 km and an hourly temporal resolution, with 137 vertical levels extending up to 0.01 hPa. These refinements allow for a more accurate representation of atmospheric dynamics, especially in the troposphere. Furthermore, the inclusion of an extensive set of Essential Climate Variables (ECVs) in ERA5 constitutes a critical asset for scientific analysis and improved understanding of the climate system.
An important feature of ERA5 is its ensemble data assimilation system, which enables the quantification of uncertainty in the reanalysis fields. Additionally, the latency of ERA5 data is reduced to approximately five days, facilitating near real-time climate monitoring while maintaining a high level of data fidelity. Improvements in surface boundary conditions are achieved through the use of more homogeneous sea surface temperature and sea ice concentration datasets [24].
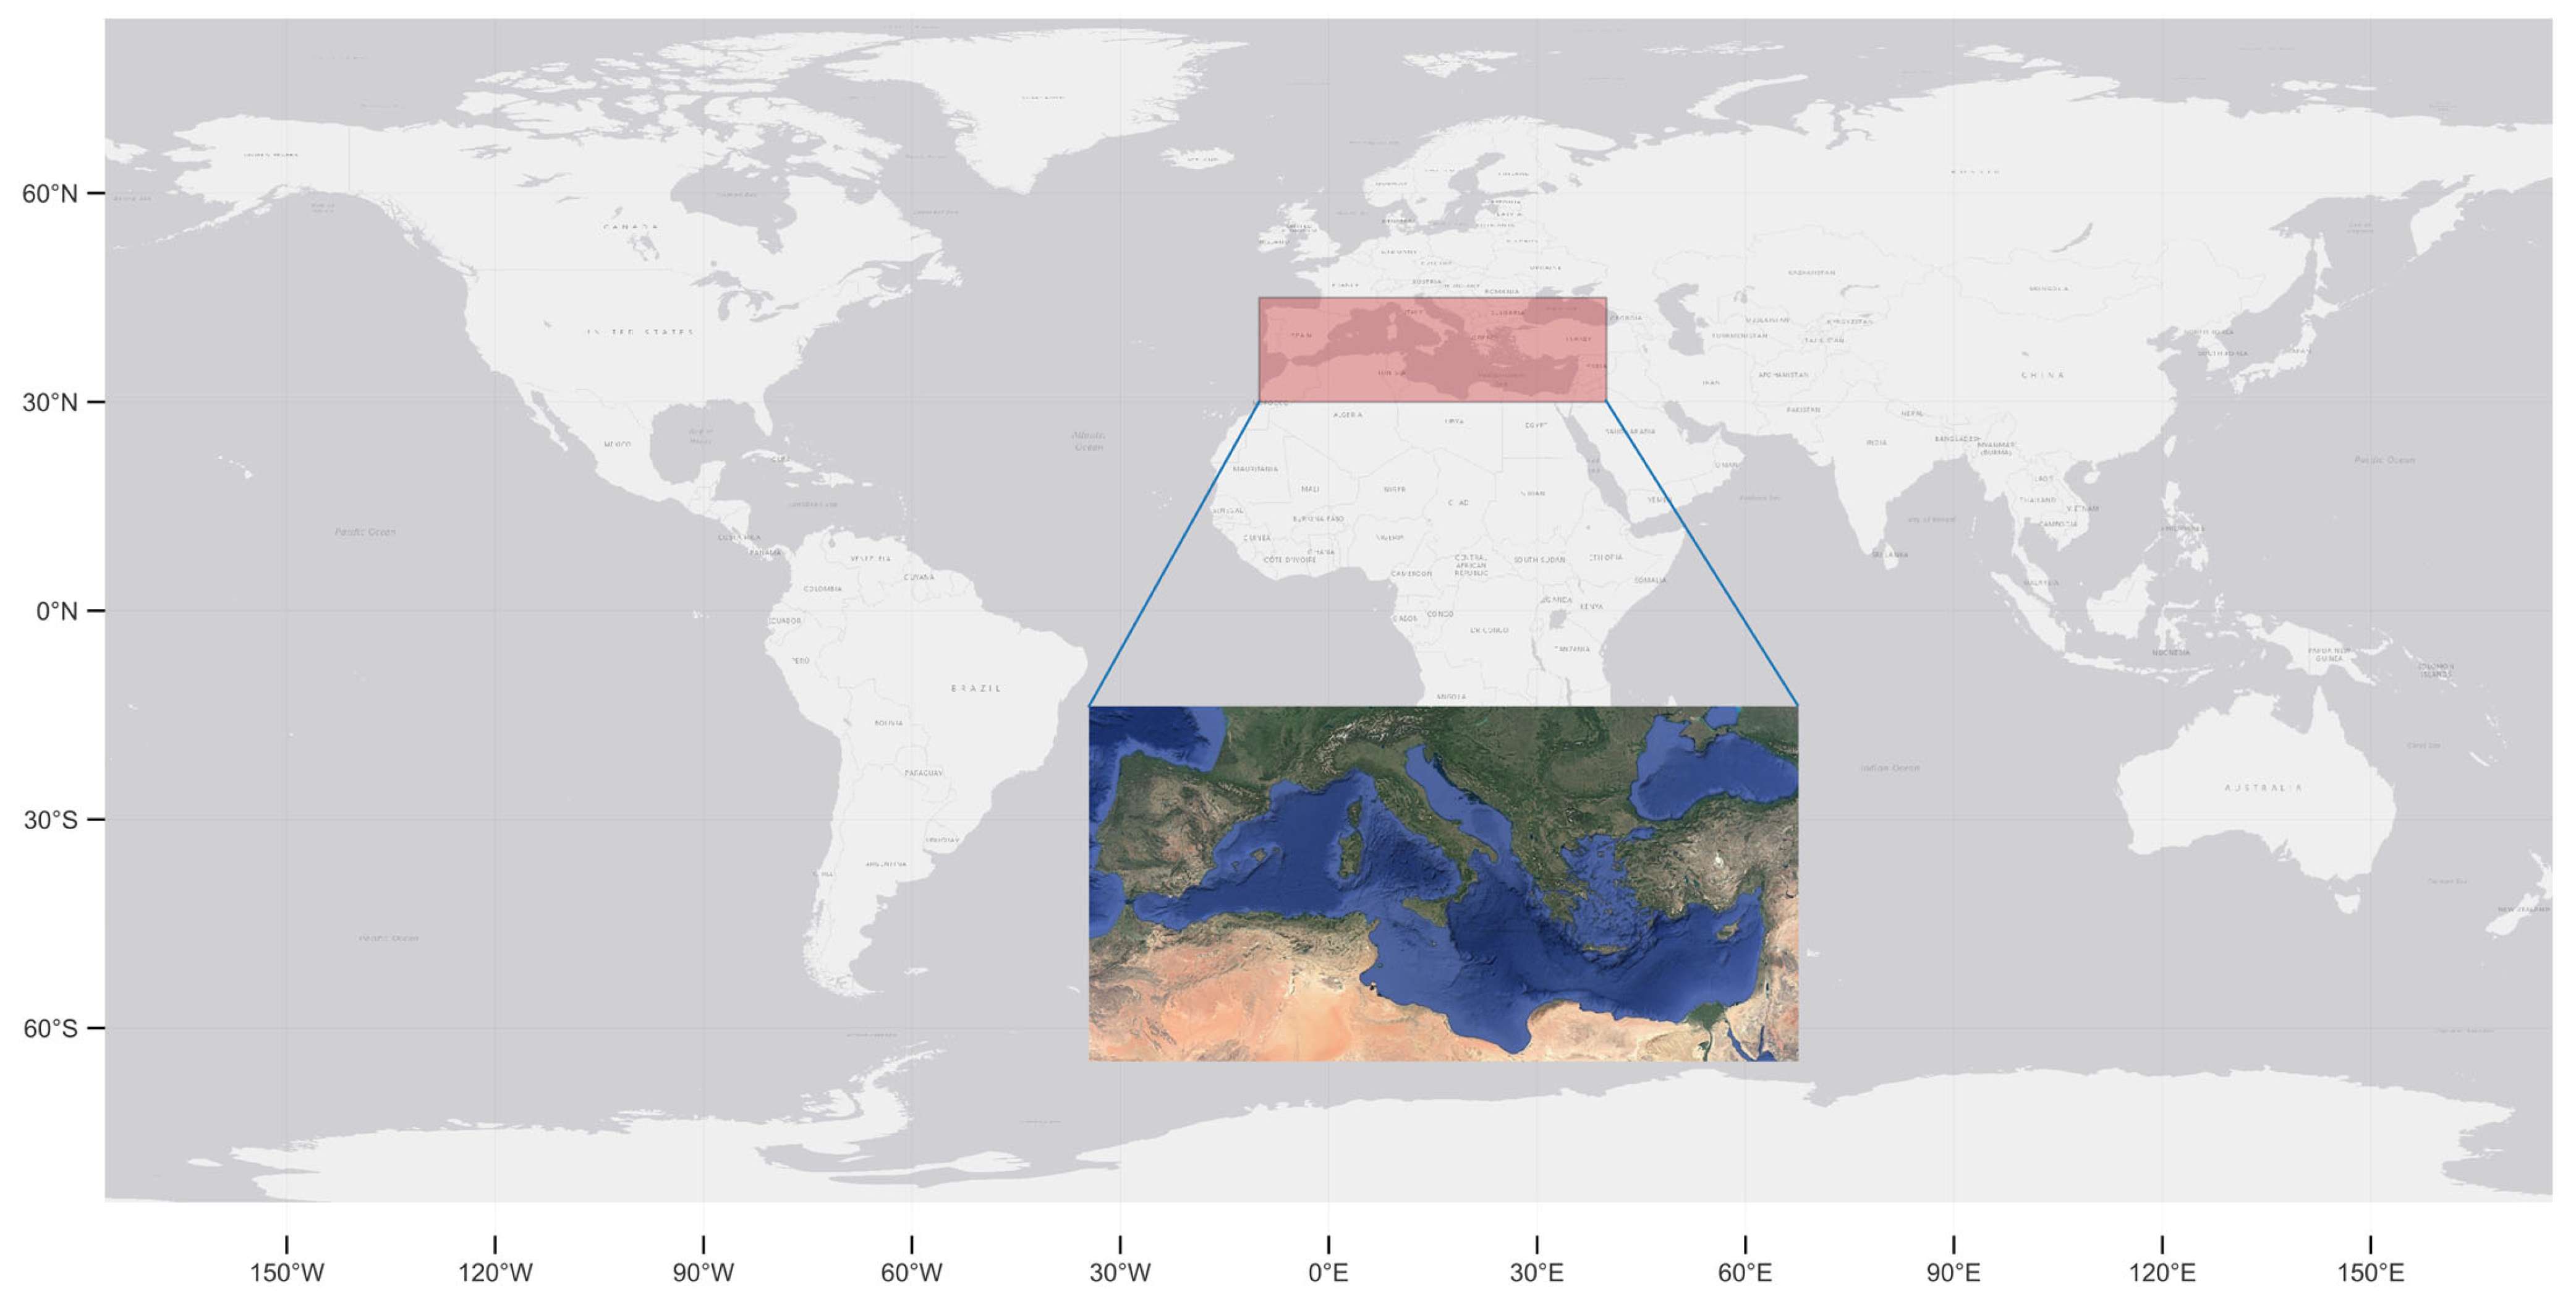
The study area focuses on the Mediterranean region (Figure 1). The mask (MED) employed in the analysis was obtained from Climexp [23], specifically from the standard dataset corresponding to the 27 IPCC SREX regions. The analysis was performed using two spatial configurations: (a) a unified Mediterranean mask encompassing both land and sea areas, and (b) a domain separation in which land and sea regions were examined independently.

3. Methodology

3.1. Climate Variables

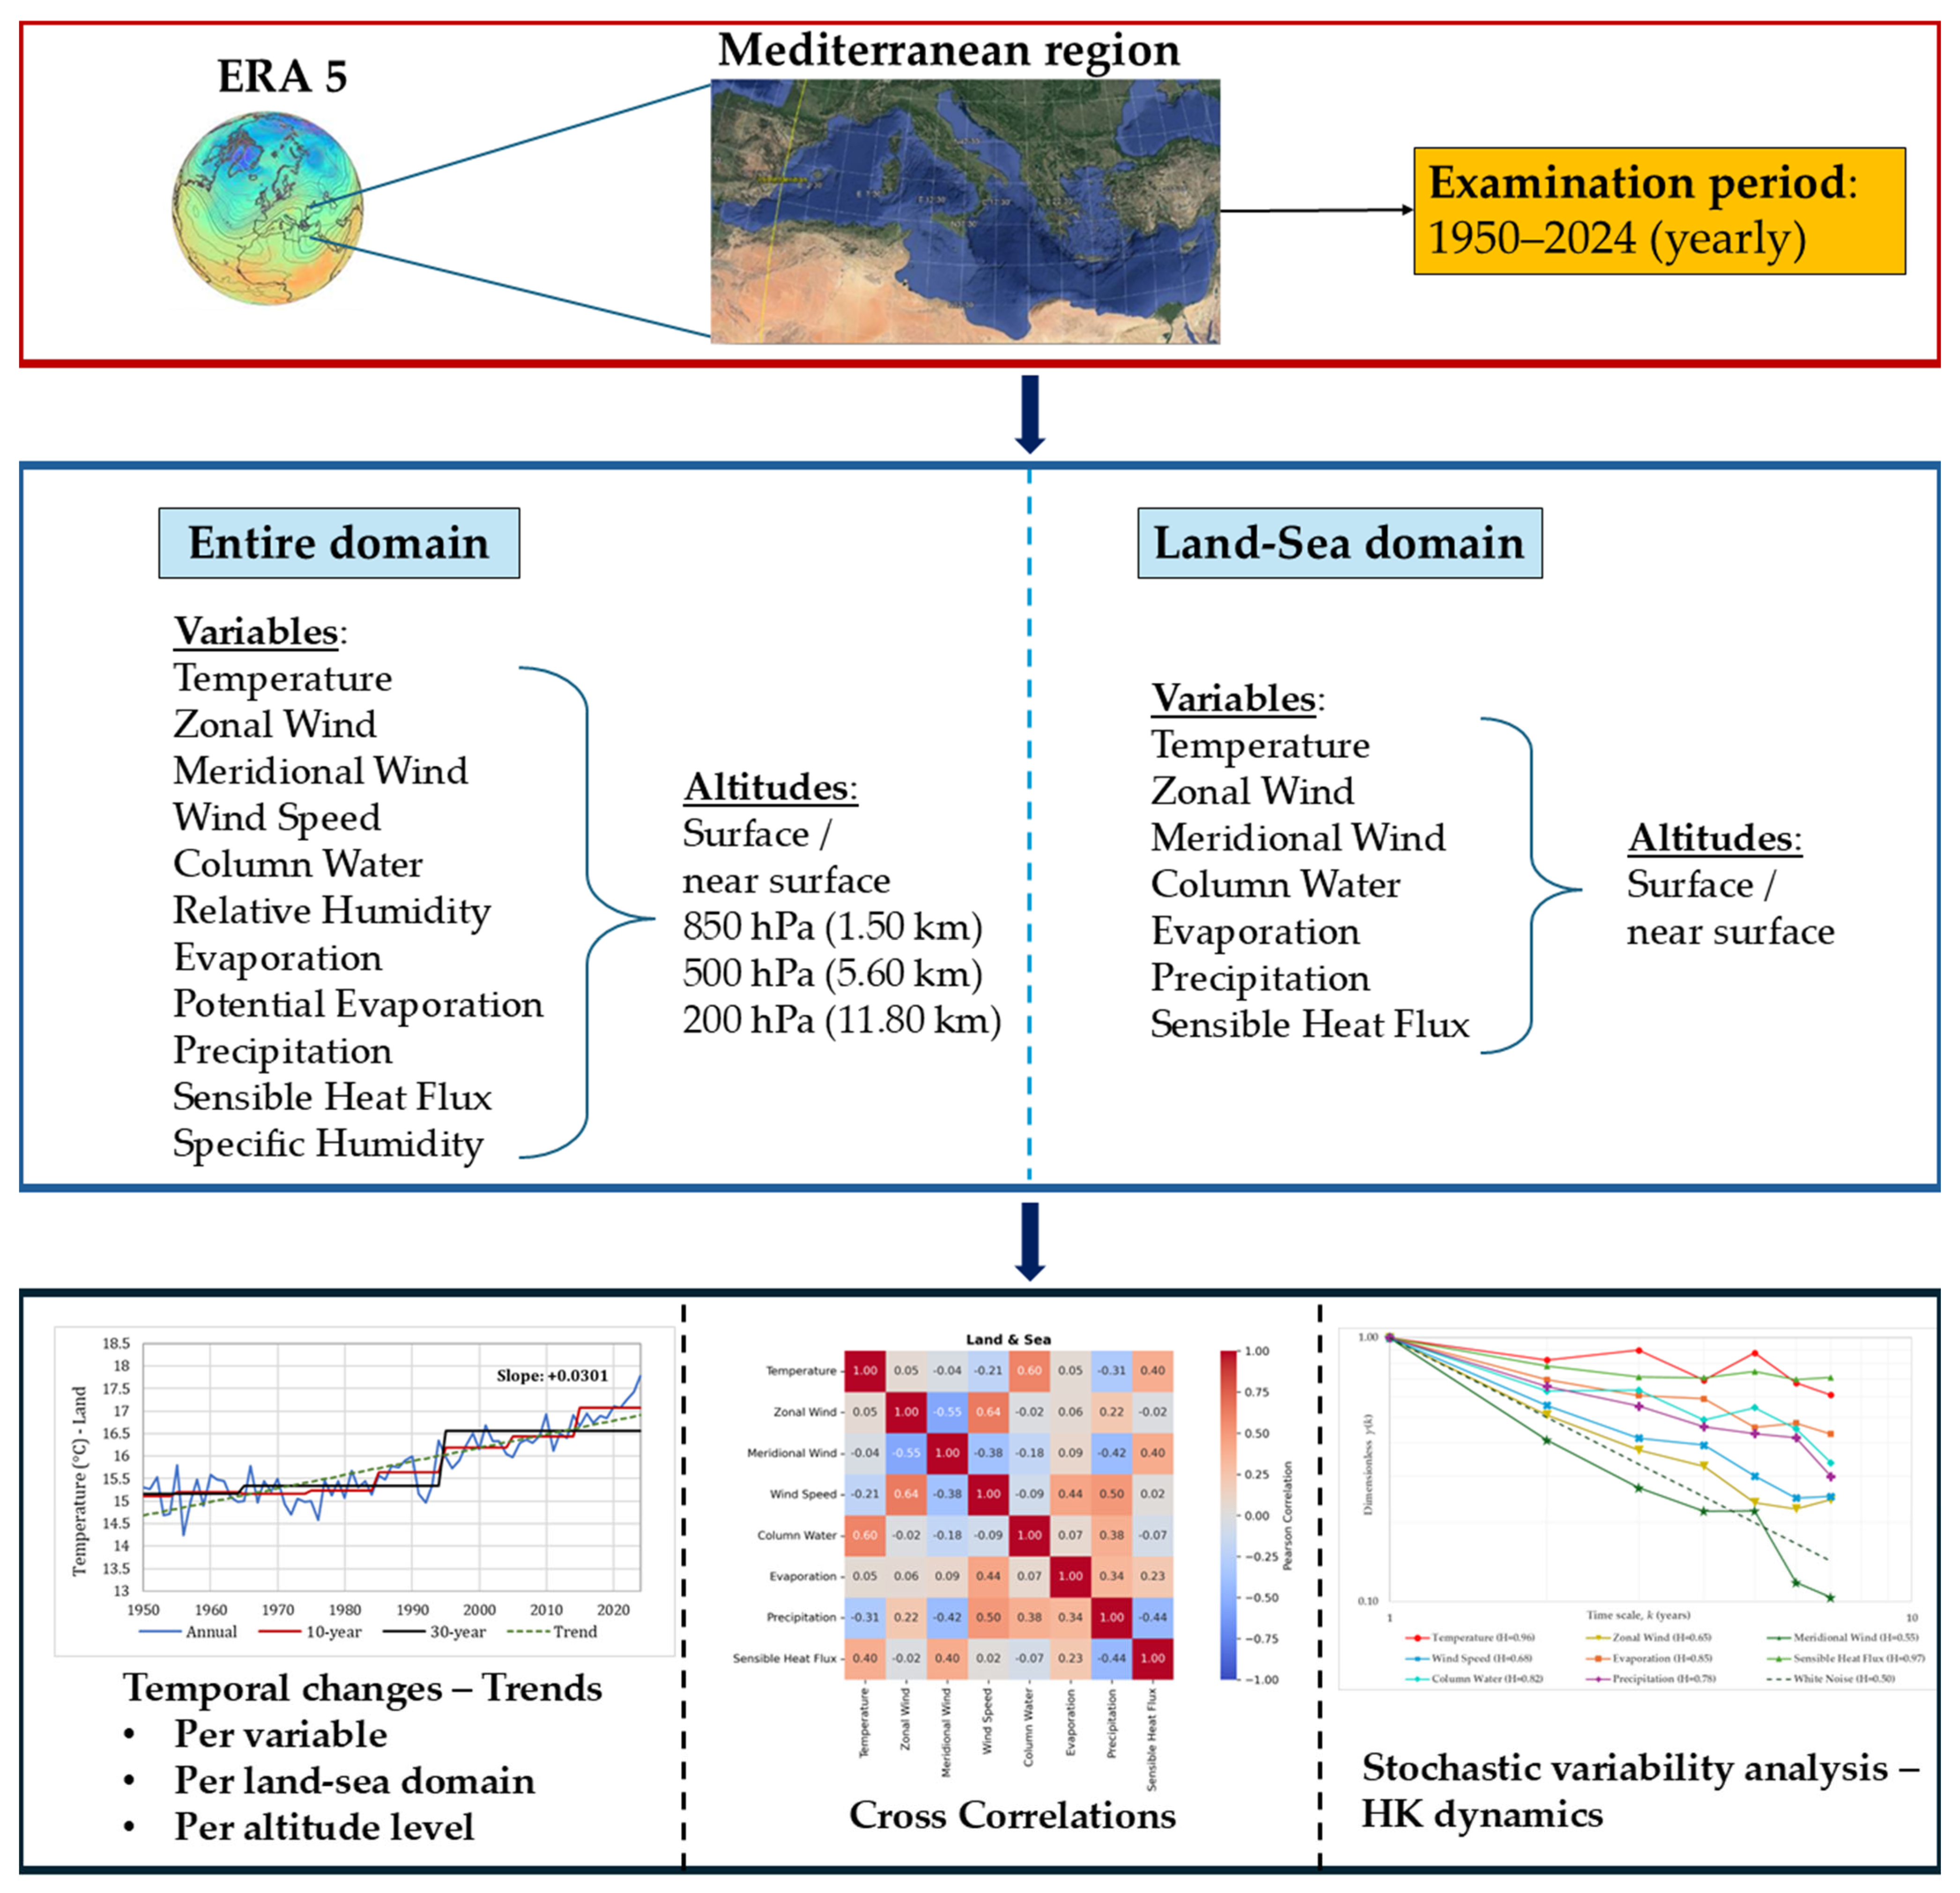
Monthly mean timeseries were collected for each ERA5 variable from 1950 to 2024 and then converted to annual means for the same period. The timeseries were processed through two complementary spatial analyses. The first applied a unified spatial mask to the entire region, while the second distinguished between land and sea domains to capture surface-specific dynamics. In the first case, the variables were examined at multiple atmospheric levels to explore vertical structure, whereas in the second, only the surface layer was studied. The analyses focus on assessment of (co-)variability through (i) exploratory visualization of yearly timeseries along with their decadal and climatic means, (ii) estimation of linear trend slopes and standardized slopes, (iii) correlation assessments to identify synchronization and co-variability among variables, and (iv) a stochastic evaluation of temporal variability. The overall methodology applied in this study is summarized in Figure 2.
In the unified Mediterranean mask, the climate variables examined are listed in Table 1, corresponding to the relevant vertical classifications. Variables considered at the surface level were total column water (vertically integrated), precipitation, sensible and latent heat flux, and evaporation (which, in the case of the land domain, includes evapotranspiration as well). Variables at the 2–10 m level above the land surface (called ‘near-surface’ here) included temperature at 2 m, wind speed as well as zonal and meridional wind components at 10 m. To ensure comparability across variables in the correlation and trend assessments, the surface level and 2–10 m level above the surface were treated as representing approximately the same elevation. Relative and specific humidity timeseries were available only at higher atmospheric levels and were therefore not included in the main analysis. However, for completeness, the corresponding results at 850 hPa are provided in Appendix A.
To evaluate vertical gradients in temperature, geopotential heights must be estimated from pressure levels. For this purpose, we use the standard hypsometric relationships to convert pressure to altitude [25]. For altitudes z ≤ 11,000 m, the following equation (Equation (1)) was applied:
p = 1013.25   1 2.256 × 10 5 z 5.256 z   = 44,332 1 p 1013.25 0.19025
For altitudes in the range 11,000 m ≤ z ≤ 20,000 m, Equation (2) was applied:
p   = 226.27   e 0.00015769 z     11,000 z = 11,000 + 6341.6   l n 226.27 p
where the units of measurement are hPa for pressure (p) and m for altitude (z).
ERA5 defines the zonal wind component (u) as positive for westerly flow (west-to-east) and negative for easterly flow, while the meridional component (v) is positive for southerlies and negative for northerlies. For the land–sea temporal analyses and the cross-correlation analyses, we focus on the strength rather than the direction of the flow and therefore use the absolute values of the wind components (or the wind-speed magnitude). The signed components are retained only in the vertical-structure analysis (Section 4.2.1), where wind direction varies with altitude. In these timeseries, the annual mean values change sign across different years and altitude levels, and therefore the sign cannot be omitted without losing physically meaningful directional information. ERA5 does not provide wind speed separately for land and sea; therefore, only wind components are used for land–sea comparisons.
Latent heat flux is directly proportional to evaporation through the following equation:
Λ = λ   Ε
where Λ (W/m2) describes the surface latent heat flux, Ε is the evaporation (kg m−2 s−1 equivalent to mm/d), and λ (J/kg) is the latent heat of vaporization, which is calculated as λ = 3.139 × 10⁶ − 2.336 Ts, with Ts the temperature on the surface of water in K [25]. Because latent heat flux and evaporation differ only by a multiplicative, temperature-dependent conversion factor, their spatiotemporal behavior is effectively identical. Therefore, in the following analyses, only evaporation is shown, as it fully reflects the variations present in both variables. ERA5 denotes both fluxes (latent and sensible heat) by a negative sign convention, which is herein removed to avoid confusion.

3.2. Temporal Trends and Cross-Correlations

Temporal trends and inter-variable relationships were assessed to explore temporal patterns across the Mediterranean domain. For each variable and spatial configuration, linear trends were estimated using ordinary least squares (OLS) regression and analyzed to detect regional contrasts between land and sea and across atmospheric levels. It is noted that linear trends are used solely as descriptive indicators of the direction of co-variability. We do not evaluate trend significance, because classical tests are not valid when the underlying processes exhibit autocorrelation or long-term persistence [22,26,27]. Although several modified procedures exist that attempt to adjust for autocorrelation or even for long-term persistence effects [28], they do not resolve the conceptual difficulty of separating deterministic and stochastic components in persistent hydroclimatic processes [29]. As a result, significance testing becomes both statistically and conceptually compromised. In this context, trends are interpreted only as exploratory diagnostic measures and not as evidence of causality or as a basis for projection. In addition to absolute slopes, we compute standardized slopes by dividing the linear trend β by the standard deviation σ of each variable’s annual series. The resulting index has units of inverse time (year−1) and quantifies the rate of change relative to the variable’s natural variability, i.e., in standard deviations per year. This standardized measure enables direct comparison among variables with different magnitudes and units and frames the trend component relative to the process’s natural variability [28,30,31].
To quantify the degree of association between climatic variables, the Pearson correlation coefficient was employed which expresses the strength and direction of linear dependence. Correlations were calculated for the surface level to examine the coupling among temperature, humidity, and energy fluxes, and to evaluate whether co-variations are consistent with the observed long-term trends. All correlations are computed on the raw annual timeseries. No detrending is applied, as detrending would require assuming a specific deterministic structure for the underlying hydroclimatic processes, which is not justified in this context. As with the trend diagnostics, we do not assess the statistical significance of correlations or apply masking. Classical significance tests are not valid under autocorrelation or long-term persistence. Moreover, recent findings show that long-term persistence can inflate cross-correlation even between independent processes, making significance thresholds statistically unreliable [32]. Correlation coefficients are therefore interpreted solely as descriptive measures of co-variability.

3.3. Stochastic Variability Analysis

To complement the trend and correlation analyses, we investigate the stochastic structure of climatic variability using the Hurst–Kolmogorov (HK) framework, which characterizes the temporal scale dependence of variance [22]. Whereas linear trends imply a deterministic description of change at a single timescale, the HK approach offers a multi-scale stochastic perspective that reveals how variability evolves across broader temporal horizons. This distinction is particularly important for hydroclimatic processes, which often exhibit pronounced multi-scale fluctuations and persistence. The HK framework provides a simple and intuitive way to detect such persistence and to distinguish pure randomness (white-noise behavior) from scale-dependent clustering and enhanced structured variability.
Let x 1 , x 2 , , x n denote a timeseries of length n (e.g., representing annual mean temperature or precipitation). The sample variance at the base timescale (one year here) is γ ( 1 ) . To examine how variability evolves over longer timescales, we form block-averaged series at increasing timescales k . For example, for k = 2,
x 1 2 x 1 + x 2 2 ,         x 2 2   x 3 + x 4 2 ,         ,     x n / 2 2   x n 1 + x n 2
and, in general, x j ( k ) represents averages of non-overlapping k -year blocks. The variance of each aggregated series, γ(k), reflects the process variability at that timescale. To ensure robustness of the variance estimation at each scale, aggregation is carried out only up to a maximum temporal scale k m a x such that at least ten block-averaged values remain for estimating the variance at that scale.
The logarithmic plot of the variance γ(k) vs. scale k yields the climacogram, a useful tool to characterize multi-scale variability. The climacogram typically exhibits lower statistical uncertainty than traditional estimators of autocovariance or power spectrum when assessing second-order dependence, making it well-suited for hydroclimatic analysis [33].
If the process were purely random (white noise), the classical statistical law applies:
γ k   =   γ 1 k
which yields a straight line of slope −1. However, natural climatic and hydrological processes rarely follow this behavior. Instead, they often exhibit long-term persistence, meaning that the variability in the averaged process decreases more slowly with increasing timescale. This behavior is described by the Hurst–Kolmogorov scaling law [22]:
γ k = γ 1 k 2 2 H
where the H parameter quantifies the degree of long-term persistence:
  • H = 0.5 : purely random process (no persistence);
  • 0.5 < H < 1 : long-term persistence or clustering of similar values;
  • H < 0.5 : antipersistence, with alternating high–low patterns.
Higher H values imply greater variability and uncertainty at large timescales, also reflecting enhanced entropy production and stronger low-frequency fluctuations [22].
For finite-length series, the estimation of the climacogram is affected by bias, approximately equal to γ ( n ) , where n is the sample size. Therefore, the fitting of the theoretical HK model to the empirical climacogram should account for this bias, minimizing the deviation between the bias-corrected model and the observed data, with the optimum fit found to be for scales up to approximately 10% of the timeseries length [33].
This method allows us to quantify the stochastic structure of climatic variability and identify whether ERA5-derived hydroclimatic variables exhibit long-term persistence (H > 0.5) or approximate randomness (H ≈ 0.5). This offers a complementary stochastic view of multi-decadal variability that contextualizes apparent long-term changes within the intrinsic persistence characteristics of the process.

4. Results

4.1. Land–Sea Comparison

Results regarding the separate land–sea analysis are presented first as distinguishing these two domains helps reveal the contrasting thermodynamic and hydrological responses that govern Mediterranean climate variability. The land–sea distinction is central because the two surfaces differ fundamentally in heat capacity, moisture availability, and response timescales to atmospheric forcing. Land warms and cools rapidly and has limited moisture storage, whereas the sea acts as a slow-response thermal and moisture reservoir that buffers temperature variability and sustains evaporation. These physical contrasts strongly shape the magnitude, pace, and co-variability of long-term changes, motivating their separate examination in the subsequent analyses.

4.1.1. Temporal Changes per Domain

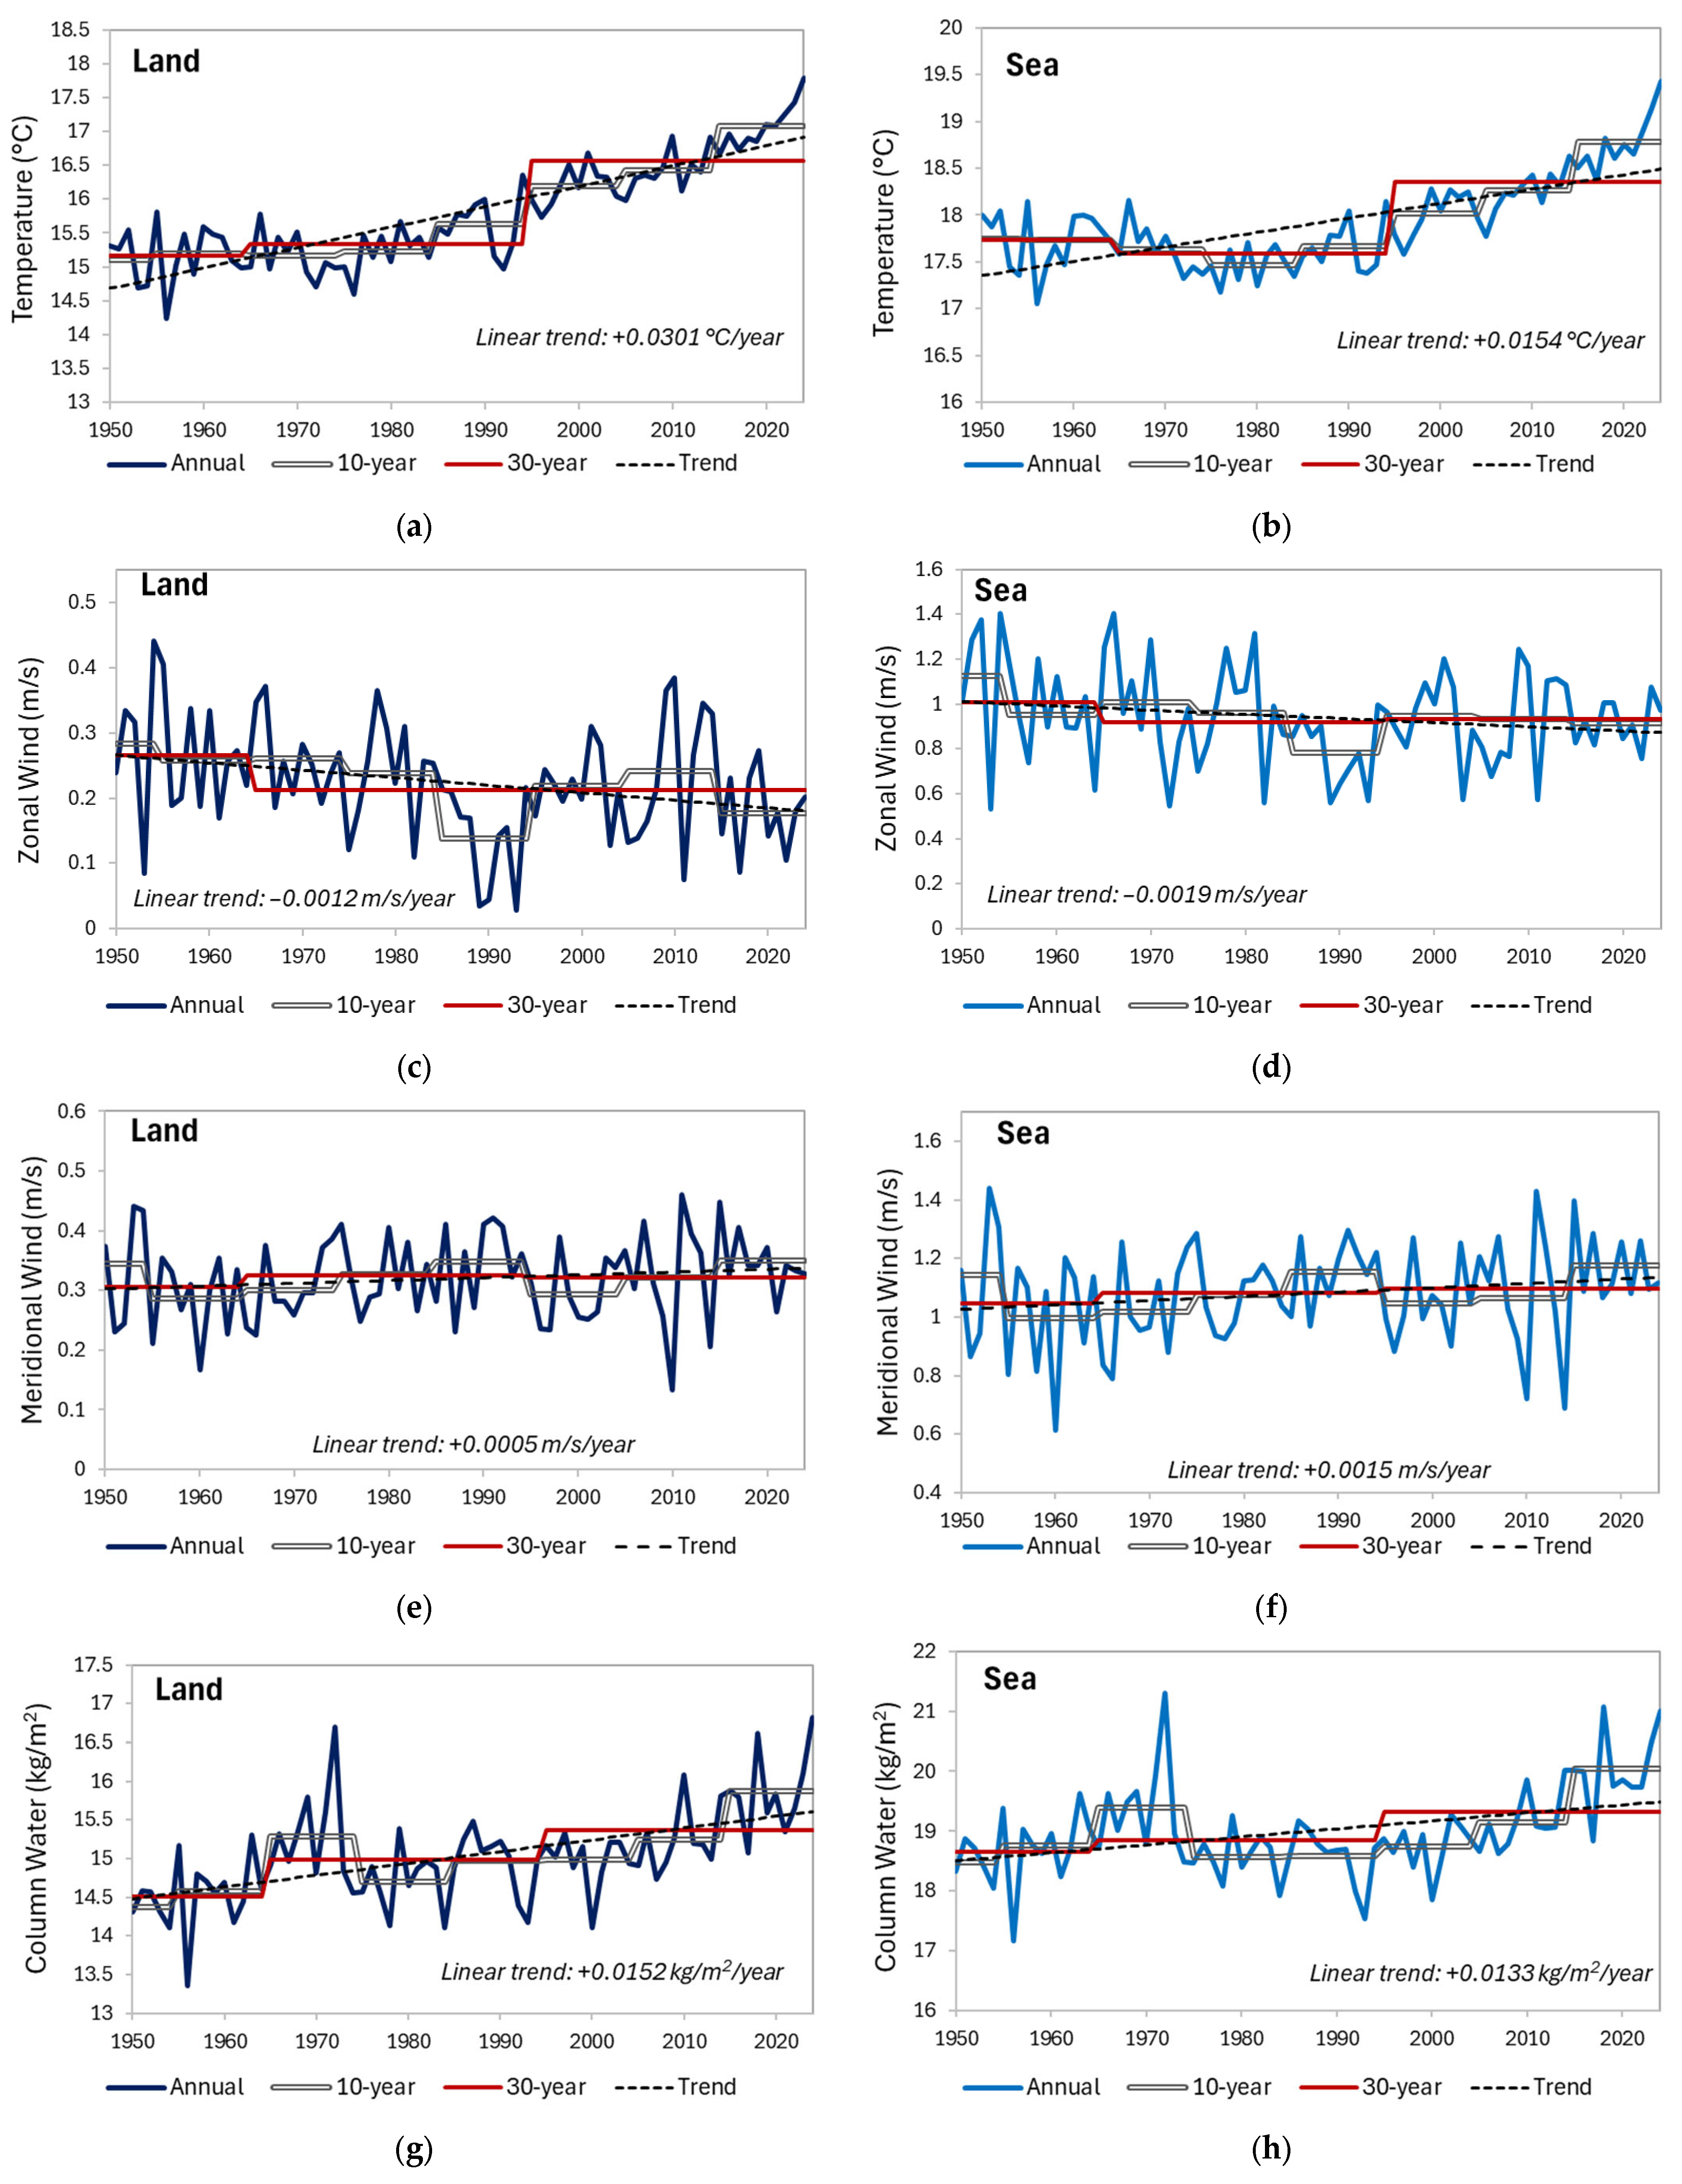
Figure 3 summarizes the evolution of the annual mean hydroclimatic variables over Mediterranean land and sea during 1950–2024. The mean annual temperature over the sea is generally higher than over land, with values ranging from 17.1 to 19.4 °C for the sea, and from 14.2 to 17.8 °C for land, over the entire period. Both land and sea regions exhibit positive linear temperature trends, with slopes estimated at 0.0301 °C/year and 0.0154 °C/year, respectively, reflecting the lower heat capacity and faster thermal response of land. The 30-year land–sea temperature contrast has slightly decreased (2.25 → 1.78 °C), consistent with stronger land warming.
The zonal wind component u (positive for westerlies) displays a negative linear trend, with slopes of −0.0012 m/s/year over land and −0.0019 m/s/year over the sea. The 30-year mean sea–land difference remains almost unchanged, indicating a basin-wide reduction in westerly flow rather than a shift in spatial contrast. The meridional wind component is consistently negative—confirming dominant northerly flow. For interpretability, its magnitude is examined; trends are slightly positive (0.0005 m s−1 year−1 over land, 0.0015 m s−1 year−1 over sea), implying a modest strengthening of northerlies. The accompanying 30-year contrast has remained essentially stable. Taken together, the two wind components indicate weaker westerlies and slightly stronger northerlies.
Column water values are consistently higher over the sea than over land. Both linear trend slopes are positive, estimated as 0.0152 kg/m2/year for land and 0.0133 kg/m2/year for the sea. The 30-year contrast rises slightly (3.86 → 3.95 kg m−2), reflecting the persistent moisture advantage of the marine environment and its buffering capacity.
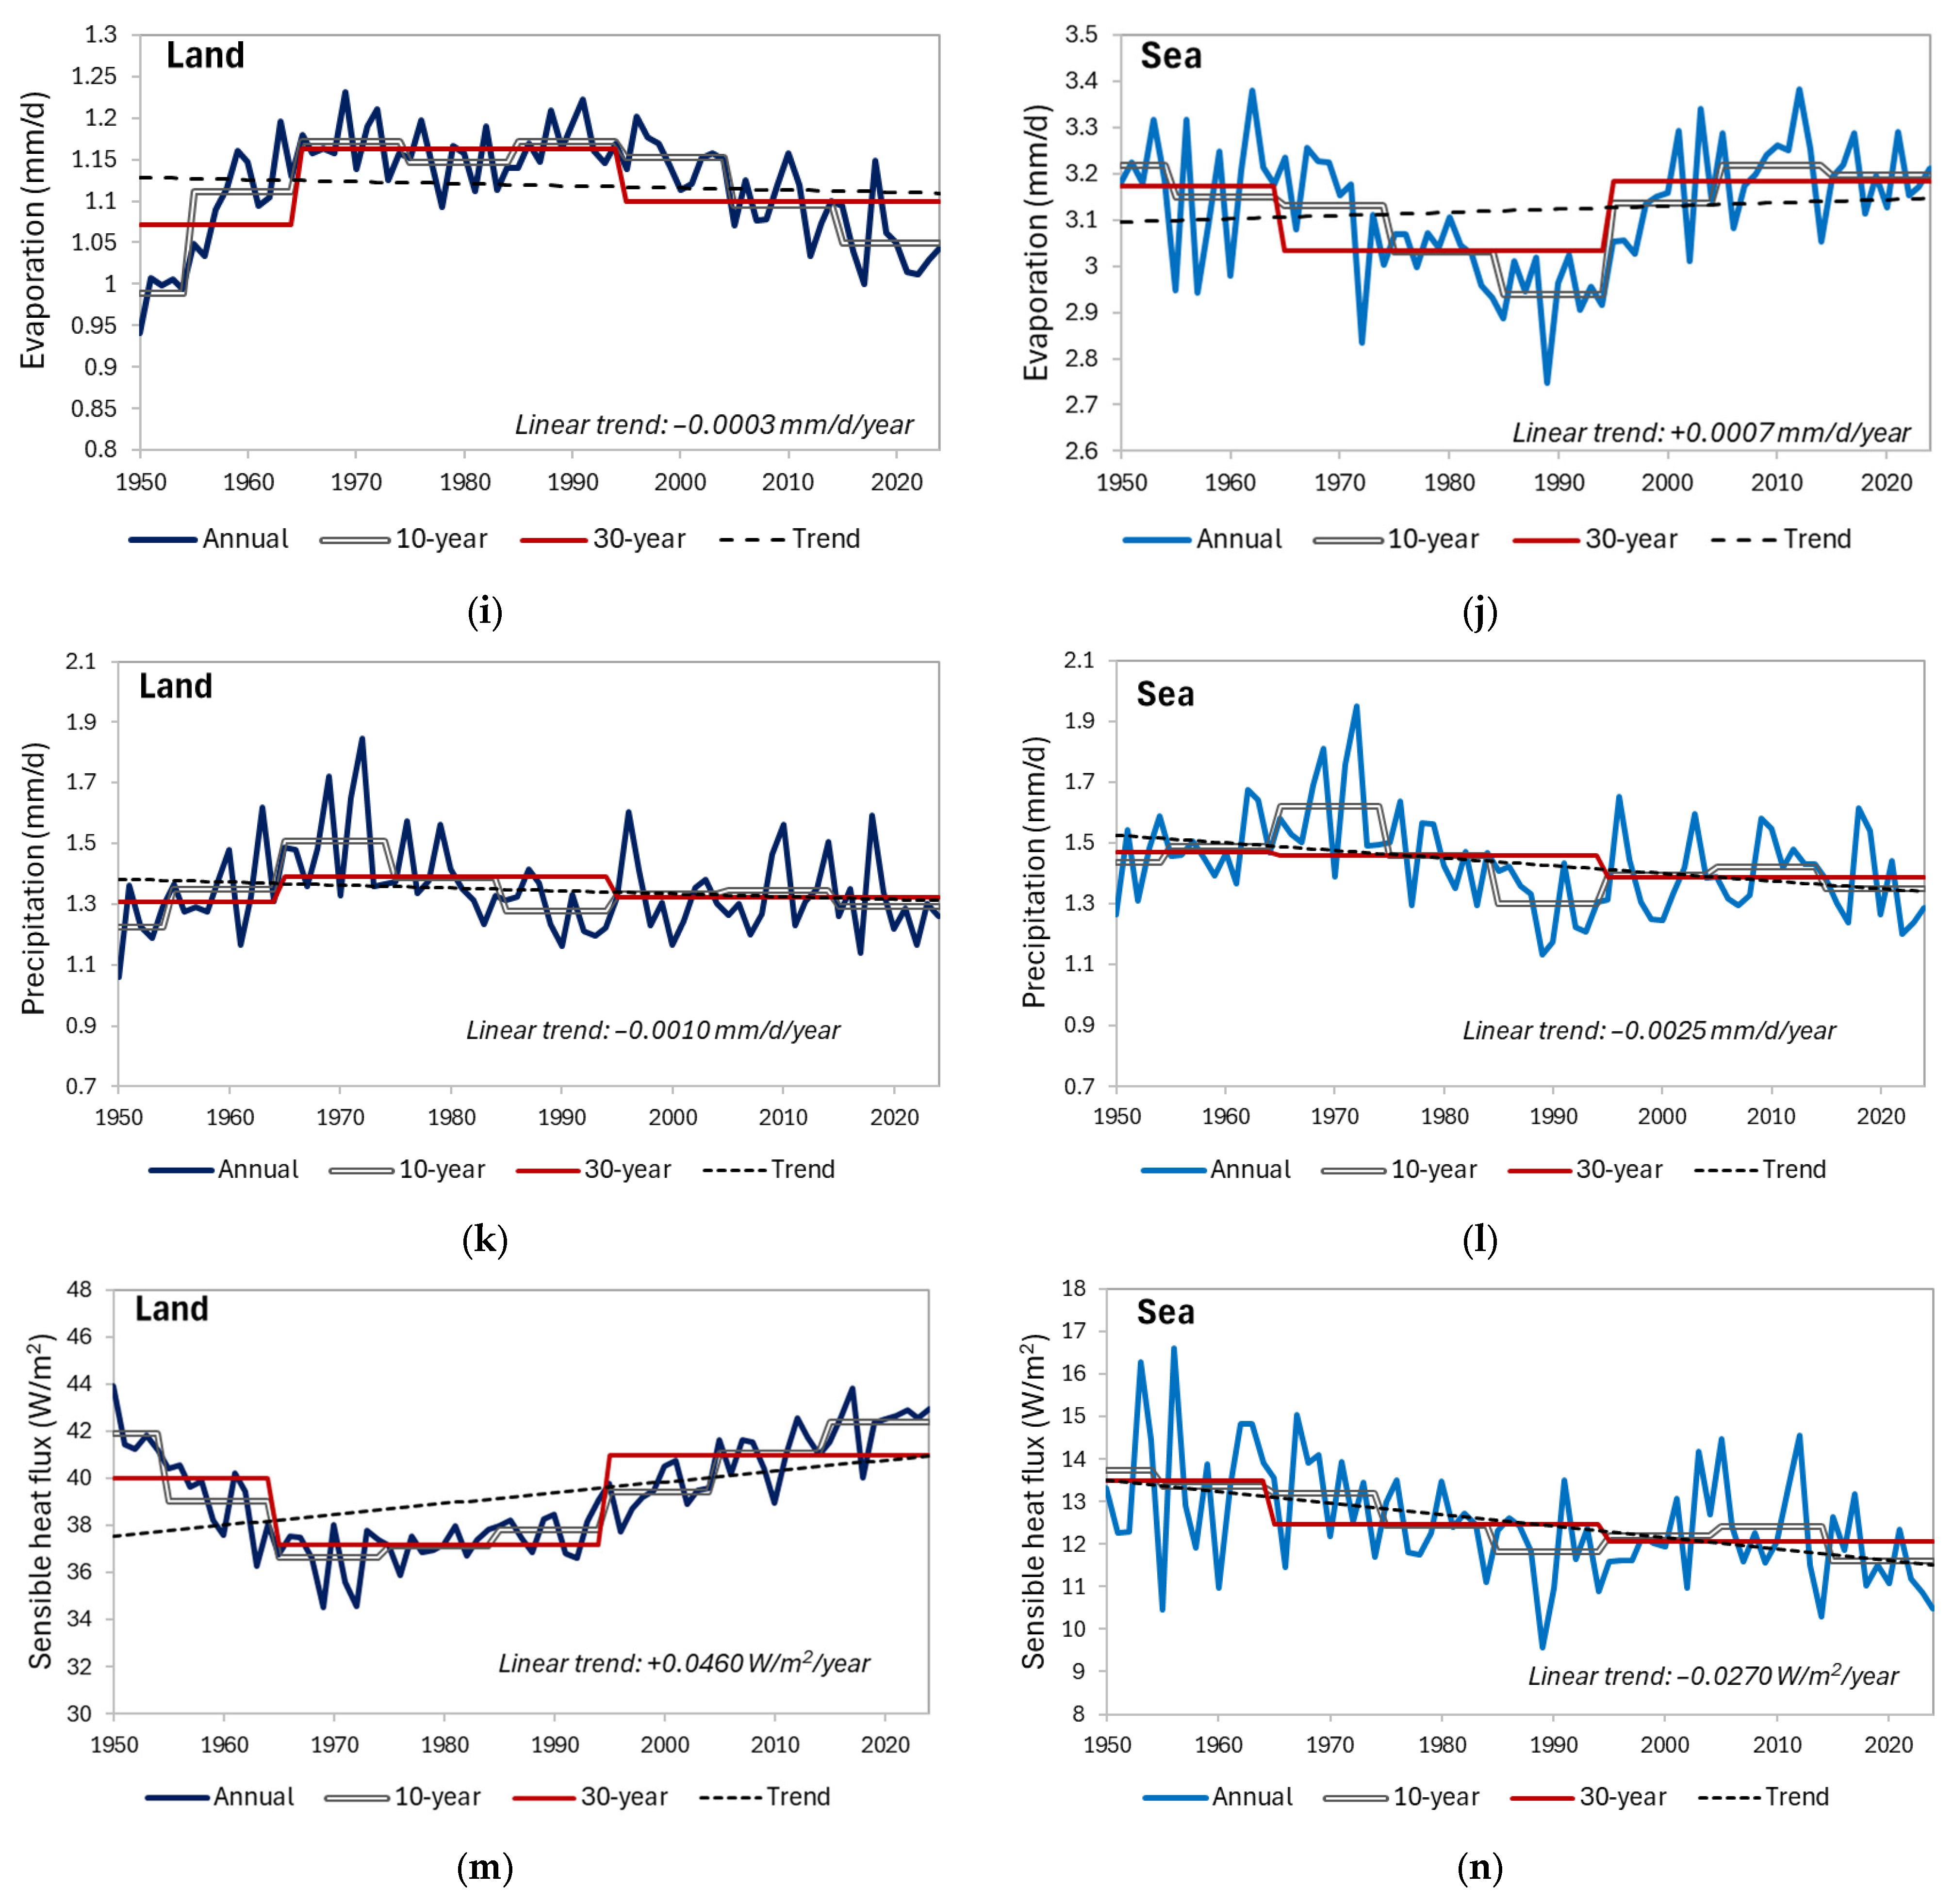
Evaporation exhibits contrasting tendencies: it increases slightly over the sea (0.0007 mm d−1 year−1) and decreases slightly over land (−0.0003 mm d−1 year−1). These long-term changes are small relative to interannual variability, but their opposite signs reflect different controls. Over land, evapotranspiration is limited by soil-moisture availability and declining wind speeds, while over the sea, evaporation remains more strongly governed by wind-driven turbulent exchange. Since approximately 1985, evapotranspiration over land has declined while sea evaporation has increased, further illustrating this land–sea contrast.
Precipitation shows a slight negative trend over both land and sea, with values close to zero: −0.0010 mm/d/year over land and −0.0025 mm/d/year over the sea. This remarkable stability indicates that, despite pronounced warming and increased atmospheric moisture content, Mediterranean precipitation continues to be governed primarily by atmospheric dynamics rather than thermodynamic moisture availability. This interpretation is supported by the behavior of specific and relative humidity at 1.5 km (Appendix A), where specific humidity shows a small increase while relative humidity declines.
As with latent heat flux (evaporation), sensible heat flux also shows a significant difference in values between land and sea. Over land, it increases (0.046 W m−2 year−1), reflecting rising temperatures and soil-moisture limitation, whereas over the sea, it decreases (−0.027 W m−2 year−1), consistent with a shift in surface energy partitioning toward latent heat flux associated with increasing evaporation. The 30-year land–sea contrast has therefore become slightly more pronounced (−24.70 → −28.88 W m−2), highlighting a continued divergence in energy partitioning between terrestrial and marine surfaces.
To enable comparison across variables with very different units and magnitudes, standardized slopes (β/σ) were also computed. These values quantify the rate of long-term change relative to each variable’s interannual variability (in year−1). Most land–sea trends exhibit small standardized slopes, indicating that long-term tendencies remain modest relative to natural fluctuations, with temperature showing the strongest signal, followed by column water and sensible heat flux. A consolidated summary of trend slopes, standardized trends (β/σ), and land–sea contrasts is provided in Table 2.

4.1.2. Cross-Correlation Examination per Land and Sea

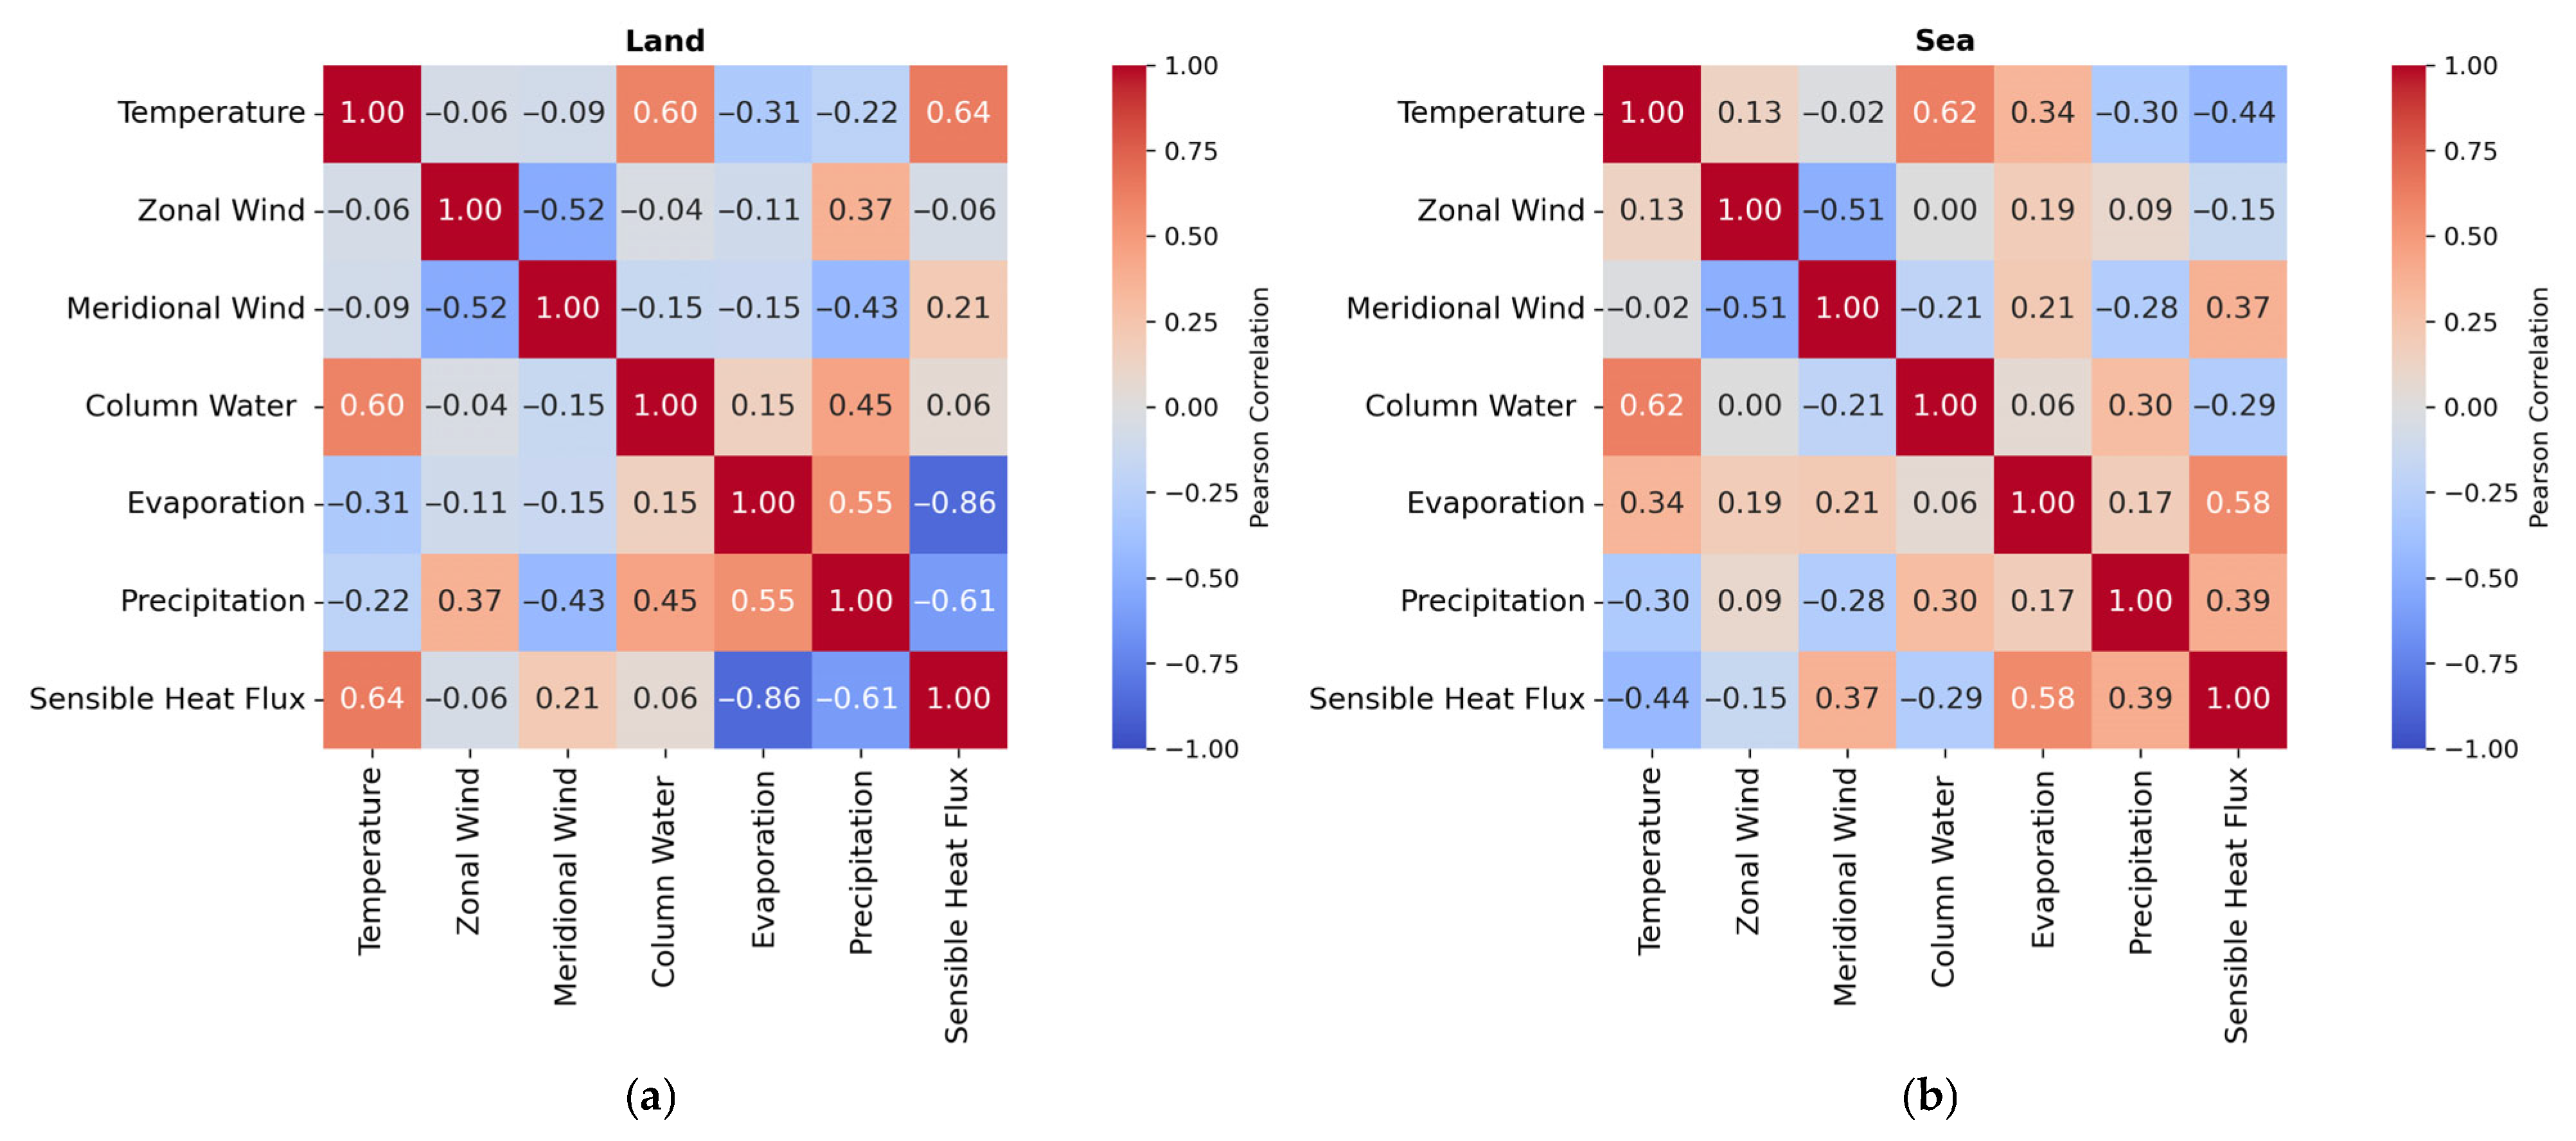
The correlation patterns (Figure 4) reveal distinct land–sea contrasts in surface–atmosphere coupling. Over land, temperature correlates strongly with sensible heat (r = 0.64), indicating that warmer surface conditions coincide with enhanced turbulent heating of the lower atmosphere. Temperature also correlates strongly with column water (r = 0.60), suggesting that warming is accompanied by higher atmospheric moisture content. Evaporation, however, is strongly negatively correlated with sensible heat (r = −0.86), reflecting an energy-partitioning trade-off towards sensible heat instead of latent heat. Indeed, evaporation is negatively correlated with temperature (r = −0.31) over land.
In contrast, over the ocean, where moisture supply is unrestricted, temperature correlates positively with evaporation (r = 0.34), consistent with thermodynamic demand in a water-unlimited environment. Although long-term trends show declining sensible heat flux and only a slight increase in evaporation, the two variables remain positively correlated (r = 0.58) over the ocean. This correlation reflects shared interannual variability driven by common atmospheric controls, such as wind speed, air–sea humidity gradients, and large-scale circulation, rather than parallel long-term trends. Thus, over the sea, sensible and latent heat fluxes may evolve differently over decades yet still fluctuate coherently on shorter timescales.
Precipitation correlates more strongly with evaporation (r = 0.55) and column water (r = 0.45) over land than sea (0.17 and 0.30, respectively), consistent with tighter land–atmosphere coupling in water-limited environments. In both domains, precipitation shows a weak negative correlation with temperature (−0.22 and −0.30), indicating that warmer years are not associated with increased rainfall.

4.2. Integrated Land–Sea Analysis

Having examined land and sea separately, we next analyze the combined Mediterranean domain to characterize basin-wide atmospheric structure and co-evolving variability.

4.2.1. Temporal Changes per Altitude

Table 3 summarizes the linear trend slopes (β) and standardized slopes (β/σ) for each variable and atmospheric level considered in the analysis. The surface and 2–10 m results generally reflect the spatially averaged behavior already identified in the land–sea assessments.
For the wind vertical-structure analysis, the signed zonal and meridional components are retained because wind direction varies across both years and atmospheric levels, and the sign therefore carries essential physical information. A negative trend in the zonal component corresponds to a weakening of westerlies, while a negative trend in the meridional component reflects a strengthening of northerly flow. This behavior is evident at all examined altitudes, with both tendencies becoming more pronounced with height: changes are modest near the surface but trend magnitude increases with altitude. For the 2–10 m layer, the trends remain consistent with the land–sea surface patterns described in Section 4.1. In this integrated configuration, the resulting wind-speed magnitude also exhibits a negative long-term trend of −0.0011 m/s/year.
Temperature trends show a clear altitude dependence. Warming is strongest near the surface and weakens progressively with height, with the 200 hPa level showing a slight long-term cooling (Table 3). This combination of surface-intensified warming and upper-level cooling contributes to a steepening of the vertical temperature gradient. However, the magnitude of this steepening cannot be determined from the individual levels alone, as the vertical gradient depends on the collective behavior of all atmospheric layers. We therefore compute the annual lapse rate explicitly to quantify the integrated change in the temperature–altitude structure.
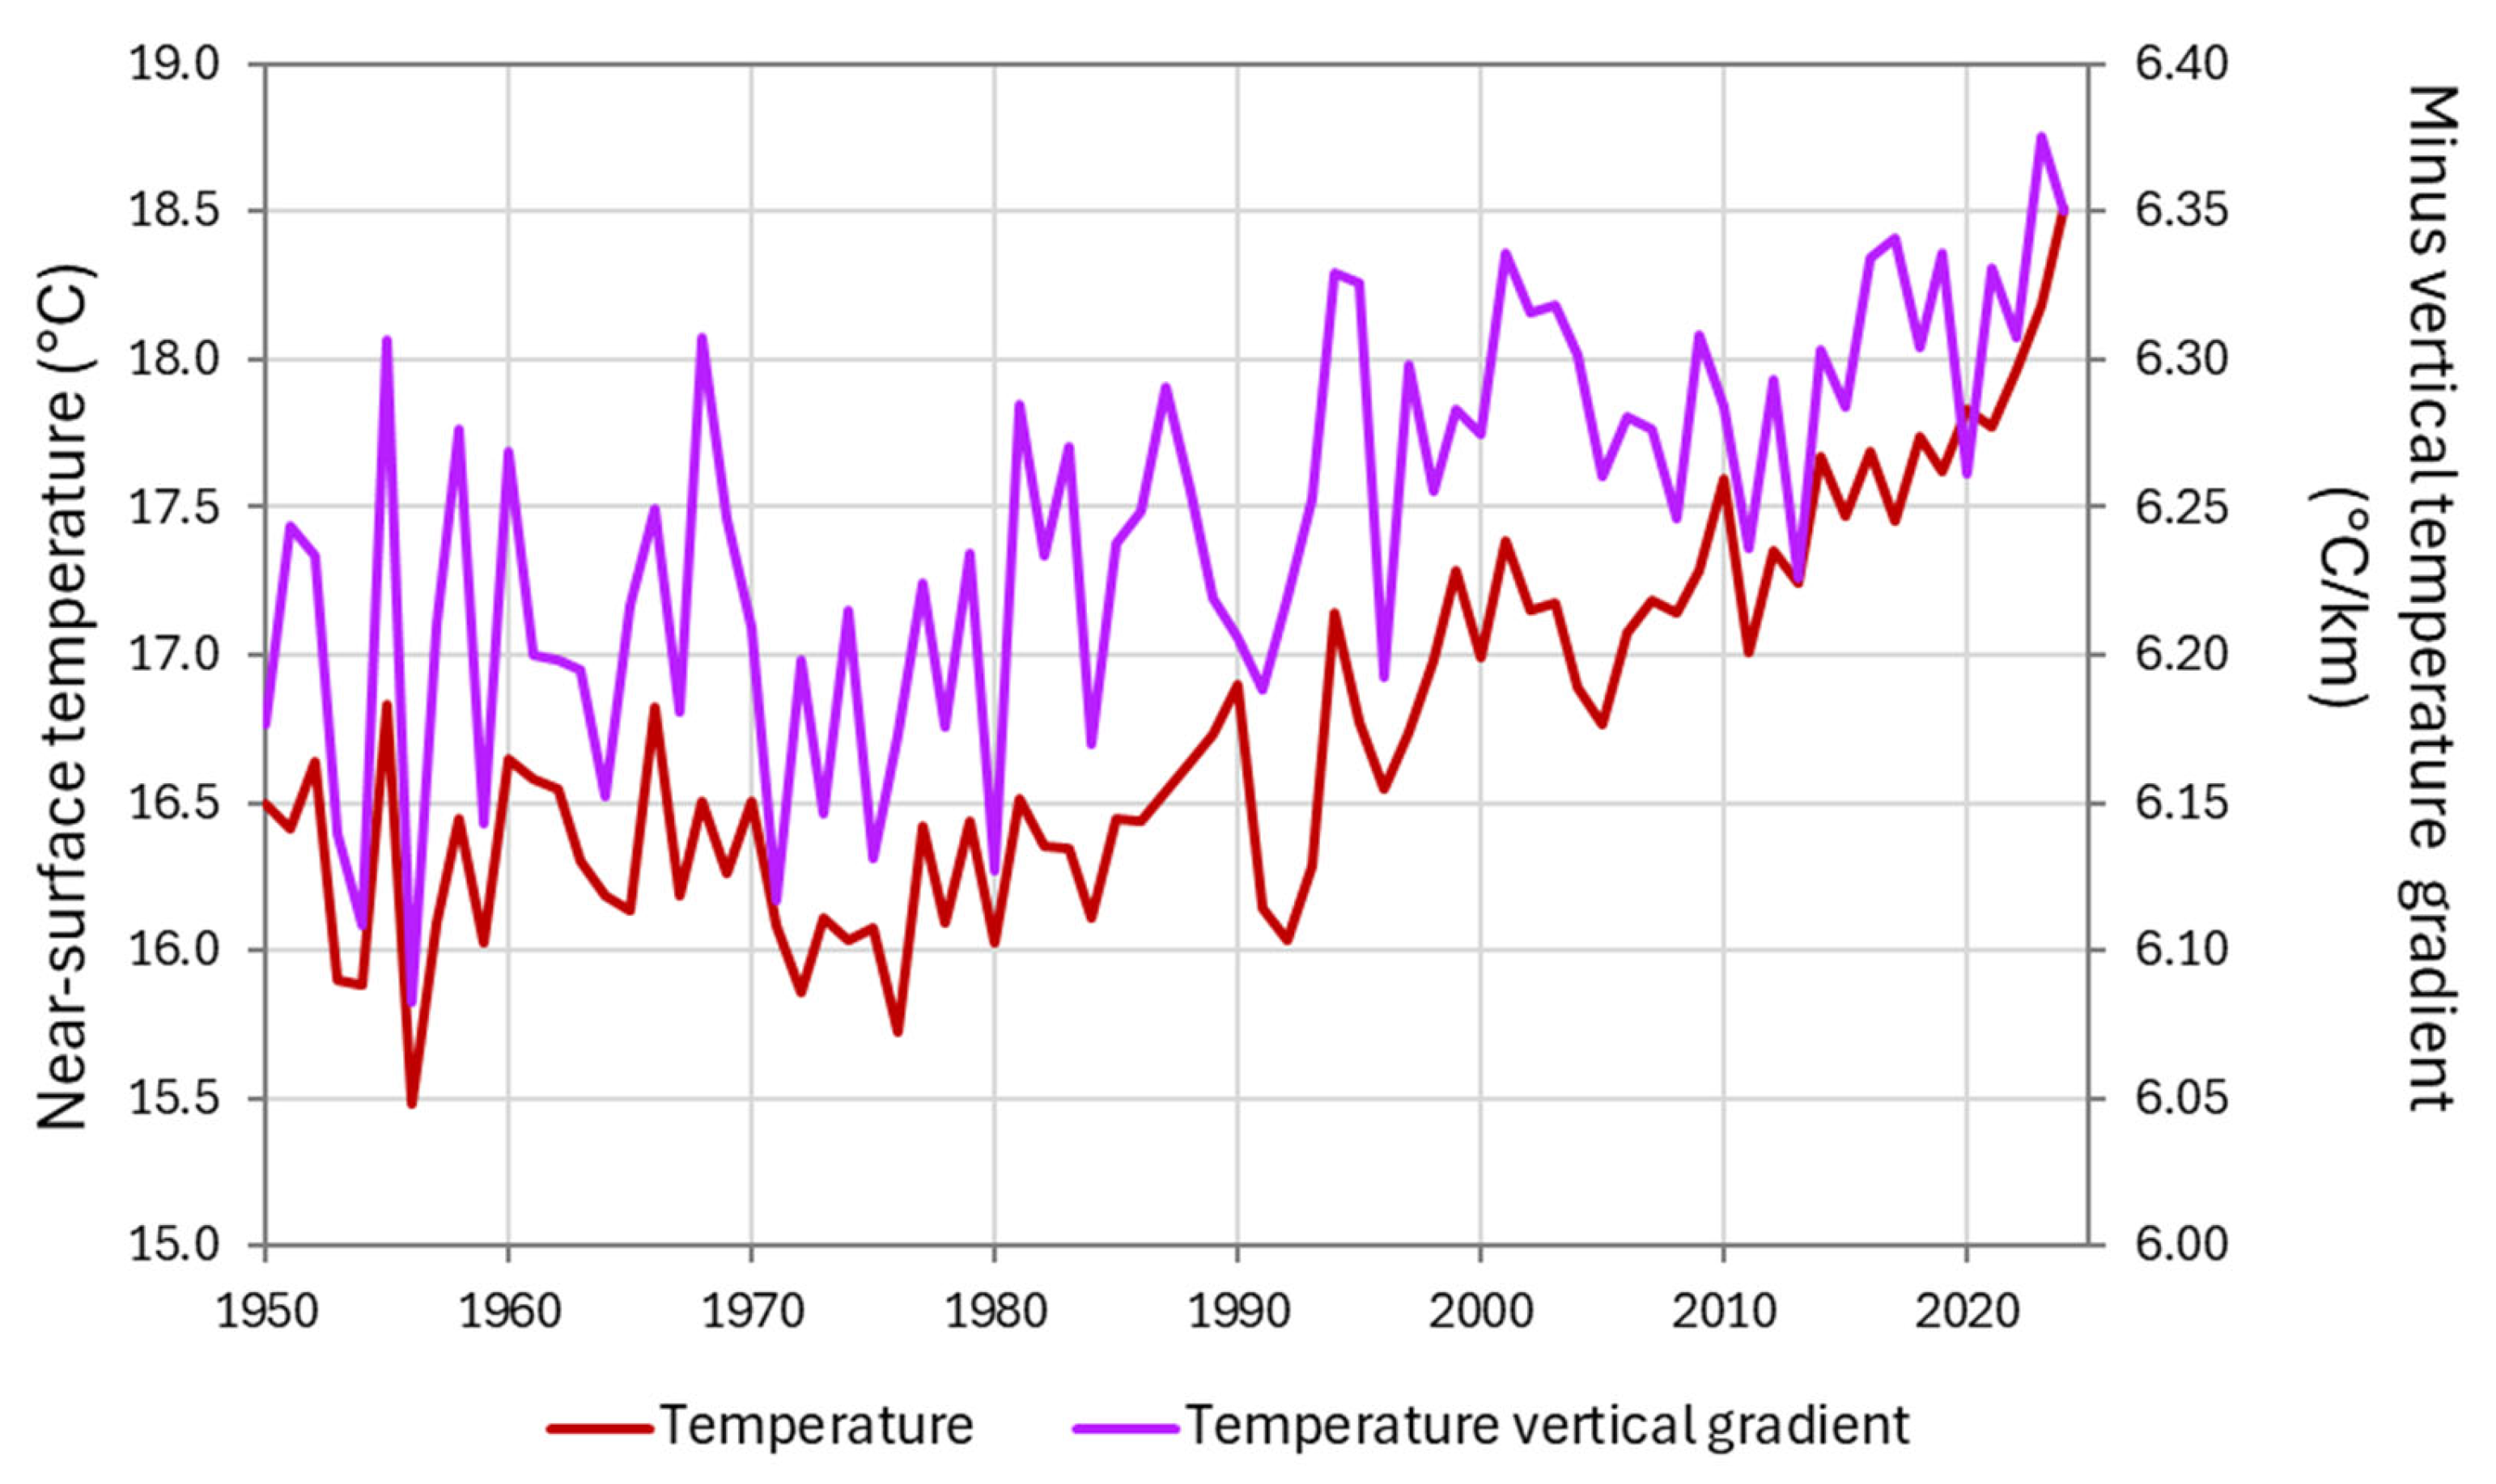
For each year, mean temperatures at the surface, 850 hPa, 500 hPa, and 200 hPa levels were regressed against their corresponding altitudes, and the minus slope of the linear fit ( d T d z ) was retained, for it to be positive. The resulting timeseries shows a long-term increase of 0.002 °C km−1 per year, reflecting enhanced warming in the lower troposphere relative to the mid–upper levels.
Figure 5 shows the co-evolution of near-surface temperature and the lapse rate from 1950 to 2024. Near-surface air temperature increases steadily, with the strongest warming at low altitudes, muted warming at mid-levels, and slight cooling aloft (Table 3). The resulting lapse-rate trend reflects a steeper temperature decrease with height, indicating that warming is concentrated near the surface to around 6 km high, rather than accelerating uniformly through the troposphere. The combined effect is a steeper lapse rate, which thermodynamically corresponds to increased lower-tropospheric instability. However, precipitation exhibits only weak long-term decreases, indicating that the lapse-rate signal alone does not translate into stronger hydrological responses without favorable dynamic conditions. Likewise, lapse-rate changes may influence boundary-layer mixing but do not substantially modify mean winds, which remain governed primarily by large-scale circulation.
Standardized slopes included in Table 3 express the magnitude of long-term change relative to each variable’s interannual variability (in year−1). Across altitudes, these values confirm that most vertical trends are small compared to natural fluctuations, while temperature exhibits the clearest and most coherent multi-level signal, particularly through the lower and mid-troposphere (up to ~6 km).

4.2.2. Cross-Correlation Examinations

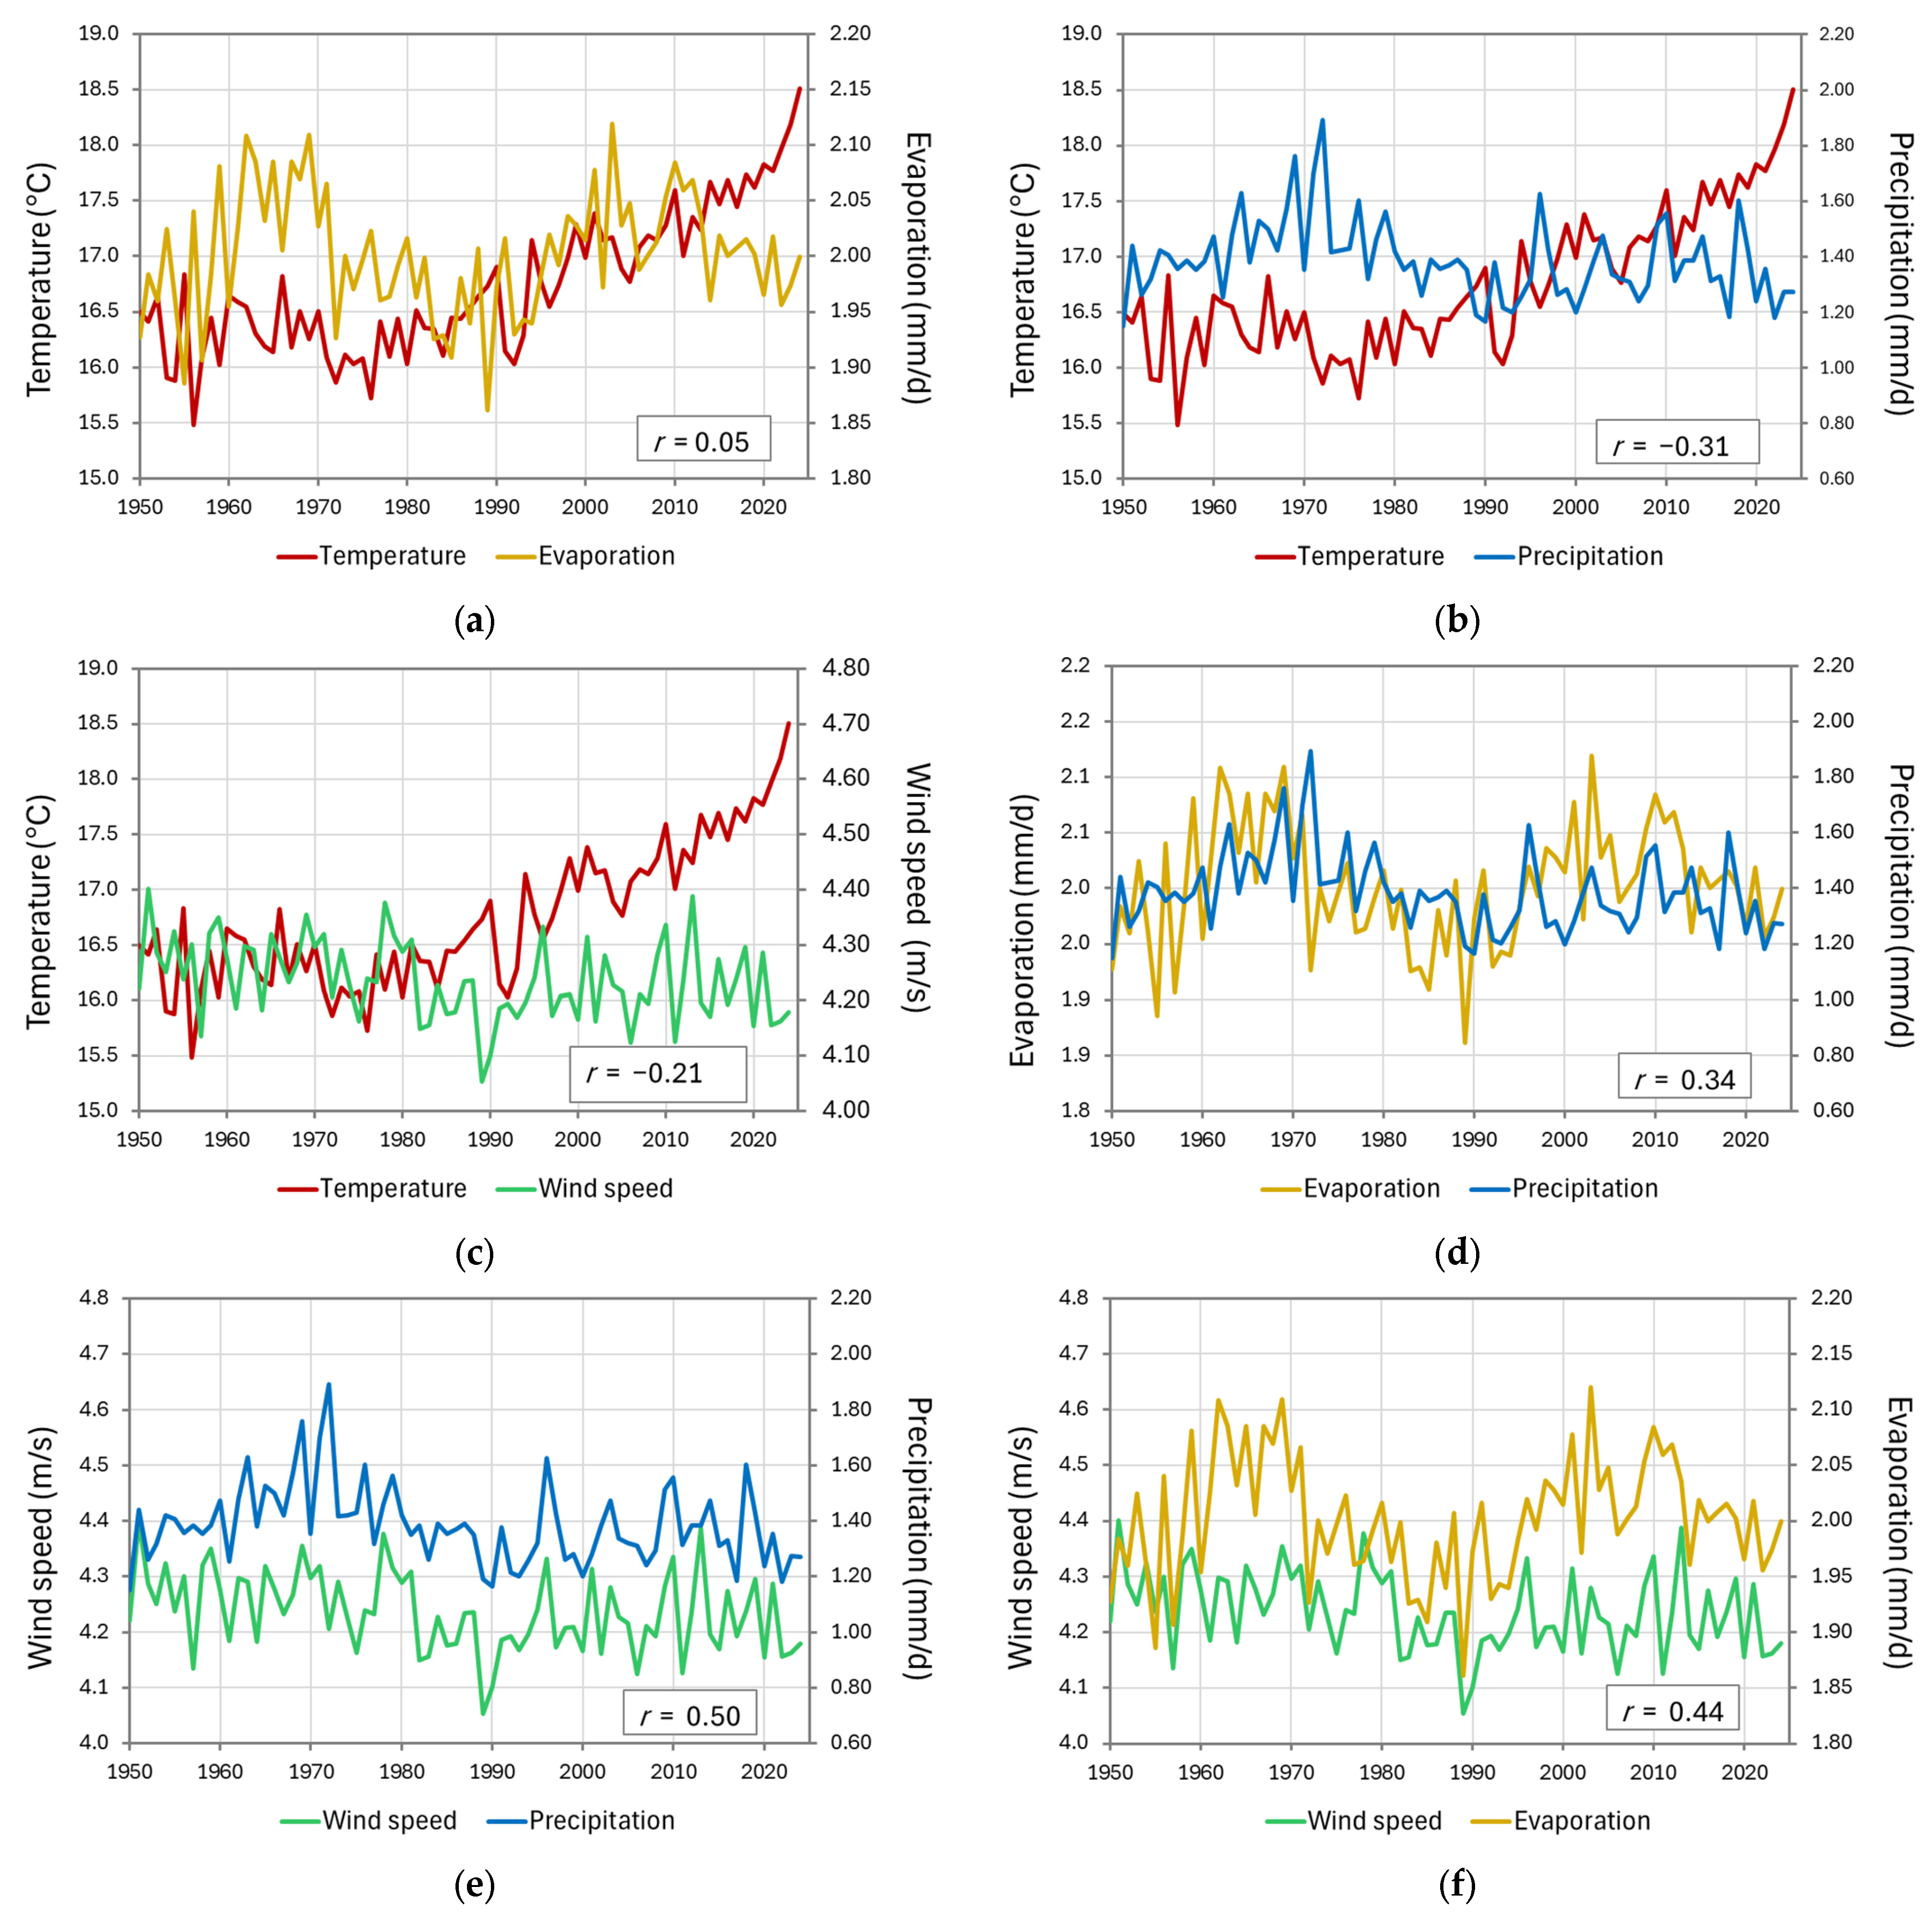
For the purposes of the correlation analysis, we assume that the surface and the 2–10 m atmospheric layer represent effectively the same level, allowing meaningful comparisons among variables measured at slightly different heights. We also examine the co-variability of physically related variables in Figure 6, and then quantify these relationships through the correlation matrix shown in Figure 7.
The paired plots in Figure 6 allow direct comparison among thermodynamic (temperature-related), dynamic (wind-related), and moisture-related (evaporation–precipitation) interactions. Temperature exhibits a clear positive trend, but its direct statistical association with evaporation is very weak, suggesting that evaporation is not primarily temperature-driven (r = 0.05). Instead, evaporation correlates more strongly with wind speed (r = 0.44), consistent with wind-controlled turbulent exchange over both land and sea.
Despite surface temperature warming, precipitation remains relatively stable. The temperature–precipitation correlation is weak (r = −0.31), whereas precipitation correlates more strongly with wind speed (r = 0.50). These relationships indicate that rainfall variability is more strongly modulated by dynamical processes—particularly wind-driven moisture transport—than by thermodynamic warming alone. The synchronization of fluctuations between evaporation and precipitation (Figure 6d) further reflects their physical coupling within the hydrological cycle.
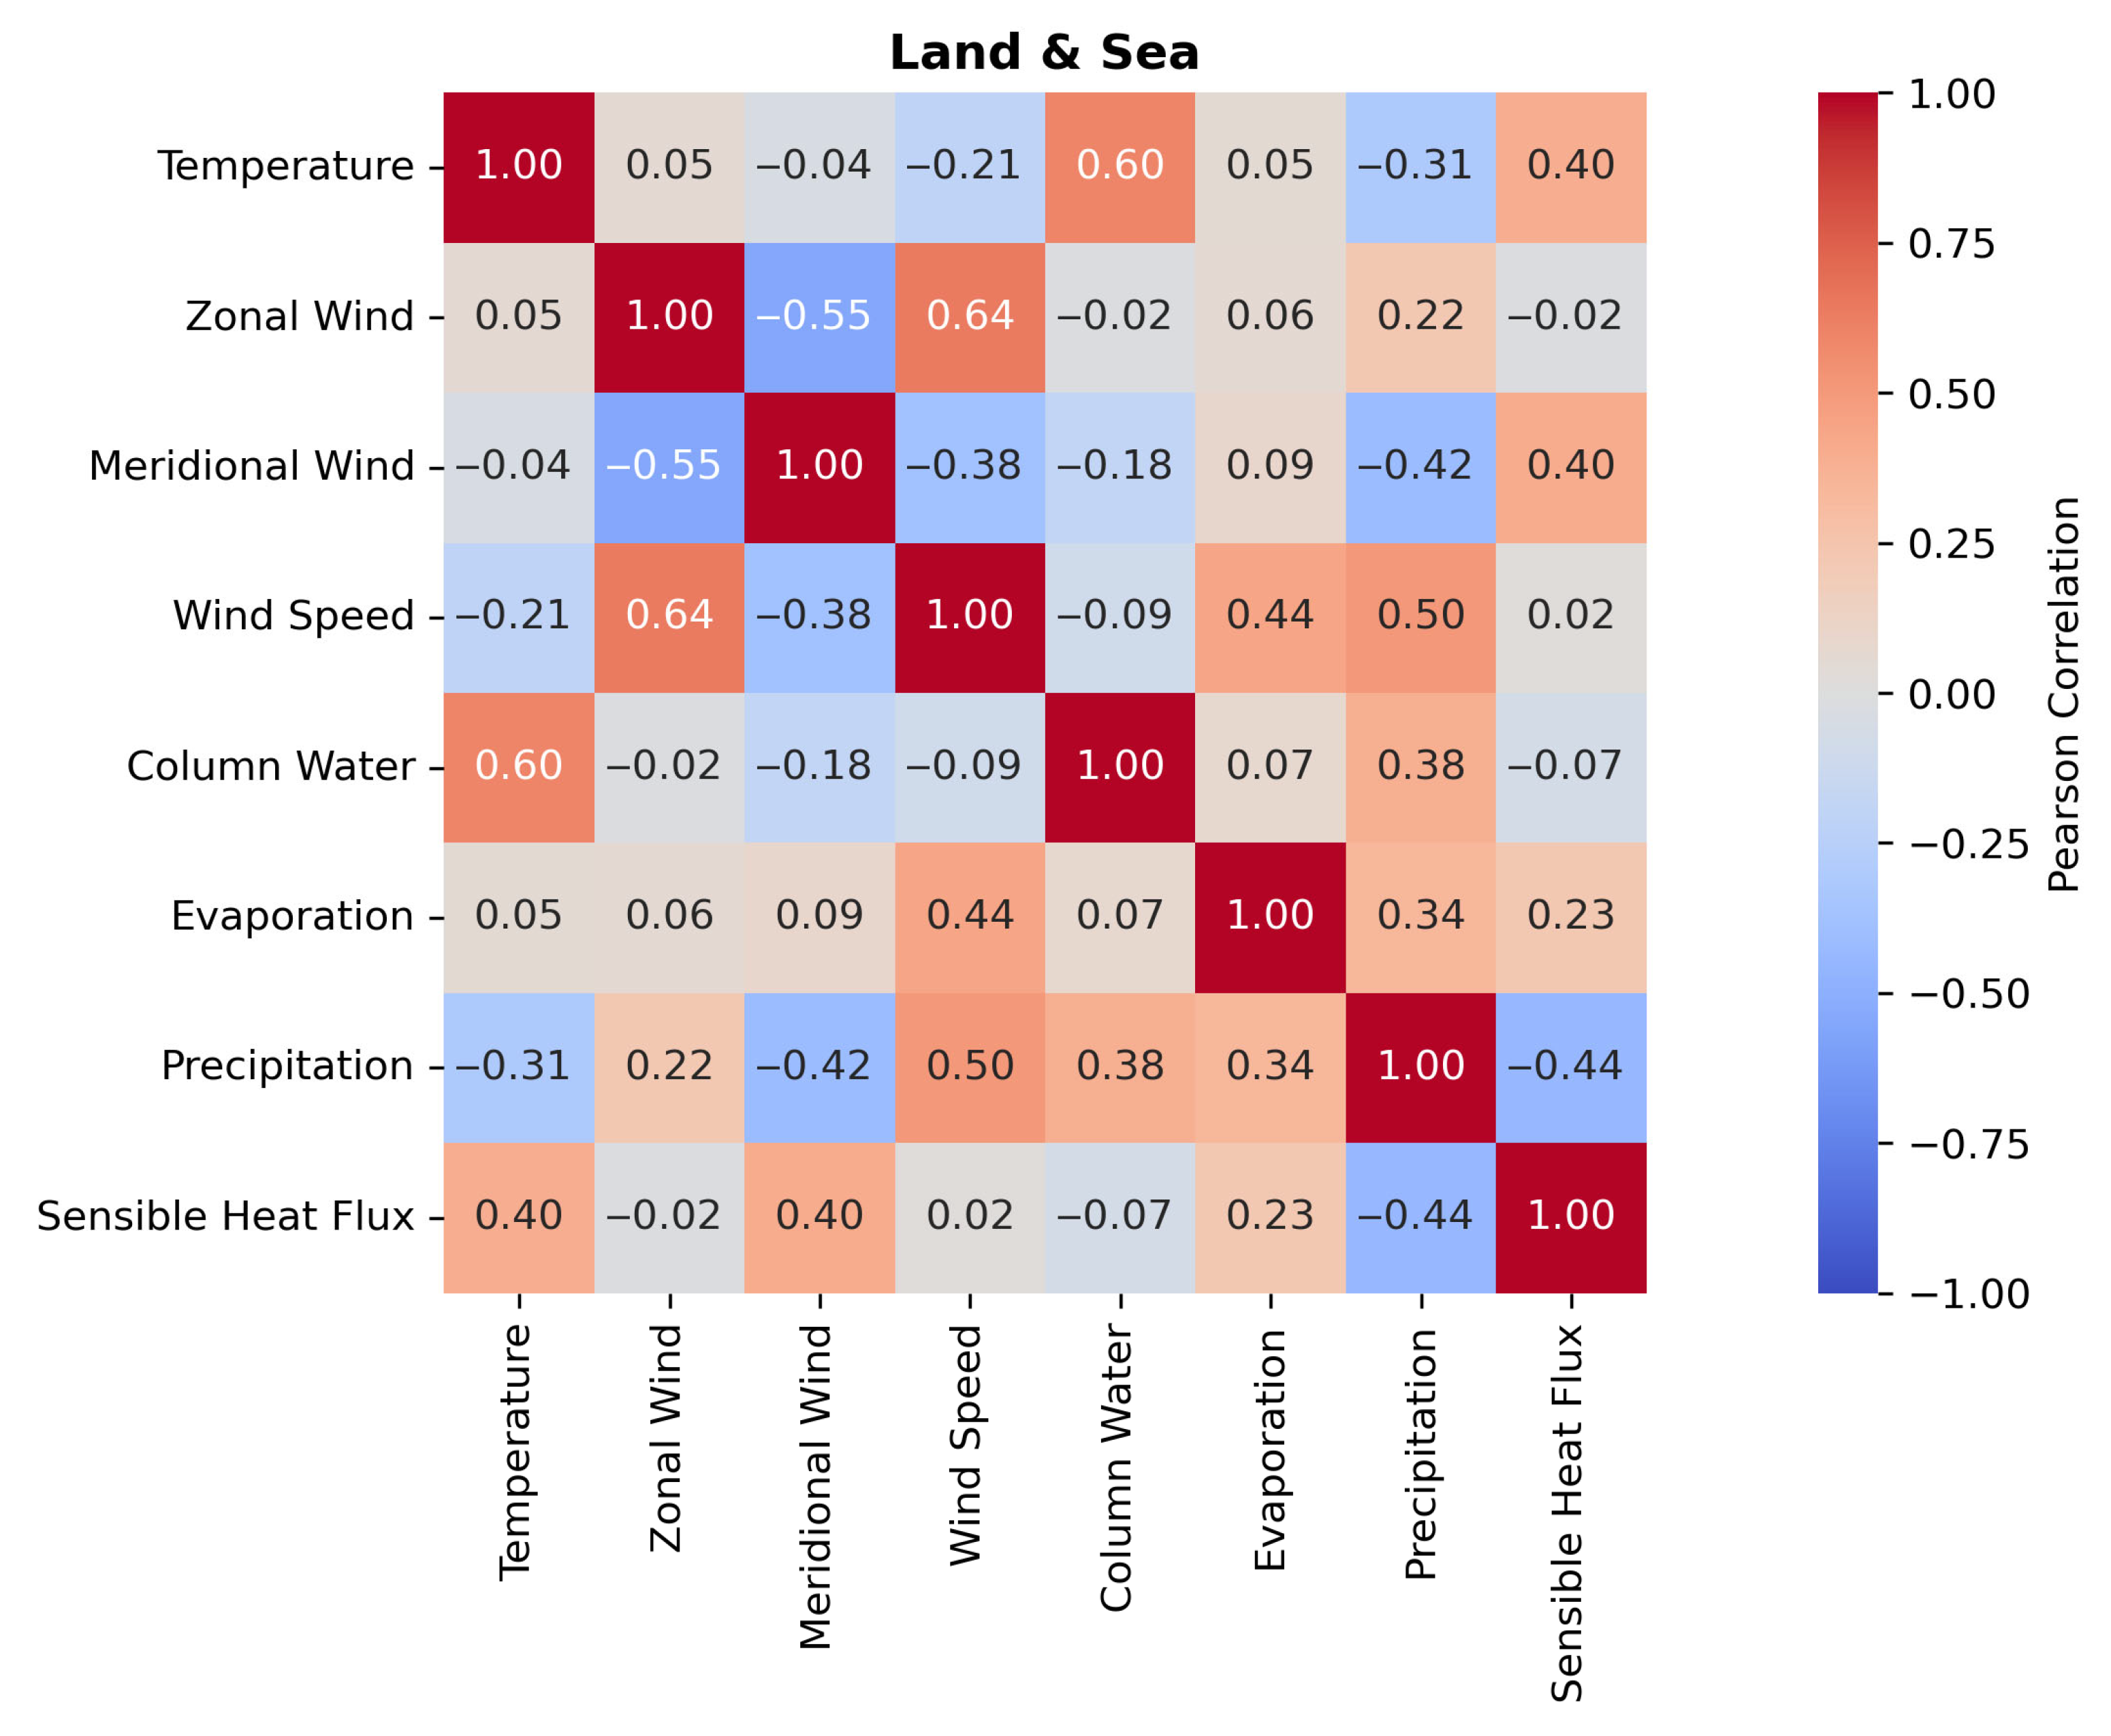
The correlation heatmap in Figure 7 summarizes all pairwise associations. With respect to the previous analyses, for which wind speed data were not available, here, we are able to validate the expected positive influence of wind speed to evaporation (r = 0.44) and precipitation (r = 0.50). These patterns are consistent with the findings from the land–sea analysis and reinforce the dynamical control exerted by wind on moisture availability and rainfall efficiency in the Mediterranean.

4.2.3. Stochastic Variability Quantification Through the Hurst–Kolmogorov Dynamics

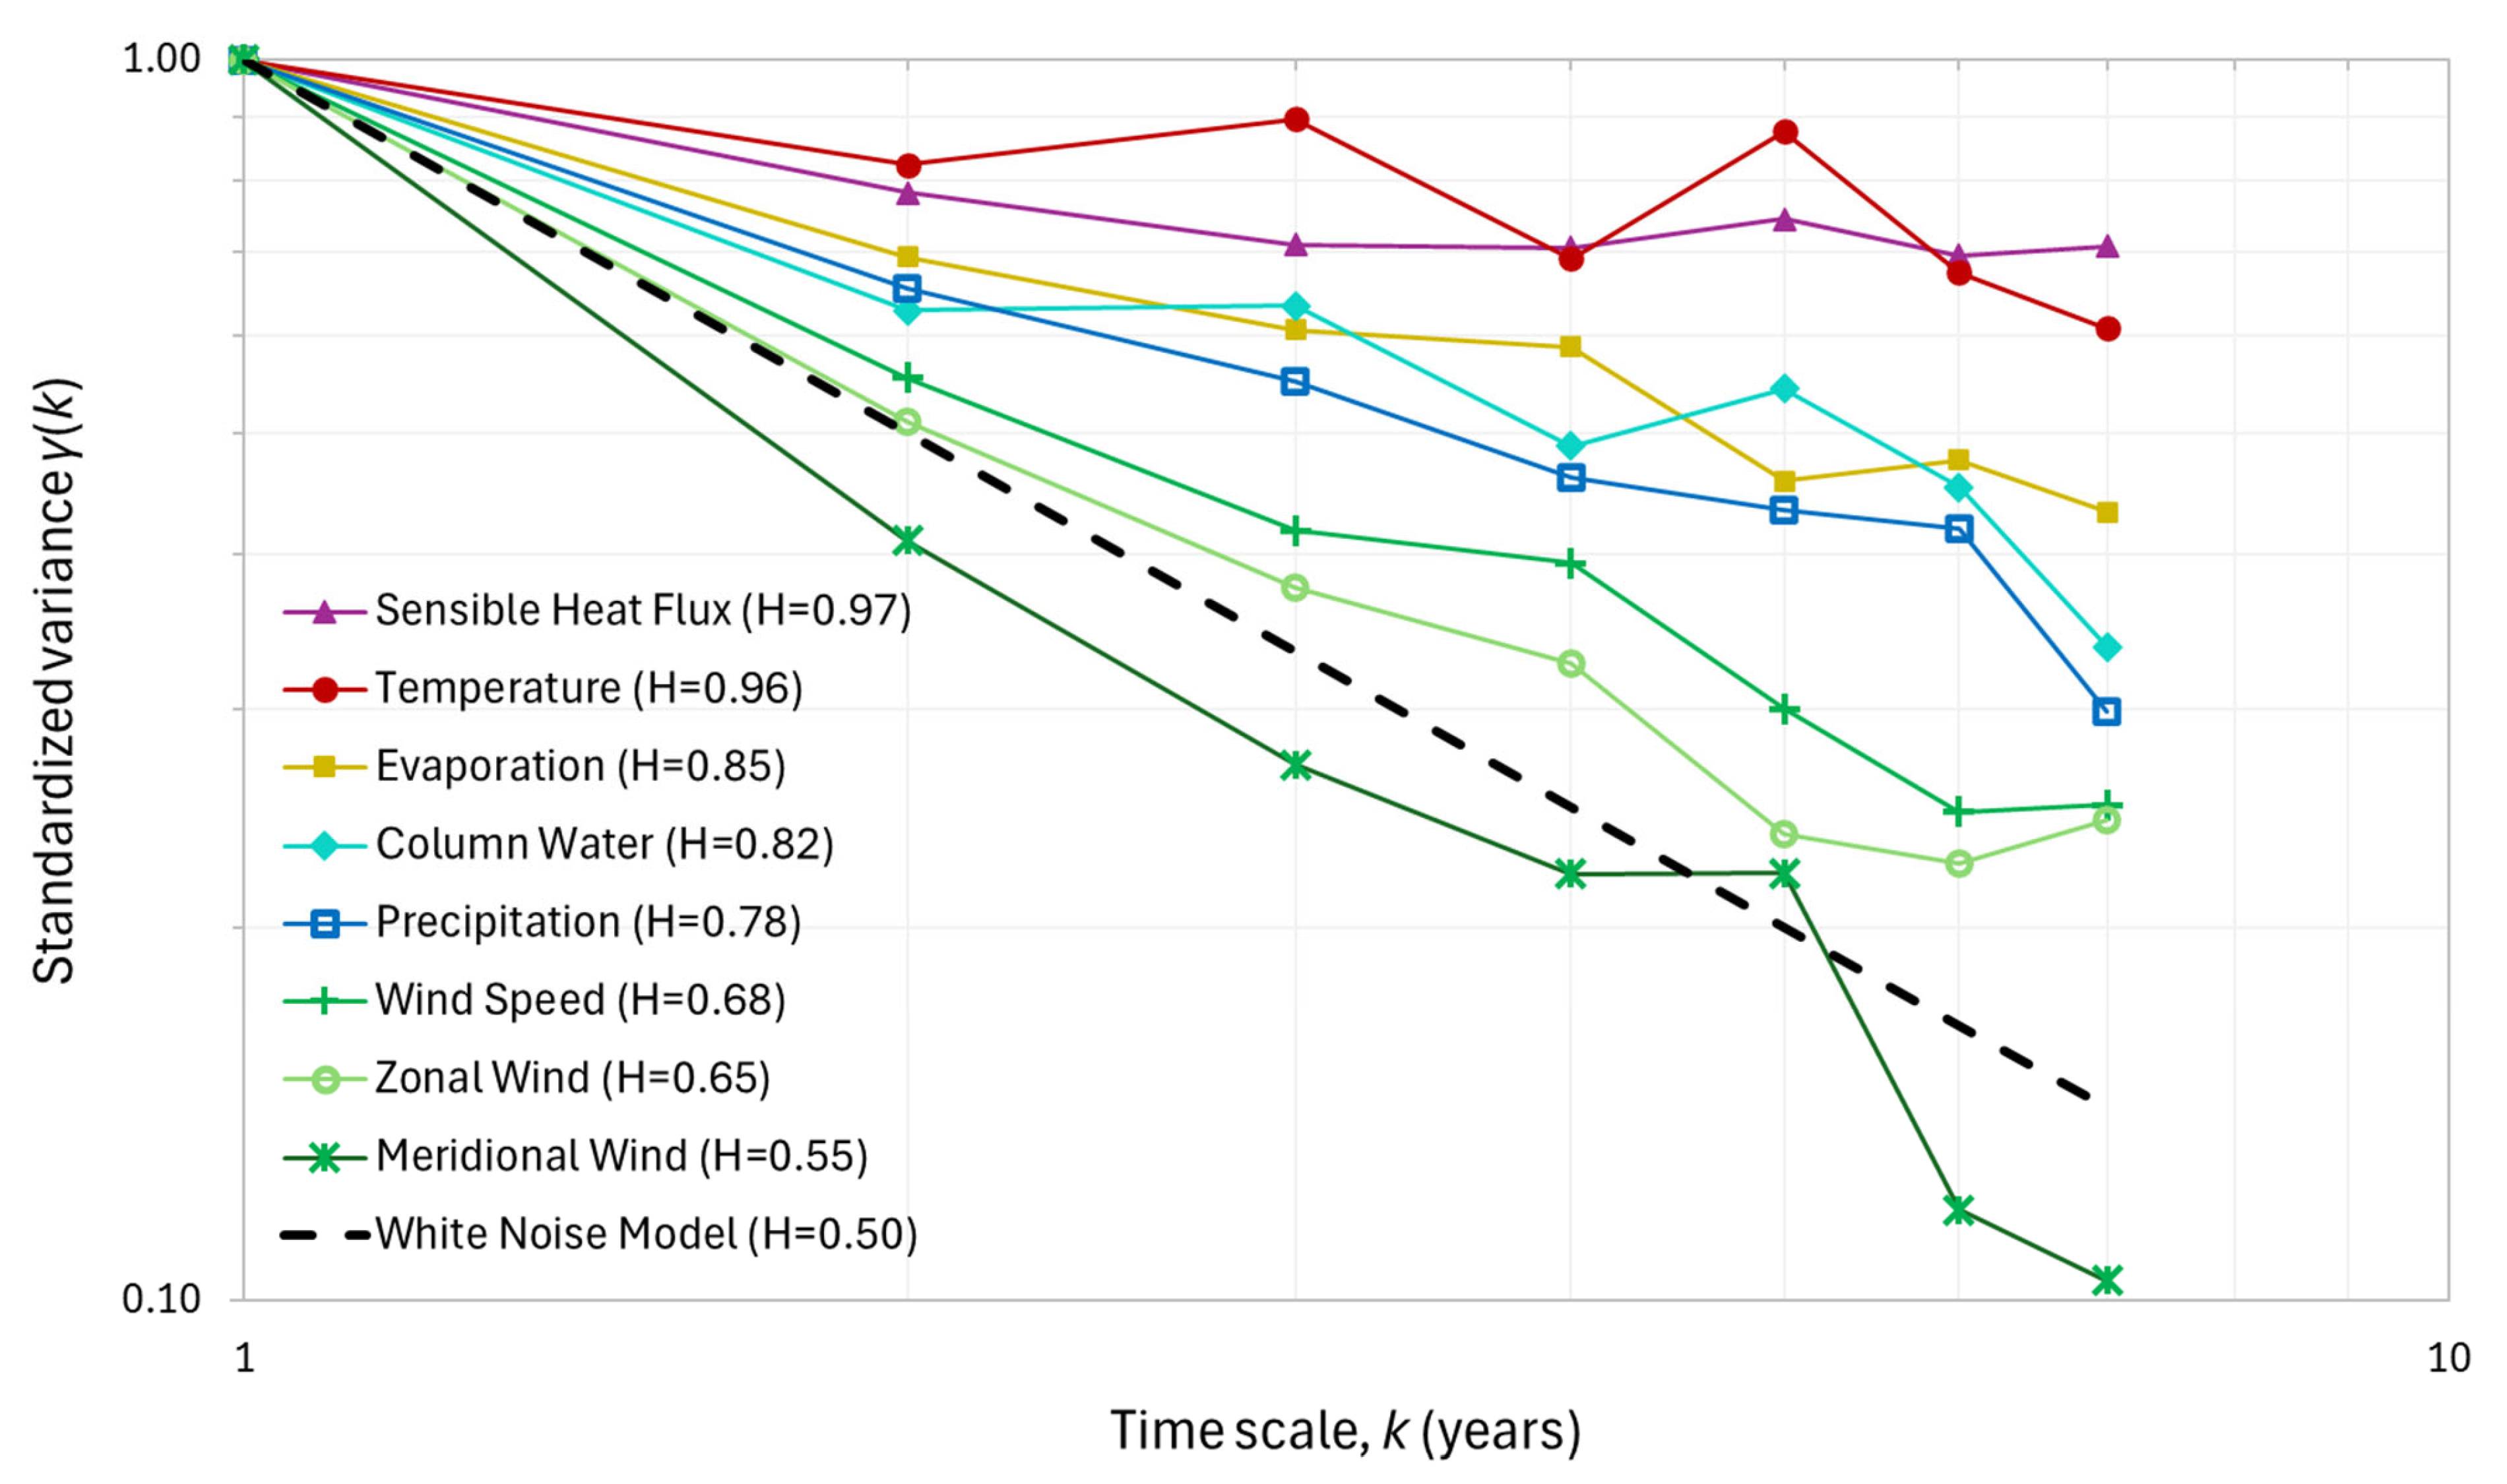
Figure 8 displays the behavior of the dimensionless variance vs. timescale (climacograms) on a double logarithmic scale graph up to the scale equal to approximately 10% of the total timeseries lengths (i.e., 7–10 annual scales). The climacogram analysis reveals that most examined hydroclimatic variables exhibit a clear deviation from the white-noise benchmark (H = 0.5), indicating long-term persistence across multiple timescales. Temperature and sensible heat flux show the highest Hurst coefficients (H ≈ 0.96–0.97), reflecting strong low-frequency clustering and enhanced long-range dependence, consistent with the sustained warming signal identified in the trend analysis. Column water (H ≈ 0.82), evaporation (H ≈ 0.85), and precipitation (H ≈ 0.78) also display pronounced persistence, suggesting coherent multiyear variability in the hydrological cycle. Wind-related variables show lower but still positive persistence (H ≈ 0.65 for the zonal and 0.55 for the meridional component), implying more white-noise behavior yet still containing decadal-scale variability.
The overall hierarchy of H values—highest for energy-related variables and lowest for dynamic ones—suggests that the energy and moisture components of the Mediterranean climate evolve more slowly and coherently than wind fields, in line with their integral role in regulating long-term hydroclimatic variability.

4.3. Assessment of Dominant Land and Sea Influences on Integrated Data

Having characterized vertical variability and cross-variable relationships within the integrated Mediterranean domain, we next examine how land and sea domains jointly contribute to the basin-wide signal. This comparison clarifies which surface type exerts stronger influence on each hydroclimatic variable in the aggregated Mediterranean record. Corresponding cross-correlations are summarized in Table 4. Temperature, zonal and meridional wind, column water, and precipitation exhibit similarly strong correlations with both land and sea subsets, indicating comparable contributions from each domain. In contrast, sensible heat flux is predominantly land-driven, reflecting stronger terrestrial control on surface energy exchange. Conversely, evaporation (and latent heat flux) is clearly dominated by oceanic variability, consistent with the marine moisture supply. All variables show positive land–sea correlations, with the exception of evaporation and sensible heat flux, as discussed previously.

5. Discussion

The ERA5 analysis reveals a pronounced and spatially coherent warming across the Mediterranean region during 1950–2024, with surface air temperature increasing at rates of approximately 0.03 °C year−1 over land and 0.015 °C year−1 over the sea (Table 2). These values align closely with basin-wide observational records from the Mediterranean Sea showing SST warming rates of 0.034–0.041 °C year−1 [34,35] and recent reanalysis-based assessments of Mediterranean temperature extremes [18]. ERA5 vertical profiles show that this signal is vertically confined to the lower half of the troposphere, decreasing from +0.024 °C year−1 near the surface to +0.016 °C year−1 at 500 hPa (~5.6 km) and approaching zero above 200 hPa (~11.8 km) (Table 3). Such a structure implies a slightly steepening lapse rate (0.002 °C km−1 year−1). The surface-amplified warming identified here is consistent with global observations of pronounced near-surface temperature increases [36], and almost no temporal changes at the zone of 200 hPa [37]. This analysis thus provides quantitative evidence, based on a continuous ERA5 record, that the Mediterranean lapse rate has steepened over recent decades, reflecting stronger warming in the lower troposphere and nearly stagnant temperatures above ~5–6 km. This lapse-rate steepening represents a thermodynamic tendency toward enhanced lower-tropospheric instability. However, instability alone is insufficient in generating stronger hydrological or dynamical responses, because Mediterranean precipitation and wind patterns are also strongly modulated by synoptic-scale circulation and moisture-transport pathways [38,39,40]. In this context, the vertical-temperature structure suggests a potential for increased instability, but its expression depends on moisture convergence, vertical motion, and the influence of large-scale atmospheric dynamics.
Temperature increases are not accompanied by proportional rises in evaporation (or latent heat flux) over either land or sea, reflecting distinct mechanistic controls. Over the sea, evaporation increases only marginally (+0.0007 mm d−1 year−1) despite warming SSTs, indicating the influence of wind stilling—dominated by the long-term weakening of the zonal wind (−0.0019 m s−1 year−1) and, to a lesser extent, changes in the meridional component (+0.0015 m s−1 year−1)—which offsets the thermodynamic tendency for higher evaporation. Globally, a decrease in evaporation over the oceans has been observed in recent decades, despite rising temperatures, and has also been linked to wind stilling [41].
Over land, the response is more complex and reflects competing drivers. Warming is stronger (+0.03 °C year−1), which is expected because of the significantly lower thermal capacity of land if compared to the sea. This leads to an increase in sensible heat flux (0.046 W m−2 year−1) with a strong positive correlation with temperature (r = 0.64). Evaporation exhibits decadal variations, with an overall declining trend (≈−0.0003 mm d−1 year−1), indicating that warming does not translate into greater surface moisture loss. The decline in land evaporation may be both explained by the soil-moisture limitation of water availability [42] and decreasing winds (−0.0012 ms−1 year−1 for zonal, +0.0005 m s−1 year−1 meridional) [43]. The decrease in the wind speed is also validated at the integrated scale (−0.00105 m s−1 year−1). As warming increases atmospheric moisture demand (higher vapor pressure deficit), simultaneous soil drying constrains the land’s ability to supply moisture. This supply–demand decoupling, characteristic of energy-limited and soil-moisture-limited regimes, is consistent with recent observations of enhanced land–atmosphere coupling in Mediterranean summer climates, where atmospheric aridity intensifies while precipitation and soil moisture decline [44].
Annual mean precipitation over the Mediterranean also shows no long-term change (−0.0010 mm d−1 year−1 over land and −0.0025 d−1 year−1 over the sea). Column water increases modestly (0.0152 kg m−2 year−1 for land and 0.0133 kg m−2 year−1 for the sea), consistent with thermodynamic expectations, and correlates positively with temperature (r = 0.60 and 0.62, respectively), yet without a corresponding increase in rainfall. Over land, precipitation correlates more strongly with evaporation and column water (r = 0.55 and r = 0.45, respectively) than over the sea (r = 0.17 and r = 0.30), indicating that moisture processes are more locally coupled to surface fluxes over land, whereas marine precipitation is influenced by larger-scale circulation. On one hand, warmer air enhances the potential for moisture availability, in line with the Clausius–Clapeyron relationship. On the other hand, wind speed weakening (−0.0011 m s−1 year−1) may reduce atmospheric instability and vertical motion, which both are essential ingredients for condensation and rainfall formation. As a result, the additional water vapor in the atmosphere does not efficiently convert into precipitation. This is also consistent with the observed weakening of westerlies which govern Mediterranean precipitation [45]. A complementary analysis of specific and relative humidity at 1.5 km altitude (Appendix A) supports this interpretation: specific humidity shows only a slight long-term increase, while relative humidity declines, indicating that warming has outpaced moisture accumulation and reduced saturation conditions. This represents a departure from expectations based on a mistaken (yet very common) interpretation of the Clausius–Clapeyron relationship. As explained in Koutsoyiannis [16], this interpretation relies on an invalid assumption of constant relative humidity, which would imply that warming should produce proportionally higher atmospheric moisture and precipitation. Instead, atmospheric moisture increases more slowly than temperature, relative humidity declines, and rainfall remains stable. Such departures from Clausius–Clapeyron equilibrium have also been observed for parts of the Mediterranean [46], while the stability in the precipitation regime is consistent with previous studies for the region [4,5,17]. The present analysis quantifies this decoupling by showing that rising temperature and column water occur alongside declining winds, suggesting that precipitation efficiency in the Mediterranean is influenced more by atmospheric dynamics than by moisture supply.
Overall, the findings indicate that the Mediterranean climate is undergoing pronounced surface warming, while hydrological-cycle changes remain limited. The combined behavior of temperature, energy fluxes, winds, evaporation, and precipitation suggests that the regional response is shaped more by atmospheric dynamics than by thermodynamic moisture availability. Over land, moisture limitation and weaker winds reduce latent fluxes and enhance sensible heating, whereas over the sea, wind stilling offsets the thermodynamic tendency for higher evaporation. Similarly, although lapse-rate steepening may affect boundary-layer mixing, the multi-decadal wind changes detected here are not evidently tied to this thermodynamic signal. As a result, both domains show reduced surface–atmosphere exchange despite a warmer, slightly moister atmosphere, helping explain the lack of long-term precipitation change.
Beyond deterministic trends, stochastic analysis offers a complementary perspective on Mediterranean climate variability, focusing on the temporal structure of fluctuations rather than their direction of change. This view aligns with the understanding that climate variability emerges from interactions among hydroclimatic processes operating at different temporal scales—from fast atmospheric dynamics to slower thermodynamic and hydrological adjustments [22,29,47]. The climacogram analysis confirms that Mediterranean hydroclimatic variables exhibit strong long-term persistence, with Hurst coefficients ranging from 0.55 to 0.97 across variables. This behavior is consistent with the universal presence of long-term persistence (LTP) in hydrometeorological processes, as reported in global-scale analyses by Koutsoyiannis et al. [16] for satellite-based and reanalysis data and by Dimitriadis et al. [47] for gauge-stations records, where H typically exceeded 0.75 for temperature, humidity, and wind-speed variables. The persistence detected here for temperature and energy fluxes (H ≥ 0.85) exceeds the global averages, indicating particularly strong low-frequency clustering in the Mediterranean. For precipitation, the estimated H ≈ 0.78 aligns with the range found by Iliopoulou et al. [48] for annual rainfall records worldwide (mean H ≈ 0.59 for instrumental, 0.75 for paleoclimatic reconstructions), confirming that Mediterranean rainfall follows the global pattern of scale-dependent persistence that strengthens toward longer timescales. The ordering of H values—larger for energy- and moisture-related variables and smaller for dynamical ones—indicates that thermal and hydrological processes in the Mediterranean vary more gradually and cohesively over time than wind fields. This pattern is consistent with their role in shaping long-term hydroclimatic behavior. This ordering aligns with the global-scale stochastic similarities identified by Dimitriadis et al. [47], who found systematically higher persistence in temperature, moisture, and energy-related variables than in dynamical ones. It is further consistent with the multi-scale structure of climate variability described by Franzke et al. [29], in which fast atmospheric dynamics display weaker temporal dependence while slower thermodynamic and hydrological components evolve over much longer timescales. The above results indicate that the sustained warming and the long-term stability of Mediterranean precipitation may both arise from the strong persistence characteristics of the regional climate system, rather than from a direct thermodynamic linkage.
Several limitations should be acknowledged. First, the analysis relies exclusively on ERA5 reanalysis data, which, although extensively evaluated, are subject to uncertainties related to water budget closure and may not fully capture long-term changes in Mediterranean hydrology [14,16]. The coarse spatial and temporal resolution also limits the representation of fine-scale mechanisms such as urban heat island effects, orographic circulations, and the dependence of convective precipitation on local warming. In situ measurements, particularly over the sea, remain scarce and would be valuable for constraining surface fluxes and validating reanalysis-based estimates. Moreover, the identified relationships should be interpreted as indicative associations that can help falsify oversimplified causal claims but cannot establish strong causal links. Future research should focus on resolving and validating land–sea contrasts using high-resolution observational networks and targeted regional modeling, to better understand how local processes aggregate into the large-scale hydroclimatic behavior of the Mediterranean.

6. Summary and Conclusions

This study provides a data-driven characterization of Mediterranean hydroclimatic changes during 1950–2024 using ERA5 reanalysis, integrating cross-variable relationships, land–sea contrasts, vertical atmospheric profiling, and stochastic assessment of temporal variability. By jointly examining temperature, evaporation, sensible heat, precipitation, wind fields, and atmospheric moisture across land, sea, and the unified basin, as well as multiple atmospheric layers, the analysis captures basin-wide patterns and co-evolving behavior within the Mediterranean climate system.
The results indicate a Mediterranean climate undergoing pronounced, surface-intensified warming, accompanied by divergent land–sea energy partitioning, fluctuating evaporation, and largely unchanged precipitation. Although the lapse rate has steepened, this thermodynamic signal is not accompanied by corresponding long-term changes in precipitation or winds, indicating that lower-tropospheric instability alone does not explain the observed hydroclimatic behavior. These outcomes suggest that regional hydroclimatic responses are shaped more by atmospheric dynamic constraints—such as declining winds—together with land-surface moisture limitations, than by thermodynamic warming alone. The complex and non-linear coupling among atmospheric circulation, surface conditions, and atmospheric moisture availability challenges simplified expectations that link warming directly to hydrological-cycle intensification, including those arising from constant relative-humidity interpretations of the Clausius–Clapeyron relationship. Rather than a uniform “hotspot” of climate change, the Mediterranean appears as a region where warming, circulation patterns, and surface–atmosphere feedbacks interact with substantial spatial and temporal complexity.

Author Contributions

Conceptualization, T.I. and D.K.; methodology, T.I. and D.K.; validation, T.I., N.T., P.D. and D.K.; formal analysis, T.I., M.L., C.-I.S., D.-M.T., N.T. and P.D.; investigation, T.I., M.L., C.-I.S., D.-M.T., N.T. and P.D.; data curation, M.L., C.-I.S. and D.-M.T.; writing—original draft preparation, T.I., M.L., C.-I.S., D.-M.T. and N.T.; writing—review and editing, P.D. and D.K.; visualization, T.I., M.L., C.-I.S., D.-M.T. and N.T.; supervision, T.I. All authors have read and agreed to the published version of the manuscript.

Funding

This research received no external funding.

Data Availability Statement

The original data presented in the study are openly available in ERA5 datasets at the KNMI Climate Explorer platform at https://climexp.knmi.nl/ (accessed on 30 June 2025).

Acknowledgments

We are grateful to the Academic Editor and three reviewers for encouraging and constructive comments, which helped us improve our work.

Conflicts of Interest

The authors declare no conflicts of interest.

Appendix A

Specific and Relative Humidity

Below, we present results for specific and relative humidity at the 850 hPa level (~1.5 km).
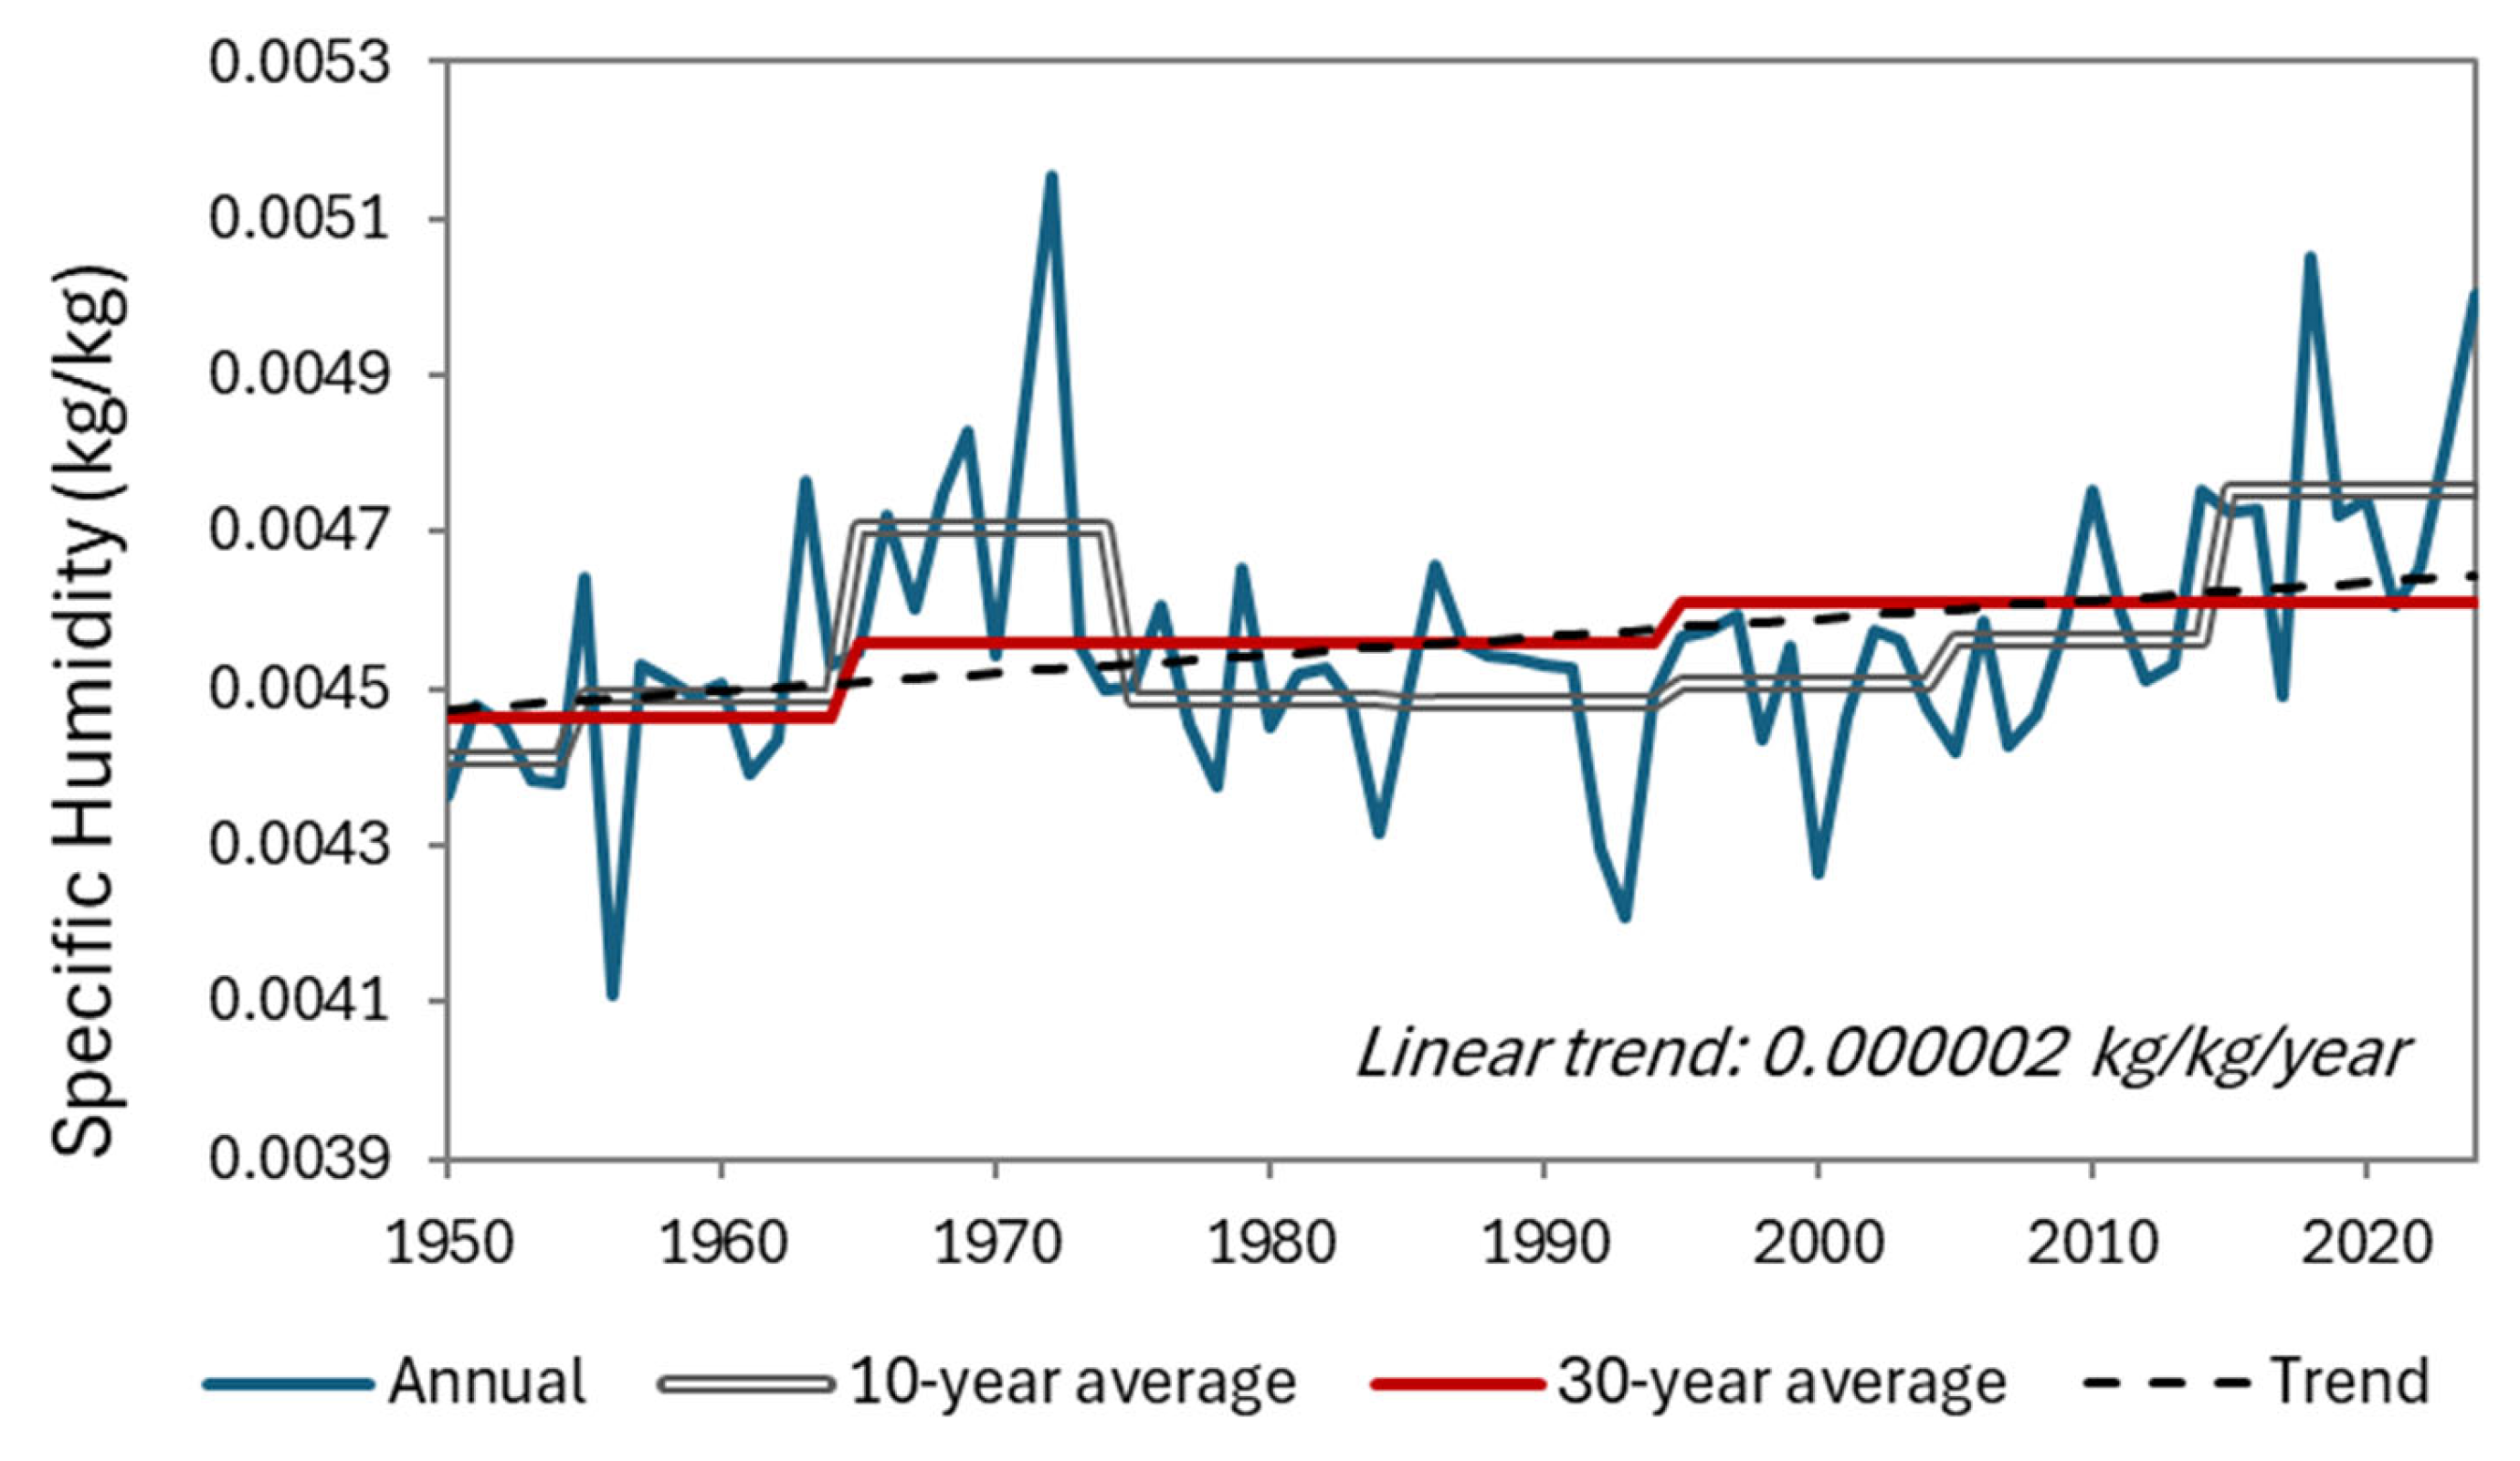
In Figure A1, specific humidity exhibits a weak but positive long-term trend during 1950–2024, with a linear slope of +0.000002 kg kg−1 year−1, indicating only a marginal increase in atmospheric moisture content. Annual values range between approximately 0.0041 and 0.0052 kg kg−1, with noticeable peaks in the early 1970s and the most recent decade. The 10-year and 30-year moving averages show a subtle upward tendency, particularly after 2000. However, a comparison of 30-year means reveals that specific humidity remained nearly unchanged—around 0.0046 kg kg−1—from 1965–1994 to 1995–2024.
Figure A1. Annual mean specific humidity, along with the 10-year and 30-year averages and the linear trend over the entire period, for the unified mask at an altitude of 1.5 km.
Water 18 00331 g0a1
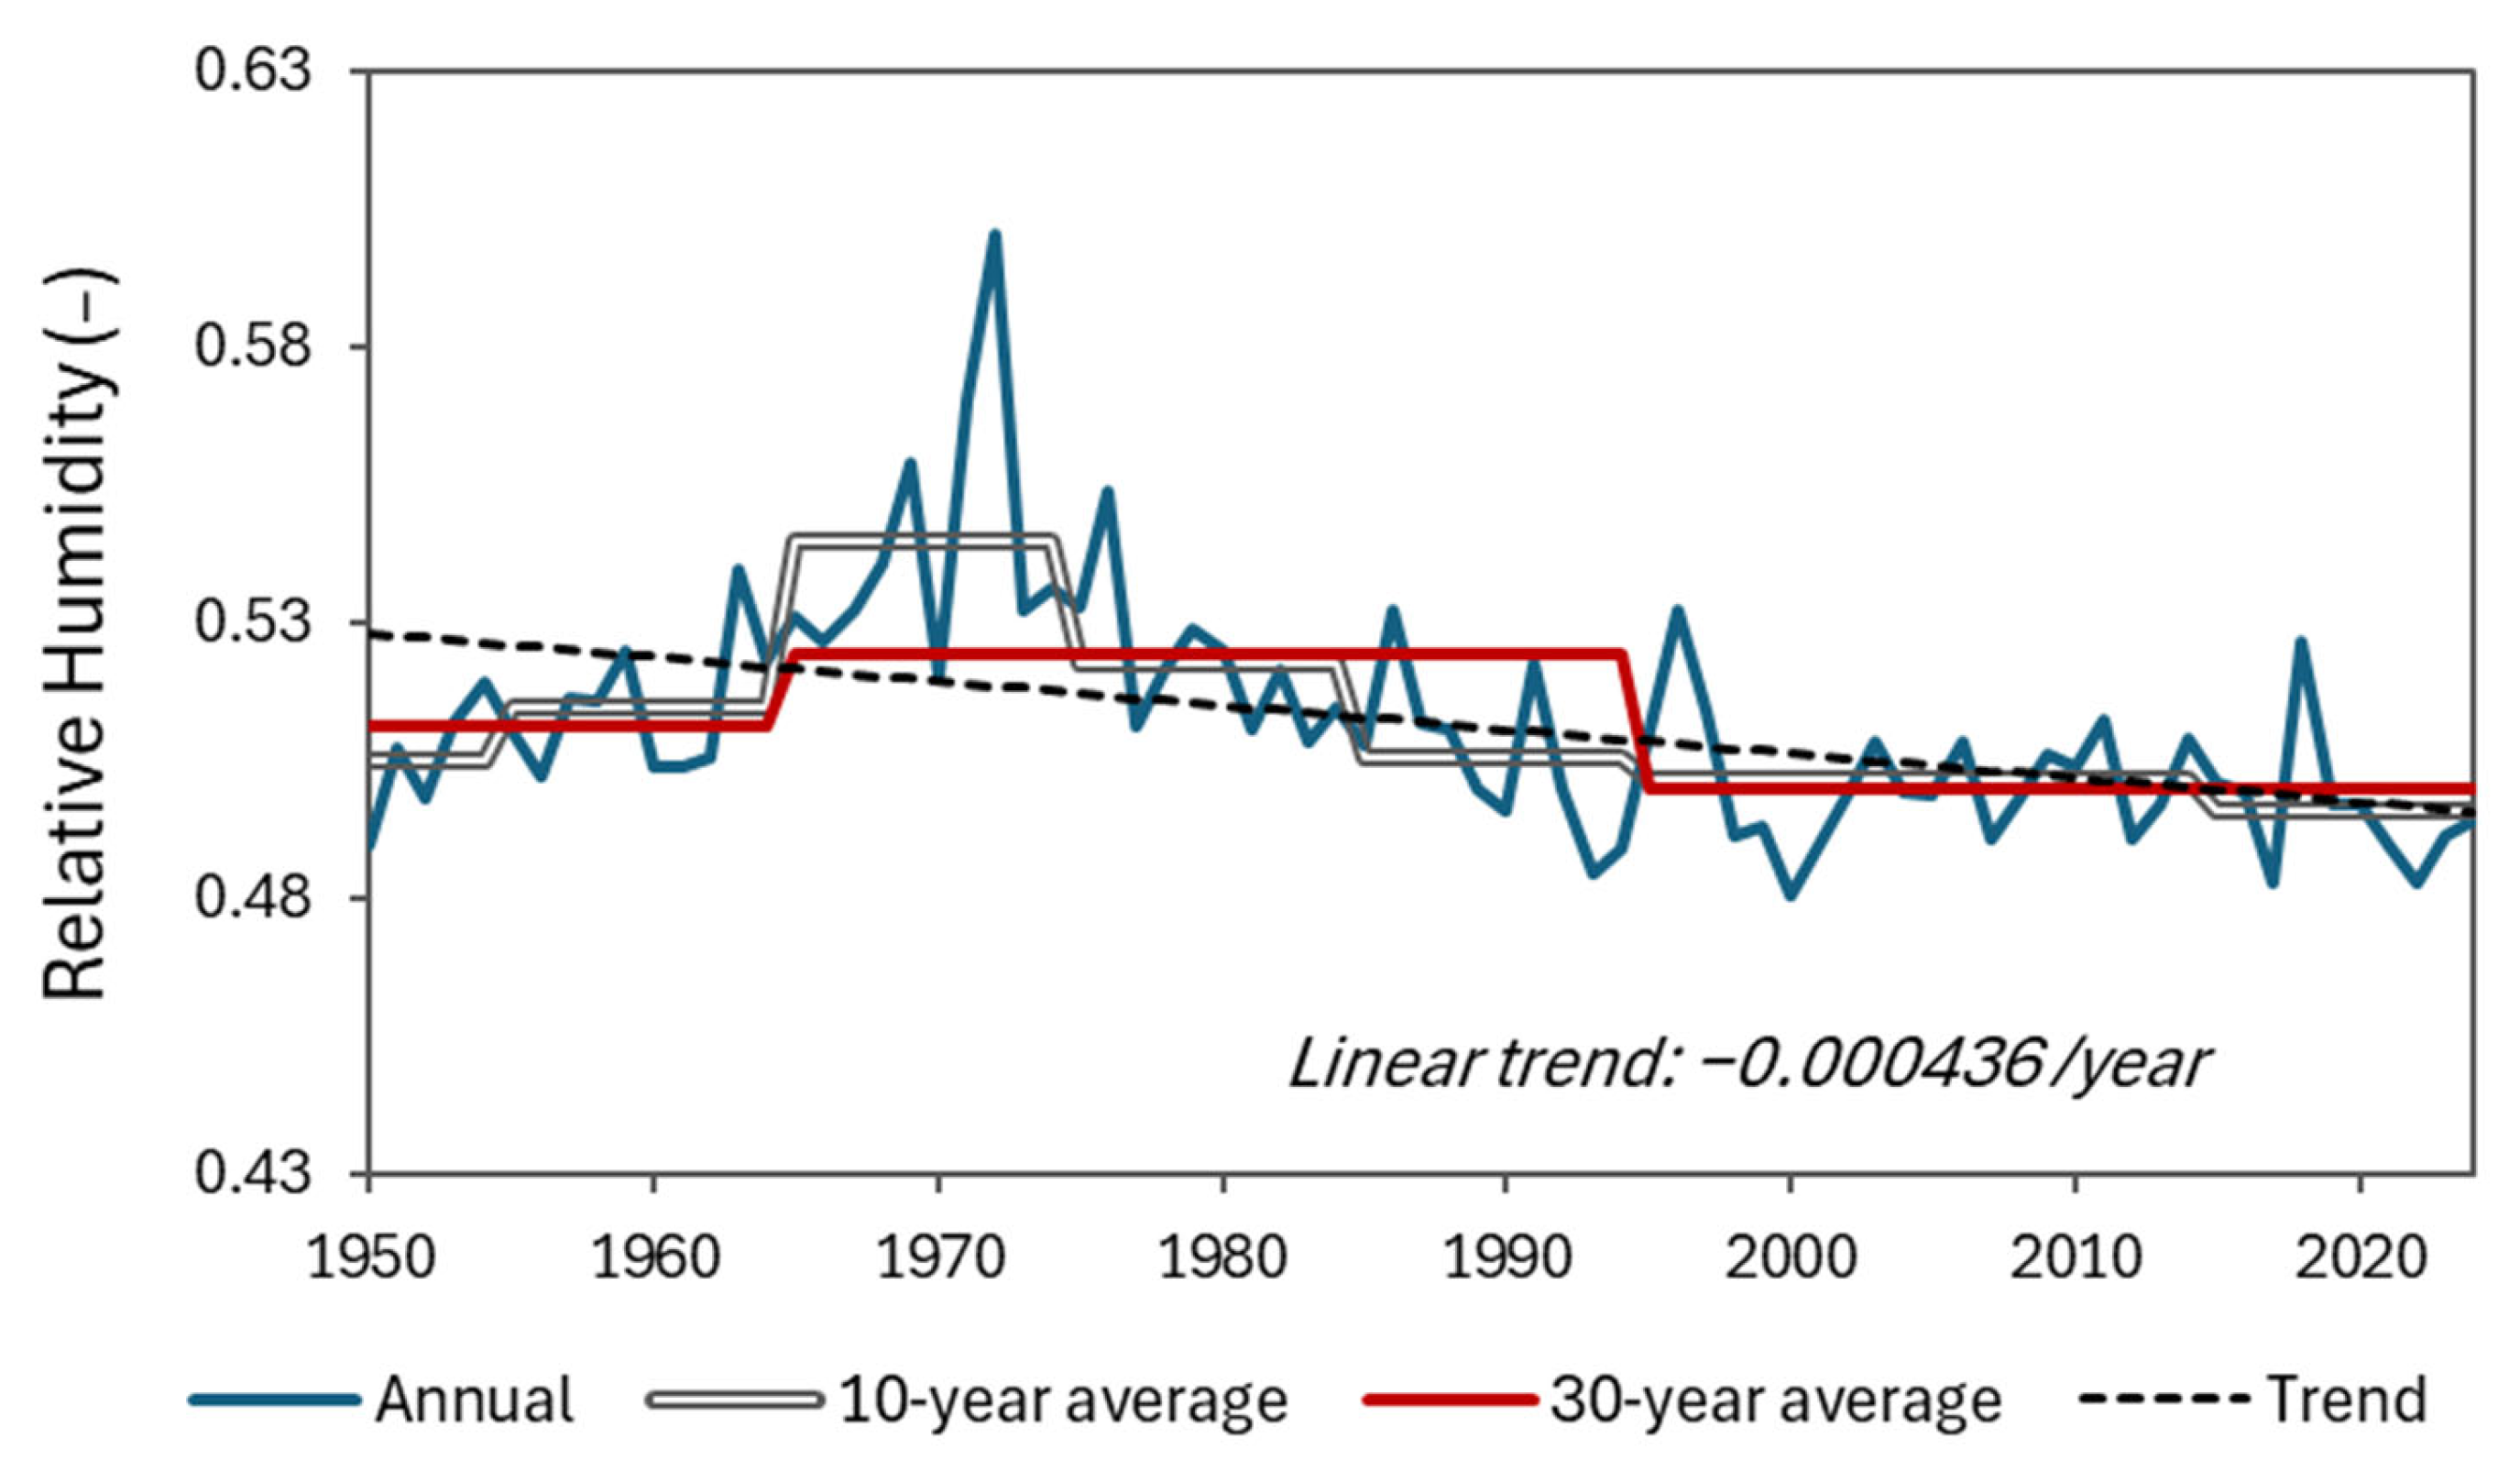
Relative humidity demonstrates a modest but persistent negative trend over 1950–2024, characterized by a linear slope of −0.0004 year−1. Interannual variability is evident, with annual mean values ranging from approximately 0.48 to 0.60 and pronounced peaks during the late 1960s and early 1970s. Both the 10-year and 30-year moving averages indicate a gradual long-term decline. A comparison of 30-year means shows a reduction from approximately 0.52 during 1965–1994 to around 0.50 during 1995–2024, suggesting that warming has increased the atmosphere’s moisture-holding capacity faster than actual moisture, leading to lower relative saturation levels.
Figure A2. Annual mean relative humidity, along with the 10-year and 30-year averages and the linear trend over the entire period, for the unified mask at an altitude of 1.5 km.
Water 18 00331 g0a2

References

  1. Giorgi, F. Climate change hot-spots. Geophys. Res. Lett. 2006, 33. [Google Scholar] [CrossRef]
  2. Intergovernmental Panel On Climate Change (IPCC). Climate Change 2022—Impacts, Adaptation and Vulnerability: Working Group II Contribution to the Sixth Assessment Report of the Intergovernmental Panel on Climate Change, 1st ed.; Cambridge University Press: Cambridge, UK, 2023. [Google Scholar] [CrossRef]
  3. Lionello, P.; Scarascia, L. The relation between climate change in the Mediterranean region and global warming. Reg. Environ. Change 2018, 18, 1481–1493. [Google Scholar] [CrossRef]
  4. Vicente-Serrano, S.M.; Tramblay, Y.; Reig, F.; González-Hidalgo, J.C.; Beguería, S.; Brunetti, M.; Kalin, K.C.; Patalen, L.; Kržič, A.; Lionello, P.; et al. High temporal variability not trend dominates Mediterranean precipitation. Nature 2025, 639, 658–666. [Google Scholar] [CrossRef] [PubMed]
  5. Koutsoyiannis, D.; Iliopoulou, T.; Koukouvinos, A.; Malamos, N.; Mamassis, N.; Dimitriadis, P.; Tepetidis, N.; Markantonis, D. In search of climate crisis in Greece using hydrological data: 404 not found. Water 2023, 15, 1711. [Google Scholar] [CrossRef]
  6. Romero, R.; Emanuel, K. Medicane Risk in a Changing Climate. JGR Atmos. 2013, 118, 5992–6001. [Google Scholar] [CrossRef]
  7. Amiri, A.; Gumiere, S.J.; Gharabaghi, B.; Bonakdari, H. From Warm Seas to Flooded Streets: The Impact of Sea Surface Temperature on Cutoff Low and Extreme Rainfall in Valencia, Spain. J. Flood Risk Manag. 2025, 18, e13055. [Google Scholar] [CrossRef]
  8. Argüeso, D.; Marcos, M.; Amores, A. Storm Daniel Fueled by Anomalously High Sea Surface Temperatures in the Mediterranean. npj Clim. Atmos. Sci. 2024, 7, 307. [Google Scholar] [CrossRef]
  9. Caloiero, T.; Caroletti, G.N.; Coscarelli, R. IMERG-Based Meteorological Drought Analysis over Italy. Climate 2021, 9, 65. [Google Scholar] [CrossRef]
  10. Tramblay, Y.; Koutroulis, A.; Samaniego, L.; Vicente-Serrano, S.M.; Volaire, F.; Boone, A.; Le Page, M.; Llasat, M.C.; Albergel, C.; Burak, S.; et al. Challenges for Drought Assessment in the Mediterranean Region under Future Climate Scenarios. Earth-Sci. Rev. 2020, 210, 103348. [Google Scholar] [CrossRef]
  11. Diakakis, M.; Papagiannaki, K.; Fouskaris, M. The Occurrence of Catastrophic Multiple-Fatality Flash Floods in the Eastern Mediterranean Region. Water 2022, 15, 119. [Google Scholar] [CrossRef]
  12. Stefanakos, C. Global Wind and Wave Climate Based on Two Reanalysis Databases: ECMWF ERA5 and NCEP CFSR. J. Mar. Sci. Eng. 2021, 9, 990. [Google Scholar] [CrossRef]
  13. Muñoz-Sabater, J.; Dutra, E.; Agustí-Panareda, A.; Albergel, C.; Arduini, G.; Balsamo, G.; Boussetta, S.; Choulga, M.; Harrigan, S.; Hersbach, H.; et al. ERA5-Land: A State-of-the-Art Global Reanalysis Dataset for Land Applications. Earth Syst. Sci. Data 2021, 13, 4349–4383. [Google Scholar] [CrossRef]
  14. Tootoonchi, R.; Bordoni, S.; D’Agostino, R. Revisiting the Moisture Budget of the Mediterranean Region in the ERA5 Reanalysis. Weather Clim. Dyn. 2025, 6, 245–263. [Google Scholar] [CrossRef]
  15. Senatore, A.; Furnari, L.; Nikravesh, G.; Castagna, J.; Mendicino, G. Increasing Daily Extreme and Declining Annual Precipitation in Southern Europe: A Modeling Study on the Effects of Mediterranean Warming. EGUsphere 2025, 1567. [Google Scholar] [CrossRef]
  16. Koutsoyiannis, D. Revisiting global hydrological cycle: Is it intensifying? Hydrol. Earth Syst. Sci. Discuss. 2020, 24, 3899–3932. [Google Scholar] [CrossRef]
  17. Iliopoulou, T.; Koutsoyiannis, D. Have Rainfall Patterns Changed? A Global Analysis of Long-Term Rainfall Records and Re-Analysis Data; The Heritage Foundation: Washington, DC, USA, 2025. [Google Scholar]
  18. Efthymiadis, D.; Goodess, C.M.; Jones, P.D. Trends in Mediterranean Gridded Temperature Extremes and Large-Scale Circulation Influences. Nat. Hazards Earth Syst. Sci. 2011, 11, 2199–2214. [Google Scholar] [CrossRef]
  19. Kotsias, G.; Lolis, C.J. Air Temperature Extremes in the Mediterranean Region (1940–2024): Synoptic Patterns and Trends. Atmosphere 2025, 16, 852. [Google Scholar] [CrossRef]
  20. Tuel, A.; Eltahir, E.A.B. Why Is the Mediterranean a Climate Change Hot Spot? J. Clim. 2020, 33, 5829–5843. [Google Scholar] [CrossRef]
  21. Skliris, N.; Zika, J.D.; Herold, L.; Josey, S.A.; Marsh, R. Mediterranean sea water budget long-term trend inferred from salinity observations. Clim. Dyn. 2018, 51, 2857–2876. [Google Scholar] [CrossRef]
  22. Koutsoyiannis, D. Hurst-Kolmogorov Dynamics and Uncertainty 1. JAWRA J. Am. Water Resour. Assoc. 2011, 47, 481–495. [Google Scholar] [CrossRef]
  23. KNMI Climate Explorer. C2022 de Bilt: Koninklijk Nederlands Meteorologisch Instituut (KNMI). Available online: https://climexp.knmi.nl/start.cgi (accessed on 30 June 2025).
  24. Hersbach, H.; Bell, B.; Berrisford, P.; Hirahara, S.; Horányi, A.; Muñoz-Sabater, J.; Nicolas, J.; Peubey, C.; Radu, R.; Schepers, D.; et al. The ERA5 Global Reanalysis. Q. J. R. Meteorol. Soc. 2020, 146, 1999–2049. [Google Scholar] [CrossRef]
  25. US Government Printing Office (GPO). U.S. Standard Atmosphere, 1976; NOAA: Washington, DC, USA; NASA: Washington, DC, USA; USAF: Washington, DC, USA, 1976. [Google Scholar]
  26. Cohn, T.A.; Lins, H.F. Nature’s style: Naturally trendy. Geophys. Res. Lett. 2005, 32, L23402. [Google Scholar] [CrossRef]
  27. Serinaldi, F.; Kilsby, C.G.; Lombardo, F. Untenable nonstationarity: An assessment of the fitness for purpose of trend tests in hydrology. Adv. Water Resour. 2018, 111, 132–155. [Google Scholar] [CrossRef]
  28. Hamed, K.H. Trend detection in hydrologic data: The Mann–Kendall trend test under the scaling hypothesis. J. Hydrol. 2008, 349, 350–363. [Google Scholar] [CrossRef]
  29. Franzke, C.L.; Barbosa, S.; Blender, R.; Fredriksen, H.B.; Laepple, T.; Lambert, F.; Nilsen, T.; Rypdal, K.; Rypdal, M.; Scotto, M.G.; et al. The structure of climate variability across scales. Rev. Geophys. 2020, 58, e2019RG000657. [Google Scholar] [CrossRef]
  30. Zeng, X.; Reeves Eyre, J.J.; Dixon, R.D.; Arevalo, J. Quantifying the occurrence of record hot years through normalized warming trends. Geophys. Res. Lett. 2021, 48, e2020GL091626. [Google Scholar] [CrossRef]
  31. Coumou, D.; Robinson, A.; Rahmstorf, S. Global increase in record-breaking monthly-mean temperatures. Clim. Change 2013, 118, 771–782. [Google Scholar] [CrossRef]
  32. Koskinas, A.; Zaharopoulou, E.; Pouliasis, G.; Deligiannis, I.; Dimitriadis, P.; Iliopoulou, T.; Mamassis, N.; Koutsoyiannis, D. Estimating the Statistical Significance of Cross–Correlations between Hydroclimatic Processes in the Presence of Long–Range Dependence. Earth 2022, 3, 1027–1041. [Google Scholar] [CrossRef]
  33. Dimitriadis, P.; Koutsoyiannis, D. Climacogram versus autocovariance and power spectrum in stochastic modelling for Markovian and Hurst–Kolmogorov processes. Stoch. Environ. Res. Risk Assess. 2015, 29, 1649–1669. [Google Scholar] [CrossRef]
  34. Kubin, E.; Menna, M.; Mauri, E.; Notarstefano, G.; Mieruch, S.; Poulain, P.-M. Heat content and temperature trends in the Mediterranean Sea as derived from Argo float data. Frontiers in Marine Science. Front. Mar. Sci. 2023, 10, 1271638. [Google Scholar] [CrossRef]
  35. García-Monteiro, S.; Sobrino, J.A.; Julien, Y.; Sòria, G.; Skokovic, D. Surface Temperature trends in the Mediterranean Sea from MODIS data during years 2003–2019. Reg. Stud. Mar. Sci. 2022, 49, 102086. [Google Scholar] [CrossRef]
  36. Hawkins, E.; Williams, R.G.; Young, P.J.; Berardelli, J.; Burgess, S.N.; Highwood, E.; Randel, W.; Roussenov, V.; Smith, D.; Placky, B.W. Warming Stripes spark climate conversations: From the ocean to the stratosphere. Bull. Am. Meteorol. Soc. 2025, 106, E964–E970. [Google Scholar] [CrossRef]
  37. Koutsoyiannis, D.; Tsakalias, G. Unsettling the settled: Simple musings on the complex climatic system. Front. Complex Syst. 2025, 3, 1617092. [Google Scholar] [CrossRef]
  38. Krichak, S.O.; Breitgand, J.S.; Gualdi, S.; Feldstein, S.B. Teleconnection–extreme precipitation relationships over the Mediterranean region. Theor. Appl. Climatol. 2014, 117, 679–692. [Google Scholar] [CrossRef]
  39. Mariotti, A.; Dell’Aquila, A. Decadal climate variability in the Mediterranean region: Roles of large-scale forcings and regional processes. Clim. Dyn. 2012, 38, 1129–1145. [Google Scholar] [CrossRef]
  40. Xoplaki, E.; González-Rouco, J.F.; Luterbacher, J.U.; Wanner, H. Wet season Mediterranean precipitation variability: Influence of large-scale dynamics and trends. Clim. Dyn. 2004, 23, 63–78. [Google Scholar] [CrossRef]
  41. Ma, N.; Zhang, Y.; Yang, Y. Recent decline in global ocean evaporation due to wind stilling. Geophys. Res. Lett. 2025, 52, e2024GL114256. [Google Scholar] [CrossRef]
  42. Jung, M.; Reichstein, M.; Ciais, P.; Seneviratne, S.I.; Sheffield, J.; Goulden, M.L.; Bonan, G.; Cescatti, A.; Chen, J.; De Jeu, R.; et al. Recent decline in the global land evapotranspiration trend due to limited moisture supply. Nature 2010, 467, 951–954. [Google Scholar] [CrossRef]
  43. McVicar, T.R.; Roderick, M.L.; Donohue, R.J.; Li, L.T.; Van Niel, T.G.; Thomas, A.; Grieser, J.; Jhajharia, D.; Himri, Y.; Mahowald, N.M.; et al. Global review and synthesis of trends in observed terrestrial near-surface wind speeds: Implications for evaporation. J. Hydrol. 2012, 416, 182–205. [Google Scholar] [CrossRef]
  44. Liu, L.; Gudmundsson, L.; Hauser, M.; Qin, D.; Li, S.; Seneviratne, S.I. Soil moisture dominates dryness stress on ecosystem production globally. Nat. Commun. 2020, 11, 4892. [Google Scholar] [CrossRef]
  45. Dayan, U.; Nissen, K.; Ulbrich, U. Atmospheric conditions inducing extreme precipitation over the eastern and western Mediterranean. Nat. Hazards Earth Syst. Sci. 2015, 15, 2525–2544. [Google Scholar] [CrossRef]
  46. Drobinski, P.; Alonzo, B.; Bastin, S.; Silva, N.D.; Muller, C. Scaling of precipitation extremes with temperature in the French Mediterranean region: What explains the hook shape? J. Geophys. Res. Atmos. 2016, 121, 3100–3119. [Google Scholar] [CrossRef]
  47. Dimitriadis, P.; Koutsoyiannis, D.; Iliopoulou, T.; Papanicolaou, P. A global-scale investigation of stochastic similarities in marginal distribution and dependence structure of key hydrological-cycle processes. Hydrology 2021, 8, 59. [Google Scholar] [CrossRef]
  48. Iliopoulou, T.; Papalexiou, S.M.; Markonis, Y.; Koutsoyiannis, D. Revisiting long-range dependence in annual precipitation. J. Hydrol. 2018, 556, 891–900. [Google Scholar] [CrossRef]
Figure 1. ERA5-based mask for the Mediterranean region.
Water 18 00331 g001
Figure 2. Workflow diagram illustrating the general methodology.
Water 18 00331 g002
Figure 3. Annual mean series of hydroclimatic variables over Mediterranean land (a,c,e,g,i,k,m) and sea (b,d,f,h,j,l,n) for 1950–2024, shown with 10-year and 30-year moving averages and linear trends. Variables include temperature, zonal and meridional winds, column water, evaporation, precipitation, and sensible heat flux.
Water 18 00331 g003aWater 18 00331 g003b
Figure 4. Pearson correlation matrices of annual mean hydroclimatic variables for the Mediterranean (a) land and (b) sea domains.
Water 18 00331 g004
Figure 5. Co-evolution of near-surface temperature (2–10 m) and the vertical temperature gradient (lapse rate, plotted as −dT/dz) for the Mediterranean region from 1950 to 2024, shown using dual y-axes to facilitate comparison.
Water 18 00331 g005
Figure 6. Co-evolution of annual mean pairs of hydroclimatic variables for the integrated Mediterranean domain during 1950–2024: (a) temperature–evaporation, (b) temperature–precipitation, (c) temperature–wind speed, (d) evaporation–precipitation, (e) wind speed–precipitation, and (f) wind speed–evaporation. Each panel uses dual y-axes and reports the corresponding Pearson correlation coefficient.
Water 18 00331 g006
Figure 7. Pearson correlation matrix among all examined hydroclimatic variables for the integrated Mediterranean domain at the surface level (annual means, 1950–2024).
Water 18 00331 g007
Figure 8. Standardized climacograms (variance vs. timescale) of the examined hydroclimatic variables, shown together with the theoretical white-noise climacogram and the estimated Hurst parameters.
Water 18 00331 g008
Table 1. List of variables examined at different altitudes, with a monthly temporal resolution and a spatial resolution of 0.25°: the X-axis comprises 1440 steps (0.00° E to 359.75° E) and the Y-axis comprises 721 steps (90.00° N to 90.00° S).
VariablesUnitsAltitude
Surface2–10 m850 hPa500 hPa200 hPa
0.01 km1.5 km5.6 km11.8 km
Temperature°C
Zonal Windm/s
Meridional Windm/s
Wind Speedm/s
Column Waterkg/m2
Relative Humidity(-)
Evaporationmm/d
Potential Evaporationmm/d
Precipitationmm/d
Latent Heat FluxW/m2
Sensible Heat FluxW/m2
Specific Humiditykg/kg
Table 2. Annual linear trends (β), standardized trends (β/σ), and 30-year mean state differences between sea and land (Δ). Trends are expressed in original units per year; standardized trends represent the trend magnitude relative to interannual variability σ and are expressed in year−1. Mean state differences Δ represent the sea–land contrast, reported as the 30-year mean over sea minus the 30-year mean over land for the baseline period (1965–1994) and the recent period (1995–2024), respectively (XY).
VariablesUnitsLand β (Unit/Year)Sea β (Unit/Year)Land β/σ (Year−1)Sea β/σ (Year−1)ΔSea-Land (1st→2nd Period)
Temperature°C0.03010.01540.040.032.25→1.78
Zonal Windm/s−0.0012−0.0019−0.01−0.010.71→0.72
Meridional Windm/s0.00050.00150.010.010.76→0.77
Column Waterkg/m20.01520.01330.020.023.86→3.95
Evaporationmm/d−0.00030.00070.000.011.87→2.09
Precipitationmm/d−0.0010−0.0025−0.01−0.020.07→0.07
Sensible Heat FluxW/m20.0460−0.02700.02−0.02−24.70→−28.88
Table 3. Annual linear trends (β) and standardized trends (β/σ) of key hydroclimatic variables at different altitudes. Trends are reported in physical units per year, while standardized trends are expressed in units of year−1, representing the rate of change relative to each variable’s interannual variability. Altitudes represent surface, near-surface (2–10 m), and pressure levels from 850 to 200 hPa.
VariablesUnitsAltitudes
Surface2–10 m850 hPa500 hPa200 hPa
0.01 km1.5 km5.6 km11.8 km
Temperature°C/year
year−1
-
-
0.0236
0.04
0.0189
0.03
0.0161
0.03
−0.0009
0.00
Zonal Wind *m/s/year
year−1
-
-
−0.0015
−0.01
−0.0041
−0.01
−0.0091
−0.01
−0.0116
−0.01
Meridional Wind *m/s/year
year−1
-
-
−0.0009
−0.01
−0.0015
−0.01
−0.0048
−0.01
−0.0108
−0.02
Wind speedm/s/year
year−1
-
-
−0.0011
−0.01
-
-
-
-
-
-
Column Waterkg/m2/year
year−1
0.0144
0.02
-
-
-
-
-
-
-
-
Relative Humidity(-)/year
year−1
-
-
-
-
−0.0004
−0.02
−0.0001
−0.01
0.0001
0.00
Evaporationmm/d/year
year−1
−0.0002
0.00
-
-
-
-
-
-
-
-
Potential Evaporationmm/d/year
year−1
0.0021
0.03
-
-
-
-
-
-
-
-
Precipitationmm/d/year
year−1
−0.00164
−0.01
-
-
-
-
-
-
-
-
Latent Heat FluxW/m2/year
year−1
0.0046
0.00
-
-
-
-
-
-
-
-
Sensible Heat FluxW/m2/year
year−1
0.0138
0.01
-
-
-
-
-
-
-
-
Specific Humiditykg/kg/year
year−1
-
-
-
-
0.000002
0.01
0.000001
0.03
0.00000
−0.01
Notes: * Signed wind components are retained because direction varies with altitude. Negative zonal trends indicate weaker westerlies, while negative meridional trends indicate stronger northerlies.
Table 4. Correlation coefficients between integrated Mediterranean values and those from land-only (a) and sea-only (b) subsets, together with the direct land–sea correlation (c), for each variable. These correlations identify the relative influence of land and sea domains on the basin-wide signal.
VariablesIntegrated–Land (a)Integrated–Sea (b)Land–Sea
(c)
Temperature0.990.970.93
Zonal Wind0.940.980.86
Meridional Wind0.960.990.90
Column water0.990.990.95
Evaporation (latent heat flux)0.190.81−0.427
Precipitation0.960.950.814
Sensible Heat Flux0.900.35−0.105
Disclaimer/Publisher’s Note: The statements, opinions and data contained in all publications are solely those of the individual author(s) and contributor(s) and not of MDPI and/or the editor(s). MDPI and/or the editor(s) disclaim responsibility for any injury to people or property resulting from any ideas, methods, instructions or products referred to in the content.