Article

Evolution of Unsteady Internal Flow and Rotordynamic Characteristics of Siphon Vertical Axial-Flow Pump During Start-Up

1
School of Mechanical Engineering, Yangzhou Polytechnic University, Yangzhou 225009, China
2
College of Hydraulic Science and Engineering, Yangzhou University, Yangzhou 225009, China
*
Author to whom correspondence should be addressed.
Water 2026, 18(17), 2178; https://doi.org/10.3390/w18172178
Submission received: 2 July 2026 / Revised: 12 August 2026 / Accepted: 31 August 2026 / Published: 3 September 2026
(This article belongs to the Section Hydraulics and Hydrodynamics)

Abstract

The start-up process of a siphon vertical axial-flow pump is accompanied by rapid internal-flow reconstruction, transient hydraulic loading and unsteady rotor response, which directly affect the operational stability of the pump system. In this study, the unsteady internal flow evolution and rotordynamic characteristics of a siphon vertical axial-flow pump during start-up were investigated using a transient numerical method with dynamic rotational-speed updating. The instantaneous impeller speed was solved based on a torque-balance equation considering motor driving torque, hydraulic resistance torque and rotor inertia, and the angular-velocity boundary condition of the rotating domain was updated at each time step through a custom UDF routine. The numerical model was validated against model-test data, and good agreement was obtained for both pump head and efficiency. Based on the validated model, the flow-angle distribution, vortex stretching term, blade-surface pressure, rotor mechanical response, radial-force time–frequency characteristics and blade-loading variation were analyzed. The results show that the internal flow in the main pump section evolves from a strongly unsteady swirling state to an axially dominated quasi-steady state. In the early stage, obvious pre-swirl, local backflow and strong vortex stretching occur near the impeller inlet, blade-tip clearance and impeller–guide-vane interaction region. With increasing rotational speed and flow rate, the disordered vortical structures are gradually suppressed, and the internal flow becomes more organized. The rotor response exhibits clear stage-dependent characteristics, and the radial force is more sensitive to local flow instability than the axial force and torque. Continuous wavelet transform and variational mode decomposition further indicate that the radial-force signal is dominated by low-frequency transient excitation in the early stage, while medium- and high-frequency modulation components appear in the later stage. This study reveals the coupling mechanism between transient internal-flow evolution and rotor dynamic response during pump start-up, providing guidance for improving the start-up stability of siphon vertical axial-flow pump systems.

1. Introduction

Large-scale low-head pumping stations are widely used in irrigation and drainage, inter-basin water transfer, urban flood control and plain-area water resource regulation. Owing to their large discharge capacity and good adaptability to low-head conditions, vertical axial-flow pumps have become important hydraulic units in such engineering projects. For siphon vertical axial-flow pump systems, the siphon outlet passage affects not only the hydraulic performance of the pump system but also the stability of transient operating processes such as start-up and shutdown. Liu et al. [1] investigated the transient flow characteristics of an axial-flow pump system during stoppage and indicated that the siphon outlet passage has an important influence on the hydraulic transition process. Fu et al. [2] studied the transient characteristics of an axial-flow pump during start-up through numerical simulation and experiment and found that the rotational speed, head and flow rate changed markedly during the acceleration stage. Zhang et al. [3] further analyzed the start-up transition process of a large vertical siphon axial-flow pump station and reported obvious transient flow phenomena during air discharge and flow establishment. More recently, Zhang et al. [4] conducted numerical and field experimental studies on a prototype axial-flow pump system considering the motion of cutoff facilities. In addition, transient operating conditions such as non-uniform suction flow, power-off and runaway processes have also been shown to induce strong variations in internal flow and hydraulic parameters [5,6,7]. These studies demonstrate that the start-up process of axial-flow pump systems is a typical hydraulic transient closely related to the operational safety of large pumping stations. However, most existing studies still focus mainly on global hydraulic parameters, while the coupling between transient internal-flow evolution and rotor mechanical response during start-up remains insufficiently clarified.
The flow behavior in a vertical axial-flow pump is influenced by the interaction among the inlet passage, rotating impeller, guide vane and downstream outlet passage. During the initial stage of start-up, the axial through-flow is still developing, and the pump may temporarily work under low-discharge or near-shutoff conditions. As a result, unstable flow phenomena such as inlet pre-rotation, local backflow, separation and residual circulation can easily appear in the flow passages. Yang et al. [8] reported that the interaction between the impeller and guide vane plays an important role in the unsteady flow field of vertical axial-flow pumps, especially in modifying the pressure distribution and flow stability. Lin et al. [9] analyzed the pressure pulsation and energy characteristics of guide vanes using the Hilbert–Huang transform, indicating that the inlet region of the guide vane is strongly influenced by the upstream rotating impeller. In addition, Yang et al. [10] investigated the internal flow and pressure fluctuation behavior in the inlet passage of an axial-flow pump under deflected inflow conditions. Duan et al. [11] experimentally investigated the correlation between pressure pulsation and vibration in an axial-flow pump, and Yang et al. [12] analyzed the pressure pulsation characteristics of a vertical submersible axial-flow pump device under bidirectional operation. Zhao et al. [13] studied the generation mechanism and control methods of secondary flows in axial-flow pump impellers, while Shi et al. [14] showed that guide-vane angles can significantly affect the performance and flow-rectification characteristics of axial-flow pumps. These studies suggest that flow instability in the impeller and guide-vane regions is not only a hydraulic performance issue but also a potential source of dynamic excitation.
Rotor–stator interactions and local fluid-force fluctuations may directly affect rotor loading and vibration response. Yang et al. [15] analyzed the flow characteristics in the impeller–guide-vane hydraulic coupling zone of an axial-flow pump as a turbine and found that the fluid force acting on the impeller and guide vane is closely related to rotor–stator interactions and is mainly concentrated in the radial direction. Duan et al. [16] further analyzed the centroid trajectory characteristics of an axial-flow pump impeller under hydraulic excitation and revealed the relationship between hydraulic excitation and rotor vibration response. Kan et al. [17] investigated the influence of non-uniform inflow on impeller forces in axial-flow pumps operating as turbines and showed that unstable inflow can change the pressure distribution and force characteristics of the impeller. From the perspective of pump rotordynamics, hydraulic excitation is generally regarded as an important source of vibration and instability. Brennen [18] systematically discussed hydrodynamic forces and rotordynamic problems in pumps. Chalghoum et al. [19] analyzed the effects of rotor–stator interactions on unsteady pressure pulsation and radial force in a centrifugal pump, and Wu et al. [20] reviewed fluid-induced excitations in pumps. These studies provide important theoretical and methodological references for pump dynamic analysis. Nevertheless, the transient rotor dynamic response during start-up, especially the evolution of radial force, has not been systematically analyzed for siphon vertical axial-flow pump systems.
Tip-clearance flow and vortex structures are another key factor affecting the stability of axial-flow pumps. Driven by the pressure difference between the blade’s pressure side and suction side, leakage flow passes through the blade-tip clearance and forms tip leakage vortices near the blade tip. Shi et al. [21] investigated tip leakage vortex dynamics and cavitation characteristics in an axial-flow pump, while Zhang et al. [22] studied the tip leakage vortex based on a modified SST k–ω turbulence model. Feng et al. [23] studied the influence of tip clearance on pressure fluctuations in an axial-flow pump and showed that tip clearance can amplify pressure pulsation in the pump. Liu and Tan [24] found that tip clearance significantly affects pressure fluctuation intensity and vortex characteristics. Hao and Tan [25] further showed that symmetric and asymmetric tip clearances can markedly change cavitation performance and radial force. Zhang et al. [26] analyzed the influence of cavitation on the dynamic characteristics of tip leakage vortices. The vortex-identification criterion proposed by Jeong and Hussain [27] provides an important theoretical basis for identifying coherent vortical structures in complex turbulent flows. During start-up, blade loading and tip pressure difference vary continuously with time; therefore, tip leakage vortices, passage vortices and wake vortices may undergo strong stretching, tilting and reorganization, thereby affecting radial-force fluctuation and rotor stability.
For non-stationary mechanical and hydraulic signals, time–frequency analysis provides an effective way to reveal transient excitation characteristics. Continuous wavelet transform can capture localized variations in signal energy in both time and frequency domains [28], while variational mode decomposition can adaptively decompose complex non-stationary signals into several intrinsic mode functions with different frequency scales [29]. Zhang et al. [30] applied VMD to fault diagnoses of rolling bearings in a multistage centrifugal pump, demonstrating its applicability to pump-related rotating machinery signals. In addition, energy loss and entropy production analyses have also been used to reveal the dissipation mechanism of internal flow in axial-flow pumps [31].
However, energy-loss analysis mainly focuses on hydraulic efficiency and local dissipation, while the mechanical response induced by unsteady flow, especially the time–frequency characteristics of radial force, still needs to be further clarified.
In summary, previous studies have made important progress in axial-flow pump transient operation, internal flow instability, rotor–stator interaction, pressure pulsation, hydraulic excitation, tip leakage vortex dynamics and pump rotordynamics. However, several issues remain unresolved. First, the coupling between transient internal-flow reconstruction and rotor dynamic response during start-up has not been fully revealed. Second, the evolution of pre-swirl, backflow, vortex stretching, tip leakage flow and guide-vane rectification has not been systematically analyzed from the perspective of rotor loading. Third, radial force, as an important indicator of transverse hydraulic excitation and rotor stability, still lacks a clear description in terms of its time-domain response, time–frequency characteristics and relationship with local unsteady flow structures.
Therefore, the present study investigates the unsteady internal flow evolution and rotordynamic characteristics of a siphon vertical axial-flow pump during start-up. A transient numerical model with dynamic rotational-speed updating is established by coupling the torque-balance equation with a custom UDF routine. The flow-angle distribution, vortex stretching term, blade-surface pressure, rotor mechanical response, radial-force time–frequency characteristics and blade-loading variation are analyzed. The objective is to reveal the coupling mechanism between internal-flow reconstruction and rotor dynamic response during start-up and to provide a theoretical reference for improving the start-up stability of siphon vertical axial-flow pump systems.

2. Geometric Model

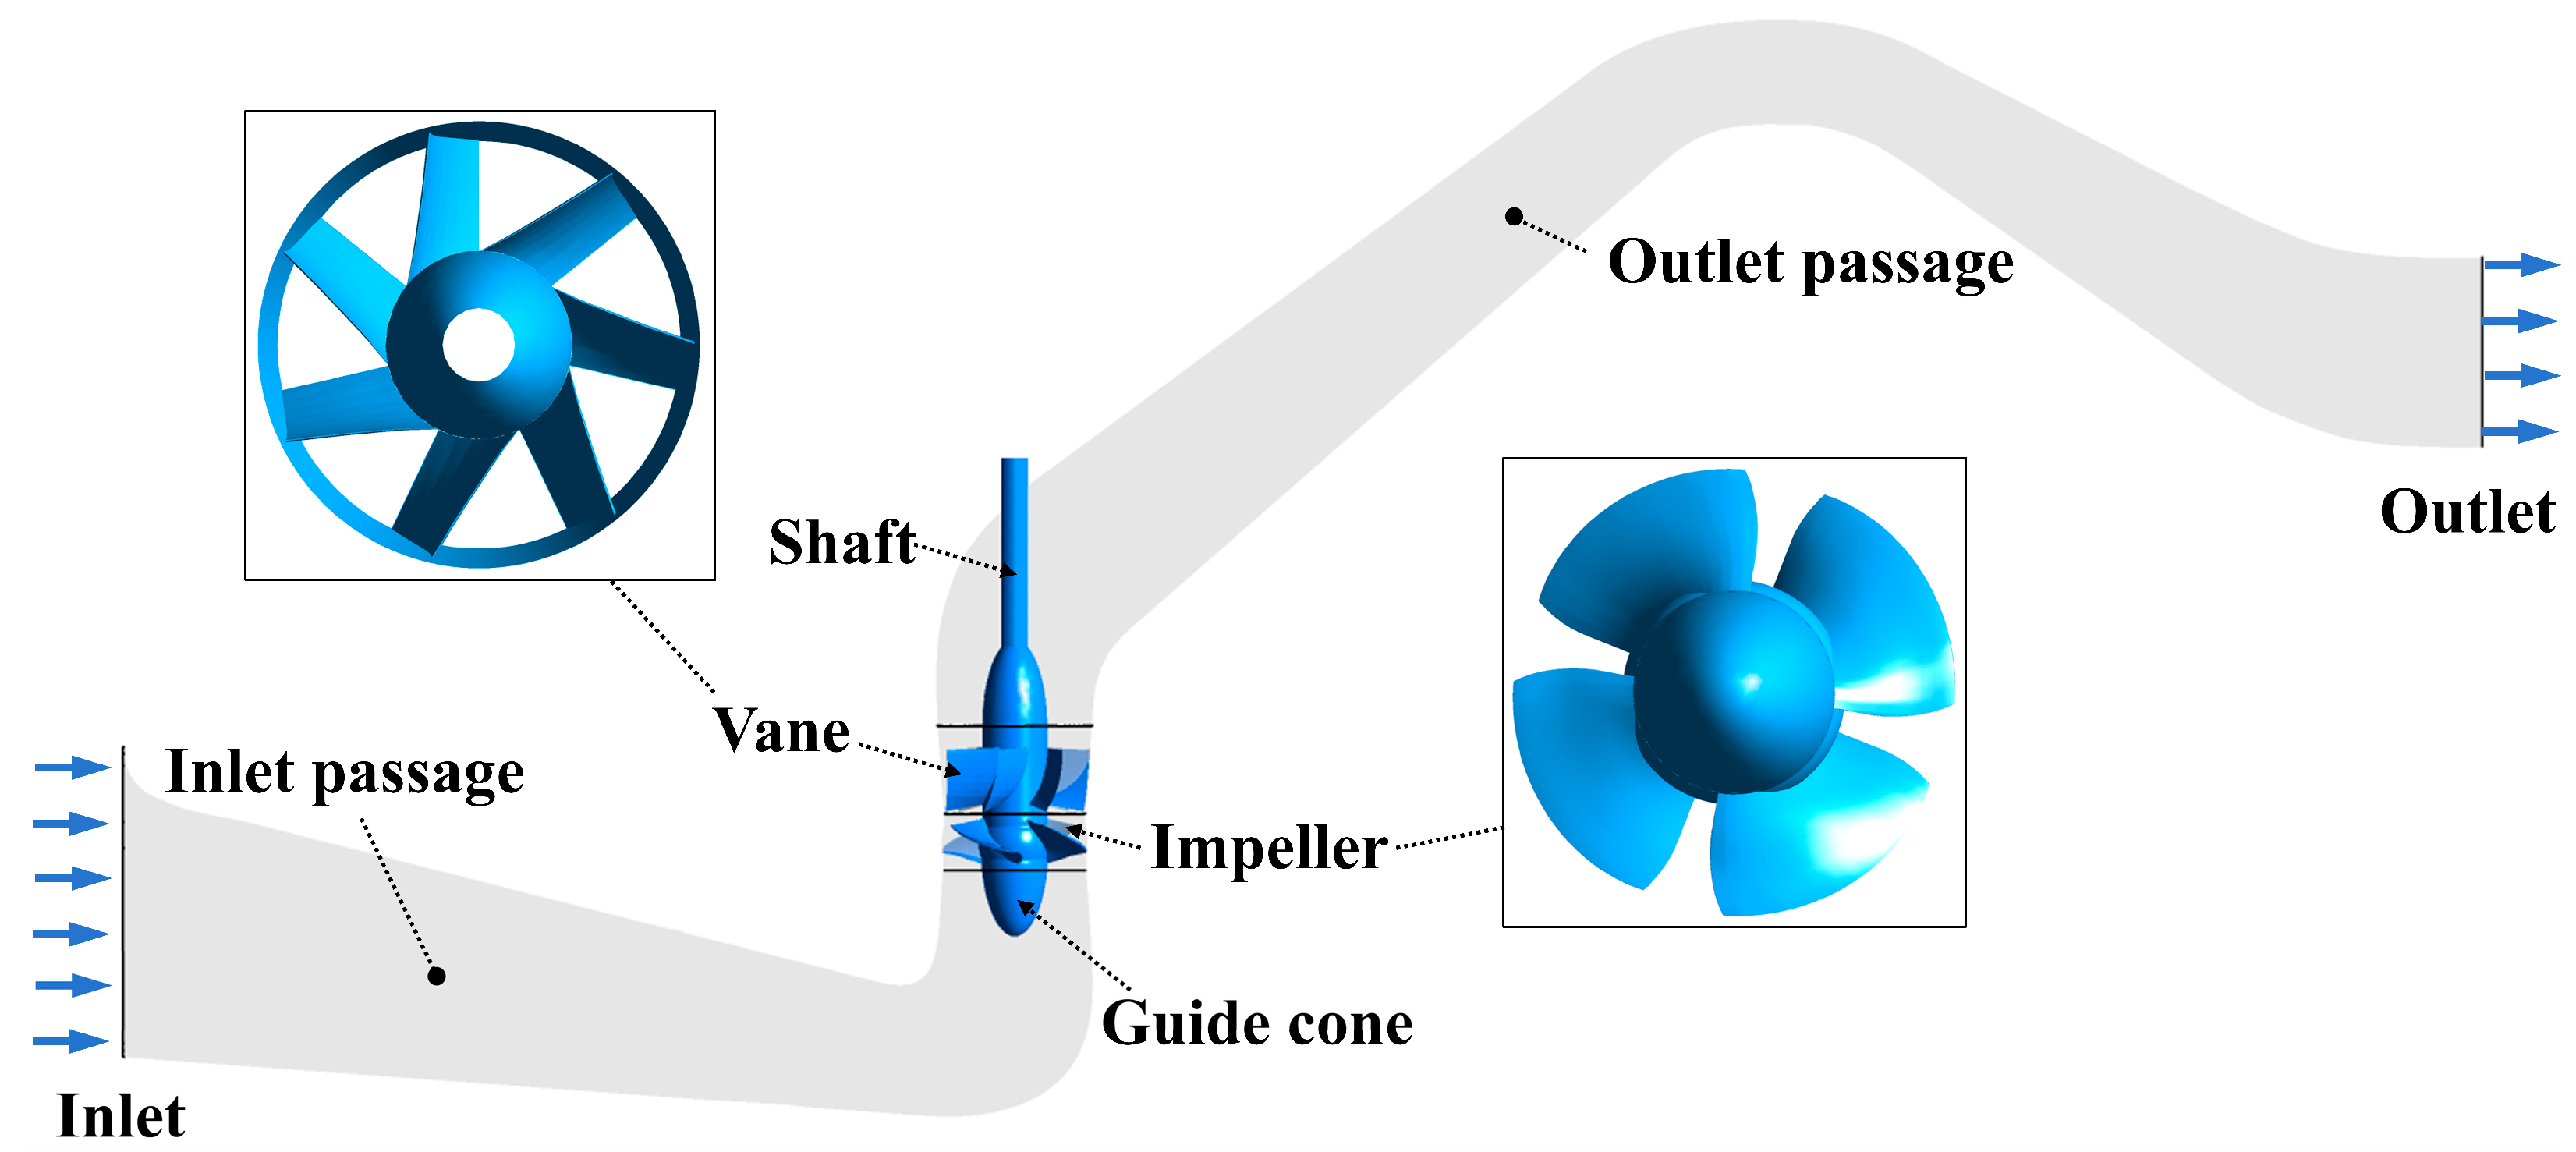
The investigated object is a siphon vertical axial-flow pump system used in a large low-head pumping station. As shown in Figure 1, the hydraulic passage was constructed according to the prototype pump system, and the main flow path from the upstream inlet to the downstream outlet was retained. Along the flow direction, the fluid first enters the inlet passage; then passes through the pump section composed of the guide cone, impeller and guide vane; and finally discharges into the siphon outlet passage. The siphon outlet passage contains a hump section, which is one of the typical structural features of this type of pump system and may influence the pressure distribution and transient flow development during start-up.
The pump section is the most important part of the computational model. It contains both rotating and stationary hydraulic components. The rotating part mainly consists of the shaft connected to the motor and the impeller. During start-up, the motor drives the shaft and transfers mechanical energy to the impeller, and the impeller further converts this mechanical input into hydraulic energy in the fluid. Upstream of the impeller, a guide cone is arranged to improve the approach flow and reduce disturbances before the fluid enters the blade passage. Downstream of the impeller, the guide vane is installed as a stationary component. Its main function is to recover part of the circumferential velocity that leaves the impeller and guide the flow toward the outlet passage, thereby improving flow direction and reducing residual swirls.
The pump model used in this study is the same siphon vertical axial-flow pump system as that investigated in a previous study [32]. The impeller adopts the TJ04-ZL-02 hydraulic model and contains four blades, while the guide vane consists of seven vanes. The main design parameters include an impeller diameter of 2100 mm, a design flow rate of 15 m3/s, a design net head of 5.30 m, maximum and minimum net heads of 6.05 m and 4.55 m, respectively, and a rated rotational speed of 187.5 r/min. In addition, the actual tip clearance between the blade tip and the casing was considered in the geometric model. This treatment is necessary because the tip-clearance region is closely related to leakage flow, local pressure imbalance and unsteady rotor loading during the start-up transient process.
In the computational domain, the impeller region was defined as the rotating domain, whereas the inlet passage, guide cone, guide vane and siphon outlet passage were treated as stationary domains. This arrangement allows the numerical model to capture the interaction between the rotating impeller and the stationary guide vane. Therefore, the established model can reasonably represent the main hydraulic components, rotor–stator configuration and local flow characteristics of the siphon vertical axial-flow pump system, providing the geometric basis for the subsequent analysis of unsteady internal flow and rotordynamic response during start-up.

3. Numerical Model

3.1. Grid and Irrelevance Validation

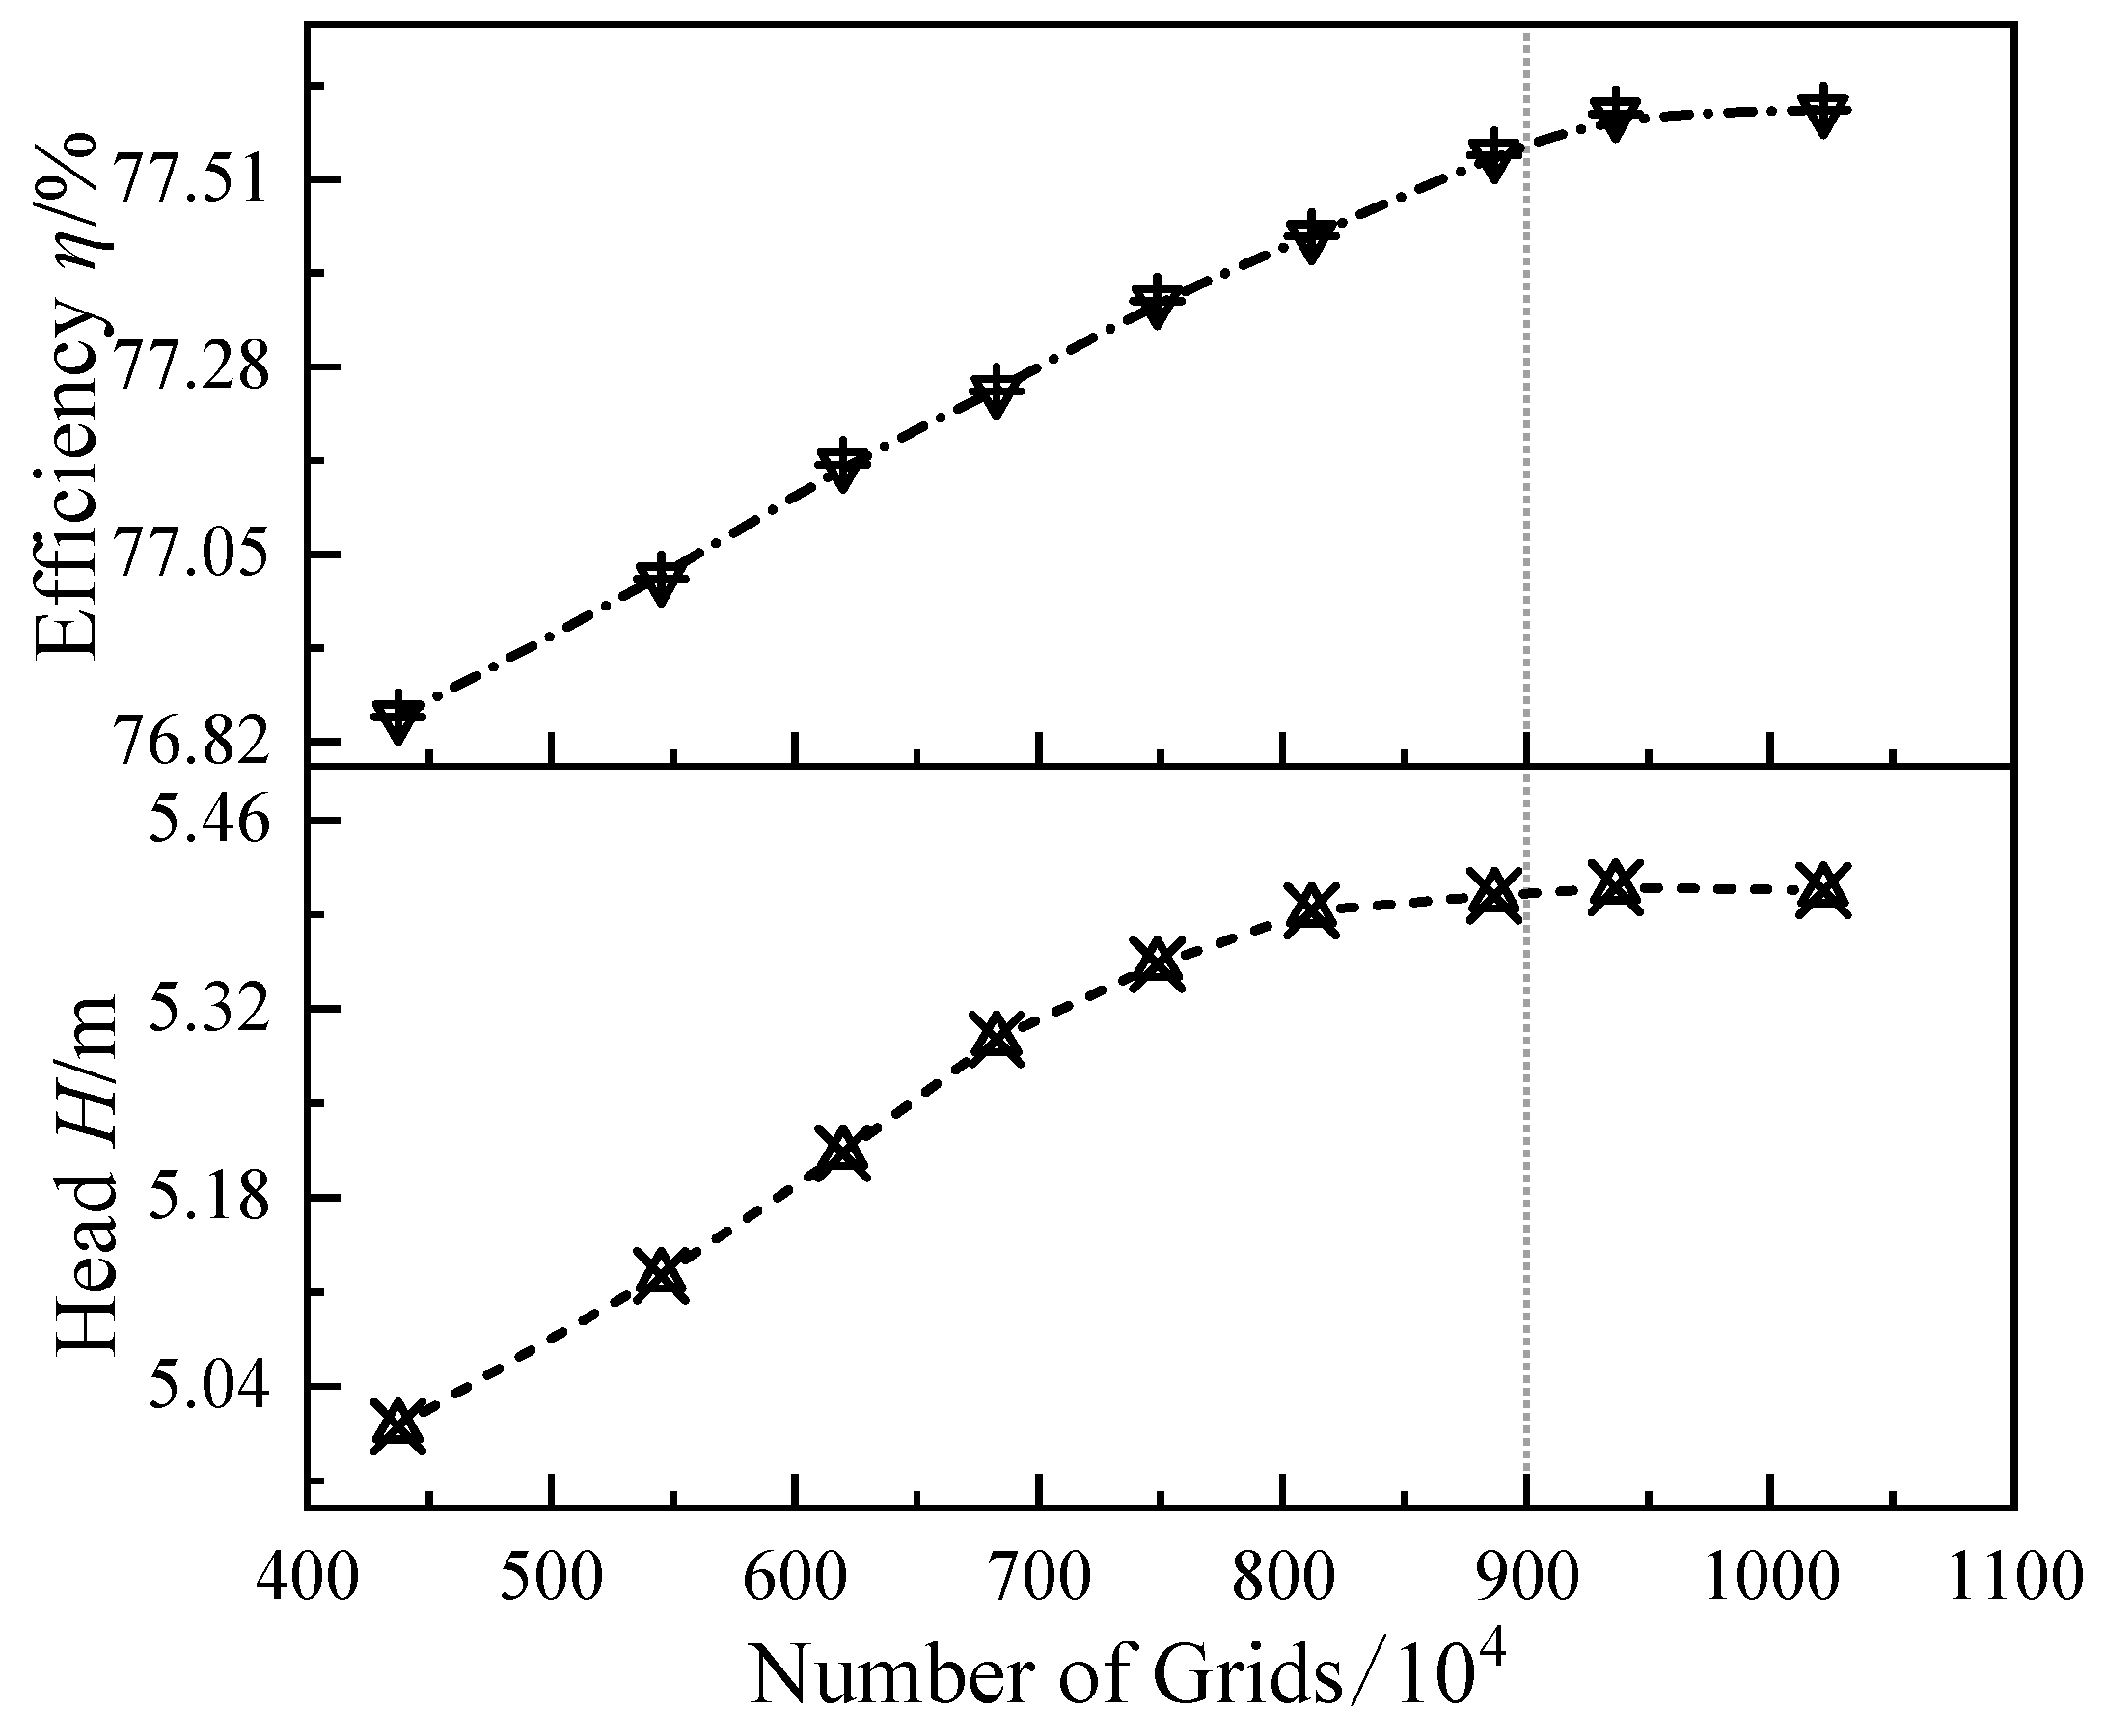
To minimize the influence of mesh resolutions on the numerical results and to ensure the reliability of subsequent unsteady simulations, a mesh independence study was performed under the design operating condition. Several mesh schemes with different cell numbers were generated, while the boundary conditions and numerical settings were kept identical. The pump head and hydraulic efficiency were selected as the evaluation indicators. As shown in Figure 2, both the predicted head and efficiency fluctuate noticeably when relatively coarse meshes are used, indicating that the flow features in the impeller, guide vane and tip-clearance regions cannot be fully resolved. As the mesh number increases, the variations in head and efficiency gradually decrease. When the total cell number exceeds approximately 9.0 × 10⁶, further mesh refinement causes only minor changes in both quantities, suggesting that the numerical results are nearly independent of the mesh resolution. Considering the balance between computational accuracy and cost, the mesh scheme with approximately 9.0 × 10⁶ cells was adopted for the following start-up transient simulations.
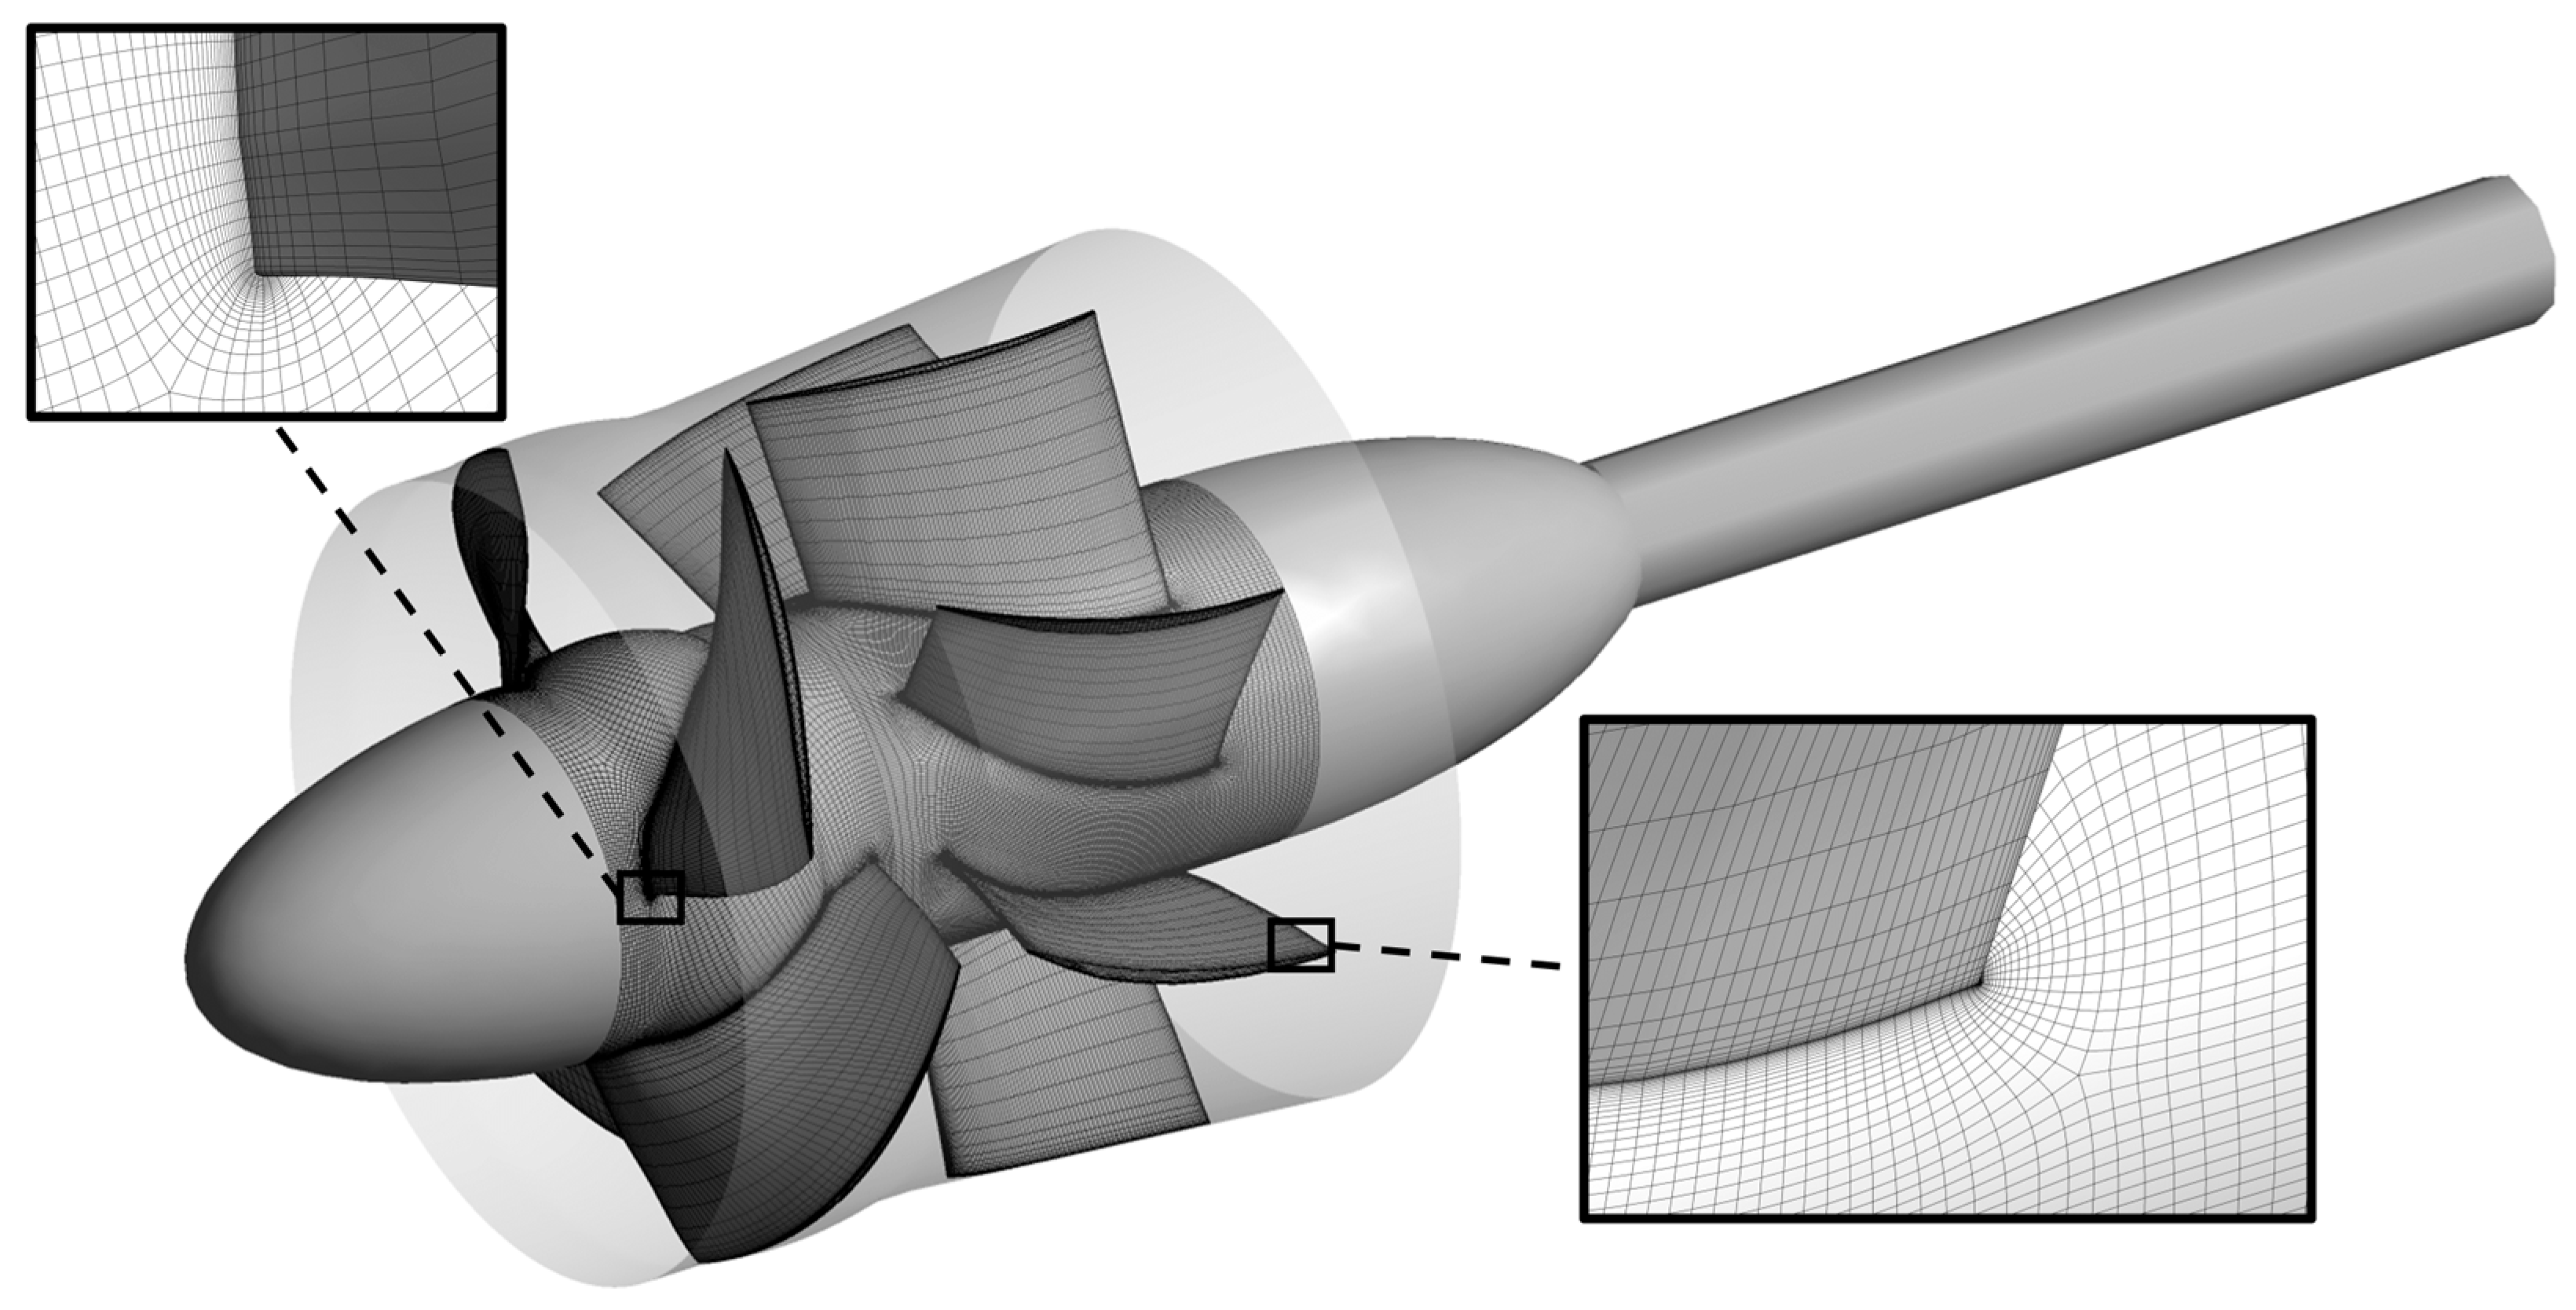
Based on the mesh independence verification, the computational domain was discretized using structured hexahedral meshes. The mesh distribution and local details of the impeller and guide vane are presented in Figure 3. Considering the complex unsteady flow in the impeller, guide vane and near-wall regions during start-up, local mesh refinement was applied near the blade surfaces, leading and trailing edges, hub and shroud walls, and blade-tip clearance. This refinement improves the spatial resolution in key flow regions. In particular, the refined mesh in the tip-clearance region is beneficial for capturing the transient leakage flow and the associated local vortex structures. Overall, the adopted structured mesh provides an appropriate description of the geometric boundaries and near-wall flow features in the impeller and guide-vane regions, thereby providing a reliable mesh basis for subsequent unsteady numerical simulations.

3.2. Governing Equations and Numerical Methods

The transient flow field of the siphon vertical axial-flow pump system during start-up was numerically investigated using ANSYS Fluent 19.2. In the simulation, water was treated as an incompressible Newtonian fluid, and the unsteady Reynolds-averaged Navier–Stokes equations were adopted as the governing equations. For incompressible turbulent flow, the continuity and momentum equations can be expressed as follows:
u i ¯ x i = 0
ρ u i ¯ t + u j ¯ u i ¯ x j = p ¯ x i + μ 2 u i ¯ x j x j ρ u i u j ¯ x j + S i
where u i ¯ and u j ¯ are the Reynolds-averaged velocity components, x i and x j are the Cartesian coordinate components, ρ is the fluid density, p ¯ is the Reynolds-averaged pressure, μ is the dynamic viscosity, ρ u i u j ¯ is the Reynolds stress term, and S i represents the source term associated with the rotating frame and external body forces.
To close the RANS equations, the Reynolds stress term was modeled using the Boussinesq hypothesis:
ρ u i u j ¯ = μ t u i ¯ x j + u j ¯ x i 2 3 ρ k δ i j
where μ t is the turbulent eddy viscosity, k is the turbulent kinetic energy, and δ i j is the Kronecker delta.
Owing to the complex flow phenomena occurring in the impeller and guide-vane regions, such as adverse pressure-gradient effects, flow separation, tip-clearance leakage and vortex evolution, the shear stress transport (SST) k–ω turbulence model was selected for turbulence closure. This model integrates the advantages of the standard k–ω formulation in the near-wall region and the k–ε formulation in the free-stream region, making it suitable for predicting separated flow, near-wall shear behavior and vortical structures in hydraulic machinery. The governing transport equations for the turbulent kinetic energy k and the specific dissipation rate ω are given as follows:
( ρ k ) t + ( ρ k u j ) x j = P k β * ρ k ω + x j μ + σ k μ t k x j
( ρ ω ) t + ( ρ ω u j ) x j = α ω k P k β ρ ω 2 + x j μ + σ ω μ t ω x j + 2 ( 1 F 1 ) ρ σ ω 2 1 ω k x j ω x j
μ t = ρ a 1 k max a 1 ω ,   S F 2
where Pk is the production term of turbulent kinetic energy, μt is the turbulent eddy viscosity, S is the strain-rate magnitude, F1 and F2 are the blending functions of the SST model, and α, β, β*, σk and σω are model constants.
It should also be acknowledged that the SST k–ω model used in the present URANS simulation is a two-equation RANS turbulence model. Therefore, small-scale turbulent structures cannot be fully resolved as in scale-resolving simulations such as LES or DES. However, the main objective of this study is to capture the dominant transient flow evolution and global hydrodynamic loads during the start-up process. Within this scope, the present URANS method is considered suitable for analyzing the overall transient force and torque characteristics of the siphon vertical axial-flow pump system.
In the numerical model, the inlet and outlet boundaries were specified as pressure boundaries based on the corresponding upstream and downstream water levels of the pump system. A no-slip condition was applied to all solid surfaces. The impeller zone was assigned as the rotating region, whereas the inlet passage, guide vane and outlet passage were defined as stationary regions. To resolve the transient interaction between the rotating impeller and the stationary components, transient rotor–stator interfaces were established between adjacent rotating and stationary domains.
In the present start-up simulation, the motor driving torque was updated based on the starting characteristics of the synchronous motor rather than being prescribed as a constant value. In large low-head pumping stations, the synchronous motor generally starts asynchronously and is pulled into synchronous operation when the rotational speed approaches the rated synchronous speed. Therefore, the motor driving torque varies with the instantaneous rotational speed during the start-up process.
At each time step, the instantaneous rotational speed obtained from the previous time step was used to calculate the corresponding motor driving torque according to the synchronous motor starting-torque equation. The motor driving torque can be expressed as a function of the instantaneous rotational speed and motor performance parameters:
T m n   =   f n n , U D , M m , S m , M 1 , M 2
where T m n is the motor driving torque at the current time step, n n is the instantaneous rotational speed, U D is the instantaneous stator voltage, M m is the maximum motor driving torque, S m is the critical slip, M 1 is the starting torque at zero speed, and M 2 is the pull-in torque when the motor speed approaches the synchronous speed. The specific value of T m n was calculated in the UDF routine according to the synchronous-motor starting-torque equation and the instantaneous rotational speed at each time step.
Meanwhile, the hydraulic resistance torque acting on the impeller was obtained from the transient CFD solution. Considering the torque balance of the rotating unit, the angular velocity of the impeller was updated as
I r d Ω d t = T m T h
and its discrete form can be written as
Ω n + 1 = Ω n + Δ t I r T m n T h n
where Ir is the moment of inertia of the rotating components, Ω n and Ω n + 1 are the angular velocities of the impeller at the current and next time steps, respectively, T h n is the hydraulic resistance torque obtained from the transient flow solution, and Δ t is the time-step size.
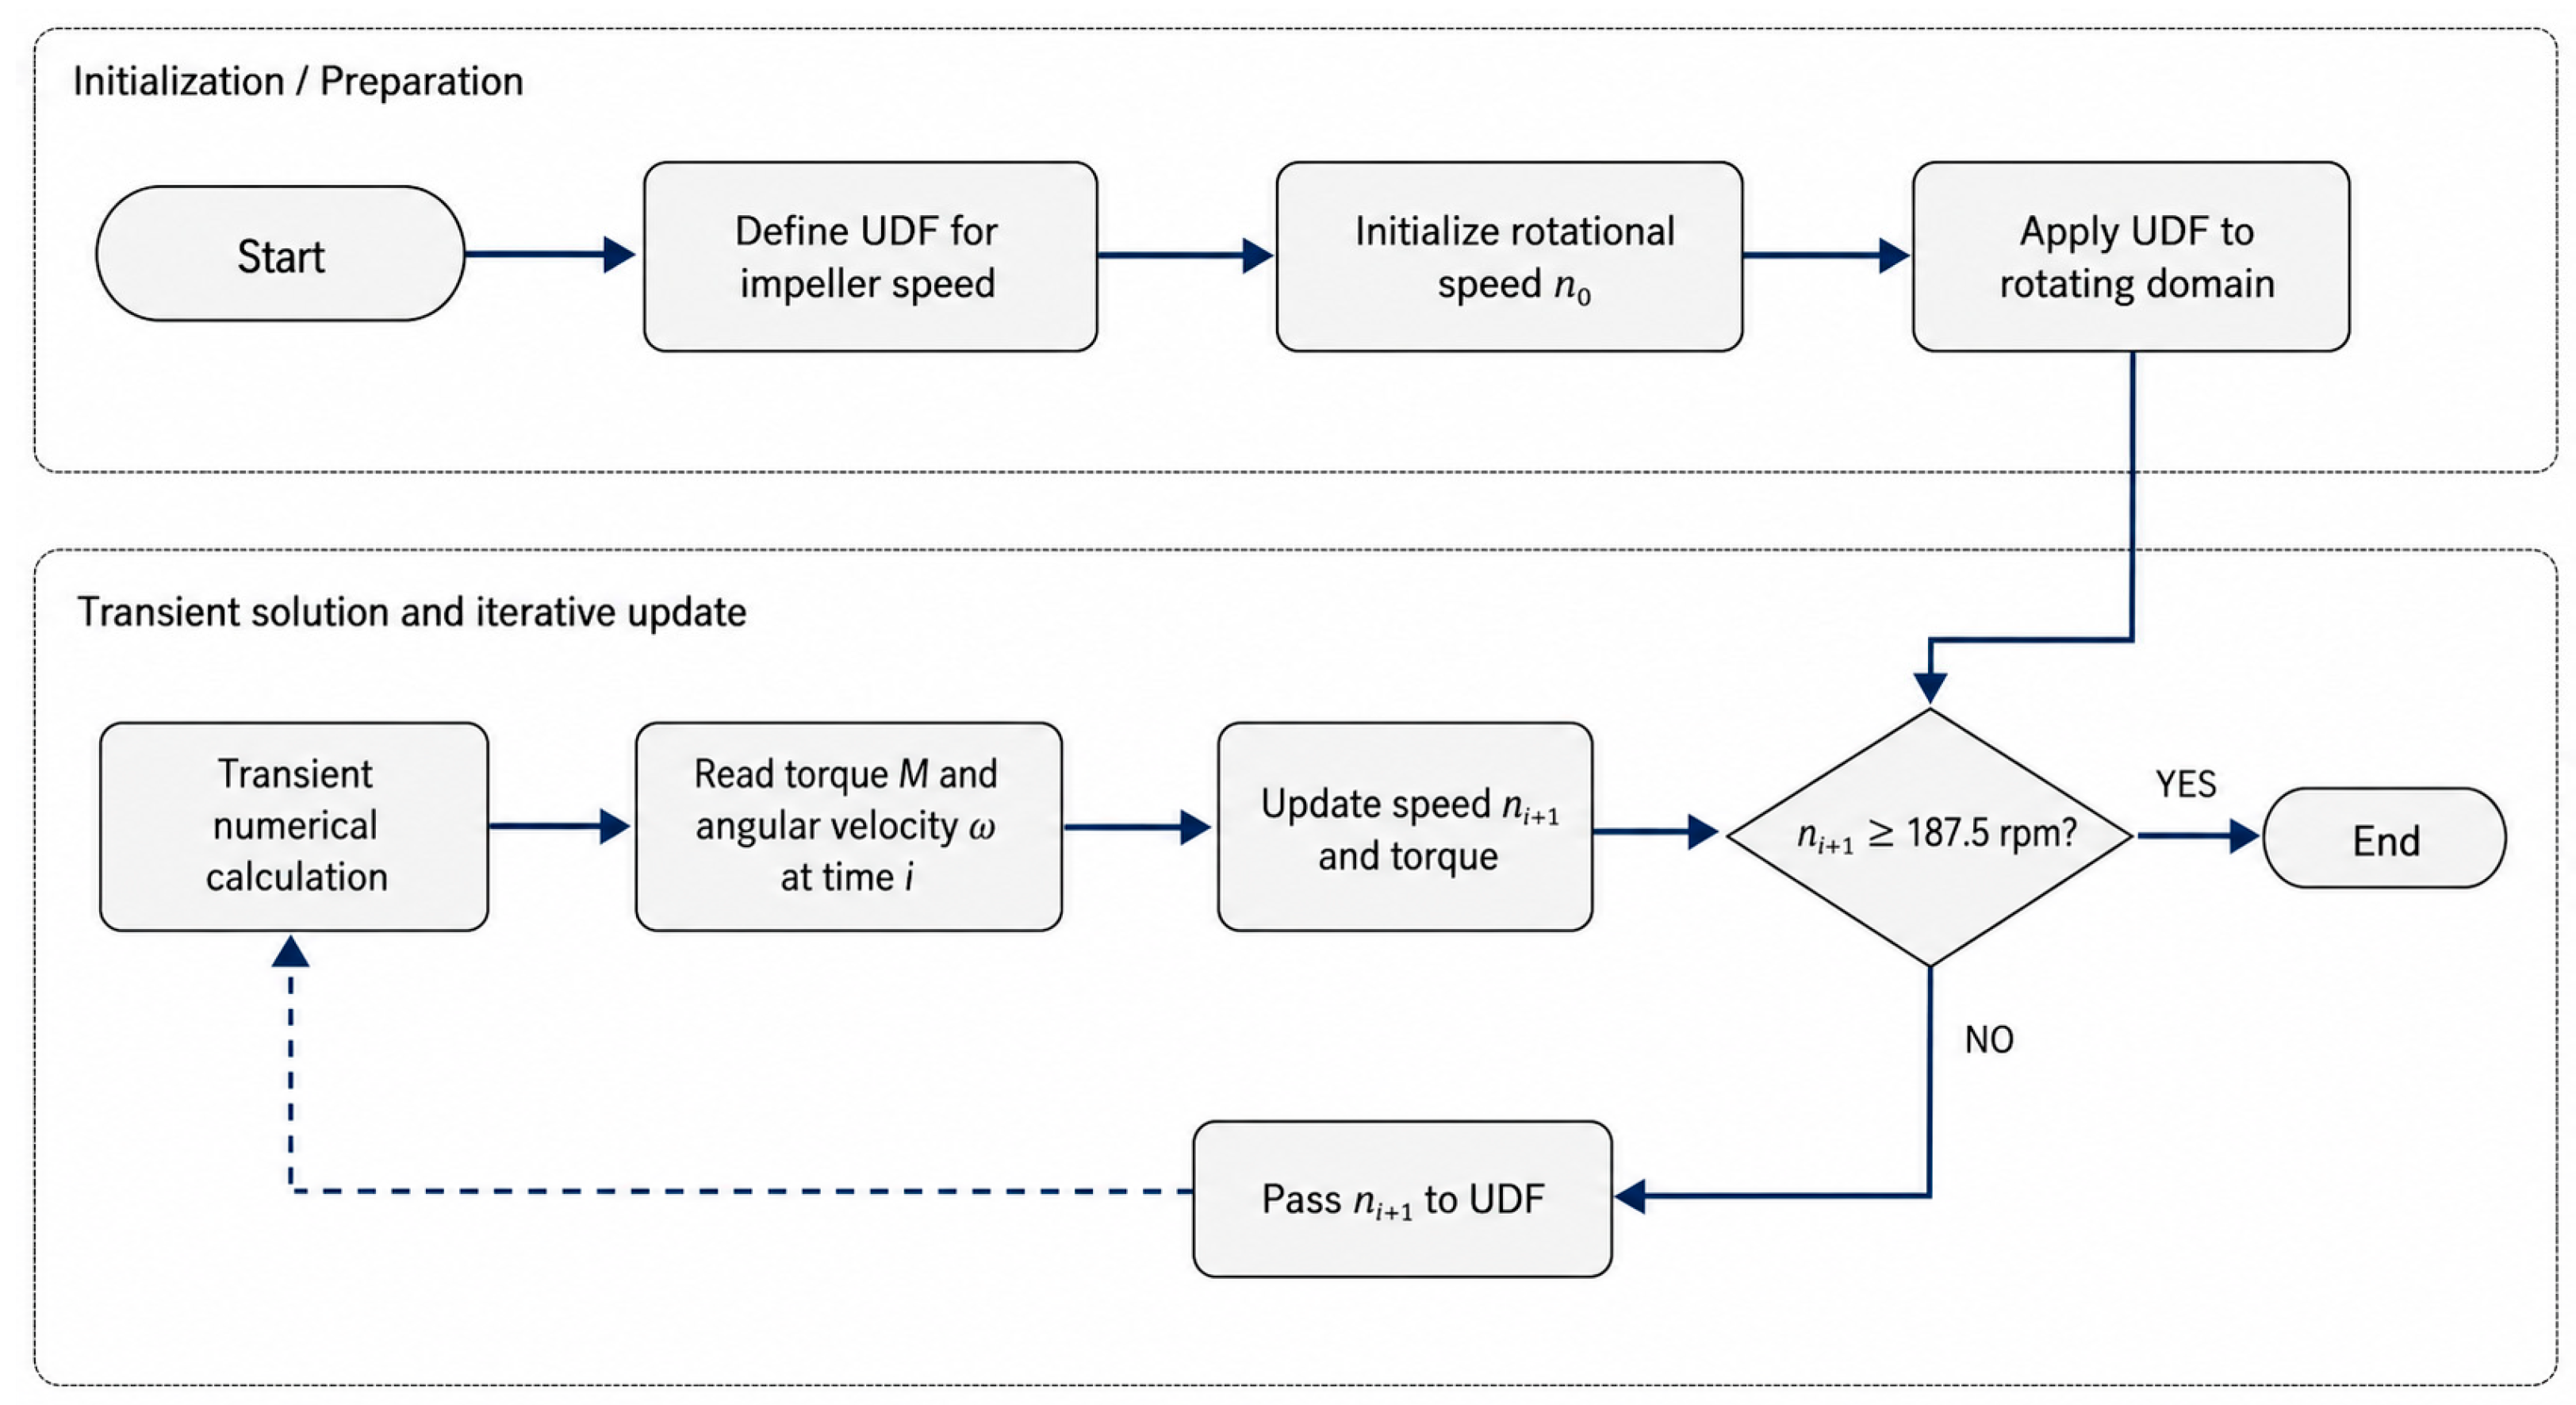
According to the motor performance characteristics and the start-up control model, the maximum allowable motor driving torque was set to 20,000 N·m. During the calculation, the UDF routine continuously calculated the instantaneous motor driving torque and hydraulic resistance torque and then updated the impeller speed according to the torque-balance equation. In this way, the start-up process was determined by the coupled interaction among motor driving torque, hydraulic resistance torque and rotor inertia rather than by prescribing a fixed rotational-speed curve.
According to the design data of the prototype pump system, the moment of inertia of the rotating assembly was specified as 0.25 kg·m2. Unlike the motor driving torque, the hydraulic resistance torque was not prescribed in advance but was obtained from the transient flow solution and updated at each time step according to the instantaneous hydraulic load acting on the impeller. To accurately capture the rapid variation in rotational speed and flow field during start-up, a time-step size of 0.001 s was adopted. The physical simulation time was set to 10 s, which was sufficient to cover the complete acceleration process from the initial stationary state to the near-stable operating condition. The computational workflow for the start-up transient simulation is illustrated in Figure 4.

4. Experimental Setup

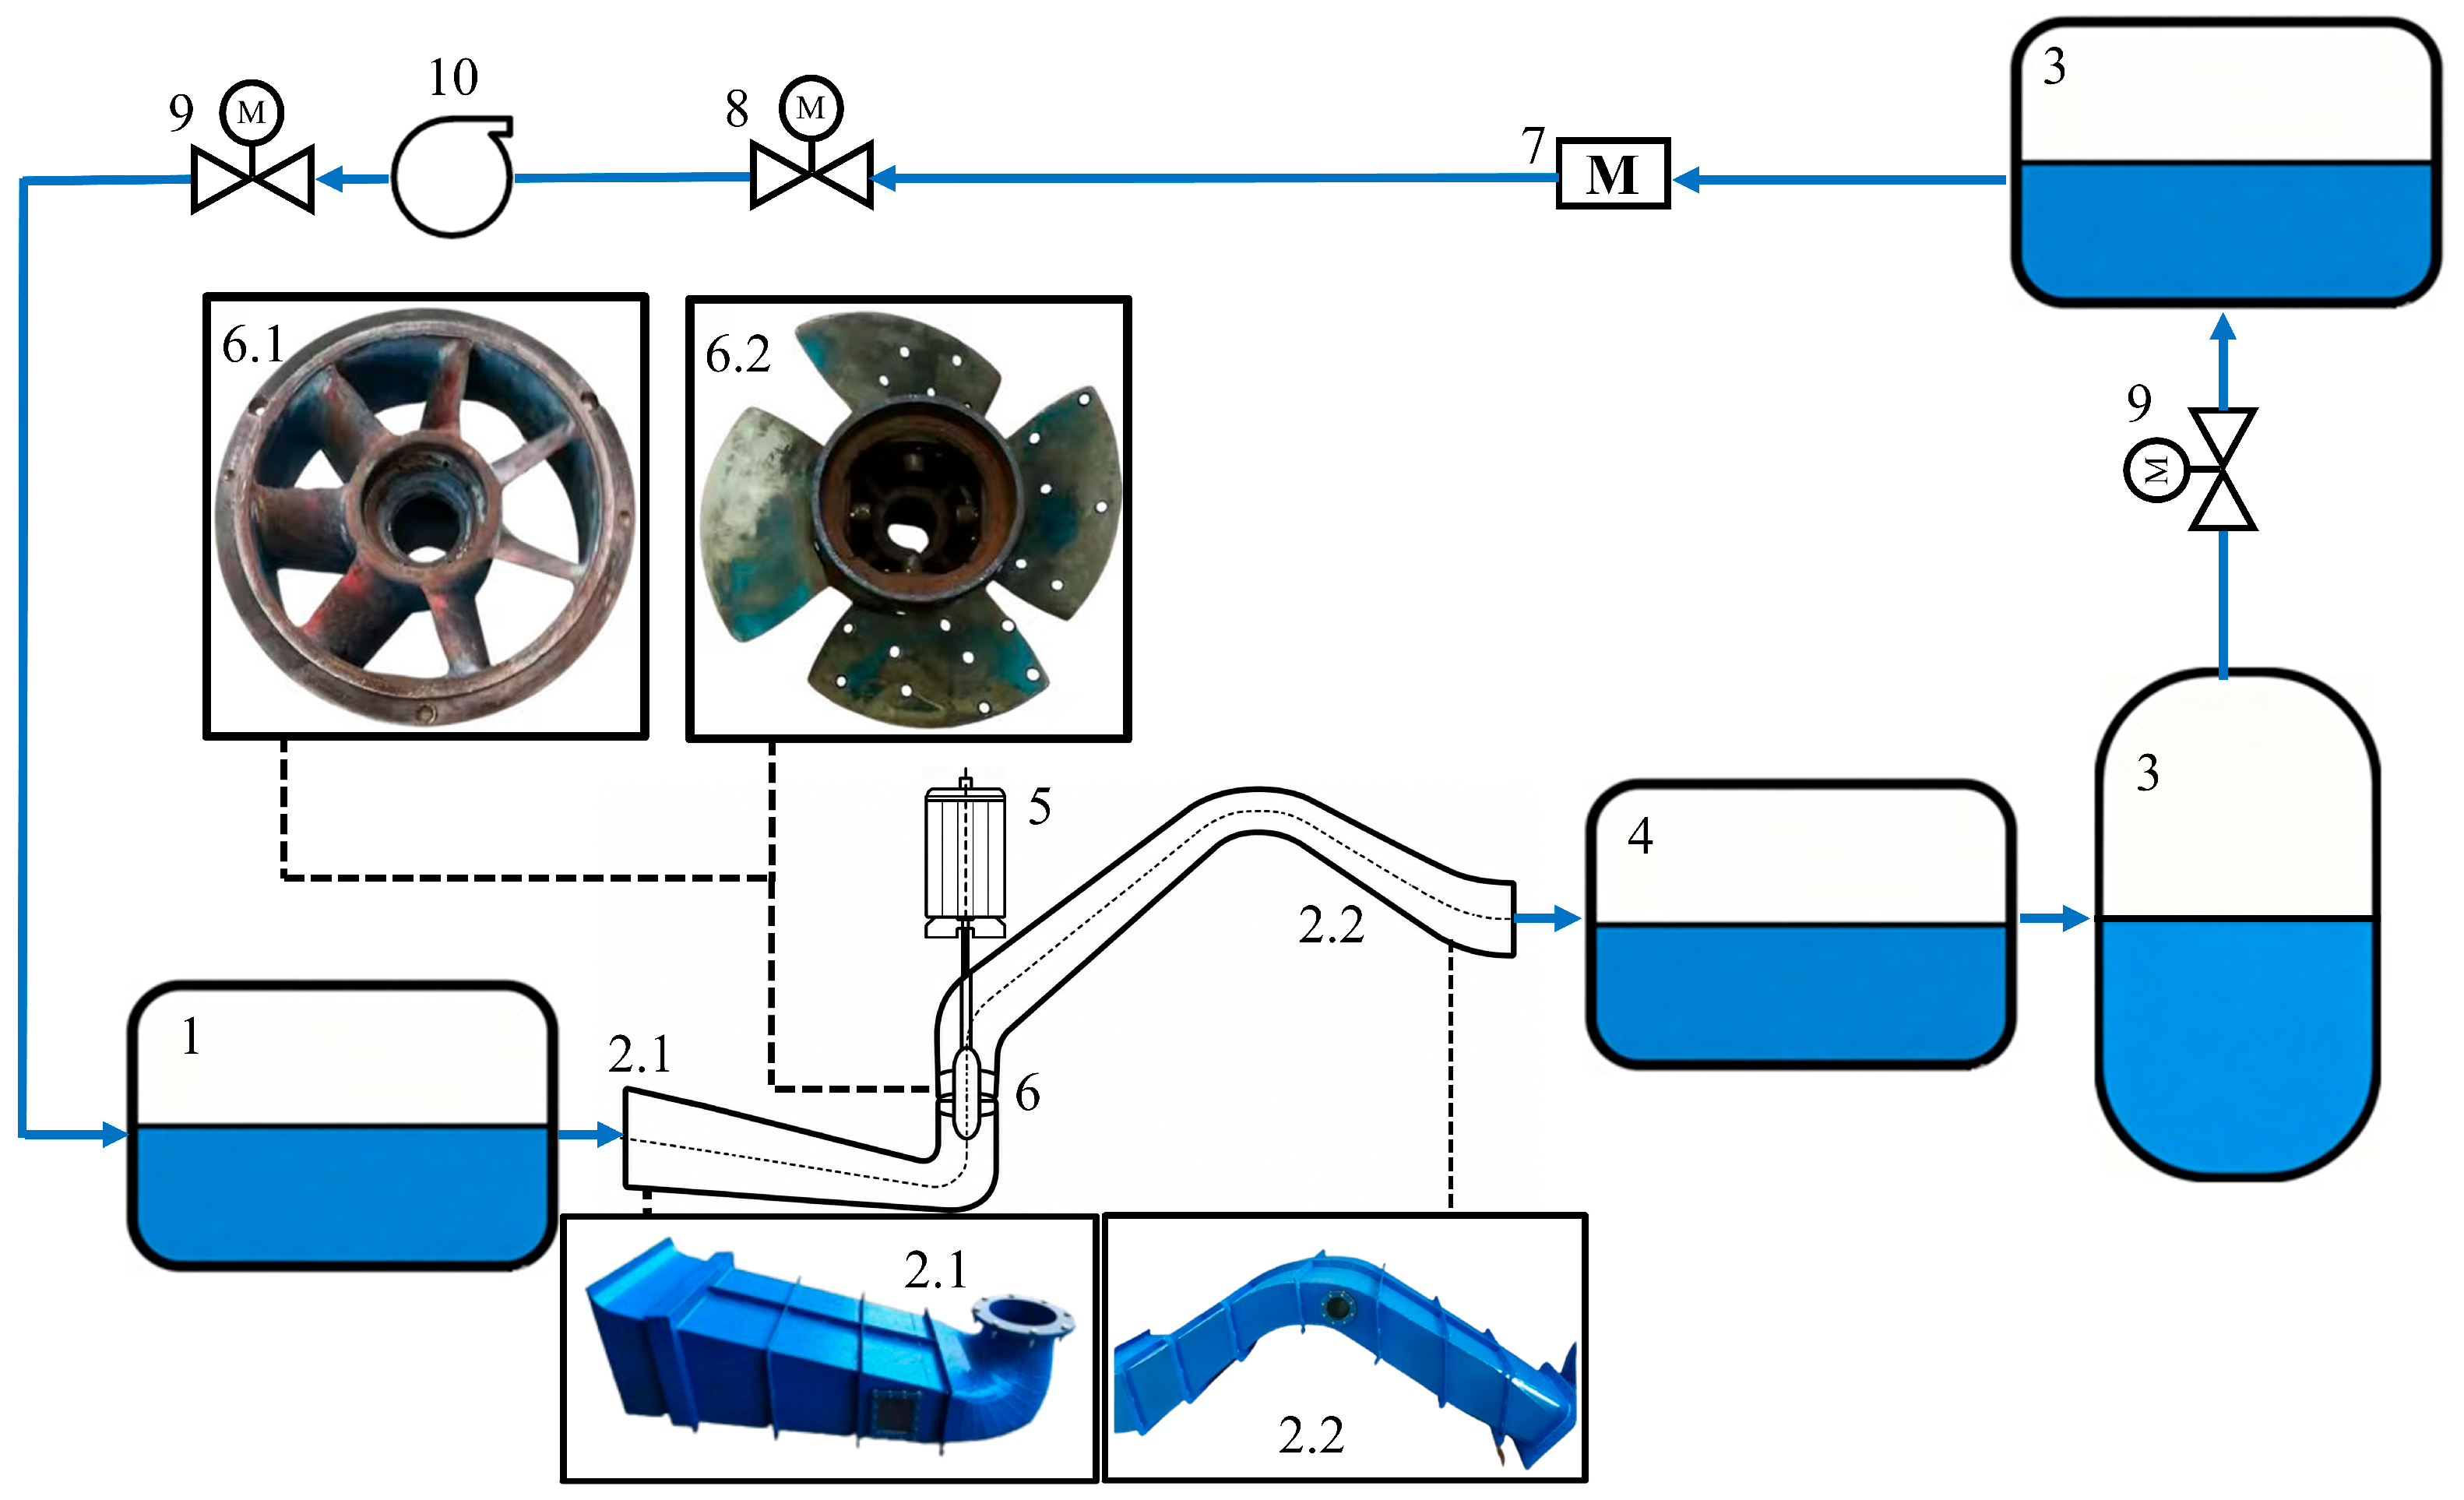
The CFD model was validated using experimental data obtained from a closed-loop model pump test facility, as shown in Figure 5. The test facility was designed to reproduce the hydraulic performance of the siphon vertical axial-flow pump system under controlled laboratory conditions. During the experiment, water was supplied from the inlet vacuum tank and then entered the model inlet passage. After passing through the model pump, the flow discharged into the outlet passage and subsequently entered the outlet pressure buffer tank and the storage-pressure tank before returning to the circulation pipeline. In this way, a stable closed-loop hydraulic circuit was formed for the performance test of the model pump system.
The operating condition of the test facility was adjusted by the auxiliary pump, globe valve and electric regulating butterfly valve. The E-mag DN400 electromagnetic flowmeter installed in the pipeline was used to measure the discharge. The outlet pressure buffer tank and storage-pressure tank were used to reduce pressure fluctuations and improve the stability of the measured data. The model pump was driven by a DC variable-speed motor, which enabled the rotational speed to be adjusted according to the required test condition. The tested pump was a scaled model based on the TJ04-ZL-02 hydraulic model. As shown in the enlarged views in Figure 5, component 6.1 denotes the guide vane, and component 6.2 denotes the impeller. The model impeller had four blades, and the guide vane consisted of seven vanes. The diameter of the model impeller was 300 mm. The inlet and outlet passages of the model pump were obtained from the prototype pump system according to the similarity law, with a scale ratio of 1:7. The guide vane was arranged downstream of the impeller to reduce the residual swirl and improve the outlet flow direction.
During the model test, the main hydraulic and mechanical parameters, including flow rate, head, rotational speed and shaft power, were measured using the corresponding instruments. The flow rate was recorded by the electromagnetic flowmeter, the pressure and pressure difference were obtained using pressure sensors, and the rotational speed and torque were measured using a torque-speed sensor. The pump efficiency was then calculated from the measured flow rate, head and shaft power. Finally, the measured head and efficiency under different flow-rate conditions were compared with the numerical results to evaluate the predictive accuracy of the CFD model.
During the model test, the main hydraulic and mechanical parameters, including flow rate, head, rotational speed and torque, were measured using the corresponding instruments. The flow rate was recorded by the electromagnetic flowmeter, the pressure and pressure difference were obtained using pressure sensors, and the rotational speed and torque were measured using a torque-speed sensor. The shaft power was calculated from the measured rotational speed and torque, and the pump efficiency was then calculated from the measured flow rate, head and shaft power.
To evaluate the reliability of the experimental results, an uncertainty analysis of the model test was performed. The uncertainty analysis considered both systematic uncertainty and random uncertainty. Systematic uncertainty mainly originates from the measurement systems for flow rate, head, torque and rotational speed. The systematic uncertainties of the main measurement systems are listed in Table 1.
The combined systematic uncertainty of the efficiency measurement can be expressed as
( E η ) s = ± E Q 2 + E H 2 + E M 2 + E n 2
where ( E η ) s is the systematic uncertainty of the pump’s efficiency, and E Q , E H , E M and E n are the systematic uncertainties of flow-rate, head, torque and rotational-speed measurements, respectively.
To quantify the random uncertainty of the efficiency measurement, repeated measurements were carried out under a representative operating condition. The repeated-test information and the calculated uncertainty results are summarized in Table 2.
The random uncertainty was evaluated using repeated measurements of the model pump efficiency. In the present test, 20 repeated measurements were carried out under the selected operating condition. The random uncertainty of the efficiency measurement can be calculated as
( E η ) r = ± t 0.95 ( N 1 ) S η η ¯ N × 100 %
where ( E η ) r is the random uncertainty of the efficiency measurement, N is the number of repeated measurements, is the standard deviation of the measured efficiency, η ¯ is the mean efficiency, and t 0.95 ( N 1 ) is the confidence coefficient at a confidence level of 95%. In this study, N = 20, and the corresponding confidence coefficient was 1.7291.
The comprehensive uncertainty of the efficiency measurement was obtained by combining systematic uncertainty and random uncertainty:
E η = ± ( E η ) s 2 + ( E η ) r 2
Based on the repeated experimental data, the comprehensive uncertainty of the pump efficiency was calculated to be ±0.302%. This value is lower than the allowable uncertainty specified in relevant pump test standards, indicating that the model-test data have sufficient reliability for assessing the accuracy of the numerical results. Finally, the measured head and efficiency under different flow-rate conditions were compared with the numerical results to evaluate the predictive accuracy of the CFD model.

5. Results and Analysis

5.1. Validation of the Numerical Method

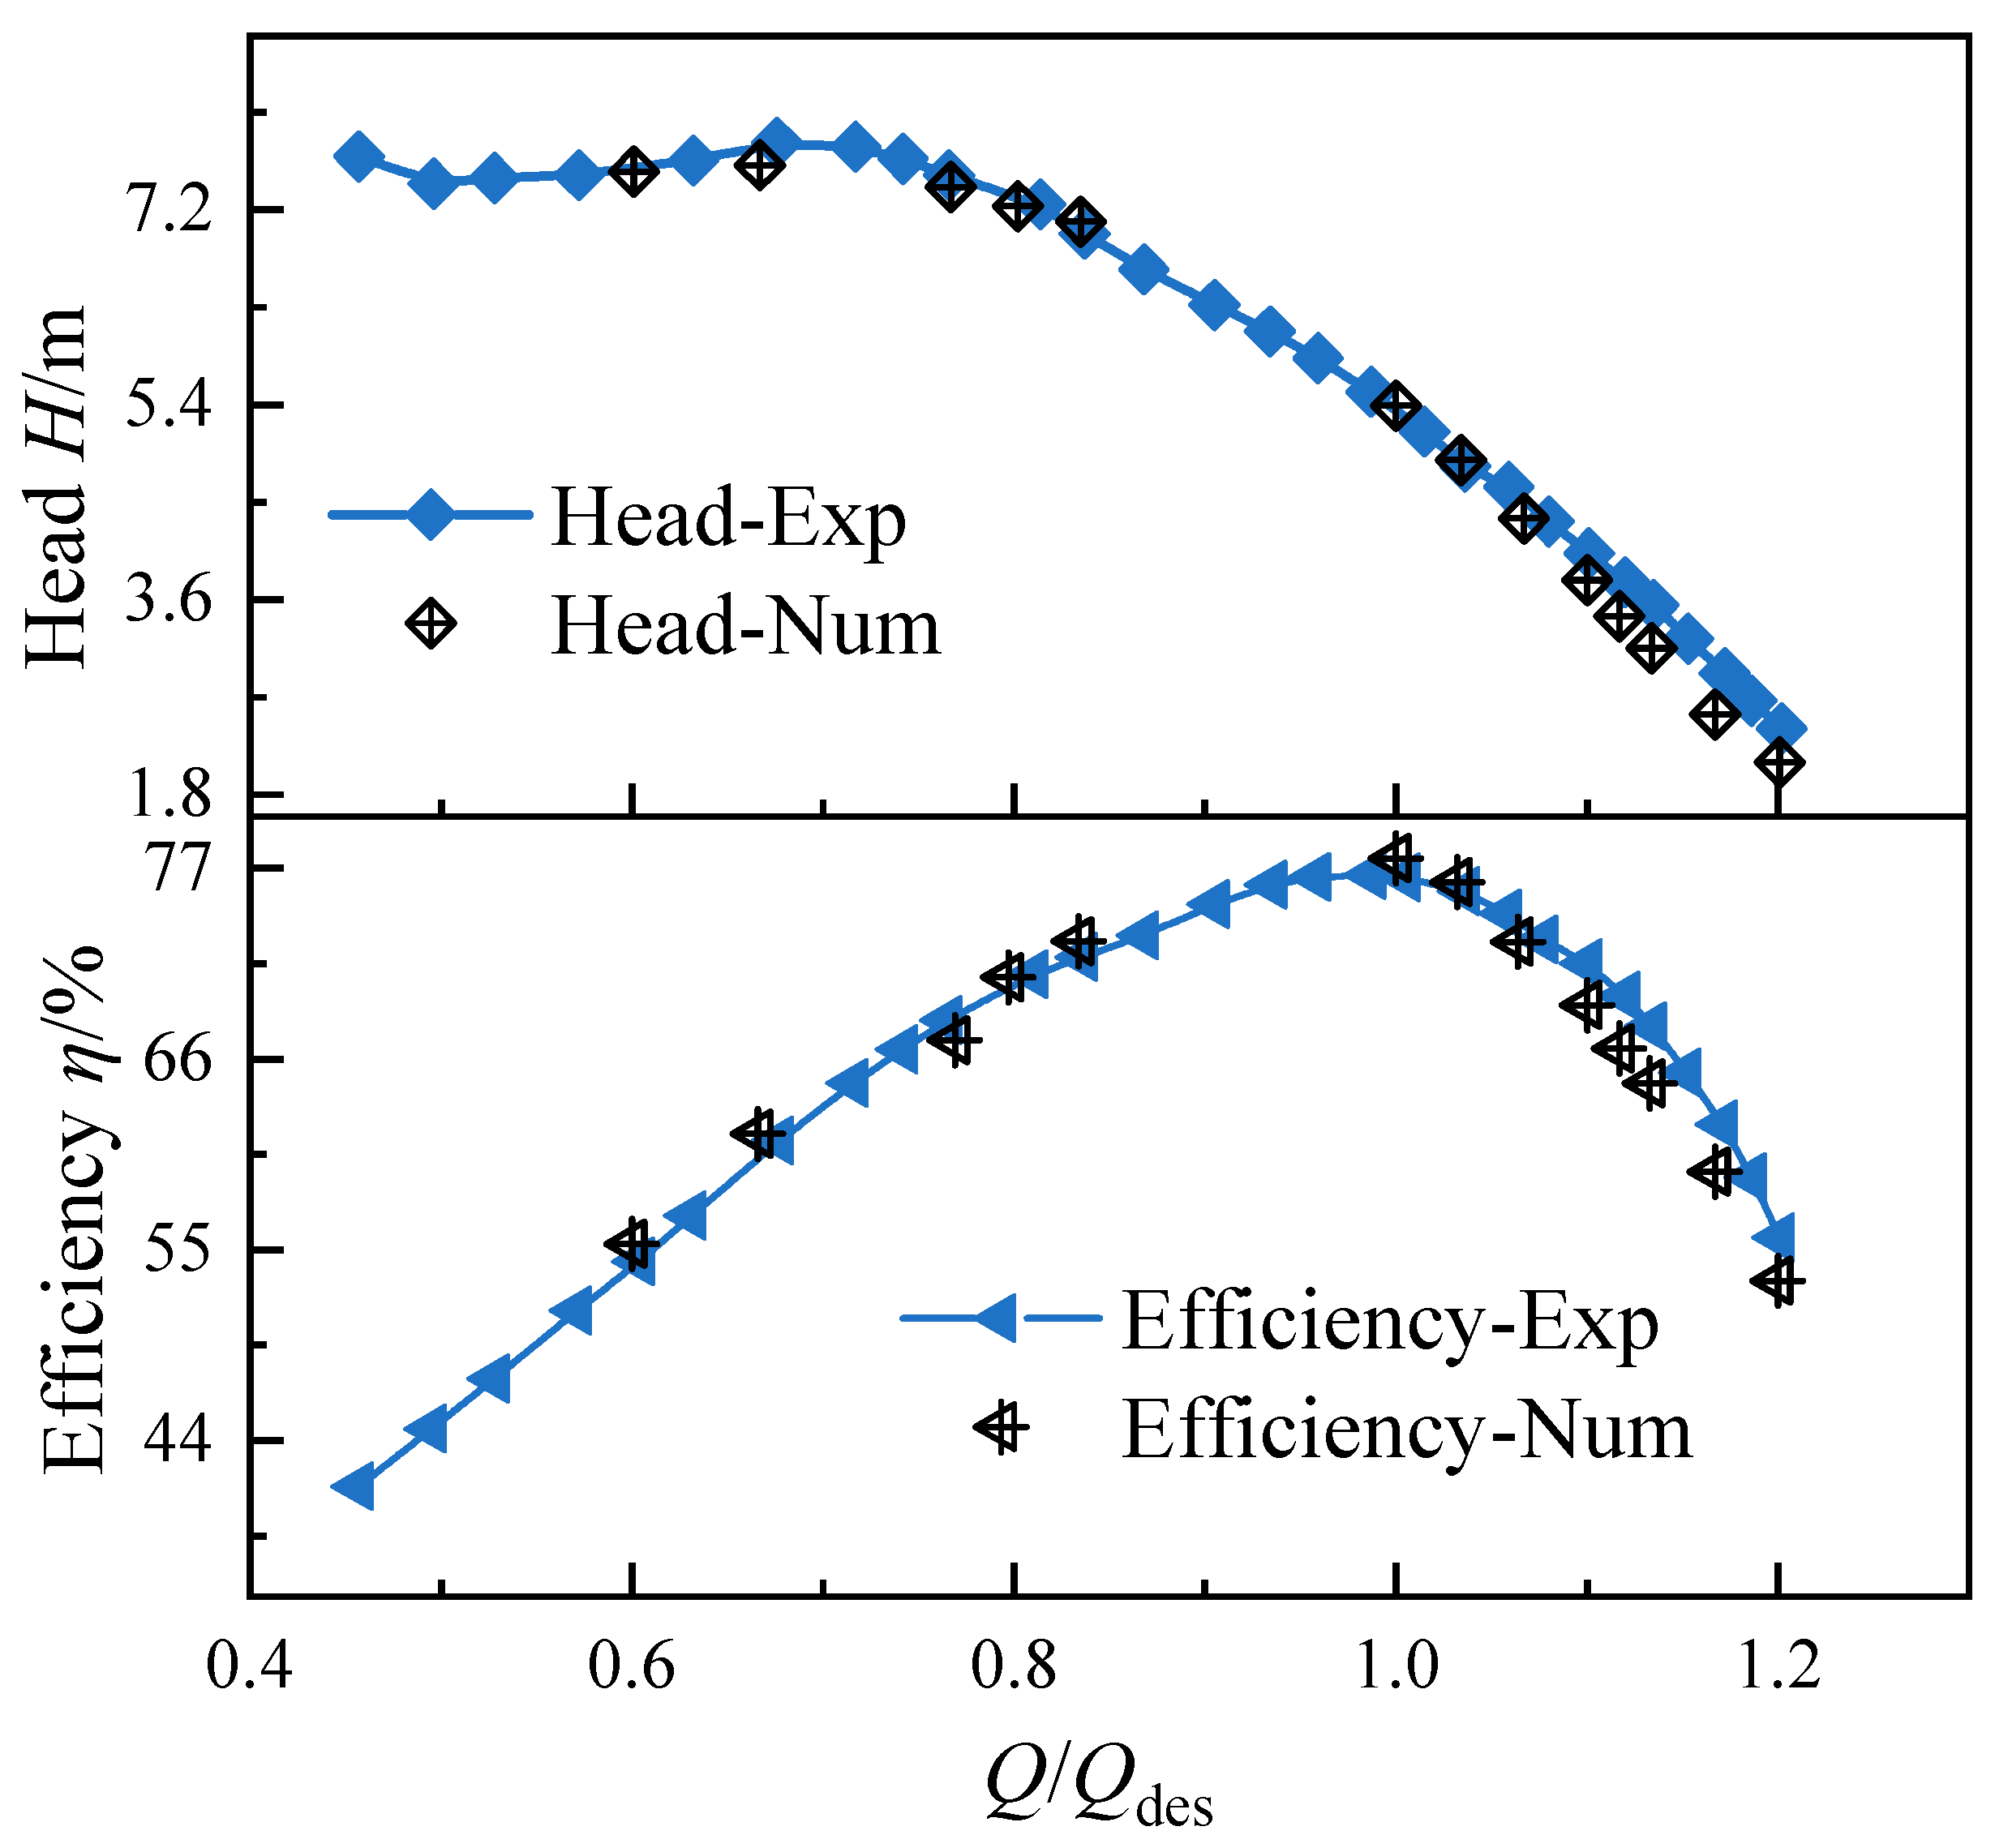
As shown in Figure 6, the numerical and experimental results exhibit consistent variation trends in both pump head and efficiency. With increasing flow rates, the pump head decreases continuously, while efficiency first increases and then decreases, reaching its maximum value near the design operating condition. This indicates that the numerical model can reasonably reproduce the external characteristic curves of the siphon vertical axial-flow pump system.
For the head curve, the numerical results are close to the experimental measurements under different flow-rate conditions, and the maximum relative deviation is less than 2.29%. This agreement indicates that the numerical model can accurately predict the energy increase provided by the impeller and the hydraulic system. For the efficiency curve, the numerical results also agree well with the experimental data, particularly near the design flow rate, where the deviation is only 0.50%. Relatively larger discrepancies are observed under small-flow-rate conditions, which may be related to stronger flow separation, secondary flow and local vortex structures under off-design operation. Even so, the efficiency deviation remains within 3%, indicating that the adopted turbulence model, mesh arrangement and boundary conditions are appropriate for predicting the main hydraulic performance of the pump system.
Therefore, the comparison between the numerical and experimental results provides validation of the present CFD model. The validated numerical approach can be used for the subsequent analysis of the unsteady internal flow evolution and rotordynamic response of the siphon vertical axial-flow pump system during the start-up process.
It should be noted that the present validation mainly focuses on the steady-state hydraulic performance of the pump system, including pump head and efficiency. The transient force and torque responses during start-up are therefore interpreted as numerical predictions obtained from the CFD model validated against steady-state experimental data.

5.2. Internal Flow Characteristics of the Pump System During Start-Up

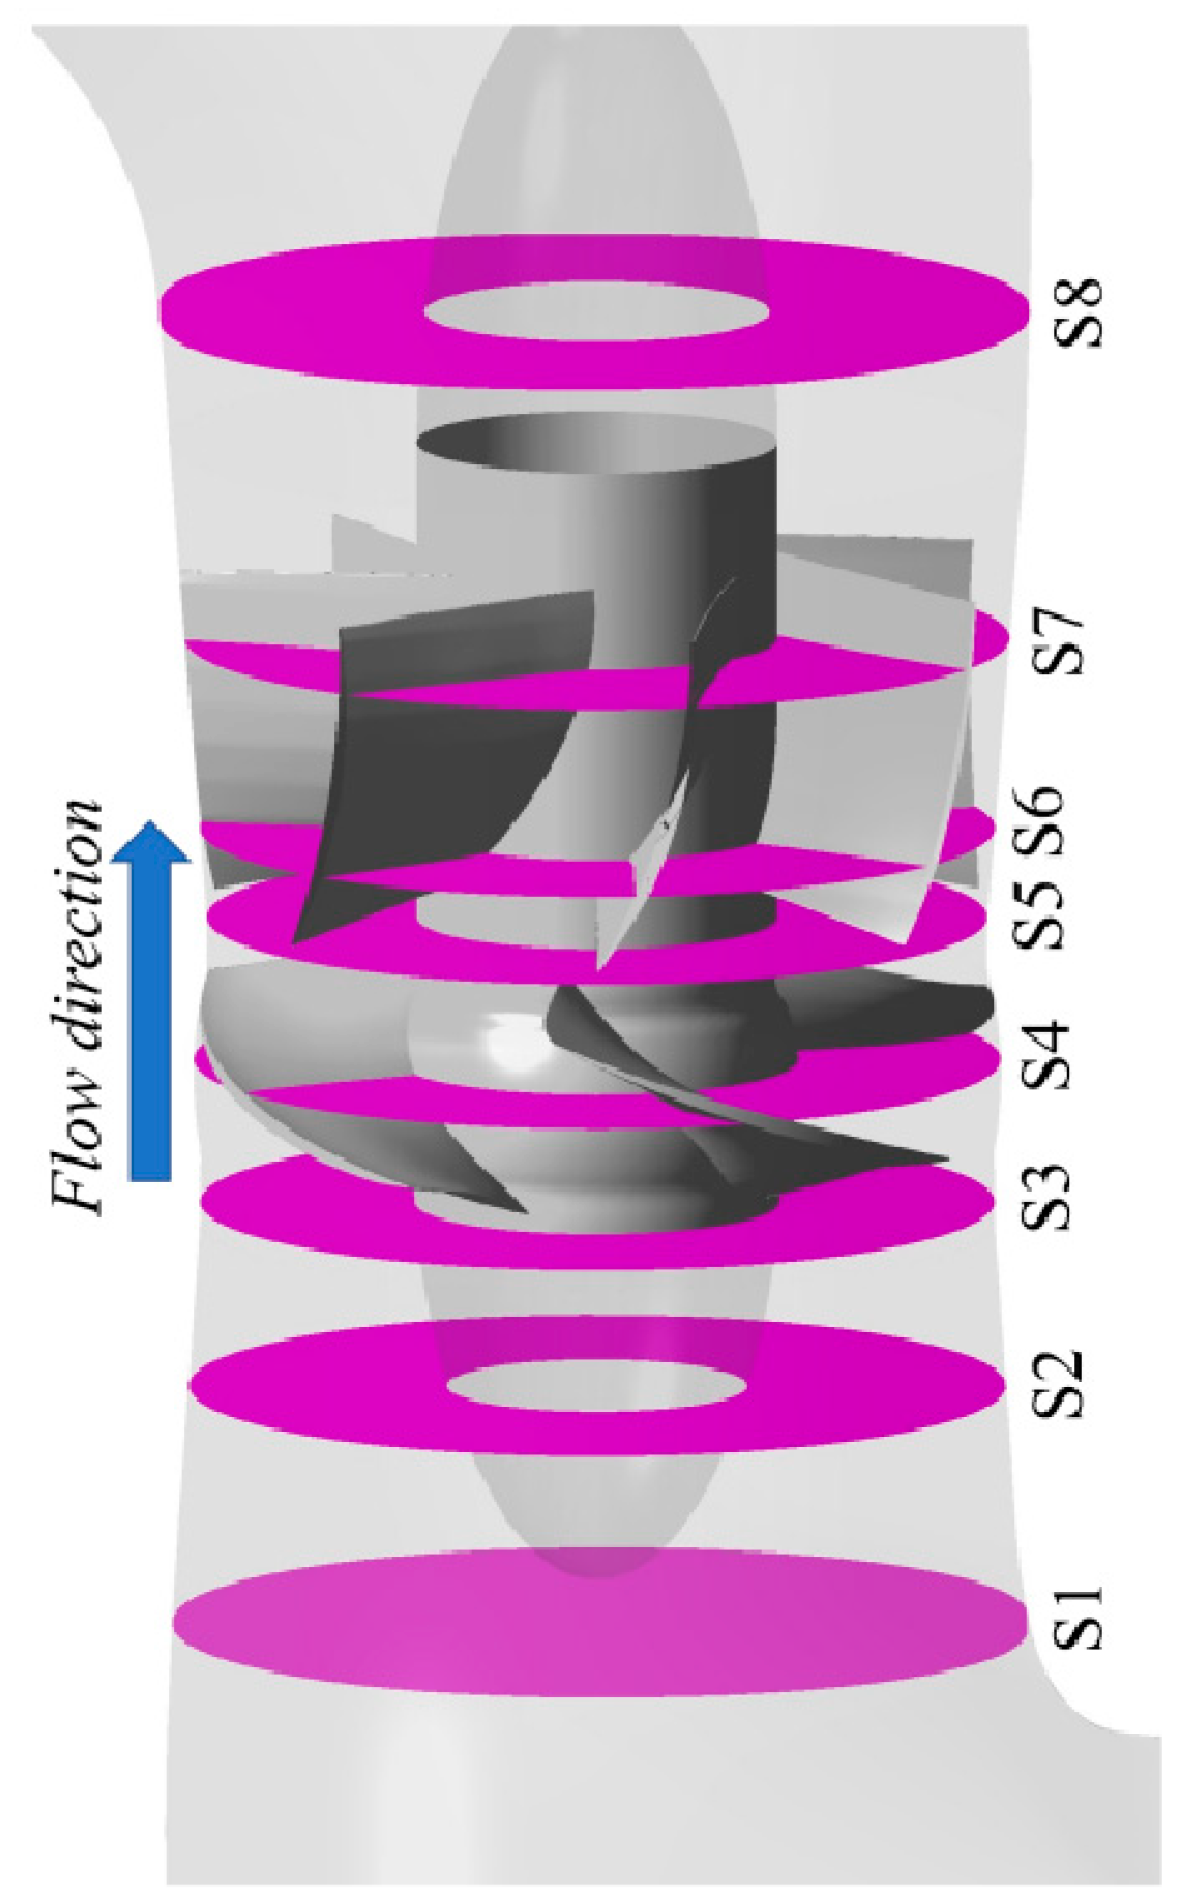
During the start-up transient process, the internal flow in the main pump section exhibits pronounced unsteady evolution, especially in the early stage, when flow instability inside the impeller is relatively significant. To investigate the temporal and spatial variations of the internal flow in the main hydraulic components, several monitoring sections were arranged in the main pump section, as shown in Figure 7. Among them, S4 is located at the mid-plane of the impeller, while S1 and S8 correspond to the inlet and outlet sections of the pump section, respectively. The monitoring sections were arranged successively along the axial direction of the flow passage, including the inlet section S1, the outlet section S8, and the intermediate sections S2–S7.
These sections cover the key flow regions from the pump’s inlet to the impeller and then to the pump’s outlet. In particular, sections S2–S7 are located in the region where the interaction between the impeller and guide vane is relatively strong and thus can be used to capture the flow features associated with rotor–stator interaction. By comparing the flow characteristics at different start-up times and different spatial locations, the evolution of velocity distribution, backflow and vortical structures in the main pump section can be identified. Since the internal flow during start-up is strongly unsteady, its unstable development may further affect the rotordynamic characteristics, such as torque, axial force and radial force. Therefore, the arrangement of these monitoring sections provides a basis for further analyzing the relationship between internal flow evolution and rotordynamic response during the start-up process.
In fluid machinery, the flow angle is used to characterize the direction of the velocity vector and the relative magnitudes of its axial and circumferential components. It is a key parameter linking the velocity triangle with blade-row loading, momentum exchange and energy conversion mechanisms. In this study, the flow angle αf is defined as the angle between the instantaneous absolute velocity V and the circumferential basis vector eθ:
α f = arccos V · e θ V
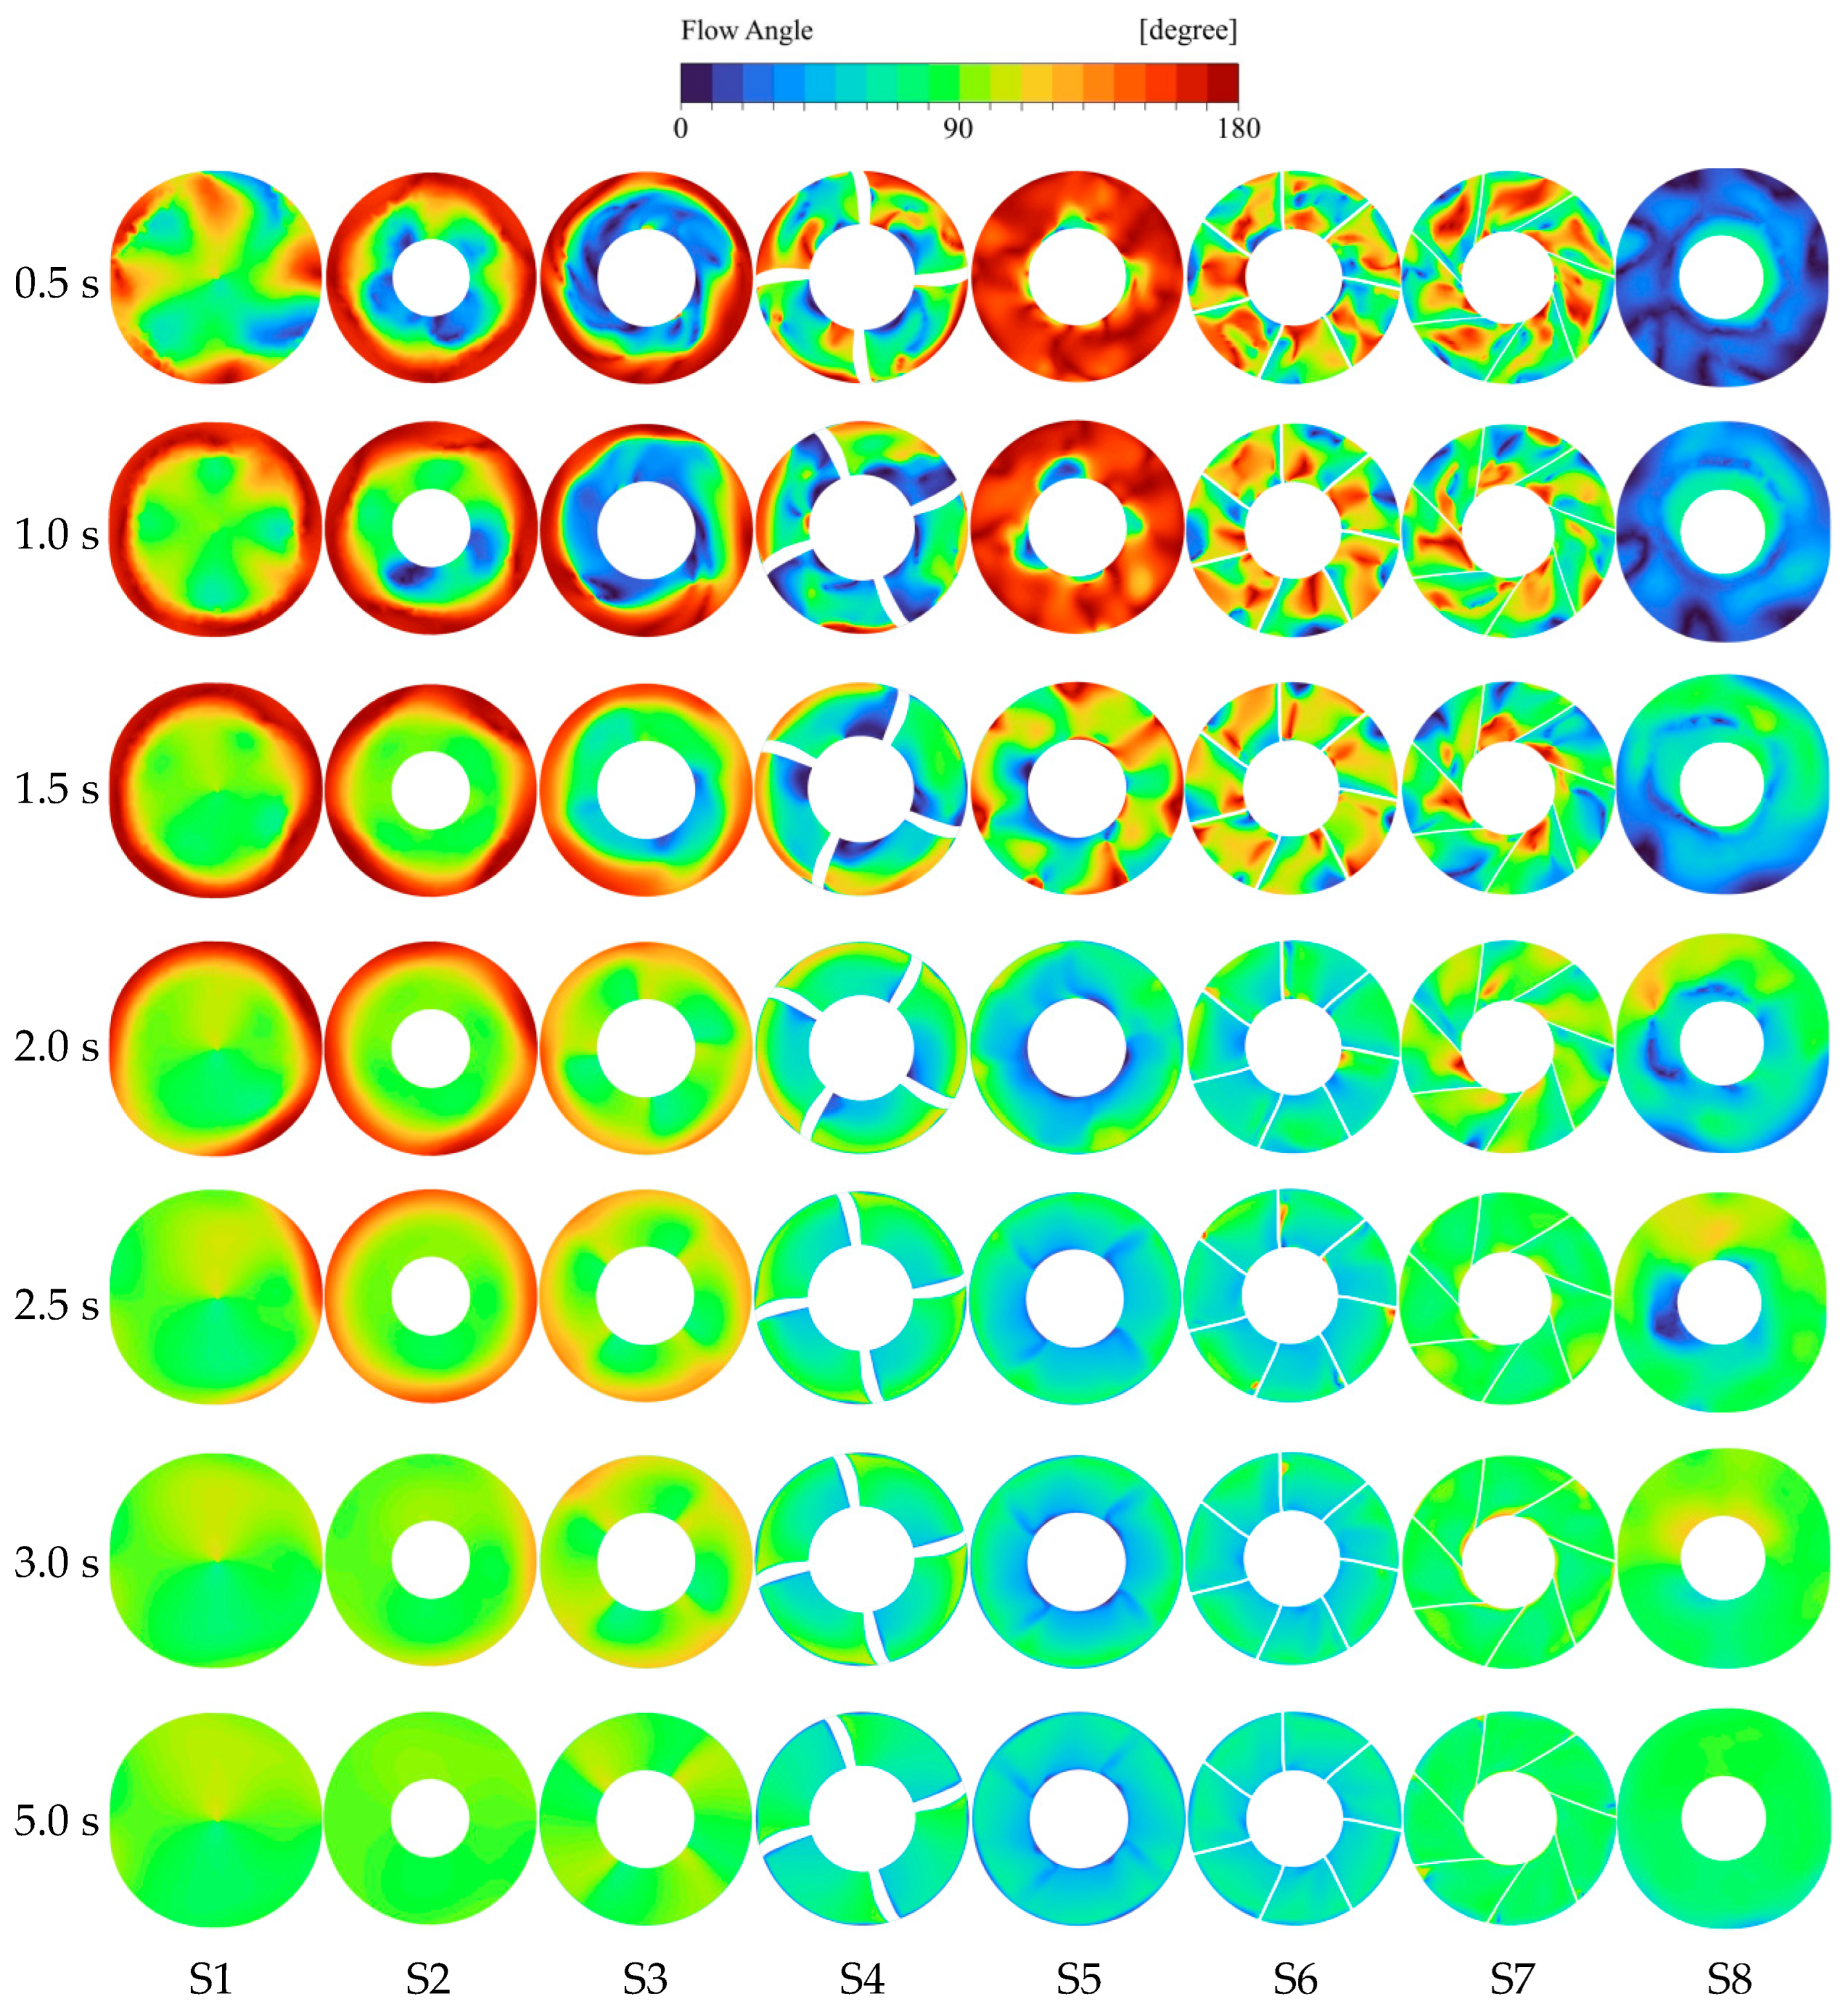
It should be noted that the value of αf ranges from 0° to 180°. When αf = 90°, the circumferential component of the local flow is relatively weak, and velocity is mainly aligned with the axial direction. In contrast, values of αf approaching the two limits indicate that the local flow is dominated by a strong circumferential component. Based on the monitoring sections arranged in Figure 7, Figure 8 presents the flow-angle distributions at typical moments during the start-up transient process. It can be observed that, as the start-up process proceeds, the spatial distribution of the flow angle evolves from a highly unsteady and non-uniform state toward a more uniform and axially aligned flow pattern.
At the early start-up stage, namely t = 0.5 s, circumferentially periodic regions with large flow angles appear at the inlet section S1, corresponding to the number of impeller blades. This indicates that the incoming flow is strongly disturbed by the rotating impeller, resulting in pre-swirl and local backflow. At sections S2 and S3 upstream of the impeller inlet, the flow angle shows a distinct radial gradient. Regions with large flow angles are mainly concentrated near the wall, whereas regions with small flow angles are distributed near the shaft. This distribution suggests that strong radial non-uniformity exists near the leading-edge region of the impeller inlet and that the circumferential motion of the near-wall fluid differs significantly from that of the core flow. This further indicates that a stable axial inflow has not yet been established at the impeller inlet during the early start-up stage.
At the impeller mid-plane section S4, large flow-angle regions are mainly located near the blade tip, while small flow-angle regions are concentrated near the hub, indicating that the flow inside the impeller still exhibits pronounced radial non-uniformity. At section S5, which corresponds to the interface between the impeller outlet and the guide-vane inlet, large flow-angle regions almost cover the entire section, showing that the flow discharged from the impeller carries a high level of residual circumferential momentum. In the guide-vane passages, namely sections S6 and S7, the large flow-angle regions appear as non-uniform patches, suggesting the presence of local flow separation and non-uniform flow rectification inside the guide vane. At the outlet section S8, small flow-angle regions dominate, indicating that the guide vane has not yet fully exerted its rectifying effect at this stage, and the flow leaving the main pump section still retains a relatively high circumferential velocity component.
When t = 1.0 s, the fan-shaped regions with large flow angles induced by impeller rotation at section S1 are weakened, and the high-value regions are mainly concentrated near the wall. This indicates that near-wall flow separation still exists at the pump inlet. At section S2, the influence range of the small flow-angle region near the guide cone decreases, whereas the large flow-angle regions near the outer wall and the corresponding circumferential swirling characteristics do not decay significantly. Combined with the distributions at sections S3–S7, it can be inferred that the flow-angle pattern in the main pump section has not been substantially reconstructed at this stage. The flow field still maintains a strong swirling feature, suggesting that the internal flow remains in an unstable adjustment state. Notably, the overall flow angle at the outlet section S8 increases, indicating that the rectifying effect of the guide vane on the outlet flow begins to strengthen as the start-up process proceeds, and the outlet flow condition of the main pump section is gradually improved.
When the start-up process advances to t = 1.5 s, the unsteady characteristics of the internal flow in the main pump section are further weakened, and the flow structure exhibits a certain tendency toward orderliness. At the impeller inlet section S3, the radial gradient of the flow angle decreases markedly, and the flow angle near the guide-cone wall gradually increases and approaches 90°. This indicates that the fluid motion in this region gradually changes from circumferential swirling flow to axial flow, and the impeller inflow condition is improved. Although large flow-angle regions with annular distribution still exist near the outer wall, both their range and magnitude are reduced compared with those in the early start-up stage. A similar trend is observed at the impeller mid-plane section S4. The originally scattered high- and low-flow-angle regions gradually weaken, and the flow-angle distribution becomes more regular. The low-flow-angle region is mainly located near the blade’s pressure side, whereas the high-flow-angle region remains concentrated near the blade tip. At the impeller outlet section S5, the previously extensive high-flow-angle region is significantly suppressed, and local axial-flow features begin to appear. Meanwhile, regions with strong circumferential flow become discretely distributed in the section. In contrast, the flow-angle distribution inside the guide vane changes relatively slightly. However, at outlet section S8, the overall flow angle further increases, and the area occupied by axial flow expands, indicating that the outlet flow of the pump section gradually becomes more stable.
At t = 2.0 s, the flow-angle distribution in the main pump section is further improved, and the proportion of axial flow in the flow field increases significantly. Although localized regions with high circumferential velocity are still observed near the outer wall at sections S1 and S2, the flow in the central part of the sections and near the guide cone has essentially changed to axial motion, indicating that the inlet flow condition continues to improve. At the impeller mid-plane section S4, the areas with high- and low-flow-angle regions are significantly reduced compared with the previous stage, suggesting that the flow non-uniformity inside the impeller is further weakened. At the impeller outlet section S5, the large flow-angle region almost disappears, indicating that the attachment and guiding characteristics of the impeller outflow are enhanced. The flow-angle distribution in the guide-vane region also becomes more uniform, and no obvious large flow-angle region is observed, showing that the rectifying effect of the guide vane has gradually developed. Considering the distributions at subsequent time instants, the flow angles at the monitoring sections gradually stabilize and converge toward approximately 90° as the start-up process continues, and the fluid motion progressively becomes dominated by axial flow. Since the unstable evolution of the internal flow during start-up alters the blade-surface pressure distribution and the fluid momentum exchange process, it further affects the rotordynamic parameters, including torque, axial force and radial force. Therefore, it is necessary to further analyze the rotordynamic response during start-up using appropriate mechanical characterization methods.
Based on the monitoring sections arranged in the main pump section, the classical vorticity transport equation was further decomposed in this study. The vortex stretching term was selected as the key indicator to visualize the spatial evolution and dynamic mechanism of unsteady vortical structures during the start-up transient process. In general, for an incompressible viscous fluid, the vorticity vector ω is defined as the curl of the velocity field u, namely ω = ∇ × u. Its evolution can be described by the vorticity transport equation:
ω t + u · ω = ω · u ω · u + 1 ρ 2 ρ × p + ν 2 ω
where u = (u, v, w) is the velocity vector, t is time, and ν is the kinematic viscosity of the fluid. The two terms on the left-hand side represent the local temporal variation of vorticity and the convective transport of vorticity with fluid motion, respectively. On the right-hand side, the first term is the vortex stretching and tilting term, which describes the stretching of vortex lines along the principal strain direction and their reorientation process. This term plays a key role in determining the local amplification or attenuation of vorticity and the direction of energy cascade. The second term represents the volumetric expansion or compression effect, which describes the influence of compressibility on the vorticity magnitude; for incompressible flow, this term is approximately zero. The third term is the baroclinic term, which generates new vorticity when the density gradient and pressure gradient are not aligned, and it is particularly important in non-uniform-density flows, such as cavitating flow and thermal convection. The fourth term is the viscous diffusion term, reflecting the dissipation and spatial diffusion of vorticity under the action of viscosity. The strain-rate tensor S is further introduced as
S = 1 2 u + u T
Thus, the evolution equation of enstrophy can be expressed as
d d t 1 2 ω · ω = ω · S · ω + ν ω · 2 ω
where ω·S·ω represents the vortex stretching term. When this term is positive, vorticity is amplified along the principal stretching direction, corresponding to enhanced local rotation and a forward cascade of energy toward smaller scales. Conversely, a negative value indicates that vorticity is weakened along the compressive direction, leading to the attenuation of local rotational motion. Therefore, the vortex stretching term is one of the most direct indicators in the vorticity transport equation for characterizing the unsteady features of three-dimensional turbulent flow. It is of great significance for revealing the generation, maintenance and decay mechanisms of vortical structures in complex internal flows.
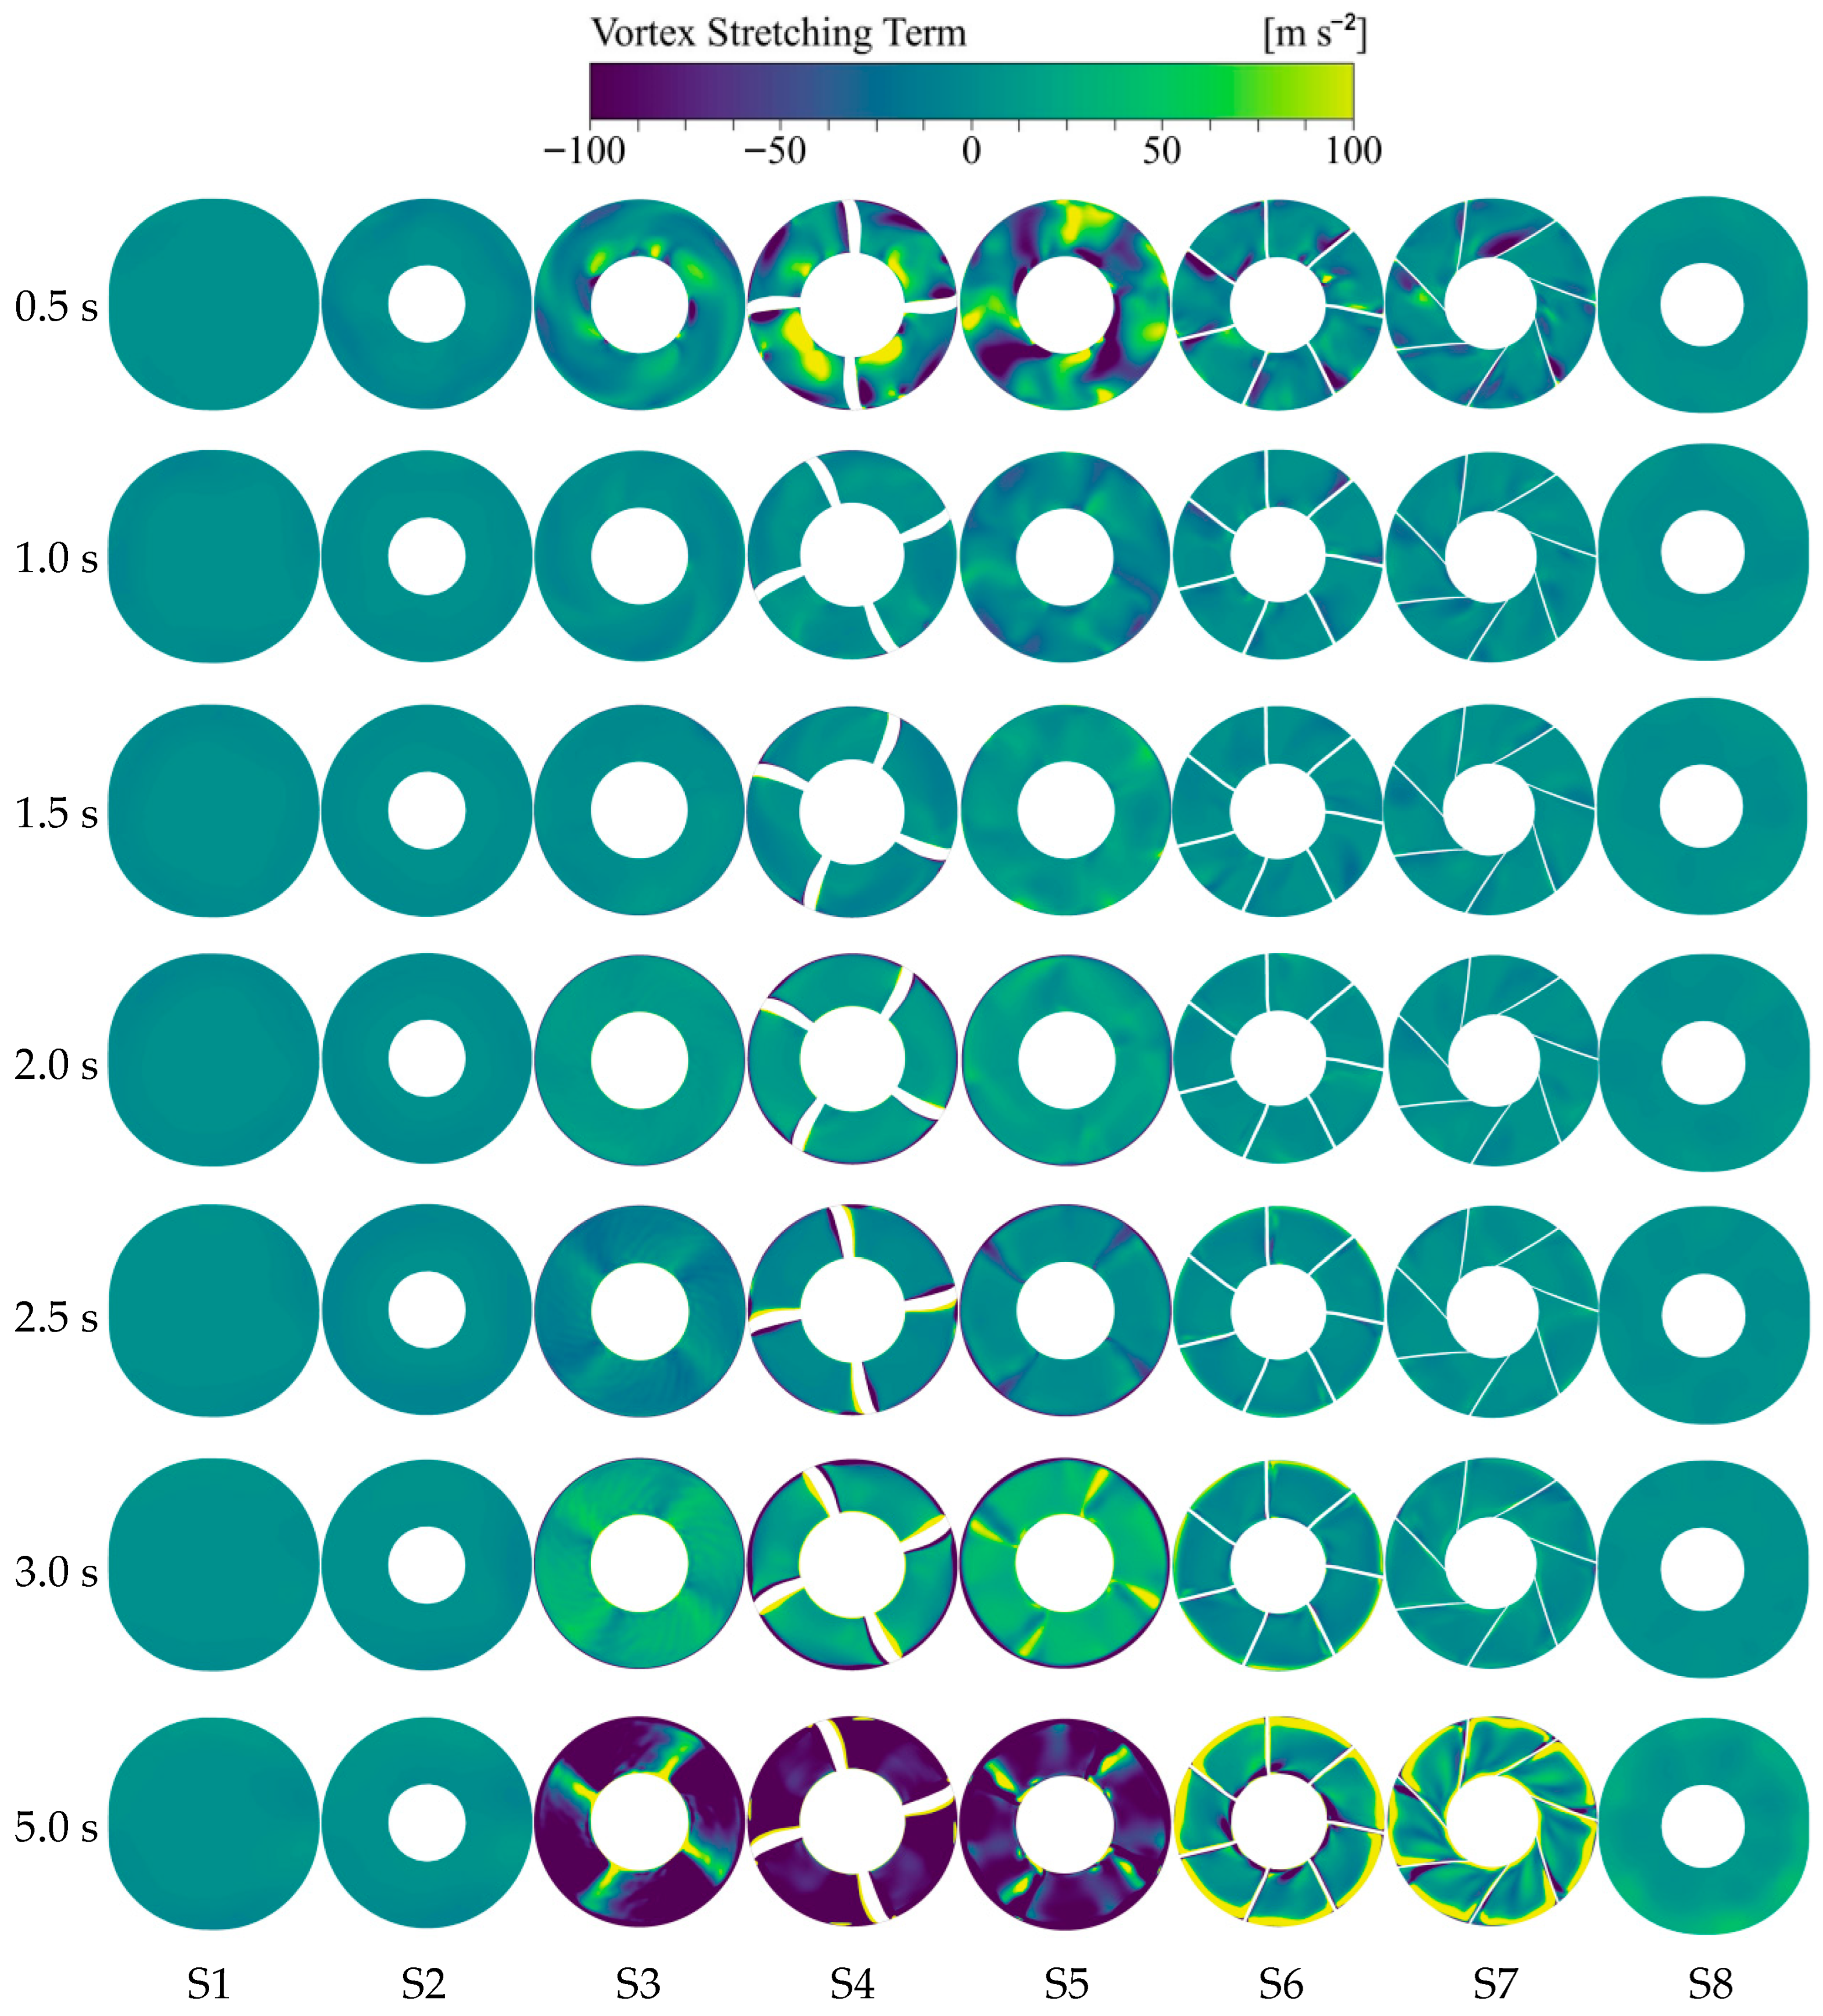
The distribution of the vortex stretching term in the main pump section during start-up is shown in Figure 9. At the early stage, namely t = 0.5 s, the values at sections S1–S2 are close to zero, indicating that vortex stretching near the pump inlet is still weak. Under the influence of impeller acceleration and the induced swirl, scattered regions of vortex stretching appear at section S3, suggesting that local velocity shear and vorticity reorientation have developed near the impeller inlet. This is consistent with the strong circumferential flow observed at S3 in the previous flow-angle analysis. In contrast, sections S4–S7 exhibit large-scale positive and negative vortex stretching bands with relatively high magnitudes. These high-value regions are mainly located near the blade’s leading and trailing edges and in the impeller–guide-vane interaction region, indicating that unsteady vortical structures such as TLV and PV are rapidly stretched, tilted and reoriented during the initial start-up stage. These structures are closely associated with the strongly unsteady flow and non-uniform hydrodynamic loading in the main pump section. At section S8, the vortex stretching intensity remains weak, implying that the stable outlet flow has not yet been established.
When the start-up process reaches t = 1.0 s, both the intensity and spatial extent of vortex stretching at sections S4–S6 decrease markedly. The high-value regions shrink into narrow bands near the outer wall and the pressure side of the impeller passage. This indicates that, with an increase in rotational speed and flow rate, the disordered generation of vorticity is weakened, and the stretching of vortical structures gradually changes from a broad-area distribution to a localized pattern. Meanwhile, the flow-guiding effect of the guide vane begins to become more evident. During t = 1.5–2.0 s, vortex stretching becomes further localized. The main regions of the sections show values close to zero, while narrow high-value bands remain only near the pressure side of the impeller passage and the blade-tip clearance. This suggests that the large-scale disordered vortex stretching observed at the early stage is effectively suppressed, and the flow enters a more organized transitional state with reduced unsteadiness.
At t = 2.5 s and t = 3.0 s, fan-shaped coherent bands corresponding to the impeller blade phase appear at sections S3–S7. Although their intensity increases compared with that at t = 1.5–2.0 s, their spatial distribution becomes more geometrically constrained and phase-locked. This indicates that vortex stretching is mainly concentrated in relatively stable shear layers and wake regions, rather than appearing as the large-scale disordered distribution observed at the initial stage. This trend is consistent with the flow-angle evolution shown in Figure 8, where the flow gradually converges toward 90° and becomes increasingly axial. At t = 5.0 s, continuous high-value bands are formed along the blade edges, tip-clearance region and guide-vane boundaries. Although local amplitudes remain relatively high, the spatial distribution becomes more regular, reflecting the maintenance of vortical structures by stable shear layers. In addition, the vortex stretching intensity at section S8 remains close to zero, indicating that the outlet flow is well guided and the flow structure tends to be stable.
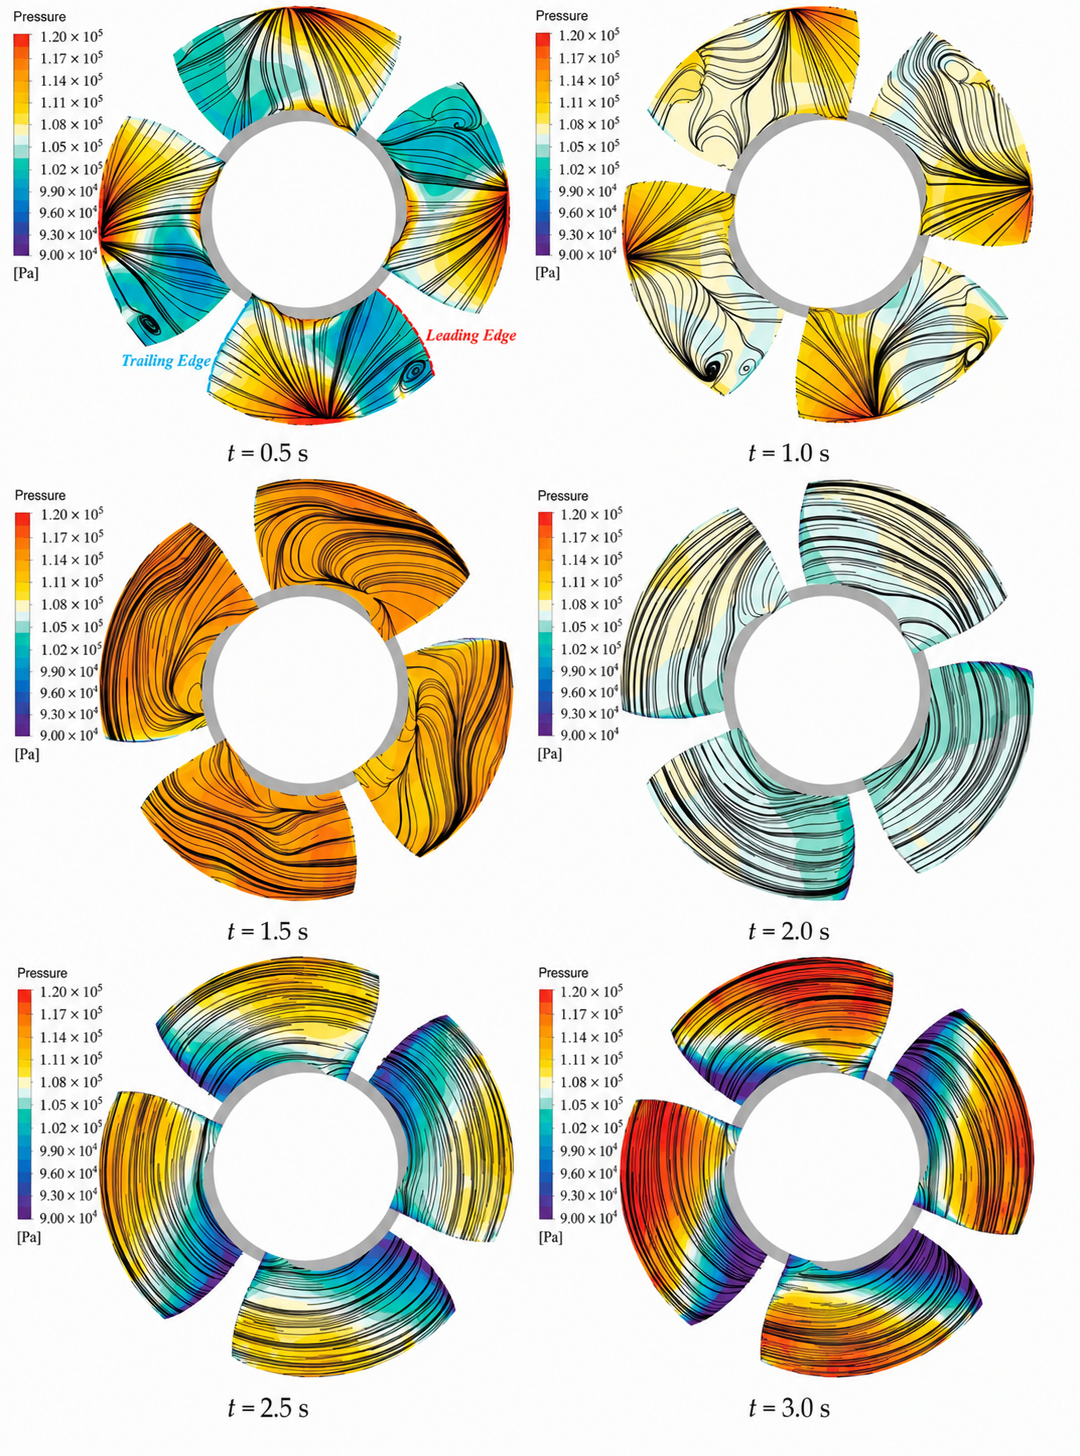
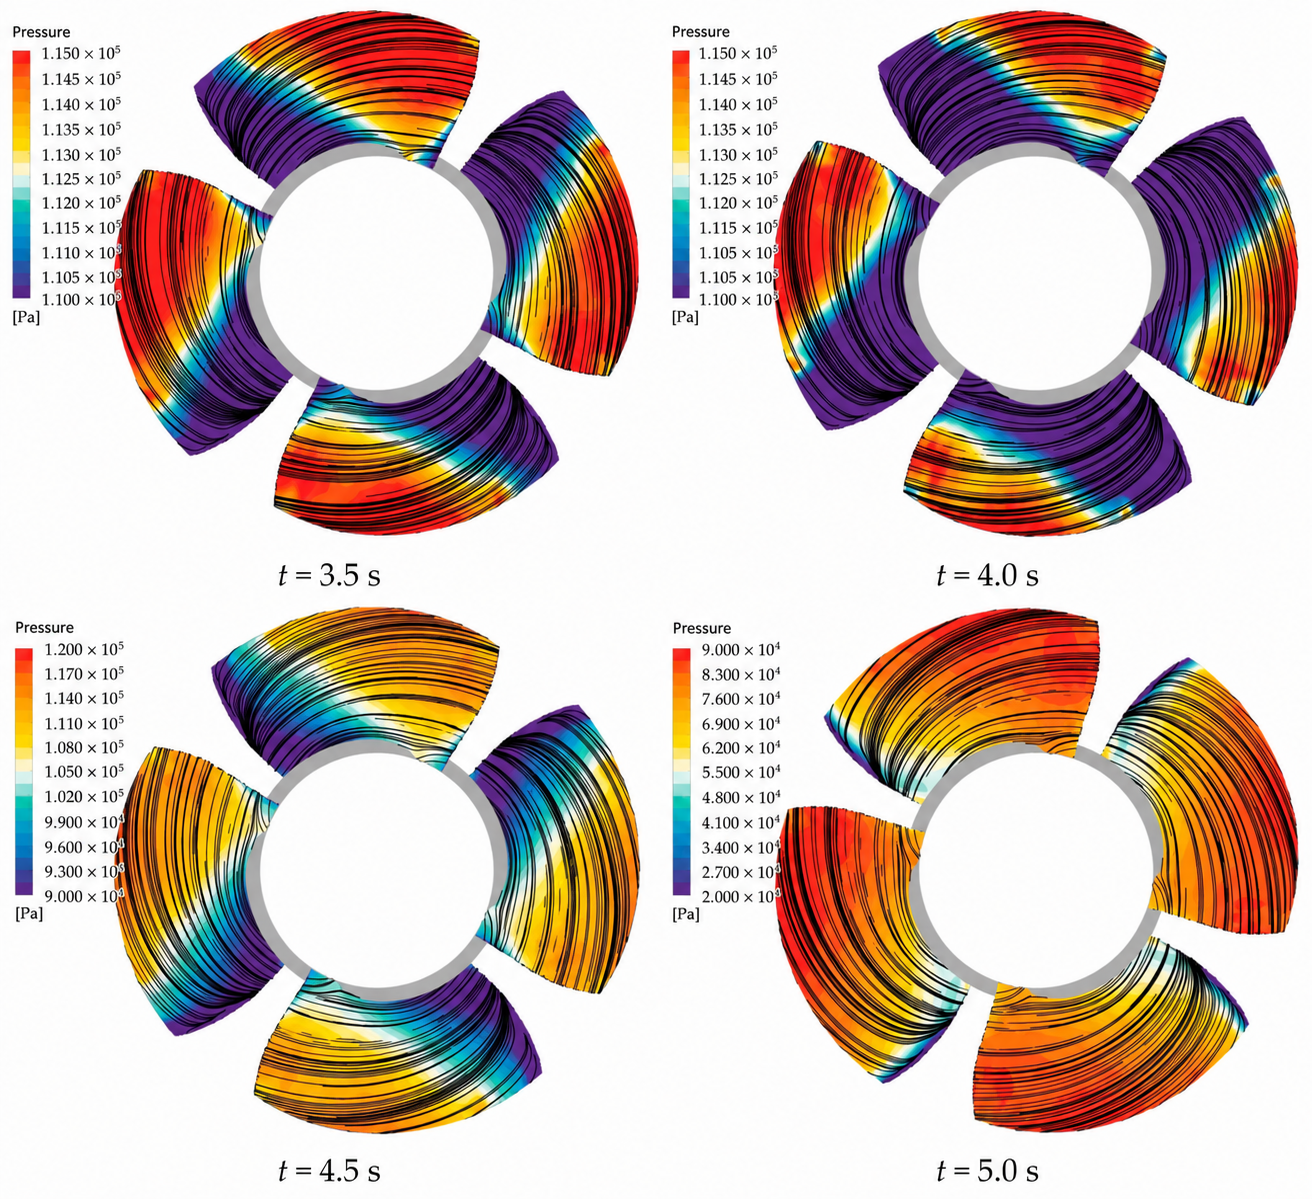
The pressure distribution on the blade surface is an important indicator of the work input from the impeller to the fluid. It reflects the spatial distribution of blade loading and is closely related to flow separation, backflow and leakage near the blade surface. During start-up, the transient variation in blade-surface pressure directly affects the hydraulic loading, energy transfer and operational stability of an axial-flow pump. Therefore, the pressure distribution and surface streamlines on the blade pressure side were visualized to clarify the unsteady flow behavior during start-up, as shown in Figure 10. It should be noted that the view direction is from the impeller outlet toward the impeller inlet, and the impeller phase was not unified at different time instants; therefore, slight phase differences exist among the subfigures.
At the early start-up stage, namely t = 0.5 s, the pressure distribution on the blade pressure side is highly non-uniform. A high-pressure region is mainly located near the middle part of the blade tip, while a small high-pressure region also appears near the hub. The high-pressure core tends to expand downstream, and the surface streamlines diverge from this region. A small-scale vortex structure is also observed near the leading edge at the blade tip. This phenomenon is mainly caused by the incomplete establishment of stable flow in the early start-up stage. As the start-up process proceeds to t = 1.0 s, the non-uniformity of the blade pressure distribution is weakened. The magnitude of the high-pressure core decreases, and its location moves downstream along the chord direction near the blade tip. The surface streamlines still exhibit a divergent pattern around the high-pressure core, but the affected region becomes smaller than that at t = 0.5 s. This indicates that the flow instability inside the impeller is gradually alleviated as the discharge increases, and the interaction between tip leakage flow and end-wall secondary flow becomes weaker. At t = 1.5 s, the pressure distribution becomes more uniform, and the pressure difference between the high- and low-pressure regions is further reduced. The surface streamlines no longer show the strong divergent pattern observed at the initial stage, but gradually develop into a more regular distribution along the blade’s surface, indicating an improvement in the internal flow state of the impeller. During t = 2.0–3.0 s, the surface streamlines become more ordered and gradually align with the blade profile, suggesting that the unsteadiness of the flow field is significantly reduced and that the energy transfer process approaches a stable state.
In the later start-up stage, namely t = 3.5–5.0 s, the overall pressure gradient on the blade pressure side becomes smoother, and the distribution pattern becomes more regular. A typical blade-loading pattern is formed, with relatively lower pressure near the leading edge and higher pressure near the trailing edge. The pressure difference between the low- and high-pressure regions continues to decrease, indicating that the unstable flow structures inside the impeller have been largely suppressed and that the flow state approaches the stable operating condition. Overall, the early-stage tip leakage flow and end-wall effects lead to a distinct high-pressure core and divergent surface streamlines, which are important sources of local flow instability and load fluctuation. With increasing flow rates and rotational speeds, the unsteady vortical structures and leakage effects are gradually weakened, and the blade-surface pressure distribution becomes more uniform. This evolution indicates a close relationship between blade pressure redistribution, local hydraulic loss and rotordynamic response during the start-up process.

5.3. Rotordynamic Response and Time–Frequency Characteristics of Radial Force During Start-Up

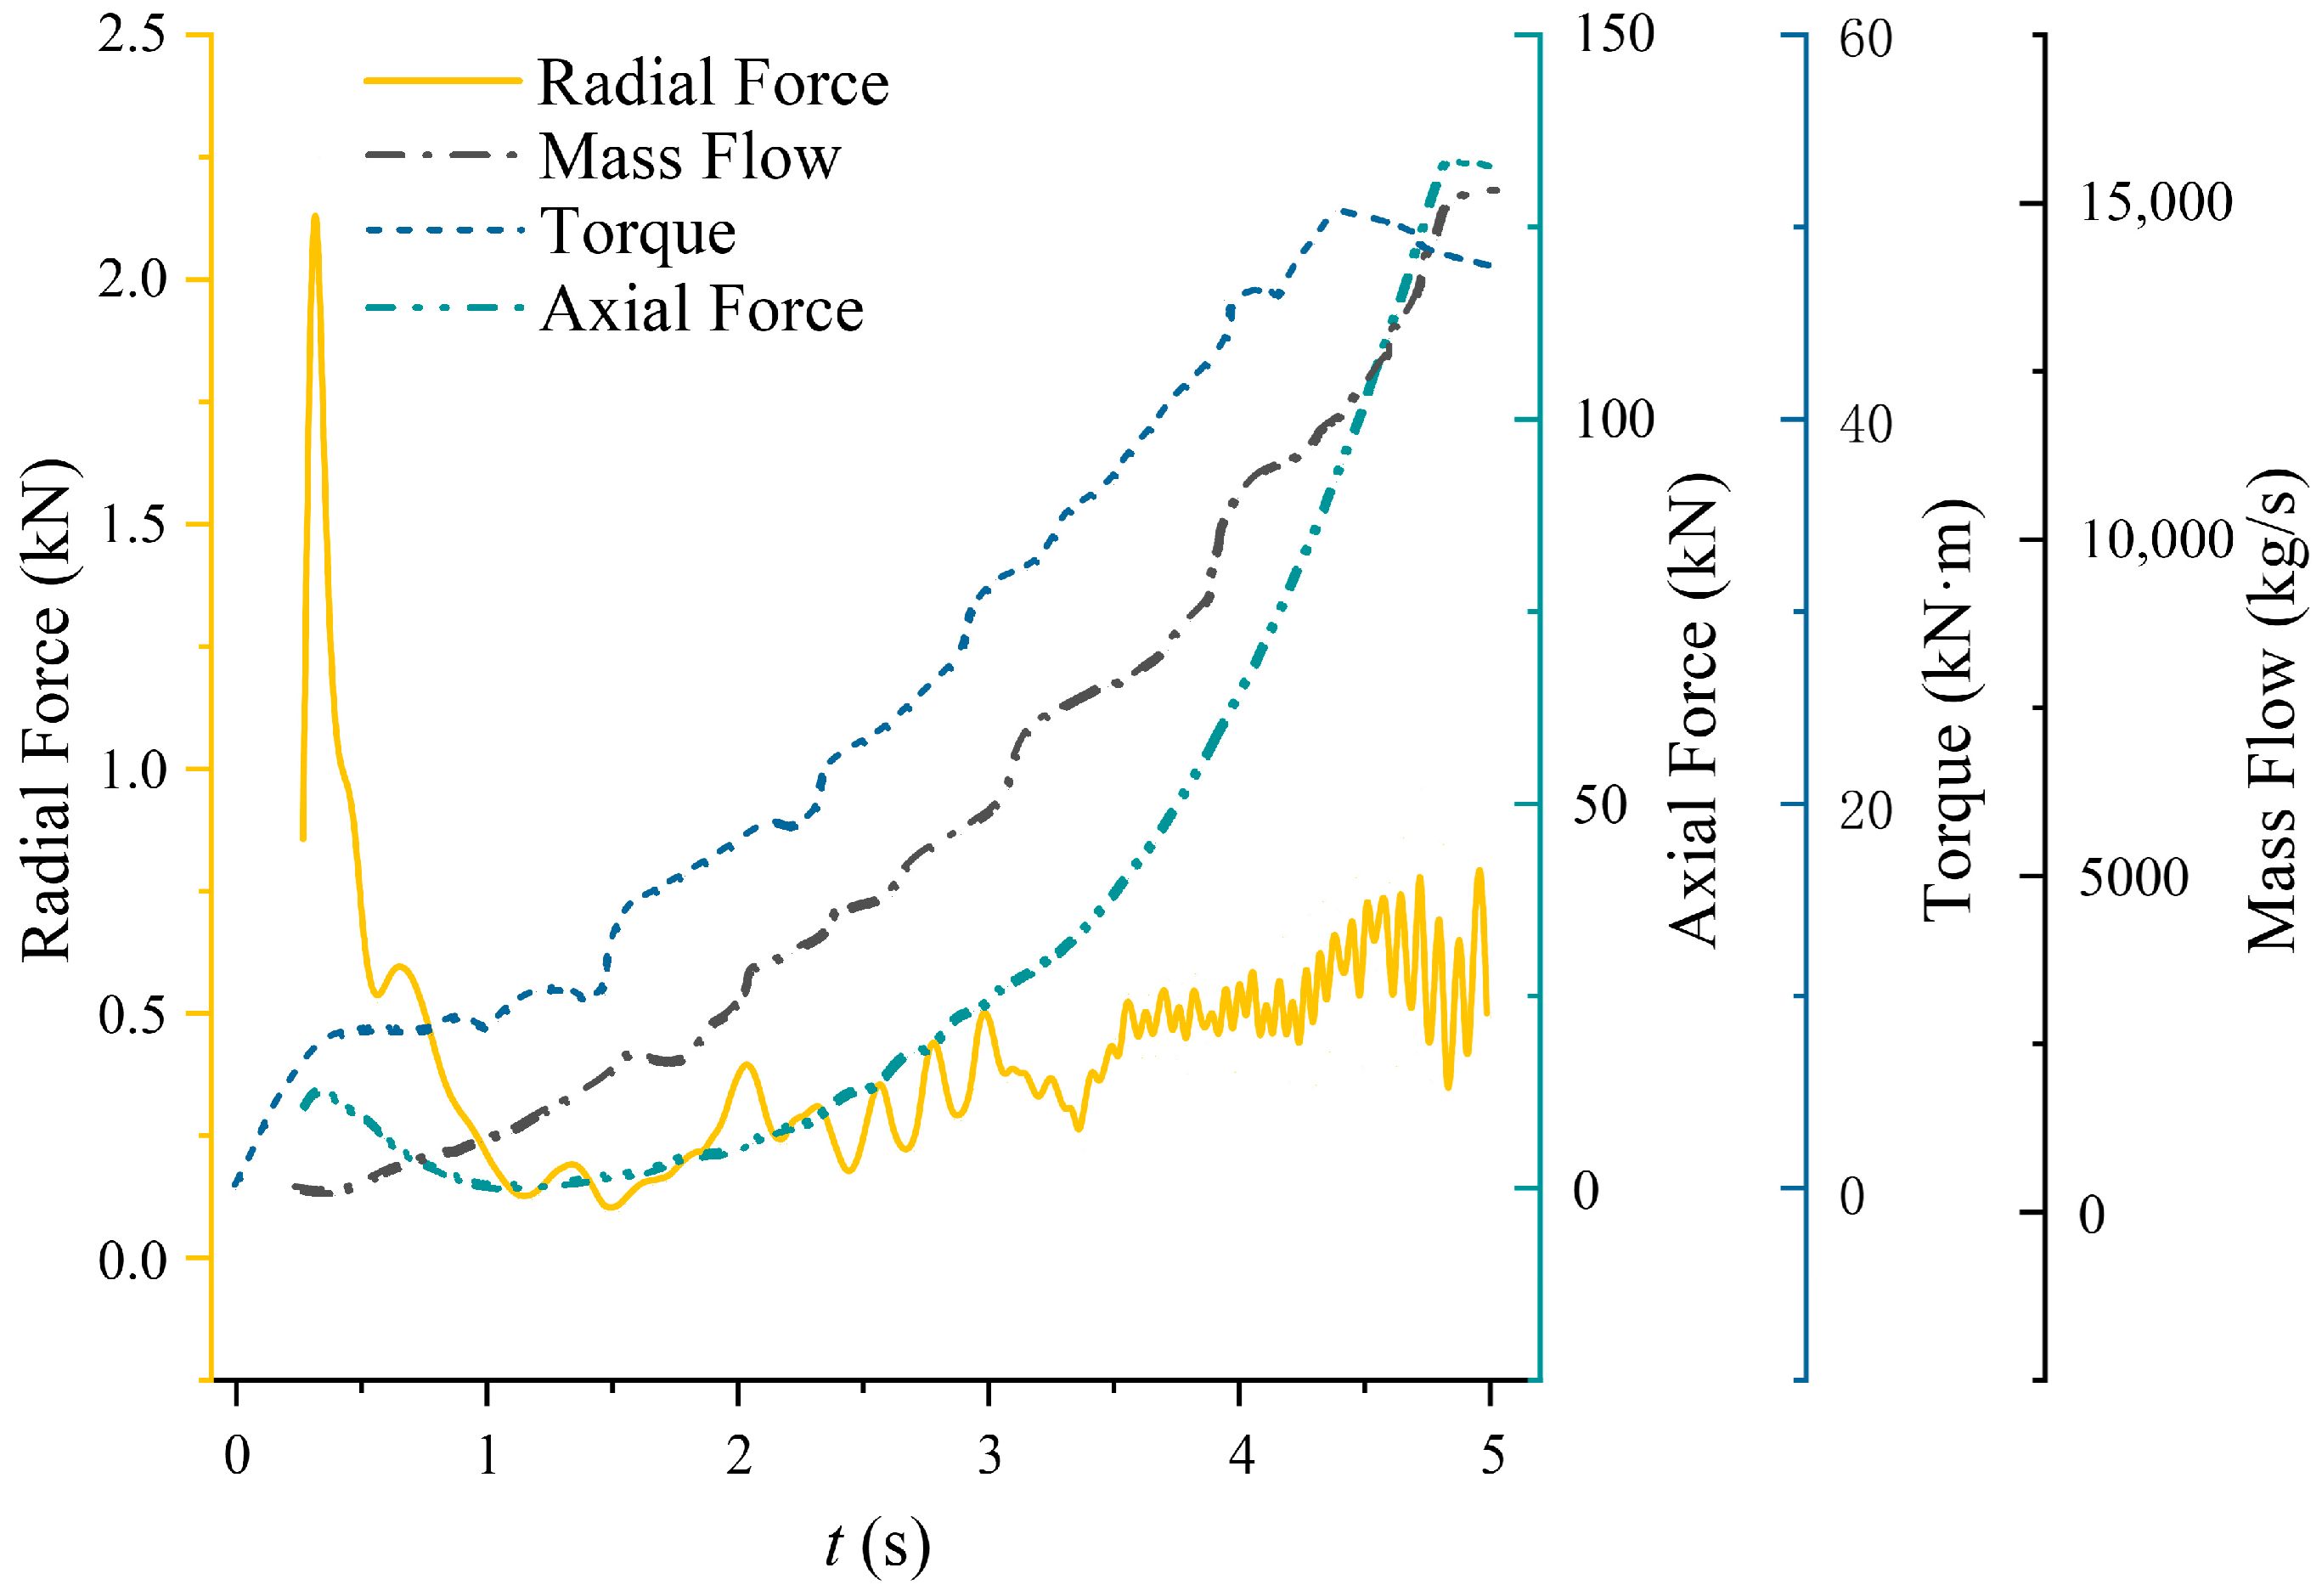
Figure 11 shows the numerically predicted time variations of axial force, radial force and torque acting on the impeller rotor during the start-up process, together with the corresponding mass flow rate. The axial force, radial force and torque represent the resultant hydrodynamic loads acting on the impeller rotor, and they were extracted from the transient CFD solution. These parameters reflect the coupling among rotor loading, fluid inertia and flow-field reconstruction during the transient process, and they are important indicators for evaluating the start-up safety and dynamic stability of the pump system. The axial force is closely related to the establishment of the pressure difference between the inlet and outlet, while torque reflects the conversion of motor input power into hydraulic energy. The mass flow rate represents the development of the main flow passage from the initial stagnant state to a stable flow condition. In contrast, radial force is more sensitive to flow asymmetry, local pressure non-uniformity, tip leakage flow and unsteady vortical structures.
As shown in Figure 11, after the pump starts at t = 0 s, the mass flow rate increases rapidly from zero and finally stabilizes at approximately 15,500 kg/s. The axial force increases gradually from about 0.3 kN and reaches a stable value of approximately 133 kN at around t = 4.8 s. The torque also shows an overall increasing trend, rising from 0 kN·m to about 50 kN·m, and gradually converges after t = 4.4 s. A slight decrease is then observed, which may be attributed to the establishment of the main flow rate and the weakening of the fluid inertial resistance in the later stage of start-up. Meanwhile, the redistribution of the inlet–outlet pressure difference and the adjustment of local flow structures, such as trailing-edge vortices and backflow, may further modify the instantaneous rotor load. Based on the responses of mass flow rate, axial force and torque, the pump system basically completes the start-up process at approximately t = 4.8 s, after which the internal flow field and rotor loading approach a quasi-steady state.
Compared with the axial force and torque, the radial force exhibits a more complex and strongly unsteady response. In the early start-up stage, the radial force increases rapidly and reaches a peak value of approximately 2.25 kN at around t = 0.2 s. It then decreases quickly during t = 0.5–1.5 s, accompanied by irregular fluctuations. During t = 1.5–3.5 s, the fluctuation amplitude is reduced, but the radial force still remains within approximately 0.2–0.8 kN, indicating that circumferential non-uniformity of the impeller load still exists. During t = 4.0–5.0 s, although the mass flow rate, axial force and torque gradually become stable, the radial force continues to exhibit high-frequency fluctuations. This indicates that the radial force is more sensitive to local unsteady flow structures, and its dynamic response is not fully synchronized with global hydraulic parameters.
The above behavior can be attributed to the rapid variation in impeller speed and the incomplete establishment of the internal flow field during start-up. In this stage, the non-uniform pressure distribution in the main pump section induces transverse pressure differences and causes strong radial-force fluctuations. In addition, trailing-edge vortices, tip leakage vortices and local backflow structures continuously evolve and interact with the main flow, leading to continuous adjustment of the blade-surface pressure distribution and local momentum exchange. These effects further intensify the unsteady radial loading. Therefore, the radial force can be regarded as a key indicator for characterizing asymmetric flow, local load fluctuation and rotor dynamic stability during the start-up process.
The previous analysis indicates that the radial force exhibits pronounced non-stationary characteristics during the start-up process. In addition to the initial impulse response, the time-domain waveform contains multi-scale modulation and aperiodic disturbances, suggesting that the radial force is not a simple periodic response but a nonlinear dynamic response driven by flow-field evolution, rotor–fluid interaction and local flow disturbances. Especially before the system reaches a quasi-steady state, high-frequency fluctuations remain evident. Therefore, time-domain analysis alone is insufficient to identify the dominant frequency components and local energy distribution of the radial force.
Direct time-resolved experimental measurements of the transient torque during start-up were not available in the present model test. Therefore, the transient torque response shown in Figure 11 was not directly validated against experimental torque histories. Nevertheless, the torque evolution was obtained from the same CFD framework validated against steady-state hydraulic performance, and it was analyzed together with the transient evolution of mass flow rate, axial force, radial force and internal flow structures. Thus, the predicted torque response can still provide useful insight into the dominant hydrodynamic-load evolution during the start-up process.
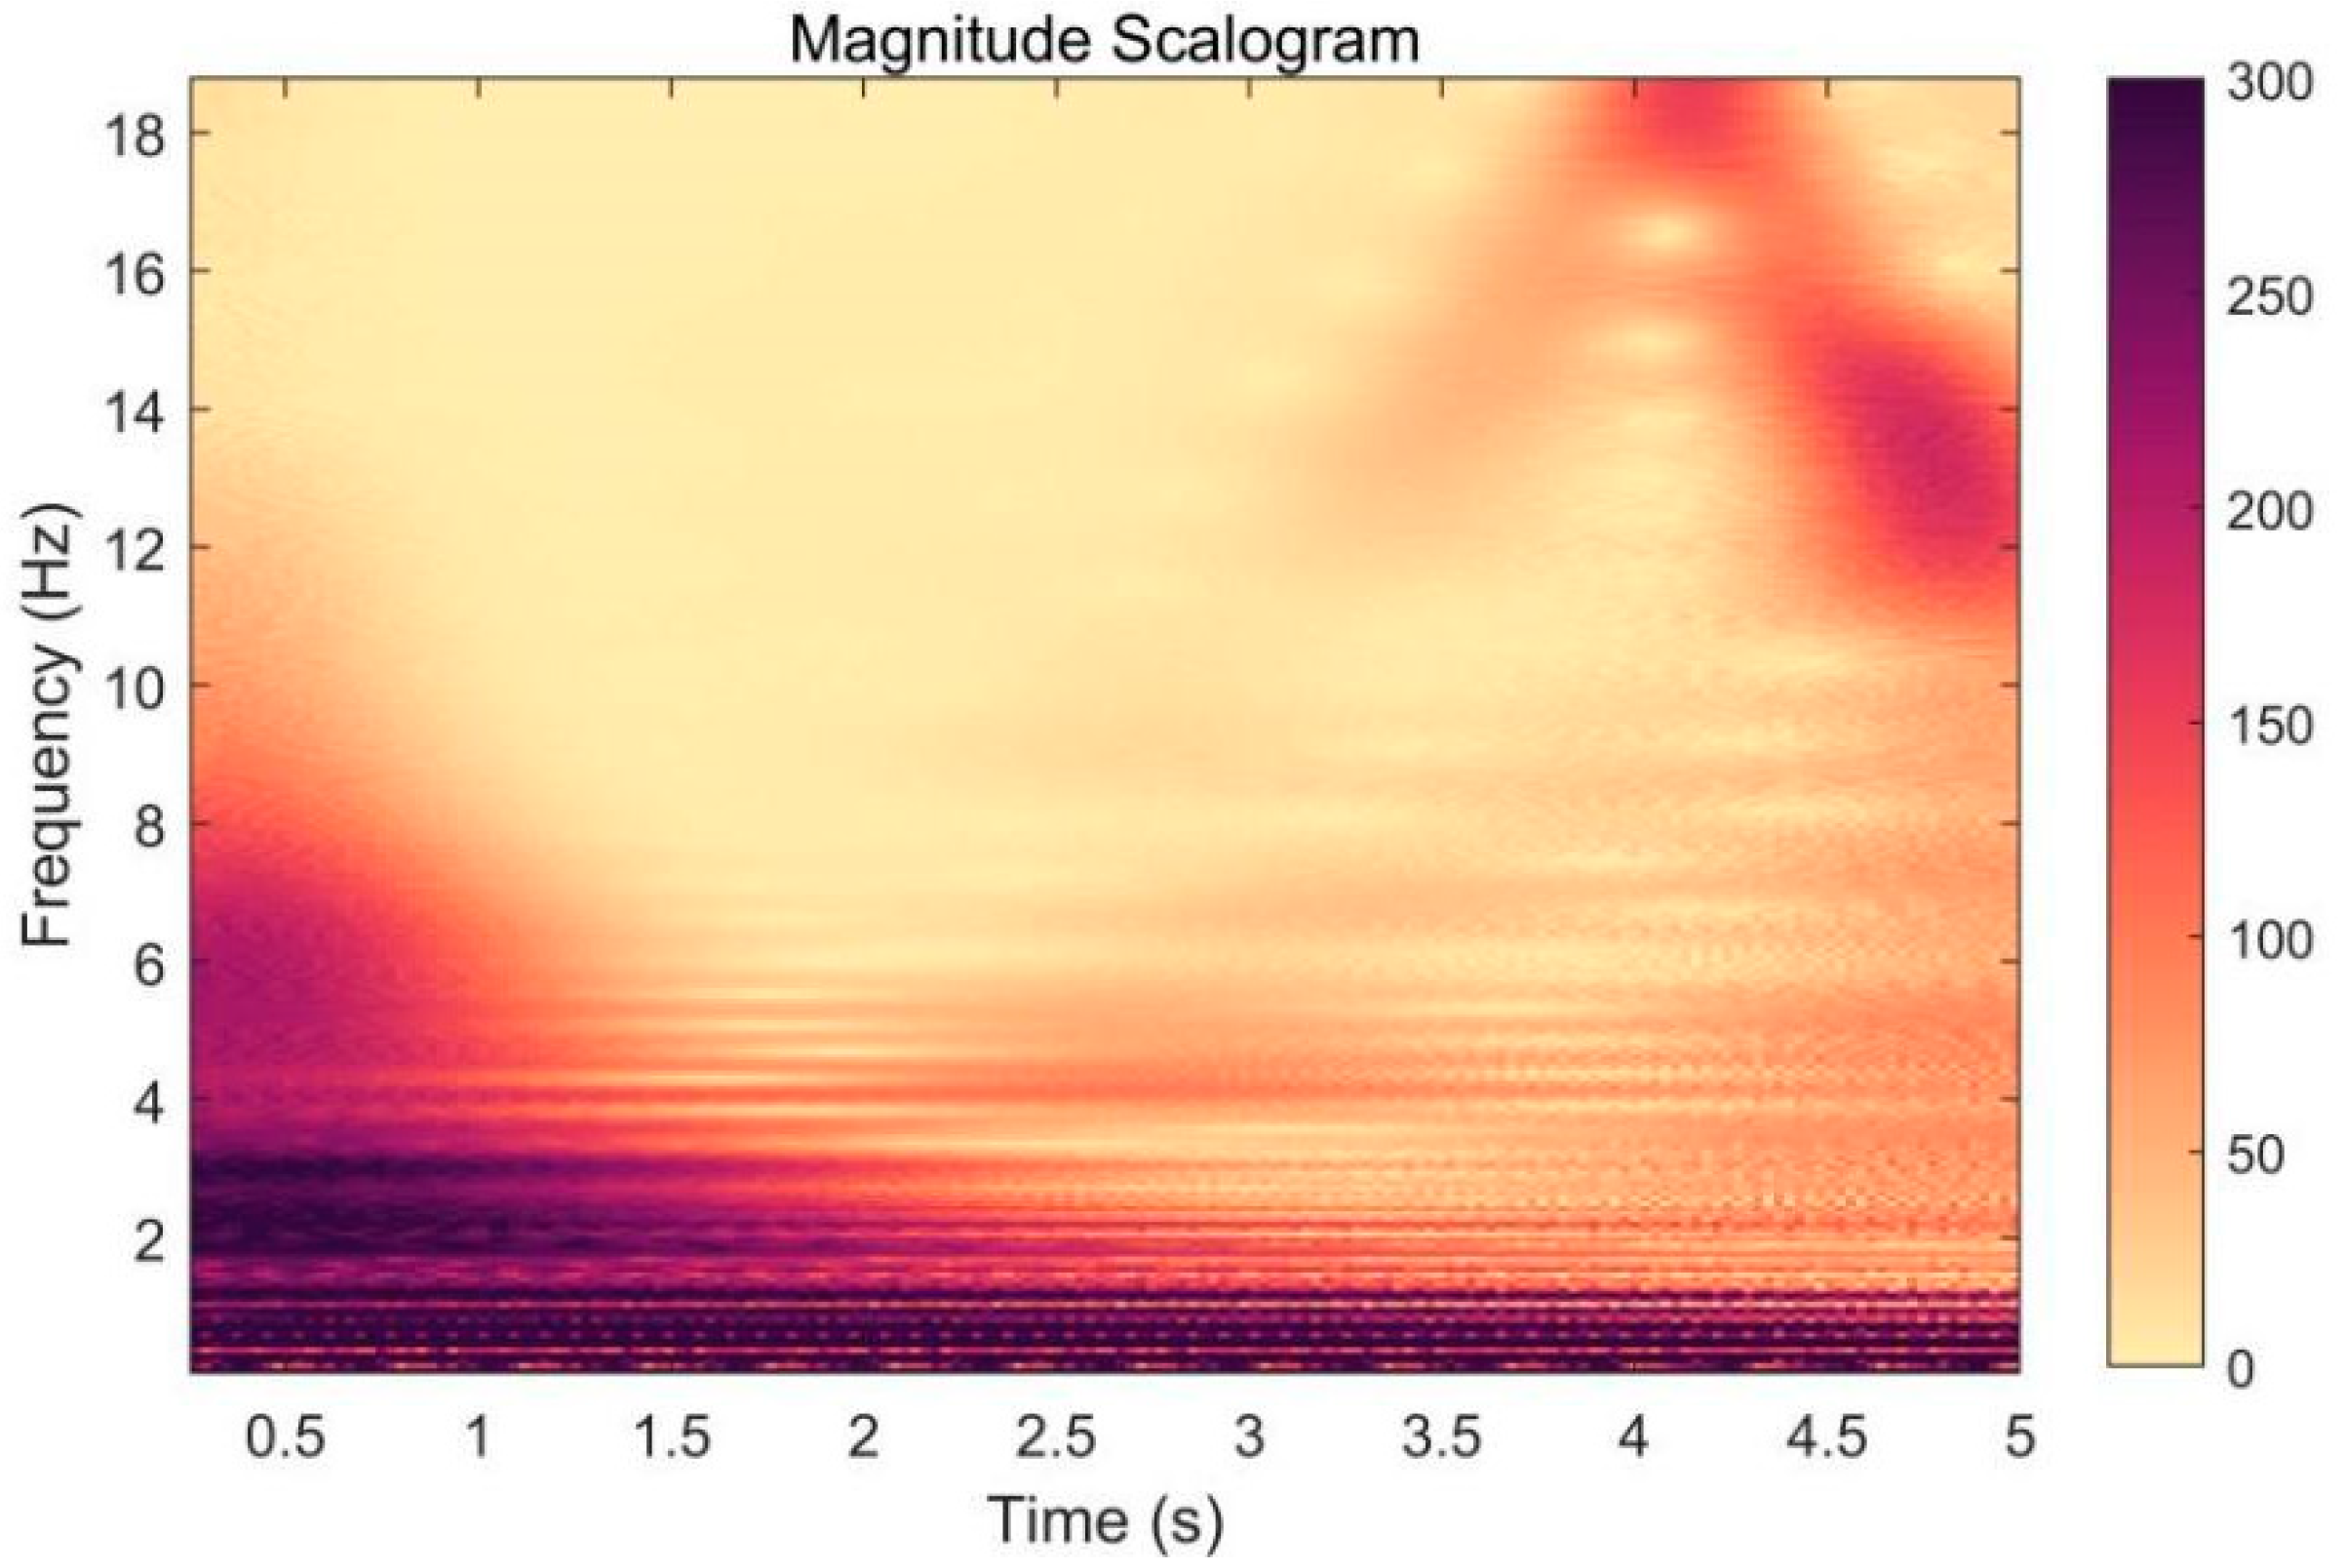
To further characterize the transient frequency evolution of the radial force, continuous wavelet transform (CWT) was employed. CWT is a typical time–frequency analysis method suitable for non-stationary signals. Unlike Fourier transforms, it does not require the assumption of global periodicity. Instead, it decomposes a signal through translation and scaling of the mother wavelet, thereby capturing local features at different frequency scales. This method provides good temporal resolution for high-frequency components while maintaining frequency resolution for low-frequency components, making it suitable for analyzing radial-force signals with impulse, oscillation and modulation characteristics. In this study, the Morlet wavelet was selected as the mother wavelet because of its good time–frequency localization capability for non-stationary vibration-like signals.
Figure 12 presents the CWT time–frequency spectrum of the rotor radial force during start-up. The horizontal axis represents time, the vertical axis represents frequency, and the color intensity denotes the magnitude of the wavelet coefficient, corresponding to the local energy intensity of the signal. During the initial stage of start-up, from 0 to 1.5 s, a broad low-frequency energy band appears mainly within 0–4 Hz. This indicates that the impeller is subjected to strong asymmetric hydrodynamic excitation and rapid internal flow reconstruction, resulting in a significant transient lateral impact on the rotor. As the start-up process proceeds, the low-frequency energy gradually decays, and the system enters a transitional response stage.
In the time interval of 3.0–4.5 s, several frequency-modulation structures appear in the range of 10–18 Hz, showing inclined or locally enhanced energy bands. This suggests that the rotor is intermittently excited by unsteady flow structures during the later stage of start-up. Around t = 4.2 s, the high-frequency energy increases again, which corresponds to the slight decrease in torque observed at a similar time. This may indicate a local adjustment of the flow field and rotor loading before the system approaches a quasi-steady state.
Overall, the CWT results reveal clear stage-dependent frequency characteristics of the radial force during start-up. The early stage is dominated by low-frequency transient excitation, whereas the later stage contains more complex medium- and high-frequency components associated with unsteady flow structures. These results further demonstrate the sensitivity of radial force to internal flow instability and indicate that high-frequency load fluctuations should be considered in the optimization of pump start-up and rotor dynamic stability.
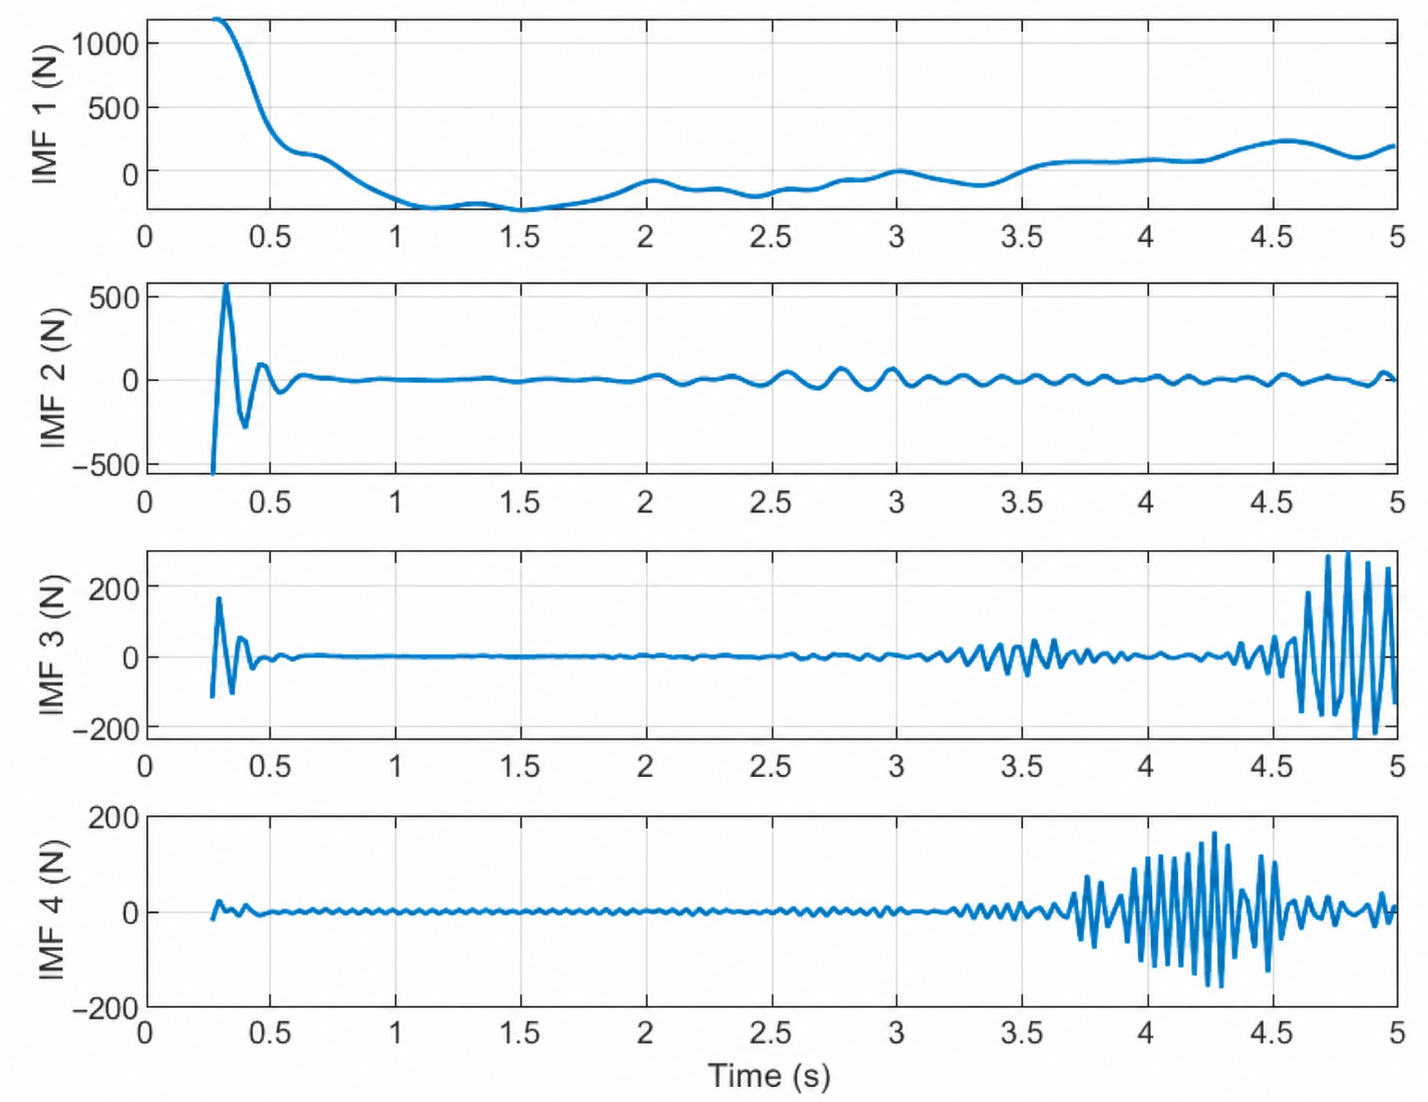
To extract the potential multi-scale components of the rotor radial-force signal, variational mode decomposition (VMD) was applied to the time-domain signal. VMD is an adaptive signal-processing method that decomposes a non-stationary signal into several intrinsic mode functions (IMFs) with limited bandwidths and adaptively determined center frequencies under a variational constraint framework. Since the radial force of the rotor is affected by multiple hydraulic excitations and structural responses during start-up, the signal exhibits pronounced nonlinear and non-stationary characteristics. Therefore, VMD was used to separate the radial-force signal into different modal components, allowing further identification of its time–frequency features and physical mechanisms.
The VMD results of the rotor radial force are shown in Figure 13. In the present decomposition, the bandwidth constraint parameter α was set to 100, the dual ascent step τ was set to 0, the DC component option was set to 0, the center frequencies were initialized uniformly (init = 1), and the convergence tolerance was set to 1 × 10⁻⁶. The number of modes K was set to four, indicating that the original signal was decomposed into four IMFs. This value was selected by considering both the spectral characteristics of the radial-force signal and the stability of the decomposition results. Using four modes can preserve the main frequency information while avoiding excessive modal redundancy and noise leakage.
As shown in Figure 13, IMF 1 is a low-frequency component with relatively high amplitude. It decreases rapidly before 1.5 s and then shows a slowly varying fluctuation. This component mainly reflects the large-scale unbalanced radial force induced by the unstable establishment of the flow field during the early acceleration stage. It is closely related to the non-uniform pressure distribution, unsteady vortex structures and wake development in the flow passages. IMF 2 presents a medium–low-frequency oscillation that gradually becomes stable, indicating that it may be associated with the asymmetric flow and periodic blade loading after the main flow structure is gradually established. This component may originate from secondary flow, alternating pressure variations on blade surfaces and rotationally non-uniform hydraulic excitation, and its frequency is likely related to the impeller rotational frequency or its low-order harmonics.
IMF 3 and IMF 4 exhibit typical high-frequency oscillation characteristics. In particular, after approximately 4.5 s, their amplitudes and frequencies increase simultaneously, indicating that local high-frequency disturbances become more evident in the later stage of start-up when the pump approaches a relatively stable operating state. These components may reflect the response of the rotor system to hydraulic excitation associated with local unsteady flow structures. Compared with the other modes, IMF 4 shows more distinct variations in frequency and envelope amplitude, suggesting that potential fluid–structure interaction or local instability may exist in the system and should be further examined.
In rotating machinery, the dynamic characteristics of blade loading are closely related to energy conversion efficiency and operational stability. For an axial-flow pump, the loading difference between the pressure side (PS) and suction side (SS) of the blade provides the main driving force for fluid energy transfer. However, excessive blade loading may enhance tip leakage flow and cause effective flow loss, thereby reducing hydraulic efficiency. In addition, asymmetric blade loading can induce unsteady axial and radial forces, which may increase the risk of bearing wear and rotor vibration, especially under low-head start-up conditions.
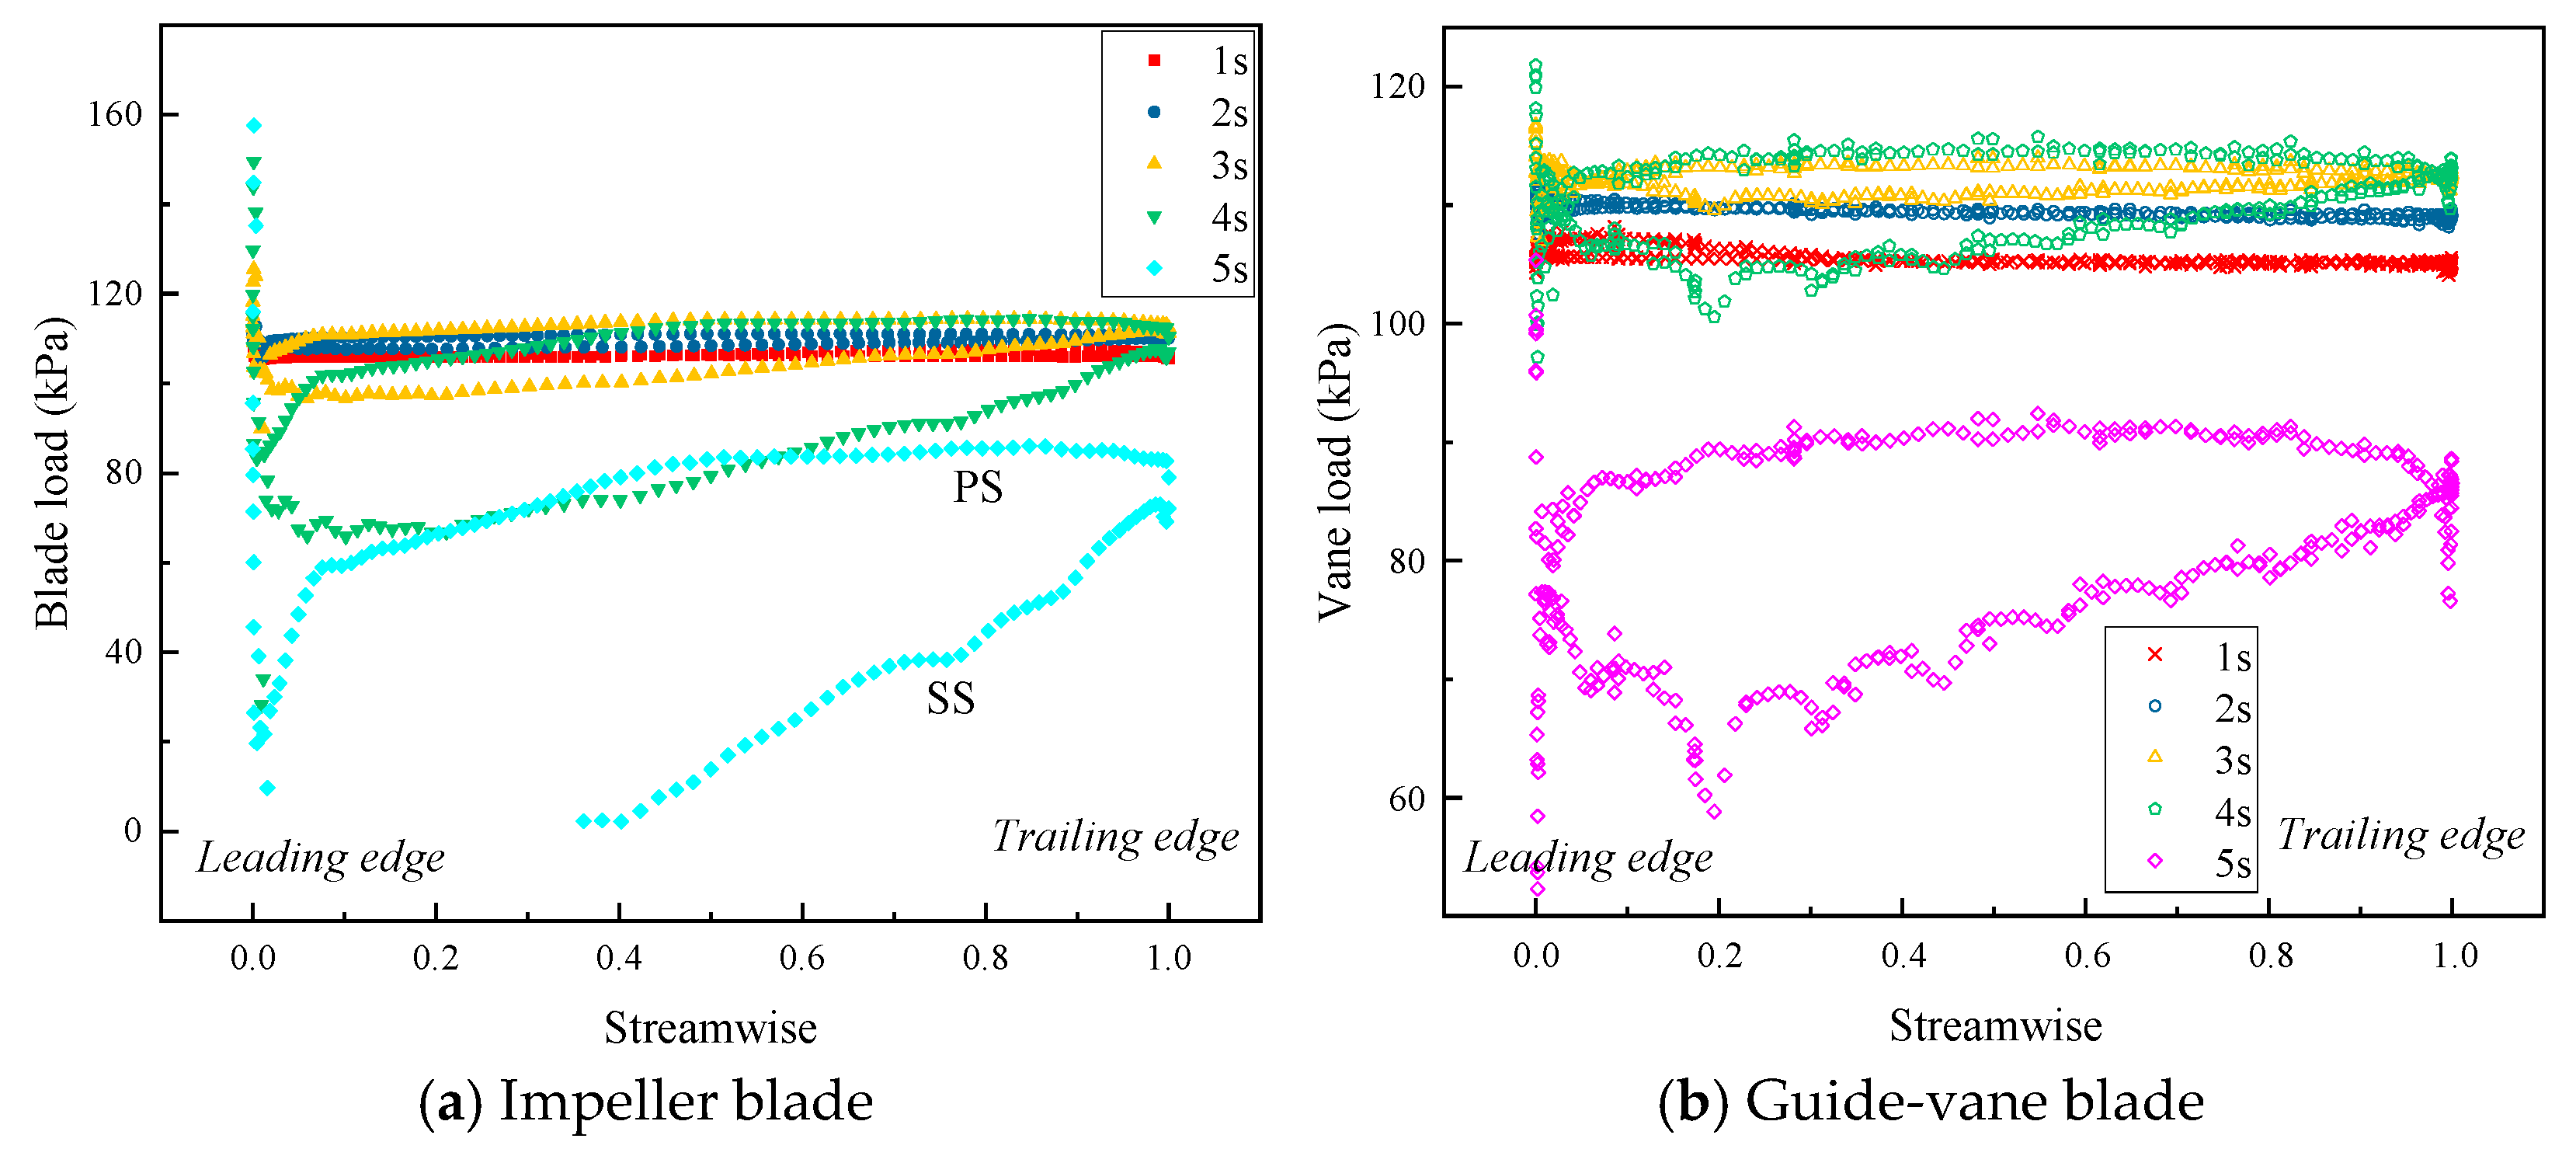
Figure 14 shows the variation in blade loading on the impeller and guide vane during the start-up transient process. Five representative time instants, namely 1, 2, 3, 4 and 5 s, were selected to characterize different stages of start-up, including the initial acceleration stage, the flow-development stage and the near-stable operating stage. The blade loading shown in the figure was obtained from the mean value at the 0.5 span position, which helps reduce the influence of local flow non-uniformity.
As shown in Figure 14a, the loading on the impeller blade is relatively uniform at the early start-up stage, namely t = 1 s, and its variation along the streamwise direction is limited. At this stage, the loading difference between the PS and SS is small. As the start-up process proceeds, the internal flow structure gradually develops, and the loading difference between the two blade sides increases. At t = 5 s, a negative streamwise pressure gradient appears near the blade leading-edge region, with the pressure decreasing along the flow direction. Meanwhile, the loading difference between the PS and SS reaches its maximum value of 76.76 kPa. The mean absolute blade loading decreases to 62.11 kPa, which is only 52.89% of the mean impeller-blade loading at t = 1 s.
Compared with the impeller blade, the guide-vane loading exhibits a non-monotonic variation during start-up, increasing first and then decreasing. Similarly to the impeller blade, the guide-vane loading is relatively uniform in the early stage, and the difference between the PS and SS is small. With the development of the flow field, the loading difference on the two sides of the guide vane becomes more pronounced. In particular, during the later stage of start-up, from 3.0 to 5.0 s, the guide-vane loading distribution shows clear asymmetry, indicating that the guide vane is strongly affected by the unsteady impeller wake and residual swirl.


6. Conclusions

In this study, a transient numerical method with dynamic rotational-speed updating was employed to investigate the internal flow evolution and rotordynamic characteristics of a siphon vertical axial-flow pump during start-up. The flow-angle distribution, vortex stretching term, blade-surface pressure, rotor mechanical response, radial-force time–frequency characteristics and blade-loading variation were analyzed. The main conclusions are summarized as follows:
(1)
The established transient start-up model can reasonably predict the hydraulic performance of the siphon vertical axial-flow pump system and provide a reliable basis for analyzing the corresponding flow evolution and rotor dynamic response. The numerical results agree well with the model-test data, with the maximum deviation in pump head being less than 2.29% and the efficiency deviation near the design condition being approximately 0.50%. This demonstrates the reliability of the adopted turbulence model, mesh strategy and boundary conditions. Moreover, the dynamic rotational-speed updating method based on torque balance can better represent the coupling among motor driving torque, hydraulic resistance torque and rotor inertia, providing a reliable basis for analyzing rotor dynamic responses.
(2)
During start-up, the internal flow in the main pump section evolves from a strongly unsteady swirling state to an axially dominated flow state. In the early stage, obvious pre-swirl, local backflow and circumferentially non-uniform flow occur near the impeller inlet and the impeller–guide-vane interaction region, resulting in highly scattered flow-angle distributions. As the rotational speed and flow rate increase, the high circumferential-flow regions are gradually weakened, and the flow angles at different monitoring sections tend to converge toward approximately 90°. This indicates that the main flow passage is progressively established, the rectifying effect of the guide vane is enhanced, and the internal flow structure becomes more ordered.
(3)
The vortex stretching term effectively reveals the spatial evolution mechanism of unsteady vortical structures during start-up. At the initial stage, strong vortex stretching is mainly concentrated near the blade leading and trailing edges, blade-tip clearance and impeller–guide-vane interaction region, indicating rapid stretching, tilting and reorientation of tip leakage vortices, passage vortices and wake vortices. As the start-up process proceeds, the initially large-scale and disordered vortex stretching gradually evolves into localized and regular structures distributed along the blade edges, tip-clearance region and guide-vane boundaries. This suggests that the strong unsteady vortical motion in the early stage is progressively suppressed, and the flow in the main pump section gradually approaches a quasi-steady state.
(4)
The rotor mechanical response exhibits clear stage-dependent and multi-scale characteristics. Compared with the axial force and torque, the radial force is more sensitive to local unsteady flow structures. It rapidly reaches a peak value of approximately 2.25 kN in the early stage and then decays with irregular fluctuations. The CWT results show that the radial force is mainly dominated by low-frequency transient excitation within 0–4 Hz during the initial stage, whereas medium- and high-frequency modulation structures within 10–18 Hz appear in the later stage. The VMD results further indicate that the low-frequency mode mainly reflects the large-scale unbalanced load induced by rapid flow-field establishment, while the high-frequency modes are associated with local flow disturbances and potential fluid–structure interaction in the later stage. In addition, the blade-loading analysis shows that the loading difference between the pressure side and suction side of the impeller and guide-vane blades increases during start-up, indicating that asymmetric blade loading is an important source of radial-force fluctuation. Therefore, suppressing early-stage flow disorder, reducing high-frequency radial-force excitation and improving impeller–guide-vane matching are important for enhancing the start-up stability of siphon vertical axial-flow pump systems.

Author Contributions

Conceptualization, Y.Z. (Yadong Zhu) and Y.Y.; methodology, Y.Z. (Yadong Zhu) and Y.Z. (Yinyan Zhao); software, Y.Z. (Yadong Zhu); validation, Y.Z. (Yadong Zhu), Y.Z. (Yinyan Zhao) and Z.S.; formal analysis, Y.Z. (Yadong Zhu) and Y.Z. (Yinyan Zhao); investigation, Y.Z. (Yadong Zhu) and Y.Z. (Yinyan Zhao); resources, Y.Y., Z.Z. and W.J.; data curation, Y.Z. (Yadong Zhu) and Y.Z. (Yinyan Zhao); writing—original draft preparation, Y.Z. (Yadong Zhu) and Y.Z. (Yinyan Zhao); writing—review and editing, Y.Y., Z.S., Z.Z. and W.J.; visualization, Y.Z. (Yinyan Zhao); supervision, Y.Y.; project administration, Y.Y.; funding acquisition, Y.Y. All authors have read and agreed to the published version of the manuscript.

Funding

This work was supported by the Yangzhou Municipal Science and Technology Public Service Platform Construction Project (Grant No. YZ2023223).

Data Availability Statement

Data will be made available upon request.

Acknowledgments

The authors would like to thank the technical staff of the laboratory for their assistance during the experimental measurements.

Conflicts of Interest

The authors declare no conflicts of interest.

References

  1. Liu, Y.; Zhou, J.; Zhou, D. Transient flow analysis in axial-flow pump system during stoppage. Adv. Mech. Eng. 2017, 9, 1687814017723280. [Google Scholar] [CrossRef] [Scilit]
  2. Fu, S.; Zheng, Y.; Kan, K.; Chen, H.; Han, X.; Liang, X.; Liu, H.; Tian, X. Numerical simulation and experimental study of transient characteristics in an axial flow pump during start-up. Renew. Energy 2020, 146, 1879–1887. [Google Scholar] [CrossRef] [Scilit]
  3. Zhang, X.; Tang, F.; Liu, C.; Shi, L.; Liu, H.; Sun, Z.; Hu, W. Numerical simulation of transient characteristics of start-up transition process of large vertical siphon axial flow pump station. Front. Energy Res. 2021, 9, 706975. [Google Scholar] [CrossRef] [Scilit]
  4. Zhang, X.; Hu, C.; Tang, F.; Yang, F.; Shi, L.; Liu, C. Numerical and field experimental study on the start-up process of a prototype axial-flow pump system considering the motion characteristics of cutoff facilities. Phys. Fluids 2024, 36, 024102. [Google Scholar] [CrossRef] [Scilit]
  5. Meng, F.; Qin, Z.; Li, Y.; Chen, J. Investigation of transient characteristics of a vertical axial-flow pump with non-uniform suction flow. Machines 2022, 10, 855. [Google Scholar] [CrossRef] [Scilit]
  6. Kan, K.; Chen, H.; Zheng, Y.; Zhou, D.; Binama, M.; Dai, J. Transient characteristics during power-off process in a shaft extension tubular pump by using a suitable numerical model. Renew. Energy 2021, 164, 109–121. [Google Scholar] [CrossRef] [Scilit]
  7. Kan, K.; Zheng, Y.; Chen, H.; Zhou, D.; Dai, J.; Binama, M.; Yu, A. Numerical simulation of transient flow in a shaft extension tubular pump unit during runaway process caused by power failure. Renew. Energy 2020, 154, 1153–1164. [Google Scholar] [CrossRef] [Scilit]
  8. Yang, F.; Chang, P.; Jian, H.; Lv, Y.; Tang, F.; Jin, Y. Numerical analysis of unsteady internal flow characteristics of impeller-guide vane in a vertical axial flow pump device. Front. Energy Res. 2022, 10, 935888. [Google Scholar] [CrossRef] [Scilit]
  9. Lin, Z.; Yang, F.; Ding, P.; Teng, J.; Yuan, Y.; Jin, Y. Analysis of pressure pulsation and energy characteristics of guide vane for axial flow pump based on Hilbert–Huang transform considering impeller–guide vane interaction. Sci. Prog. 2023, 106, 00368504231188627. [Google Scholar] [CrossRef] [Scilit] [PubMed]
  10. Yang, F.; Tang, F.; Liu, C.; Jiang, D.; Jin, Y. Numerical and experimental investigation of internal flow characteristics and pressure fluctuation in inlet passage of axial flow pump under deflection flow conditions. Energies 2021, 14, 5245. [Google Scholar] [CrossRef] [Scilit]
  11. Duan, X.; Tang, F.; Duan, W.; Zhou, W.; Shi, L. Experimental investigation on the correlation of pressure pulsation and vibration of axial flow pump. Adv. Mech. Eng. 2019, 11, 1687814019889473. [Google Scholar] [CrossRef] [Scilit]
  12. Yang, F.; Chang, P.; Li, C.; Shen, Q.; Qian, J.; Li, J. Numerical analysis of pressure pulsation in vertical submersible axial flow pump device under bidirectional operation. AIP Adv. 2022, 12, 025107. [Google Scholar] [CrossRef] [Scilit]
  13. Zhao, H.; Wang, F.; Wang, C.; Lu, H.; Zhu, B. Generation mechanism and control methods of secondary flows in the impeller of axial flow pumps. Phys. Fluids 2023, 35, 065127. [Google Scholar] [CrossRef] [Scilit]
  14. Shi, L.; Chai, Y.; Wang, L.; Xu, T.; Jiang, Y.; Xing, J.; Yan, B.; Chen, Y.; Han, Y. Numerical simulation and model test of the influence of guide vane angle on the performance of axial flow pump. Phys. Fluids 2023, 35, 015129. [Google Scholar] [CrossRef] [Scilit]
  15. Yang, F.; Li, Z.; Lv, Y.; Li, J.; Zhou, G.; Nasr, A. Numerical analysis of flow characteristics in impeller-guide vane hydraulic coupling zone of an axial-flow pump as turbine device. J. Mar. Sci. Eng. 2023, 11, 661. [Google Scholar] [CrossRef] [Scilit]
  16. Duan, X.; Tang, F.; Xu, H.; Chen, J.; Lu, Q.; Duan, W.; Zhang, R. Analysis of centroid trajectory characteristics of axial-flow pump impeller under hydraulic excitation. Front. Energy Res. 2021, 9, 754419. [Google Scholar] [CrossRef] [Scilit]
  17. Kan, K.; Zhang, Q.; Xu, H.; Feng, J.; Song, Z.; Cheng, J.; Binama, M. Investigation of non-uniform inflow effects on impeller forces in axial-flow pumps operating as turbines. Water 2024, 16, 1428. [Google Scholar] [CrossRef] [Scilit]
  18. Brennen, C.E. Hydrodynamics of Pumps; Oxford University Press: New York, NY, USA, 1994. [Google Scholar]
  19. Chalghoum, I.; Elaoud, S.; Kanfoudi, H.; Akrout, M. The effects of the rotor-stator interaction on unsteady pressure pulsation and radial force in a centrifugal pump. J. Hydrodyn. 2018, 30, 672–681. [Google Scholar] [CrossRef] [Scilit]
  20. Wu, C.; Yang, J.; Yang, S.; Wu, P.; Huang, B.; Wu, D. A review of fluid-induced excitations in centrifugal pumps. Mathematics 2023, 11, 1026. [Google Scholar] [CrossRef] [Scilit]
  21. Shi, L.; Zhang, D.; Jin, Y.; Shi, W.; van Esch, B.P.M. A study on tip leakage vortex dynamics and cavitation in axial-flow pump. Fluid Dyn. Res. 2017, 49, 035504. [Google Scholar] [CrossRef] [Scilit]
  22. Zhang, D.; Pan, D.; Shi, W.; Wu, S.; Shao, P. Study on tip leakage vortex in an axial flow pump based on modified shear stress transport k−ω turbulence model. Therm. Sci. 2013, 17, 1551–1555. [Google Scholar] [CrossRef] [Scilit]
  23. Feng, J.; Luo, X.; Guo, P.; Wu, G. Influence of tip clearance on pressure fluctuations in an axial flow pump. J. Mech. Sci. Technol. 2016, 30, 1603–1610. [Google Scholar] [CrossRef] [Scilit]
  24. Liu, Y.; Tan, L. Tip clearance on pressure fluctuation intensity and vortex characteristic of a mixed flow pump as turbine at pump mode. Renew. Energy 2018, 129, 606–615. [Google Scholar] [CrossRef] [Scilit]
  25. Hao, Y.; Tan, L. Symmetrical and unsymmetrical tip clearances on cavitation performance and radial force of a mixed flow pump as turbine at pump mode. Renew. Energy 2018, 127, 368–376. [Google Scholar] [CrossRef] [Scilit]
  26. Zhang, H.; Shi, L.; Chen, B.; Zhang, D.; van Esch, B.P.M. Numerical analysis of the effect of cavitation on the tip leakage vortex dynamics characteristics in an axial-flow pump. J. Mar. Sci. Eng. 2021, 9, 775. [Google Scholar] [CrossRef] [Scilit]
  27. Jeong, J.; Hussain, F. On the identification of a vortex. J. Fluid Mech. 1995, 285, 69–94. [Google Scholar] [CrossRef] [Scilit]
  28. Torrence, C.; Compo, G.P. A practical guide to wavelet analysis. Bull. Am. Meteorol. Soc. 1998, 79, 61–78. [Google Scholar] [CrossRef] [Scilit]
  29. Dragomiretskiy, K.; Zosso, D. Variational mode decomposition. IEEE Trans. Signal Process. 2014, 62, 531–544. [Google Scholar] [CrossRef] [Scilit]
  30. Zhang, M.; Jiang, Z.; Feng, K. Research on variational mode decomposition in rolling bearings fault diagnosis of the multistage centrifugal pump. Mech. Syst. Signal Process. 2017, 93, 460–493. [Google Scholar] [CrossRef] [Scilit]
  31. Yang, F.; Chang, P.; Cai, Y.; Lin, Z.; Tang, F.; Lv, Y. Analysis of energy loss characteristics of vertical axial flow pump based on entropy production method under partial conditions. Entropy 2022, 24, 1200. [Google Scholar] [CrossRef] [Scilit] [PubMed]
  32. Zhu, Y.; Wang, H.; Sun, Z.; Zhou, Z.; Jiao, W.; Yang, Y. Transient Internal Flow and Energy Conversion Characteristics of a Siphon Vertical Axial-Flow Pump Hydraulic System During Startup. Water 2026, 18, 1973. [Google Scholar] [CrossRef] [Scilit]
Figure 1. Meridian surfaces of overflow components.
Water 18 02178 g001
Figure 2. Mesh independence verification based on head and efficiency. Grid independence analysis based on pump head and efficiency. Each marker represents the calculated result obtained with a specific grid number, where the upper and lower curves correspond to the hydraulic efficiency and pump head, respectively.
Water 18 02178 g002
Figure 3. Mesh details of impeller and vane.
Water 18 02178 g003
Figure 4. Calculation procedure of the system start-up transient process.
Water 18 02178 g004
Figure 5. Schematic diagram of the test bench used in the present study [32]: 1. inlet vacuum tank; 2.1. inlet flow passage; 2.2. outlet flow passage; 3. storage & pressure tank; 4. outlet pressure buffer tank; 5. DC variable-speed motor; 6. test pump; 6.1. guide vane; 6.2. impeller; 7. electromagnetic flowmeter; 8. globe valve; 9. electric regulating butterfly valve; 10. auxiliary pump.
Water 18 02178 g005
Figure 6. Comparison of experimental and numerically predicted pump performance values.
Water 18 02178 g006
Figure 7. Spatial arrangement of monitoring sections in the main pump section.
Water 18 02178 g007
Figure 8. Flow-angle distributions at different time instants during the start-up transient process.
Water 18 02178 g008
Figure 9. Distribution of the vortex stretching term at different monitoring sections during the start-up transient process.
Water 18 02178 g009
Figure 10. Pressure distribution and flow characteristics on the pressure side of the impeller blade at different time instants during the start-up transient process.
Water 18 02178 g010aWater 18 02178 g010b
Figure 11. Numerically predicted time variations of axial force, radial force and torque acting on the impeller rotor, together with the mass flow rate during the start-up process.
Water 18 02178 g011
Figure 12. CWT results of the time-domain data of rotor radial force.
Water 18 02178 g012
Figure 13. VMD results of the time-domain data of rotor radial force.
Water 18 02178 g013
Figure 14. Variation in blade loading on the impeller and guide-vane blades during the start-up transient process at 0.5 span.
Water 18 02178 g014
Table 1. Systematic uncertainties of the experimental measurement system.
Measured ParameterSymbolSystematic Uncertainty
Flow rateEQ±0.16%
HeadEH±0.10%
TorqueEM±0.12%
Rotational speedEn±0.06%
Table 2. Summary of repeated efficiency measurements under a representative operating condition for repeatability assessment.
ParameterValue
Blade angle
Flow rate337.9 L/s
Rotational speed1312.5 r/min
Number of repeated measurements, N20
Mean efficiency, η ¯ 73.94%
Standard deviation, 0.371%
Confidence coefficient, t0.95(N − 1)1.7291
Systematic uncertainty, (Eη)s±0.232%
Random uncertainty, (Eη)r±0.194%
Comprehensive uncertainty, Eη±0.302%
Disclaimer/Publisher’s Note: The statements, opinions and data contained in all publications are solely those of the individual author(s) and contributor(s) and not of MDPI and/or the editor(s). MDPI and/or the editor(s) disclaim responsibility for any injury to people or property resulting from any ideas, methods, instructions or products referred to in the content.