Article

Evolution of the Deep Channels in the Hechangzhou Anabranching Reach Under the Regulation of Submerged Dikes

1
Jiangsu Hydraulic Research Institute, Nanjing 210017, China
2
Zhenjiang Yangtze River Management Office, Zhenjiang 212008, China
*
Author to whom correspondence should be addressed.
Water 2026, 18(17), 2176; https://doi.org/10.3390/w18172176
Submission received: 6 July 2026 / Revised: 28 August 2026 / Accepted: 29 August 2026 / Published: 3 September 2026
(This article belongs to the Special Issue River Dynamics: Flow and Sediment Transport)

Abstract

The Hechangzhou Anabranching Reach is a typical tidal anabranching segment of the Yangtze River with intense riverbed evolution driven by altered water-sediment regimes and channel regulation. Submerged dikes stabilize river regimes and navigation yet trigger differential local clear-water scour; most prior studies only adopt short-term bathymetric data and lack long-term quantitative analysis across diverse hydrological scenarios, so the synergistic geomorphic mechanism under the control of the submerged dike group remains unclear. This study integrates the 2002–2025 flow division ratio series and multi-period bathymetric data from 2018 to 2026 to quantify spatiotemporal deep-channel adjustments, scour-deposition patterns and cross-sectional deformation of the two anabranches, and evaluate morphological effects of river training structures and relevant potential scour risks. The submerged dike group regulates diversion patterns and keeps the left anabranch’s flow division ratio below 70%. The right anabranch deep channel undergoes persistent vertical incision and reverses its historical deposition trend, while the left anabranch features spatially uneven scour: intense scour zones migrate within the SD1–SD2 reach, and persistent landward erosion occurs between SD2 and SD3. The reach’s polarized evolution of intensified scour and attenuated deposition arises from the joint control of the submerged dike group, bank protection and reduced basin sediment supply. This study reveals the spatially differentiated riverbed evolution driven by engineering-induced hydrodynamic redistribution, offering scientific support for refined waterway management and scour prevention in analogous tidal anabranching rivers.

1. Introduction

The Hechangzhou Anabranching Reach is a critical waterway connecting the core region of the Yangtze River Delta. As one of the most dynamically evolving sections in the lower reaches of the Yangtze River [1,2], its morphological evolution directly impacts the maintenance of the deepwater navigation channel and flood control safety along the river. Influenced by multiple factors, including the continuous impingement of the main flow, the sinuous channel morphology, and drastic changes in water and sediment conditions [3,4,5], the flow division ratio of the left anabranch once kept rising, posing a threat to the stability of the main navigation channel in the right anabranch. Therefore, whether the continuous increase in the left anabranch’s flow division ratio can be effectively controlled within 70% is a critical issue concerning the safe operation of the deep-water channel and the sustainable development of local industries [6,7].
Regulation practices of multiple large rivers worldwide provide valuable references for research on river training structures in tidal anabranching rivers. The U.S. Army Corps of Engineers has long applied wing dikes, stone dikes, bendway weirs and chevrons in the middle Mississippi River [8]. These training structures are generally constructed to half-channel elevation and are fully submerged when water depth exceeds 5 m during floods. Since 1850, a series of transverse groynes have been deployed along the Waal River, a Dutch anabranch of the Rhine River, to narrow the channel and improve navigation. Nevertheless, long-term operation triggered cascading effects including persistent riverbed incision and elevated flood levels. To tackle these issues, the Netherlands replaced portions of groyne groups with Longitudinal Training Walls (LTW) in the reach near Tiel during 2013–2015 [9]. This scheme created a dual-channel system consisting of a primary navigation channel and an ecological secondary channel, balancing low-water navigation, flood conveyance and ecological restoration. In the Ganges–Brahmaputra basin, region-specific training techniques have been developed. Bandal-like structures function as hybrid groynes: their impermeable upper sections divert flow, while permeable lower sections allow sediment transport [10]. Overall, most existing case studies focus on engineering design and structural stability evaluation under conventional hydrological conditions. Few investigations have systematically explored the long-term morphological response mechanisms of training structures driven by extreme hydrological events.
To curb the adverse evolutionary trends, submerged dikes, as a critical type of underwater river training structures, have been widely applied in the regulation of such anabranching river channels [11,12]. During the dry season, submerged dikes are often exposed above the water surface or only slightly submerged, effectively guiding and directing the main flow. In contrast, during the flood season, as water levels rise, the dikes become completely submerged, thereby minimizing obstruction to flood discharge capacity. This unique hydrodynamic characteristic allows them to control the flow division ratio by adjusting momentum exchange, while simultaneously minimizing the impact on flood passage [12,13,14]. However, existing research indicates that while submerged dikes alter the main flow path and stabilize the river regime, they also trigger complex local hydraulic responses. The pressure differential and overtopping effect generated upstream and downstream of the dikes often form high-intensity local scour pits at the dike head and in the wake region. This “engineering-induced erosion”, directly triggered by the training structures, has become a major hazard threatening the safety of the engineering foundation [15,16,17].
Domestic scholars have conducted extensive research on the morphological evolution of the Hechangzhou Reach, with sustained attention paid to its anabranching reach regulation performance after the construction of the left anabranch inlet control project [18,19]. Meanwhile, relevant studies have revealed the intrinsic correlation among training structure layout, construction techniques, and geomorphic responses [20,21,22]. Previous studies have explored flow regulation effects and channel morphological evolution in anabranching reaches equipped with submerged dikes. These studies mostly adopt short-term observation datasets, only examine channel variations shortly before and after construction, and rarely conduct comprehensive analysis of riverbed evolution under the coupling of extreme floods and prolonged low-flow periods. Furthermore, existing works mainly discuss structural stability and short-term scour-sedimentation features under normal hydrological regimes. Few systematic efforts have been devoted to revealing the long-term morphological feedback of training structures triggered by extreme hydrological events, which usually serve as pivotal turning points in the geomorphic evolution of alluvial rivers [23]. In 2020, the Yangtze River Basin experienced another catastrophic basin-wide flood following the 1998 event, characterized by high flood peaks and prolonged high-water stages, which imposed severe tests on river channels and training structures in the middle and lower reaches. Against the background of intense hydrodynamic disturbance, the long-term differential migration mechanism of deep channels in two anabranches under the combined regulation of three submerged dikes remains unclear. In particular, quantitative identification based on long-term topographic measurements is still lacking for the operational performance of the submerged dike group under extreme floods and potential bank structure hazards induced by the landward migration of inter-dike deep channels.
Accordingly, this study integrates bathymetric data from 2018 to 2026 to systematically reconstruct the morphological evolution of the Hechangzhou Reach before and after the catastrophic 2020 flood. The research objectives are as follows: (1) analyze the sustained regulation performance of the three submerged dikes after long-term operation and extreme flood impacts; (2) quantitatively identify potential river regime risks caused by bank-adjacent deep channels and migrating scour troughs; (3) reveal the evolution laws of deep channels. The findings can provide scientific references for the operation, maintenance and comprehensive management of training structures in analogous anabranching rivers under extreme climate conditions.

2. Study Area and Methods

2.1. Study Area

2.1.1. General Overview

The Hechangzhou Anabranching Reach is located in the Zhenyang Reach of the lower Yangtze River, with geographic coordinates ranging from 119°30′ to 119°38′ E and 32°11′ to 32°16′ N. It is situated approximately 280 km from the Yangtze Estuary, near the upper limit of the tidal reach. The channel exhibits a typical compound anabranching pattern, resembling a “lotus-root” shape in planform. It extends 16.8 km from the Shatou estuary at the upstream end (receiving flow from the Liuwei bend) to the tail of Hechangzhou (connecting to the Dagang waterway). The Hechangzhou shoal divides the flow into left and right anabranches: the left anabranch is 10.9 km long, characterized by a wide and shallow cross-section with a “slightly curved to sharp S-shape” planform; historically, it served as the main anabranch when its division ratio exceeded 50%. The right anabranch is 10.2 km long and features a complex morphology, sequentially comprising a straight reach, a nearly 90° sharp bend, and a slightly curved adjustment reach. It currently serves as the main navigation channel for the Yangtze River Deep-Water Channel [24,25].

2.1.2. Regional Water and Sediment Background

As the last runoff control station on the middle and lower reaches of the Yangtze River mainstream, the Datong Hydrological Station has relatively limited water inflow from the downstream interval. Given that Hechangzhou is located downstream of the Datong Hydrological Station, its measured hydrological data can serve as a reliable representation of the runoff characteristics of the Hechangzhou Reach. According to statistics from 1950 to 2024, the multi-year average total runoff at Datong Hydrological Station is approximately 894.7 billion m3. Although there is significant interannual fluctuation, the multi-year average runoff shows no obvious trend of change. Notably, with the official operation of the Three Gorges Reservoir in 2003, the mean annual sediment load at the Datong Hydrological Station during 2003–2024 decreased to 124 million tons. Compared to the pre-reservoir period (1951–2002) of 427 million tons, this represents a decline of over 70%, indicating profound changes in the runoff and sediment regimes of the Yangtze River basin [26,27,28,29].

2.1.3. Project Overview

Prior to the construction of submerged dikes, the Hechangzhou Reach exhibited an evident asymmetric evolution pattern with vigorous development of the left anabranch and degradation of the right anabranch. Previous studies have revealed that before 2002, the right anabranch suffered insufficient hydrodynamic force due to deteriorated inflow conditions, leading to continuous riverbed deposition that severely impaired navigation capacity and safety. Meanwhile, the flow division ratio of the left anabranch kept rising, accompanied by intensified scour and progressive deepening of deep channels, resulting in highly unbalanced development between the two anabranches [30,31].
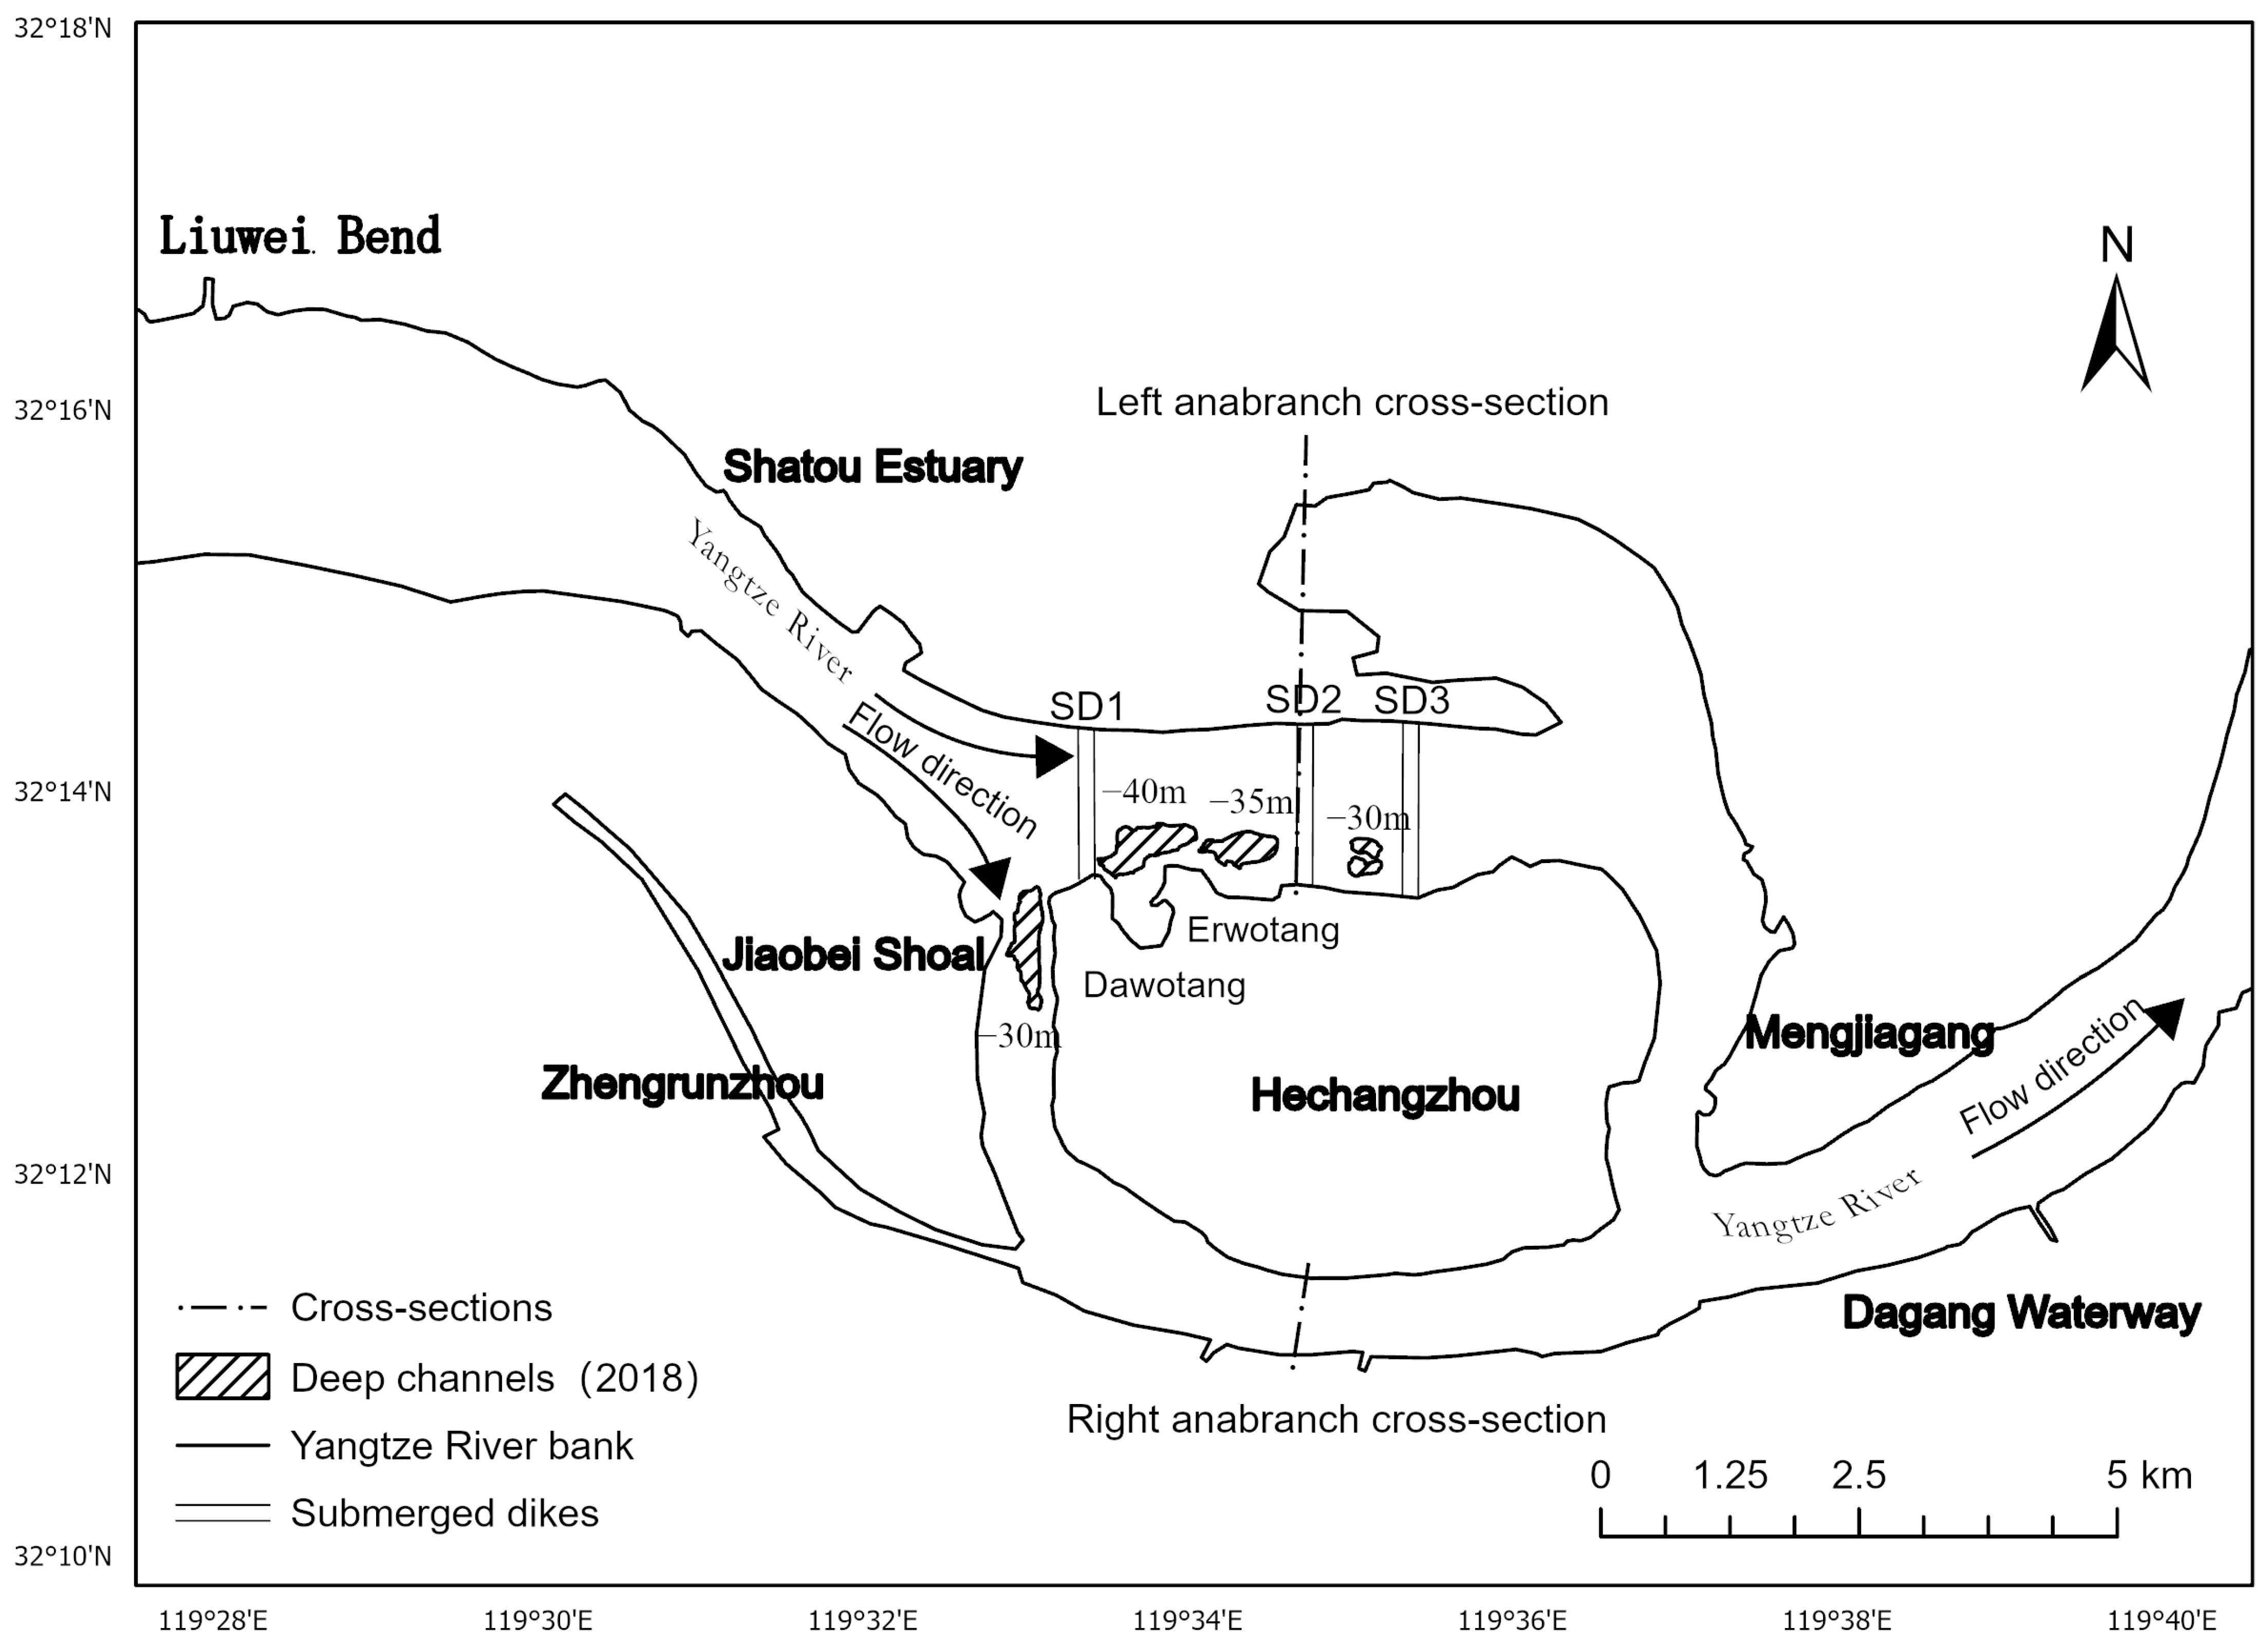
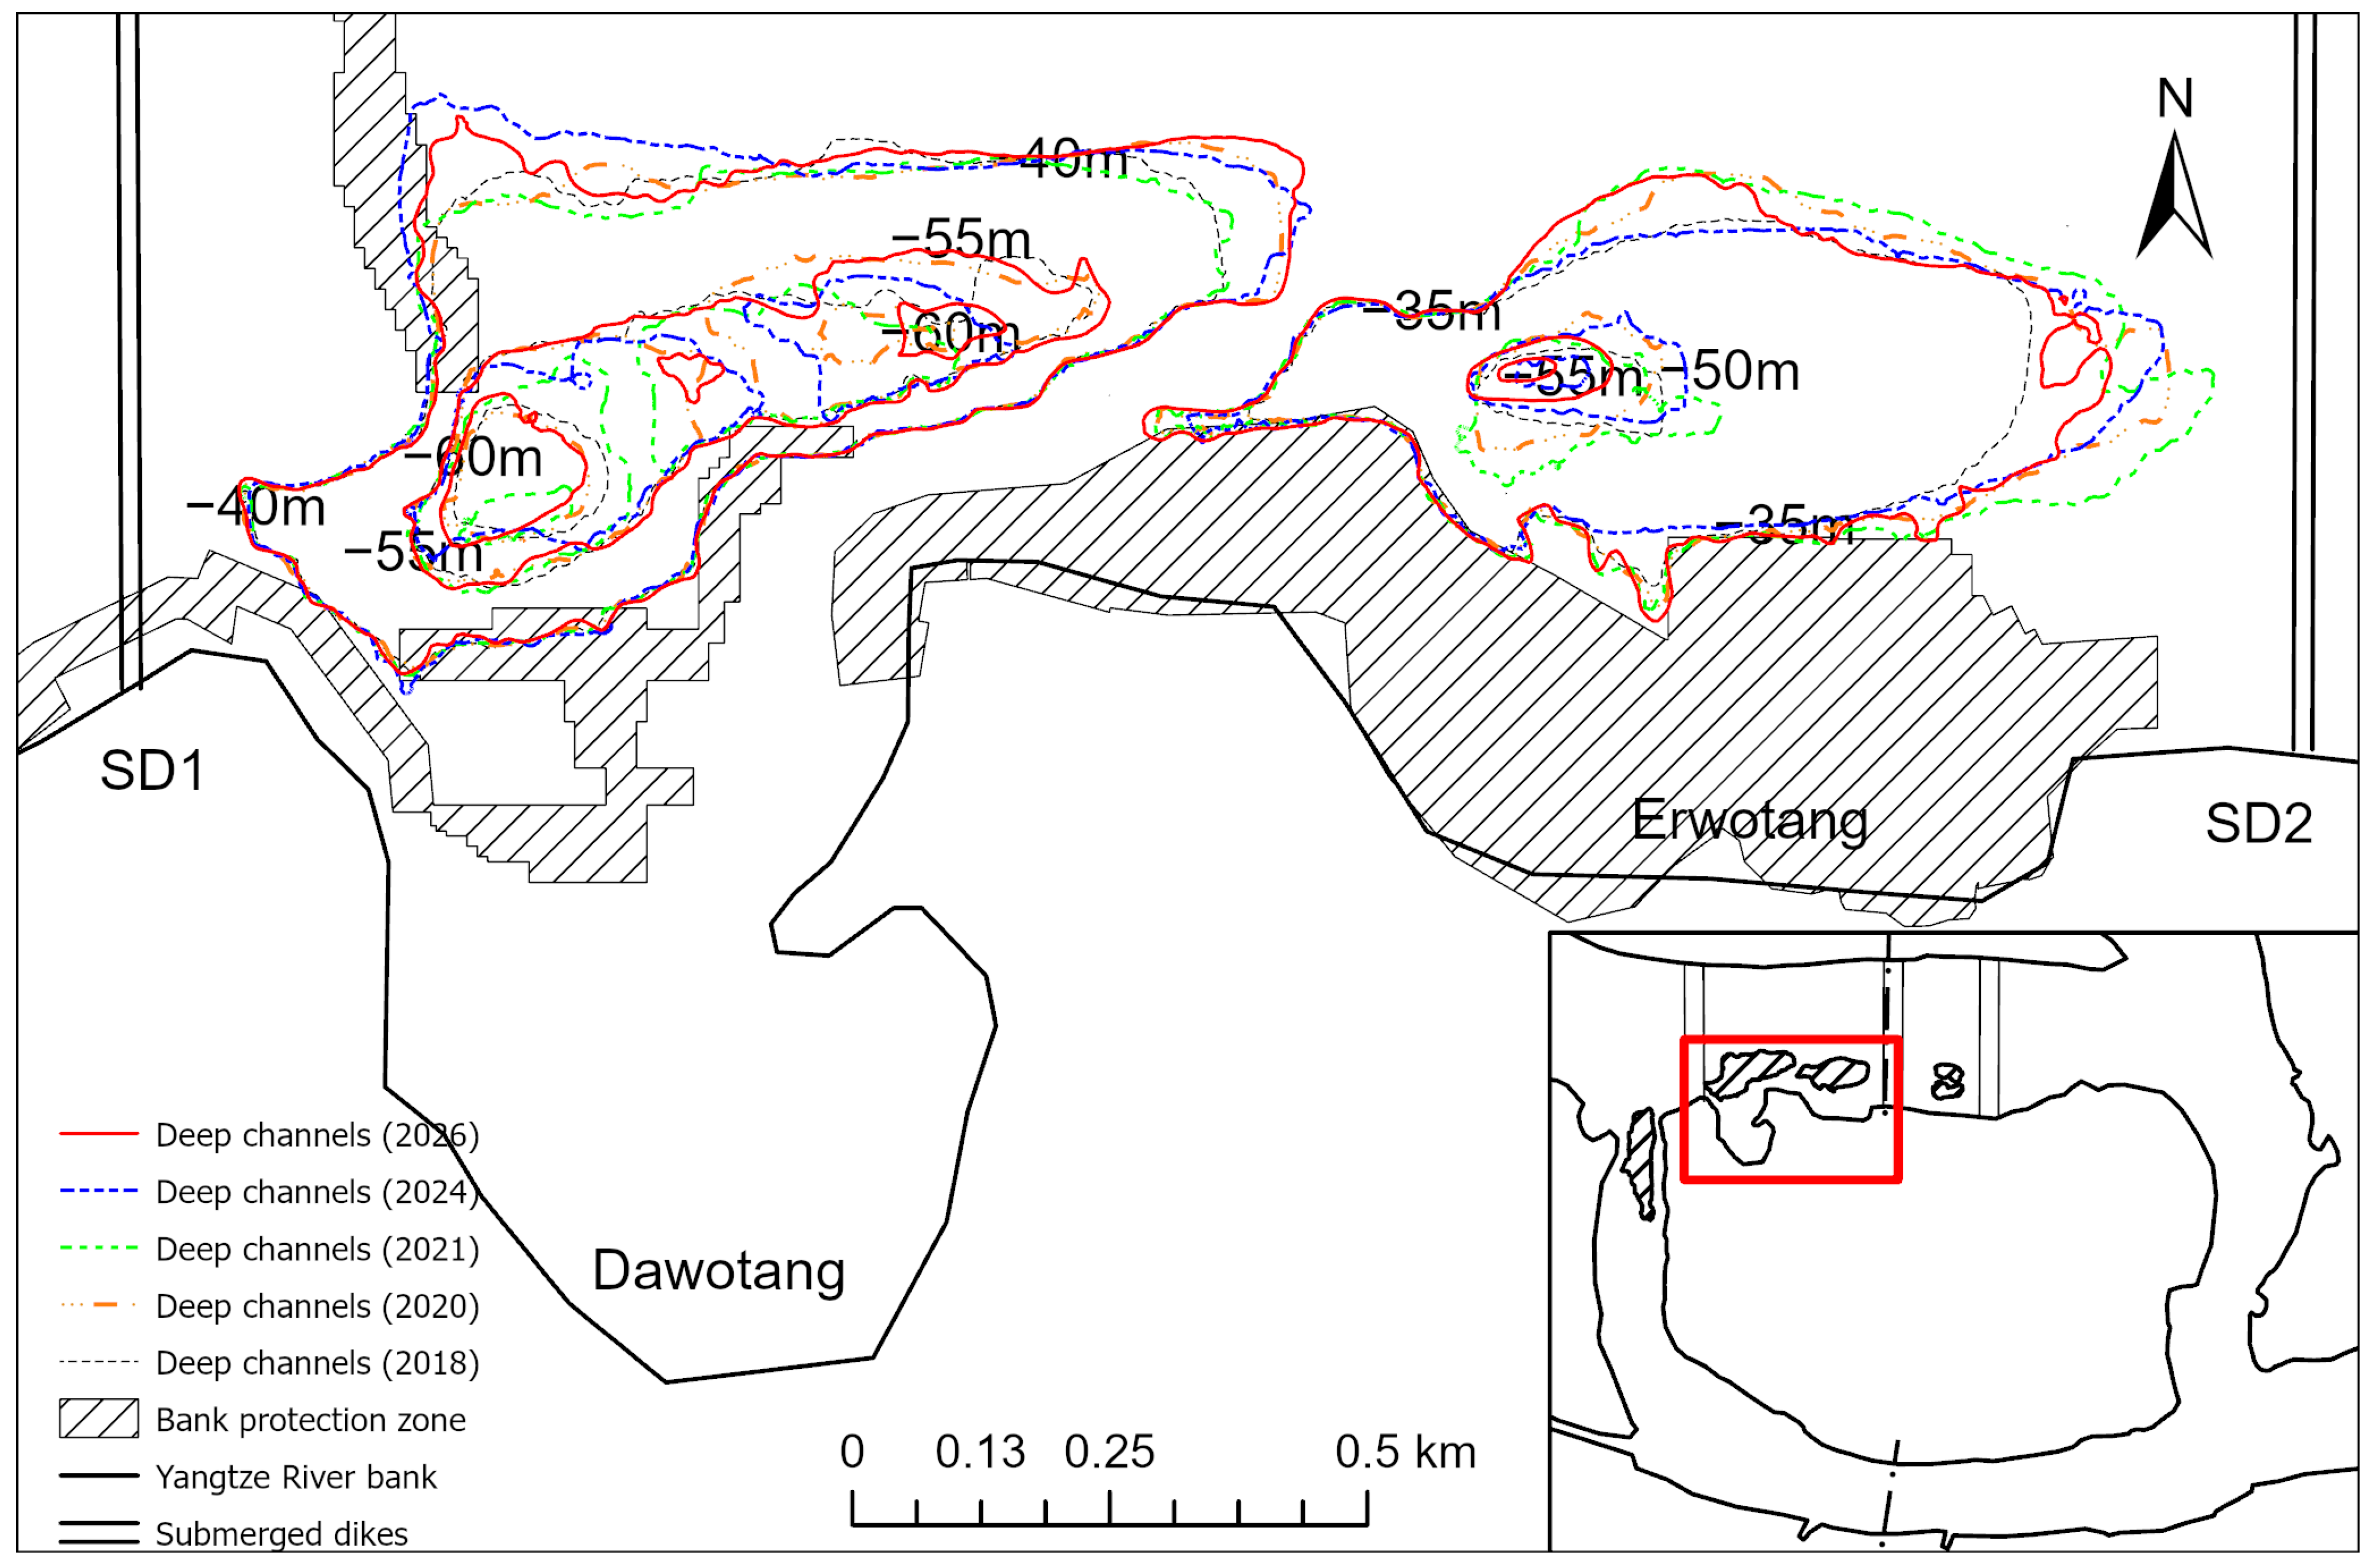
To address the issues of insufficient hydrodynamics and channel siltation in the right anabranch caused by the excessive development of the left anabranch, the water resource authorities implemented the Left Anabranch Inlet Control Project, namely Submerged Dike 1 (SD1), from 2002 to 2003. To further enhance the navigability of the deep-water channel, the transportation authorities carried out the Phase II Deepwater Channel Regulation Project from 2015 to 2017. This project involved the construction of two new submerged dikes, Submerged Dike 2 (SD2) and Submerged Dike 3 (SD3), downstream of the left anabranch inlet to optimize the flow division ratio and flow field structure. The locations of the three submerged dikes are shown in Figure 1, and the engineering parameters of these dikes are presented in Table 1.

2.2. Data and Methods

2.2.1. Data Sources

This study adopts three types of basic data for river morphological analysis, including multi-temporal bathymetric data, hydrological and flow division ratio data, and spatial datasets of bank protection. The overall data configuration supports the comprehensive analysis of spatiotemporal morphological evolution of the Hechangzhou anabranching reach. The detailed introduction of each dataset and corresponding technical specifications are presented as follows:
  • Bathymetric data
Multi-temporal bathymetric monitoring data of key river sections in the pre-flood seasons of 2018, 2020, 2021, 2024 and 2026 were selected to analyze the deep channel evolution of the Hechangzhou anabranches. The specific bathymetric data selection criteria are as follows:
(1)
All datasets were collected during low-water seasons, when the Yangtze River runoff and sediment transport remain stable at low levels, eliminating disturbances from seasonal hydrological fluctuations on topographic comparisons.
(2)
The 2018 dataset reflects the initial morphological condition after the completion of the three submerged dikes.
(3)
The datasets cover multiple hydrological regimes for morphological analysis: normal-flow, flood, post-flood recovery, and low-flow period. Normal-flow and low-flow periods are classified based on the percentage deviation of the preceding-year annual runoff from the multi-year average runoff from official hydrological and sediment bulletins. A deviation ranging from −10% to +10% is defined as the normal-flow period. The preceding-year annual runoff for 2018 and 2020 exhibited a −5% negative deviation from the multi-year average, falling within this normal-flow range. Deviations below −10% represent low-flow conditions; the preceding-year annual runoff for 2024 and 2026 showed negative deviations exceeding −15%. Unlike the above statistical thresholds, the 2020–2021 interval is defined as the flood period. This interval corresponds to the well-recognized catastrophic basin-wide flood of 2020, which represented the severest flood event since 1998. The low-water bathymetric dataset of 2021 was used to capture post-flood morphological responses. The 2021–2024 interval denotes the post-flood recovery period for riverbed adjustment following this extreme flood disturbance.
These multi-temporal bathymetric datasets were provided by co-author Jinping Ling. His institution carried out the official routine monitoring project for key river reaches of the Yangtze River (Jiangsu reach). Field bathymetric acquisition, tidal- and-water-level correction, datum unification and primary data quality control were performed by the institutional project team as part of routine monitoring, not as dedicated fieldwork conducted for the present study. The project specifies a full-coverage bathymetric survey scale of 1:2000, and the multibeam system configuration and data-processing workflow follow the requirements specified in Chinese national standard GB/T 42640-2023 [32] for multibeam echosounder surveys, while fixed-cross-section monitoring adopted a scale of 1:5000. All bathymetric datasets adopt the China Geodetic Coordinate System 2000 (CGCS2000) and the 1985 National Elevation Datum.
Field surveys were carried out using the Teledyne Reson SeaBat T50-P multibeam echosounder system (Teledyne Reson, Slangerup, Denmark), coupled with an iXblue Octans fiber-optic gyrocompass (motion-reference unit, iXblue, Saint‑Germain‑en‑Laye, France), GNSS-RTK positioning, and an AML-3 SVP sound-velocity profiler (AML Oceanographic, Victoria, BC, Canada) for in situ sound-speed correction. This integrated system meets the instrument-level accuracy requirements for 1:2000-scale inland-river bathymetric mapping specified in GB/T 42640-2023. Within the monitoring project, real-time water-level observations from adjacent hydrological stations were used to convert instantaneous depth measurements to the 1985 National Elevation Datum.
The raw input provided for this study consists of pre-processed multibeam bathymetric points decimated to a 16 m × 24 m grid. Potential uncertainties originate from field sounding observation, attitude-sensor error, sound-velocity correction error, water-level correction, and point decimation. Additional processing uncertainty will be introduced during spatial interpolation (see Section 2.2.2). Collectively, the composite vertical uncertainty of the final derived bathymetric raster dataset is estimated to be approximately ±0.5 m. It should be noted that although GB/T 42640-2023 specifies allowable horizontal error limits for 1:2000-scale bathymetric surveys, the delivered dataset lacks quantitative horizontal-positioning-accuracy statistics. Thus, no numerical horizontal-accuracy estimate can be provided. Nevertheless, potential horizontal point deviations are small relative to our 16 m × 24 m grid and reach-scale geomorphic features. Since our analysis focuses on vertical scour-deposition magnitudes and long-term morphological trends rather than precise horizontal boundary delineation, such deviations have negligible influence on the core results.
2.
Hydrological and flow division ratio data
The flow division ratio sequence data in this study integrates official monitoring data and historical literature records from 2002 to 2025, which is applied to analyze the long-term evolutionary characteristics of the anabranch division pattern in the study reach.
Corresponding runoff volume and sediment load data were derived from the Yangtze River Sediment Bulletin, with detailed information listed in Table 2. Additionally, the monthly runoff volume and sediment load monitoring data for March 2026 have not yet been released, and thus these two indicators are marked as “/” in Table 2.
3.
Bank protection dataset
This study established a spatial dataset of bank protection in the Hechangzhou anabranching reach from 2012 to 2026, covering reinforcement and maintenance work during the study period. According to official monitoring records, no dredging or other engineering activities occurred within the study subzones during the research period.

2.2.2. Analytical Methods

To systematically characterize the riverbed evolution, this study establishes a multi-dimensional analytical framework:
(1)
Long-term evolution of the flow division ratio in the anabranches: The historical literature is integrated with recent project monitoring data to identify long-term evolutionary trends.
(2)
Morphological evolution of the deep channel: Based on multi-temporal bathymetric monitoring data, bathymetric contours were generated at a fixed 5 m elevation interval for each phase, and the closed contour areas were uniformly defined as deep channel regions. To facilitate morphological analysis and visual presentation, only the outermost shallowest contour and the innermost deepest contour of each independent deep channel were retained to simplify the morphological expression of deep channels. The outer boundary and the deepest contour line of the riverbed deep channel in 2018 were selected as the initial reference benchmark, based on which the altered deep channel areas in 2020, 2021, 2024 and 2026 relative to this baseline were delineated. Through overlay analysis of the deep channels across the five periods, the dynamic evolutionary characteristics—including longitudinal extension length, lateral migration distance, and maximum depth—were quantitatively analyzed. The differences in absolute elevation of outer deep-channel contours at different sites are natural topographic variations in the anabranching reach, rather than artificially adjusted thresholds. All deep channels were extracted under a unified 5 m contour interval rule and compared against the 2018 baseline, ensuring reproducible and consistent identification criteria.
(3)
Scour and deposition analysis of deep channels: The extents of the deep channels extracted from five topographic datasets between 2018 and 2026 were merged to obtain the union polygon, which marks the outermost boundary of deep channel development during the study period. This unified boundary was adopted as the analysis domain. Prior to scour-deposition calculation, the delivered 16 m × 24 m discrete bathymetric points from each multi-temporal survey were interpolated into regular 5 m raster grids using the Kriging geostatistical interpolation method. These standardized raster datasets were then applied for raster difference calculation to derive bed-elevation change ∆z (Equation (1)).
Given the estimated composite vertical uncertainty of approximately ±0.5 m for the final raster dataset, bed-elevation changes ranging from −0.5 m to +0.5 m are defined as negligible bed variation. Raster-difference outputs were used to generate scour-deposition raster maps for each interval:
z i , j = z t 2 i , j z t 1 ( i , j )
where z i , j denotes the bed elevation change in a grid cell i , j ; z t 2 i , j is the bed elevation at the later stage; and z t 1 ( i , j ) is the bed elevation at the earlier stage. Positive values of z i , j represent deposition, while negative values indicate scour.
Spatial distribution maps of scour and deposition within the deep channels for each period were produced based on the difference results. The total scour volume and total deposition volume were statistically calculated, and the net scour−deposition volume within the domain was determined as
V n e t = V d e p V s c o u r
where V n e t is the net scour-deposition volume of the deep channel; V d e p is the total deposition volume; and V s c o u r is the total scour volume. V n e t > 0 represents net deposition, and V n e t < 0 denotes net scour. In addition to calculating net scour-deposition volume for each hydrological period, the average scour-deposition rate (m3 yr−1) was calculated by dividing the net scour-deposition volume by the time span of the corresponding survey interval. This metric characterizes the annual-scale geomorphic adjustment intensity for each individual period.
Taking the total area enclosed by the maximum deep channels boundary as the reference benchmark, the scour area ratio and deposition area ratio were calculated using the following equations:
R s c o u r = A s c o u r A t o t a l
R d e p = A d e p A t o t a l
where R s c o u r is the scour area ratio; A s c o u r is the scour area; R d e p is the deposition area ratio; A d e p is the deposition area; and A t o t a l is the total area within the maximum boundary derived from the union of multi-period deep channel extents.
The scour and deposition areas were quantified jointly with volumetric indicators to reveal the overall evolutionary trend of scour and deposition in the deep channel. Four intervals, namely 2018–2020, 2020–2021, 2021–2024 and 2024–2026, were selected for comparative analysis. These intervals correspond, respectively, to a normal-flow period after project completion, a flood period characterized by catastrophic basin-wide flood events, a post-flood recovery period and a low-flow period, so as to identify the erosion-deposition evolution characteristics of deep channels under varying hydrological regimes.
It should be noted that bathymetric survey noise, interpolation artefacts and vertical measurement uncertainty (composite vertical uncertainty of approximately ±0.5 m for raster datasets) can propagate to scour-deposition calculations. Nevertheless, residual uncertainties may still influence the computed scour-deposition volumes: small-magnitude volume values are more susceptible to measurement noise. For planimetric metrics such as deep-channel migration distance, positional errors of multibeam points and interpolation may bring minor offsets to the extracted deep-channel boundaries, while the large-scale migration trends identified in this study remain robust against such uncertainties.
(4)
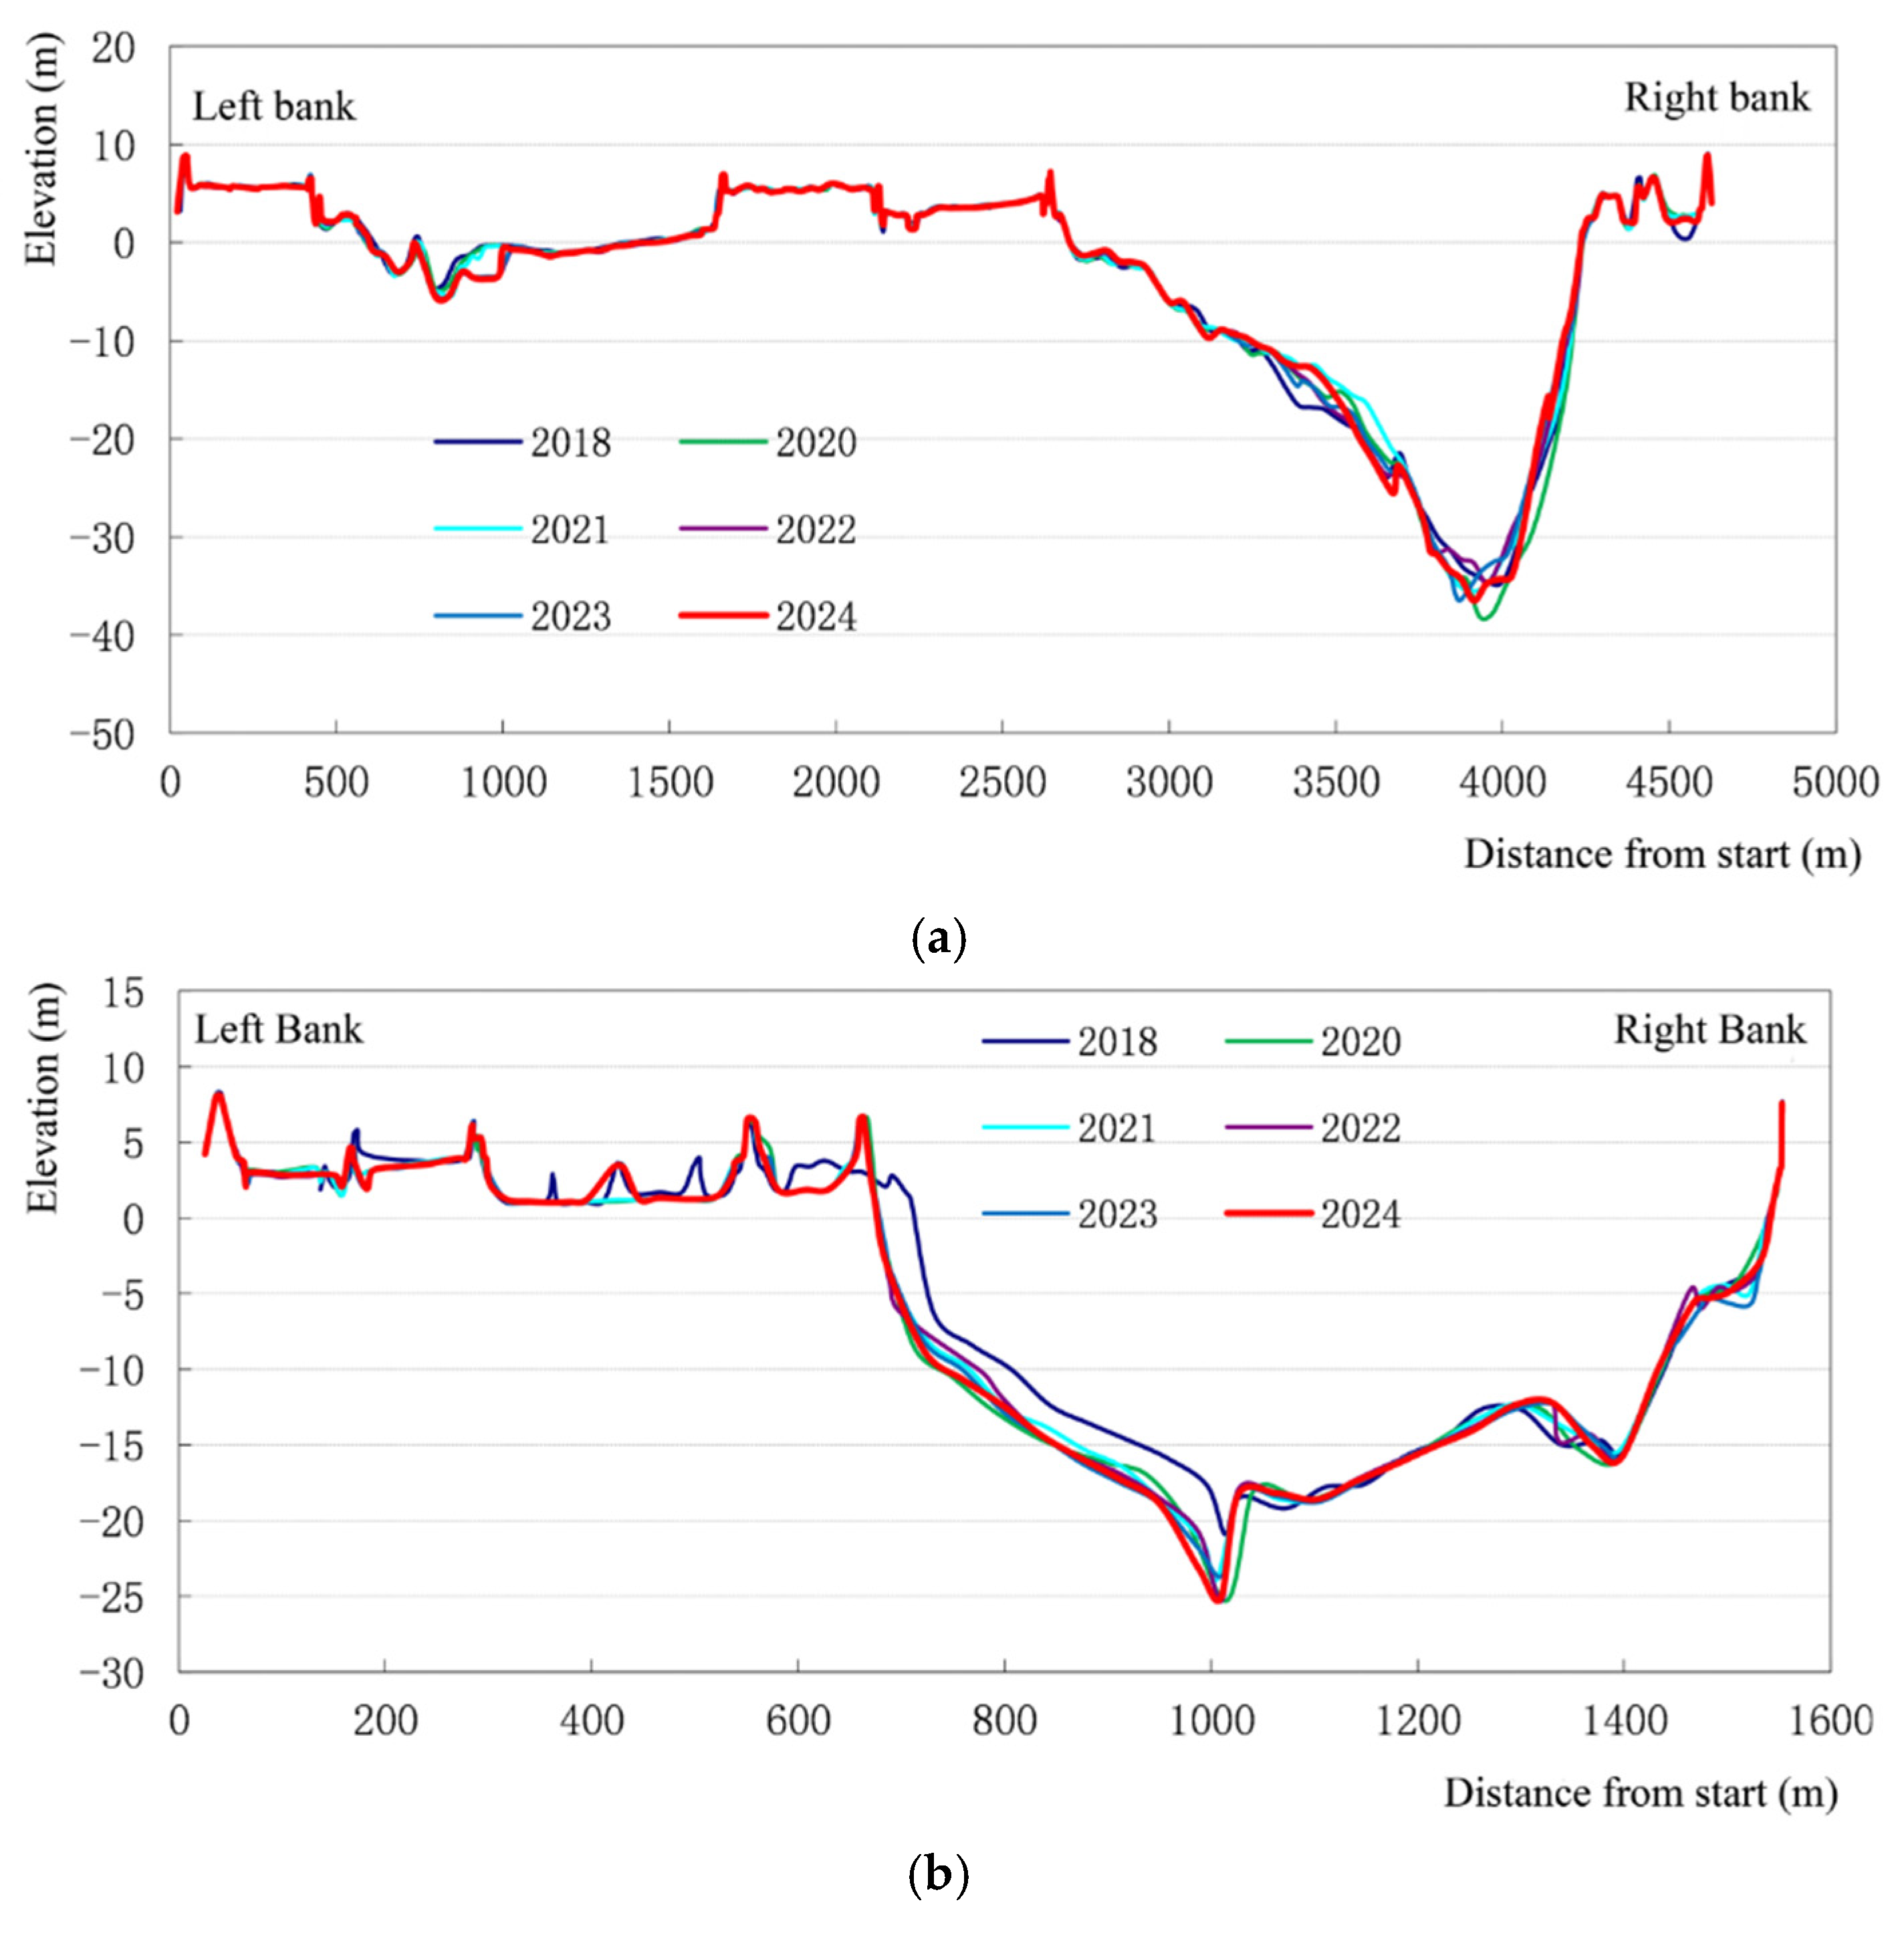
Analysis of cross-sectional variation: One fixed cross-section was established in each of the left and right anabranches of Hechangzhou. Based on six phases of surveyed data from 2018 to 2024, the morphological evolution of these cross-sections was analyzed. The adjustment trends of riverbed scour and deposition were clarified through variations in depth, sedimentation amplitude, and flow cross-sectional area.
The above analyses were conducted using ArcGIS Pro 3.1 (Esri, Redlands, CA, USA) and CARIS HIPS‑SIPS 11.4 (Teledyne CARIS, Fredericton, NB, Canada), ensuring the accuracy and reliability of data processing.

3. Results

3.1. Variations in the Flow Division Ratio of the Hechangzhou Anabranching Reach

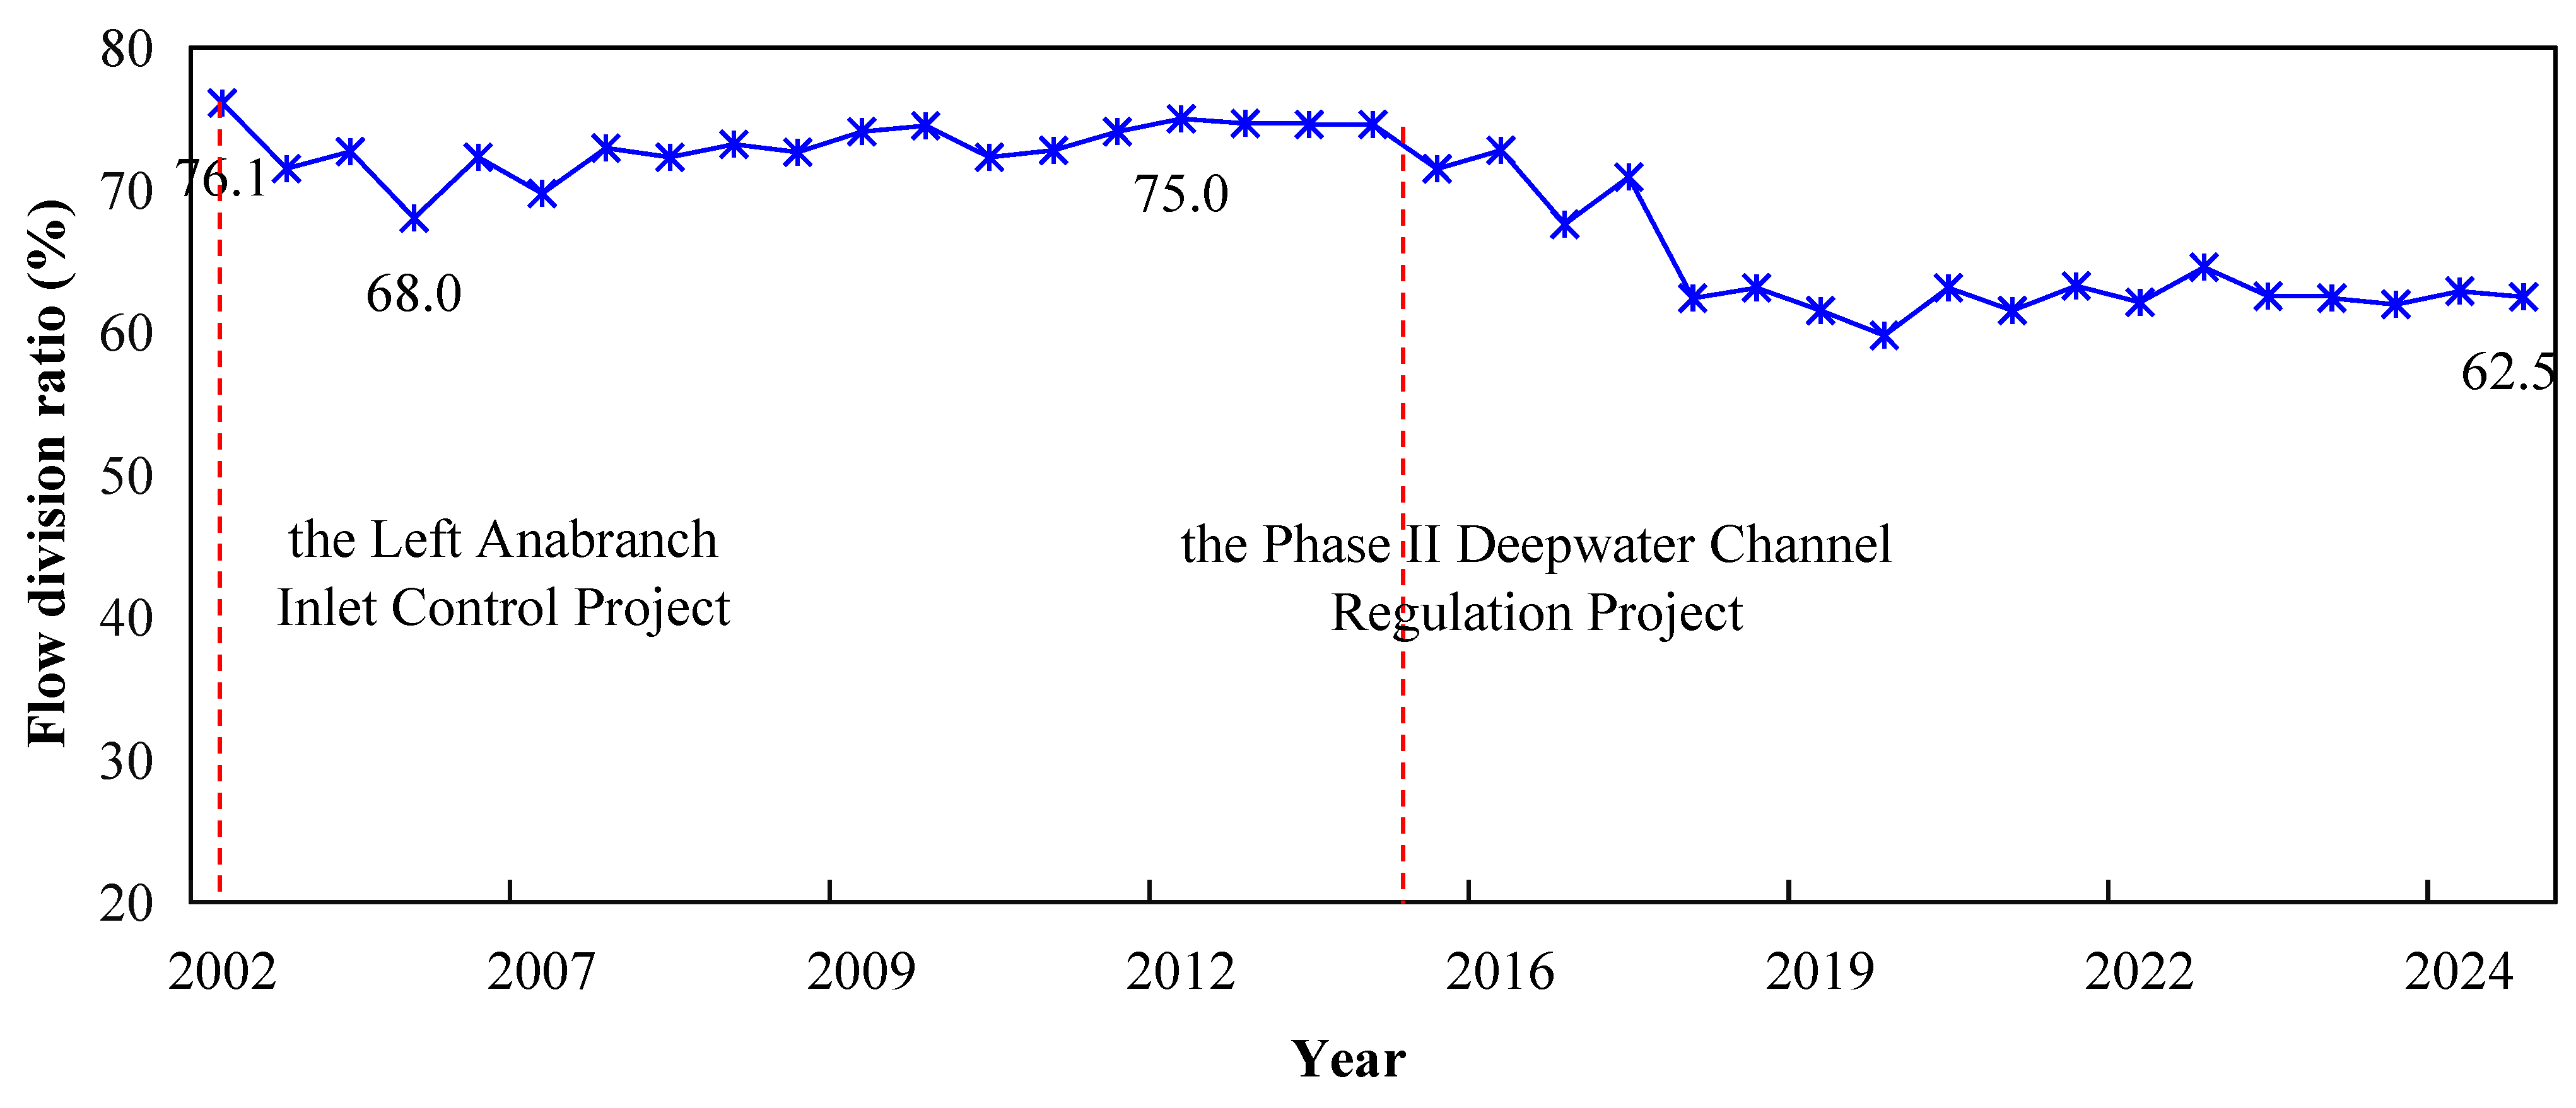
Based on long-term hydrological observations, the evolution of the Hechangzhou Anabranching Reach exhibits distinct characteristics (see Figure 2), which can be divided into historical and recent stages.
(1)
Historical Evolution (1950s–2002). The flow division ratio of the left anabranch increased continuously from 32% in 1952 to 56% in 1961 [27,33], followed by a decline to 27% from 1962 to the mid-1970s. After 1974, the left anabranch flow division ratio entered a phase of sustained long-term growth, rising progressively from 34.9% in 1974 to 75.5% in 2002 [30], during which it again exceeded 50% in 1986. Subsequently, the SD1 implemented in 2002 initially curbed the rapid rise in the flow division ratio.
(2)
Recent Evolution (2002–2025). Since the early 2000s, the left anabranch flow division ratio has undergone a transition from high-level fluctuation to significant reduction, with markedly different regulatory effects observed at the two major engineering nodes. In the initial stage following the implementation of SD1, the flow division ratio briefly decreased from 76.1% in 2002 to 68% in 2005, but then recovered gradually and remained within a high range of 70–75% from 2006 to 2016. However, following the implementation of SD2 and SD3 from 2015 to 2017, the left anabranch flow division ratio terminated more than a decade of high-level fluctuation and shifted to a significant downward trend. It dropped to 59.8% in 2020 and stabilized at 62.5% in 2025. The average flow division ratio has been 62.3% since 2017.

3.2. Evolution Characteristics of Key Deep Channels

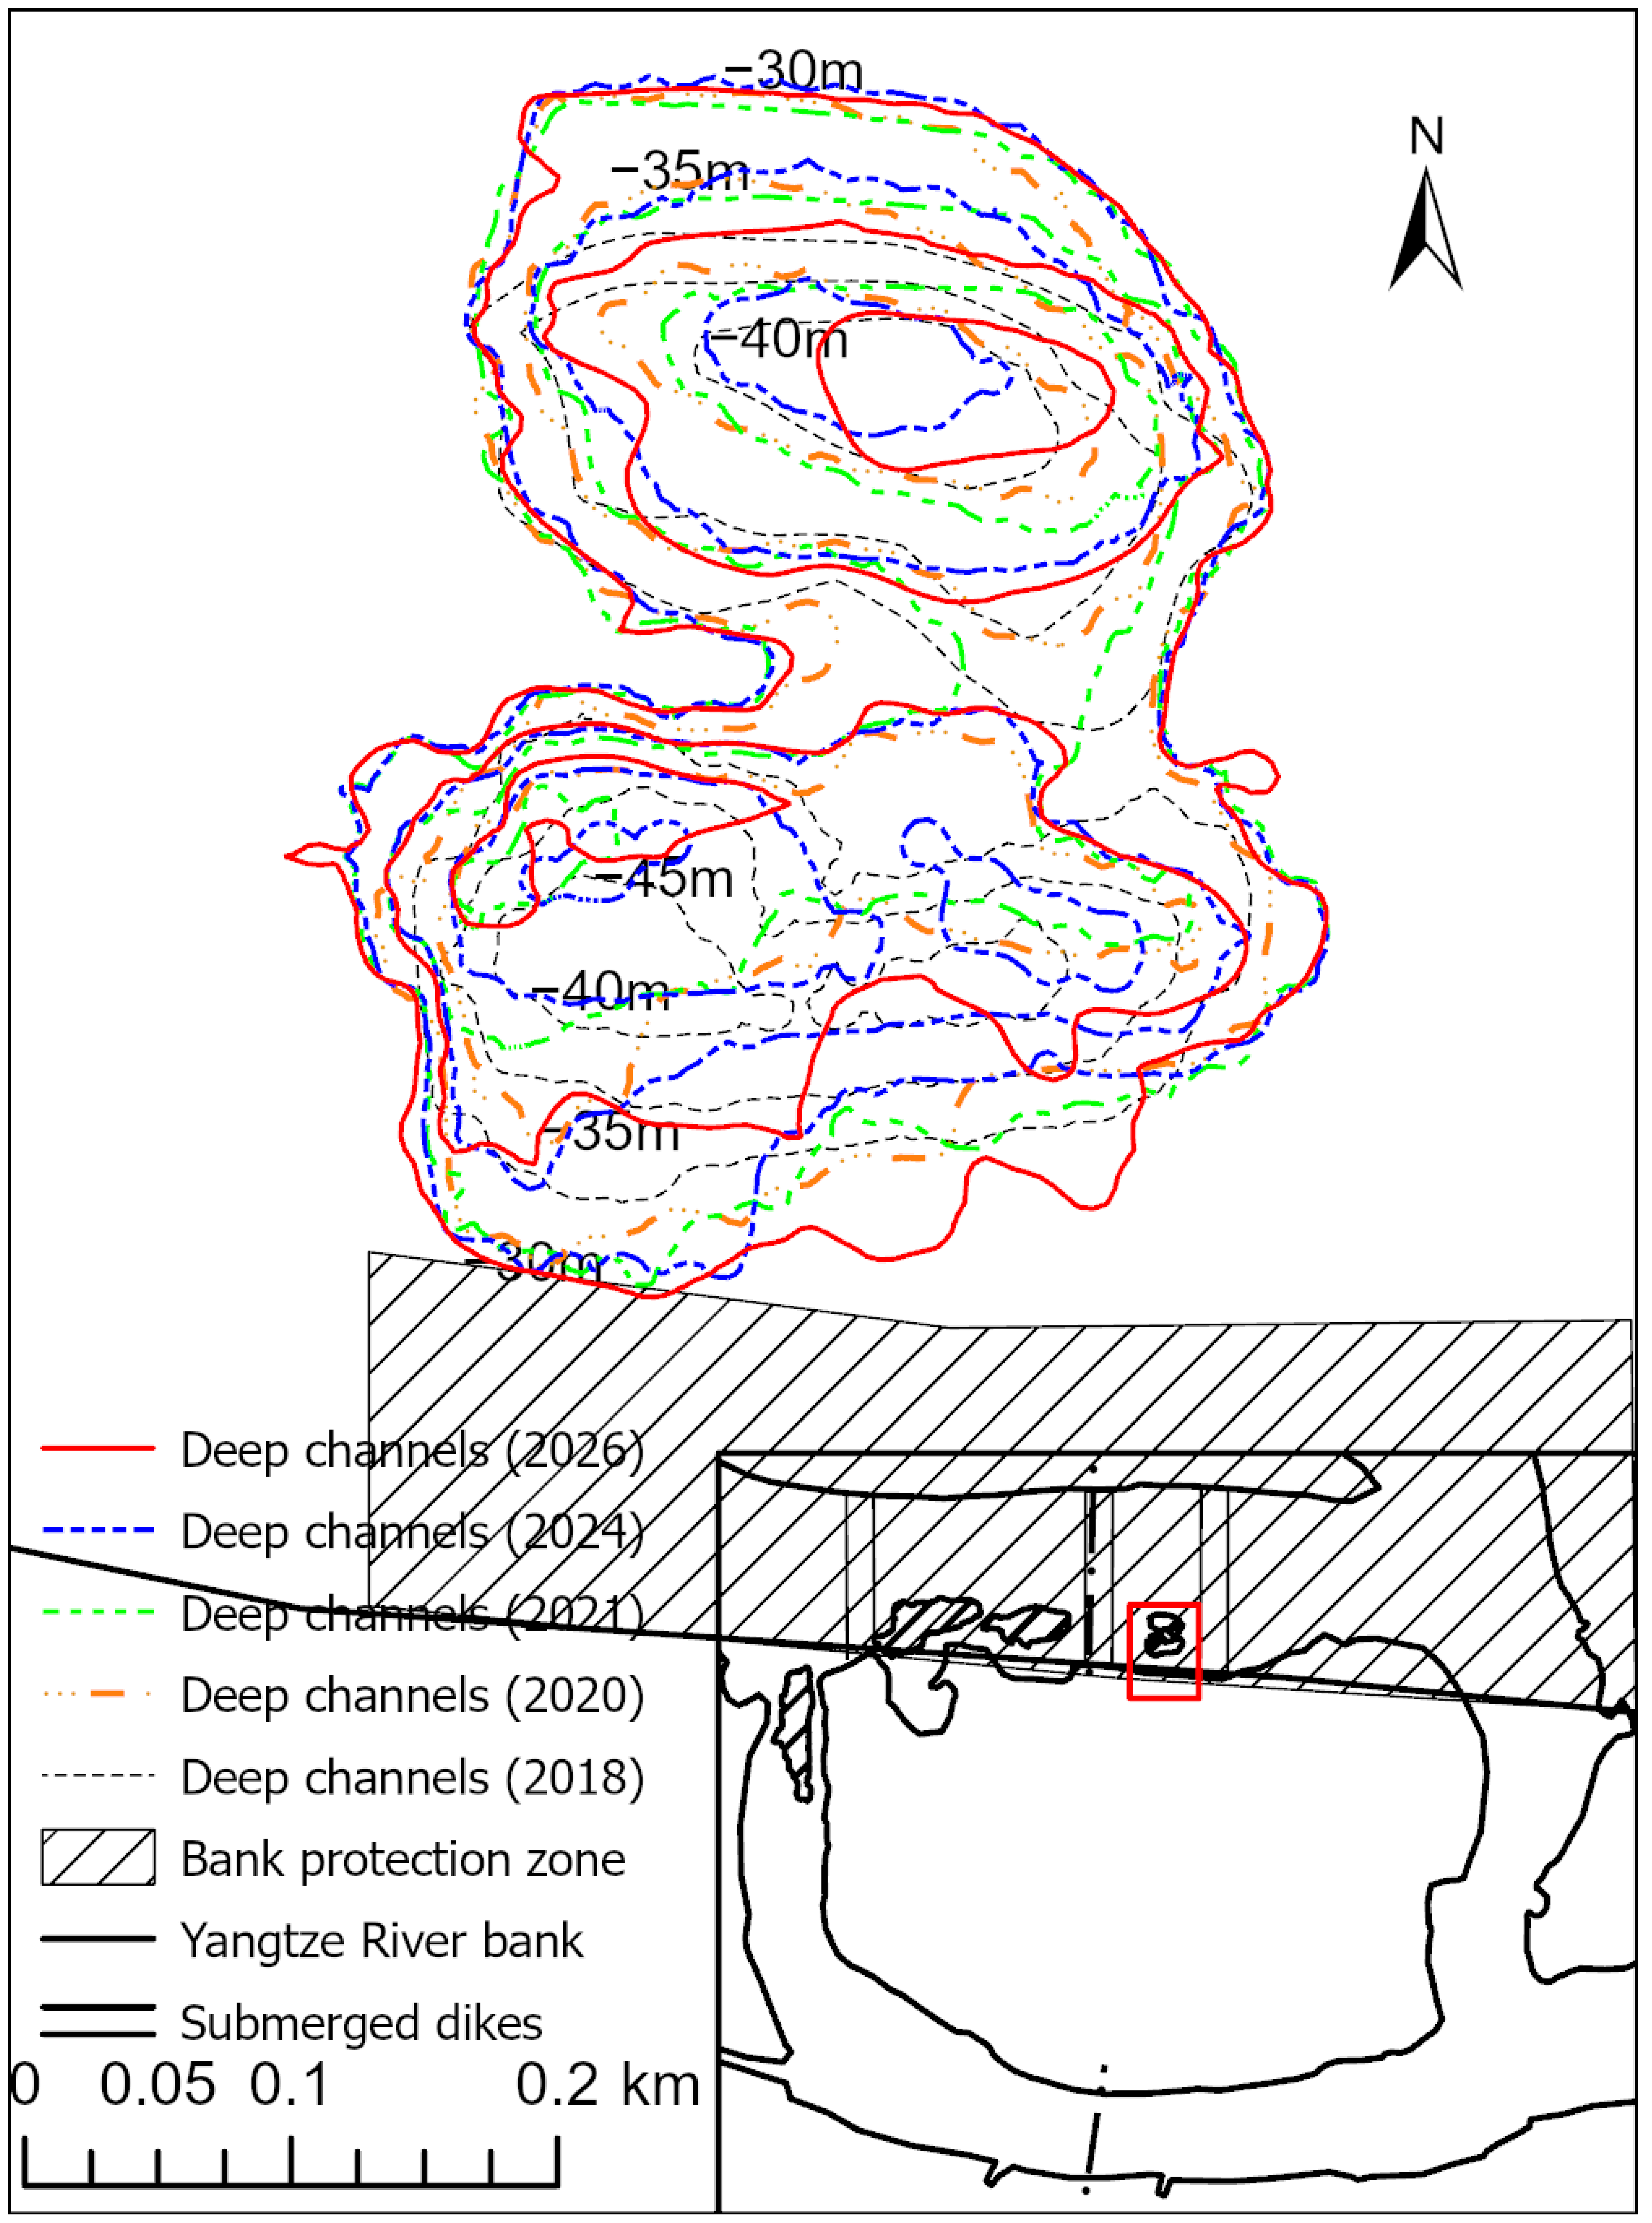
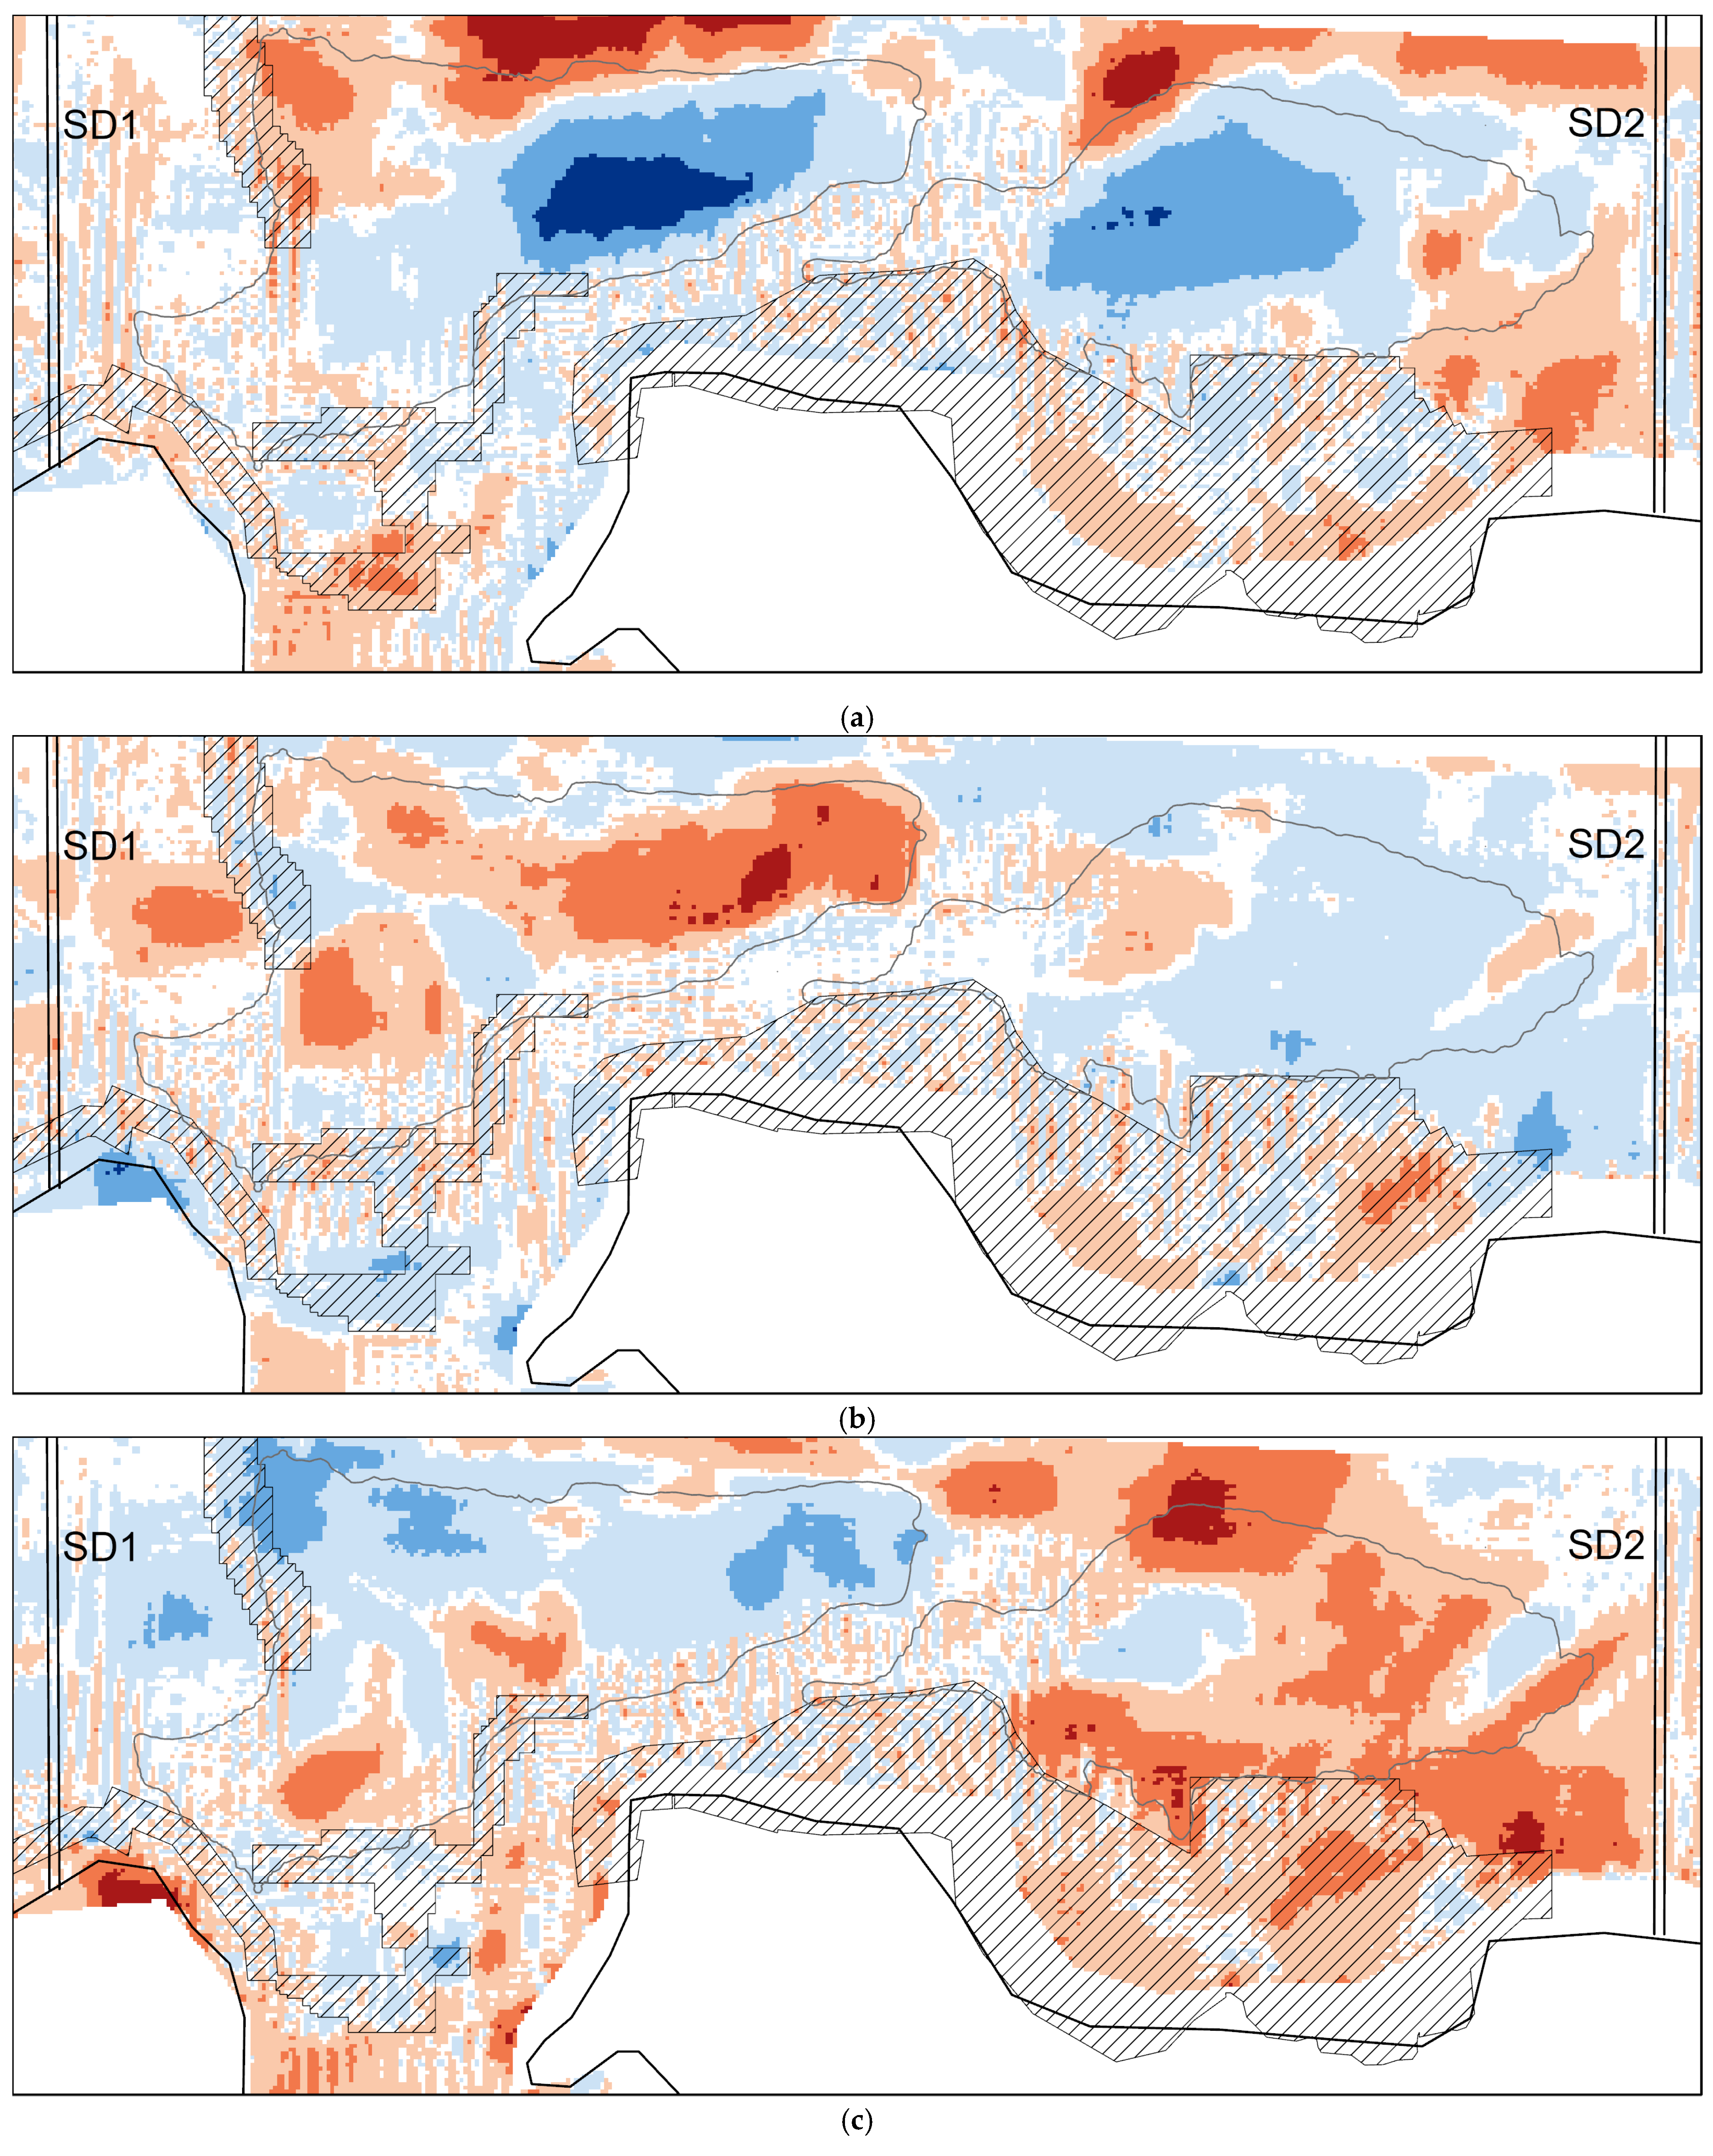
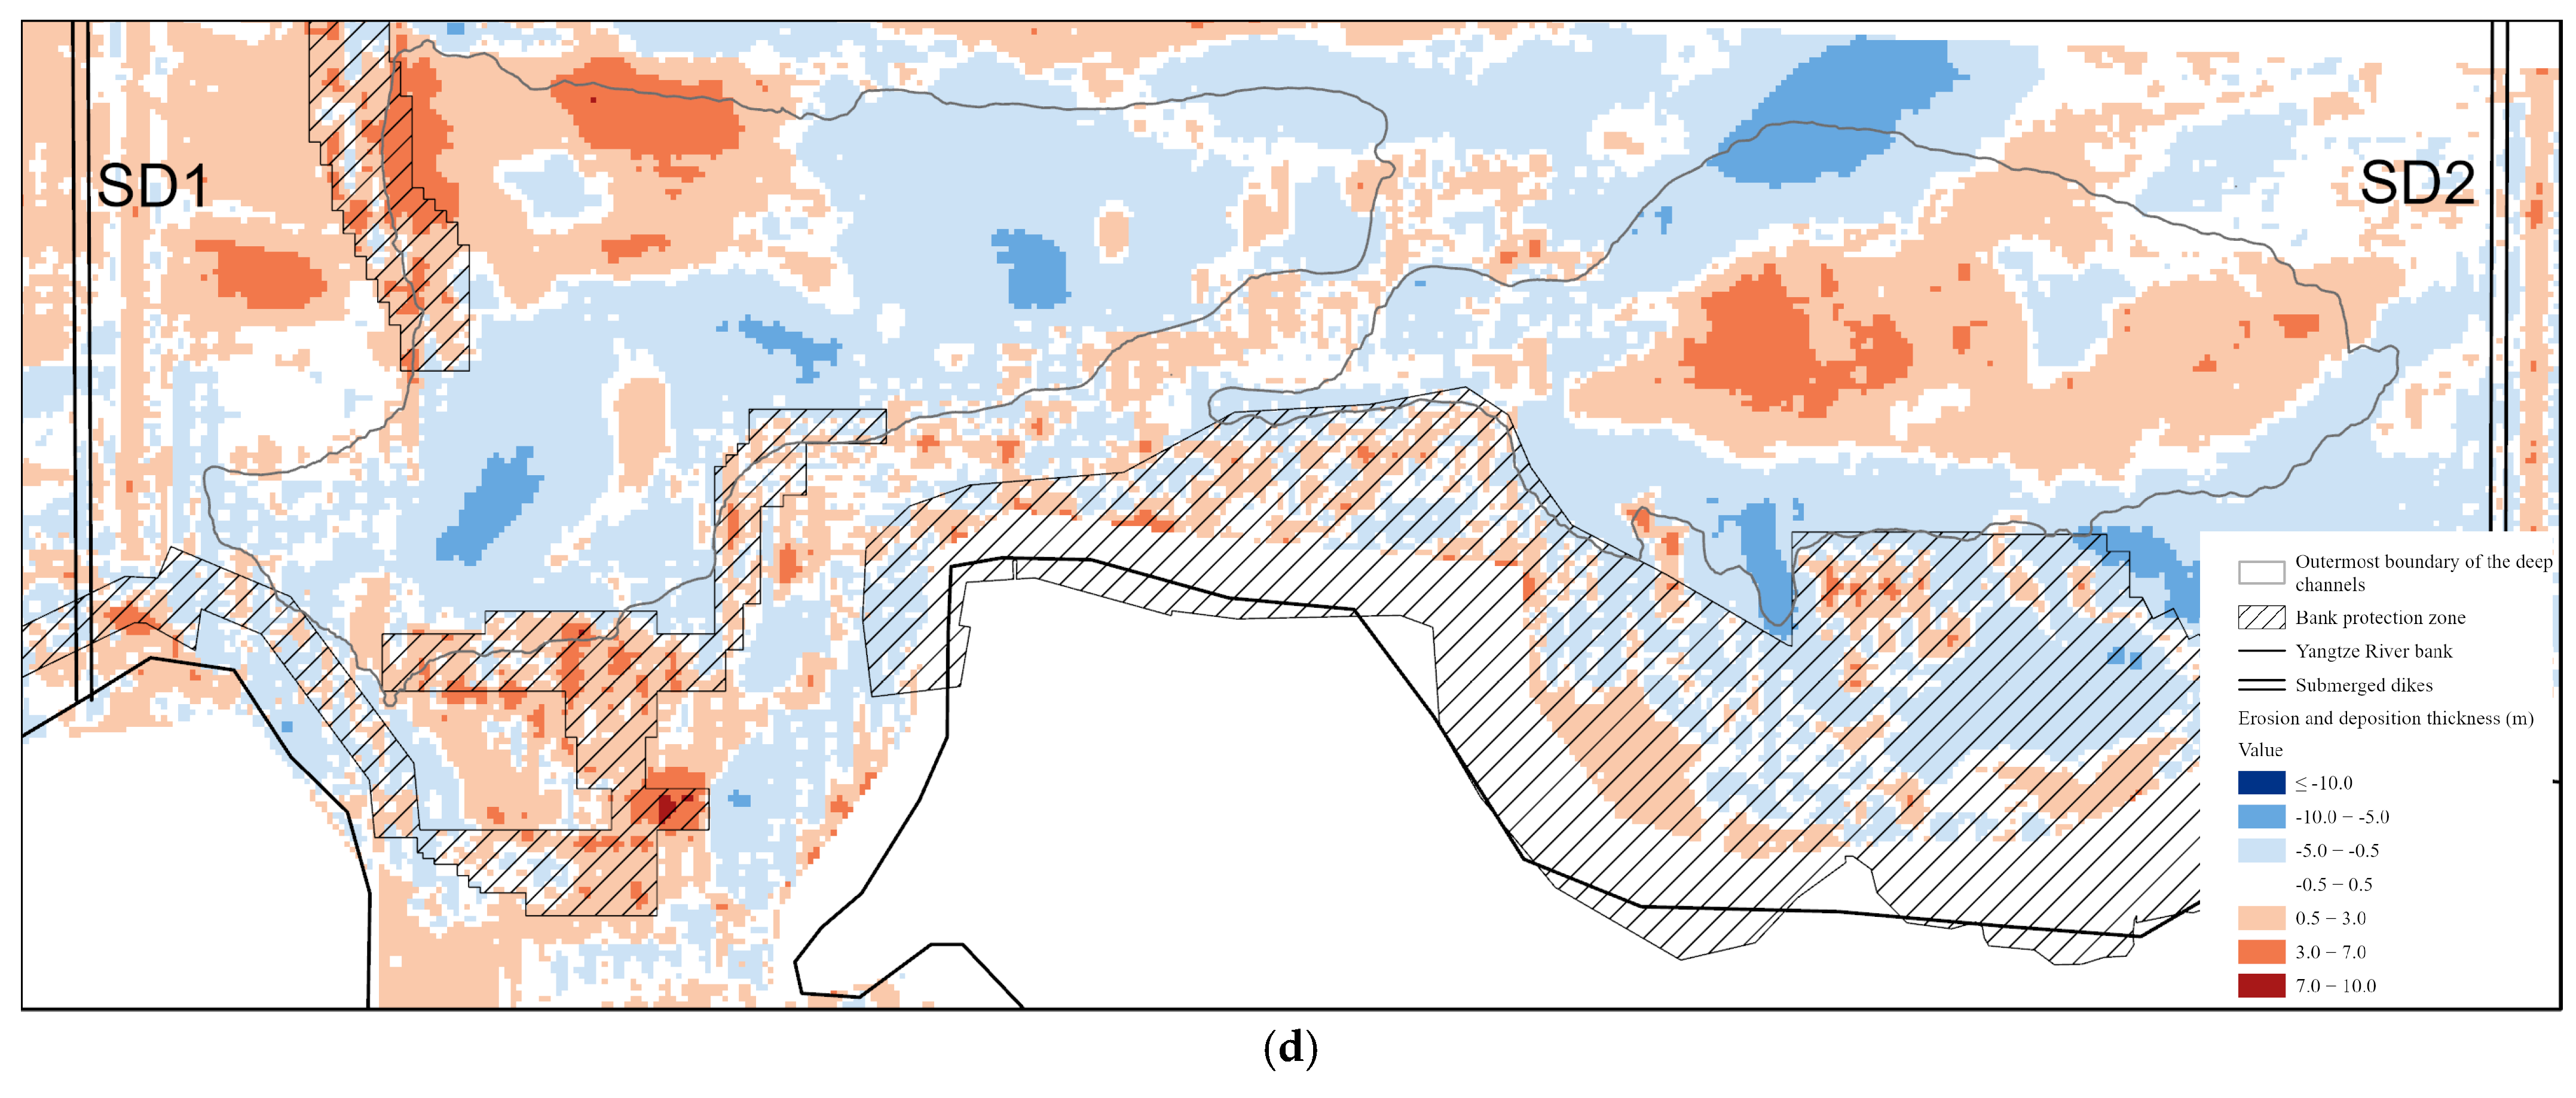
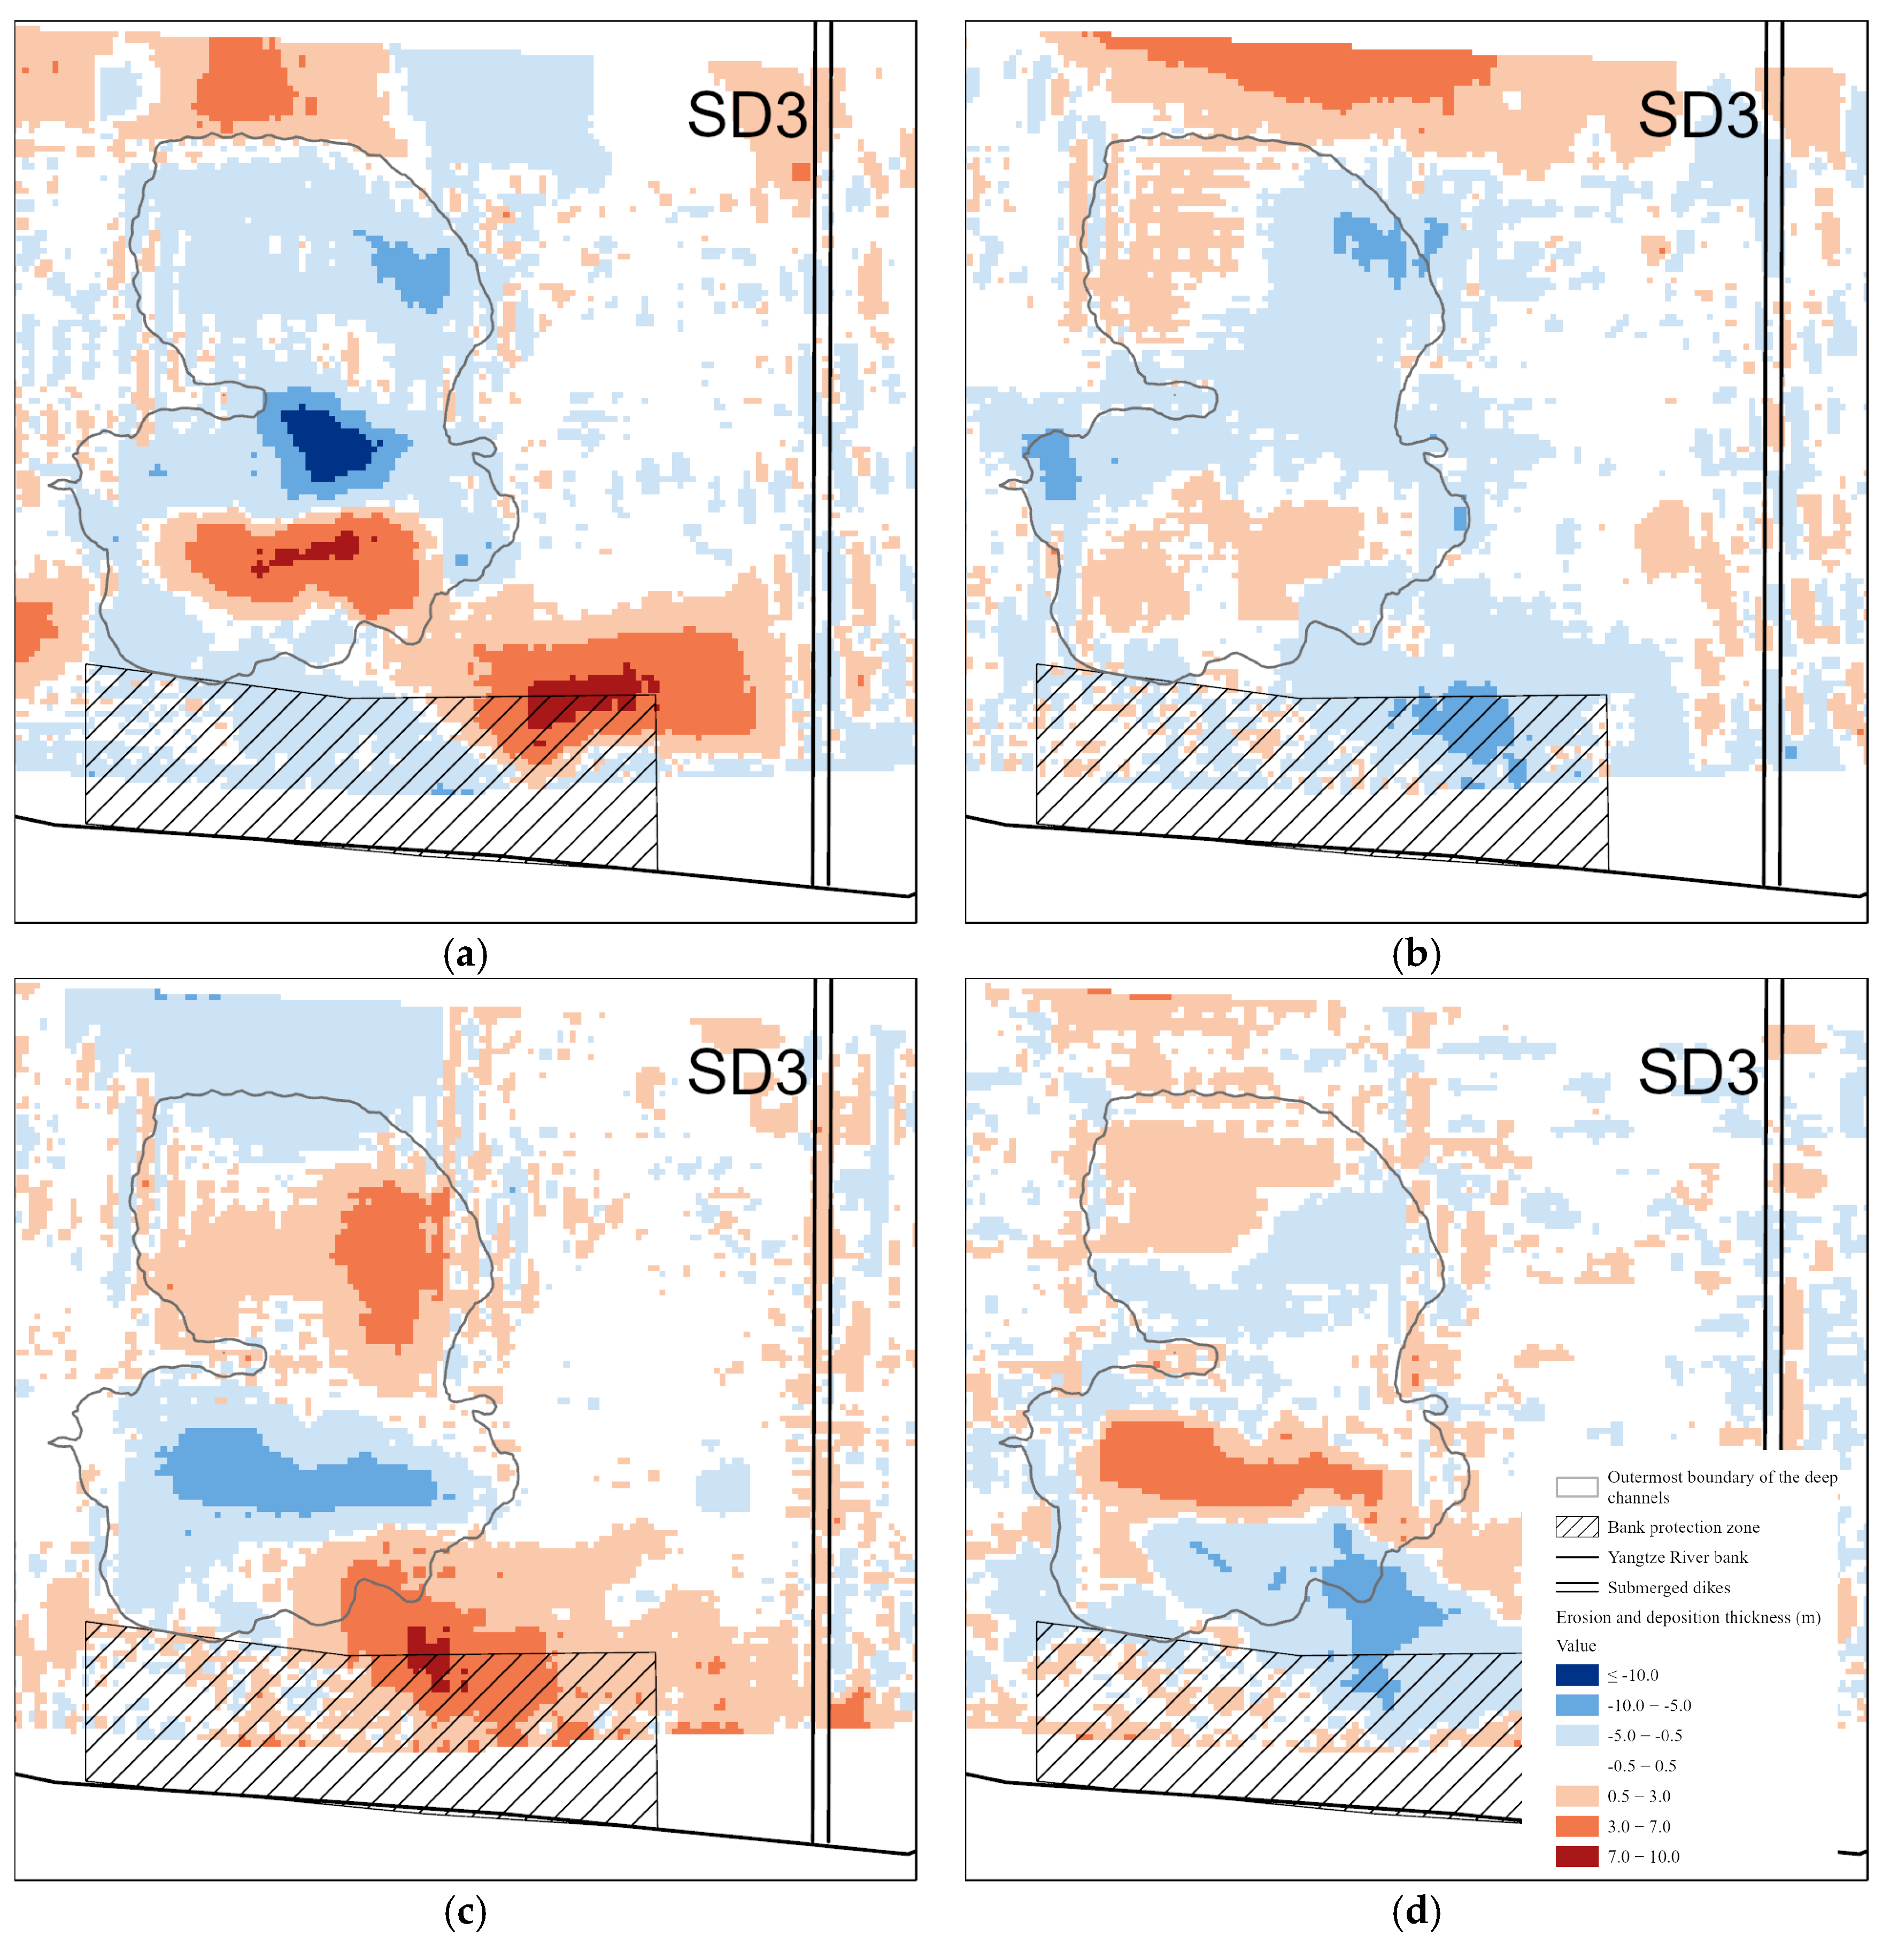
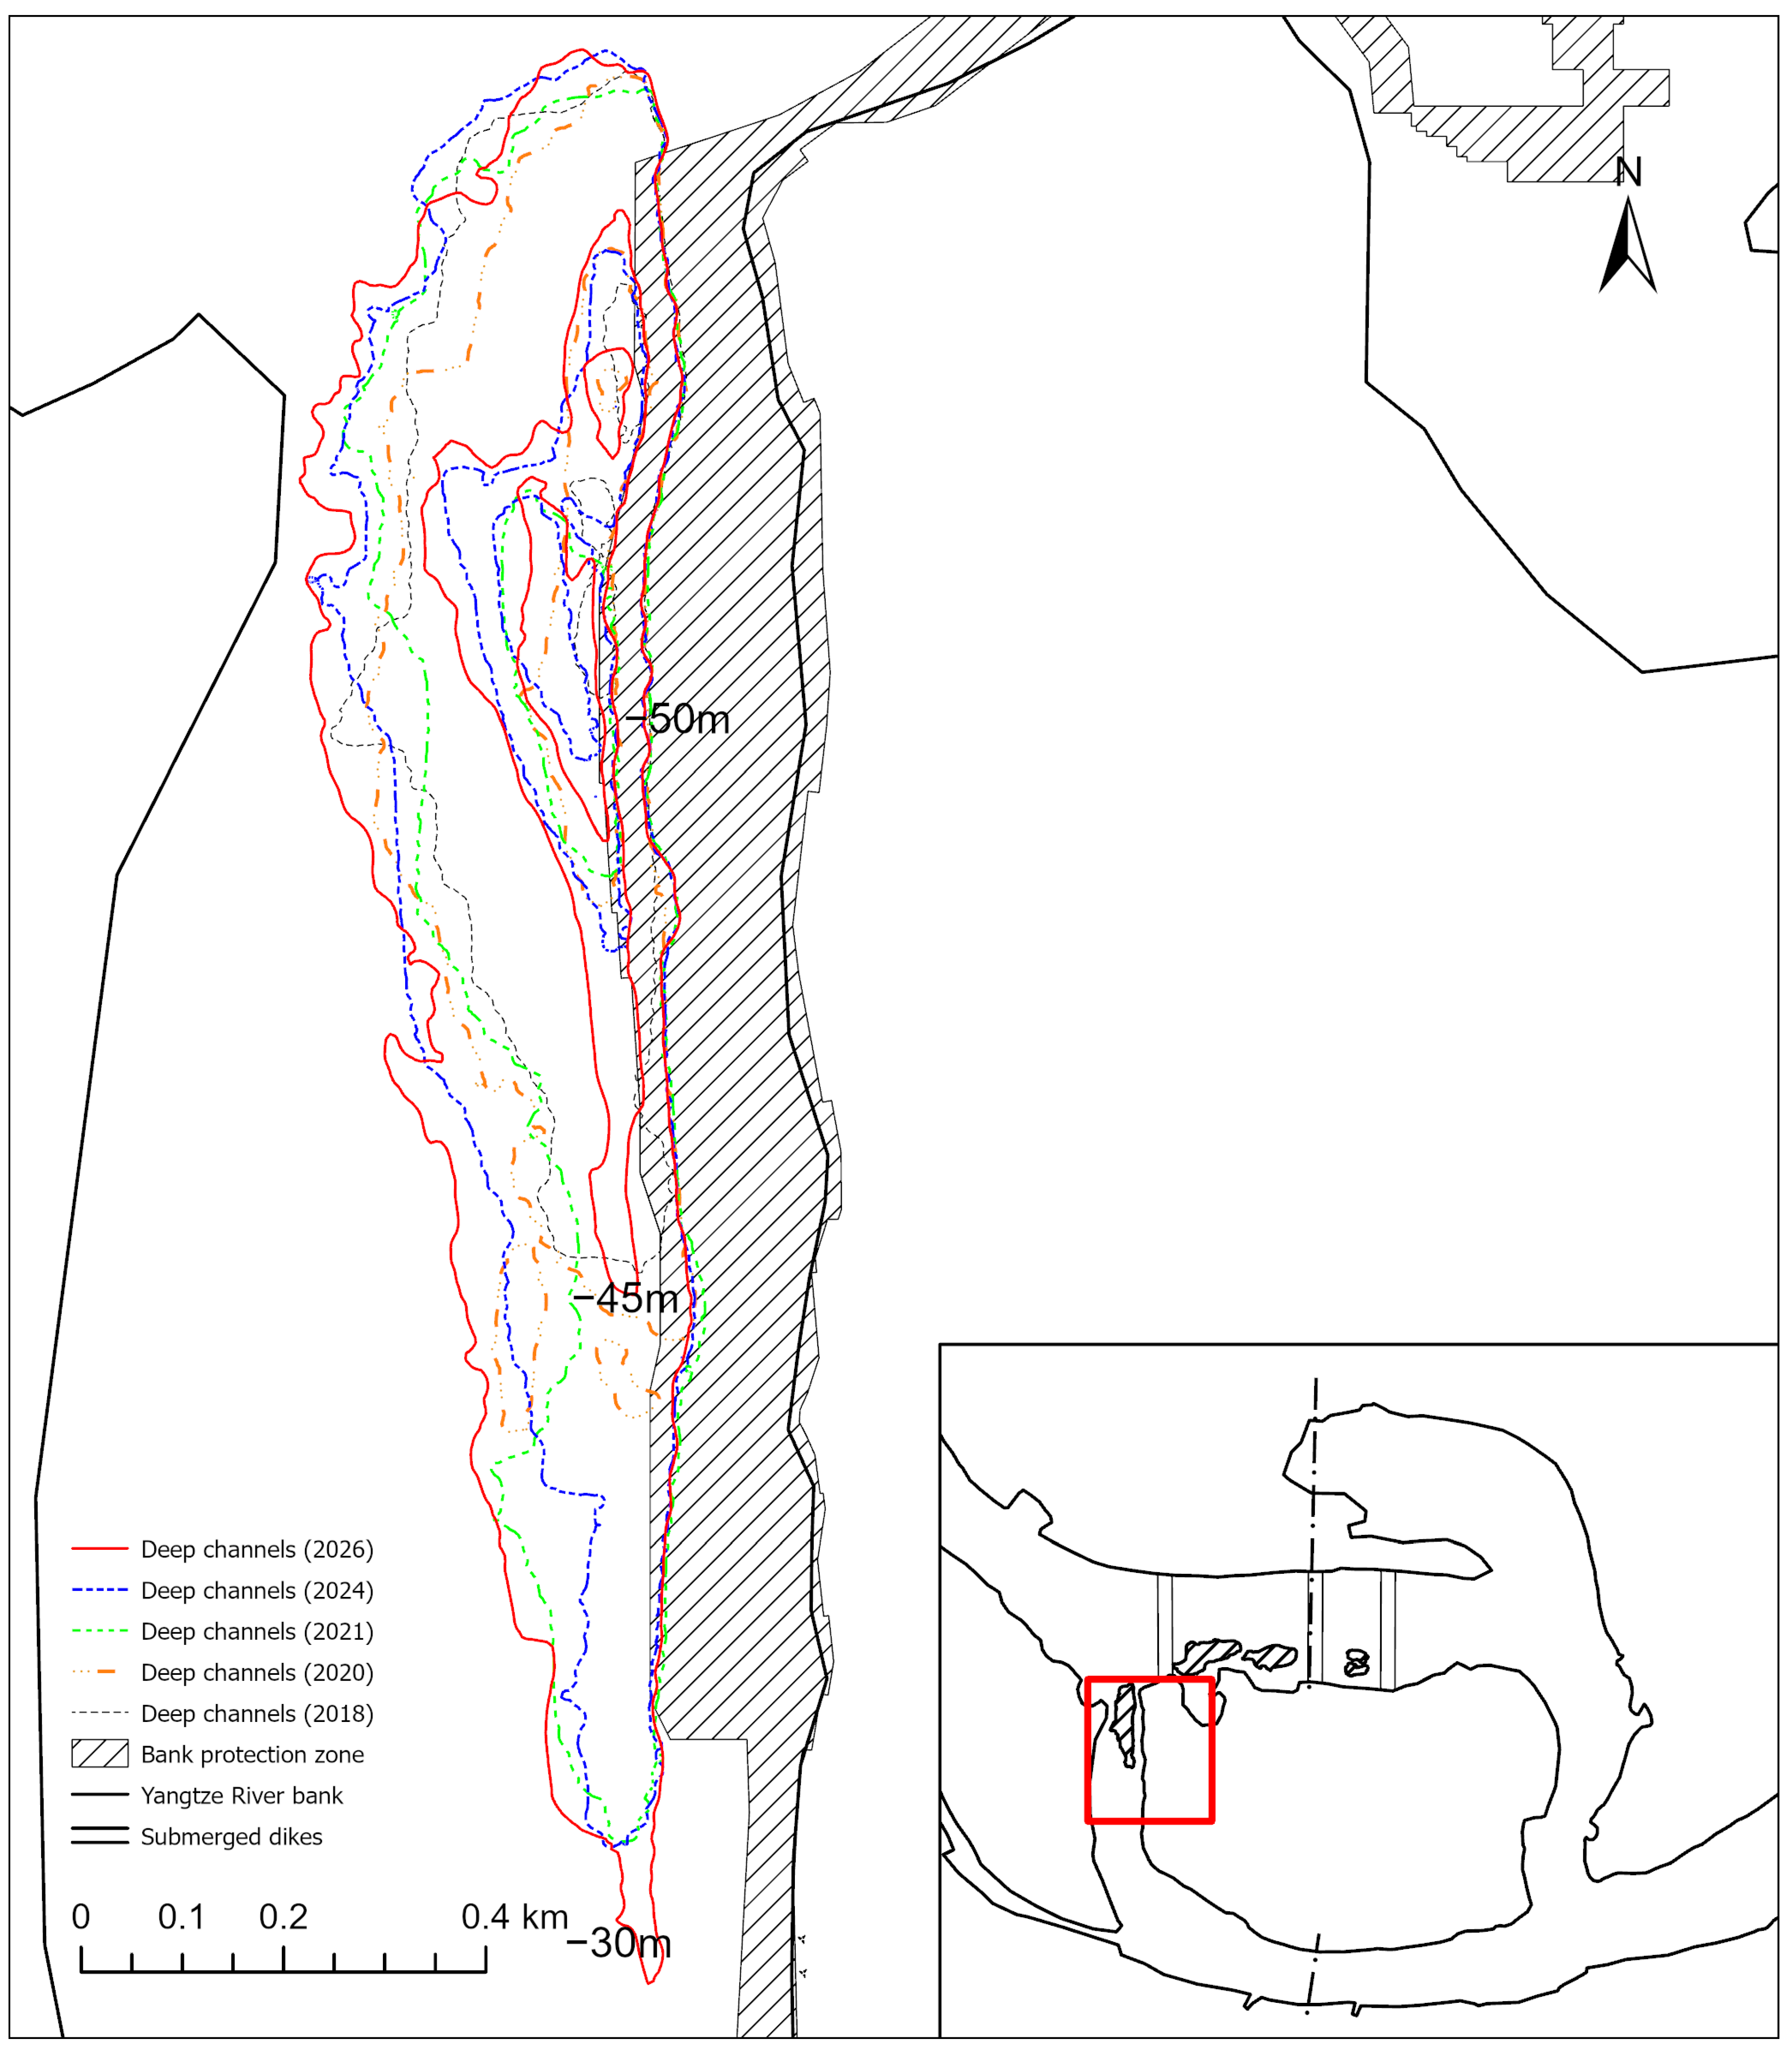
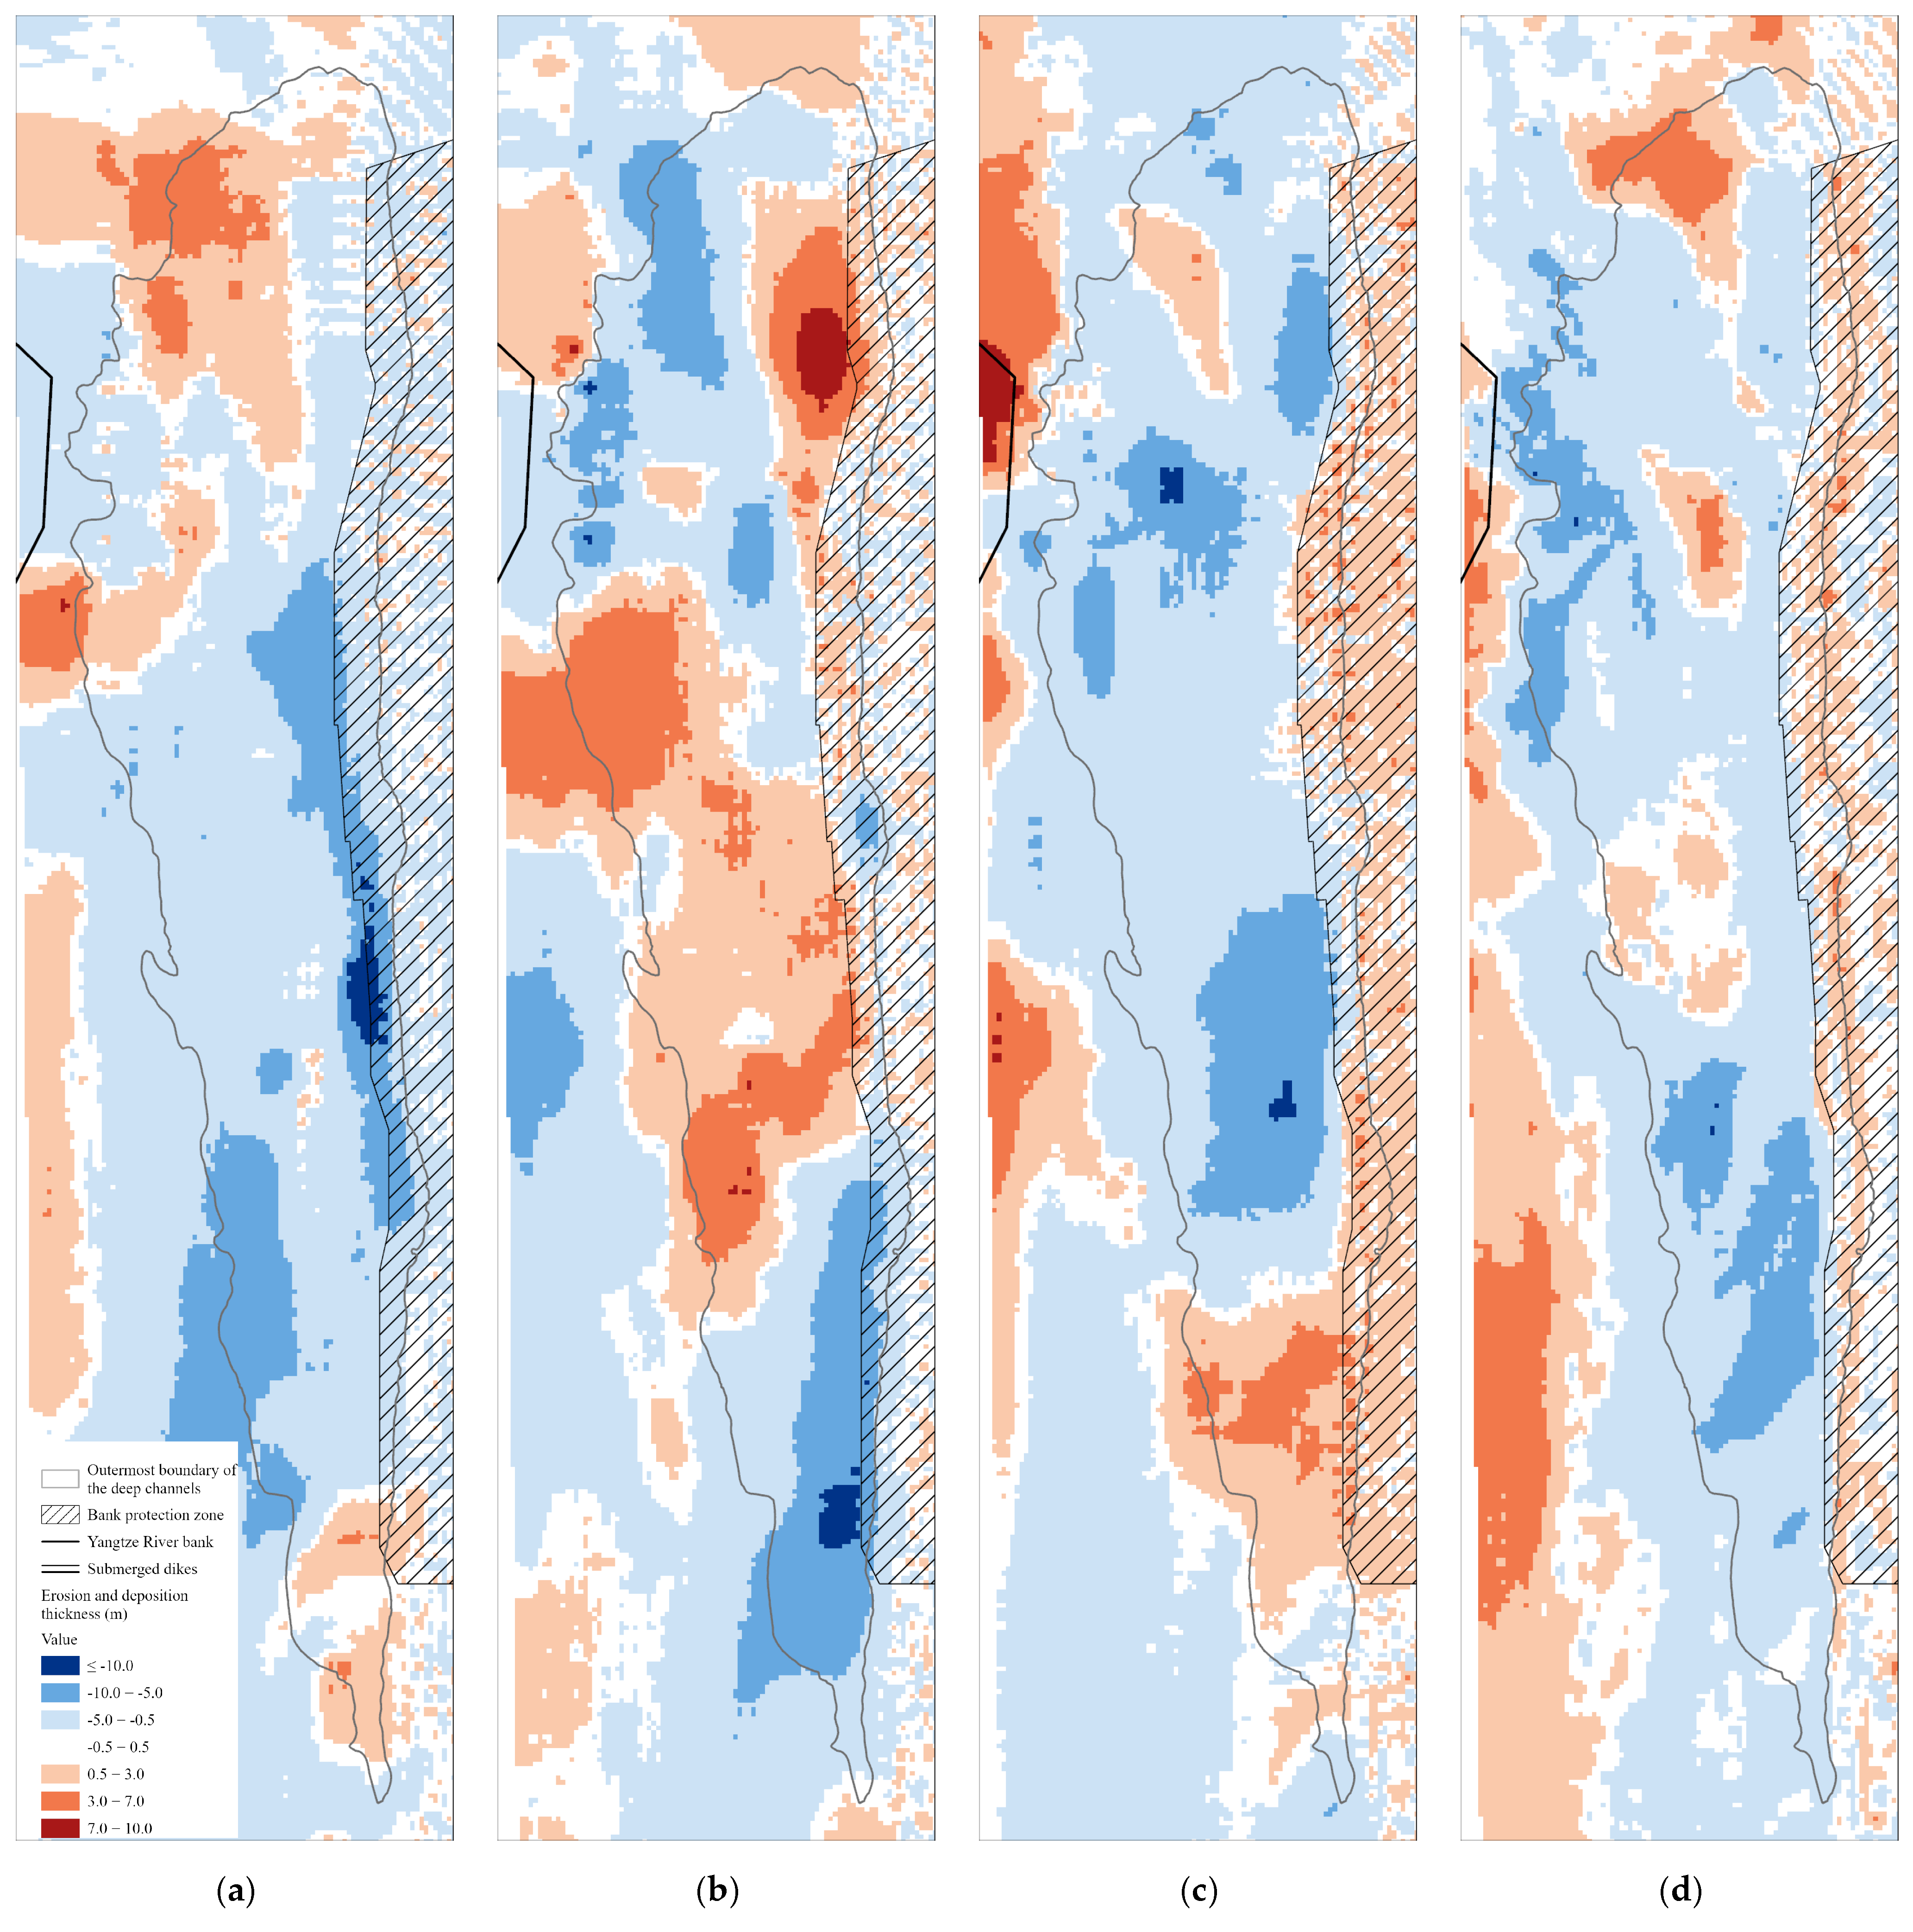
Based on bathymetric data from key sections of the Hechangzhou Anabranching Reach collected in 2018, 2020, 2021, 2024 and 2026, this study analyzes the morphological evolution of deep channels after the completion of the three submerged dikes in the left anabranch. The analysis is conducted in terms of two aspects, including planform variations in deep channel boundaries and internal bed scour and deposition characteristics. The targeted deep channels cover the −30 m deep channel in the right anabranch, the −40 m and −35 m deep channels between SD1 and SD2, and the northern and southern −30 m deep channels between SD2 and SD3 in the left anabranch. Figure 1 illustrates the spatial distribution of these deep channels in 2018. Figure 3 presents planform variations of major deep channel boundaries in the right anabranch for 2018–2026. Figure 4 illustrates four‑period scour‑deposition patterns of the −30 m deep channel in the right anabranch. Figure 5 and Figure 6 display planform variations of deep channel boundaries for the SD1‑SD2 and SD2‑SD3 reaches, respectively. Figure 7 and Figure 8 depict the four‑period scour‑deposition patterns of deep channels within the SD1‑SD2 and SD2‑SD3 reaches. The color scale indicates bed elevation change in meters, where negative values represent scour and positive values represent deposition. Blue tones correspond to eroded areas, while warm tones represent depositional areas. The white zone (−0.5 m to 0.5 m) refers to areas with negligible bed change, and darker colors indicate larger magnitudes of scour or deposition. Areas with bed elevation variation less than −5 m are defined as intense scour zones.

3.2.1. Deep Channel in the Right Anabranch

  • Planform Variations in Deep Channel Boundaries
As illustrated in Figure 3, the −30 m deep channel in the right anabranch of Hechangzhou exhibits a strip-shaped distribution pattern across the 2018–2026 survey epochs. In the initial stage after the completion of the project in 2018, the area of the −30 m deep channel in the right anabranch was approximately 236,000 m2, with a length of about 1187 m. Two independent −45 m secondary deep channels were distributed along the flow direction within the main channel, measuring 157 m and 217 m in length, respectively.
In 2020, the area of the −30 m deep channel increased to approximately 255,000 m2, and its length extended to 1249 m, representing an increase of about 8.0% in area and 5.2% in length. The two original −45 m deep channels merged into one, reaching a length of 649 m. Concurrently, incision occurred within the merged channel, forming a −50 m deep channel with a length of approximately 41 m.
In 2021, the −30 m deep channel covered an area of about 319,000 m2 and extended to 1733 m in length. Relative to 2020, its area and length increased by 25.1% and 38.8%, respectively. No significant incision was observed inside the channel, and the −50 m deep channel was filled with sediment.
In 2024, the area of the −30 m deep channel expanded to approximately 359,000 m2, with a total length extending to 1770 m. Compared to 2021, the area and length increased by approximately 12.5% and 2.1%, respectively. The −50 m deep channel reappeared, expanding and shifting downstream relative to its extent in 2020.
In 2026, the −30 m deep channel covered an area of approximately 413,800 m2 with a total length extending to 1901 m. Compared with 2024, its area and length increased by roughly 15.3% and 7.4%, respectively. The original −50 m deep channel expanded and developed, and a new −50 m deep channel emerged.
Overall, from 2018 to 2026, the deep channel primarily expanded channelward and downstream, accompanied by continuous vertical incision. The morphology of the near-bank marginal deep channel remained generally stable with small variations, and only partial regions expanded inward toward the training structures.
2.
Scour and Deposition Characteristics within Deep Channels
Figure 4 presents the scour-deposition variations and spatial distribution of the −30 m deep channel in the right anabranch from 2018 to 2026. Evidently, the dominant trend and spatial pattern of scour and deposition within the deep channel underwent phased adjustments across different periods. During the normal-flow period of 2018–2020, the deep channel was dominated by erosion, with a net scour volume of −903,000 m3 and an average scour rate of −451,500 m3 yr−1. Depositional zones were concentrated at the upstream and downstream ends of the deep channel. Regions with large scour magnitudes lay adjacent to the bank protection, alongside mild near-bank erosion (Figure 4a). During the flood period of 2020–2021, the deep channel remained dominated by erosion, yet the net scour volume decreased markedly to −282,000 m3, corresponding to an average scour rate of −282,000 m3 yr−1, lower than that in the normal-flow period. The distribution of scour zones shifted, occurring locally in the upstream and downstream ends of the deep channel (Figure 4b).
The 2021–2024 interval corresponded to the post-flood recovery period, when the local scour and deposition pattern underwent substantial restructuring. The overall scour intensity increased, with a net scour volume of −964,000 m3, corresponding to an average scour rate of −321,300 m3 yr−1.
Depositional zones once more shifted toward the lower portion of the deep channel. The depositional zones identified in the previous phase were transformed into scour zones, with slight deposition occurring near the bank (Figure 4c). During the low-flow period of 2024–2026, scour dominated the entire deep channel, yielding a net scour volume of −829,000 m3, corresponding to an average scour rate of −414,500 m3 yr−1. Scour zones were concentrated within its middle and lower portions, and slight deposition persisted near the bank (Figure 4d). Over the four periods, scour remained the dominant geomorphic process, with the spatial patterns of scour and deposition undergoing iterative adjustments. Despite dynamic shifts in the scour-deposition regime, the near-bank boundary constrained by bank protection stayed stable. Moreover, impacts on the near-bank zone were more pronounced during the normal-flow period.

3.2.2. Evolution of Deep Channels in the Left Anabranch

  • Planform Variations in Deep Channel Boundaries
As illustrated in Figure 5, two major deep channels are distributed upstream and downstream between SD1 and SD2, located off Dawotang and Erwotang, respectively.
From 2018 to 2026, the near-bank (left bank) boundary of the −40 m deep channel off Dawotang remained relatively stable. Compared with 2018, the −40 m deep channel extended approximately 70 m downstream in 2020, and its area increased by 3.0%. Sediment deposition disconnected the −55 m deep channel into two separate −55 m deep channels. In addition, incision within the downstream −55 m deep channel generated a −60 m deep channel. In 2021, the area of the −40 m deep channel decreased from 259,000 m2 in 2020 to 245,000 m2, and the downstream −60 m deep channel vanished due to sediment deposition. In 2024, the −40 m deep channel expanded downstream and toward the main channel. Its area increased to 285,000 m2, representing a rise of roughly 15%. However, internal sediment deposition was observed, causing the −60 m deep channel to disappear. In 2026, although the area of the −40 m deep channel shrank by 3.4% relative to 2024, the channel underwent incision. The −55 m deep channel became continuous, and three −60 m deep channels formed, covering a total area of 18,000 m2.
The area of the −35 m deep channel off Erwotang was approximately 162,000 m2 in 2018, with an internal −50 m deep channel of about 11,000 m2. In 2020, the areas of the −35 m and −50 m deep channels expanded to 201,000 m2 and 16,000 m2, respectively. In 2021, the areas of the −35 m and −50 m deep channels expanded to 219,000 m2 and 19,700 m2, respectively. In 2024, the area of the −35 m deep channel slightly decreased to 181,000 m2, and the internal −50 m deep channel reduced marginally to 15,000 m2. Despite this slight shrinkage, scour and vertical incision occurred within the channel, creating a new −55 m deep channel covering an area of approximately 2000 m2. In 2026, the −35 m deep channel expanded slightly, reaching an area of approximately 192,000 m2, while the internal −50 m and −55 m deep channels shrank in area. Between 2018 and 2026, the deep channel exhibited a multi-directional expansion pattern.
The upper portion extended upstream along the edge of the bank protection and exhibited finger- or tongue-shaped morphologies. Meanwhile, the near-bank portion developed multiple finger- or tongue-shaped protrusions in poorly protected bank segments. Consequently, the channel margins became highly sinuous and fragmented, with their overall morphology evolving from relatively regular to complex and irregular.
One −30 m deep channel lay on the northern side and another on the southern side between SD2 and SD3 in 2018 (Figure 6). In 2020, these two −30 m deep channels expanded and merged. In 2026, the furthest landward extent of the merged channel was approximately 40 m closer to the bank.
On the north side, the area of the −35 m deep channel increased from 20,000 m2 in 2018 to 28,000 m2 in 2020. In 2021, it became connected with the southern −35 m deep channel. However, due to deposition, the −35 m deep channel was separated once more into northern and southern segments in 2024, and the northern segment covered a total area of 27,000 m2. In 2026, its area reached 25,800 m2. Meanwhile, the −40 m deep channel expanded from 6000 m2 in 2018 to 10,000 m2 in 2020 and reached 12,000 m2 in 2021. Nevertheless, it shrank to 4000 m2 in 2024, before recovering to 5000 m2 in 2026. Morphologically, the northern deep channel exhibited a tendency to expand landward.
On the south side, the −35 m deep channel covered 21,000 m2 in 2018. While its area remained almost unchanged in 2020, significant deposition occurred within the channel, causing the −40 m deep channel to disappear. In 2021, it became connected with the northern −35 m deep channel. In 2024, the −35 m deep channel expanded to 33,000 m2, accompanied by internal scour and incision, leading to the formation of a new −45 m deep channel. In 2026, the −35 m deep channel expanded slightly to approximately 35,000 m2, yet internal sediment deposition occurred, causing the −45 m deep channel to vanish. Morphologically, the southern −35 m deep channel demonstrated a continuous landward development.
2.
Scour and Deposition Characteristics within Deep Channels
The −40 m deep channel off Dawotang experienced extensive local scour during the normal-flow period of 2018–2020. The scoured area reached approximately 191,000 m2, accounting for 64.9% of the analysis domain, with a net scour volume of −604,000 m3, corresponding to an average scour rate of −302,000 m3 yr−1. Scour was concentrated in the lower portion of the deep channel, and the intense scour zones were located approximately 511 m from SD1 (Figure 7a). During the flood period of 2020–2021, this deep channel underwent widespread deposition. The depositional area was approximately 200,500 m2, occupying 68.1% of the domain, corresponding to a net deposition volume of 430,000 m3 and an average deposition rate of 430,000 m3 yr−1, and no intense scour zones were identified (Figure 7b). Over the 2021–2024 post-flood recovery period, scour remained dominant across the −40 m deep channel with a broad scoured extent. The scoured area totalled around 198,100 m2 (67.3% of the domain) and the net scour volume amounted to −403,000 m3, corresponding to an average scour rate of −134,300 m3 yr−1. The intense scour zones lay approximately 240 m from SD1. Compared with the 2018–2020 normal-flow period, these intense scour zones migrated roughly 190 m channelward and were situated adjacent to the bed protection of SD1 (Figure 7c). During the low-flow period of 2024–2026, persistent scour continued to act on the −40 m deep channel. The scoured area reached approximately 192,400 m2 (65.4% coverage), with a net scour volume of −247,900 m3, corresponding to an average scour rate of −123,950 m3 yr−1. The intense scour zones were scattered and positioned about 300 m from SD1; relative to the 2018–2020 condition, these zones migrated 130 m landward (Figure 7d).
In summary, scour during the low-flow period exerts prominent impacts on nearshore bank protection. In contrast, scour generated during the flood and post-flood recovery periods primarily affects bed protection downstream of SD1.
The −35 m deep channel off Erwotang was dominated by local scour during the normal-flow period of 2018–2020, with a net scour volume of −581,000 m3 and an average scour rate of −290,500 m3 yr−1. The intense scour zones were approximately 260 m away from SD2 and concentrated in the middle portion of the deep channel. The deep-channel margin adjacent to the bank-protection zone remained relatively stable with limited scour and deposition variation (Figure 7a). During the flood period (2020–2021), the −35 m deep channel underwent continuous scour, yielding a net scour volume of −235,400 m3 and an average scour rate of −235,400 m3 yr−1. Compared with the normal-flow period, the scour magnitude decreased, and scour shifted downstream, distributed in the middle and lower portions of the deep channel (Figure 7b). During the post-flood recovery period (2021–2024), the −35 m deep channel was dominated by deposition, with a net deposition volume of 473,000 m3 and an average deposition rate of 157,667 m3 yr−1, and intense scour zones migrated upstream to the upper portion of the deep channel (Figure 7c). During the low-flow period (2024–2026), the deposition area within the −35 m deep channel was slightly larger than the scour area, yet the scour intensity exceeded the deposition intensity, corresponding to a net scour volume of −33,600 m3 and an average scour rate of −16,800 m3 yr−1. Scour occurred over nearly the entire near-bank zone, and the scour propagated toward poorly protected bank segments (Figure 7d).
As shown in Figure 8, the −30 m deep channel between SD2 and SD3 experienced extensive scour during the normal-flow period (2018–2020). Scour areas accounted for 76.3% of the channel domain, with a net scour volume of −119,000 m3 and an average scour rate of −59,500 m3 yr−1. Intense scour zones were generally distributed between the northern and southern −35 m deep channels, with a maximum local bed incision depth exceeding 10 m. During the flood period (2020–2021), scour still covered 60.9% of the −30 m deep channel, while the overall scour intensity decreased. Bed incision was primarily limited to depths less than 5 m, yielding a net scour volume of −82,300 m3 and an average scour rate of −82,300 m3 yr−1. During the post-flood recovery period (2021–2024), scour occupied 49.7% of the channel domain, with a net scour volume of −52,000 m3 and an average scour rate of −17,333 m3 yr−1. Compared with the 2018–2020 normal-flow period, the intense scour zones migrated approximately 44 m landward. During the low-flow period (2024–2026), the channel produced a slight net deposition volume of 8800 m3 and an average deposition rate of 4400 m3 yr−1. Even so, the intense scour zones kept propagating landward, with local scour advancing further toward the bank protection.

3.3. Cross-Section Variation Analysis

Figure 9 systematically illustrates the dynamic evolution of the cross-sectional morphology in the left and right anabranches of Hechangzhou between 2018 and 2024. As shown in Figure 9a, the cross-section of the left anabranch exhibits an overall “V-shaped” profile, characterized by a notably steep right bank slope. From 2018 to 2021, the left bank slope (at elevations between −10 m and −25 m) experienced slight deposition. Meanwhile, the area to the right of the thalweg underwent significant scour in 2020, with the deepest point incising to −38.1 m, followed by minor re-deposition in 2021. During the 2021–2024 period, the left bank slope transitioned from deposition to being dominated by erosion, reaching a maximum scour depth of approximately 4 m. Conversely, the area to the right of the thalweg showed localized, minor deposition of about 3 m. Overall, compared to the 2018 baseline, the cross-sectional flow area of the left anabranch decreased by only 0.4%.
As indicated in Figure 9b, the right anabranch features a typical “U-shaped” cross-section with a wide and shallow riverbed. Between 2018 and 2020, the left bank slope continuously retreated due to erosion, and the deepest point in the deep channel incised to −24.8 m, demonstrating strong longitudinal scour capacity. Although brief re-deposition occurred in this area in 2021, the net state remained one of erosion. From 2021 to 2024, the left bank slope underwent dynamic adjustments with alternating scour and deposition; by 2024, its morphology was largely comparable to that of 2020. Notably, the cross-sectional flow area of the right anabranch increased by 11.1% compared to 2018, indicating that this anabranch is primarily dominated by erosion-induced expansion.
These fixed cross-sections come from the official routine monitoring project for key river reaches of the Yangtze River (Jiangsu reach). Under this project, only one fixed profile was deployed for each anabranch within the Hechangzhou reach. It should be noted that these cross-sections do not cover the highly dynamic deep-channel core zones. They are designed to capture the overall long-term morphological trend of each anabranch, whereas fine-scale deep-channel evolution is analysed using full-coverage multi-temporal bathymetric datasets. These two complementary analytical approaches jointly characterise the integrated geomorphic adjustments of the anabranching reach.
Synthesizing the evolutionary characteristics of both anabranches, it is evident that the regulation project has effectively constrained the development of the left anabranch and directed water flow and sediment towards the right anabranch, thereby achieving a rational distribution and regulation of flow between the main and secondary anabranches. The simultaneous enhancement of the left anabranch’s stability and the optimization of navigational conditions in the right anabranch demonstrate the dual effectiveness of the engineering design in terms of river regime control and the improvement of navigation functions.

4. Discussion

Constrained jointly by the submerged dike group and bank protection, deep channels in different subzones of the Hechangzhou Anabranching Reach exhibit remarkable spatiotemporal differentiation in scour and deposition evolution. Deep channels at different locations exhibit evident disparities in scour-deposition responses, morphological adjustment and evolution intensity under varied hydrological regimes, including normal, flood and low-flow conditions. Additionally, bank protection alters local flow fields, generating finger- or tongue-shaped scour troughs along poorly protected bank segments; such geomorphic signatures have rarely been reported in existing literature.
It should be noted that hydrodynamic-related mechanisms mentioned below, such as recirculation, bed shear stress, and flow-energy redistribution, are qualitative interpretations inferred from bathymetric morphological observations and previous relevant studies. These parameters are neither directly measured nor numerically modelled in this work.

4.1. Constraint Mechanism of Bank Protection on the Planform of Deep Channels

Bank protection can significantly restrict the lateral expansion of deep channels. Analysis results show that the near-bank edge of the right anabranch deep channel maintained a regular strip shape from 2018 to 2026, with negligible disorderly lateral scour. Constrained by rigid bank protection, the lateral widening of the channel is effectively suppressed. According to the hydraulic geometry equilibrium theory, alluvial rivers feature coordinated three-dimensional adjustments in width, water depth and flow velocity. When the lateral adjustment space of the river is blocked, flow energy cannot be dissipated through bank and beach erosion and is redistributed vertically and longitudinally. This considerably increases bed shear stress, ultimately driving continuous narrowing and vertical incision of the deep channel in the right anabranch [34,35]. This evolutionary pattern agrees with the findings of relevant studies regarding bank protection in anabranching channels of the middle and lower reaches of the Yangtze River [36,37,38]. However, rigid bank protection may induce risks of bank slope scour. During the low-flow period of 2024–2026, the scour zone failed to migrate away and remained closely adjacent to the toe of the bank protection over a long period. This indicates that the main flow travels along the bank at low water levels, and the toe protection is persistently exposed to scour, rendering this area a location of increased vulnerability for the toe-protection works.
The response characteristics of deep channels in the left anabranch are more complex. Driven by the combined effects of flow blockage, overtopping, and recirculating vortices generated by the submerged dike group, the flow field is reshaped. Constrained effectively by rigid bank protection—which restricts lateral channel widening along reinforced bank segments—deep channels experience persistent scour and lateral expansion toward poorly protected bank segments. Among these reaches, the −35 m deep channel at Erwotang, located between SD1 and SD2, develops multiple finger- or tongue-shaped scour troughs extending landward. This forms distinctive geomorphic features marked by localized concentrated scour and distorted channel geometry. This reveals that while rigid bank protection stabilizes the overall river regime via lateral confinement, it reorganizes local flow fields and accumulates hydrodynamic energy in poorly protected bank segments, triggering persistent local scour and posing potential safety hazards to near-bank protective structures. Meanwhile, the constraining effect of rigid bank protection exhibits pronounced spatial variability. In bank-protected segments far from submerged dikes, deep channel evolution remains generally stable and is dominated by uniform erosional expansion. In contrast, transition zones linking submerged dikes and bank protection experience significantly intensified flow turbulence, frequent scour-deposition alternations, and complex channel morphologies. These zones act as sensitive areas of bed response to the intervention of training structures, featuring unique geomorphic patterns absent in natural river evolution. Such evolutionary characteristics align with the hydrodynamic restructuring effect induced by training structures [33,37].

4.2. Differential Responses of Deep Channels at Various Locations to Varied Hydrological Conditions

4.2.1. Deep Channel in the Right Anabranch

Following regulation by submerged dikes, the deep channel in the right anabranch of Hechangzhou has thoroughly reversed the unfavorable pre-regulation evolution regime characterized by continuous deposition and contraction. The deep channel maintains steady expansion throughout all hydrological phases, with distinctly different development patterns under varied hydrological conditions. During the normal-flow period, abundant hydrodynamic forces drive simultaneous lateral widening and longitudinal extension of the deep channel. Increased water and sediment fluxes during the flood period render longitudinal extension the dominant evolutionary feature, accompanied by local adjustments, including partial re-deposition in the middle portion of the deep channel and intensified scour in the lower portion of the deep channel. In the post-flood recovery phase, lateral expansion becomes the primary evolutionary direction; the lowest point of the deep channel undergoes aggravated vertical incision, and deposition occurs merely within near-bank zones. During the low-flow period, the deep channel retains coordinated lateral and longitudinal development. The overall intensity of scour decreased moderately, with sustained near-bank re-deposition.
Such periodically differentiated evolutionary patterns essentially arise from the combined effects of flow division regulation by the submerged dike group in the left anabranch and flow concentration enhanced by bank protection in the right anabranch. The submerged dike group reshapes the reach-scale hydrodynamic pattern via flow blockage and flow division, effectively stabilizing the right anabranch’s inflow regime and supplying sustained hydrodynamic power for persistent scour in the main channel. Continuous rigid bank protection along the entire right anabranch restrains unordered lateral channel expansion and eliminates flow energy dissipation over the floodplain. As a result, hydrodynamic forces are highly concentrated within the main channel, sustaining stable erosion capacity in the right anabranch across all hydrological cycles. The combined regulation of training structures establishes a novel self-adaptive channel evolution regime. Differentiated minor morphological adjustments in each hydrological period realize dynamic matching of flow and sediment throughout the whole cycle, effectively stabilizing deep channel morphology and continuously optimizing navigation conditions in the right anabranch.

4.2.2. Deep Channel in the Left Anabranch

Backwater and overtopping induced by the left-anabranch submerged dike group produce distinct recirculation zones and shear stress fields upstream of and between the dikes [29,39,40]. Consequently, distinctly different flow dynamic zones form around each dike segment, disrupting the uniform flow field structure of the natural channel. Each deep channel exhibits remarkably spatially differentiated responses to four hydrological periods: normal-flow, flood, post-flood recovery, and the low-flow period. Overall, the evolution characteristics manifest that scour intensity is governed by hydrological cycles while scour locations are controlled by the arrangement of submerged dikes. The morphological differentiation effect induced by training structure disturbance is significantly stronger than the impacts originating from natural flow-sediment periodic fluctuations.
  • The Deep Channels between SD1 and SD2
The −40 m deep channel off Dawotang presents obvious alternating scour and deposition across successive periods. During the normal-flow period, abundant hydrodynamic forces induce substantial overall scour within the deep channel, and the intense scour zone lies approximately 511 m away from SD1 in the lower portion of the deep channel. During the flood period, the mainstream features large discharge and strong sediment transport capacity. Nevertheless, extensive low-velocity recirculation zones form downstream of the dikes, where flow velocity decreases sharply and sediment cannot be transported away, leading to local sediment deposition. This reach is the only segment in the left anabranch dominated by deposition during the flood period.
In the post-flood recovery period, the hydrodynamic power of the mainstream is restored. The intense scour zone shifts 190 m landward and 271 m upstream, concentrating scour on the bed protection of SD1. This observation is consistent with previous findings that intensive local scour zones tend to develop downstream of submerged dikes [29]. During the low-flow period, river discharge declines, concentrating all flow within the main channel that runs adjacent to the bank protection. As a result, the intense scour zone migrates 320 m landward, inducing persistent scour on the bank protection slopes.
Overall, scour occurring during the flood and post-flood recovery periods primarily threatens the bed protection of SD1, while scour in the low-flow period mainly affects the bank protection, indicating differentiated risks to training structures across hydrological periods and spatial zones.
The −35 m deep channel off Erwotang exhibits a prominent lagged response to hydrological variations, following an evolutionary pattern characterized by intense scour during the normal-flow period, mild scour during the flood period, deposition in the post-flood recovery period, and near-bank scour in the low-flow period. During the normal-flow period, flow is confined within the channel, producing intense scour in the central region of the deep channel. By contrast, flow conditions near the bank protection stay stable, and bed morphology barely varies.
During the flood period, river discharge increases substantially, causing flow to spread laterally and the overall flow field to become homogenized. The localized abrasive force that originally concentrates scour within the channel is greatly diluted. Accordingly, scour intensity decreases markedly, only triggering slight vertical incision without distinct intense scour zones. After floods enter the recovery stage, water level declines, and the backwater effect induced by the submerged dike group becomes prominent. Flow exchange between the dikes is obstructed, flow velocity reduces, and sediment transport capacity declines significantly. Continuous sediment accumulation occurs, leading to lagged deposition differing from instantaneous flood-induced deposition, which effectively compensates the scour volume formed in earlier stages.
The overall magnitude of scour and deposition remains low in the low-flow period. Nevertheless, flows converge within the channel and travel closely along the bankline, inducing concentrated scour on poorly protected bank segments. The intense scour zone gradually extends toward the bank protection, creating latent risks to training structures.
2.
The Deep Channels between SD2 and SD3
The deep channel lies in the enclosed water area surrounded by the second and third submerged dikes. This zone features higher enclosure and weaker flow exchange, developing a highly independent steady recirculation system between the dikes. Less disturbed by alternating high and low-flow hydrological cycles, it presents a stable evolutionary trend of long-term landward migration, with maximum scour persistently approaching the engineering boundary.
Seldom disturbed by the rise and fall of mainstream flood discharge, this enclosed recirculation zone maintains a long-term stable hydrodynamic environment, and its morphological evolution exhibits strong independence. Scour intensity peaks during the normal-flow period and gradually weakens with the decreasing discharge in the post-flood recovery period. Even in the low-flow period, the entire deep channel undergoes slight deposition; nevertheless, the high-intensity scour zone within the channel continuously shifts toward the bank and gradually erodes into the scope of bank protection. It can be seen that the steady recirculation enclosed by twin dikes weakens the conventional alternating scour and deposition induced by hydrological variations and imposes persistent lateral erosion on bank slopes, acting as the primary trigger for potential hazards of the bank protection zone in this reach.
In summary, the submerged dike group in the left anabranch reconstructs the hydrodynamic pattern across the whole reach and creates independent scour-deposition response systems within each inter-dike interval, which constitutes the core mechanism accounting for spatial morphological differentiation of the reach after regulation [41]. The upstream deep channels are sensitive to flood processes with remarkable alternating scour and deposition; the mid-reach deep channels display obvious lagged deposition effect during the post-flood stage; the inter-dike deep channels in the downstream are dominated by steady recirculation, and their evolution decouples from the regulation of hydrological cycles. This differentiated evolutionary pattern contrasts sharply with the feature of persistent scour throughout all hydrological periods in the right anabranch. The findings reveal the distinctive morphological response law of engineering-regulated anabranching channels and can provide references for the later operation, maintenance and risk prevention of similar waterway regulation projects in the middle and lower reaches of the Yangtze River.

4.3. Novel Scour-Deposition Patterns and Associated Risks to Training Structures Driven by Abrupt Flow-Sediment Variations and Training Structure Impacts

Since the impoundment of the Three Gorges Reservoir, the incoming sediment load in the middle and lower reaches of the Yangtze River has decreased continuously, which greatly weakens the natural sediment supply and the deposition compensation capacity of the riverbed [26,42]. Against the background of basin-scale flow–sediment regime variations and superimposed constraints from the submerged dike group and rigid bank protection within the study area, the scour-deposition evolution of this reach breaks the inherent matching law of scour and deposition of natural rivers in this region, forming a novel scour-deposition evolution pattern specific to this regulated reach. Subjected to varied hydrological regimes, this regulated reach fails to exhibit persistent depositional characteristics. No extensive deposition occurs during the low-flow period, and the channel remains in a slight scour state as a whole. Consequently, a distinctive scour-deposition pattern is established, featuring intensive scour during the normal-flow period, localized deposition during the flood period, and weak scour during the low-flow period, which differs markedly from the evolutionary law of the reach under natural conditions.
It should be noted that although multi-temporal observational records indicate the submerged-dike group acted as a key anthropogenic trigger for the observed river-regime shift, the relative contributions of hydrological variability, sediment reduction and engineering interventions cannot be quantitatively disentangled in the present study. Within this context, the regulatory effects of the submerged dike group exhibit obvious dual characteristics. On the one hand, the submerged dikes effectively restrain the overdevelopment of the left anabranch, stabilize the flow division pattern of the dual anabranches, and optimize flow and sediment allocation as well as navigation conditions in the right anabranch [2,18,20]. These achievements conform to the regulation philosophy of stabilizing anabranches and controlling channel evolution for the anabranching reach of the Yangtze River [19]. Nevertheless, hydrodynamic characteristics including turbulent recirculation between the dikes and concentrated flow power near the bank trigger persistent local scour [39]. The deep channels undergo continuous vertical incision and landward migration, persistently approaching the foundations of the submerged dikes and the boundary of bank protection. In particular, prominent irregular scour develops on poorly protected bank segments. Such long-term morphological evolution may turn these sites into locations of increased vulnerability for training structures, making them potential risk zones for future routine monitoring, operation, and maintenance of the waterway [43].

5. Conclusions

Against the background of flow-sediment variations in the middle and lower reaches of the Yangtze River, this study systematically investigates the morphological evolution characteristics and hydrodynamic mechanisms of deep channels under the collaborative constraints of the submerged dike group and bank protection within the left anabranch of the Hechangzhou Reach. The spatial differentiation law of scour-deposition evolution in engineering-regulated anabranch channels is clarified. The combined effects of flow regulation by submerged dikes and boundary stabilization via bank protection restructure the reach-scale flow field, forming a unique morphological response pattern governed by diminished basin sediment supply and artificial training structure regulation. The main conclusions are summarized as follows:
(1)
Lateral constraints imposed by rigid bank protection govern the planform evolution of deep channels. Bank protection effectively restricts the lateral expansion of the river channel, prompting flow energy to redistribute vertically and longitudinally rather than dissipating laterally. This process promotes the continuous elongation and vertical incision of the main channel in the right anabranch and maintains a regular and stable strip-shaped channel morphology. Meanwhile, rigid bank protection induces localized flow energy accumulation. Concentrated scour occurs at poorly protected bank segments, forming irregular finger- or tongue-shaped scour troughs that represent typical morphological features of local bed adjustment under training structure constraints. The affected bank reaches are thus locations of increased vulnerability and potential risk zones.
(2)
Deep channels in distinct inter-dike segments display highly differentiated responses to hydrological regimes with obvious spatial heterogeneity. The deep channel within the SD1–SD2 reach is controlled by hydrological processes and undergoes periodic alternations between scour and deposition. Abundant hydrodynamic power during the normal-flow period generates intense channel scour, whereas low-velocity recirculation zones downstream of the dikes during the flood period lead to localized sediment deposition. The enclosed stable recirculation system formed between SD2 and SD3 experiences weak disturbance from interannual high–low flow fluctuations and decouples from the standard alternating scour-deposition cycle. Persistent lateral bank erosion prevails here; the scour zone migrates landward continuously, bringing sustained hazards to training structures. Furthermore, this reach exhibits an evident lagged deposition effect in the post-flood recovery period, which offsets channel incision and mitigates persistent scour.
(3)
The combined impacts of diminished sediment supply and training structure constraints create a unique scour-deposition regime within the study reach. Since the operation of the Three Gorges Reservoir, the sediment supply and deposition compensation capacity of the middle and lower reaches of the Yangtze River have declined significantly. Combined with the rigid constraints of intensive training structures, the reach breaks its inherent natural scour-deposition regime and forms an engineering-dominated scour-deposition pattern featured by intensive scour during the normal-flow period, localized deposition during the flood periods, and weak scour during the low-flow periods.
(4)
The multi-stage implementation of the submerged dike group represents a key anthropogenic measure and produces dual geomorphic effects. Submerged dikes effectively restrain the overdevelopment of the left anabranch of Hechangzhou, stabilize the dual-anabranch flow division pattern, and optimize the flow-sediment allocation and navigation conditions of the right anabranch. However, hydrodynamic characteristics including turbulent recirculation between dikes and concentrated near-bank flow power induce persistent local scour. The continuous vertical incision of deep channels gradually approaches the bank protection boundary, and prominent irregular scour occurs at weakly protected segments. Long-term morphological evolution threatens the structural stability of submerged dikes and bank protection, making these reaches key risk areas for subsequent waterway operation, maintenance, and risk management.
In conclusion, the combined regulation of the submerged dike group and bank protection induces spatial differentiation in the hydrodynamic and morphological evolution of anabranching channels. Specifically, training structures govern the spatial distribution of scour and deposition, while hydrological regimes control the magnitudes of scour-deposition adjustments. This study reveals the differentiated evolution mechanisms of multi-segment deep channels in engineering-regulated anabranching channels under altered flow-sediment regimes. The findings can provide theoretical support and practical references for maintaining channel morphological stability and mitigating scour hazards at analogous waterway regulation projects in the middle and lower reaches of the Yangtze River. Future research can adopt numerical modelling to further quantify the threshold relationships between training structure parameters, hydrological regimes, and local scour, so as to support refined operation, maintenance, and hazard forecasting for waterway training structures.

Author Contributions

Q.L.: Formal analysis, Investigation, Methodology, Resources, Validation, Visualization, Writing—original draft, Writing—review & editing. H.Z.: Data curation, Project administration, Validation, Supervision, Writing—review & editing. M.W.: Funding acquisition, Project administration, Resources, Supervision, Writing—review & editing. J.L.: Data curation, Supervision, Writing—review & editing. Y.G.: Data curation, Validation, Writing—review & editing. X.W.: Data curation, Investigation, Writing—review & editing. All authors have read and agreed to the published version of the manuscript.

Funding

This research was funded by the Major Science and Technology Project of the Ministry of Water Resources of China (Grant No. SKS-2025040), the Hydraulic Science and Technology Project of Jiangsu Province (Grant No. 2024002).

Data Availability Statement

The raw data supporting the conclusions of this article will be made available by the authors on request.

Conflicts of Interest

The authors declare no conflicts of interest.

References

  1. Liu, S.; Zhong, G.; Huang, W.; He, Y. Recent evolution trend and mechanism of Hechangzhou braided channel in Zhenyang Reach of Yangtze River. In Proceedings of the Tenth ISOPE Pacific/Asia Offshore Mechanics Symposium, Vladivostok, Russia, 17–21 September 2012. [Google Scholar]
  2. Lin, M.S.; Lu, J.Y.; Zhang, D.F.; Chen, H.P.; Zhang, Z.F.; Gao, H.F. Evolution and training structures of the Hechangzhou anabranch in the Zhenyang Reach of the Yangtze River. J. Yangtze River Sci. Res. Inst. 2006, 23, 10–13. (In Chinese) [Google Scholar] [CrossRef]
  3. Huang, R.Y.; Zhang, X.B. Changes of inflow and outflow runoff and sediment of Three Gorges Reservoir before and after the impoundment. J. Yangtze River Sci. Res. Inst. 2011, 28, 75–79. (In Chinese) [Google Scholar] [CrossRef]
  4. Wang, N.R.; Huang, S.N.; Cao, S.; Zhang, H.Y.; Zhang, T.T. Analysis on the characteristics of channel scour and deposition in the Nanjing reach of the Yangtze River after impoundment of the Three Gorges Reservoir. In Proceedings of the PIANC Smart Rivers 2022, Antwerp, Belgium, 23–27 October 2022. [Google Scholar]
  5. Lai, X.; Jia, J.; Hou, Y.; Jiang, J.; Li, M.; Chen, J.; Wei, W. Changes in riverbed morphology in the middle Yangtze River (Yichang–Chenglingji) after the construction of the Three Gorges Dam. Hydrolog. Sci. J. 2023, 68, 2373–2387. [Google Scholar] [CrossRef] [Scilit]
  6. Yang, F.L. Study on the relationship between flow division ratio, channel capacity and navigation conditions in Hechangzhou Reach. Yangtze River 2015, 46, 10–14. (In Chinese) [Google Scholar]
  7. Wang, J.Z.; Fan, H.X.; Zhu, L.J.; Ying, H.H. Analysis of hydrodynamic improvement measures for the right anabranch of the Hechangzhou Anabranching Reach Deepwater Channel Regulation Project. Port Waterway. Eng. 2014, 11–17. (In Chinese) [Google Scholar]
  8. Kumar, A.; Ojha, C.S.P. Review on the field applications of river training structures for river bank protection. In The Ganga River Basin: A Hydrometeorological Approach; Chauhan, M.S., Ojha, C.S.P., Eds.; Society of Earth Scientists Series; Springer: Cham, Switzerland, 2021; pp. 211–236. [Google Scholar]
  9. Le, T.B.; Crosato, A.; Arboleda, A.M. Revisiting Waal River Training by Historical Reconstruction. J. Hydraul. Eng. 2020, 146, 05020002. [Google Scholar] [CrossRef] [Scilit]
  10. Ezzeldin, R.; Saqr, A.M.; Abdelmaboud, M.E.; Tsakiris, G. Hydro-morphologic variations induced by bandal-like structures for river bank protection. Water Resour. Manag. 2026, 40, 120. [Google Scholar] [CrossRef] [Scilit]
  11. Yang, Y.; Zheng, J.; Zhang, M.; Zhu, L.; Zhu, Y.; Wang, J.; Zhao, W. Sandy riverbed shoal under anthropogenic activities: The sandy reach of the Yangtze River, China. J. Hydrol. 2021, 603, 126861. [Google Scholar] [CrossRef] [Scilit]
  12. Yang, Y.; Zheng, J.; Zhang, W.; Zhu, Y.; Chai, Y.; Wang, J.; Wen, Y. Quantitative relationship between channels and bars in a tidal reach of the lower Yangtze River: Implications for river management. J. Geogr. Sci. 2021, 31, 1837–1851. [Google Scholar] [CrossRef] [Scilit]
  13. Allahyonesi, H.; Omid, M.H.; Haghiabi, A.H. A study of the effects of the longitudinal arrangement sediment behavior near intake structures. J. Hydraul. Res. 2008, 46, 814–819. [Google Scholar] [CrossRef] [Scilit]
  14. Chauhan, V.; Singhal, G.D.; Chavan, R. A review of sediment deflection in rivers using submerged vanes. ISH J. Hydraul. Eng. 2023, 29, 514–530. [Google Scholar] [CrossRef] [Scilit]
  15. Solanki, K.; Sharma, H.; Joshi, N. Flow and parameter optimization of tapered vane. J. Ecohydraulics 2023, 8, 13–25. [Google Scholar] [CrossRef] [Scilit]
  16. Keshavarzi, A.; Valizadeh, M.; Ball, J. Experimental study of the effects of submerged dikes on the energy and momentum coefficients in compound channel. Engineering 2010, 2, 855–862. [Google Scholar] [CrossRef]
  17. Guguloth, S.; Chaudhuri, A.R.; Shafighi, N.; Kumar, S. Influence of submergence ratio on scour morphology around spur dike: Experimental and numerical analysis. Acta Geophys. 2025, 73, 6051–6066. [Google Scholar] [CrossRef] [Scilit]
  18. Zhang, X.B.; Lu, J.Y.; Lin, M.S. Analysis on evolution of Hechangzhou anabranching channel and effect of the left anabranch inlet control project. Yangtze River 2009, 40, 1–3, 6. (In Chinese) [Google Scholar] [CrossRef]
  19. Liu, X.B.; Lin, M.S.; Li, Z.Q. River channel evolution and regulation study of Zhenjiang-Yangzhou reach in the lower Yangtze River. J. Yangtze River Sci. Res. Inst. 2011, 28, 1–9. Available online: http://ckyyb.crsri.cn/CN/Y2011/V28/I11/1 (accessed on 28 August 2026). (In Chinese)
  20. Wang, A.C. Specialized research on bank protection for the Hechangzhou waterway regulation project in the lower Yangtze River. Yangtze River 2018, 49, 1–5. (In Chinese) [Google Scholar] [CrossRef]
  21. Hu, Y.; Ma, A.X.; Cao, M.X.; Huang, M.Y.; Cai, J.D. Study on construction sequence of flow-limiting submerged dikes in Hechangzhou branching channel. Port Waterw. Eng. 2018, 5, 8–15. (In Chinese) [Google Scholar] [CrossRef]
  22. Kou, J. Construction sequencing and implementation effectiveness of deep-water, high-velocity submerged dikes in the Hechangzhou waterway. Port Waterw. Eng. 2019, 7, 1–8. (In Chinese) [Google Scholar] [CrossRef]
  23. Xing, M.H.; Zhu, H.; He, J.; Tao, J.F.; Wang, M.M.; Luo, Q. Analysis on the River Regime Evolution Characteristics and Scour-deposition Mechanism of the Yangtze River Bagazhou Reach Under Extreme Floods. Water Resources and Power, (In Press). Available online: https://sdny.cbpt.cnki.net/portal/journal/portal/client/paper/df396f73c19e6a67e8274e703a4edcc4 (accessed on 28 August 2026). (In Chinese)
  24. Hang, J.G.; Zhang, Z.F.; Wang, G.Q. Research on training structures of the Hechangzhou anabranch in the lower Yangtze River. J. Yangtze River Sci. Res. Inst. 2010, 27, 6–13. Available online: http://ckyyb.crsri.cn/CN/Y2010/V27/I9/6 (accessed on 28 August 2026). (In Chinese)
  25. Shen, Z.P.; Qiao, W.; Yang, G.R. Experimental study on river engineering model for river regime control project of Shiyezhou anabranch channel of the Yangtze River. Express Water Resour. Hydropower Inf. 2016, 37, 37–41. (In Chinese) [Google Scholar] [CrossRef]
  26. Yang, Z.; Wang, H.; Saito, Y.; Milliman, J.D.; Xu, K.; Qiao, S.; Shi, G. Dam impacts on the Changjiang (Yangtze) River sediment discharge to the sea: The past 55 years and after the Three Gorges Dam. Water Resour. Res. 2006, 42, W04407. [Google Scholar] [CrossRef] [Scilit]
  27. Cheng, J.X.; Xu, L.G.; Fan, H.X. Changes in the flow regimes associated with climate change and human activities in the Yangtze River. River Res. Appl. 2019, 35, 1415–1427. [Google Scholar] [CrossRef] [Scilit]
  28. Guo, L.C.; Su, N.; Zhu, C.Y. How have the river discharges and sediment loads changed in the Changjiang River basin downstream of the Three Gorges Dam? J. Hydrol. 2018, 560, 259–274. [Google Scholar] [CrossRef] [Scilit]
  29. Fan, H.X.; Wang, J.Z.; Zhu, L.J. Evolution analysis of the Hechangzhou anabranch under new hydro-sediment conditions and regulation interventions. Hydro-Sci. Eng. 2021, 5, 19–26. (In Chinese) [Google Scholar] [CrossRef]
  30. Liu, K.X.; Yin, Y.F.; Wu, Q.L. Defects and reinforcement measures during operation of the inlet control project in the left anabranch of Hechangzhou. China Water Transp. 2012, 12, 169–170. (In Chinese) [Google Scholar] [CrossRef]
  31. Yan, J.B.; Yin, H.; Yang, Y.P. Study on bar and channel evolution and flow-sediment channel forming mechanism of Hechangzhou waterway in the lower Yangtze River. Water Resour. Power 2022, 40, 41–44. Available online: https://d.wanfangdata.com.cn/periodical/sdnykx202204010 (accessed on 28 August 2026). (In Chinese)
  32. GB/T 42640‑2023; Specification for Underwater Topographic Survey by Multibeam Echosounding System. Standards Press of China: Beijing, China, 2023. Available online: https://openstd.samr.gov.cn/bzgk/std/newGbInfo?hcno=FB19C59F9C651E15A49327B5B48E81F8 (accessed on 28 August 2026).
  33. Han, X.J.; Fan, D.D.; Tu, J.B.; Meng, L.P.; Huang, J.; Chen, S.L. Cumulative impact of human activities on hydro-sediment dynamics and morphodynamics in the highly altered Yangtze Estuary. J. Hydrol. 2025, 648, 132625. [Google Scholar] [CrossRef] [Scilit]
  34. Reid, D.; Church, M. Geomorphic and Ecological Consequences of Riprap Placement in River Systems. J. Am. Water Resour. Assoc. 2015, 51, 1043–1059. [Google Scholar] [CrossRef] [Scilit]
  35. Carbonari, C.; Recking, A.; Solari, L. Morphology, Bedload, and Sorting Process Variability in Response to Lateral Confinement: Results From Physical Models of Gravel-Bed Rivers. J. Geophys. Res. Earth Surf. 2020, 125, e2020JF005773. [Google Scholar] [CrossRef] [Scilit]
  36. Gao, Y.; Lv, Y.; Li, Y.; Pan, S. Hydraulic Geometry and Theory of Equilibrium Water Depth of Branching River. Water 2023, 15, 430. [Google Scholar] [CrossRef] [Scilit]
  37. Zhang, G.Y.; Tan, G.M.; Zhang, W.; Yin, Z.; Wang, J.W. Characteristics and causes of shoal-channel adjustment in Wuhan reach under the superposition of scouring and regulation projects. Adv. Water Sci. 2024, 35, 629–644. (In Chinese) [Google Scholar] [CrossRef]
  38. Yang, Y.P.; Zheng, J.H.; Wang, J.J.; Liu, W.L.; Zhu, L.L. Evolution of Shoal-Group Linkage in the Daijiazhou Section of the Middle Yangtze River and Its Response Mechanism to Channel Engineering. Adv. Water Sci. 2024, 35, 830–842. (In Chinese) [Google Scholar] [CrossRef]
  39. Rhoads, B.L. 3-D flow and scour near a submerged wing dike: ADCP measurements on the Missouri River. Water Resour. Res. 2011, 47, W09524. [Google Scholar] [CrossRef] [Scilit]
  40. Li, Z.Q.; Li, H.; Li, J.; Li, R. Experimental study and numerical simulation of free water surface near overflow spur dike. J. Hydraul. Eng. 2003, 34, 53–57. [Google Scholar] [CrossRef]
  41. Dou, Z.; Zhang, Z.F. Impacts of submerged dike group in the left anabranch of the Hechangzhou on channel evolution. J. Yangtze River Sci. Res. Inst. 2012, 29, 21–27. (In Chinese) [Google Scholar] [CrossRef]
  42. Changjiang Water Resources Commission. Yangtze River Basin Sediment Bulletin (2018–2025); Changjiang Water Resources Commission: Wuhan, China, 2025. Available online: http://www.cjw.gov.cn/zwzc/zjgb/ (accessed on 28 August 2026). (In Chinese)
  43. Wei, X.L.; Dai, J.Q.; Zuo, L.Q.; Lu, Y.J.; Yang, H.Y.; Lu, Y.; Huang, T.J.; Lu, A.P.; Yuan, S.Y. Preliminary experimental study on generalized model of instability mechanism of soft mattress protecting shoal under flow erosion. J. Basic Sci. Eng. 2024, 32, 773–786. (In Chinese) [Google Scholar] [CrossRef]
Figure 1. Sketch map of the study area, showing the location of submerged dikes, deep channels, and cross-sections.
Water 18 02176 g001
Figure 2. Variation in flow division ratio of the left anabranch of the Hechangzhou Reach (2002–2025). The blue line with asterisk markers represents the flow division ratio of the left anabranch in different periods, and the red dashed lines denote the commencement timings of two key river‑training structures.
Water 18 02176 g002
Figure 3. Planform variations in key deep channel boundaries in the right anabranch (2018–2026).
Water 18 02176 g003
Figure 4. Spatial patterns of scour and deposition of the −30 m deep channel in the right anabranch during four periods: (a) the normal-flow period (2018–2020); (b) the flood period (2020–2021); (c) the post-flood recovery period (2021–2024); (d) the low-flow period (2024–2026).
Water 18 02176 g004
Figure 5. Planform variations in key deep channel boundaries between SD1 and SD2 (2018–2026).
Water 18 02176 g005
Figure 6. Planform variations in key deep channel boundaries between SD2 and SD3 (2018–2026).
Water 18 02176 g006
Figure 7. Spatial patterns of scour and deposition of the −40 m and −35 m deep channels between SD1 and SD2 during four periods: (a) the normal-flow period (2018–2020); (b) the flood period (2020–2021); (c) the post-flood recovery period (2021–2024); (d) the low-flow period (2024–2026).
Water 18 02176 g007aWater 18 02176 g007b
Figure 8. Spatial patterns of scour and deposition of the −30 m deep channel between SD2 and SD3 during four periods: (a) the normal-flow period (2018–2020); (b) the flood period (2020–2021); (c) the post-flood recovery period (2021–2024); (d) the low-flow period (2024–2026).
Water 18 02176 g008
Figure 9. Cross-section change diagrams of the left and right anabranches of Hechangzhou (2018–2024): (a) left anabranch cross-section; (b) right anabranch cross-section.
Water 18 02176 g009
Table 1. Structural Parameters of Submerged Dikes SD1–SD3.
No.Dike Length (m)Crest Elevation (m)Crest Width (m)Upstream SlopeDownstream Slope
SD11102−3~−20101:2.51:3
SD218174~−1881:2.51:3
SD319194~−1881:2.51:3
Table 2. Underwater topography and monthly sediment load of the Hechangzhou anabranch.
DateMonthly Runoff Volume (108 m3)Monthly Sediment
Load (106 t)
Previous-Year Total Annual Runoff Volume (108 m3)Previous-Year Total Annual Sediment Load (×108 t)
March 20185033.393781.04
February 20204882.793341.05
March 20215242.511,1801.64
March 20245462.267200.445
March 2026//69660.54
Note: The “Previous-year total annual” variables represent hydrological totals of the preceding calendar year and are not monthly values for the corresponding row.
Disclaimer/Publisher’s Note: The statements, opinions and data contained in all publications are solely those of the individual author(s) and contributor(s) and not of MDPI and/or the editor(s). MDPI and/or the editor(s) disclaim responsibility for any injury to people or property resulting from any ideas, methods, instructions or products referred to in the content.