Article

A Biofloc Technology–Microbial Fuel Cell Coupled System for Enhanced Water Purification, Biofloc Regulation and Energy Recovery in Aquaculture


School of Agricultural Engineering, Jiangsu University, Zhenjiang 212013, China
*
Author to whom correspondence should be addressed.
Water 2026, 18(17), 2115; https://doi.org/10.3390/w18172115
Submission received: 13 July 2026 / Revised: 21 August 2026 / Accepted: 26 August 2026 / Published: 27 August 2026
(This article belongs to the Special Issue Water Quality Management in Aquaculture Systems)

Highlights

What are the main findings?
  • A novel BFT–MFC system integrated water purification, biofloc regulation, and energy recovery.
  • MFC integration reduced TN accumulation and stabilized TOC during continuous operation.
  • The coupled system reduced biofloc accumulation without compromising water-quality regulation.
  • Autonomous electricity generation reached 295.9 mV and 1716.8 mW m−2.
What are the implications of the main findings?
  • BFT–MFC coupling provides a new strategy for improving carbon utilization in biofloc systems.
  • The coupled system may help reduce nitrogen accumulation and excessive biofloc growth.
  • Bioelectrochemical integration enables simultaneous wastewater treatment and bioenergy recovery.
  • The system shows potential as a sustainable technology for recirculating aquaculture.

Abstract
Low organic carbon utilization efficiency is a core bottleneck restricting the application of biofloc technology (BFT) in intensive aquaculture, accompanied by limited total nitrogen removal, excessive biofloc accumulation, and underutilized chemical energy in organic wastes. To address this issue, this study develops a novel biofloc technology–microbial fuel cell (BFT-MFC) coupled system that exploits surplus carbon sources in BFT as electron donors for bioelectricity generation while synergistically enhancing water purification performance. Compared with a conventional standalone BFT system, the coupled system was systematically evaluated in terms of water quality regulation, biofloc control and electricity generation performance. Results showed that the BFT-MFC system maintained relatively stable dissolved oxygen, pH, and temperature throughout the operation period. The ammonia nitrogen concentration remained relatively low in the BFT-MFC system, although a transient increase to approximately 0.35 mg/L occurred around day 20 before subsequently declining, and total nitrogen fluctuated within 4.29–12.87 mg/L, with substantially less accumulation than that observed in the BFT system, in contrast to the control group, where TN continuously rose to a peak of 23.55 mg/L. Total organic carbon was stabilized within a narrower range of 150–245 mg/L, compared with the wide fluctuation of 129.6–360 mg/L in the single BFT system. Additionally, the coupled system exhibited lower net biofloc accumulation based on floc-volume measurements, while maintaining effective water-quality regulation, and the integrated MFC delivered a maximum output voltage of 295.9 mV and a peak power density of 1716.8 mW m−2. Overall, the BFT-MFC coupled system integrates wastewater purification, biofloc regulation and energy recovery into a single unit, offering a promising sustainable strategy for industrial recirculating aquaculture.

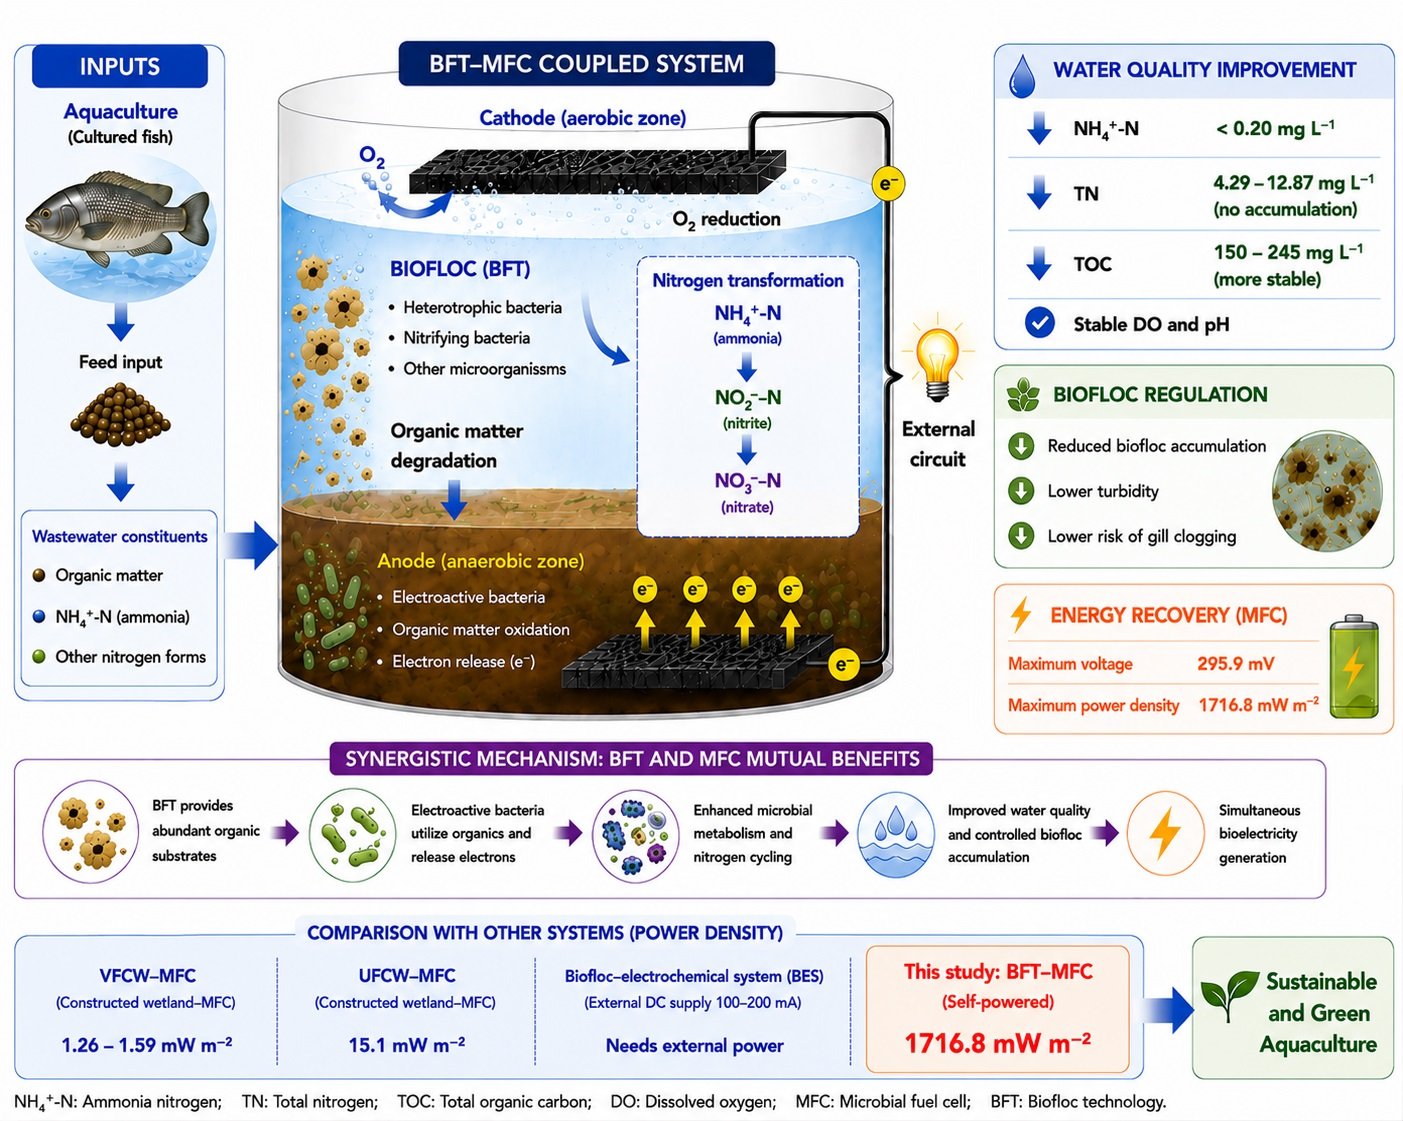
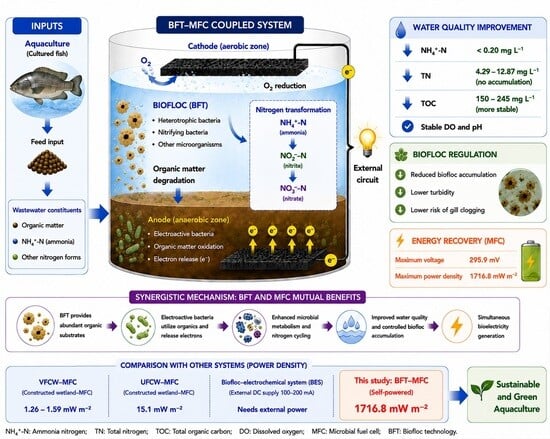
Graphical Abstract

1. Introduction

With the continuous growth of the global population and increasing demand for high-quality animal protein, aquaculture has become one of the fastest-growing food production sectors worldwide, playing a crucial role in ensuring food security, promoting economic development, and improving human nutrition [1]. However, to meet rising market demand, aquaculture systems have increasingly shifted toward intensive, high-density production practices. In addition to production efficiency and environmental sustainability, the quality and safety of aquatic products have also received increasing attention. For example, the occurrence of antibiotic residues in aquatic products, including tilapia, has raised concerns regarding food safety and has promoted the development of sensitive analytical methods for residue detection [2]. Under such conditions, large amounts of feed inputs result in the accumulation of uneaten feed, feces, and metabolic waste in the culture environment, leading to elevated concentrations of ammonia nitrogen, nitrite nitrogen, and organic matter [3]. These deteriorating water quality conditions increase physiological stress and disease susceptibility in cultured organisms [4,5]. Furthermore, conventional aquaculture systems generally rely on frequent water exchange to maintain acceptable water quality levels, which not only consumes substantial water resources but also releases nutrient-rich effluents containing high levels of nitrogen and phosphorus into surrounding aquatic environments, thereby contributing to eutrophication and other ecological problems [6]. In recent years, with increasing emphasis on green aquaculture and circular economy concepts, achieving sustainable aquaculture production through wastewater reduction, resource recycling, and environmentally friendly management practices while maintaining high productivity has become a major challenge for the long-term development of the aquaculture industry [7]. Meanwhile, the development of sustainable aquaculture also requires the exploration of environmentally friendly and biologically compatible technologies and materials that can support aquaculture production while minimizing potential environmental risks [8].
Biofloc technology (BFT) is a water-quality management strategy that promotes microbial assimilation and transformation of inorganic nitrogen by maintaining an appropriate carbon-to-nitrogen ratio and continuous aeration [9,10,11]. The resulting bioflocs can provide an additional nutritional resource for cultured organisms while reducing dissolved nitrogen accumulation and water-exchange requirements [12]. However, conventional BFT systems may suffer from excessive biofloc accumulation, inefficient utilization of organic carbon, and limited denitrification, which can lead to nitrogen accumulation during prolonged operation [13]. Excessive accumulation of bioflocs has also been recognized as a practical challenge in intensive and recirculating BFT systems, often requiring additional solid-separation or floc-management units to maintain an appropriate biofloc concentration [14]. These limitations highlight the need for complementary technologies that can enhance carbon utilization and nitrogen removal, providing a rationale for integrating microbial fuel cell (MFC) technology with BFT.
Although BFT has demonstrated significant advantages in reducing water exchange, improving feed utilization efficiency, and maintaining water quality in aquaculture systems [9,15], several limitations still hinder its wider application [16,17]. Chief among these limitations is low carbon source utilization efficiency, the core bottleneck that drives relatively high operational costs [18], alongside secondary drawbacks including insufficient system stability, excessive biofloc accumulation with elevated water turbidity, and increased gill clogging risk in cultured organisms [19]. In addition, conventional BFT systems primarily rely on heterotrophic assimilation and nitrification for nitrogen removal, while denitrification processes are often limited, resulting in the gradual accumulation of total nitrogen (TN) [20]. Furthermore, the organic carbon and chemical energy stored within the system are not effectively recovered or utilized [21]. Therefore, the development of novel integrated technologies capable of enhancing carbon source utilization efficiency, improving system stability, controlling excessive biofloc growth, and achieving resource recovery has become an important research direction in the advancement of BFT. In parallel with the continuous advancement of biological treatment technologies, a diverse array of novel aquaculture technologies has garnered growing research attention, aimed at enhancing the management precision and operational stability of aquaculture systems [22,23,24].
To address the core limitations of standalone BFT systems, microbial fuel cell (MFC) technology offers a mechanistically sound coupling strategy that integrates pollutant degradation with bioenergy recovery. Driven by electroactive microorganisms, MFC converts the chemical energy of organic wastes directly into bioelectricity via extracellular electron transfer, achieving simultaneous water purification and energy harvesting without external energy input [25,26]. The synergy of the BFT–MFC system centers on improving carbon utilization efficiency: the surplus dissolved organic carbon in BFT—otherwise underutilized and prone to large fluctuations—acts as a sustained electron donor for anodic electroactive bacteria, supporting stable electricity generation while accelerating organic carbon turnover and substantially elevating carbon source utilization efficiency [27]. Concurrently, the localized anoxic anode niche provides a potentially complementary strategy in aerobic BFT to curb total nitrogen accumulation [28], electrode-colonized biofilms mitigate excessive suspended biofloc growth, and electrochemically enhanced metabolism reinforces overall system stability [29,30]. This integrated design thus combines multiple functions in a single unit, providing an efficient and sustainable solution for intensive recirculating aquaculture.
Recent studies have begun to explore the integration of biofloc technology with electrochemical processes for aquaculture water management. For example, a recent biofloc–electrochemical system was reported to improve nitrogen and phosphorus removal under an externally applied microcurrent, demonstrating the potential of electrochemical regulation to enhance BFT performance [31]. However, such externally driven electrochemical systems differ fundamentally from microbial fuel cells, in which organic substrates are biologically oxidized to generate electrical energy without continuous external power input. In particular, the long-term effects of MFC integration on nitrogen accumulation, organic carbon dynamics, biofloc development, and simultaneous electricity recovery under continuous aquaculture operation remain insufficiently characterized. Previous studies have shown that aquaculture mode can influence not only the production environment but also the physicochemical characteristics and subsequent quality stability of tilapia, highlighting the importance of developing sustainable and well-controlled aquaculture systems [32]. Therefore, this study established a directly coupled BFT–MFC aquaculture system and compared its long-term performance with that of a conventional BFT system. The objectives were to (i) evaluate the effects of MFC integration on nitrogen species and organic carbon dynamics; (ii) characterize the electricity generation performance of the coupled system during long-term aquaculture operation; and (iii) assess whether MFC integration could improve water quality stability while simultaneously enabling bioelectricity recovery. By integrating water quality regulation and energy recovery within a single aquaculture system, this study provides experimental evidence for the potential of BFT–MFC coupling as a resource-recovery strategy for sustainable aquaculture.

2. Materials and Methods

2.1. Reactor Configurations and Operations

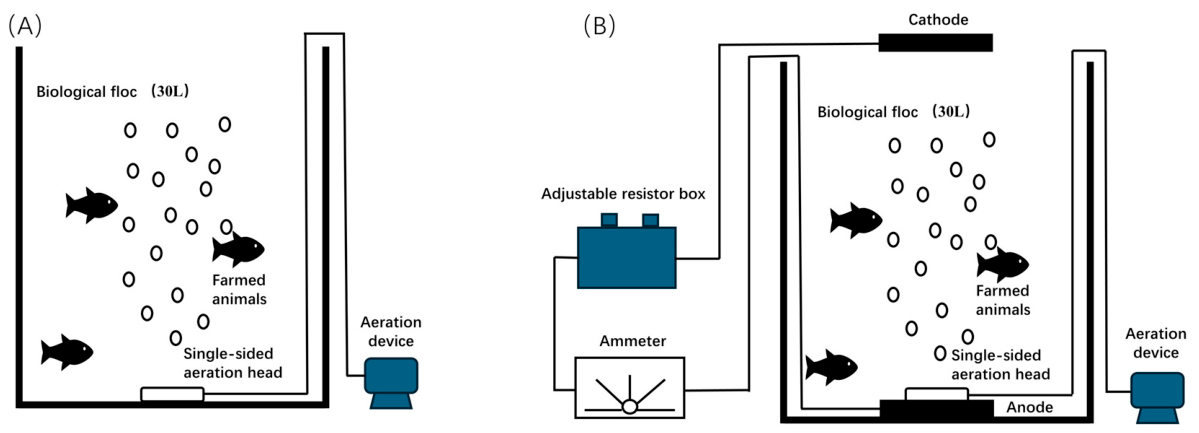
The experiment was conducted from 14 October to 25 December 2025 at the Intelligent Aquaculture Equipment Laboratory of Jiangsu University. The experimental setup consisted of two acrylic cylindrical reactors: one served as the control system (a single BFT system), and the other served as the experimental system (a BFT–MFC coupled system). Each reactor had a diameter of 400 mm, a height of 300 mm, a wall thickness of 5 mm, and an effective working volume of 20 L (see Figure 1). One reactor was operated for each system because the present study was designed as a preliminary laboratory-scale evaluation of the newly developed BFT–MFC coupled configuration. Therefore, the two reactors represented two different system configurations rather than independent biological replicates, and the experiment was primarily intended to compare their operational performance under the same experimental conditions.
For the BFT–MFC coupled system, the anode was installed at the bottom of the reactor, and a single-sided aerator was placed above it to provide upward aeration [33]. This configuration created a relatively anaerobic microenvironment around the anode, which was favorable for microbial oxidation reactions [34]. Carbon felt was used as the electrode material. The electrodes had dimensions of 15 cm × 15 cm × 1 cm (length × width × thickness), with an inter-electrode distance of 20 cm between the anode and cathode. Prior to use, the electrodes were pretreated following a standardized procedure: they were first immersed in anhydrous ethanol for 30 min and rinsed with deionized water; then treated in 0.1 mol/L hydrochloric acid solution at 80–100 °C for 30 min and rinsed with deionized water until the effluent reached neutral pH; subsequently dried in an oven at 80 °C for 24 h; and finally, both the anode and cathode were soaked in biofloc suspension for 48 h to achieve microbial colonization on the electrode surfaces. During routine operation, the external resistance was set at 1000 Ω. When plotting polarization and power density curves, the resistance was adjusted as needed, and the current generated by the MFC was monitored using an ammeter.
Tap water was used as the experimental water source and was left standing for 24 h before use to remove residual chlorine. The bioflocs used in the experiment were cultivated in-house using the following method: brown sugar and a bacterial consortium containing Bacillus subtilis were inoculated into the water. The temperature was maintained at 10–20 °C, and dissolved oxygen (DO) was maintained above 5 mg/L, and carbon and nitrogen sources were replenished regularly. The carbon source was glucose, and the nitrogen source was feed, maintaining a C/N of 15:1 to provide suitable living conditions for the microorganisms in the flocs. Stable bioflocs were obtained after 15 days of cultivation. Before the experiment, the cultivated bioflocs were inoculated into the two reactors, ensuring that the amount of flocs in both reactors was as equal as possible [35]. Throughout the experiment, the aquaculture water in both reactors was not replaced; only water lost due to sampling and natural evaporation was replenished.
No live tilapia were stocked in the reactors during the experiment. Instead, this study was designed as a laboratory-scale simulation to evaluate the performance of the BFT and BFT-MFC systems under tilapia aquaculture-related nutrient loading conditions. The experimental nutrient input was established using theoretical stocking density, commercial tilapia feed, and carbon supplementation rather than through actual fish culture. Therefore, the stocking density used in this study served only as a theoretical reference for estimating the simulated nutrient load. The reactor was initially inoculated with aquaculture water containing bioflocs, and a theoretical tilapia stocking density of 2 kg/m3 was used to establish the simulated culture conditions. Commercial extruded tilapia feed (Tongwei Aquatic Feed) was used, with a guaranteed composition of ≥31% crude protein, ≤12% crude fiber, ≥5% crude lipid, ≤15% crude ash, ≥1% total phosphorus, ≤12.5% moisture, and ≥1.6% lysine. The daily feeding rate was set at 4% of fish body weight. Based on the reported estimate that approximately 62% of total nitrogen (TN) from tilapia feed is released into the culture environment [36], the corresponding feed input under the simulated aquaculture conditions was calculated as 1.488 g d−1 per reactor.
For carbon-to-nitrogen (C/N) ratio regulation, the nitrogen content of the feed was estimated from its crude protein content (31%), assuming that protein contains approximately 16% nitrogen. Thus, the feed nitrogen content was calculated as 31% × 16% = 4.96%. Given that glucose contains approximately 40% carbon, maintaining a target C/N ratio of 15 required 1.86 g glucose per gram of feed, calculated as (1 × 31% × 16% × 15)/40%. Accordingly, 1.488 g feed d−1 and 2.768 g glucose d−1 (1.488 × 1.86) were added to each reactor. The glucose was supplied to provide the carbon required for microbial metabolism and biofloc formation under the simulated aquaculture conditions [37].

2.2. Water Quality Analysis

DO was measured using a portable DO meter (JPB-607A, Leici, Shanghai, China); pH was measured using a portable pH meter (PHB-4, Leici, Shanghai, China); water temperature was measured using a digital thermometer (WDJ-005, Sunsun, Zhoushan, China); air temperature was measured using a mercury thermometer. During the experiment, DO, pH, and temperature were measured daily, and measurements were completed within 30 min. Before analysis, the flocculent precipitation method was used to eliminate interference caused by biofloc colour. Total ammonia nitrogen (TAN), nitrate nitrogen, and nitrite nitrogen were determined using spectrophotometry [21], while total nitrogen (TN) and total organic carbon (TOC) were measured using a TOC analyzer (TOC-L, Shimadzu, Kyoto, Japan). Ammonia nitrogen, nitrate nitrogen, and nitrite nitrogen were measured every two days during the first 48 days of the experiment, while TOC and TN were measured every two days during the final 20 days of the experiment. The time of daily measurements differed by less than 30 min.

2.3. Biofloc Volume Measurement

Floc volume was measured using the Imhoff cone method. A water sample was poured into a graduated Imhoff cone and allowed to settle for 30 min, after which the volume occupied by the settled flocs at the bottom was directly recorded and expressed in mL/L [38].

2.4. Electrochemical Measurement and Data Analysis

During long-term operation, the BFT–MFC system was continuously operated under a fixed external resistance of 1000 Ω, with the output voltage recorded at the same time each day. Upon completion of routine voltage monitoring, a dedicated polarization test was carried out: the external resistance was stepwise adjusted from 5000 Ω to 10 Ω via a resistance box to measure the voltage at each resistance level, and the corresponding voltage value was documented once the output voltage attained a steady state. The power density obtained from long-term voltage monitoring and that derived from the polarization test are regarded as two independent sets of electrochemical measurements, as the two tests were performed at different stages of reactor operation. The carbon felt anode employed in this study had dimensions of 15 cm × 15 cm × 1 cm, corresponding to a total geometric surface area of 0.051 m2.

2.4.1. Output Voltage and Current Density

A variable resistor box was connected between the anode and cathode of the MFC, with the resistance set to 1000 Ω. The output voltage of the cell was collected and recorded using a digital multimeter. Areal current density was adopted for analysis in this study [39], and its calculation formula is presented as follows:
I A = I / A = U / ( R A )
In the formula: I A is the areal current density, A/m2. U is the voltage, V. A is the anode surface area, m2. R is the external resistance, Ω.

2.4.2. Polarization and Power Density Measurements

Polarization curves and power density curves are key performance parameters for MFCs. Power is a physical quantity that represents the rate at which a cell performs work. Areal power density was employed in this study [40], and its calculation formula is given as follows:
P A = ( U I ) / A = U 2 / ( R A )
In the formula: P A is the areal power density, W/m2. U is the output voltage of the cell, V. A is the surface area of the anode, m2. R is the external resistance, Ω.
The peak of the power density curve represents the maximum power density of the system. During the polarization test, the external resistance was gradually adjusted from 5000 Ω to 10 Ω, and the corresponding voltage and current values were recorded after the system reached a stable state at each resistance. The polarization and power density curves were then constructed to evaluate the electrical performance of the BFT–MFC system, including voltage losses and power output characteristics [41].

2.5. Data Presentation and Statistical Considerations

The obtained parameters were simply analyzed and organized using Excel 2024 (Microsoft Corporation, Redmond, WA, USA). Results of measurements were reported either as individual values or as mean ± standard deviation when repeated analytical measurements were performed. Since each experimental condition was operated using a single reactor, the repeated measurements represent technical replicates rather than independent biological replicates. Therefore, the obtained results were interpreted primarily based on the observed variation trends and comparative performance between the two systems.

2.6. Use of Generative AI in Graphical Abstract Preparation

Generative AI was used to assist in the preparation of the Graphical Abstract. The Graphical Abstract was generated using ChatGPT 5.5 (OpenAI, San Francisco, CA, USA) based on detailed instructions provided by the authors. The authors determined the scientific content, experimental configuration, and conceptual design of the figure, while the AI tool was used solely to assist with visual generation. The authors subsequently reviewed and verified the final Graphical Abstract to ensure that it accurately reflected the experimental system and findings presented in this study. No generative AI was used to generate, modify, or analyze the experimental data or scientific results reported in this manuscript.

3. Results and Discussion

3.1. Water Quality Parameters

3.1.1. Changes in DO, Temperature and pH

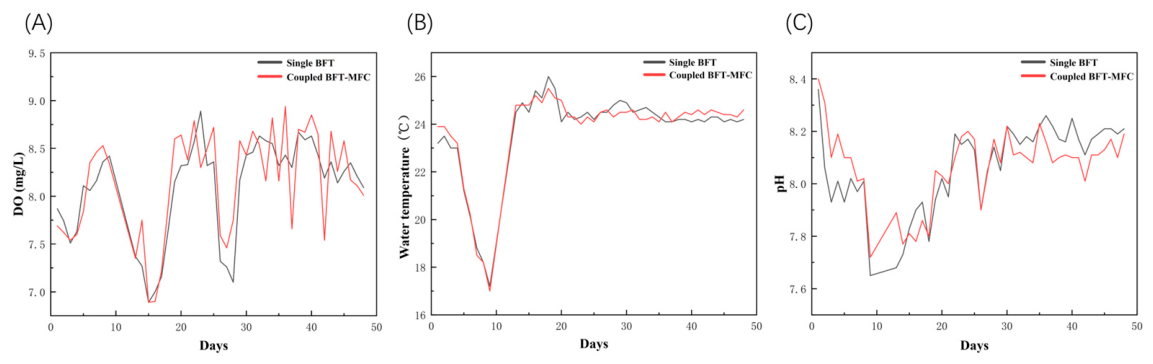
Throughout the experimental period, DO concentrations showed similar variation patterns between the two systems and remained relatively stable at a relatively high level (Figure 2A). This condition provided sufficient oxygen for the growth and metabolic activities of microorganisms [21], thereby ensuring the stable operation of the nitrification process. In terms of water temperature, the two groups maintained basically consistent levels during the experiment (Figure 2B). No heating equipment was applied during the first 10 days, and the water temperature showed a continuous decline due to weather conditions. On day 11, heating equipment was installed in the system, and the water temperature was set at 25 °C, which guaranteed that microbial metabolism and growth rates were maintained at a high-efficiency state [42]. Moreover, the pH values of both systems remained stable throughout the experimental period, with similar variation patterns observed between the two reactors, with a range of 7.7–8.7 (Figure 2C). This pH range was conducive to maintaining the activity of nitrifying bacteria [43].
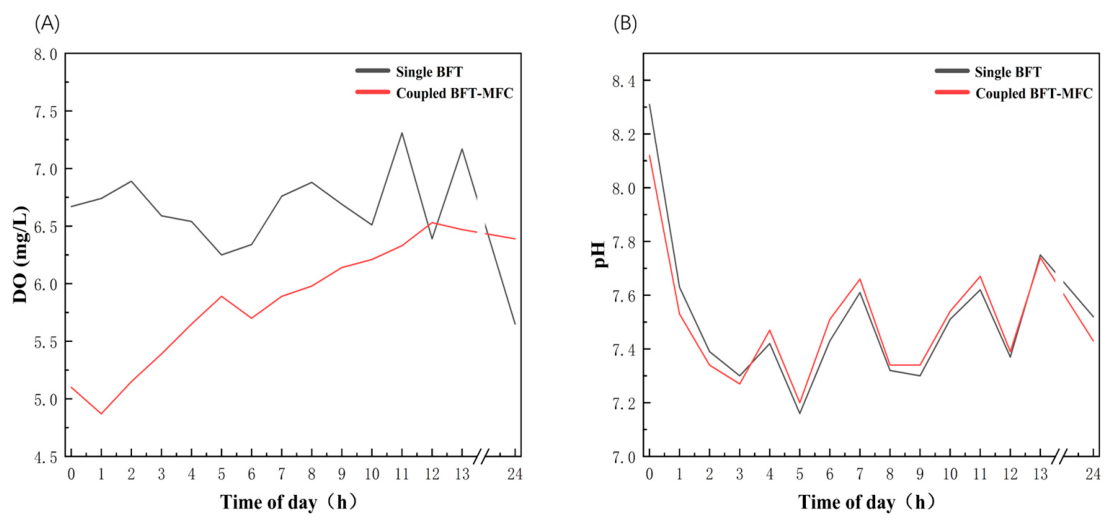
To further evaluate the short-term stability and buffering capacity of the coupled system under daily feeding disturbances, the diurnal variations in pH and DO were monitored. The diurnal variations in pH and DO in the two reactors are shown in Figure 3. The diurnal variations in pH values of the two reactors remained basically consistent and within the normal range throughout the day. After feed addition (0 h), the pH in both reactors exhibited a decline. This phenomenon was attributed to the decomposition of organic matter in the feed by bacteria. During the decomposition of these organic compounds, a significant amount of oxygen is consumed and CO2 is released. The CO2 dissolves in water to form carbonic acid. Although carbonic acid is a weak acid, its substantial accumulation directly led to the observed decrease in pH. Furthermore, acids are also generated during nitrification by bacteria, which further contributes to the decline in system pH. During the diurnal cycle, the DO content in the BFT maintained a stable level, whereas that in the BFT-MFC showed a continuous upward trend. This phenomenon may be associated with changes in microbial oxygen consumption and mass-transfer processes following feed addition. However, the specific mechanisms underlying the observed increase in DO were not directly investigated in this study [44].

3.1.2. Variations in Ammonia, Nitrite and Nitrate

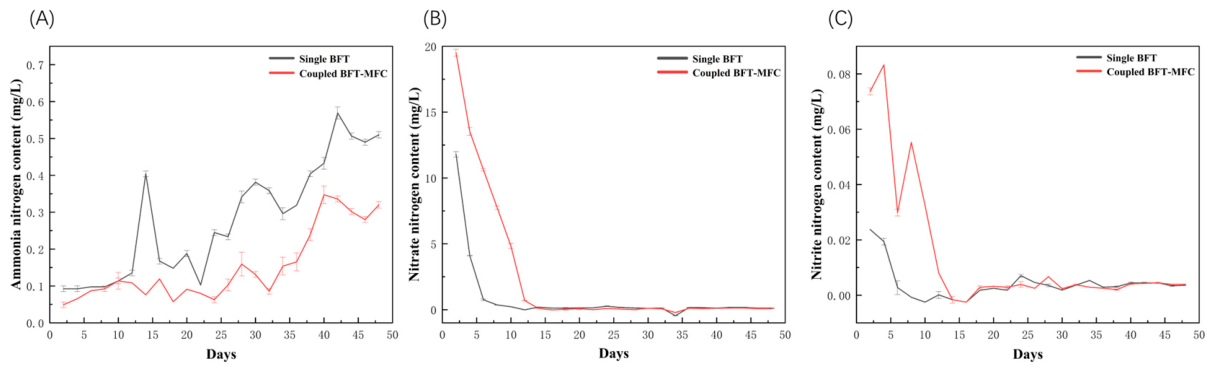
The variations in NH4+-N concentrations in the two reactors during the experimental period are presented in Figure 4A. During the initial stage of the experiment, NH4+-N concentrations in both the BFT and BFT-MFC systems remained at relatively low levels, ranging from 0.05 ± 0.008 to 0.11 ± 0.023 mg/L, with similar initial NH4+-N levels observed in both systems. From day 12 onward, the NH4+-N concentration in the single BFT system exhibited a fluctuating increasing trend, reaching a peak of 0.56 ± 0.016 mg/L on day 42 before gradually declining. In contrast, the NH4+-N concentration in the BFT-MFC system remained below 0.35 mg/L throughout the experimental period. A transient increase to approximately 0.35 mg/L was observed around day 20, after which the NH4+-N concentration declined and remained at a relatively low level. After day 12, the NH4+-N concentration in the BFT-MFC group remained lower than that in the control group throughout the experimental period. After day 12, the NH4+-N concentration in the BFT-MFC group remained lower than that in the control group throughout the experimental period.
NH4+-N is one of the major nitrogenous pollutants generated from fish metabolism, the decomposition of uneaten feed, and microbial mineralization of organic matter [45,46]. Excessive accumulation of NH4+-N can inhibit fish growth, impair immune function, and even result in mortality of cultured organisms [47]. In conventional biofloc systems, NH4+-N is primarily removed through two pathways. First, under high C/N ratio conditions, heterotrophic microorganisms directly assimilate NH4+-N into microbial biomass. Second, biological nitrification converts NH4+-N into NO2-N through the activity of ammonia-oxidizing bacteria [48]. The superior ammonia control observed in the BFT–MFC system may be associated with the combined effects of biofloc-associated microbial processes and electrode-associated microbial activity. The anode surface provides additional sites for microbial attachment and biofilm development, which may contribute to microbial retention and nitrogen transformation [49,50]. In addition, bioelectrochemical processes may have influenced microbial metabolic activity and nitrogen cycling [51]. However, the specific contribution of extracellular electron transfer to ammonia transformation was not directly quantified in this study.
Previous studies have demonstrated that bioelectrochemical systems can improve ammonia removal efficiency by stimulating microbial activity and optimizing nitrogen cycling processes [31]. Therefore, the coupled BFT-MFC system combines the advantages of efficient ammonia assimilation by bioflocs with electrochemically enhanced biodegradation. Nevertheless, the ammonia removal performance of the system may still be influenced by several operational factors, including electrode material, current density, DO concentration, and microbial community structure [52,53]. Overall, the BFT-MFC system exhibited significantly superior ammonia control performance compared with the conventional BFT system, indicating a stronger capacity to buffer fluctuations in nitrogen loading and maintain operational stability.
The variations in NO2-N concentrations in the two reactors during the experimental period are presented in Figure 4B. NO2-N concentrations in both groups remained at relatively low levels throughout the experiment, with no apparent accumulation observed. In the control group, the NO2-N concentration rapidly decreased from 0.024 ± 0.001 mg/L to nearly 0 mg/L during the initial stage and subsequently fluctuated within a narrow range of 0–0.008 ± 0.002 mg/L. This indicates that nitrification operated efficiently in the conventional BFT system, allowing nitrite produced during ammonia oxidation to be rapidly converted into nitrate. In contrast, the BFT-MFC group exhibited significantly higher NO2-N concentrations during the early stage of the experiment, reaching a peak of approximately 0.085 mg/L. Thereafter, the concentration declined rapidly and remained at a low level after day 12, gradually approaching that observed in the control group. The elevated NO2-N concentration during the initial period may be attributed to the enhancement of ammonia oxidation by the MFC. As demonstrated above, NH4+-N concentrations in the BFT-MFC system were significantly lower than those in the control group, the lower NH4+-N concentration and transient NO2-N accumulation in the BFT–MFC group suggest that ammonia oxidation may have been enhanced during the initial stage. This effect may be associated with changes in microbial activity and community structure induced by the coupled bioelectrochemical environment. When the growth and metabolic activities of nitrite-oxidizing bacteria temporarily lag those of ammonia-oxidizing bacteria, transient nitrite accumulation may occur within the system [54].
As the experiment progressed, NO2-N concentrations rapidly declined and subsequently remained at low levels, suggesting that nitrogen transformation processes became more stable over time. This finding indicates that a relatively complete and stable nitrogen transformation pathway was established in the coupled system. Although the BFT-MFC group exhibited higher NO2-N concentrations during the initial stage, the peak concentration remained well below the safety threshold for Nile tilapia culture and therefore posed no toxic effects on the cultured fish. Furthermore, this phenomenon indirectly demonstrates that the MFC may have contributed to nitrogen transformation and improved overall nitrogen cycling efficiency, thereby contributing to the long-term stability of water quality in the aquaculture system.
In summary, the BFT-MFC system did not exhibit a stronger nitrite removal capacity than the conventional BFT system. However, by promoting ammonia oxidation, the coupled system improved the overall efficiency of nitrogen cycling, resulting in more stable water quality regulation and system performance.
The variations in nitrate nitrogen (NO3-N) concentrations in the two reactors during the experimental period are shown in Figure 4C. At the beginning of the experiment, the NO3-N concentrations in the control and BFT-MFC groups were approximately 11.8 ± 0.211 mg/L and 19.5 ± 0.271 mg/L, respectively. As the culture system operated, NO3-N concentrations in both groups exhibited a rapid declining trend. In the control group, the NO3-N concentration decreased rapidly from 11.8 ± 0.211 mg/L to nearly 0 mg/L within the first 10 days. Although the initial NO3-N concentration in the BFT-MFC group was considerably higher than that in the control group, it also continuously declined and reached a low level by approximately day 12. Thereafter, NO3-N concentrations in both groups fluctuated within a narrow range of 0–0.7 ± 0.012 mg/L, with no apparent accumulation observed.
NO3-N is the final product of the nitrification process and is generally less toxic to aquatic organisms than ammonia nitrogen and nitrite nitrogen [55]. However, its long-term accumulation may adversely affect fish growth performance and increase the environmental risks associated with aquaculture effluent discharge. In conventional biofloc systems, denitrification is often limited due to the highly aerobic conditions maintained within the culture environment, resulting in the gradual accumulation of nitrate. The continuous decrease in NO3-N concentration observed in this study suggests that effective NO3-N removal pathways exist in the two systems established in this experiment, possibly including microbial assimilation, denitrification occurring in local anaerobic zones of bioflocs, and sustained nitrogen uptake and utilization by microbial communities.
Compared with the conventional BFT system, the BFT-MFC system was able to reduce NO3-N concentrations to levels comparable to those of the control group within a relatively short period despite a substantially higher initial nitrate concentration. This suggests that the coupled system had a greater capacity for nitrate buffering and transformation. Such an effect may be associated with the potentially oxygen-limited microenvironment around the MFC anode [56]. Biofilms formed on the anode surface can provide favorable conditions for the growth of denitrifying bacteria [27], the observed nitrate removal may be associated with the localized low-oxygen or anaerobic microenvironments around the anode and within biofilms. Electrode-associated microbial processes may have contributed to nitrogen transformation [57]. In addition, biofilm development on the electrode surface increases the available habitat for microorganisms, facilitating the establishment of a more complex and stable nitrogen-cycling microecosystem.
Notably, although the initial NO3-N concentration in the BFT-MFC group was approximately 1.7 times higher than that of the control group, both systems ultimately achieved comparable nitrate removal performance. This result suggests that the BFT-MFC system was capable of effectively regulating nitrate under the tested conditions despite the higher initial nitrate concentration. Overall, the introduction of MFC technology not only enhanced nitrogen cycling within the system but also reduced the risk of nitrate accumulation in aquaculture water, thereby contributing to improved water quality stability and supporting the long-term operation of recirculating aquaculture systems.

3.1.3. Changes in TN and TOC

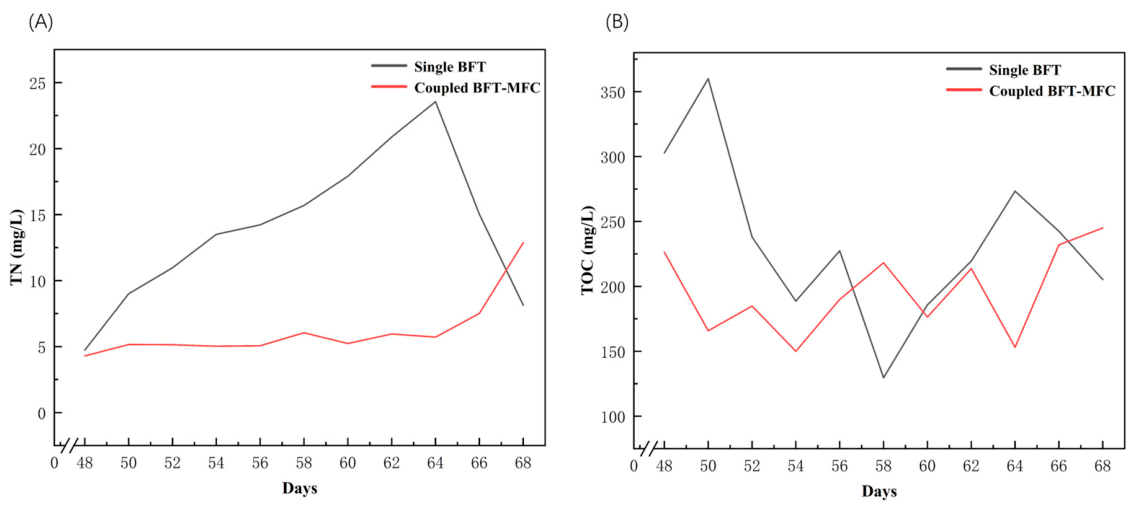
At the beginning of the experiment, TN concentrations in both systems were relatively low, measuring 4.73 mg/L in the BFT group and 4.29 mg/L in the BFT-MFC group (Figure 5A). As the culture system operated, TN concentrations in the control group exhibited a continuous increasing trend, rising from the initial level to 23.55 mg/L by day 66, followed by a slight decline. In contrast, TN concentrations in the BFT-MFC group remained relatively low throughout the experimental period, fluctuating only between 4.29 and 12.87 mg/L, without obvious accumulation observed.
TN serves as a key indicator for evaluating nitrogen accumulation and removal efficiency in aquaculture systems, encompassing multiple nitrogen forms including ammonia nitrogen, nitrite nitrogen, nitrate nitrogen, and organic nitrogen [58]. The continuous increase in TN in the control group indicates that the nitrogen input rate exceeded the removal rate, resulting in gradual nitrogen accumulation. By contrast, the ability of the BFT-MFC system to maintain low TN levels over an extended period suggests the establishment of more efficient nitrogen cycling and removal pathways.
The lower TN accumulation observed in the BFT-MFC system may be associated with improved overall nitrogen transformation and retention processes. The localized low-oxygen environment near the anode could potentially provide favorable conditions for denitrification [59], while the electrode surface may serve as an additional microbial attachment interface [56]. However, because denitrification rates and functional genes were not directly measured, the specific contribution of anode-associated denitrification cannot be quantitatively determined in the present study.
Collectively, the BFT-MFC system effectively suppressed nitrogen accumulation in the culture water, suggesting stronger buffering capacity against nitrogen accumulation under the tested experimental conditions, indicating that the coupled technology provides a clear advantage for enhancing nitrogen removal in recirculating aquaculture systems [60].
The variations in TOC concentrations in the two reactors during the experimental period are shown in Figure 5B. Throughout the experiment, TOC concentrations in both systems exhibited fluctuating trends; however, the magnitude of fluctuation differed markedly between the two groups. In the control group, TOC concentrations varied substantially within a range of 129.6–360 mg/L, indicating considerable instability in organic matter accumulation and transformation processes. In contrast, TOC concentrations in the BFT-MFC system were maintained primarily between 150 and 245 mg/L, exhibiting a narrower fluctuation range and greater overall stability. TOC is an important indicator reflecting the accumulation of organic matter in aquaculture systems, mainly originating from uneaten feed, microbial metabolites, and organic residues [61]. The pronounced fluctuations observed in the conventional BFT system suggest that the rates of organic matter production and degradation were not consistently balanced, whereas the relatively stable TOC levels in the BFT-MFC system indicate an enhanced capacity to buffer variations in organic loading.
The relatively stable TOC concentrations in the coupled system may be associated with the combined effects of biofloc microbial activity and electrode-associated microbial colonization [29]. Previous studies have demonstrated that electroactive microorganisms can utilize organic compounds as electron donors and convert part of the chemical energy stored in organic matter into electrical energy through extracellular electron transfer, thereby accelerating organic matter degradation and reducing carbon accumulation within the system [62]. Meanwhile, the electrode surface provides additional attachment sites for microbial colonization, facilitating biofilm formation and improving microbial substrate utilization efficiency [63]. Similar findings have been reported in bioelectrochemical wastewater treatment systems, where MFC integration has been reported to influence organic carbon removal and system stability through bioelectrochemical and microbial processes [64]. Although TOC concentrations in the BFT-MFC group were slightly higher than those in the control group during the later stage of the experiment, the overall fluctuation range remained considerably smaller. This result suggests that the coupled system possessed superior organic carbon regulation capability and operational stability. A relatively stable organic carbon environment is beneficial for maintaining microbial community structure, supporting nitrification and denitrification processes, and ultimately contributing to the long-term stable operation of aquaculture systems.

3.2. Floc Volume Changes

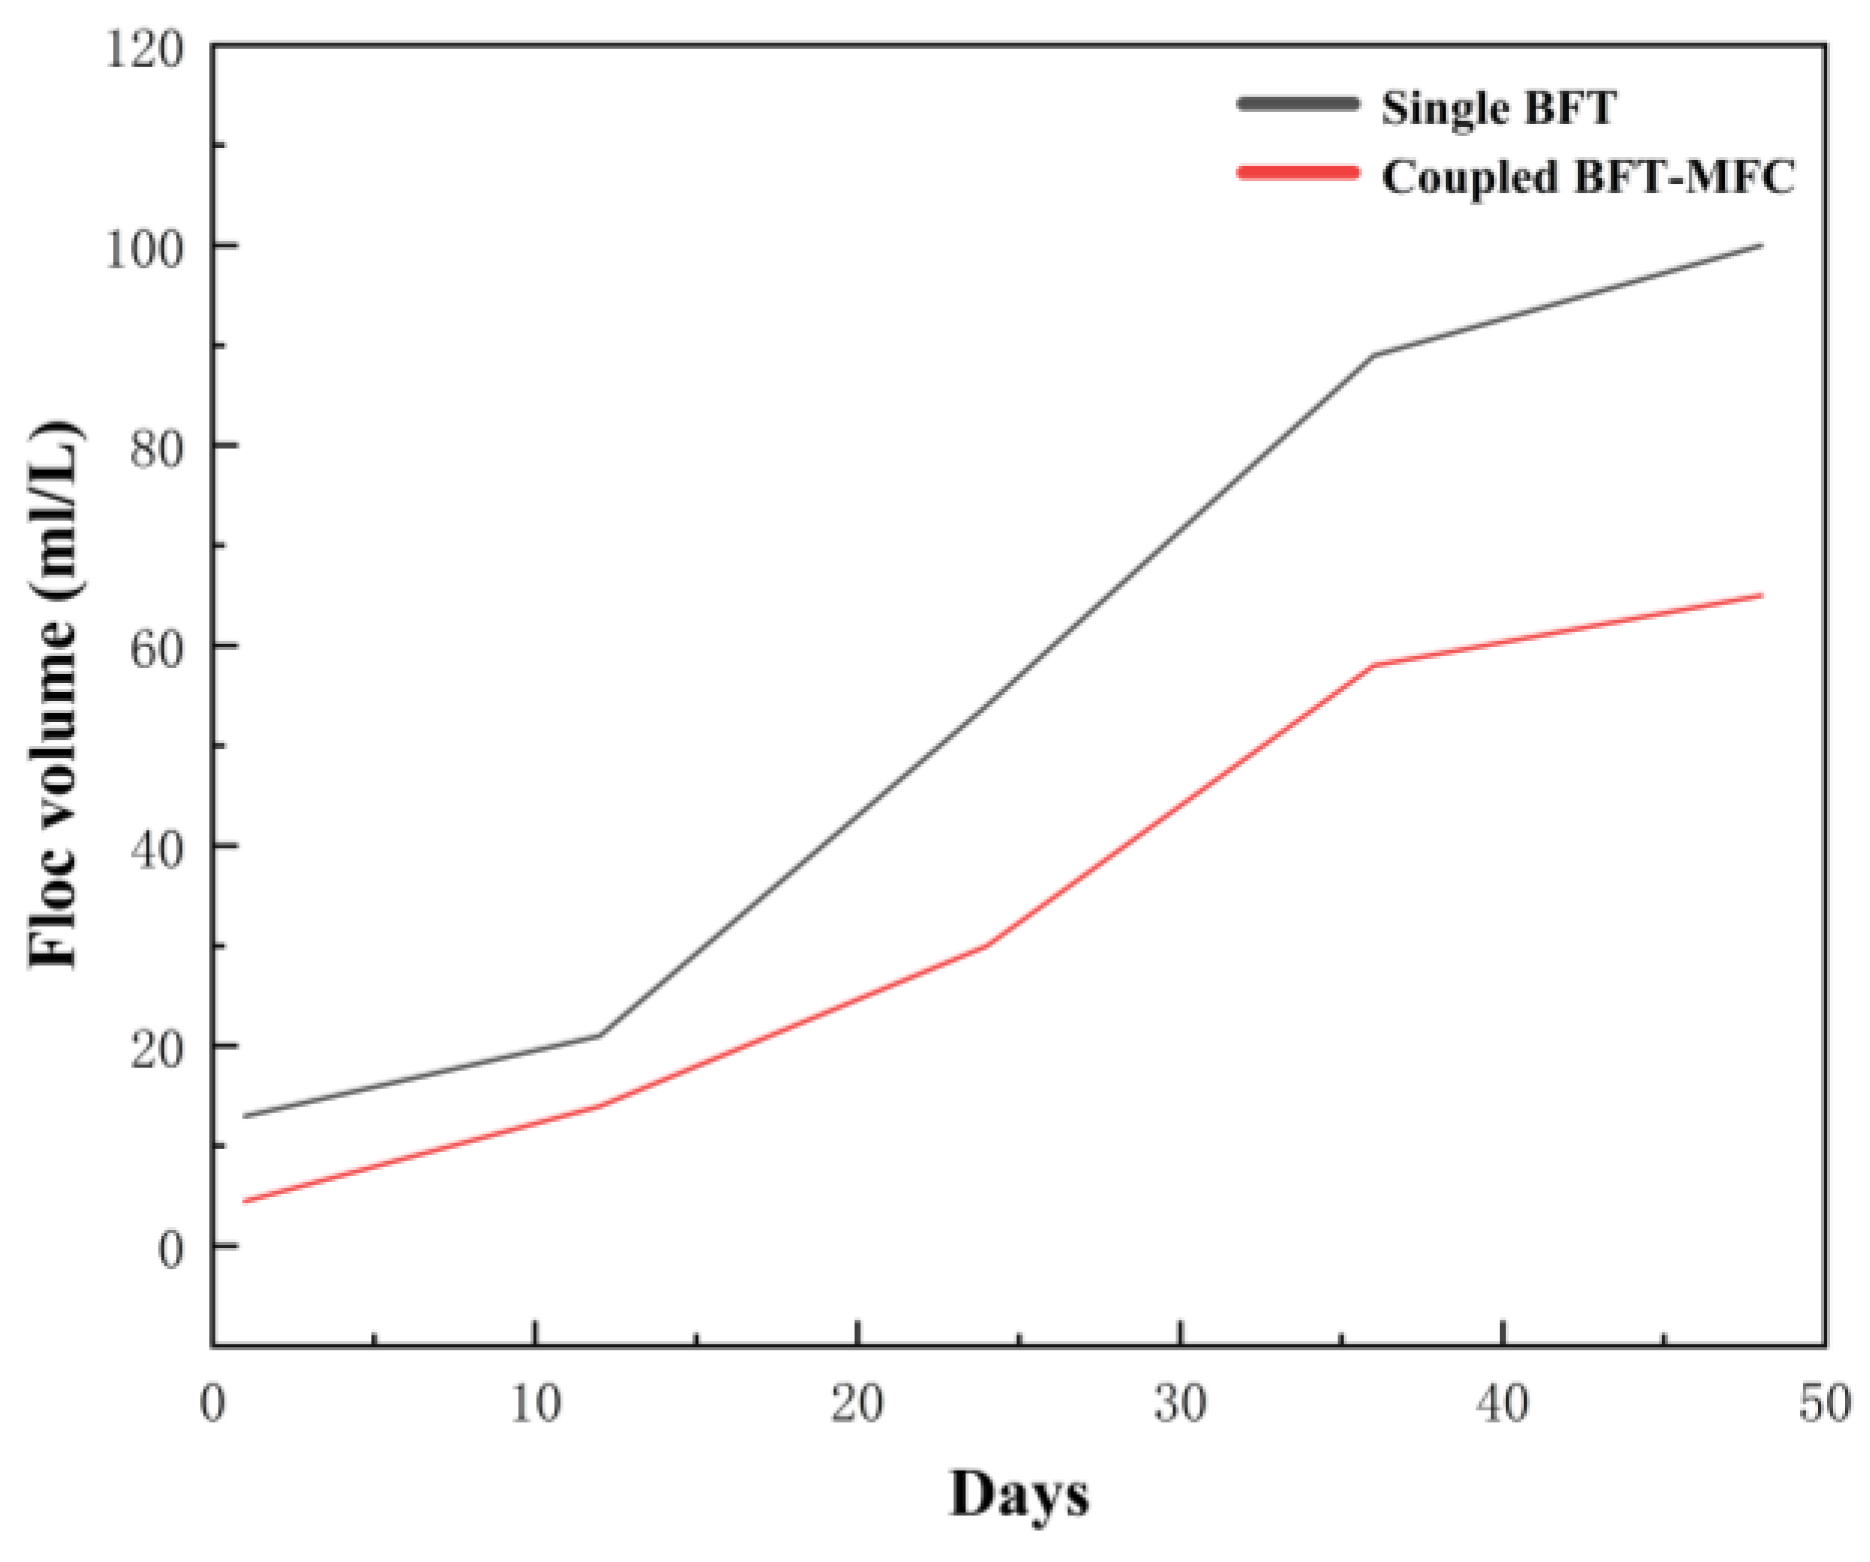
During the experimental period, the changes in floc volume in the two reactors are shown in Figure 6. Throughout the experimental period, the floc volume in both the control group and the experimental group exhibited a gradual upward trend, indicating that bioflocs were continuously formed and accumulated during the aquaculture process. The growth rate of floc volume in the experimental group was generally lower than that in the control group, with the difference between the two groups becoming increasingly pronounced especially in the middle and late stages of the culture period. Correspondingly, the biofloc volume of the experimental group remained consistently lower than that of the control group over the entire cultivation cycle, which implies that the microbial fuel cell (MFC) system has the potential to inhibit the volumetric growth of bioflocs. However, because floc formation and degradation rates were not separately quantified, it remains unclear whether this reduction resulted from inhibited floc formation, enhanced floc degradation, or a combination of both. The reduction in floc volume not only decreased the turbidity of the aquaculture water body but also mitigated the occurrence of fish gill clogging caused by excessive flocs [65]. Notably, the reduction in floc volume did not compromise the water quality treatment capacity of the experimental group; on the contrary, its performance was even superior to that of the control group. These results demonstrate that the coupled BFT-MFC system is more suitable for practical aquaculture applications.

3.3. MFC Characterization

3.3.1. Variation in Voltage and Power Density

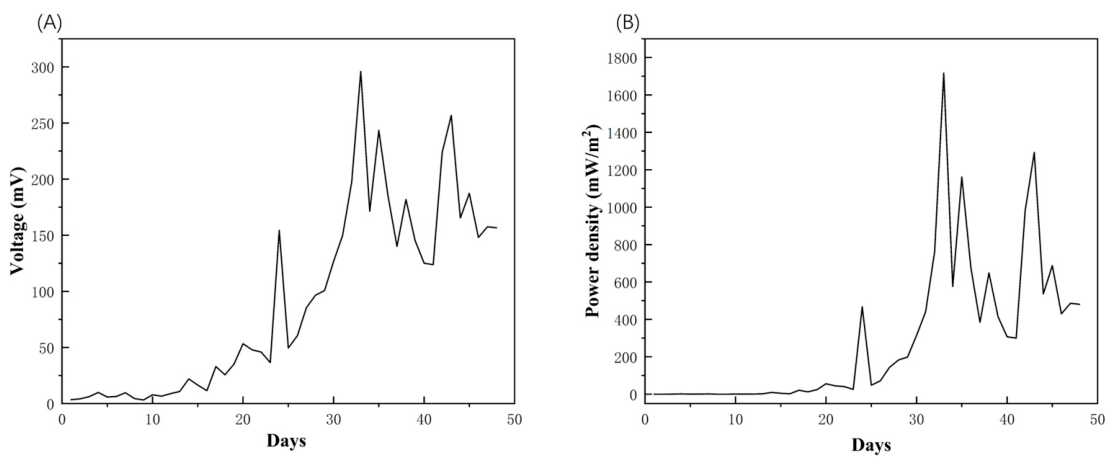
Throughout the experimental period, the voltage variation in the coupled system is shown in Figure 7A. The system voltage exhibited a fluctuating upward trend. The initial system voltage was 3.5 mV, which then gradually increased to 154.4 mV in the early stage of the experiment before dropping to 49.6 mV on day 25. In the late stage of the experiment, the voltage rose again, reaching a maximum value of 295.9 mV. The fluctuations in system voltage may reflect the surface state of electrodes, substrate availability, and the rate of water quality treatment.
The variation in power density with culture time is illustrated in Figure 7B. At the initial stage of the experiment, the power density rapidly increased from approximately 0 mW m−2 to around 1716.8 mW m−2, and maintained at a relatively high level during the middle stage of the experiment. Eventually, the power density decreased gradually, falling to about 300 mW m−2 on the 40th day or so. At a fixed external resistance of 1000 Ω, the maximum power density obtained in this study was 1716.8 mW m−2, which was considerably higher than the reported values for several CW-MFC systems. For example, Nguyen et al. reported that the power density only ranged from 1.26 mW m−2 to 1.59 mW m−2 when treating domestic wastewater using a vertical up-flow constructed wetland integrated with MFC (VFCW-MFC) system [66]. In the study by Anıl et al., which combined up-flow constructed wetlands (UFCW) with MFCs for wastewater treatment and bioelectricity generation, the maximum power density was merely 15.1 mW m−2 [67]. However, direct comparison of power density values among different systems should be interpreted cautiously because of differences in reactor configurations, operating modes, substrates, electrode characteristics, and normalization methods. Therefore, the comparison presented here is intended only to provide a general reference rather than a direct performance ranking among different systems.
The electricity generation capacity of the system designed in this study remains far lower than that of MFC systems specifically dedicated to power production. Lin et al. reported that integrating a direct glucose alkaline fuel cell with an MFC increased the maximum power density from 8.7 ± 0.8 W m−2 to 34.0 ± 3.0 W m−2 [68]. However, the application scenarios of these systems are fundamentally different. Compared with MFC systems operating in the same aquaculture scenario, the electricity generation performance of the BFT-MFC system in this study is already quite remarkable. It should be noted that although the power density achieved in this study demonstrates that organic matter in the aquaculture environment can be partially converted into electrical energy, the electricity generated under the current configuration is unlikely to offset the major energy demands of aquaculture operations, such as aeration and water circulation. Therefore, the primary significance of power generation in this study lies not in energy substitution, but in bioenergy recovery alongside improved water quality regulation.
Furthermore, the biofloc-electrochemical system (BES) reported by Su et al. required continuous external direct current inputs of 100 mA and 200 mA to enhance pollutant removal efficiency [31]. In contrast, the BFT-MFC system developed in this study generated electricity autonomously solely through microbial metabolism without any external energy supply. Therefore, in addition to achieving effective removal of nitrogen and organic matter, the coupled system realized energy recovery from aquaculture wastewater, conferring additional value in terms of bioenergy recovery and operational sustainability. These findings highlight the potential of the BFT-MFC coupled system as a promising green technology for future recirculating aquaculture applications.

3.3.2. Polarization Curve and Power Density Curve

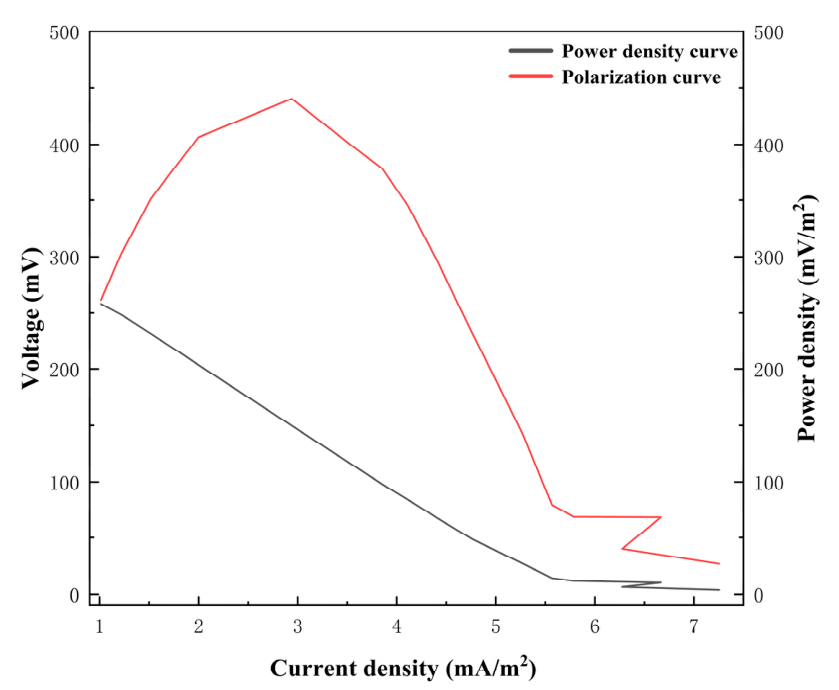
The polarization curve and power density curve of the coupled system are shown in Figure 8. During the polarization test, the coupled system achieved a maximum power density of approximately 440.59 mW m−2 at a current density of 2.94 mA m−2, which indicates that the output power of the MFCs reached its peak under this specific current density condition. As the current density increased from 1.01 mA m−2 to 7.25 mA m−2, the power density first rose and then tended to stabilize or decline. This variation pattern is consistent with the typical characteristics of MFC power density curves, demonstrating the existence of an optimal output range for the coupled system. With the continuous increase in current density, the polarization voltage decreased gradually, indicating a significant polarization phenomenon within the system. This phenomenon may be associated with slow reaction kinetics of the cathodic oxygen reduction, increased internal resistance of the system, or mass transfer limitations. During the polarisation curve measurement, the maximum power density of the coupled system reached 440.59 mW m−2, which indicates that the coupled system was capable of generating measurable electrical output under the tested conditions.

3.3.3. Daily Variations in Voltage and Power Density

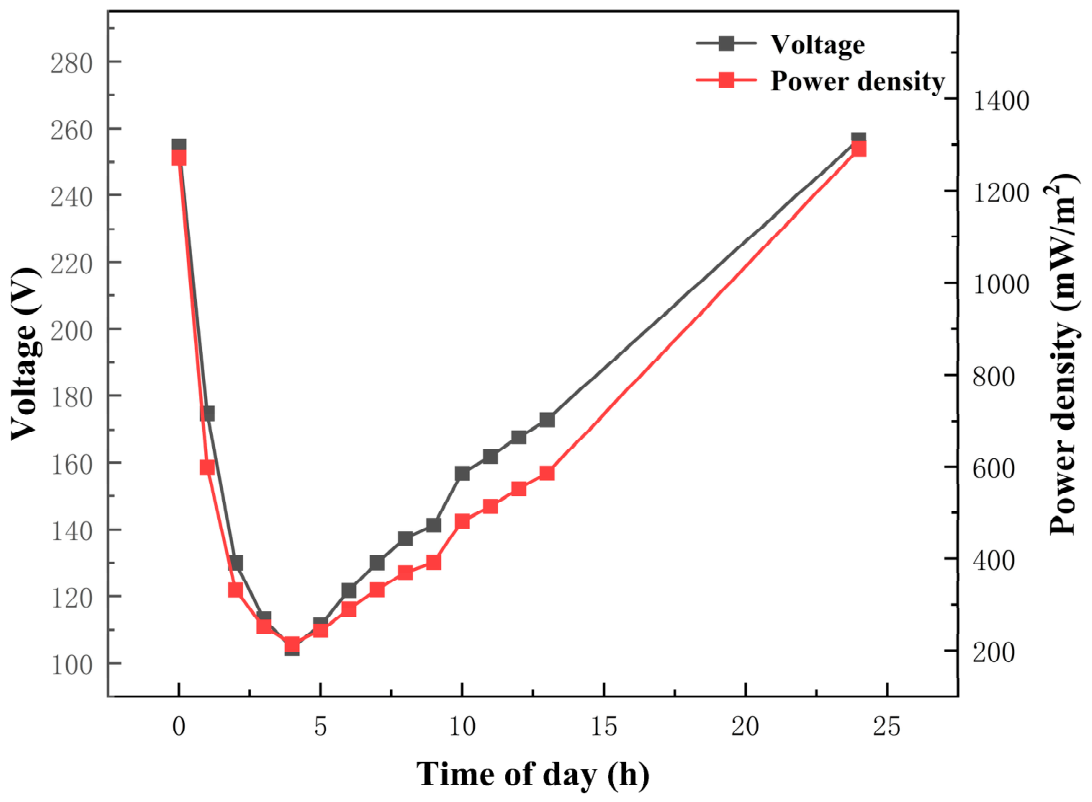
The daily variations in voltage and power density in the coupled system are shown in Figure 9. Data on the daily variations in voltage and power density of the coupled system demonstrated that the MFC system exhibited distinct metabolic cycle characteristics throughout a single day. After feed addition in the morning, the system voltage decreased from 254.7 mV to 104.4 mV, accompanied by a decrease in power density from 1272 to 213.7 mW m−2. This transient decline may have been associated with the abrupt increase in organic substrate concentration and the resulting changes in microbial metabolic conditions. High substrate loading may alter substrate utilization patterns and mass-transfer conditions within microbial aggregates, temporarily affecting the availability of electron donors for electricity generation. The observed decrease in electrical output may therefore reflect changes in substrate availability, microbial metabolic activity, and mass-transfer conditions. However, the present study did not directly measure extracellular electron-transfer activity, and thus the specific contribution of EET or biofilm adaptation to the transient decline cannot be confirmed. One possible explanation is that the abrupt increase in substrate concentration altered microbial metabolic activity and mass-transfer conditions, temporarily affecting electron transfer to the anode. Consequently, current generation is temporarily reduced. Furthermore, it has been reported that excessively high substrate concentrations can induce substrate inhibition effects and simultaneously increase mass transfer resistance within the biofilm. These changes may reduce the availability of electron donors and adversely affect the overall electrical output. Similar transient declines in electrical performance can also be observed following fluctuations in substrate concentration [69]. From the afternoon to nighttime, both parameters gradually recovered: the voltage rose back to 256.6 mV and the power density reached 1291.1 mW m−2. These findings suggest that the coupled system exhibited a certain degree of self-recovery during the diurnal cycle.
It should be noted that the mechanistic interpretation of the electrical performance in this study is based primarily on long-term electrochemical output and microbial community characteristics. Direct electrochemical characterization, such as cyclic voltammetry and electrochemical impedance spectroscopy, was not performed; therefore, changes in redox activity, charge-transfer resistance, and extracellular electron-transfer kinetics could not be directly quantified. In addition, coulombic efficiency was not determined. Consequently, the potential involvement of electroactive microorganisms, electrode-associated biofilms, and microbial electron-transfer processes should be considered a plausible interpretation rather than a directly demonstrated mechanism. Future studies combining direct electrochemical characterization with microbial functional analyses will be necessary to further verify these proposed mechanisms.
From a practical perspective, this short-term fluctuation does not necessarily indicate unstable operation because the electrical output recovered within the same daily cycle. Nevertheless, the magnitude of the post-feeding decrease indicates that feeding frequency and organic loading should be considered when optimizing BFT-MFC operation. In aquaculture practice, feeding characteristics and feeding uniformity can substantially influence the temporal distribution of organic inputs into culture systems, highlighting the importance of appropriate feeding management and feeding strategies for maintaining stable system operation [70]. More controlled feeding strategies or gradual substrate loading may help reduce these transient fluctuations and improve the stability of electricity generation.

3.4. Experimental Limitations and Future Perspectives

It should be noted that the present experiment was conducted using one reactor for each treatment. Therefore, the observed differences between the BFT and BFT-MFC systems mainly represent performance trends under specific operating conditions rather than statistically generalized effects. Although repeated measurements were performed throughout the operation period, these measurements describe temporal variations within each reactor and cannot completely substitute biological replicates. Future studies should incorporate multiple independent reactors for each treatment to further evaluate reproducibility and statistical robustness.

4. Conclusions

In this study, a BFT-MFC coupled system was developed and evaluated for aquaculture water quality regulation and energy recovery. Compared with the conventional BFT system, the coupled system exhibited improved control of NH4+-N accumulation, lower TN accumulation, reduced TOC fluctuation, and stable electricity generation. These improvements may be associated with the integration of bioelectrochemical processes into the biofloc system, although the detailed microbial and electrochemical mechanisms require further investigation. However, several limitations should be acknowledged. The present study was conducted using laboratory-scale reactors with one reactor per treatment, and therefore the reproducibility across independent biological replicates requires further validation. In addition, microbial community composition, electrode-associated biofilm characteristics, and specific electron transfer pathways were not directly characterized. Future studies should incorporate multiple independent reactors, microbial sequencing, functional gene analysis, and advanced electrochemical characterization to clarify the mechanisms underlying the enhanced performance of the BFT-MFC system. Furthermore, reactor optimization and scale-up studies are required to evaluate its practical application potential and energy recovery efficiency in aquaculture systems.

Author Contributions

C.L.: Conceptualization & Writing. Z.G.: Methodology, Writing & Visualization. Y.L.: Writing. L.D.: Review, Investigation & Editing. All authors have read and agreed to the published version of the manuscript.

Funding

This work was financially supported by the National Natural Science Foundation of China (No. 32202999), the Natural Science Foundation of Jiangsu Province (No. BK20220521).

Data Availability Statement

The original contributions presented in this study are included in the article. Further inquiries can be directed to the corresponding author.

Acknowledgments

The authors acknowledge the use of ChatGPT 5.5 (OpenAI, San Francisco, CA, USA) for assistance in generating the visual content of the Graphical Abstract. The authors reviewed and verified the final image and take full responsibility for its scientific accuracy and content.

Conflicts of Interest

The authors declare no conflicts of interest.

References

  1. Mente, E.; Smaal, A.C. Introduction to the special issue on “European aquaculture development since 1993: The benefits of aquaculture to Europe and the perspectives of European aquaculture production”. Aquac. Int. 2016, 24, 698. [Google Scholar] [CrossRef] [Scilit]
  2. Yang, Z.; Zhu, A.; Adade, S.Y.-S.S.; Ali, S.; Chen, Q.; Wei, J.; Chen, X.; Jiao, T.; Chen, Q. Ag@Au core–shell nanoparticle-based surface-enhanced Raman scattering coupled with chemometrics for rapid determination of chloramphenicol residue in fish. Food Chem. 2024, 438, 138026. [Google Scholar] [CrossRef] [Scilit]
  3. Song, W.; Jiang, Q.; He, Y.; Ma, B.; Tang, Y.; Zhao, J. Crowding-induced physiological stress, not aggression, makes high stocking density more worthy of attention in aquaculture. Aquaculture 2026, 616, 743700. [Google Scholar] [CrossRef] [Scilit]
  4. Anandkumar, A.; Li, J.; Prabakaran, K.; Xi Jia, Z.; Leng, Z.; Nagarajan, R.; Du, D. Accumulation of toxic elements in an invasive crayfish species (Procambarus clarkii) and its health risk assessment to humans. J. Food Compos. Anal. 2020, 88, 103449. [Google Scholar] [CrossRef] [Scilit]
  5. Xu, X.D.; Yang, X.T.; Li, S.T.; Ye, Y.M.; Zhou, C. Fish Disease Cross-Modal Image-Text Retrieval Model in Aquaculture. J. Asabe 2026, 69, 119–132. [Google Scholar] [CrossRef] [Scilit]
  6. Verdegem, M.; Buschmann, A.H.; Latt, U.W.; Dalsgaard, A.J.T.; Lovatelli, A. The contribution of aquaculture systems to global aquaculture production. J. World Aquac. Soc. 2023, 54, 206–250. [Google Scholar] [CrossRef] [Scilit]
  7. Frankic, A.; Hershner, C. Sustainable aquaculture: Developing the promise of aquaculture. Aquac. Int. 2003, 11, 517–530. [Google Scholar] [CrossRef] [Scilit]
  8. Gao, X.L.; Ye, C.; Ma, H.L.; Zhang, Z.K.; Wang, J.C.; Zhang, Z.H.; Zhao, X.; Ho, C.T. Research Advances in Preparation, Stability, Application, and Possible Risks of Nanoselenium: Focus on Food and Food-Related Fields. J. Agric. Food Chem. 2023, 71, 8731–8745. [Google Scholar] [CrossRef] [Scilit]
  9. Crab, R.; Defoirdt, T.; Bossier, P.; Verstraete, W. Biofloc technology in aquaculture: Beneficial effects and future challenges. Aquaculture 2012, 356–357, 351–356. [Google Scholar] [CrossRef] [Scilit]
  10. Abakari, G.; Luo, G.; Kombat, E.O.; Alhassan, E.H. Supplemental carbon sources applied in biofloc technology aquaculture systems: Types, effects and future research. Rev. Aquac. 2021, 13, 1193–1222. [Google Scholar] [CrossRef] [Scilit]
  11. Khanjani, M.H.; Sharifinia, M. Biofloc technology as a promising tool to improve aquaculture production. Rev. Aquac. 2020, 12, 1836–1850. [Google Scholar] [CrossRef] [Scilit]
  12. Rai, N.; Panigrahi, A.; Julka, J.M.; Nan, F.-H.; Das, S.P. Biofloc technology for sustainable aquaculture: Microbial regulation, nutrient dynamics, and integrated system approaches. J. Water Process Eng. 2025, 78, 108730. [Google Scholar] [CrossRef] [Scilit]
  13. Li, C.; Dai, L. Multifunctional Applications of Biofloc Technology (BFT) in Sustainable Aquaculture: A Review. Fishes 2025, 10, 353. [Google Scholar] [CrossRef] [Scilit]
  14. Shi, M.; Ruan, Y.; Wu, B.; Ye, Z.; Zhu, S. Performance Evaluation of Hydrodynamic Vortex Separator at Different Hydraulic Retention Times Applied in Recirculating Biofloc Technology System. Trans. Asabe 2017, 60, 1737–1747. [Google Scholar] [CrossRef] [Scilit]
  15. Jamal, M.T.; Broom, M.; Al-Mur, B.A.; Al Harbi, M.; Ghandourah, M.; Al Otaibi, A.; Haque, M.F. Biofloc Technology: Emerging Microbial Biotechnology for the Improvement of Aquaculture Productivity. Pol. J. Microbiol. 2020, 69, 401–409. [Google Scholar] [CrossRef] [Scilit]
  16. Khanjani, M.H.; Sharifinia, M.; Emerenciano, M.G.C. Biofloc Technology (BFT) in Aquaculture: What Goes Right, What Goes Wrong? A Scientific-Based Snapshot. Aquac. Nutr. 2024, 2024, 7496572. [Google Scholar] [CrossRef] [Scilit]
  17. Li, C.; Ge, Z.; Dai, L.; Chen, Y. Integrated Application of Biofloc Technology in Aquaculture: A Review. Water 2025, 17, 2107. [Google Scholar] [CrossRef] [Scilit]
  18. Raza, B.; Zheng, Z.; Yang, W. A Review on Biofloc System Technology, History, Types, and Future Economical Perceptions in Aquaculture. Animals 2024, 14, 1489. [Google Scholar] [CrossRef] [Scilit]
  19. Soaudy, M.R.; Ghonimy, A.; Greco, L.S.L.; Chen, Z.; Dyzenchauz, A.; Li, J. Total suspended solids and their impact in a biofloc system: Current and potentially new management strategies. Aquaculture 2023, 572, 739524. [Google Scholar] [CrossRef] [Scilit]
  20. Abakari, G.; Luo, G.; Kombat, E.O. Dynamics of nitrogenous compounds and their control in biofloc technology (BFT) systems: A review. Aquac. Fish. 2021, 6, 441–447. [Google Scholar] [CrossRef] [Scilit]
  21. Yu, Y.-B.; Lee, J.-H.; Choi, J.-H.; Choi, Y.J.; Jo, A.H.; Choi, C.Y.; Kang, J.-C.; Kim, J.-H. The application and future of biofloc technology (BFT) in aquaculture industry: A review. J. Environ. Manag. 2023, 342, 118237. [Google Scholar] [CrossRef] [Scilit]
  22. Shi, B.; Sreeram, V.; Zhao, D.; Duan, S.; Jiang, J. A wireless sensor network-based monitoring system for freshwater fishpond aquaculture. Biosyst. Eng. 2018, 172, 57–66. [Google Scholar] [CrossRef] [Scilit]
  23. Zhu, C.Y.; Liu, X.Q.; Chen, H.L.; Tian, X. Automatic cruise system for water quality monitoring. Int. J. Agric. Biol. Eng. 2018, 11, 244–250. [Google Scholar] [CrossRef]
  24. Jin, Y.C.; Liu, J.Z.; Xu, Z.J.; Yuan, S.Q.; Li, P.P.; Wang, J.Z. Development status and trend of agricultural robot technology. Int. J. Agric. Biol. Eng. 2021, 14, 1–19. [Google Scholar] [CrossRef] [Scilit]
  25. Qu, J.; Yu, X.X.; You, S.H.; Lan, X.D. Effects and Mechanism of Constructed Wetland Microbial Fuel Cell (CW-MFC) in the Treatment of Freshwater Fish Aquaculture Wastewater. Environ. Prot. Eng. 2025, 51, 13–30. [Google Scholar] [CrossRef] [Scilit]
  26. Saraf, R.; Goyal, A.; Jain, D.; Dutt, K. Microbial Fuel Cell an Alternative for Sustainable Energy Production: Substrate, Challenges and Application. Curr. Green Chem. 2025, 12, 291–308. [Google Scholar] [CrossRef] [Scilit]
  27. Santoro, C.; Arbizzani, C.; Erable, B.; Ieropoulos, I. Microbial fuel cells: From fundamentals to applications. A review. J. Power Sources 2017, 356, 225–244. [Google Scholar] [CrossRef] [Scilit]
  28. Vijay, A.; Sonawane, J.M.; Chhabra, M. Denitrification process in microbial fuel cell: A comprehensive review. Bioresour. Technol. Rep. 2022, 17, 100991. [Google Scholar] [CrossRef] [Scilit]
  29. Mahto, K.U.; Das, S. Electroactive biofilm communities in microbial fuel cells for the synergistic treatment of wastewater and bioelectricity generation. Crit. Rev. Biotechnol. 2025, 45, 434–453. [Google Scholar] [CrossRef] [Scilit]
  30. Huang, S.; Zhang, J.; Zhang, H.; Wang, C.; Zou, C.; Zhang, Y.; Zhu, G. Electric field effect of microbial fuel cells on biological reactions: A review. Int. Biodeterior. Biodegrad. 2024, 194, 105886. [Google Scholar] [CrossRef] [Scilit]
  31. Su, W.; Lin, J.; Liu, W.; Guo, Y.; Wang, J.; Luo, G.; Tan, H. Effects of biofloc-electrochemical system on water quality, fish performance, and microbial diversity. Aquac. Eng. 2025, 111, 102567. [Google Scholar] [CrossRef] [Scilit]
  32. Gao, R.; Liu, L.; Monto, A.R.; Su, K.; Zhang, H.; Shi, T.; Xiong, Z.; Xu, G.; Luo, Y.; Bao, Y.; et al. Metabolomic profile of muscles from tilapia cultured in recirculating aquaculture systems and traditional aquaculture in ponds and protein stability during freeze-thaw cycles. Food Chem. 2024, 451, 139325. [Google Scholar] [CrossRef] [Scilit]
  33. Tamilarasan, K.; Banu, J.R.; Jayashree, C.; Yogalakshmi, K.N.; Gokulakrishnan, K. Effect of organic loading rate on electricity generating potential of upflow anaerobic microbial fuel cell treating surgical cotton industry wastewater. J. Environ. Chem. Eng. 2017, 5, 1021–1026. [Google Scholar] [CrossRef] [Scilit]
  34. Preen, R.J.; You, J.; Bull, L.; Ieropoulos, I.A. Design mining microbial fuel cell cascades. Soft Comput. 2019, 23, 4673–4683. [Google Scholar] [CrossRef] [Scilit]
  35. Guo, Y.; Wang, Z.; Liu, W.; Hong, B.; Luo, G.; Li, X.; Wang, C.; Tan, H. Enhancing sustainable Penaeus vannamei aquaculture: A green duckweed-biofloc multitrophic system for improved culture performance and economic benefits. J. Water Process Eng. 2025, 79, 108976. [Google Scholar] [CrossRef] [Scilit]
  36. Mohammady, E.Y.; Soaudy, M.R.; Ali, M.M.; El-ashry, M.A.; El-Karim, M.S.A.; Jarmołowicz, S.; Hassaan, M.S. Response of Nile tilapia under biofloc system to floating or sinking feed and feeding rates: Water quality, plankton community, growth, intestinal enzymes, serum biochemical and antioxidant status. Aquac. Rep. 2023, 29, 101489. [Google Scholar] [CrossRef] [Scilit]
  37. Khanjani, M.H.; Eslami, J.; Emerenciano, M.G.C. Wheat flour as carbon source on water quality, growth performance, hemolymph biochemical and immune parameters of Pacific white shrimp (Penaeus vannamei) juveniles in biofloc technology (BFT). Aquac. Rep. 2025, 40, 102623. [Google Scholar] [CrossRef] [Scilit]
  38. Kang, J.; McLaughlin, R.A. Polyacrylamide and Chitosan Biopolymer for Flocculation and Turbidity Reduction in Soil Suspensions. J. Polym. Environ. 2020, 28, 1335–1343. [Google Scholar] [CrossRef] [Scilit]
  39. Demir, Ö.; Gümüş, E. Effects of pre-treated sludge on sludge stabilization and electricity generation in microbial fuel cell. Environ. Prog. Sustain. Energy 2023, 42, e14119. [Google Scholar] [CrossRef] [Scilit]
  40. Abdolhossein Zadeh, A.; Shokri, R.; Moaddab, S.R.; Rahnema, M. Analysis and Study of the Bioelectric Production Potential of Actinomycete and Microbial Isolates in Industrial Glass Factory Wastewater Using a Microbial Fuel Cell. Biosci. J. 2023, 39, e39093. [Google Scholar] [CrossRef] [Scilit]
  41. Serra, P.M.D.; Espírito-Santo, A.; Magrinho, M. A steady-state electrical model of a microbial fuel cell through multiple-cycle polarization curves. Renew. Sustain. Energy Rev. 2020, 117, 109439. [Google Scholar] [CrossRef] [Scilit]
  42. Prates, E.; Holanda, M.; Pedrosa, V.F.; Monserrat, J.M.; Wasielesky, W. Compensatory growth and energy reserves changes in the Pacific white shrimp (Litopenaeus vannamei) reared in different temperatures and under feed restriction in biofloc technology system (BFT). Aquaculture 2023, 562, 738821. [Google Scholar] [CrossRef] [Scilit]
  43. Deswati, D.; Safni, S.; Khairiyah, K.; Yani, E.; Yusuf, Y.; Pardi, H. Biofloc technology: Water quality (pH, temperature, DO, COD, BOD) in a flood & drain aquaponic system. Int. J. Environ. Anal. Chem. 2022, 102, 6835–6844. [Google Scholar] [CrossRef] [Scilit]
  44. Wang, W.; Tang, L.; Chen, C.; Wang, X.; Wang, Y.; Sun, W. Engineering Pt–S–Mo and Pd–S–Mo sites in hierarchical porous MoS2 for boosted oxygen reduction activity in microbial fuel cell. J. Power Sources 2024, 598, 234143. [Google Scholar] [CrossRef] [Scilit]
  45. Hu, J.; Cai, T.; Klümper, U.; Luo, L.; Zhu, Y.; He, Y. Novel multi-drug-resistant yeast efficiently removed ammonia nitrogen from antibiotic-contaminated aquaculture water. Int. Biodeterior. Biodegrad. 2025, 203, 106111. [Google Scholar] [CrossRef] [Scilit]
  46. Luo, G.; Zhang, N.; Cai, S.; Tan, H.; Liu, Z. Nitrogen dynamics, bacterial community composition and biofloc quality in biofloc-based systems cultured Oreochromis niloticus with poly-β-hydroxybutyric and polycaprolactone as external carbohydrates. Aquaculture 2017, 479, 732–741. [Google Scholar] [CrossRef] [Scilit]
  47. Li, H.; Luo, H.; Huang, Q. Integrated decontamination of off-odors and ammonia nitrogen in aquaculture using a core–satellite MOF-on-MOF heterostructure. J. Hazard. Mater. 2026, 510, 142158. [Google Scholar] [CrossRef] [Scilit]
  48. Khanjani, M.H.; Mohammadi, A.; Emerenciano, M.G.C. Microorganisms in biofloc aquaculture system. Aquac. Rep. 2022, 26, 101300. [Google Scholar] [CrossRef] [Scilit]
  49. Yashiro, Y.; Yamamoto, M.; Muneta, Y.; Sawada, H.; Nishiura, R.; Arai, S.; Takamatsu, S.; Itoh, T. Comparative Studies on Electrodes for Rumen Bacteria Microbial Fuel Cells. Sensors 2023, 23, 4162. [Google Scholar] [CrossRef] [Scilit]
  50. Merga, T.; Gebreslassie, G.; Hailu, T.; Nwanya, A.C.; Ezema, F.I.; Ejikeme, P.M.; Workneh, G.A. Progress of carbon-based electrodes in microbial fuel cells: A comprehensive review. Results Chem. 2025, 17, 102627. [Google Scholar] [CrossRef] [Scilit]
  51. Xu, J.; Zhang, X.; Jin, D.; Wu, P. Anammox-coupled microbial fuel cell (Anammox-MFC) for wastewater treatment: A critical review. J. Water Process Eng. 2025, 71, 107285. [Google Scholar] [CrossRef] [Scilit]
  52. Pu, K.-B.; Li, T.-T.; Gao, J.-Y.; Chen, Q.-Y.; Guo, K.; Zhou, M.; Wang, C.-T.; Wang, Y.-H. Floating flexible microbial fuel cells for electricity generation and municipal wastewater treatment. Sep. Purif. Technol. 2022, 300, 121915. [Google Scholar] [CrossRef] [Scilit]
  53. Sonu, K.; Sogani, M.; Sen, H.; Maheshwari, K.; Tiwari, M.K. Water hyacinth-assisted microbial fuel cells: A review on prospects for bioenergy and wastewater treatment. Environ. Prog. Sustain. Energy 2026, 45, e70240. [Google Scholar] [CrossRef] [Scilit]
  54. Meng, L.-J.; Hu, X.; Wen, B.; Liu, Y.-H.; Luo, G.-Z.; Gao, J.-Z.; Chen, Z.-Z. Microplastics inhibit biofloc formation and alter microbial community composition and nitrogen transformation function in aquaculture. Sci. Total Environ. 2023, 866, 161362. [Google Scholar] [CrossRef] [Scilit]
  55. An, S.; Li, J.; Du, J.; Feng, L.; Zhang, L.; Zhang, X.; Zhuang, Z.; Zhao, Z.; Yang, G. Coupled nitrogen and phosphorus cycles mediated by coordinated variations of functional microbes in industrial recirculating aquaculture system. Water Res. 2025, 280, 123726. [Google Scholar] [CrossRef] [Scilit]
  56. Logan, B.E.; Hamelers, B.; Rozendal, R.A.; Schrorder, U.; Keller, J.; Freguia, S.; Aelterman, P.; Verstraete, W.; Rabaey, K. Microbial fuel cells: Methodology and technology. Environ. Sci. Technol. 2006, 40, 5181–5192. [Google Scholar] [CrossRef] [Scilit]
  57. Virdis, B.; Rabaey, K.; Yuan, Z.; Keller, J. Microbial fuel cells for simultaneous carbon and nitrogen removal. Water Res. 2008, 42, 3013–3024. [Google Scholar] [CrossRef] [Scilit]
  58. Chen, N.; Wang, L.; Zhao, Z.; Zhu, M.; Li, Y. Impacts of aquaculture on nitrogen cycling and microbial community dynamics in coastal tidal flats. Environ. Res. 2025, 270, 120973. [Google Scholar] [CrossRef] [Scilit]
  59. Virdis, B.; Read, S.T.; Rabaey, K.; Rozendal, R.A.; Yuan, Z.G.; Keller, J. Biofilm stratification during simultaneous nitrification and denitrification (SND) at a biocathode. Bioresour. Technol. 2011, 102, 334–341. [Google Scholar] [CrossRef] [Scilit]
  60. Zou, S.Q.; Guan, L.; Taylor, D.P.; Kuhn, D.; He, Z. Nitrogen removal from water of recirculating aquaculture system by a microbial fuel cell. Aquaculture 2018, 497, 74–81. [Google Scholar] [CrossRef] [Scilit]
  61. Jiménez-Montealegre, R.; Verdegem, M.C.J.; van Dam, A.A.; Verreth, J.A. Effect of organic nitrogen and carbon mineralization on sediment organic matter accumulation in fish ponds. Aquac. Res. 2005, 36, 1001–1014. [Google Scholar] [CrossRef] [Scilit]
  62. Logan, B.E.; Rossi, R.; Ragab, A.; Saikaly, P.E. Electroactive microorganisms in bioelectrochemical systems. Nat. Rev. Microbiol. 2019, 17, 307–319. [Google Scholar] [CrossRef] [Scilit]
  63. Mahmoud, R.H.; Gomaa, O.M.; Hassan, R.Y.A. Bio-electrochemical frameworks governing microbial fuel cell performance: Technical bottlenecks and proposed solutions. RSC Adv. 2022, 12, 5749–5764. [Google Scholar] [CrossRef] [Scilit]
  64. Huang, Y.; Zhao, Y.; Tang, C.; Yadav, A.K.; Abbassi, R.; Kang, P.; Cai, Y.; Liu, A.; Yang, A.; Li, M. A glance of coupled water and wastewater treatment systems based on microbial fuel cells. Sci. Total Environ. 2023, 892, 164599. [Google Scholar] [CrossRef] [Scilit]
  65. Romano, N.; Surratt, A.; Renukdas, N.; Monico, J.; Egnew, N.; Sinha, A.K. Assessing the feasibility of biofloc technology to largemouth bass Micropterus salmoides juveniles: Insights into their welfare and physiology. Aquaculture 2020, 520, 735008. [Google Scholar] [CrossRef] [Scilit]
  66. Vo, N.X.P.; Hoang, D.D.N.; Huu, T.D.; Van, T.D.; Thanh, H.L.P.; Xuan, Q.V.N. Performance of vertical up-flow-constructed wetlands integrating with microbial fuel cell (VFCW-MFC) treating ammonium in domestic wastewater. Environ. Technol. 2023, 44, 1822–1837. [Google Scholar] [CrossRef] [Scilit]
  67. Yakar, A.; Türe, C.; Türker, O.C.; Vymazal, J.; Saz, Ç. Impacts of various filtration media on wastewater treatment and bioelectric production in up-flow constructed wetland combined with microbial fuel cell (UCW-MFC). Ecol. Eng. 2018, 117, 120–132. [Google Scholar] [CrossRef] [Scilit]
  68. Lin, S.W.; Zheng, H.M.; Ma, S.Y.; Chen, X.D.; Li, X.; Luo, H.P.; Liu, G.L. Enhanced electricity generation in direct glucose alkaline fuel cell combined with microbial fuel cell. Int. J. Hydrog. Energy 2024, 89, 790–798. [Google Scholar] [CrossRef] [Scilit]
  69. Zhang, J.; Zheng, P.; Zhang, M.; Chen, H.; Chen, T.; Xie, Z.; Cai, J.; Abbas, G. Kinetics of substrate degradation and electricity generation in anodic denitrification microbial fuel cell (AD-MFC). Bioresour. Technol. 2013, 149, 44–50. [Google Scholar] [CrossRef] [Scilit]
  70. Yuan, H.; Cai, Y.; Liang, S.; Ku, J.; Qin, Y. Numerical Simulation and Analysis of Feeding Uniformity of Viscous Miscellaneous Fish Bait Based on EDEM Software. Agriculture 2023, 13, 356. [Google Scholar] [CrossRef] [Scilit]
Figure 1. Schematic diagram of the experimental setup. (A) Single biofloc technology (BFT) system; (B) biofloc technology–microbial fuel cell (BFT-MFC) coupled system.
Water 18 02115 g001
Figure 2. Variations in dissolved oxygen (DO), water temperature, and pH. (A) DO; (B) water temperature; (C) pH. Data points represent individual measurements.
Water 18 02115 g002
Figure 3. Diurnal variations in DO and pH in the two reactors. (A) DO; (B) pH. Data points represent individual measurements.
Water 18 02115 g003
Figure 4. Variations in nitrogen species concentrations. (A) Ammonia nitrogen (NH4+-N); (B) nitrite nitrogen (NO2-N); (C) nitrate nitrogen (NO3-N). Data are presented as mean ± SD (n = 2).
Water 18 02115 g004
Figure 5. Variations in total nitrogen (TN) and total organic carbon (TOC). (A) TN; (B) TOC. Data points represent individual measurements.
Water 18 02115 g005
Figure 6. Changes in biofloc volume during the experimental period. Data points represent individual measurements.
Water 18 02115 g006
Figure 7. Temporal variations in output voltage and power density of the BFT–MFC system during continuous operation at an external resistance of 1000 Ω. (A) Output voltage variation; (B) power density variation. Data points represent individual measurements.
Water 18 02115 g007
Figure 8. Polarization and power density curves of the BFT-MFC coupled system. Data points represent individual measurements.
Water 18 02115 g008
Figure 9. Diurnal variations in voltage and power density of the coupled system. Data points represent individual measurements.
Water 18 02115 g009
Disclaimer/Publisher’s Note: The statements, opinions and data contained in all publications are solely those of the individual author(s) and contributor(s) and not of MDPI and/or the editor(s). MDPI and/or the editor(s) disclaim responsibility for any injury to people or property resulting from any ideas, methods, instructions or products referred to in the content.