Article

Spatiotemporal Differentiation and Driving Mechanisms of Water Resources Carrying Capacity in the Jialu River Basin Using Combined Weighting and Geodetector

1
School of Geography and Tourism, Zhengzhou Normal University, Zhengzhou 450044, China
2
Faculty of Geographical Science and Engineering, Henan University, Kaifeng 475001, China
*
Author to whom correspondence should be addressed.
Water 2026, 18(17), 2111; https://doi.org/10.3390/w18172111
Submission received: 20 July 2026 / Revised: 20 August 2026 / Accepted: 24 August 2026 / Published: 27 August 2026

Abstract

The water resources carrying capacity (WRCC) lays a foundational basis for long-term coordinated water resource governance. Based on the Driving–Pressure–State–Impact–Response (DPSIR) framework, this study constructed a WRCC evaluation system containing 21 indicators and adopted a combined weighting method integrating entropy weight and coefficient of variation. Weighted Technique for Order Preference by Similarity to Ideal Solution (TOPSIS) and geographical detector tools were jointly applied to quantify spatial-temporal WRCC disparities within the Jialu River Basin, alongside extraction of core driving forces during 2010–2022. Marked spatial disparities existed across administrative units, with basin-average WRCC ranging from 0.18–0.35. Zhengzhou maintained relatively high carrying levels, Kaifeng stayed chronically low, Xuchang improved after 2019, while Zhoukou experienced an overall decline, forming a relatively stable spatial pattern: Zhengzhou > Zhoukou > Xuchang > Kaifeng. Socioeconomic factors stood among the major drivers of spatial divergence. R&D expenditure and urbanization rate exhibited the highest explanatory capacity, with respective q statistics of 0.58 and 0.57. In contrast, natural factors including precipitation and groundwater reserves showed limited impacts, with q values of only 0.11 and 0.09. Factor interaction analysis showed that bivariate enhancement was the primary interaction type (70.53%), followed by nonlinear enhancement (21.05%) and nonlinear weakening (8.42%). The mean q value of the interactive effects reached 0.58, which was 45.0% higher than that of individual factors, suggesting prominent multi-factor synergistic effects. These results deliver empirical evidence for differentiated watershed regulation and cross-jurisdictional water–ecological coordination, and offer actionable governance insights for densely urbanized plain tributary basins with intense human–water conflicts.

1. Introduction

Water resources are considered to be a strategic resource of paramount importance, providing support for both regional socioeconomic development and ecological security. Accelerated urban expansion, intensive human activities, and the uneven spatiotemporal distribution of natural water resources have jointly triggered prominent contradictions between water supply and demand, widespread water scarcity, and degraded aquatic environments across numerous river basins worldwide [1,2]. Water resources carrying capacity (WRCC) is a core indicator of the sustainable development potential of watershed systems [3,4]. It is a reliable metric with which to characterise the maximum sustainable yield of water bodies for human production, daily living and ecological conservation activities. Scientific assessment of WRCC, paired with clear identification of its long-term evolution rules, lays essential groundwork for designing practical, evidence-based water resource management plans [5,6].
Scholars across the globe have carried out extensive exploration on WRCC’s core concepts, quantitative evaluation techniques and internal evolution mechanisms, gradually building a complete set of theoretical frameworks and operational technical workflows. Recent related works have enriched evaluation routes while broadening study boundaries in both temporal and spatial dimensions. More attention is paid to unpacking spatial distribution rules and latent driving forces shaping regional water carrying capacity [7,8,9]. Evaluating WRCC across plain urban basins requires systematic consideration of interactions among society, economy and hydrological–ecological subsystems. The Driving–Pressure–State–Impact–Response (DPSIR) conceptual framework provides a mature logical paradigm for organising multi-source indicators, which helps unpack causal chains between human activities and basin water-system status, and has been widely adopted in recent WRCC assessment work [10,11,12]. Benefiting from its cause-effect hierarchical logic, DPSIR can reduce subjectivity in indicator screening and simultaneously cover socioeconomic drivers, human-induced pressures, system conditions and governance feedback, which fits the complex human–water coupling features of urban–agricultural plain basins. Even so, DPSIR functions merely as a conceptual classification framework without embedded quantitative calculation capacity. Reliable empirical assessment still requires well-selected weighting schemes and multi-criteria evaluation models to translate conceptual indicator systems into measurable WRCC outputs. When determining indicator weights, subjective approaches such as the Analytic Hierarchy Process (AHP) rely heavily on expert experience and may introduce artificial preference in long-time-series dynamic evaluation [13]. The Criteria Importance Through Inter-criteria Correlation (CRITIC) method considers correlation among indicators yet focuses primarily on statistical features among indicators and tends to generate relatively homogenized weight values, showing limited capacity for capturing spatial disparities across basin subunits [14]. The coefficient-of-variation method highlights spatial differences among research units, whereas the entropy weight method captures temporal variability embedded in multi-year datasets. Combining the two objective weighting strategies can moderate risks caused by over-sensitivity to abnormal values and improve weight robustness for basin-scale comprehensive evaluation [15,16,17,18].
For multi-index comprehensive evaluation, multiple multi-criteria decision-making tools are available. The VlseKriterijumska Optimizacija I Kompromisno Resenje (VIKOR) method is oriented toward compromise-based scheme screening and fits comparative analysis among limited alternatives, rather than continuous annual index calculation for long-time-series records [19]. The Preference Ranking Organization Method for Enrichment Evaluations (PROMETHEE), Measurement of Alternatives and Ranking according to Compromise Solution (MARCOS) and Evaluation based on Distance from Average Solution (EDAS) demand manual tuning of preference-related parameters, which may bring unnecessary uncertainty when processing datasets covering multiple administrative cities over more than a decade [20,21]. By comparison, the Technique for Order Preference by Similarity to an Ideal Solution (TOPSIS) generates continuous, comparable composite scores without subjective parameter input, making it well-suited to track inter-annual WRCC fluctuations across basin subunits [22,23,24]. Even so, TOPSIS alone cannot quantitatively disentangle the drivers behind spatial heterogeneity of WRCC. As a spatial–statistical tool, the Geodetector model quantifies single-factor explanatory power as well as interactive coupling effects between variables, and fills this analytical gap for identifying driving mechanisms in water-related research [25,26,27].
Numerous existing studies have realized multi-model coupling that combines combined weighting, TOPSIS and Geodetector, forming a well-established technical paradigm for WRCC assessment. These approaches enable the characterization of spatiotemporal patterns and quantification of independent contributions from individual driving factors [11,17,18,28]. Nevertheless, most multi-model empirical applications focus on arid regions and large river basins [29,30,31,32], and few analyses are carried out from the perspective of urbanized plain tributaries as a distinctive human–water coupled system. Located in the transitional zone between the Huaihe and Yellow River basins, such medium-small watersheds suffer intensive anthropogenic hydrological alteration, where social, economic, hydrological and ecological elements are closely intertwined. Their evolutionary rules cannot be directly generalized from conclusions derived from arid zones or large basins. Morever, existing research tends to prioritise single-factor interpretations; reported factor-interaction outputs are often presented as pure statistical results, with limited mechanistic discussion on synergistic or antagonistic relationships between anthropogenic interference and natural hydrological conditions [24,25]. Compared with existing studies on other tributaries of the Huaihe and Yellow River, long-term systematic analysis that integrates combined-weighting-DPSIR-TOPSIS-Geodetector to reveal how multi-system interactions shape WRCC spatial heterogeneity remains scarce for cross-administrative urban-disturbed plain tributaries such as the Jialu River.
As an important sub-basin belonging to the Huaihe River system, the Jialu River Basin bears core responsibilities for urban water supply, flood risk prevention and ecological balance maintenance across multiple Central Plain cities. Intense industrial and domestic water demand, uneven water distribution between administrative regions and unstable hydrological cycles all impose persistent stress on local water systems. Such intertwined difficulties create visible barriers to rational water resource governance [33,34]. Spatial discrepancies and time-varying characteristics are widely observed in the basin’s WRCC, while quantitative and systematic investigations targeting its spatiotemporal differentiation laws and formative driving mechanisms remain insufficient in existing literature.
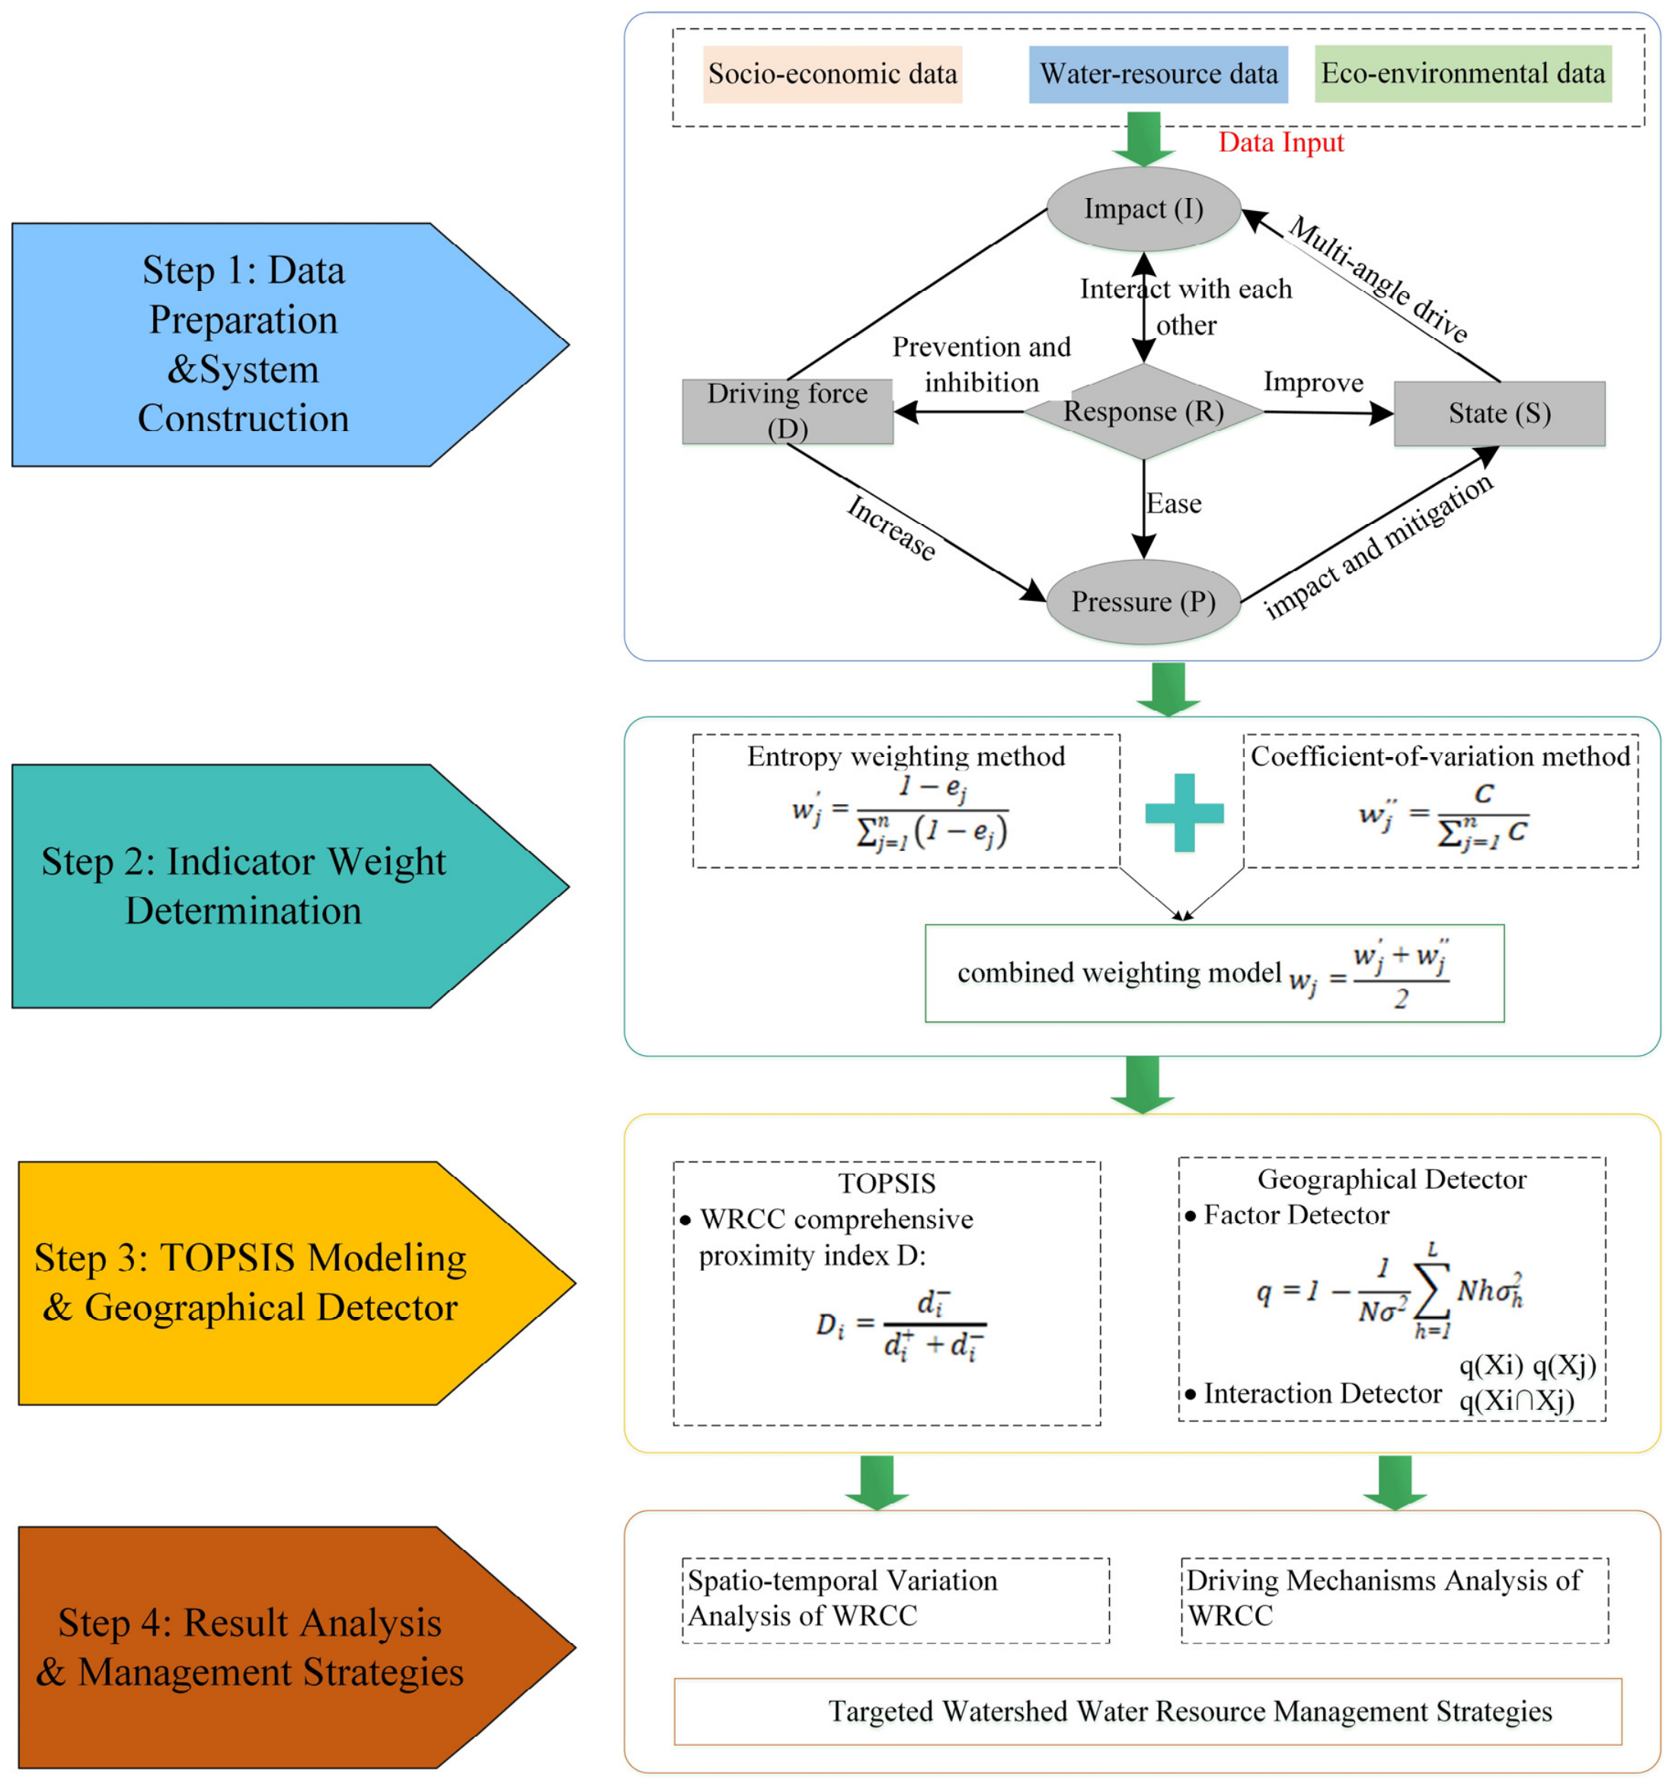
This study adopts the human–water coupled-system perspective for urbanized plain tributaries, covers the 2010–2022 study period, and takes the Jialu River Basin as its core research area. Evaluation indicators are organized following the DPSIR analytical logic. Indicator weights are computed by integrating the entropy weight method and coefficient-of-variation method to improve the objectivity and robustness of WRCC assessment. The TOPSIS model delivers quantitative WRCC scoring for every city unit distributed in the basin. The geodetector model is introduced next to calculate each factor’s independent explanatory capacity, alongside quantification of synergistic coupling interactions between multiple impact indicators. This quantitative analysis intends to disentangle the spatiotemporal evolutionary laws of basin WRCC and identify the dominant formative mechanisms behind its regional variations. Derived analytical outcomes can deliver theoretical references and actionable decision-making evidence. Local administrative departments can adopt these findings to optimize cross-regional water allocation frameworks, formulate differentiated zoning governance schemes, and facilitate the long-term sustainable exploitation of watershed water resources. The research framework is shown in Figure 1.

2. Materials and Methods

2.1. Overview of the Study Area

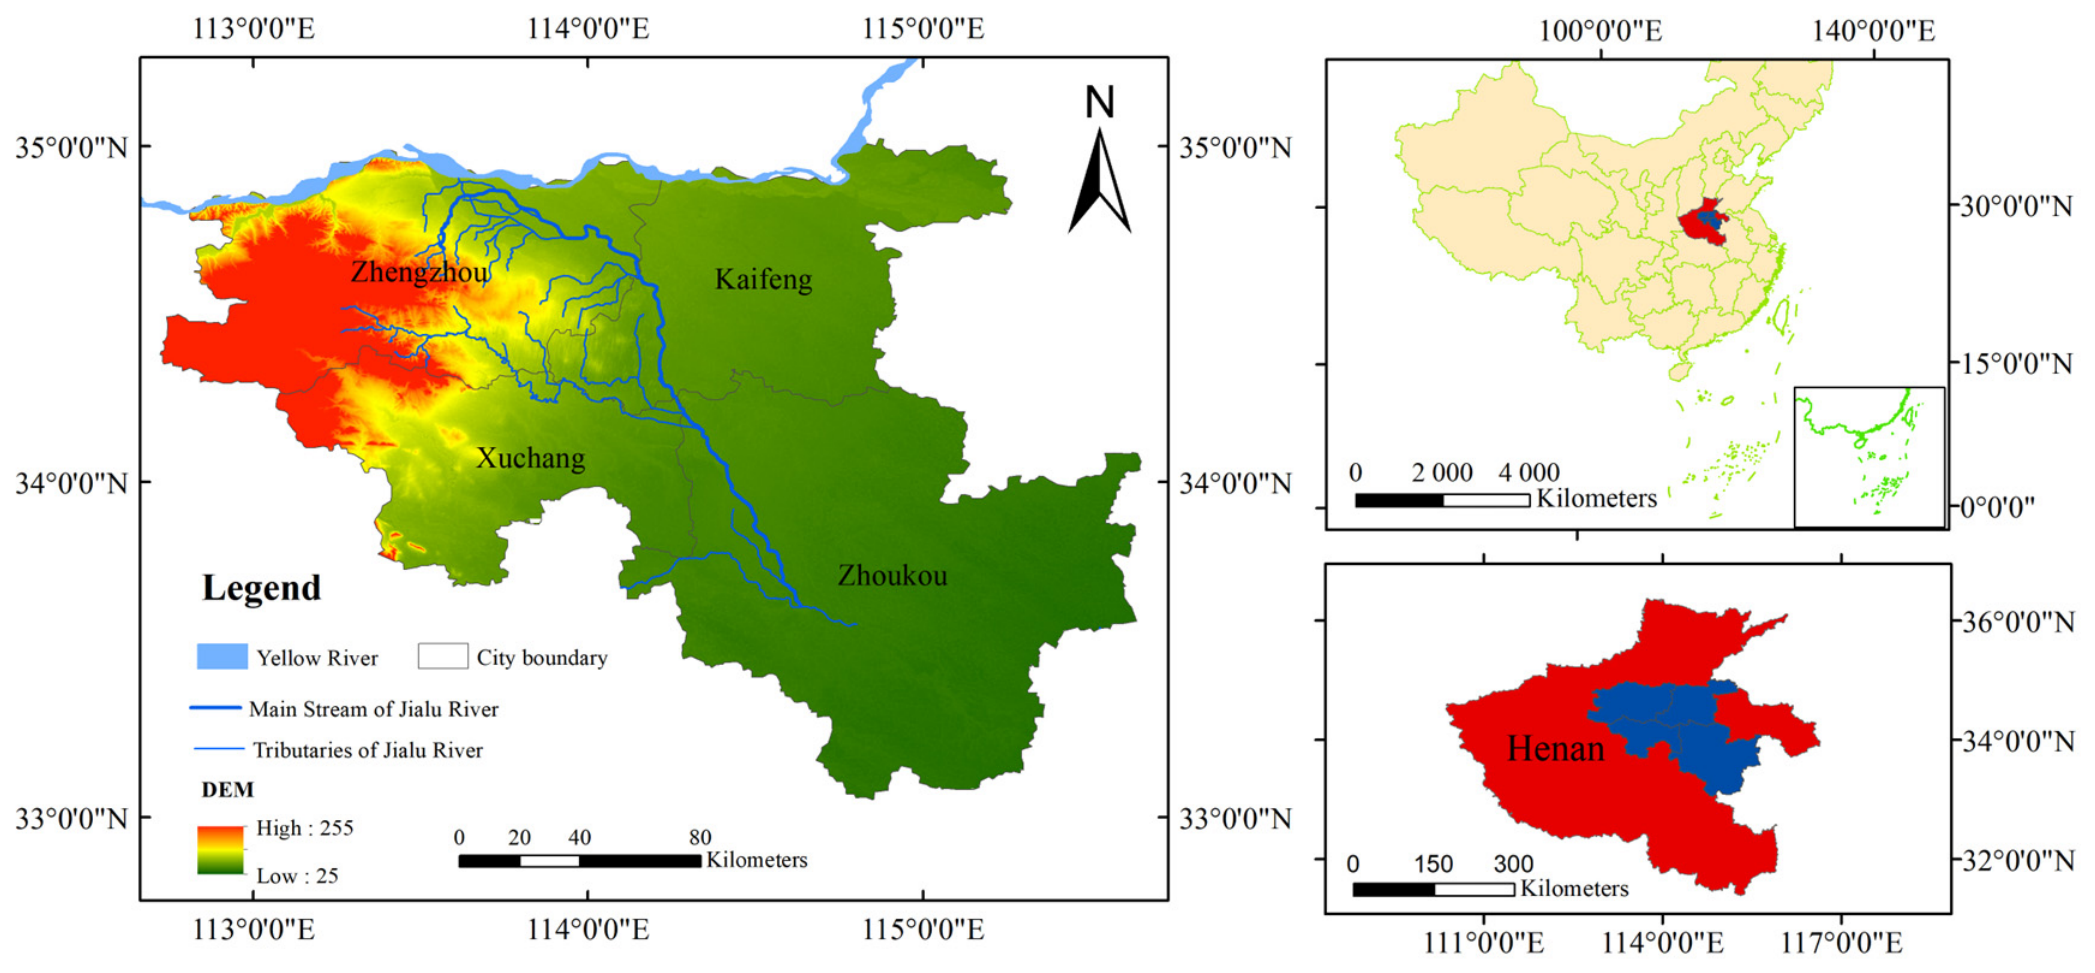
The Jialu River catchment lies within the southern zone of the North China Plain. Terrain characteristics form a stepped terrain descending from western uplands toward the eastern lowlands, covering composite geomorphic units ranging from mountainous zones and rolling hills to flat alluvial plains. This river system takes its source within Zhengzhou, Henan Province, traverses Kaifeng and Xuchang administrative territories, and joins the Shaying River watercourse in Zhoukou before flowing into the Huai River mainstream (Figure 2). The primary channel stretches 264 km, with the whole basin covering 6137 km2 [35]. Local stakeholders rely on this river system for ecological restoration, flood regulation and drainage, and farmland irrigation support. Specifically, the river extends for 137 km and drains a watershed area of 2750 km2 within Zhengzhou City [33]. Flowing east-southeastwards, it runs 68 km across Kaifeng, covering around 1030 km2 of local catchment. In Xuchang City, the watercourse spans 48 km, with its associated watershed occupying approximately 2077 km2. In Zhoukou City, the river stretches 81 km, draining a watershed area of 280 km2 and receiving an annual inflow of 488 million m3. With a long-term annual average runoff of 299 million m3 and 3466.7 km2 of cultivated land [35], the basin acts as a key national grain production zone guaranteeing regional food security. Boasting a complete industrial framework dominated by manufacturing, chemical and textile industries, it serves as a critical water carrier for high-quality socioeconomic development within the Central Plains Economic Zone.

2.2. Data Sources

The statistical data presented in this paper are drawn from the following primary sources: the Henan Statistical Yearbook (2010–2022), the municipal statistical yearbooks of the four cities within the Jialu River Basin, and the water resources bulletins of those four cities. These standardized official publications provide consistent and publicly verified socioeconomic, ecological, and hydrological indicators, including population density, natural population growth rate, urbanization rate, share of the tertiary sector in GDP, GDP per capita, water consumption per ten-thousand CNY of GDP, volume of wastewater discharge, per capita domestic water consumption, fertilizer application intensity, water consumption per ten-thousand CNY of industrial value added, per capita grain production, urban green space area, urban sewage treatment rate, R&D expenditure, and green coverage rate in built-up areas. Additional data were obtained from the Henan Province Water Resources Bulletin (2010–2022). This bulletin provides basin-level hydrological and water resources data for the four cities, including the water yield coefficient, annual precipitation, groundwater resources, surface water resources, water consumption rate, and water resource utilization rate. All adopted data underwent unified quality control and standardized preprocessing. First, original statistical indicators were strictly screened to eliminate abnormal and invalid statistical records. Second, missing values for wastewater discharge volume, fertilizer application intensity, and R&D expenditure were filled using temporal linear interpolation based on continuous time-series data of each individual city. This city-specific temporal interpolation avoids spatial confounding and ensures statistical consistency of socioeconomic indicators. Cross-year fitting validation was conducted for all interpolated items, with high fitting accuracy supporting data reliability. Nevertheless, minor uncertainty may still exist in individual interpolated annual values due to discrete statistical monitoring, which has limited influence on the overall spatiotemporal trend and driving factor analysis results. Third, uniform dimensionless standardization was performed for all evaluation indicators to eliminate the interference of magnitude differences. The processed multi-source dataset exhibits complete temporal continuity, reliable spatial consistency, and stable overall quality, which guarantees the scientificity and comparability of subsequent WRCC spatiotemporal evaluation and driving mechanism analysis.

2.3. Research Methods

2.3.1. The DPSIR Model

The Organisation for Economic Co-operation and Development (OECD) proposed the DPSIR analytical framework in 1993. Environmental assessment and watershed policy research have extensively adopted this structural logic over the following decades [36]. Five interrelated modules (Driving forces, Pressures, State, Impacts, Responses) build the core structure of this framework, which sorts out causal chains and feedback loops linking human socioeconomic activities, natural water endowments, and regional ecological conditions. The multi-dimensional structure simultaneously covers hydrological conditions, economic growth and ecological constraints, delivering high adaptability for quantitative evaluation of watershed WRCC [37]. Detailed connotations of each component are clarified below. Driving forces contain fundamental socioeconomic and demographic variables triggering shifts in regional water systems, with population expansion and industrial economic growth acting as core contributors. Pressures reflect direct and indirect human interference exerted on water bodies, including industrial sewage discharge and land cover transformation. State describes measurable real-time status of local water systems, quantified through water quantity and water quality monitoring indices. Impacts capture adverse outcomes triggered by water system variations, covering ecological degradation and long-term mismatches between regional water supply and human water demand. Responses summarize institutional, technical and administrative countermeasures addressing water-related risks, including water governance policies, water conservation technical upgrades, and holistic watershed ecological restoration projects.
A total of 21 evaluation indices were screened by combining three local realities of the Jialu River Basin: inherent natural water resource reserves, current socioeconomic development level, and regional ecological environment background. In addition to reflecting watershed actual conditions, these indicators are referenced from widely used WRCC assessment systems in previous relevant literature, and are hierarchically organized following the DPSIR causal logic [10,15,22,28,29]. The selected metrics constitute a complete evaluation system for basin-scale WRCC measurement (detailed classification provided in Table 1). Symbols assigned to each index reflect attribute orientation. Markers of “+” correspond to positive indicators, where larger numerical values signify elevated water carrying capacity. Markers of “−” stand for negative indicators; smaller index values indicate better regional WRCC performance.

2.3.2. Combined Entropy-Weighted and Coefficient-of-Variation Weighting Method

Single weighting algorithms commonly suffer from limited comprehensiveness and systematic bias in index quantification. Dual weighting strategies based on entropy and coefficient-of-variation algorithms are adopted in this study to refine index weighting rationality and enhance overall evaluation accuracy. The hybrid framework simultaneously captures the information dispersion characteristics and spatial variation features of each evaluation indicator, enabling more scientific and reasonable weight distribution for WRCC assessment.
(1) Entropy Weighting Method
Entropy weighting serves as a typical data-objective weighting approach, which quantifies indicator weights based on inherent information entropy and data dispersion degree [38]. Indices with lower entropy values present stronger data volatility and richer effective information, thereby deserving higher weight coefficients in comprehensive evaluation. Calculation procedures fully depend on original statistical data rather than subjective empirical judgment. Such characteristics effectively eliminate artificial intervention errors, guarantee objective weight calibration, and ensure evaluation results reflect the actual water resource system status of the study basin [39]. The procedural steps are outlined below:
① Standardization of indicators. The original data matrix is defined as X = (xij)m×n. We standardise positive and negative indicators separately to obtain the matrix Y = (yij)m×n.
The following positive indicators have been identified:
y i j = x i j m i n x i j m a x x i j m i n x i j
The negative indicators are defined as follows:
y i j = m a x x i j x i j m a x x i j m i n x i j
where xij represents the original value of the jth indicator for the ith city, m represents the total number of cities, and n represents the total number of indicators.
② Calculation of indicator weights:
e j = 1 ln m i = 1 m [ y i j i = 1 m y i j × ln y i j i = 1 m y i j ]
w j = 1 e j j = 1 n 1 e j
where ej represents the entropy value of the jth indicator, and wj’ represents the weight of the jth indicator.
(2) Coefficient-of-Variation Method
The coefficient-of-variation method is a statistical weighting technique that assigns weights to evaluation indicators based on their inter-object variability. Its underlying principle holds that the greater the variation in indicator values, the more effectively it differentiates developmental disparities among disparate evaluation objects, and consequently, the higher the assigned weight [40]. The method is not contingent upon the units of measurement and can accurately reflect the spatial differentiation characteristics of WRCC in the Jialu River Basin. The calculation formula is as follows:
C = 1 R 0 1 m i = 1 m R i R 0 2
w j = C j = 1 n C
where C represents the coefficient of variation, R0 represents the mean value of the jth indicator, Ri represents the raw value of the jth indicator, and wj” represents the weight assigned to indicator j.
(3) Combined Weight Calculation
The results obtained from the two methods are integrated via a linear weighting method to obtain the final combined weights, as shown in the following equation:
w j = w j + w j 2
where wj represents the weight after combined weighting.

2.3.3. TOPSIS Method

The TOPSIS method is an efficient multi-criteria evaluation technique that fully exploits information from raw data and accurately captures the differences among evaluation alternatives. It ranks alternatives based on their relative closeness to both the positive ideal solution and the negative ideal solution, thereby enabling objective prioritization and comparative assessment of performance [41,42]. The TOPSIS model is introduced to quantify the gap between actual watershed water resource conditions and theoretical optimal benchmark status for the Jialu River Basin. This approach can intuitively characterize the dynamic evolutionary trends and comprehensive level of regional WRCC. Detailed calculation procedures are implemented as follows.
(1) Weighted decision matrix generation. Standardized evaluation matrices are multiplied with corresponding index weights at the element level. This calculation yields a revised weighted matrix for subsequent comparative analysis, following the formula aij = yij × wj.
A = a 11 a 1 j a i 1 a i j
(2) Positive and negative ideal solution definition. The positive ideal solution integrates the optimal standardized value for each indicator across the entire dataset, forming the optimal evaluation set:
g j + = g 1 + , g 2 + , , g m +
By contrast, the negative ideal solution consists of the worst standardized values for all indicators, representing the poorest benchmark state:
g j = g 1 , g 2 , , g m
(3) Euclidean distance quantification. Euclidean distances between each evaluation unit and the two ideal solutions are calculated separately to quantify the relative deviation degree, with the formulas displayed as follows:
d i + = j = 1 m g i j g j + 2
d i = j = 1 m g i j g j 2
(4) Calculation of relative proximity index. The comprehensive proximity index D is adopted to judge the overall WRCC level of each research unit:
D i = d i d i + + d i
Proximity index values range from 0 to 1. Higher D values correspond to better water resources carrying capacity of the evaluated unit, while lower values indicate weaker comprehensive carrying performance.

2.3.4. Geographical Detector

Geographical detector is a mature spatial statistical analysis tool applied to identify spatial heterogeneity of geographical phenomena and decode potential driving mechanisms behind spatial differentiation. Its core theoretical basis lies in the spatial consistency rule: influencing factors dominating the spatial variation of research subjects often present highly overlapping spatial distribution characteristics with the target variables [25,43]. Prior to detection, all continuous driving factor variables were discretized into 5 strata using the natural breaks (Jenks) classification method, which groups data according to inherent statistical distribution characteristics and minimizes within-class differences. This study adopts two core functional modules of geographical detector, namely factor detector and interaction detector, to quantitatively distinguish the independent contribution of single driving factors and synergistic coupling effects of multiple factors on WRCC evolution in the Jialu River Basin during 2010–2022.
(1) Factor Detector
This module quantifies the explanatory capability of individual influencing factors for the spatiotemporal differentiation of WRCC across administrative cities in the study basin. The q-statistic is taken as the core evaluation indicator to characterize the correlation degree between each driving factor and WRCC variation, and the specific calculation formula is as follows:
q = 1 1 N σ 2 h = 1 L N h σ h 2
The q-statistic ranges strictly between 0 and 1. Larger q values mean the corresponding factor possesses stronger explanatory power for WRCC spatiotemporal differentiation. The symbol h denotes the classification number of driving factors; N represents the total number of evaluation units; σ2 refers to the overall variance of basin WRCC; and L corresponds to the classification subtypes of each driving factor.
(2) Interaction Detector
This module focuses on identifying coupling and interactive relationships among the 21 selected evaluation factors (X1–X21). It compares the explanatory capacity of single factors and multi-factor combinations for WRCC variation (Y), so as to clarify whether factor interaction presents mutual enhancement, mutual weakening, or independent effect characteristics. The analysis effectively reveals the dominant interactive modes of driving factors affecting regional water resources carrying capacity. The procedure is outlined as follows: Firstly, the q-values [q (X1)–q (X21)] for each of the 21 individual factors Xs with respect to Y are calculated. Then, the q-values [q (Xi∩Xj)] for the interaction between any two factors (which combine to form a new spatial distribution unit) are calculated. Third, the nature of each interaction is classified by comparing q(Xi), q(Xj), and q(Xi∩Xj), following the established criteria of the Geographic Detector framework. The classifications are as follows:
Nonlinear enhancement: q(Xi∩Xj) > q(Xi) + q(Xj);
Two-factor enhancement: max{q(Xi), q(Xj)} < q(Xi∩Xj) ≤ q(Xi) + q(Xj);
Single-factor nonlinear attenuation: min{q(Xi), q(Xj)} < q(Xi∩Xj) ≤ max{q(Xi), q(Xj)};
Nonlinear attenuation: q(Xi∩Xj) ≤ min{q(Xi), q(Xj)}.

3. Results

3.1. Analysis of the Weighted Combination of Evaluation Indicators

Based on the collected 21-indicator dataset covering the Jialu River Basin from 2010 to 2022, this study combined the entropy weighting method (Equations (1)–(4)) and the coefficient-of-variation method (Equations (5) and (6)) to calculate objective single-index weights, then integrated them via a combined weighting model (Equation (7)) to derive definitive weights of the 21 WRCC evaluation indicators for the Jialu River Basin from 2010 to 2022, as listed in Table 2.
The total weights of five DPSIR criterion layers show an obvious hierarchical order, State (S, 0.298) > Impact (I, 0.201) > Driving forces (D, 0.189) > Response (R, 0.173) > Pressure (P, 0.140), reflecting their differentiated contributions to regional WRCC. At the indicator level, R&D expenditure (0.131), urban green space area (0.124), and surface water resources (0.086) emerge as the most influential factors overall. Within each sub-layer, the core indicators are identified as follows: urbanization rate and per capita GDP (0.049 for both) dominate the driving forces layer; fertilizer application intensity (0.039) and per capita domestic water consumption (0.032) are the primary pressure indicators; surface water resources (0.086) and groundwater resources (0.082) constitute the principal state indicators; and R&D expenditure stands out as the dominant response indicator (0.131). Collectively, basin WRCC is governed by coupled multi-dimensional factors, among which water resource utilization and ecological conditions act as core constraints.

3.2. Spatio-Temporal Variation Analysis of WRCC in the Jialu River Basin

3.2.1. Temporal Evolution Characteristics

This study applies the Combined Weighted-TOPSIS model to calculate the WRCC proximity values for the Jialu River Basin from 2010 to 2022, using Equations (8)–(13). This study adopts mature WRCC hierarchical grading criteria from existing watershed evaluation research [11], with detailed threshold classifications summarized in Table 3. The proximity index calculated via TOPSIS quantification serves as a core indicator for diagnosing real-time water system operating status. Higher index readings correspond to more stable water resource utilization modes and stronger ecological resilience. In contrast, lower values signal constrained water carrying conditions and aggravated operational pressure on regional water circulation systems.
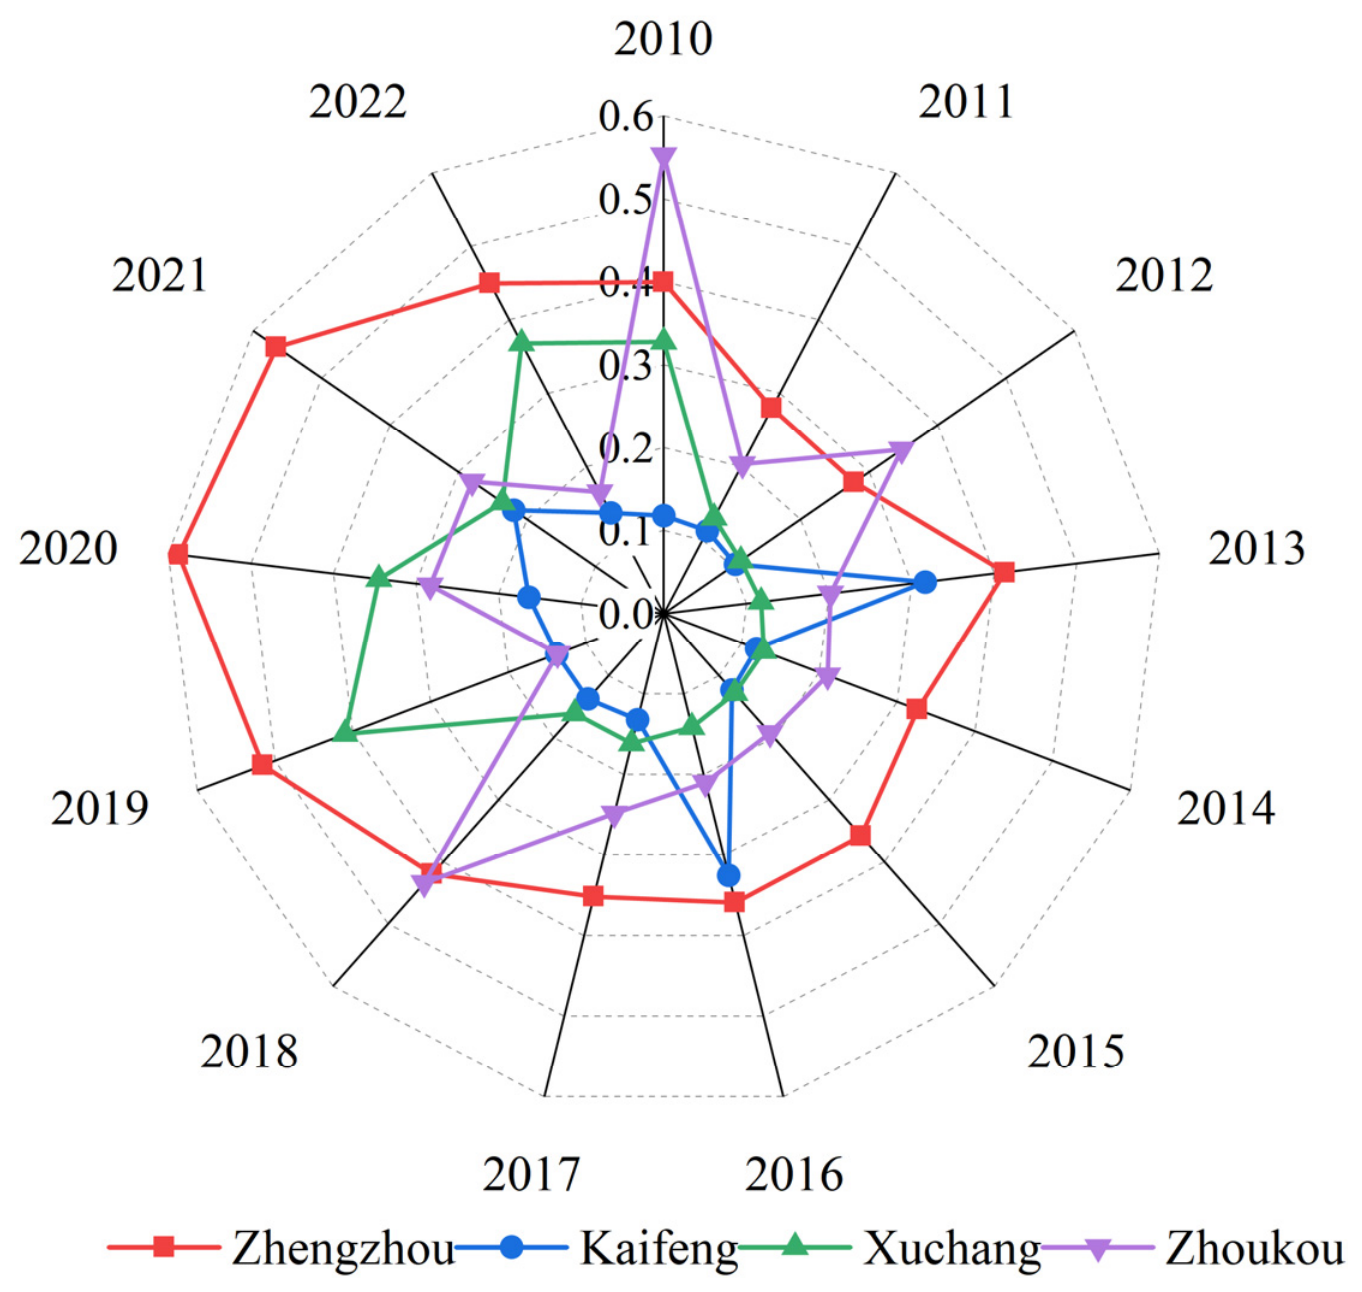
Based on the calculation results, a trend chart illustrating the temporal evolution of WRCC across cities within the basin from 2010 to 2022 was plotted (Figure 3), enabling a systematic analysis of its dynamic changes throughout the study period.
Zhengzhou’s WRCC failed to maintain stable and consistent evolutionary trends, exhibiting irregular undulations across the 2010–2022 research period. The calculated proximity index indicated critical overload conditions in 2010, with a recorded value of 0.40. Obvious deterioration occurred over 2011–2012, with the index declining to 0.28 and falling into the overload grade. Water system conditions recovered moderately in 2013, with the index bouncing back to 0.41 and returning to the critical overload state. Over the four-year period from 2014 to 2017, numerical variations remained constrained within a narrow range of 0.33 to 0.36, creating an ambiguous transitional state that alternated unpredictably between two overload grades. Slow yet steady optimization characterized the post-2018 stage, with the index stabilizing at 0.42 and sustaining critical overload conditions. The most substantial WRCC improvement occurred during 2019 to 2021, with annual index readings of 0.52, 0.59 and 0.57 gradually approaching the threshold of mild overload. Despite the cumulative positive improvement over multiple years, a minor performance regression took place in 2022, lowering the index to 0.45 and returning Zhengzhou’s water system to critical overload once again.
Persistent water system pressure plagued Kaifeng throughout the entire 12-year research cycle, as reflected in its consistently suppressed WRCC levels that rarely achieved effective improvement. The city commenced the study period under severe water overload, with an extremely low proximity index of 0.12 in 2010. Regional water carrying conditions remained largely stagnant from 2011 to 2015, as annual index values fluctuated minimally between 0.10 and 0.12 without any substantive breakthrough. Although a marginal numerical uptick occurred in 2013, this one-off annual fluctuation lacked the capacity to reverse the region’s long-term low-level operational predicament. A brief yet remarkable improvement surfaced in 2016, lifting the index to 0.33 and temporarily alleviating severe water system overload. Such favorable changes proved highly unstable, however, as the index plummeted sharply to 0.13 in 2017. For the remainder of the study period from 2018 to 2022, interannual index variations stayed limited within 0.14 to 0.22, locking Kaifeng’s water system in a prolonged state of severe overload for most monitoring years.
Distinct from the staged fluctuation patterns of other basin cities, Xuchang’s WRCC displayed highly disordered temporal variations with no predictable long-term evolutionary rules. Local water resources already fell into overload status in the baseline year of 2010, with a proximity index calculated at 0.33. What followed was an extended period of ecological stagnation spanning 2011 to 2018, during which index values lingered between 0.11 and 0.16 and continuously reflected severe water system overload. A pivotal turning point appeared in 2019, breaking the eight-year low-value dilemma; the index surged noticeably to 0.41, successfully upgrading regional WRCC to the critical overload grade. This hard-won optimization failed to sustain in subsequent years. Both 2020 and 2021 witnessed continuous degradation of water carrying capacity, with index values declining sequentially to 0.35 and 0.24. While a moderate recovery pushed the index up to 0.37 in 2022, this late-stage rebound was too limited to form stable and durable water system improvement.
Zhoukou’s WRCC presented a unique fluctuating degradation trend across the study period, with overall aquatic system resilience weakening progressively under long-term human interference. Boasting the optimal baseline water resource conditions among all study cities in 2010, the region recorded a proximity index of 0.55, which was nearly close to the mild overload threshold. Nevertheless, these advantageous initial conditions deteriorated drastically in 2011, where a sharp index drop to 0.28 instantly pushed regional water resources into formal overload. A short-term capacity rebound emerged in 2012, yet this isolated annual improvement could not reverse the inherent downward evolutionary tendency. Low-amplitude and stable fluctuations dominated the 2013–2017 period, with annual indices maintaining a low magnitude of 0.19 to 0.25 under sustained water resource pressure. A notable recovery occurred in 2018, raising the index to 0.43 and realizing critical overload classification. Unfortunately, the upward developmental momentum collapsed abruptly in 2019, with the index slumping to 0.14 and triggering a return to severe overload status. The final three monitoring years were characterized by irregular mild fluctuations, and regional WRCC ultimately stabilized within the range of 0.17 to 0.28 from 2020 to 2022.

3.2.2. Spatial Variation Analysis of WRCC in the Jialu River Basin

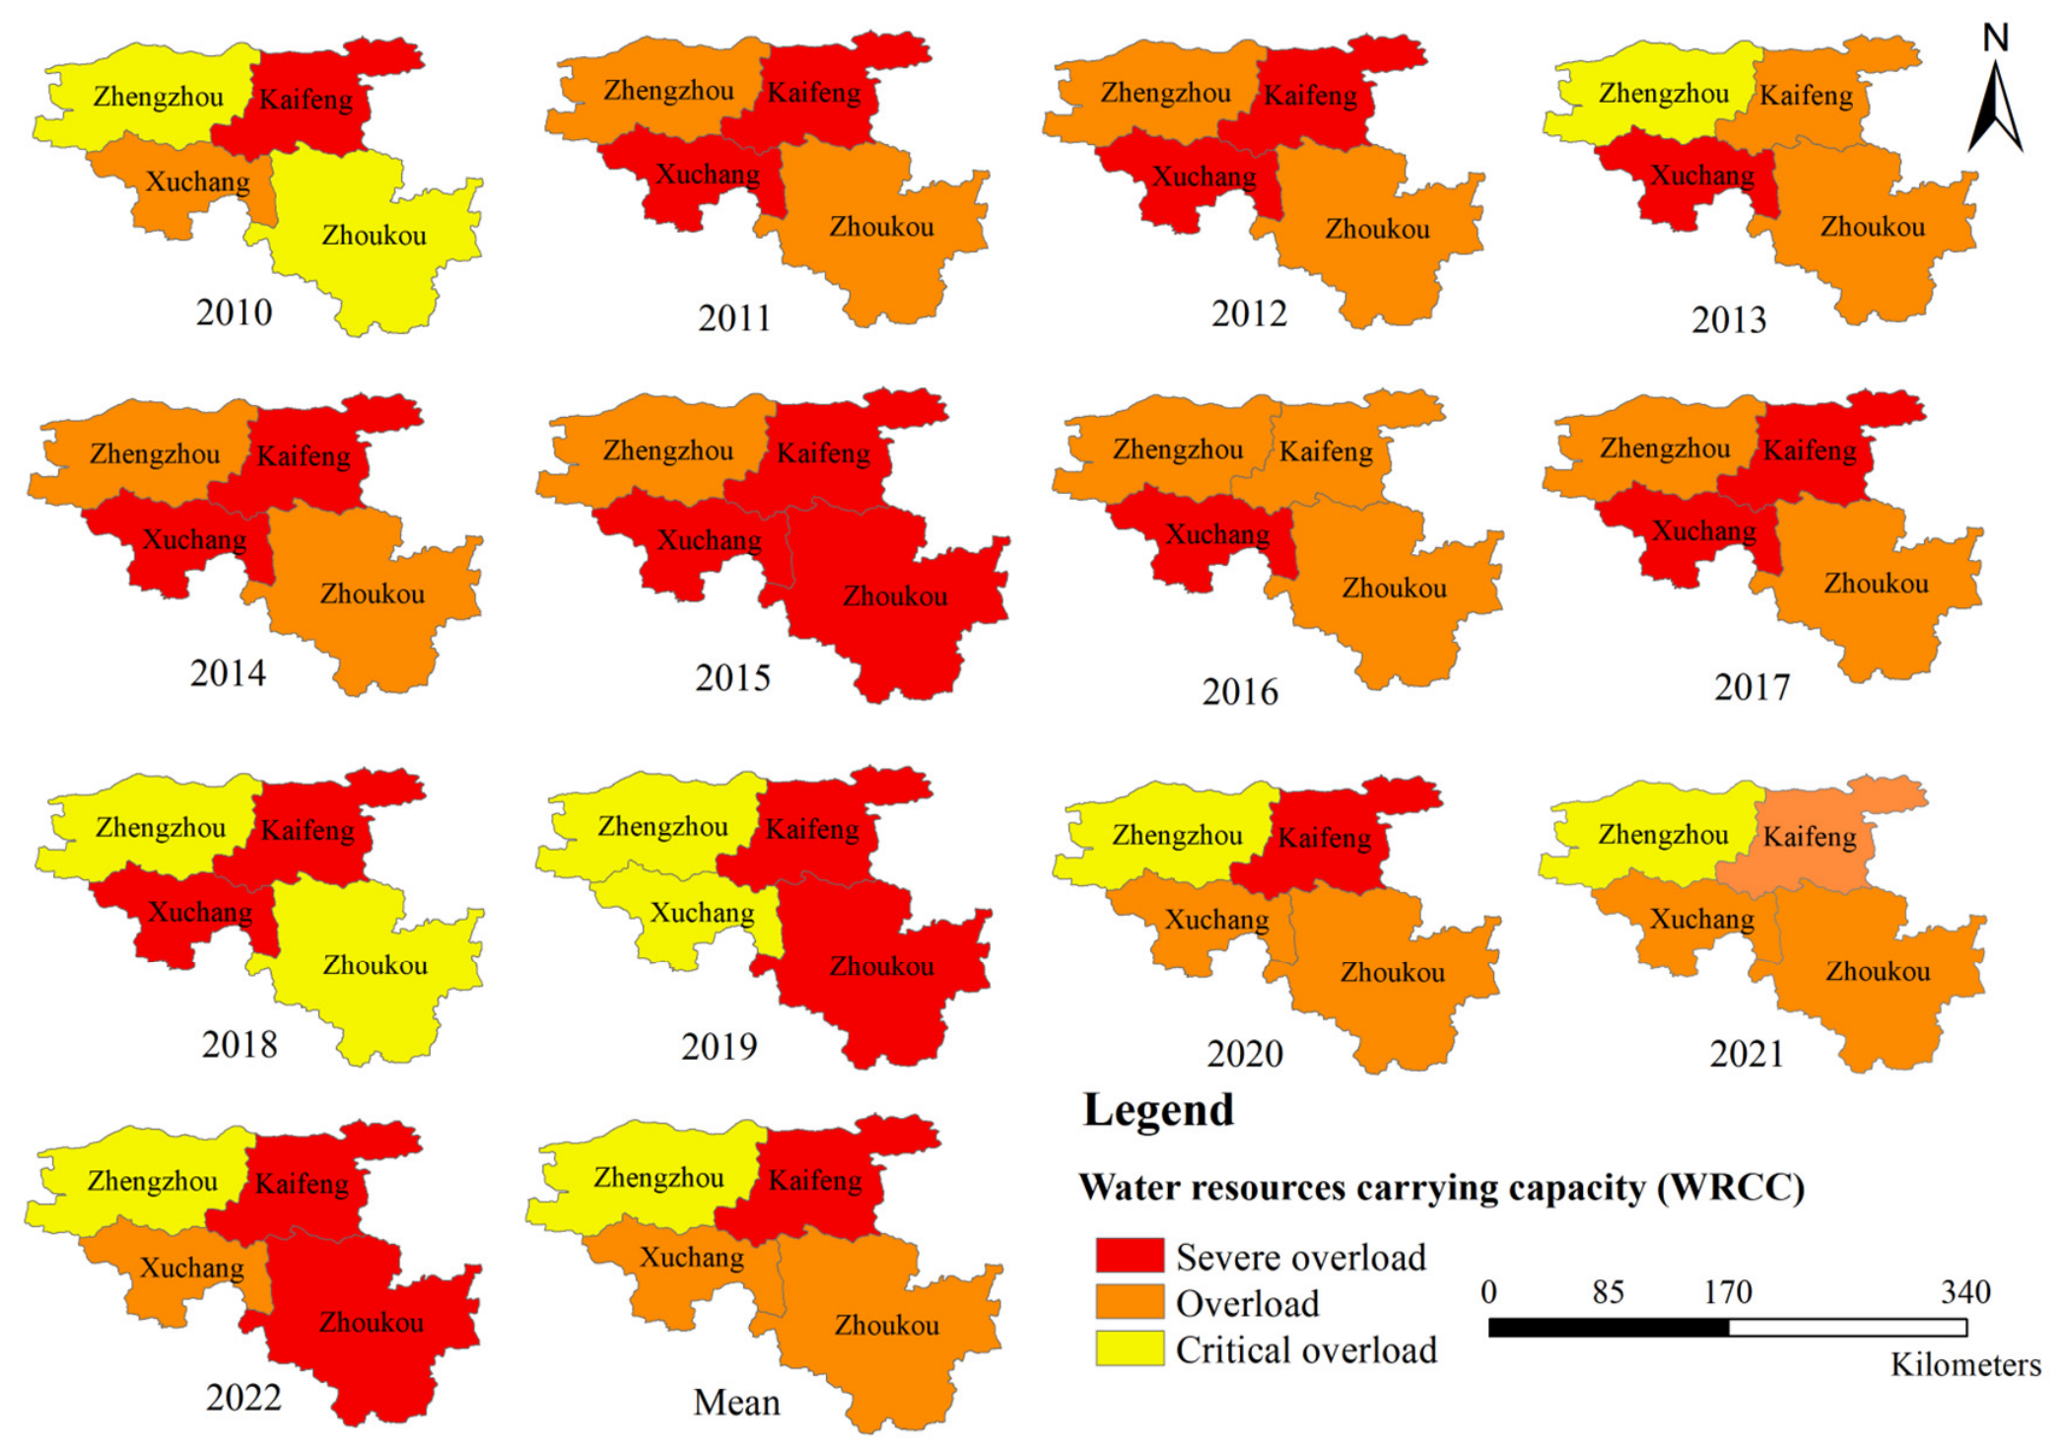
Figure 4 intuitively reflects the spatial distribution disparities of WRCC across the Jialu River Basin. The overall WRCC distribution forms a stable hierarchical spatial gradient. Among all administrative units, Zhengzhou consistently sustains the highest WRCC, followed by Zhoukou, while Xuchang and Kaifeng retain relatively low carrying levels throughout the study period. This study selects multiple representative years covering diverse hydrological backgrounds and basin development stages to sort out spatial evolutionary characteristics of regional WRCC. The differentiated spatial patterns corresponding to each typical time node are elaborated below.
(1) 2010 (Base year): The basin presented a typical polarized WRCC spatial pattern in the baseline year. Zhoukou and Zhengzhou yielded proximity indices of 0.55 and 0.40, respectively, with both regions sitting near the critical threshold of overload. Obvious spatial stratification emerged across the whole basin. Xuchang fell into the overload grade with an index of 0.33, while Kaifeng recorded the lowest basin-wide value of 0.12, corresponding to severe overload status.
(2) 2012 (Drought year): Universal WRCC degradation occurred across the entire basin under extreme drought conditions, creating a spatial feature of comprehensive system deterioration. Both Zhengzhou (0.28) and Zhoukou (0.35) retreated to the overload state. Further capacity attenuation was observed in the other two cities. Xuchang (0.11) and Kaifeng (0.10) both dropped to the severe overload interval, showing synchronized weakening of regional water system carrying performance.
(3) 2014 (Project Transition Period): The basin’s overall WRCC remained at a low-to-medium level in this transitional stage, without obvious spatial improvement across regional units. Zhengzhou (0.33) and Zhoukou (0.21) continued to maintain overload characteristics. Xuchang (0.13) and Kaifeng (0.12) still suffered from persistent severe overload. This stage preceded the official water delivery of the central route of the South-to-North Water Diversion Project at the end of 2014, when the basin’s overall water allocation capacity remained constrained.
(4) 2016 (Wet year): Abundant annual precipitation effectively replenished surface and underground water resources within the basin. The formal operation of cross-basin water supply projects further optimized regional water resource conditions, driving moderate WRCC promotion across the study area. Spatial classification results show that Zhengzhou (0.36), Kaifeng (0.33) and Zhoukou (0.21) belonged to overload areas. Xuchang failed to achieve effective capacity recovery, maintaining a stable severe overload state at 0.14.
(5) 2018 (Remediation and Improvement Phase): WRCC spatial distribution exhibited distinct regional differentiation in 2018. Carrying capacity varied substantially between central and peripheral zones. Core urban areas obtained measurable WRCC advancement, while outlying regions showed negligible positive variation. Index growth occurred in Zhengzhou and Zhoukou, with values rising to 0.42 and 0.43, respectively, and both cities transitioning to critical overload. Such spatial optimization failed to benefit peripheral regions. Xuchang (0.16) and Kaifeng (0.14) retained persistently low WRCC levels, remaining in severe overload without obvious amelioration.
(6) 2020 (Optimization and Improvement Phase): Spatial heterogeneity continued to dominate basin WRCC distribution in 2020. Capacity optimization presented obvious spatial agglomeration, with effective improvements concentrated in core urban zones and inconsistent evolutionary trends observed across peripheral units. Zhengzhou achieved the most remarkable WRCC promotion basin-wide, with the index rising to 0.59 and gradually approaching the mild overload threshold. The other three cities maintained low carrying levels with distinct interregional differences. Xuchang saw steady capacity growth to 0.35, while Zhoukou remained stable at 0.28; both fell within the overload category. Kaifeng still exhibited the weakest basin-wide carrying performance at 0.16, sustaining stable severe overload characteristics.
(7) 2022 (Current year): The basin’s overall WRCC presented a mild declining trend in 2022. Zhengzhou’s carrying capacity retreated slightly compared with its 2020 optimal level, with the index declining to 0.45 and staying within the critical overload grade. Xuchang was classified as an overloaded area (0.37) but stabilized its capacity through inter-basin water transfers and expanded use of non-conventional water sources. Meanwhile, Zhoukou fell into the severely overloaded category (0.17), and Kaifeng continued to exhibit a low carrying capacity (0.14).

3.3. Driving Mechanisms Analysis of WRCC

This study selected 21 influencing factors and used the Geodetector to systematically analyze their single-factor explanatory power and interactive effects on the spatial variation of WRCC.

3.3.1. Analysis of Single-Factor Driving Strength

The Geodetector’s q-statistic quantified the explanatory power of each factor, and significance tests were conducted using p-values (Table 4). Over 66.7% of the driving factors passed the p < 0.05 test, showing marked differences in driving strength. Top drivers were R&D expenditure (X20, q = 0.58), urbanization rate (X2, q = 0.57), fertilizer application intensity (X9, q = 0.56), population density (X1, q = 0.55), per capita grain production (X12, q = 0.52), per capita GDP (X4, q = 0.51), and water consumption per ten-thousand CNY of GDP (X6, q = 0.51). The next strongest were urban green space area (X18, q = 0.50), water consumption rate (X16, q = 0.48), and wastewater discharge volume (X7, q = 0.48). Notably, natural factors, such as precipitation volume (X13, q = 0.11) and groundwater resources (X14, q = 0.09), exhibited weak explanatory power.

3.3.2. Analysis of Interactions Among Driving Factors

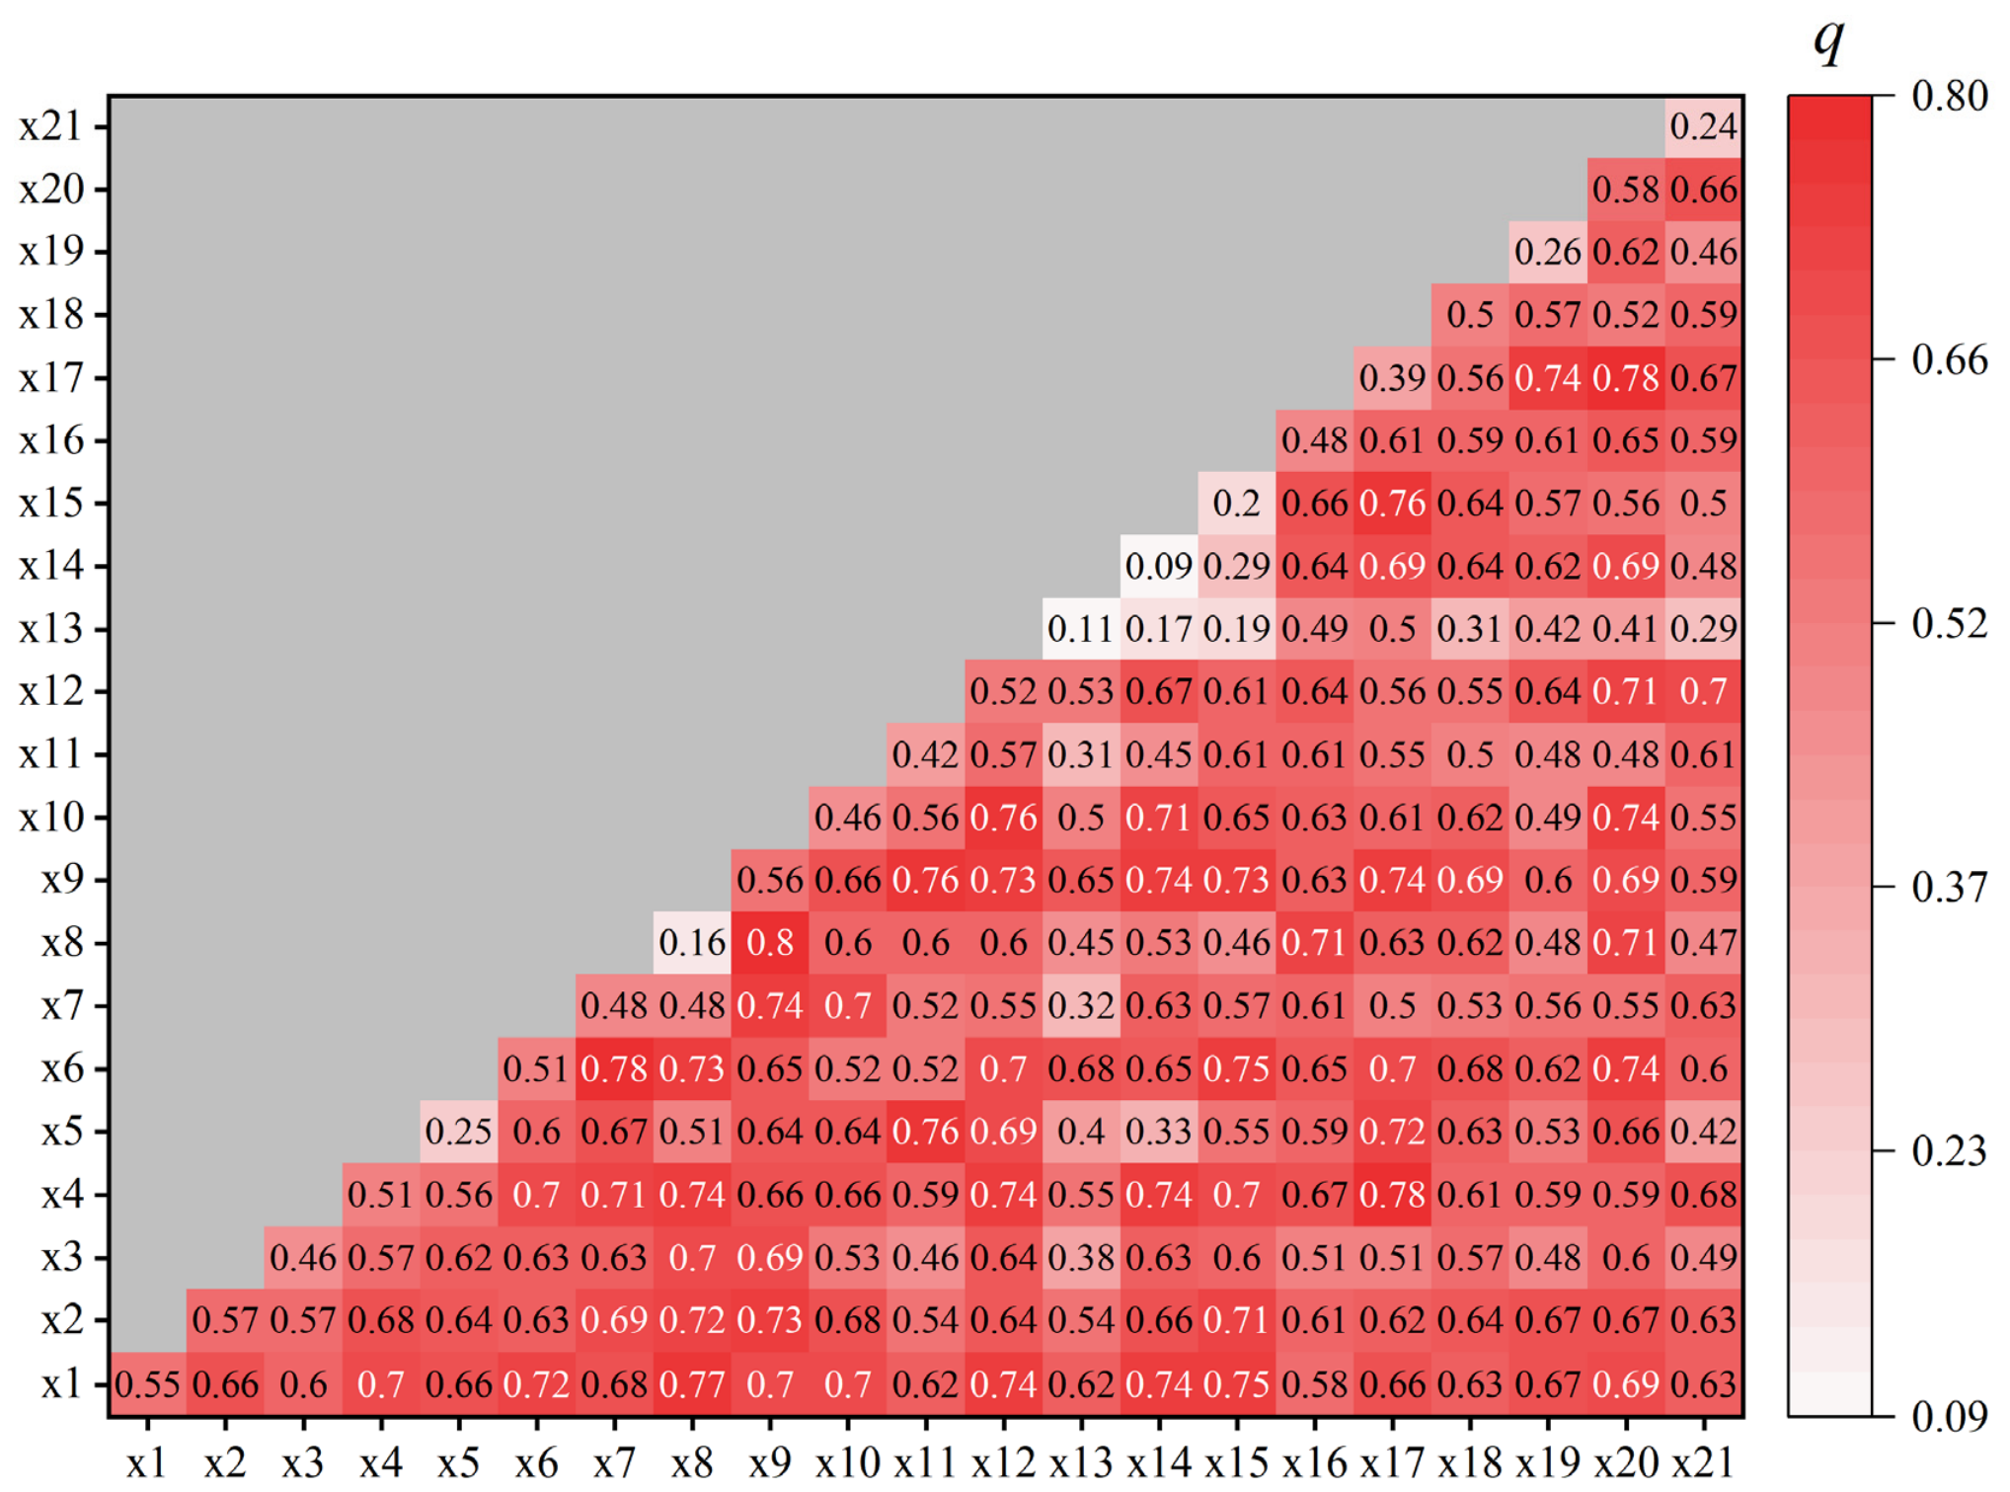
The Geodetector identified pairwise interactions among the 21 driving factors (Figure 5). Overall, basin–factor interactions were predominantly positive synergistic, with relatively high synergy intensity.
In terms of interaction type structure, there were 134 two-factor enhancements (70.53%), 40 nonlinear enhancements (21.05%), and 16 single-factor nonlinear weakenings (8.42%). No factor combinations exhibited nonlinear weakening effects throughout the analysis. The average q value of interactive factor detection reached 0.58, which was 45% higher than the average single-factor q statistic of 0.40. The synergistic explanatory power was far superior to that of the factors acting independently.
Q-value-based classification of interaction intensity shows a concentration in the mid-range and dispersion at both extremes across the watershed. Moderate interactions (0.6 ≤ q < 0.7) dominate (41.05%, 78 groups), followed by weak (0.5 ≤ q < 0.6; 24.74%, 47 groups), strong (0.7 ≤ q < 0.8; 18.95%, 36 groups), and extremely weak (q < 0.5; 14.74%, 28 groups); only one group exhibits extremely strong interaction (q = 0.80, 0.53%). Distinct discrepancies in interactive explanatory power were detected among different factor categories. Negative pressure factors presented a higher average interactive q value of 0.65, while positive support factors averaged only 0.56. Nonlinear enhancement occurred in 32.5% of cross-type interactions between positive and negative factors, a figure markedly higher than the 18.7% observed for same-group factor interactions. This numerical distinction indicates that paired factors across pressure and support dimensions tend to trigger stronger nonlinear amplification effects. A typical case involved the negative indicator X9 and positive indicator X20, whose interactive q value reached 0.69. This value was 19.0% higher than the maximum explanatory capacity of the single factor X20 (q = 0.58), further verifying that technical input exerts prominent modulating effects on the spatial variation of agricultural non-point source pollution.
Typical interaction relationships demonstrate that, in the context of nonlinear amplification, the interaction between X9 (q = 0.56, negative) and X8 (q = 0.16, negative) exhibit a q-value of 0.80, exceeding the sum of the q-values of the two factors by 11.11%, thereby forming a significant nonlinear stress effect. Following this maximum-q group, two bivariate-enhancement combinations reach q = 0.78: water consumption per ten-thousand CNY of GDP (X6, q = 0.51) and wastewater discharge (X7, q = 0.48), as well as R&D expenditure (X20, q = 0.58) and water resource utilization rate (X17, q = 0.39). Next in strength are two groups with q = 0.74, including population density (X1, q = 0.55) and precipitation (X14, q = 0.11), and per capita GDP (X4, q = 0.51) and per capita grain production (X12, q = 0.52). A further notable synergistic pair is urbanization rate (X2, q = 0.57) and surface water resources (X15, q = 0.20), yielding an interaction q-value of 0.71. Taken together, these top-ranking synergistic pairs reveal that WRCC spatial patterns are jointly shaped by the superimposed stress of pollution discharge, agricultural activities, socioeconomic development and natural water endowment.

4. Discussion

4.1. Model Reliability Verification and Comparative Analysis with Existing Studies

To verify the reliability of the comprehensive evaluation results of WRCC, this study conducted a robustness test based on different weight assignment strategies. Three weighting schemes were adopted for comparative analysis, including the single entropy weight method, the single coefficient-of-variation method, and the combined weighting method applied in this study. The TOPSIS model was recalculated independently under each scheme to obtain different time-series closeness coefficients. Pearson correlation analysis was utilized to quantitatively evaluate the consistency among multiple evaluation results. The Pearson correlation coefficients between the single-weighting results and the combined-weighting results were 0.98 and 0.97 respectively (both p < 0.001). Although slight numerical differences existed in individual annual values, the temporal evolution trends and overall ranking characteristics of WRCC under different weighting configurations remained highly consistent, without obvious structural deviation or rank reversal. These results indicate that the evaluation outcomes and temporal–spatial differentiation characteristics obtained in this study are sufficiently robust and not significantly affected by weight method selection. These results indicate that the evaluation outcomes and temporal–spatial differentiation characteristics obtained in this study are sufficiently robust and not significantly affected by weight method selection.
This study further compares the WRCC characteristics of the Jialu River Basin with existing basin and city scales to identify consistencies and regional discrepancies, which provides cross-validation for the reliability of our evaluation outputs. In terms of temporal variation, the fluctuating rising trend of Zhengzhou’s WRCC derived in this study is consistent with the findings reported by Jia and Wang [44]. Their research showed that Zhengzhou’s WRCC varied from 0.418 to 0.556 during 2010–2019, which is broadly in line with the improving trend observed in this study. Such consistent temporal evolution further supports the credibility of our main conclusions. Nevertheless, noticeable numerical gaps exist between different evaluation systems. In this study, Zhengzhou’s WRCC values range from 0.28 to 0.59, and the overall basin average remains low at 0.18–0.35, which is evidently lower than the city-scale results of 0.418–0.556 and also lower than the WRCC levels of the Yellow River (Henan section, 0.47–0.59) [45]. Such discrepancies primarily stem from methodological differences across studies, including indicator screening criteria, the composition of the evaluation system, weighting calculation routines, and quantitative assessment workflows. Method-driven uncertainties are unavoidable in WRCC quantification, as each study makes distinct judgements when selecting indicators and assigning index weights [46]. Combined with the Jialu River’s intrinsic limited water endowment and intensive dual water consumption from urban and agricultural activities, the basin’s average WRCC is naturally lower than that of surrounding large plain basins. In addition, inter-basin water transfer represented by the South-to-North Water Diversion project also brings confounding effects to WRCC evaluation within the Jialu River Basin. Imported water resources improve local water-supply conditions and regional water-carrying status; however, transferred water volume cannot be independently separated from municipal aggregated statistical data in the available datasets. Consequently, water-diversion effects are implicitly embedded within municipal water-use statistics rather than explicitly quantified in our assessment. These contextual and methodological factors help explain the observed numerical deviations and should be considered when interpreting our evaluation results, while the overall temporal and spatial patterns remain robust.

4.2. Temporal Evolution and Heterogeneous Distribution Characteristics of WRCC

From 2010 to 2022, WRCC across the four cities of the Jialu River Basin failed to follow regular linear variation rules, instead displaying irregular staged fluctuations. Such unordered evolutionary characteristics suggest that water systems in plain urban watersheds are highly susceptible to the combined impacts of natural hydrological variability and intensive human socioeconomic activities. Outputs from the Combined Weighted-TOPSIS model further confirm widespread spatial and temporal heterogeneity in regional WRCC performance, with each administrative unit facing unique water pressure constraints and differentiated developmental dilemmas. Although basin-scale WRCC trended mildly upward amid recurring oscillations, such unstable evolutionary states reveal notable loopholes in long-term water governance systems. These structural defects leave local aquatic ecosystems with poor disturbance resistance and insufficient adaptive resilience.
As the core urban cluster within the basin, Zhengzhou outperformed other regions in terms of WRCC level and developmental potential. Frequent state alternations between overload and critical overload occurred in the early study phase, which intuitively reflected poor operational stability of the local water resource system. Substantial WRCC improvements took place consecutively from 2019 to 2021, driven by updated water management frameworks, scaled application of water-saving technologies, industrial restructuring, and increased financial input into ecological construction and research. These multi-pronged regulatory measures effectively relieved urban water supply tension, boosted overall water utilization efficiency, and gradually pushed regional WRCC close to the mild overload threshold. Even so, a noticeable WRCC drop in 2022 exposed inherent structural defects in regional water allocation. Continuous urban sprawl drove rising domestic and industrial water demand, while erratic annual precipitation further aggravated seasonal water shortages. In this sense, technological upgrades and policy interventions can only deliver transient WRCC optimization, incapable of building long-term stable mechanisms for regional water system sustainability.
Differing greatly from Zhengzhou’s phased improvement features, Kaifeng suffered from chronically suppressed WRCC and persistent severe water system overload across the entire study period. Regional water carrying capacity remained extremely depressed between 2011 and 2015. While sporadic rainfall events triggered marginal, short-term capacity rebounds, these fleeting fluctuations never translated into sustainable water system restoration. A temporary WRCC recovery emerged in 2016, yet this positive shift reversed abruptly in 2017, strongly evidencing the weak self-repairing ability and fragile ecological foundation of Kaifeng’s aquatic environment. Unlike the development-driven water stress observed in core urban areas, Kaifeng’s long-term water carrying deficit originates from backward developmental patterns and insufficient ecological governance investment. Dominated by extensive traditional farming, the region struggles with excessive agricultural water consumption and pervasive non-point source pollution. Without systematic water-saving renovation and targeted ecological remediation, low WRCC status has become a persistent bottleneck restricting local water resource sustainability.
Xuchang’s WRCC presented highly disordered interannual variations and poor systematic stability. The regional water system endured prolonged severe overload from 2011 to 2018, with no effective large-scale improvement detected during this period. The year 2019 constituted a critical inflection point for local WRCC evolution. Cross-basin water diversion projects and targeted ecological restoration effectively filled regional water supply gaps, lifting local WRCC to the critical overload grade. This practical evidence proves that hydraulic engineering regulation and ecological remediation can achieve favorable short-term WRCC promotion. Nevertheless, continuous fluctuations and gradual capacity degradation after 2020 exposed prominent deficiencies in refined water governance. Unregulated wastewater discharge and low water use efficiency gradually offset previously accumulated ecological benefits, leading to repeated declines in water carrying performance. Such evolutionary laws indicate that single engineering water replenishment cannot sustain long-term WRCC stability. Coordinated progress in water quality improvement, pollution control and efficient water utilization is essential for durable capacity optimization.
Zhoukou’s WRCC evolutionary trajectory differed sharply from the fluctuating improvement trends of other cities, displaying an overall deteriorating tendency throughout the study years. The region possessed superior initial water resource endowments in 2010, yet these favorable baseline conditions decayed gradually over time, eventually evolving into long-term water system overload. A dramatic WRCC decline occurred in 2011, followed by years of low-level steady fluctuations and occasional short-term recoveries. This persistent capacity degradation is mainly attributed to the uncoordinated development of socioeconomic construction and water ecological protection. Sustained urbanization and industrial expansion have continuously elevated regional water demand, while long-term cumulative human disturbance has undermined the structural integrity of local aquatic ecosystems. Furthermore, excessive reliance on emergency water regulation measures and the absence of systematic long-term water management plans have hindered fundamental improvements, resulting in progressive weakening of the regional water ecological system.
At the overall basin scale, WRCC variations across the four cities collectively formed a fluctuating upward trend from 2010 to 2022, demonstrating that local ecological restoration and water resource optimization policies have yielded practical positive outcomes. Even so, this phased and unstable growth pattern differs greatly from the steady improvement commonly observed in large, well-managed river basins, where systematic basin-wide governance ensures continuous water system optimization [45]. Unlike inland arid basins dominated by natural water endowments, the Jialu River Basin presents far higher sensitivity to anthropogenic interference, which accounts for its unstable, stage-dependent evolutionary features [24,30]. Comparable observations have been documented in Anzali Wetland in northern Iran exposed to intensive anthropogenic pressure; human-induced interference produces oscillating water-carrying-capacity trajectories, and engineering measures alone cannot generate persistent long-term benefits for basin water systems [1].
Apart from prominent temporal heterogeneity, the basin’s WRCC also exhibits distinct zonal spatial differentiation. High WRCC values are primarily distributed across upstream ecological conservation zones. In comparison, midstream and downstream areas, which are dominated by urban agglomeration and intensive agricultural cultivation, generally maintain low carrying capacity levels, forming a steady upstream–downstream decreasing gradient. This spatial stratification arises from comprehensive regional disparities in natural water endowments, population aggregation, industrial layout and ecological investment across administrative units [11,34]. While the Iranian hyper-arid watershed also presents obvious inter-regional WRCC vulnerability gaps shaped by water availability, human exploitation and infrastructure conditions, its spatial disparity is largely governed by transboundary water inflow and arid climatic background [28]. By contrast, the spatial polarization of the Jialu River is mainly driven by coupled urban–agricultural anthropogenic pressures under plain conditions. The evident WRCC spatial imbalance reflects a typical developmental dilemma for medium-sized tributaries in the Huaihe River system, specifically the difficulty of balancing urban economic development, grain-oriented agricultural production and aquatic ecological conservation. Compared with large basins equipped with mature water regulation systems and refined governance schemes, small and medium-sized plain tributaries lack regionally targeted differentiated management policies. Such institutional deficiencies further widen inter-regional water pressure gaps and intensify spatial polarization of basin-scale WRCC [16,46].

4.3. Driving Mechanism of WRCC Spatial Differentiation

Based on the spatiotemporal evolutionary rules of WRCC summarized above, this study adopted geographical detector analysis to unpack the intrinsic driving mechanisms responsible for spatial disparities across the Jialu River Basin. A total of 21 indicators covering social, economic, ecological and natural hydrological dimensions were incorporated into the quantitative model, enabling systematic evaluation of single-factor explanatory power and pairwise interactive coupling effects. This multi-dimensional analytical framework effectively distinguishes independent individual factor influences from synergistic coupled impacts, clarifying how the basin’s spatially heterogeneous WRCC pattern forms and evolves. Different from conventional correlation analysis which cannot quantify driving intensity, the q-statistic derived from geographical detector modelling delivers objective numerical characterization of each factor’s explanatory capacity. This provides solid empirical support for interpreting the complex spatiotemporal dynamics of regional water resource carrying systems.
Single-factor detection results showed that over 66.7% of the selected indicators passed significance testing at p < 0.05, with obvious divergence in their respective driving magnitudes. On the whole, anthropogenic socioeconomic factors dominated WRCC spatial differentiation, constituting the core driving system that dictates basin-scale WRCC evolution. The most influential indicators included R&D expenditure, urbanization rate, fertilizer application intensity and population density, alongside per capita grain output, per capita GDP and water consumption per ten-thousand CNY of GDP. These indicators comprehensively reflect cumulative disturbances from urban expansion, economic growth and intensive agricultural activities, suggesting that human-socioeconomic interference constitutes one of the major contributing factors behind regional water-resource pressure and spatial WRCC imbalance [29]. Several secondary factors, such as urban green space coverage, water use efficiency and wastewater discharge intensity, further demonstrate that ecological construction and water environmental quality perform vital auxiliary regulatory functions in modulating basin WRCC status [17,37]. By contrast, natural hydrological indicators including precipitation and groundwater resources presented extremely weak explanatory power and failed to reach statistical significance. These results indicate that WRCC evolution in the Jialu River Basin is no longer dominated by natural water endowment conditions. Instead, regional water system changes have entered a human-interference-dominated stage, consistent with existing research findings on highly urbanized plain watersheds in central and northern China [6,25].
Although single-factor analysis can identify the basic contribution of individual indicators, actual WRCC spatial heterogeneity is predominantly shaped by multi-factor synergistic interactions rather than independent effects. Pairwise interaction detection verified that factor coupling serves as the core driver of fluctuating WRCC performance and distinct spatial polarization in the study basin. In terms of interaction types, synergistic enhancement dominated the entire research area, including 70.53% bivariate enhancement and 21.05% nonlinear enhancement, while negative nonlinear weakening effects were negligible across all factor combinations. Further quantitative comparison revealed prominent coupling amplification characteristics: the average q-value of all interactive factor pairs reached 0.58, which was 45% higher than the average explanatory level of individual single factors (0.40). Such a noticeable numerical difference proves that the coupled superposition of socioeconomic, ecological and hydrological factors can produce strong nonlinear amplification effects. These synergistic driving forces far exceed the regulatory capacity of any single indicator, ultimately shaping the complex and spatially differentiated WRCC pattern in the Jialu River Basin.
Interactive intensity across the basin presented moderately concentrated distribution features. Moderately coupled and weakly coupled factor pairs accounted for 41.05% and 24.74% of all pairwise interactions, respectively, whereas extreme strong coupling (q = 0.80) only occurred sporadically within individual indicator groups. Factor categories differed greatly in their interactive performance. Pressure factors related to water consumption and pollutant output achieved a mean interactive q-value of 0.65, noticeably higher than the 0.56 recorded for ecological support factors. Meanwhile, cross-type coupling between pressure and support indicators generated nonlinear enhancement in 32.5% of all cases, which was considerably higher than the 18.7% observed in homogeneous factor interactions. Typical coupling relationships further elaborate differentiated driving mechanisms. Synergistic interactions between economic water consumption and wastewater discharge intensified dual pressure on regional water resources and aquatic environments. In comparison, the coupling of R&D expenditure and water use efficiency effectively relieved local water scarcity via technological optimization and refined resource allocation. Additionally, trade-offs between economic development and grain production, together with aquatic ecological space compression caused by continuous urban sprawl, further aggravated the spatial imbalance of regional WRCC.
To sum up, WRCC spatiotemporal evolution within the Jialu River Basin is governed by a multi-factor synergistic coupling system, rather than isolated single-variable impacts. Widely existing interactive enhancement mechanisms reasonably explain the intrinsic causes of unstable WRCC fluctuations and spatial polarization, remedying the analytical limitations of single-dimensional driving research [15]. Notably, evident regional heterogeneity can be observed when comparing these driving patterns with arid inland basins. Natural factors including precipitation and groundwater reserves exert very weak explanatory effects across the Jialu River Basin, with all q-values below 0.12. This outcome differs substantially from arid catchments such as the Gansu section of the Yellow River Basin and the hyper-arid Iranian watershed reported in international literature [23,28], where natural hydrological conditions or transboundary water inflow act as dominant restrictive forces. Unlike those natural-constrained watersheds, this urban plain basin exhibits typical human-coupled water system evolution, with socioeconomic and ecological factors jointly constructing the core driving framework. Under such complex interactive mechanisms, traditional single-target water regulation measures cannot fully resolve compound water resource contradictions in the basin. Accordingly, systematic, refined and multi-dimensional governance strategies, formulated based on verified factor coupling rules, are essential to support long-term sustainable water resource management in the study region.

4.4. Targeted Watershed Water Resource Management Strategies

The human-dominated driving pattern and synergistic amplification of key factors fundamentally explain the spatiotemporal heterogeneity of WRCC across the basin, indicating that refined, multi-dimensional, and regionally adaptive governance is essential to improve regional water resource carrying status. The strongest synergistic couplings observed in this study further underline that single-measure interventions are insufficient, and joint regulation of mutually reinforcing stress sources is required. From a basin-wide perspective, integrated governance should focus on the following: (i) Coordinated agricultural and domestic pollution control: Driven by the prominent nonlinear amplification between agricultural fertilizer intensity and wastewater discharge, agricultural non-point-source pollution and urban–industrial sewage cannot be managed in isolation, especially within the mid-stream urban–agricultural interleaving zones. (ii) Integrated water conservation and pollutant reduction: Given the high-intensity synergy between GDP-linked water consumption and wastewater discharge, water-saving transformation and pollution abatement need to be advanced simultaneously rather than implemented separately. (iii) Technology-driven water-use efficiency improvement: Benefiting from the coupling effect of R&D investment and water resource utilization rate, technological innovation should be closely matched with popularization of water-saving practices instead of relying merely on increased research expenditure. (iv) Water endowment-adapted spatial layout optimization: Owing to the synergistic interactions between socioeconomic density and natural water availability, urban and population expansion must keep within local water-supply constraints to avoid aggravating human–water conflicts. (v) Balanced development of economic construction and water-saving agriculture: The strong co-dependence of per-capita economic output and grain production reminds policymakers to reconcile economic growth demands with the water footprint of agricultural activities, so as to mitigate multi-source anthropogenic water ecological pressure.
Given the highly variable WRCC evolutionary trends and region-specific dominant drivers observed across different administrative units, targeted city-level optimization strategies are proposed in this study to support differentiated water resource governance. As the basin’s core urban agglomeration, Zhengzhou faces typical structural water contradictions derived from rapid urban expansion; therefore, future governance should prioritize industrial water structure adjustment and continuous technological innovation, aiming to relieve supply-demand mismatches and stabilize regional water carrying performance. Unlike urban-centric water stress, Kaifeng’s long-term water system overload largely stems from extensive agricultural production, which necessitates large-scale water-saving renovations and systematic ecological restoration to ease cumulative aquatic ecological pressure. For Xuchang, the over-reliance on inter-basin water diversion projects has concealed inherent water use and pollution management defects, highlighting the need for long-term dynamic supervision mechanisms covering water consumption and wastewater discharge to sustain steady ecological improvement. Differently, Zhoukou’s deteriorating WRCC is closely tied to unsustainable developmental patterns and fragmented emergency regulation; transforming short-term contingency management into integrated long-term water ecological planning can effectively coordinate socioeconomic advancement and aquatic ecosystem protection. Overall, the combination of unified basin-scale systematic governance and city-specific refined interventions matches well with the heterogeneous coupling mechanisms of WRCC evolution, providing operable technical pathways for sustained water resources carrying capacity improvement within the Jialu River Basin.

4.5. Applicability and Study Limitations

The evaluation framework integrating entropy–coefficient-of-variation combined weighting, DPSIR, TOPSIS and Geodetector provides an operable paradigm for quantitative WRCC assessment and driving-factor recognition. Built upon the DPSIR logic, the indicator system retains good flexibility for regional adaptation. For plain tributaries under combined urban–agricultural pressure with scarce natural water resources, this framework is capable of capturing fluctuating WRCC trends and human-dominated coupling mechanisms. When applied to mountainous or arid inland basins where hydrological conditions dominate water-system changes, users can strengthen the weight of natural hydrological metrics and adjust indicator combinations to fit local socio-hydrological backgrounds. Beyond the Jialu River Basin, our empirical insights on spatial polarization and multi-factor interactive effects can support practical decision-making including refined water allocation, cross-administrative coordination, and water–economy–ecology synergy for other medium-sized plain watersheds facing similar human–water conflicts. In this sense, both the methodological workflow and empirical outputs possess transferable reference value for WRCC research and watershed management.
Nevertheless, several limitations of this study need to be acknowledged. First, this study employed municipal administrative-scale statistical data for quantitative assessment. The use of aggregated administrative units ensures reliable temporal continuity and consistent comparability of long-term sequential datasets, which is essential for identifying interannual WRCC evolutionary trends. Nevertheless, this coarse administrative scale inevitably induces the potential modifiable areal unit problem (MAUP) [47,48]. Boundaries of municipal administrative divisions are inconsistent with natural watershed zoning, and aggregated statistical data tend to homogenize intra-city spatial differences and mask fine-scale intra-watershed heterogeneity to a certain extent. Considering the difficulty of obtaining complete, long-term continuous socioeconomic monitoring data at the township or grid scale, prefecture-level administrative units remain the most feasible and reliable basic analytical unit for this multi-year sequential evaluation. Future research can integrate high-resolution grid datasets and field monitoring records to reduce scale-dependent deviations and achieve more refined, spatially explicit WRCC evaluation across the basin [49].
Second, the research time series is limited to the period of 2010–2022 due to the constraint of unified and publicly available official statistical data. Standardized statistical yearbooks and water resource bulletins generally have a publication time-lag [17,24,44]. Although the 13-year continuous dataset is capable of revealing the long-term evolutionary patterns of WRCC in the Jialu River Basin, the absence of the latest observational data may neglect recent short-term hydrological fluctuations and practical effects of newly implemented water management policies [50]. Future studies can update the time series and validate the universality of existing conclusions when complete official data are fully accessible.
Third, this study focuses primarily on retrospective analysis of historical spatiotemporal characteristics and driving mechanisms of WRCC. It can only reflect past evolutionary features rather than future system responses under alternative regulatory scenarios [51]. Future work can introduce scenario-simulation models to forecast WRCC dynamics under diverse socioeconomic development and water-regulation scenarios, thereby providing more scientific references for watershed sustainable water resource management.

5. Conclusions

Based on the DPSIR framework, this study constructed a multi-index comprehensive evaluation system containing 21 measurable indicators to quantitatively assess WRCC status in the Jialu River Basin. To avoid subjective weighting bias, indicator weights were calculated using a combined method integrating entropy weight and coefficient of variation. On this basis, the TOPSIS model was adopted to systematically quantify spatiotemporal variations in basin-scale WRCC throughout the 2010–2022 research period. Furthermore, the Geographic Detector model was applied to clarify the explanatory intensity of individual influencing factors and unveil complex pairwise interactive coupling relationships. Key research conclusions drawn from the above quantitative analysis are summarized as follows.
(1) WRCC across the four study cities presents prominent and regular spatiotemporal heterogeneity over the study period. Zhengzhou consistently occupies the leading position in regional water carrying capacity, with index values fluctuating between 0.28 and 0.59 and reaching the maximum value of 0.59 in 2020. By contrast, Kaifeng maintains an extremely low WRCC level for most years, with annual values ranging from 0.10 to 0.33 and long-term readings below 0.20, proving that the region has been trapped in persistent severe water system overload. Xuchang’s WRCC shows highly volatile interannual variations; the regional carrying capacity remained suppressed below 0.20 in the early research stage before achieving a remarkable recovery to 0.35–0.41 after 2019. Distinct from other regions, Zhoukou experienced a continuous degradation trend. Its superior initial WRCC value of 0.55 in 2010 declined year by year, stabilizing at a low level of 0.14–0.28 from 2019 to 2022 under sustained overload conditions. At the whole basin scale, average WRCC values ranged from 0.18 to 0.35 and mostly stayed below 0.30, forming a relatively stable spatial gradient pattern: Zhengzhou > Zhoukou > Xuchang > Kaifeng.
(2) Single-factor detection reveals that over 66% of all indicators passed statistical significance testing (p < 0.05). Anthropogenic socioeconomic factors dominate the spatiotemporal differentiation of basin WRCC, whereas natural background hydrological conditions only play a secondary and auxiliary role. Typical natural factors including precipitation (q = 0.11) and groundwater resources (q = 0.09) show quite limited explanatory power for regional WRCC variations. In comparison, R&D expenditure (q = 0.58) and urbanization rate (q = 0.57) act as the core leading driving factors. Several socioeconomic indicators also deliver strong driving effects, including fertilizer application intensity (q = 0.56), population density (q = 0.55), per capita grain production (q = 0.52), per capita GDP (q = 0.51), and water consumption per ten-thousand CNY of GDP (q = 0.51). Collectively, these anthropogenic indicators constitute the dominant driving framework that governs long-term WRCC evolution across the Jialu River Basin.
(3) Factor interaction results confirm that positive synergistic enhancement effects dominate the coupling relationships among all 21 indicators, with interactive driving intensity generally falling within medium to high levels. Importantly, coupled factor effects far exceed the explanatory capacity of individual independent factors. Statistical classification shows 134 groups of bivariate enhancement interactions, accounting for 70.53% of total pairs, alongside 40 nonlinear enhancement pairs (21.05%). In contrast, unfavorable nonlinear weakening interactions only occupied 16 pairs, representing merely 8.42% of all combinations. The average q-value of all interactive factor pairs reaches 0.58, which is 45% higher than the average single-factor explanatory level of 0.40. These findings demonstrate that WRCC spatiotemporal evolution in the study basin is not controlled by isolated single variables, but arises from complex superposition and synergistic coupling of multiple natural, economic and social factors.

Author Contributions

X.S. established the overall framework, designed the study, analyzed and visualized the data, and drafted the manuscript. T.G. acquired and collated the basic data. Y.Z. and Y.W. validated the results, organized the literature, and revised parts of the manuscript. The corresponding author supervised the entire project, provided methodological guidance, and performed comprehensive revision and final approval. All authors have read and agreed to the published version of the manuscript.

Funding

This research was funded by the Scientific and Technological Project of Henan Province, grant number 242102320260 and 252102320228.

Data Availability Statement

The data presented in this study are openly available in Zenodo at https://doi.org/10.5281/zenodo.20374438.

Conflicts of Interest

The authors declare no conflicts of interest.

References

  1. Keyvanfar, M.; Janatrostami, S.; Ashrafzadeh, A. Dynamic multi-criteria analysis of water resources carrying capacity under anthropogenic pressure. Ecol. Indic. 2025, 180, 114379. [Google Scholar] [CrossRef] [Scilit]
  2. Li, E.; Yan, B.; Yang, J.F.; Li, C.H.; Deng, Z. Study on prediction and regulation of water resources carrying capacity under changing environment. Sci. Rep. 2026, 16, 7349. [Google Scholar] [CrossRef] [Scilit]
  3. Zhu, Y.Z.; Xia, J.; Tan, G. Research on theory and method of water resources carrying capacity. Prog. Geogr. 2002, 21, 180–188. [Google Scholar]
  4. Liu, W.H.; Wang, Y.Z.; Huang, J.K.; Zhu, W.B. Assessment on the sustainability of water resources utilization in Central Asia based on water resources carrying capacity. J. Geogr. Sci. 2023, 33, 1967–1988. [Google Scholar] [CrossRef] [Scilit]
  5. Du, L.L.; Zhang, P.J.; Niu, Z.R. Research on water resources carrying capacity in the Hexi Inland River Basin of China based on “Four Waters and Four Determinations”-System Dynamics and improved TOPSIS model. Ecol. Indic. 2026, 183, 114642. [Google Scholar] [CrossRef] [Scilit]
  6. Xu, W.T.; Jin, J.L.; Zhang, J.Y.; Shu, Z.K.; Liu, Y.L.; Zhu, L.J.; Guan, T.S.; Yuan, S.S. Dynamic evaluation and the binary coupling driving mechanism of water resources carrying capacity: A case study of the Beijing-Tianjin-Hebei urban agglomeration. J. Clean. Prod. 2026, 477, 147788. [Google Scholar] [CrossRef] [Scilit]
  7. Dastranj, E.; Mahjouri, N.; Behboudian, M. Enhancement of water and environmental carrying capacity in a changing climate: A coupled assessment of ecological footprint, biocapacity, and water stress. Ecol. Indic. 2026, 187, 114956. [Google Scholar] [CrossRef] [Scilit]
  8. Li, S.Z.; Li, Y.P.; Huang, G.H.; Wang, P.P.; Liu, J.T.; Xu, Z.P.; Li, Y.F. Coupling input-output analysis with deep learning to quantify the carrying capacity of water resource for sustainable development in arid region. J. Clean. Prod. 2026, 483, 148356. [Google Scholar] [CrossRef] [Scilit]
  9. Xiao, J.R.; Zhang, J.X.; He, G.H.; Li, H.Y.; Du, L.L.; Yang, R.H.; Yin, M.; Tian, P.L.; Yang, Y.G.; Li, Q.Z.; et al. Integrated assessment of water resource carrying capacity: Dynamics, obstacles, coordination and driving mechanisms in the Gansu Section of the Yellow River Basin, China. Water 2026, 18, 761. [Google Scholar] [CrossRef] [Scilit]
  10. Chen, Y.B.; Chen, J.H.; Li, C.X.; Feng, Z.Y. Establishment of evaluation index system of water resources carrying capacity for Shenzhen based on DPSIR model. J. Hydraul. Eng. 2004, 35, 98–103. [Google Scholar]
  11. Wen, R.; Shi, X.X.; Qian, H. Spatiotemporal variation of water resources carrying capacity in Anhui Province based on DPSIR-TOPSIS and coupling coordination degree. J. Water Resour. Water Eng. 2023, 34, 88–97. [Google Scholar]
  12. Ji, M.; Li, J.R.; Li, L.P.; Zhang, L.G.; Wang, K.W. Ecosystem health in the Yellow River Estuary based on the DPSIR model: A case study in China. Sci. Rep. 2026, 16, 13587. [Google Scholar] [CrossRef] [Scilit]
  13. Xiao, H.; Zeng, S.; Peng, Y.; Kou, G. A simulation optimization approach for weight valuation in analytic hierarchy process. Eur. J. Oper. Res. 2025, 321, 851–864. [Google Scholar] [CrossRef] [Scilit]
  14. Xin, P.; Yang, L.; Xia, X. Comparative Study on Evaluation of Water Resource Carrying Capacity Using Entropy Method and CRITIC Method. Express Water Resour. Hydropower Inf. 2025, 46, 24–28. [Google Scholar]
  15. He, G.; Zhang, S.; Bao, K. Analysis of Driving Factors for Spatiotemporal Differentiation of Regional Water Resources Carrying Capacity: Taking Anhui Province as an Example. Water Resour. Hydropower Eng. 2023, 54, 88–101. [Google Scholar]
  16. Wang, C.; Li, Z.J. Evaluation of water resources carrying capacity in Henan Province based on improved coefficient of variation method. Yellow River 2023, 45, 67–72. [Google Scholar]
  17. Wei, Z.; Ji, D.; Yang, L. Comprehensive evaluation of water resources carrying capacity in Henan Province based on entropy weight TOPSIS—Coupling coordination—Obstacle model. Environ. Sci. Pollut. Res. 2023, 30, 115820–115838. [Google Scholar] [CrossRef] [Scilit] [PubMed]
  18. Zhao, Y.; Yin, H.; Zhang, W.; Yan, J.; An, J.; Zhang, Z.; Wu, Y.; Hu, W.; Lai, H.; Wang, F.; et al. Evaluation of Water Resources Carrying Capacity in Ordos City Based on the Game Theory-TOPSIS-Grey Prediction Coupling Model. Sci. Rep. 2026, 16, 5782. [Google Scholar] [CrossRef] [Scilit]
  19. Vassoney, E.; Mammoliti Mochet, A.; Desiderio, E.; Negro, G.; Pilloni, M.G.; Comoglio, C. Comparing Multi-Criteria Decision-Making Methods for the Assessment of Flow Release Scenarios From Small Hydropower Plants in the Alpine Area. Front. Environ. Sci. 2021, 9, 635100. [Google Scholar] [CrossRef] [Scilit]
  20. Ghosh, D.; Mandal, S.; Das, D.; Alam, E.; Saha, S. Beyond Single Techniques: Can a Hybrid MCDM Approach Redefine Flood Risk Mapping and Decision-Making in Sub-Himalayan North Bengal? Geocarto Int. 2026, 41, 2630429. [Google Scholar] [CrossRef] [Scilit]
  21. Abdullah, M.F.; Siraj, S.; Hodgett, R.E. An Overview of Multi-Criteria Decision Analysis (MCDA) Application in Managing Water-Related Disaster Events: Analyzing 20 Years of Literature for Flood and Drought Events. Water 2021, 13, 1358. [Google Scholar] [CrossRef] [Scilit]
  22. Yang, M.; Qu, D.; Shen, Y.; Yang, S.; Liu, B.; Lu, W. Evaluation of Water Resources Carrying Capacity of Zhangye City Based on Combined Weights and TOPSIS Modeling. Water 2023, 15, 4229. [Google Scholar] [CrossRef] [Scilit]
  23. Duan, K.; Niu, Z.; Cui, L. Analysis of Water Resources Carrying Capacity and Obstacle Factors in Gansu Section of the Wei River Basin Using Combined Weighting TOPSIS Model. Sci. Rep. 2025, 15, 12775. [Google Scholar] [CrossRef] [Scilit]
  24. Yang, L.; Pan, Z.W.; Li, H.; Wang, D.J.; Wang, J.; Wu, C.C.; Wu, X.J. Study on the spatiotemporal evolution and driving factors of water resource carrying capacity in typical arid regions. Water 2024, 16, 2142. [Google Scholar] [CrossRef] [Scilit]
  25. Yang, L.J.; Yang, X.R.; Wei, W.; Pan, J.H. Spatio-temporal evolution and influencing factors of water resource carrying capacity in Shiyang River Basin: Based on the geographical detector method. Water Supply 2020, 20, 1409–1424. [Google Scholar] [CrossRef] [Scilit]
  26. Zhang, S.W.; Liao, T.; Fang, G.H.; Zhong, H.Y.; Ju, M.S.; Zhang, D.S. Spatiotemporal variation of the water resources carrying capacity based on the PS-DR-DP model. Water Resour. Manag. 2025, 39, 5177–5194. [Google Scholar] [CrossRef] [Scilit]
  27. Zhou, T.; Lin, T.; Cheng, R.; Wang, G.; Jiang, B. An integrated approach for spatio-temporal assessment and attribution of water resources carrying capacity: Incorporating AHP, TOPSIS, and Lorenz asymmetry coefficient methods. J. Hydrol. 2025, 650, 132536. [Google Scholar] [CrossRef] [Scilit]
  28. Agheli, E.; Ashrafzadeh, A.; Janatrostami, S. Comprehensive evaluation of water resources sustainability in Sistan and Baluchestan, Iran: A TOPSIS-Cloud-Bayesian approach. J. Hydrol. Reg. Stud. 2025, 62, 102898. [Google Scholar] [CrossRef] [Scilit]
  29. Yang, L.; Hao, Y.R.; Wang, B.; Li, X.Y.; Gao, W.F. Evaluation of the water resources carrying capacity in Shaanxi Province based on DPSIRM-TOPSIS analysis. Ecol. Indic. 2025, 173, 113369. [Google Scholar] [CrossRef] [Scilit]
  30. Zhang, H.; Ma, T.R.; Pan, Z.W.; Yang, L.; Wang, D.J.; Yu, G.Y.; Li, H.; Zhang, K.Z. Assessment and diagnosis of the water resources carrying capacity in the Huaihe River basin of Anhui Province. Ecol. Indic. 2025, 176, 113596. [Google Scholar] [CrossRef] [Scilit]
  31. Chen, Q.Y.; Zhu, M.T.; Zhang, C.J.; Zhou, Q. The driving effect of spatial-temporal difference of water resources carrying capacity in the Yellow River Basin. J. Clean. Prod. 2023, 388, 135709. [Google Scholar] [CrossRef] [Scilit]
  32. Tang, L.; Zhao, H.K.; Zhou, Z.F.; Qian, Z.X.; Hou, S.S.; Liu, B. Coupling and coordinated development of urbanization and water resource carrying capacity in the Middle Yangtze River urban agglomerations under the influence of key driving factors. Environ. Dev. Sustain. 2026, 1–34. [Google Scholar] [CrossRef] [Scilit]
  33. Wang, H.L.; Wu, Z.N.; Sun, R.C. Impact of urbanization on hydrological process in Jialu River Basin. Sci. Technol. Eng. 2017, 17, 316–321. [Google Scholar]
  34. Li, Z.P.; Song, G.; Li, Y.L.; Xiao, H.; Wang, L.D.; Wang, J.H. Long-term runoff variation and quantitative attribution analysis of the Jialu River Basin. J. North China Univ. Water Resour. Electr. Power 2025, 46, 69–79. [Google Scholar]
  35. Lin, D. High-Efficiency Collaborative Legislation for Joint Protection of the Jialu River. Henan Legal News, 29 November 2024; p. 16. [CrossRef]
  36. Li, Y.Z.; Liu, Y.; Yan, X.P. Research on evaluation index system of watershed ecological security based on DPSIR model. Acta Sci. Nat. Univ. Pekin. 2012, 48, 971–981. [Google Scholar]
  37. Li, S.Q.; Qian, H.; Xu, P.P.; Gao, Y.Y.; Chen, J.; Shi, X.X. Insight into the water resource carrying capacity of the central water tower in China: Integrating the driving-pressure-state-impact-response frame and obstacle degree recognition. Ecol. Indic. 2024, 167, 112730. [Google Scholar] [CrossRef] [Scilit]
  38. Liu, H.Y.; Liu, Y.C.; Meng, L.H.; Jiao, K.Q.; Zhu, M.Y.; Chen, Y.K.; Zhang, P.F. Research progress of entropy weight method in water resources and water environment evaluation. J. Glaciol. Geocryol. 2022, 44, 299–308. [Google Scholar]
  39. Cui, Y.; Feng, P.; Jin, J.; Liu, L. Water resources carrying capacity evaluation and diagnosis based on set pair analysis and improved entropy weight method. Entropy 2018, 20, 359. [Google Scholar] [CrossRef] [Scilit]
  40. Bedeian, A.G. On the use of the coefficient of variation as a measure of diversity. Organ. Res. Methods 2000, 3, 285–297. [Google Scholar] [CrossRef] [Scilit]
  41. Behzadian, M.; Otaghsara, S.K.; Yazdani, M.; Ignatius, J. A state-of-the-art survey of TOPSIS applications. Expert Syst. Appl. 2012, 39, 13051–13069. [Google Scholar] [CrossRef] [Scilit]
  42. Song, Q.; Wang, Z.; Wu, T. Risk analysis and assessment of water resource carrying capacity based on weighted gray model with improved entropy weighting method in the central plains region of China. Ecol. Indic. 2024, 160, 111907. [Google Scholar] [CrossRef] [Scilit]
  43. Wang, J.F.; Xu, C.D. Geographical detector: Principle and prospect. Acta Geogr. Sin. 2017, 72, 116–134. [Google Scholar]
  44. Jia, Y.; Wang, H. Study on Water Resource Carrying Capacity of Zhengzhou City Based on DPSIR Model. Int. J. Environ. Res. Public Health 2023, 20, 1394. [Google Scholar] [CrossRef] [Scilit]
  45. Wang, X.; Wang, W.; Yan, C.; Gao, J. Driving effects of spatiotemporal evolution of the water resources carrying capacity in the Yellow River Basin (Henan section). Sci. Rep. 2024, 14, 29340. [Google Scholar] [CrossRef] [Scilit]
  46. Zhang, X.; Duan, X. Evaluating water resource carrying capacity in Pearl River-West River Economic Belt based on portfolio weights and GRA-TOPSIS-CCDM. Ecol. Indic. 2024, 161, 111942. [Google Scholar] [CrossRef] [Scilit]
  47. Li, K.; Qian, H.; Li, S.; Cao, Z.; Tian, P.; Shi, X.; Chen, J.; Gao, Y. Quantifying the Driving Forces of Water Conservation Using Geodetector with Optimized Parameters: A Case Study of the Yiluo River Basin. Land 2025, 14, 274. [Google Scholar] [CrossRef] [Scilit]
  48. Yan, M.; Kou, J.; Ma, W.; Jian, Y. Scale effect of population and area exposed to water scarcity based on different recurrence periods: A case study of Gansu Province, China. Ecol. Indic. 2024, 157, 111254. [Google Scholar] [CrossRef] [Scilit]
  49. Wang, P.; Song, X.; Liu, C.; Wang, Q.; Wang, B. Research on Evaluation and Advancement Strategy of Water Resources Carrying Capacity of Towns in the Middle Reaches of Heihe River. J. Ecol. Rural Environ. 2023, 39, 459–468. [Google Scholar]
  50. Liu, Z.; Bao, Y. Spatial and Temporal Divergence of Water Resource Carrying Capacity in Hubei Province, China, from the Perspective of Three Major Urban Agglomerations. Sustainability 2024, 16, 5059. [Google Scholar] [CrossRef] [Scilit]
  51. Zhou, K. Study on the dynamic prediction and optimum regulation scheme of water resource carrying capacity in the Yellow river basin. Sci. Rep. 2025, 15, 8188. [Google Scholar] [CrossRef] [Scilit]
Figure 1. Research flowchart of WRCC.
Water 18 02111 g001
Figure 2. Map of the Study Area.
Water 18 02111 g002
Figure 3. WRCC Levels by City from 2010 to 2022.
Water 18 02111 g003
Figure 4. Spatial Distribution of WRCC by City from 2010 to 2022.
Water 18 02111 g004
Figure 5. Heatmap of interaction detection results for WRCC driving factors in the Jialu River Basin.
Water 18 02111 g005
Table 1. Indicator System for Evaluating WRCC in the Jialu River Basin.
Objective LevelCriterion LevelIndicator LevelUnitIndicator AttributeSymbol
Water
Resource
Carrying
Capacity
Level
Driving Force (D)Population densitypersons/km2X1
Urbanization Rate%+X2
Share of the tertiary sector in GDP%+X3
GDP per capitaten-thousand CNY+X4
Natural population growth rate%+X5
Pressure (P)Water consumption per ten-thousand CNY of GDPm3X6
Wastewater discharge100 million tonsX7
Per capita domestic water consumptionLX8
Fertilizer application intensitytonsX9
Water consumption per ten-thousand CNY of industrial value addedm3X10
State (S)Water production coefficientDmnlX11
Per capita grain productiont/person+X12
Precipitationmm+X13
Groundwater resourcesbillion m3+X14
Surface water resourcesbillion m3+X15
Impact (I)Water consumption rate%+X16
Water resource utilization rate%+X17
Urban green space area10,000 m2+X18
Response (R)Urban sewage treatment rate%+X19
R&D expenditureten-thousand CNY+X20
Green coverage rate in built-up areas%+X21
Table 2. Weighted Combination of Evaluation Indicators for WRCC in the Jialu River Basin.
Objective LevelCriterion LevelIndicator LevelWeight w j Weight w j Combined WeightWeight
Water
Resource
Carrying
Capacity
Level
Driving Force (D)Population density0.0290.0330.0310.189
Urbanization Rate0.0480.0510.049
Share of the tertiary sector in GDP0.0280.0360.032
GDP per capita0.0480.0500.049
Natural population growth rate0.0240.0310.028
Pressure (P)Water consumption per ten-thousand CNY of GDP0.0190.0280.0240.140
Wastewater discharge0.0140.0240.019
Per capita domestic water consumption0.0270.0360.032
Fertilizer application intensity0.0390.0390.039
Water consumption per ten-thousand CNY of industrial value added0.0220.0310.026
State (S)Water production coefficient0.0240.0360.0300.298
Per capita grain production0.0480.0460.047
Precipitation0.0510.0550.053
Groundwater resources0.0890.0740.082
Surface water resources0.0900.0830.086
Impact (I)Water consumption rate0.0290.0380.0330.201
Water resource utilization rate0.0400.0470.044
Urban green space area0.1460.1010.124
Response (R)Urban sewage treatment rate0.0100.0210.0150.173
R&D expenditure0.1540.1090.131
Green coverage rate in built-up areas0.0210.0310.026
Table 3. Classification Standards for WRCC.
Proximity[0–0.2)[0.2–0.4)[0.4–0.6)[0.6–0.8)[0.8–1)
Evaluation GradeSevere OverloadOverloadCritical OverloadMild OverloadCarrying capacity available
Table 4. p-values and q-values for driving factors in the Jialu River Basin.
IndicatorqpIndicatorqp
X10.550.000X120.520.003
X20.570.000X130.110.516
X30.460.008X140.090.738
X40.510.003X150.200.184
X50.250.107X160.480.003
X60.510.000X170.390.026
X70.480.017X180.500.062
X80.160.351X190.260.022
X90.560.000X200.580.028
X100.460.002X210.240.222
X110.420.125
Disclaimer/Publisher’s Note: The statements, opinions and data contained in all publications are solely those of the individual author(s) and contributor(s) and not of MDPI and/or the editor(s). MDPI and/or the editor(s) disclaim responsibility for any injury to people or property resulting from any ideas, methods, instructions or products referred to in the content.