1. Introduction
Water scarcity and pollution have become critical environmental challenges worldwide, prompting increased attention to water resource management and wastewater treatment effectiveness. Freshwater withdrawals have increased globally by about 1% per year since the 1980s [
1]. The concept of water footprint, particularly the grey water footprint (GWF), has emerged as a useful indicator for assessing the environmental impact of water pollution in freshwater sources [
2,
3]. While wastewater treatment plants (WWTPs) are designed to reduce pollutant loads before discharge into receiving water bodies, their effluents still cause water quality degradation and environmental stress [
4]. In this context, WWTPs play a significant role in increasing the pollutant loads in water bodies. Alongside point sources, agricultural activities also contribute substantial nutrient loads through diffuse pathways, including fertilizer runoff, making integrated source management essential for water quality protection [
5].
The GWF, defined as the volume of freshwater required to assimilate pollutant loads to meet ambient water quality standards, provides an integrated metric for assessing the environmental burden of both point and diffuse pollution sources [
6]. Recent studies have demonstrated that GWF analysis can reveal impacts that remain overlooked by conventional compliance-based assessments. Investigations on medium-sized WWTPs discharging into small watercourses show that regulatory compliance does not necessarily prevent ecological risks in receiving waters [
7]. A growing body of literature has applied the GWF framework to evaluate WWTP performance under diverse operational and environmental conditions. Large-scale assessments have identified total phosphorus (TP) and ammonium nitrogen (NH4-N) as the dominant contributors to GWF values [
8], while methodological advances such as operational GWF have improved the evaluation of plant management effectiveness [
9]. Other studies introduced the concept of GWF reduction to capture the role of wastewater treatment in mitigating anthropogenic pressure on water resources within the water–energy nexus [
10]. Overall, nitrogen (N) and phosphorus (P) consistently emerge as the most limiting pollutants governing GWF magnitudes, highlighting the importance of energy efficiency improvements and enhanced water recovery for sustainable WWTP operation [
11]. These findings collectively demonstrate that GWF functions as a robust decision-support tool, enabling the identification of water quality risks beyond existing regulatory thresholds and supporting nutrient-focused treatment upgrades and policy revision.
While wastewater treatment plants represent a critical point source of nutrient pollution, diffuse agricultural inputs constitute a major—and often less controllable—driver of GWF at the catchment scale. Agriculture-based N and P pollution, particularly originating from fertilizer application and runoff, can substantially increase the GWF of receiving water bodies [
12]. Unlike point sources, diffuse agricultural emissions are spatially dispersed and strongly influenced by land use, soil properties, and hydrological conditions, making their management more challenging. Accordingly, a growing body of literature has quantified GWF and water pollution levels associated with anthropogenic nutrient emissions from multiple sectors, including agriculture, domestic wastewater, and industry, across local, regional, and global scales [
13,
14].
Diffuse agricultural pollution has emerged as one of the most persistent challenges in water quality management, largely due to the widespread application of fertilizers and the absence of clearly identifiable discharge points. Nutrient losses from agricultural land, primarily in the form of N and P, are transported to surface and groundwater systems through runoff and leaching processes, generating cumulative impacts at the catchment scale. Within this context, GWF provides a useful framework for quantifying the pressure exerted by diffuse agricultural pollution by expressing nutrient loads in terms of the freshwater volume required for their assimilation under ambient water quality standards. Unlike conventional concentration-based indicators, GWF explicitly links diffuse nutrient emissions to the assimilative capacity of the receiving water bodies, making it particularly suitable for basin-scale assessments where agricultural pressures are spatially heterogeneous and temporally variable. Recent Tier-1 assessments for GWF at national and regional scales confirm the suitability of this framework for evaluating diffuse agricultural pollution where detailed field or process-level data are unavailable [
15]. Both surplus-based and coefficient-based approaches have been successfully applied across diverse climatic and agricultural contexts to quantify GWF patterns and identify pollution hotspots, supporting policy-relevant water quality assessments. Studies conducted in temperate, Mediterranean, and arid environments consistently demonstrate that GWF is highly sensitive to the selection of water quality thresholds, particularly the maximum permissible concentration (
Cmax) and natural background concentration (
Cnat), which exert a dominant influence on the estimated dilution requirements [
16]. In intensively cultivated basins, grey water production has been shown to exceed the assimilative capacity of receiving water bodies despite relatively efficient irrigation practices, underscoring the decoupling between irrigation efficiency and nutrient pollution control [
17]. Furthermore, while nitrogen typically dominates nutrient emissions from croplands, phosphorus has been identified as the more critical parameter for basin-scale ecological recovery, particularly in relation to eutrophication risk [
18]. This highlights a common limitation of nitrogen-focused GWF assessments, which may systematically underestimate ecological pressure in phosphorus-sensitive systems. The relative contribution of different sectors—including agriculture, domestic sources, and aquaculture—varies markedly across regions and over time, reinforcing the context-specific nature of GWF results and the need for integrated multi-sector assessments [
19]. Collectively, these findings affirm that while Tier-1 methods involve inherent uncertainties, they provide transparent and reproducible estimates that are well-suited for basin-scale evaluations and management-oriented studies, particularly when the objective is to assess relative pressures rather than to simulate detailed pollutant transport processes [
15].
In Türkiye, a growing body of research has quantified the GWF of municipal WWTPs and agricultural activities at both facility and basin scales [
20,
21,
22]. While these studies consistently identify N as a major driver of water quality pressure in intensively cultivated regions, they often focus on a single sector or rely on generalized national datasets. However, a comprehensive assessment that simultaneously integrates site-specific fertilizer data, actual WWTP effluent performance, and long-term in-stream monitoring data remains scarce, particularly for semi-arid sub-basins under high urbanization pressure. Although many studies have applied the GWF framework, most focus on either point sources (e.g., WWTPs) or diffuse agricultural sources separately. In addition, many rely on generalized datasets and do not include site-specific data on fertilizer use, WWTP performance, or long-term monitoring. This study addresses this gap by providing an integrated N- and P-based GWF assessment for the Ankara River Sub-basin, linking point and diffuse source pressures directly to the river’s monitored assimilative capacity.
The Ankara River Sub-basin, part of the Sakarya Basin in Türkiye, represents a critical case study for evaluating urban and basin-scale water management due to its dense population, rapid urbanization, and intensive agricultural and industrial activities. As one of Türkiye’s major river basins, the Sakarya Basin plays a strategic role in drinking water supply, agricultural production, industrial development, and the provision of essential ecosystem services [
23]. These characteristics underscore the importance of effective wastewater treatment performance and diffuse pollution control within the Ankara River Sub-basin. The study about Sakarya Basin presents a detailed analysis of the Ankara River’s water quality using the National Sanitation Foundation Water Quality Index (NSF-WQI) which offers five quality categories (Excellent, Good, Medium, Bad and Poor) [
24]. As indicated by the study, the water quality in the upstream region was classified as Medium to Good, varying by season. However, water quality declined significantly moving downstream where agricultural activities occur and are classified as Poor. This progressive deterioration highlights the cumulative impact of anthropogenic pressures along the watershed. Therefore, the Ankara River Sub-basin was selected as the study area, as it exemplifies the challenges of balancing urbanization, agricultural activities, and water quality management in a rapidly developing semi-arid basin.
This study aims to evaluate the GWF in the Ankara River Sub-basin. It quantifies fertilizer-related diffuse pollution and municipal WWTP-related point-source pressures and compares them with basin-scale monitored GWF. By analyzing spatial and temporal data on nutrient loads, this research seeks to identify key contributors to water quality degradation and provide insights for targeted water management strategies. The results are intended to support basin-scale water management, water quality assessment, and informed policy development.
2. Materials and Methods
2.1. Site Description
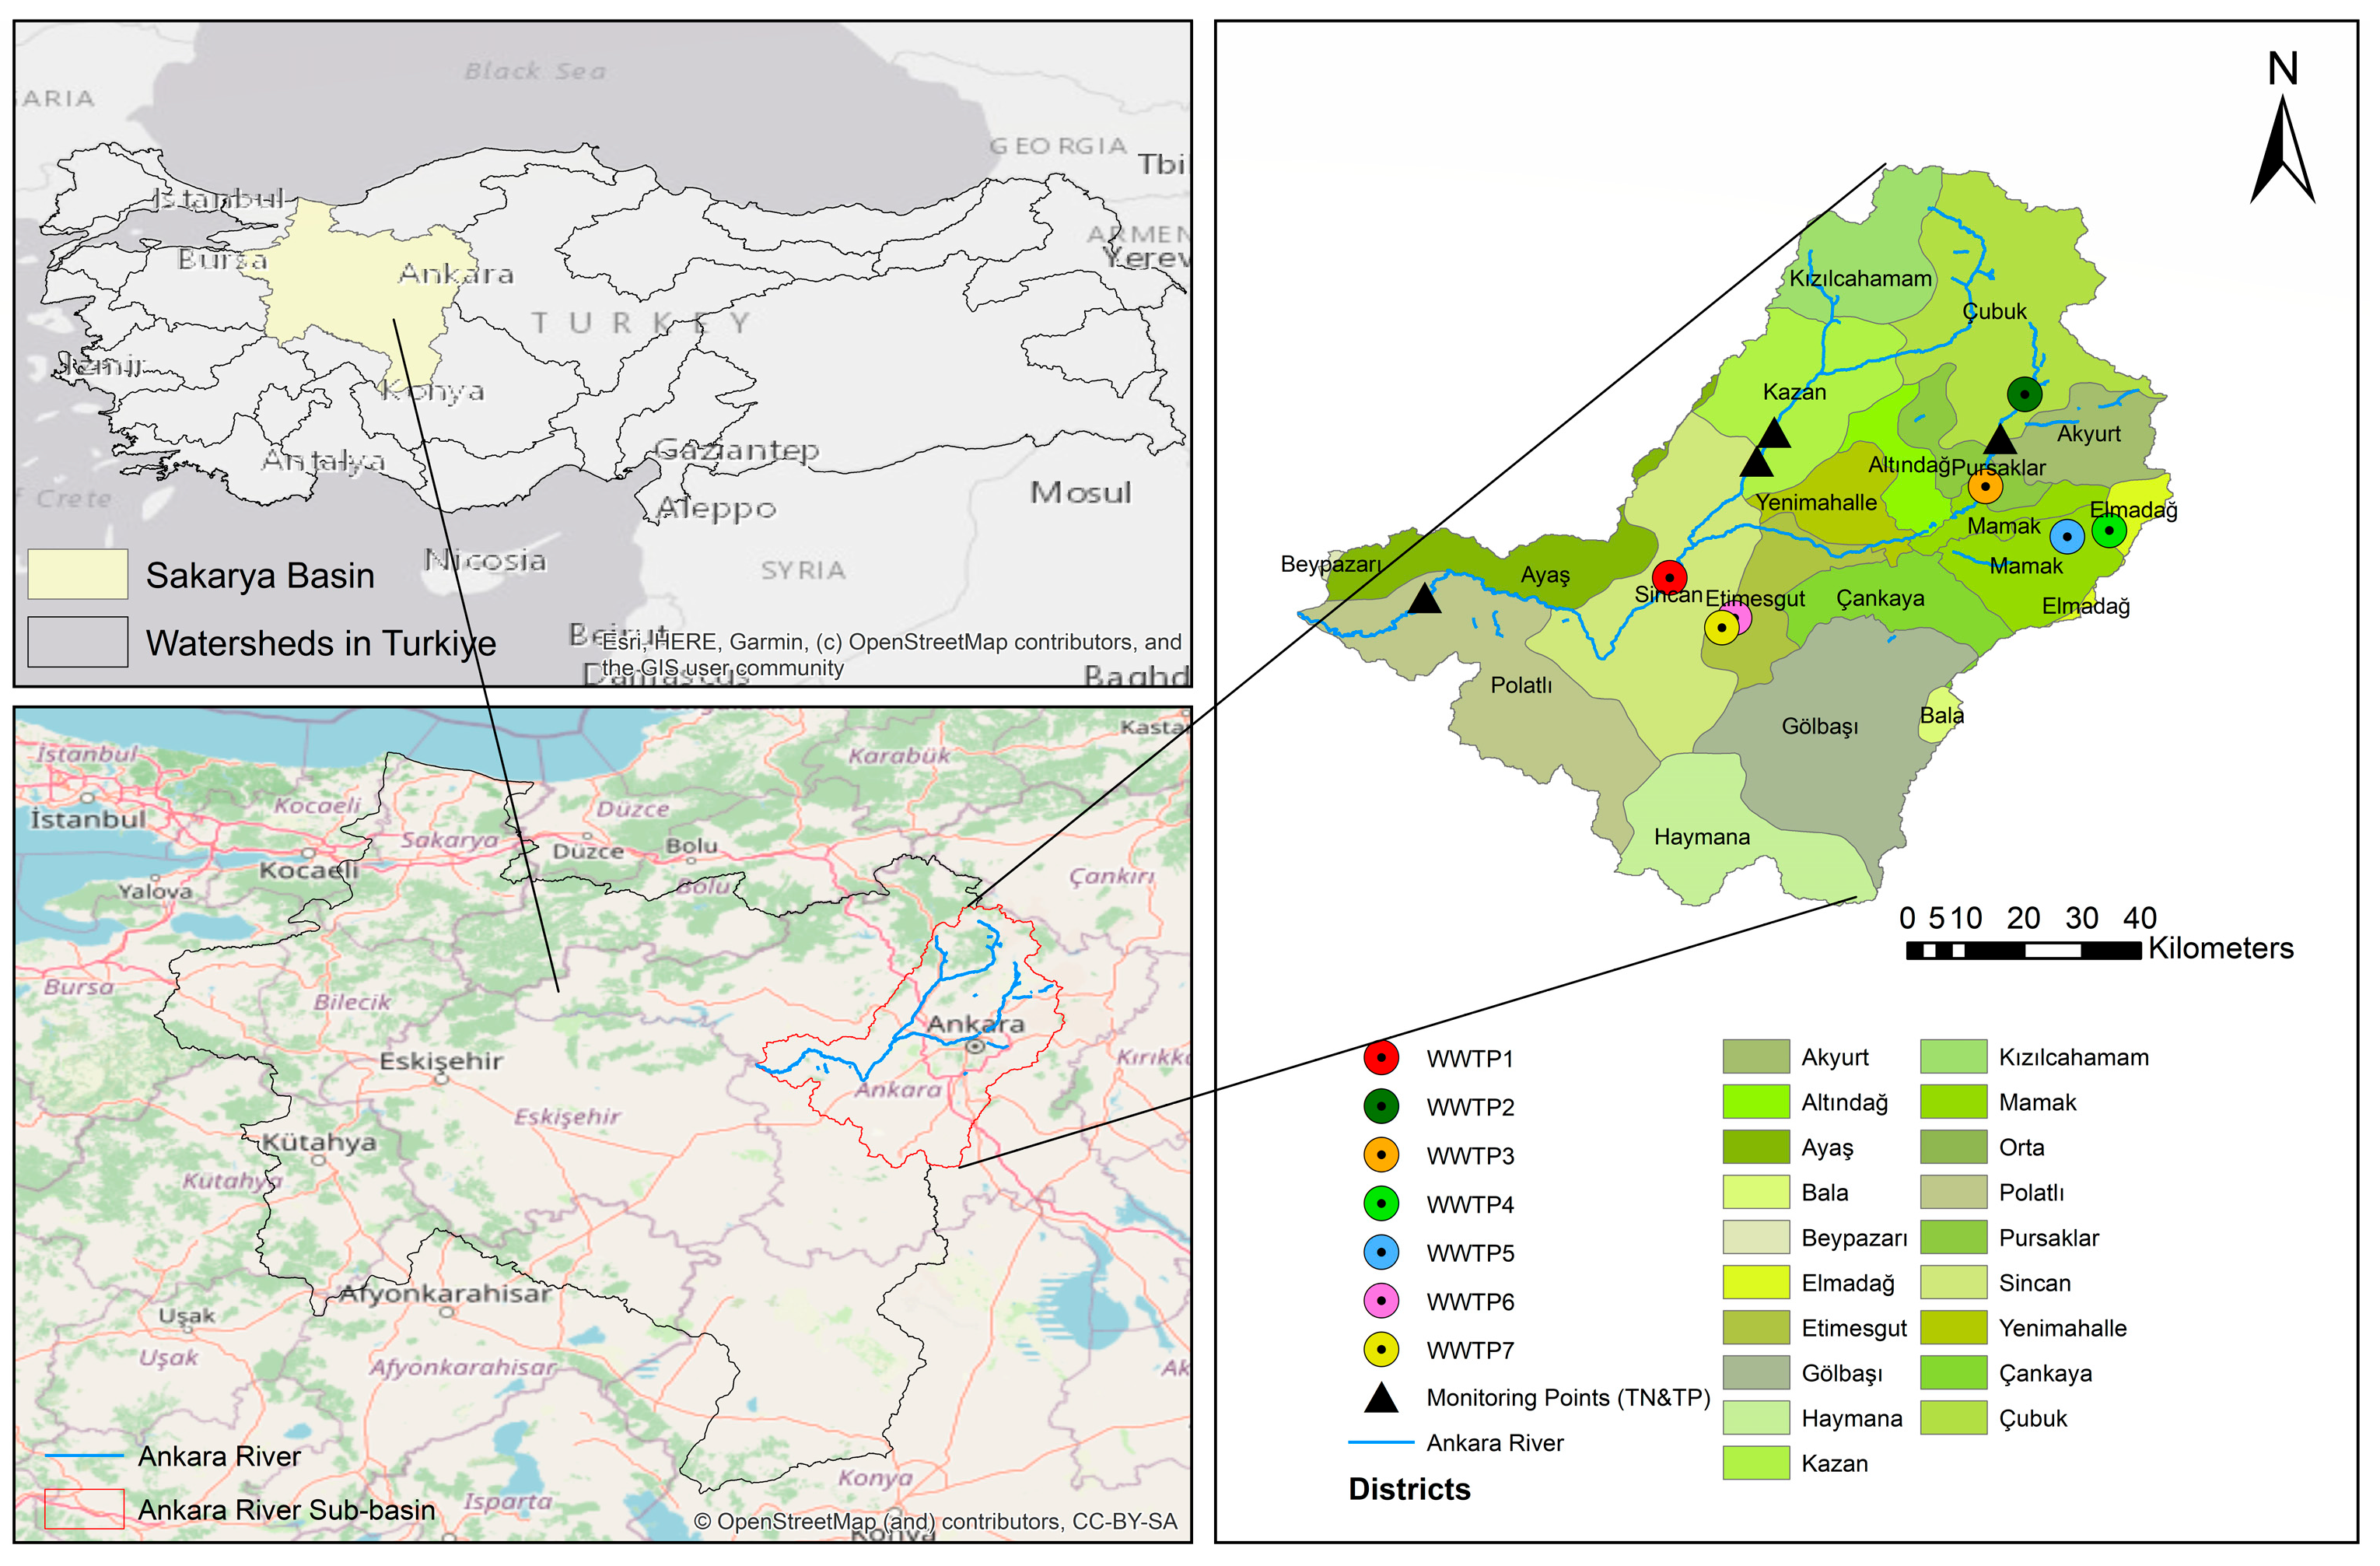
As part of the Sakarya River Basin, one of the major watersheds in Türkiye, the Ankara River Sub-basin is situated between 31°53′30″ and 33°14′32″ east longitudes and 39°23′14″ and 40°30′37″ north latitudes, covering an area of 7178 km
2 (
Figure 1). The study area has an arid climate, with an annual precipitation of approximately 300–500 mm. Precipitation is seasonal, with the highest rainfall occurring in the spring and the lowest in the summer. Temperature variations in the region range from 25–30 °C in the summer months to −5–0 °C in the winter months.
The Ankara River ultimately discharges into the Sakarya River, forming part of a larger hydrological system that drains into the Black Sea. Consequently, pollution originating in this sub-basin can propagate downstream, posing risks not only to local water resources but also to the wider Sakarya Basin and the Black Sea ecosystem. The Ankara River Sub-basin has an average annual natural flow of 389.18 hm3 (≈12.34 m3/s). Precipitation is mainly concentrated in the winter and spring months, leading to pronounced seasonal variability in the flow regime. During the summer, flows decrease significantly due to low rainfall and high evaporation.
2.2. GWF Methodology
The GWF is defined as the volume of freshwater that is required to assimilate the load of pollutants based on natural background concentrations and existing ambient water quality standards [
6]. The GWF calculation based on Tier-1 approach is as follows:
where
GWF is the grey water footprint (m
3 yr
−1),
L is the annual pollutant load (kg yr
−1),
Cmax is the maximum acceptable concentration in the receiving water body for each pollutant (kg m
−3), and
Cnat is the natural background concentration (kg m
−3).
The maximum allowable concentrations of pollutants in surface waters in Türkiye are given in
Table 1. Although the natural background concentration is generally set to 0 in GWF studies [
12], using
Cnat as 0 was not considered appropriate in this study. Even in the absence of anthropogenic impacts, organic matter and organic matter-derived pollutants are present in water bodies. According to the Water Footprint Assessment Manual [
6], the GWF represents the appropriation of the assimilative capacity of a receiving water body, which is defined by the difference between the maximum allowable concentration (
Cmax) and the natural background concentration (
Cnat). Assuming
Cnat = 0 artificially increases this difference and results in lower GWF estimates. Therefore, following the approach of [
7], the natural background concentration was taken as the excellent status concentration defined in the Turkish Surface Water Quality Regulation [
25]. In this study, good and excellent quality statuses are denoted as
Cmax and
Cnat, respectively.
The GWF calculations in this study were performed at three distinct levels within the basin: (i) diffuse pollution from agricultural activities, (ii) point-source pollution from wastewater treatment plants (WWTPs), and (iii) total basin-wide GWF based on in-stream monitoring data. This multi-level framework enables the comparison of sectoral contributions and the assessment of cumulative impacts at the basin scale. For agricultural diffuse pollution, the pollutant load reaching the water system was estimated using a Tier-1 approach based on the leaching and runoff fraction:
where
is the total mass of nitrogen (N) or phosphorus (P) applied as fertilizer (kg yr
−1) and α is the dimensionless leaching–runoff fraction. Fertilizer application rates were assumed to be spatially uniform within each district due to the use of aggregated data. While this simplification does not capture field-scale variability, it is consistent with the basin-scale scope of the study. The resulting uncertainty is mainly related to spatial distribution rather than the total amount of fertilizer applied.
For point-source pollution from wastewater treatment plants (WWTPs), the annual load was calculated directly from measured effluent data:
where
Qeff is the annual volume of treated wastewater discharge (m
3 yr
−1) and
Ceff is the average annual concentration of the pollutant (TN or TP) in the effluent (kg m
−3).
The total basin-wide GWF was calculated using data from all water quality monitoring points. The monitoring point closest to the sub-basin outlet was selected to represent the total basin-wide GWF. Following this approach, the total basin-wide GWF is calculated as:
where
Qriver is the flow of the river (m
3 s) and
Cmonitored is the observed concentration of the pollutant in the receiving water (mg L
−1).
To account for the inherent uncertainty in these proxy values and their significant influence on the final GWF results, a sensitivity analysis was integrated into the assessment. This analysis evaluates how variations in
Cnat and
Cmax thresholds—reflecting different management scenarios or potential natural background fluctuations—impact the estimated GWF. This ensures that the findings are robust and that the limitations of the regulatory-based proxy approach are transparently addressed. The impact of agricultural land area was not explicitly included in the sensitivity analysis as diffuse pollution loads were based on total fertilizer application data that are considered reliable at the basin scale. The main uncertainty relates to spatial allocation rather than total magnitude, which has limited influence on basin-scale GWF results. The sensitivity analysis is described in detail in
Section 3.4.
2.3. Data for GWF Analysis
The focus on TN and TP in this study is closely linked to data availability and monitoring consistency at the basin scale. Nutrient-related data are systematically available both for source characterization (e.g., fertilizer application and WWTP effluent concentrations) and for receiving water bodies through long-term monitoring programs.
2.3.1. Fertilizer Application
The total inputs of nitrogen and phosphorus were estimated based on fertilizer application data at the district level within the sub-basin. Districts with no significant agricultural activity (Çankaya, Etimesgut, Altındağ, Yenimahalle, and Pursaklar) were excluded from the analysis. In addition, districts with only limited spatial overlap with the sub-basin boundaries (Bala, Beypazarı, Elmadağ, and Kızılcahamam) were not included, as their contribution to the total agricultural load within the basin was considered negligible. The types and application rates of fertilizers in the districts of Ayaş, Sincan, and Polatlı were obtained from the Ankara Provincial Directorate of Agriculture and Forestry for 2023. Since these districts are only partially located within the study area, Geographic Information Systems (GIS) were used to determine the proportion of agricultural land falling within the Ankara River Sub-basin. Based on this spatial analysis, total fertilizer inputs were adjusted proportionally according to the fraction of cropland located within the basin boundaries, while application rates (kg ha−1) were assumed to be uniform across each district.
For districts lacking district-specific fertilizer data (Akyurt, Çubuk, Gölbaşı, Haymana, and Kahramankazan), fertilizer application rates were estimated using province-level statistics. Total annual nitrogen and phosphorus fertilizer consumption for Ankara Province was obtained from TURKSTAT (2023) and normalized by the total agricultural land area of the province to derive average application rates of 36.5 kg ha
−1 for N and 9.33 kg ha
−1 for P. These average rates were then applied to the agricultural areas of the respective districts located within the sub-basin boundaries, assuming spatially uniform fertilizer application (
Table 2).
In line with the opinions of the Ministry of Forestry and Agriculture (MoAF), it was assumed that, under Turkish conditions, 10% of the applied N and 2.5% of the applied P reach the receiving environment as a result of total losses in the soil [
26]. Based on this assumption, fertilizer-derived diffuse loads (entering the aquatic environment) were calculated as seen in
Table 3. This approach is consistent with the methodology reported by Franke et al. [
27].
2.3.2. Point Sources (WWTPs)
GWF assessments for selected WWTPs within the Ankara River Sub-basin were conducted using operational data obtained from the Ankara Metropolitan Municipality for 2023. Effluent flow rates and pollutant concentrations were used to calculate annual nutrient loads. Total nitrogen (TN) and total phosphorus (TP) were selected as key water quality indicators, and TN-derived and TP-derived GWF values were calculated accordingly. River flow data representing the receiving environment was obtained from the Ankara Provincial Directorate of Agriculture and Forestry. Only WWTPs with sufficiently complete and consistent datasets (i.e., continuous monthly flow and concentration records) were included in the analysis (
Table 4).
2.3.3. TN and TP Monitoring Data in Ankara River
Total nitrogen (TN) and total phosphorus (TP) measurements at multiple monitoring stations along the Ankara River were obtained from the Ankara Provincial Directorate of Agriculture and Forestry. The locations of these stations are presented in
Figure 1. Due to the irregular sampling frequency and data gaps in certain years, long-term average concentrations for the period 2015–2024 were calculated and used in the GWF estimation. The use of long-term averages reduces the influence of short-term variability but may mask seasonal fluctuations in nutrient concentrations. This approach was adopted to ensure a representative characterization of baseline water quality conditions; however, it introduces temporal inconsistency with the 2023 source data, which is acknowledged as a limitation of the study.
2.4. Sensitivity Analysis
To evaluate the robustness of the GWF estimates and to quantify the impact of inherent uncertainties in input parameters, a comprehensive sensitivity analysis was conducted. The analysis focused on two critical dimensions: (i) the leaching–runoff fraction (α), which represents the proportion of applied nutrients reaching the water bodies, and (ii) the ambient water quality standards (Cmax and Cnat), which define the dilution capacity of the receiving environment.
For diffuse pollution sources, three scenarios for leaching fractions were tested: a baseline (α_TN = 0.10, α_TP = 0.025), a low-impact scenario (α_TN = 0.05, α_TP = 0.01), and a high-impact scenario (α_TN = 0.20, α_TP = 0.05). Additionally, four distinct water quality threshold combinations were established based on different regulatory limits (ranging from ultra-strict ecological limits to permissive fair standards).
While the leaching fraction (α) is specific to diffuse agricultural sources, the sensitivity of the GWF to water quality thresholds (Cmax and Cnat) was evaluated across all pollution categories, including point sources and monitored in-stream loads. Since the GWF calculation is mathematically linear with respect to the pollutant load and inversely proportional to the concentration gradient (ΔC), the percentage changes observed in the diffuse pollution scenarios are representative and applicable to point source and monitored station assessments under identical threshold variations.
2.5. Total Grey Water Footprints
The GWF for point sources was evaluated for each WWTP individually to reflect site-specific pressures. In accordance with the Water Footprint Assessment Manual summing the GWF values of individual point sources to derive a cumulative basin-wide total was avoided, as this approach is technically inconsistent with the ‘critical pollutant’ and ‘critical location’ principles. WWTP1—the facility with the highest discharge capacity—was selected as a representative point source. Due to its dominant discharge contribution compared to other WWTPs, its GWF value was used to indicate the magnitude of point-source pressure at the basin scale.
The river basin’s GWF is calculated by analyzing the integrated pollutant responses at monitoring locations. The assessment was centered on the monitoring station nearest to the river outlet, as it represents the integrated response of the entire upstream catchment. While this comparison focuses on the dominant point source, it provides an indicative assessment of the relative contribution of municipal wastewater versus agricultural diffuse sources at the basin scale.
In this study, the parameters used in the GWF calculations are directly linked to the datasets presented in
Table 2 and
Table 4. The fertilizer input (M) corresponds to the total nitrogen and phosphorus application values reported in
Table 2, while the effluent concentration (
Ceff) is based on the average TN and TP values given in
Table 4. The effluent flow rate (
Qeff) was derived from the reported treatment capacities of the respective WWTPs.
3. Results and Discussion
3.1. Grey Water Footprint of Diffuse Pollution from Agriculture
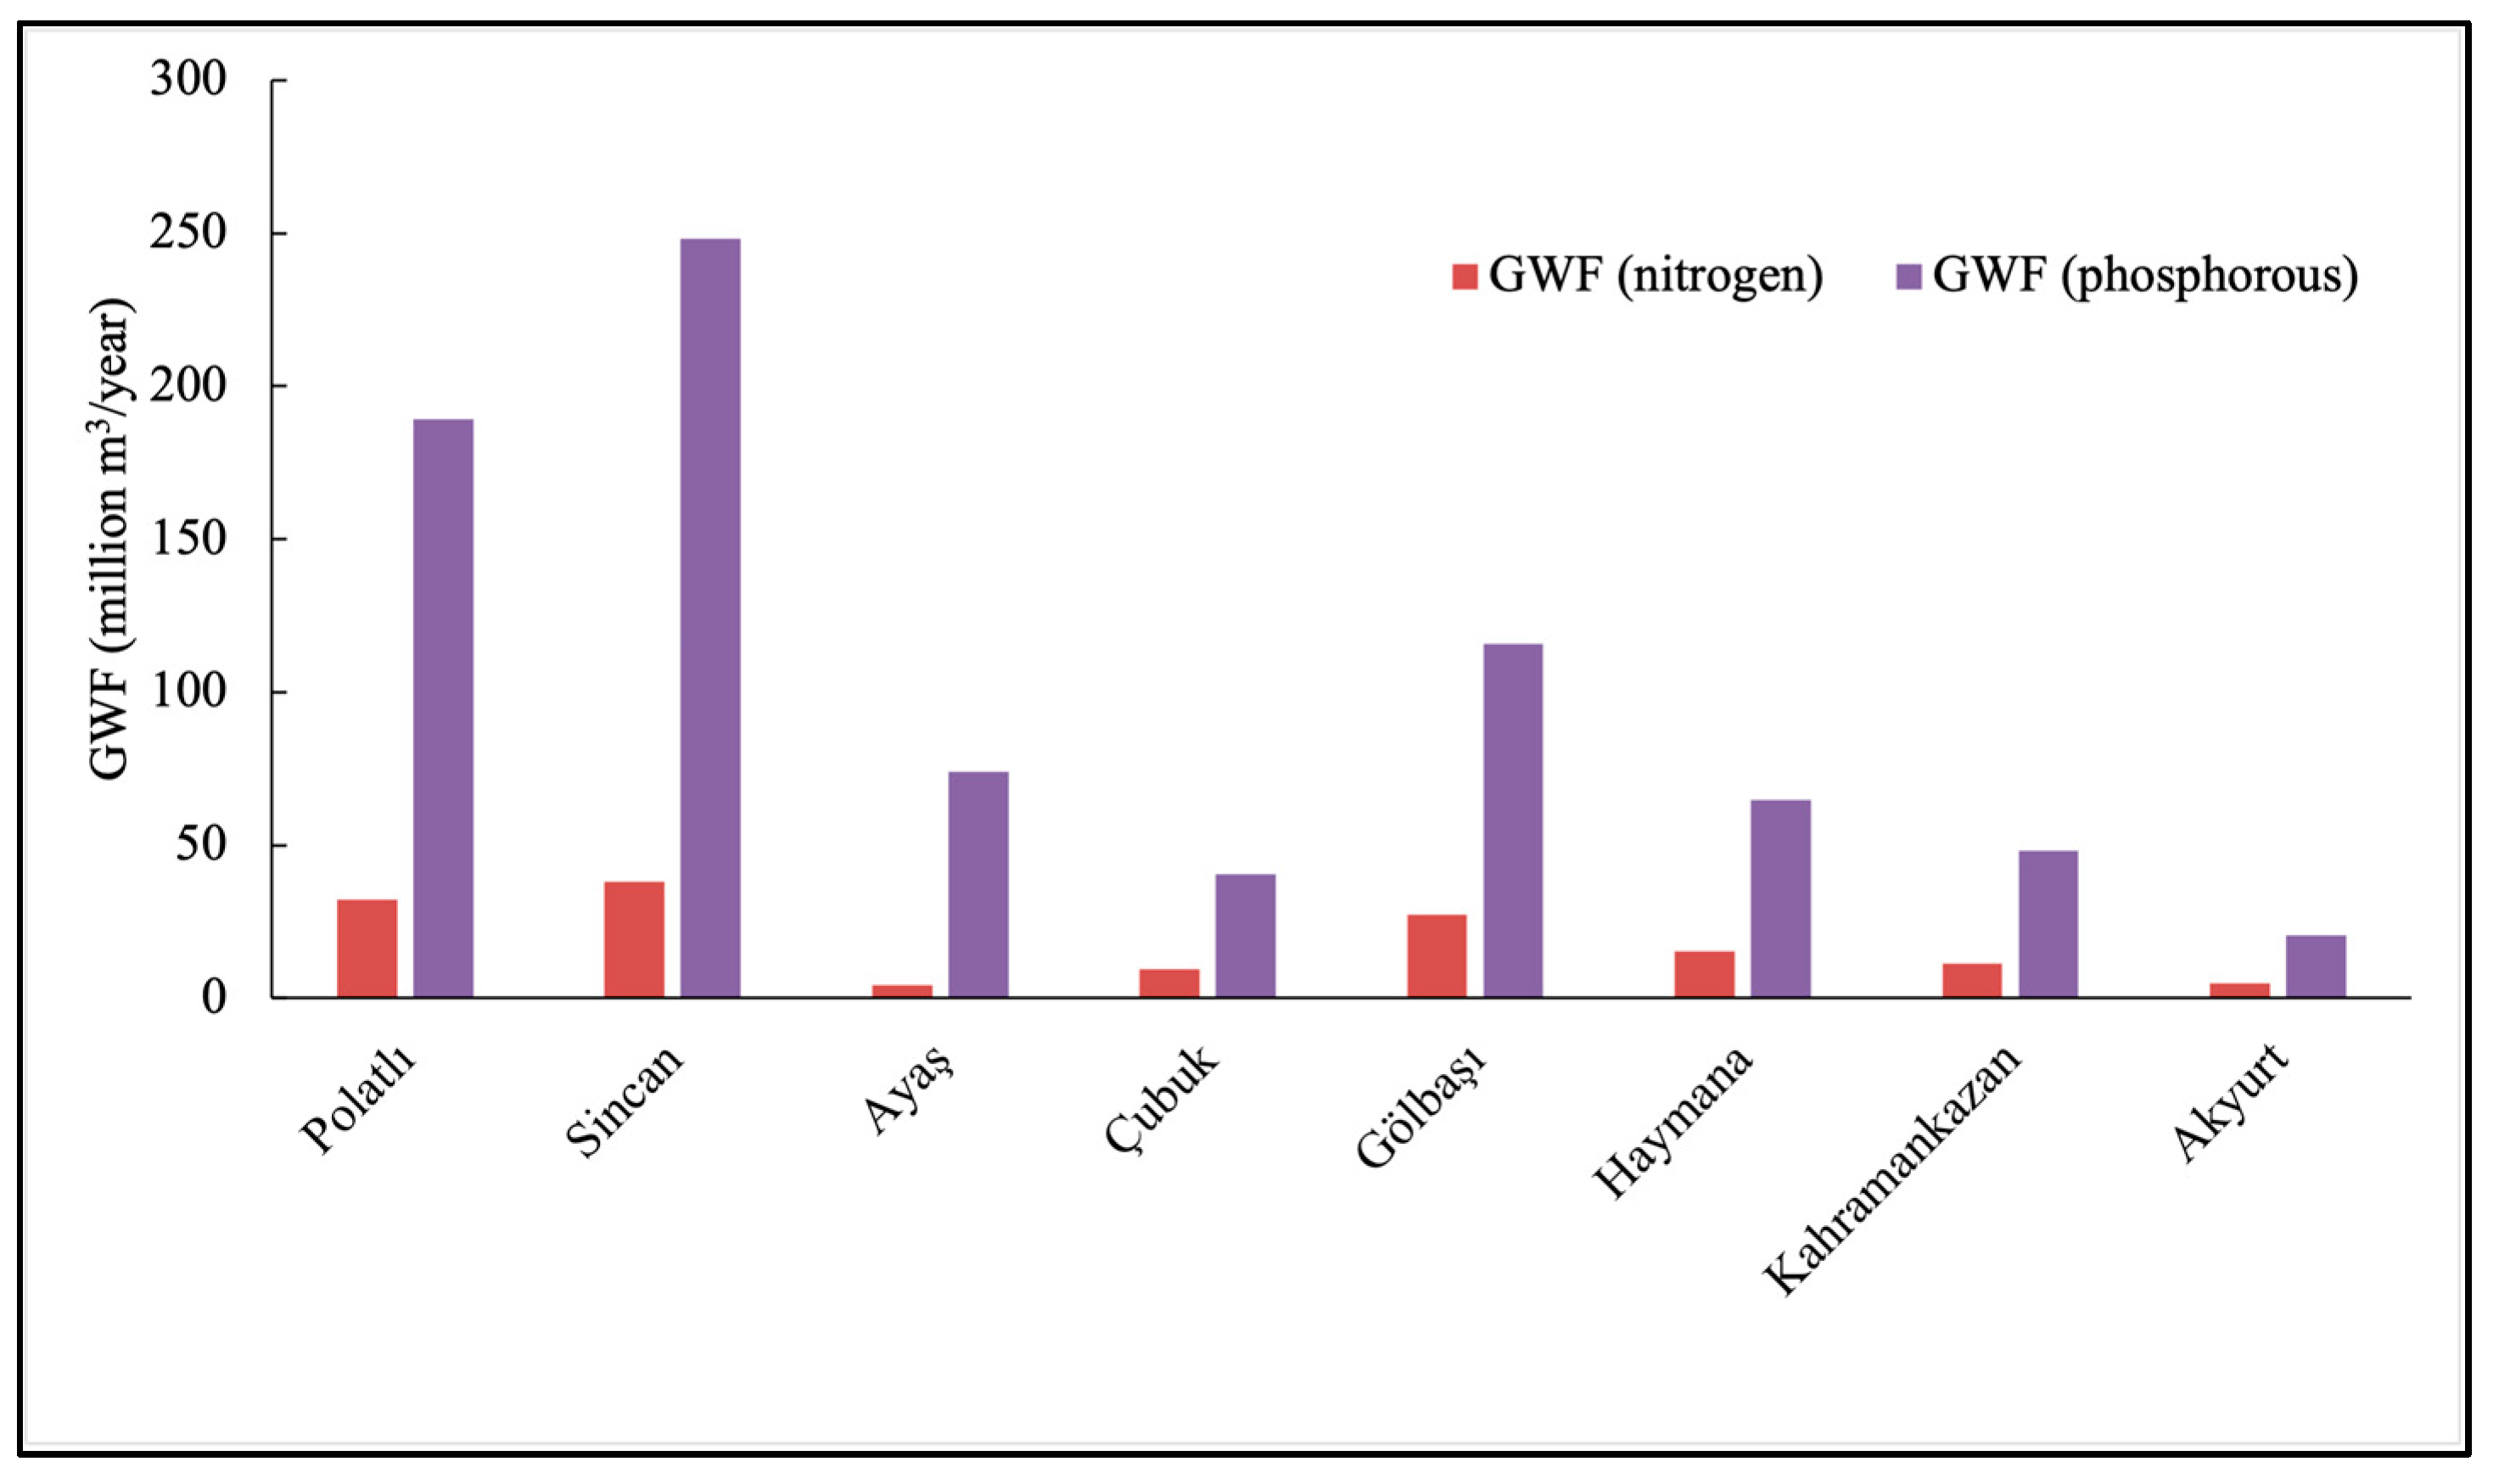
Figure 2 presents the estimated fertilizer-derived N and P loads from agricultural activities and the corresponding GWF values for the eight districts within the Ankara River Sub-basin. The results shown are based on the standard set of assumptions, where the leaching–runoff fractions were assumed as α_TN = 0.10 and α_TP = 0.025, and the water quality thresholds (
Cmax −
Cnat) were defined based on the “excellent” and “good” water quality classes, respectively. The results indicate that Sincan and Polatlı exhibit the highest GWF values for both TN and TP, suggesting the greatest potential pressure in terms of assimilative water requirements associated with nutrient pollution. In Sincan, the TP-based GWF (248 million m
3 yr
−1) was approximately 6.5 times higher than the TN-based GWF (38 million m
3 yr
−1). TP-based GWF values exceeded TN-based values across the districts, which is consistent with the GWF formulation and the typically smaller (
Cmax −
Cnat) margin for phosphorus due to lower background levels and stricter ambient water quality thresholds. This finding aligns with previous studies [
11,
28] that identified P as the most critical pollutant in determining GWFs, due to its lower natural background concentration (
Cnat) and stricter ambient water quality standards. The lowest GWF values were observed in Akyurt (4.82 million m
3 yr
−1 for TN and 20.57 million m
3 yr
−1 for TP).
3.2. Grey Water Footprint of Point Sources
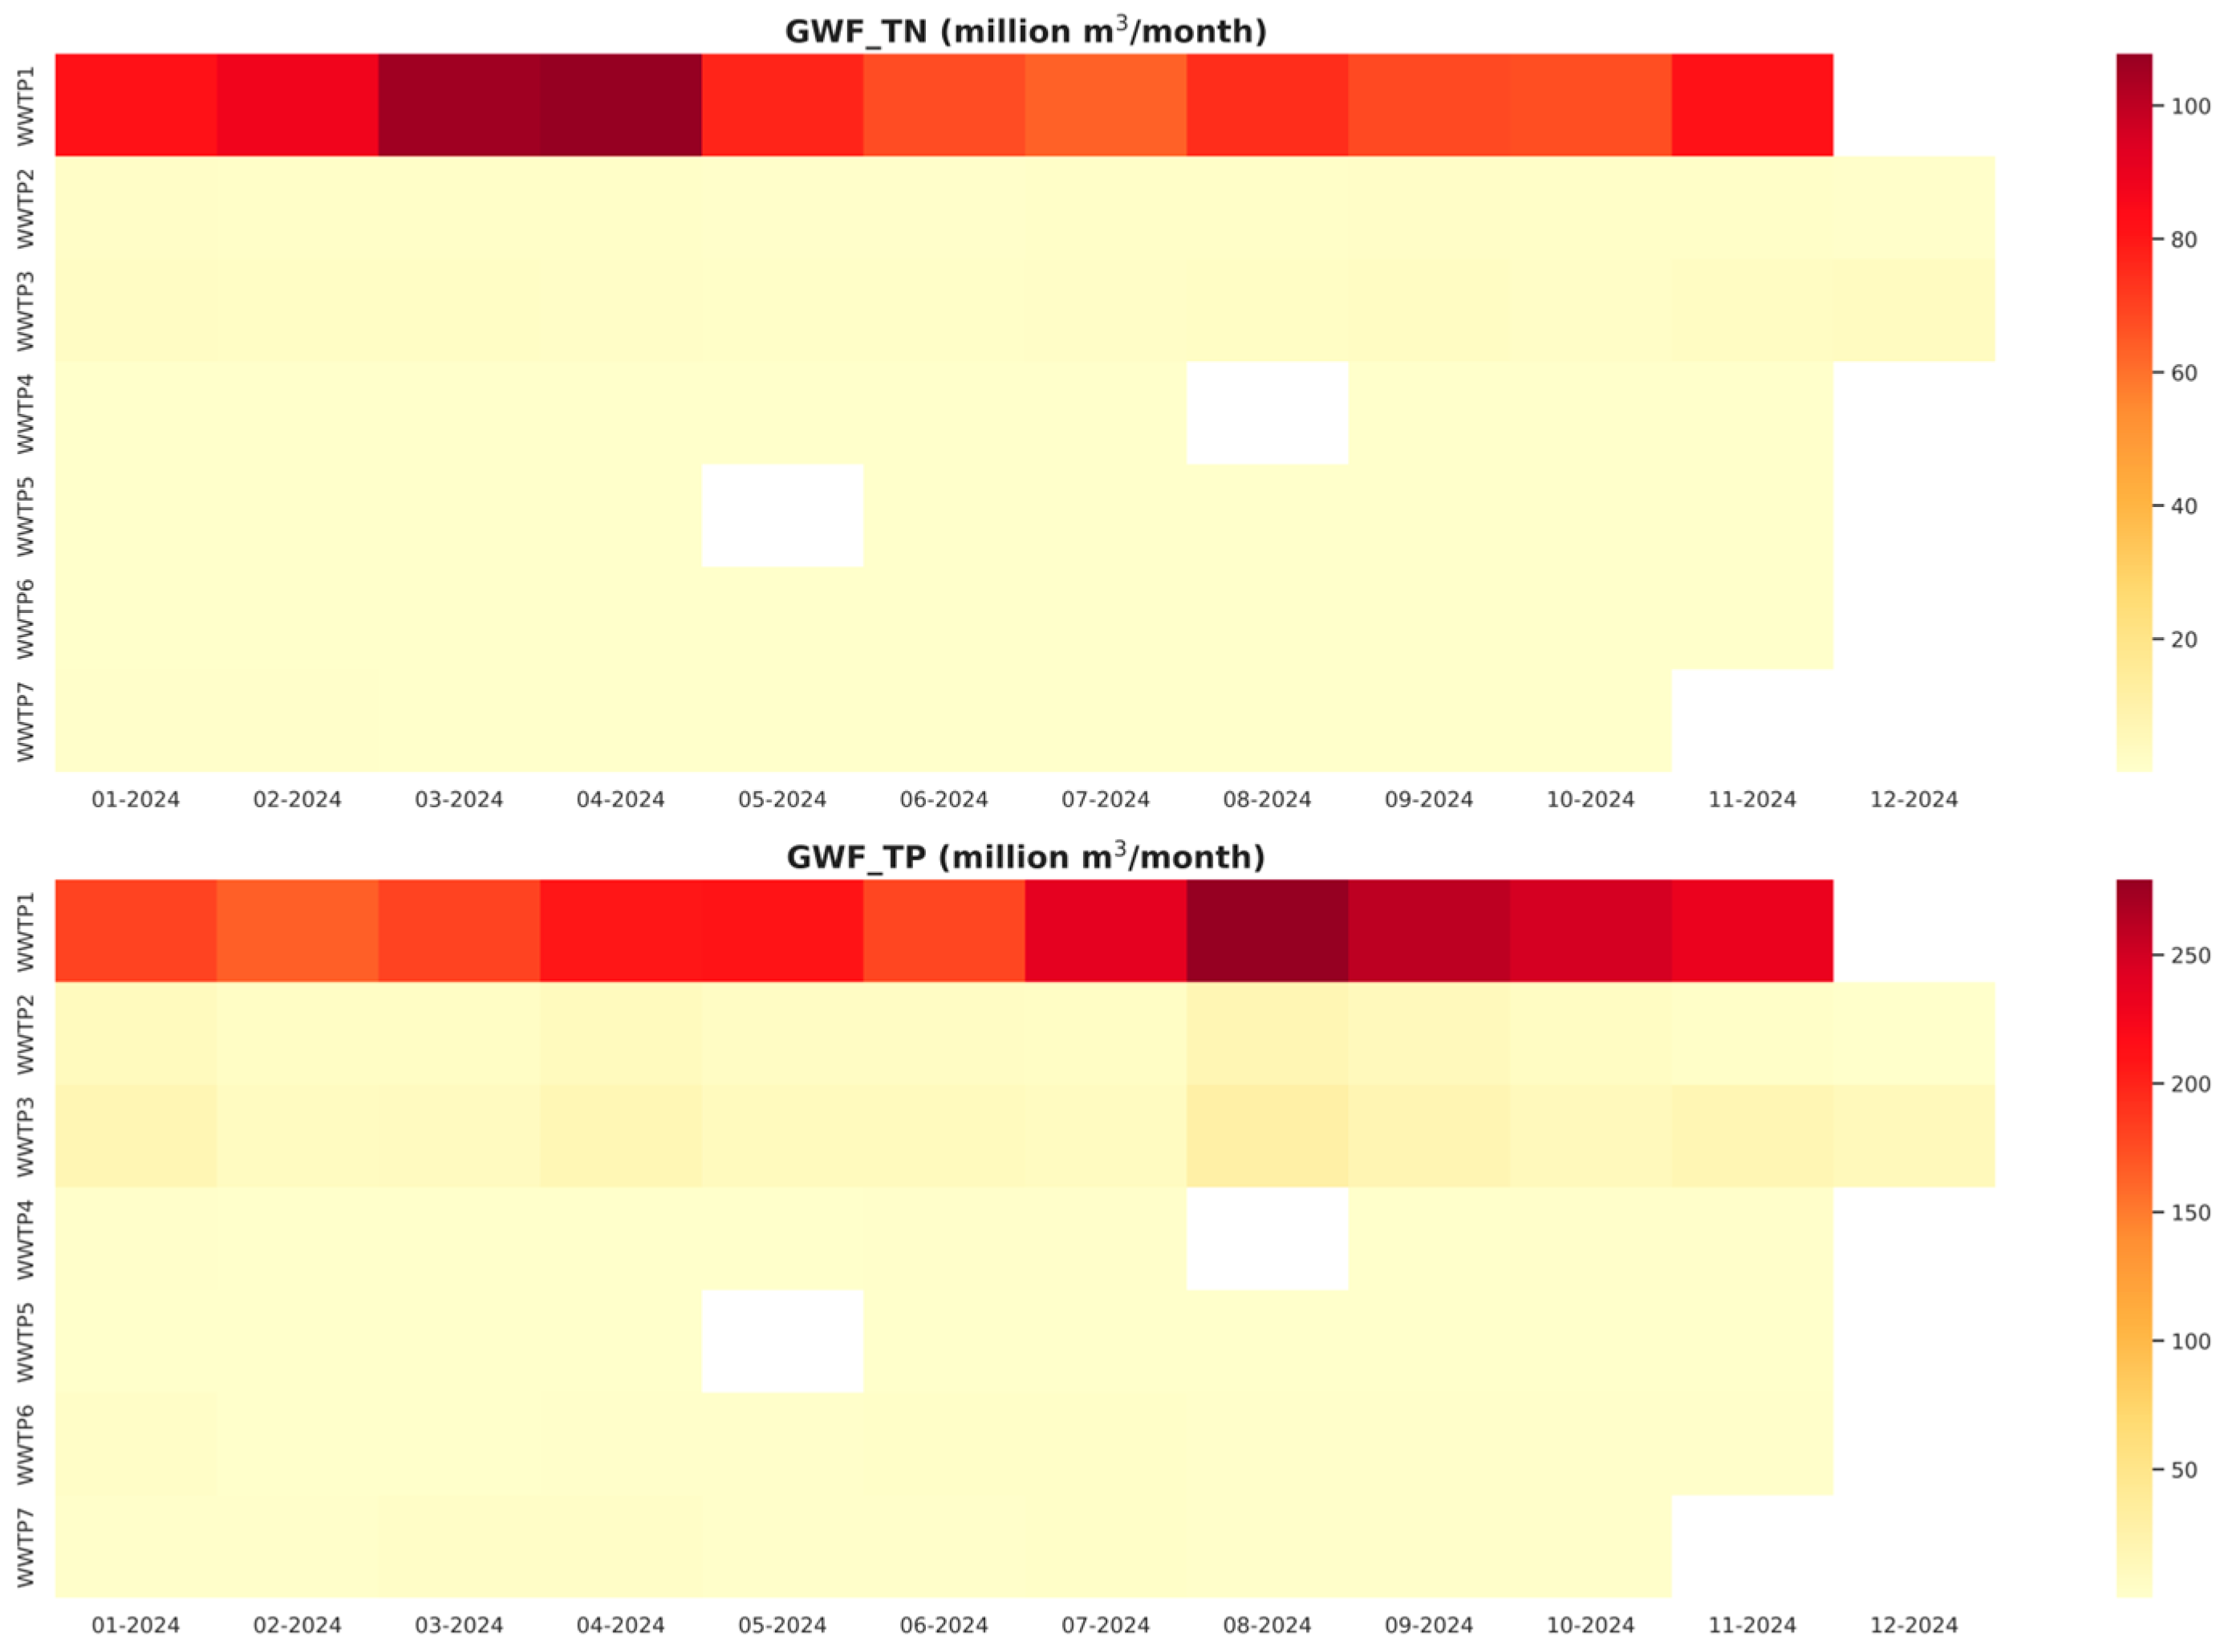
Figure 3 illustrates the monthly variation in TN- and TP-based GWF values for the selected WWTPs. Missing WWTP data, indicated as white blank cells in
Figure 3, were handled by including only available and reliable records in the GWF calculations. While this approach ensures methodological transparency, it may introduce some uncertainty due to data gaps. The results shown are based on the standard parameterization adopted in this study, where the effluent concentrations (
Ceff) are taken from the average values reported in
Table 4, and the water quality thresholds (
Cnat and
Cmax) correspond to the “excellent” and “good” water quality classes, respectively. For both parameters, WWTP1 clearly exhibits the highest GWF values throughout the year, reflecting its dominant role in terms of point-source pressure within the sub-basin. The remaining WWTPs show considerably lower GWF values, indicating a secondary but still relevant contribution.
A comparison of TN- and TP-based GWF values shows that TP-derived GWF is consistently higher than TN-derived GWF, particularly for larger facilities. TN-based GWF values range approximately between 82–108 million m
3 month
−1, with peak values observed during March and April. Following this period, TN-based GWF values decrease and stabilize within a lower range. In contrast, TP-based GWF values are substantially higher, ranging between approximately 165 and 279 million m
3 month
−1. The highest TP-derived GWF values occur during the summer months, with a peak in August. This pattern is particularly evident at WWTP1, where TP-based GWF values match or exceed TN-based values for most of the year. Seasonal hydrological variability plays a key role in the observed GWF patterns. During wetter periods, increased river flows enhance dilution capacity, which may contribute to the relatively lower and more stable TN-based GWF values observed after spring. In contrast, during dry periods, reduced river flows limit dilution capacity, leading to higher pollutant concentrations and increased GWF values [
29,
30]. This effect is particularly pronounced for phosphorus, which exhibits peak GWF values during the summer months. In addition to natural seasonal variability, anthropogenic factors such as irrigation return flows and operational changes in wastewater treatment plants may further influence temporal fluctuations in pollutant loads. Temporal variability plays an important role in the interpretation of GWF results. Certain months may exhibit significantly higher pollution loads compared to others, indicating periods when GWF is more pronounced. Identifying these months helps reveal the specific periods when environmental pressure is highest. This shows that monthly changes in GWF can be just as important as annual averages, and sometimes even more informative for understanding water quality dynamics.
Within the adopted GWF framework, these results suggest that phosphorus plays a more influential role in determining water quality pressure in the Ankara River Sub-basin. This behavior is consistent with previous studies [
8], which identified phosphorus as a key driver of GWF in wastewater systems. The temporal variability observed in the GWF values may be associated with fluctuations in influent characteristics and treatment performance, potentially influenced by seasonal factors such as changes in wastewater composition or inflow conditions. These results should be interpreted considering the selected
Cmax and
Cnat values, which directly influence the relative magnitude of TN- and TP-based GWF estimates.
Smaller decentralized plants (WWTP4, WWTP5, WWTP6, and WWTP7) contribute only marginally to the overall basin-wide GWF. From a management perspective, this pattern suggests that process optimization and targeted upgrades at large-scale facilities can deliver the most substantial environmental benefits. Nevertheless, the localized impacts of smaller WWTPs on headwater reaches or small tributaries should not be overlooked, as these water bodies often possess lower dilution and assimilation capacities. While most studied plants are located within the intensely urbanized areas of Ankara, WWTP1 and WWTP2 are situated in regions characterized by a mix of agricultural land and industrial zones. In these areas, the combined effect of agricultural diffuse sources and potential industrial discharges may significantly enhance nutrient loads, necessitating integrated downstream water quality assessments. Furthermore, since WWTP2 discharges into the upper reaches of the sub-basin, the generated pollutant loads are potentially transported downstream, influencing the cumulative water quality status of the entire catchment.
To evaluate the environmental performance of the WWTPs independently of their discharge volumes, the flow-normalized grey water footprint intensity (GWF/Q) was calculated for each facility (
Table 5). This metric represents the volume of ambient water required to dilute 1 m
3 of treated effluent to the baseline water quality standards. The results indicate significant variations in pollution intensity across the facilities. For TN, WWTP1 exhibited the highest intensity with a GWF/Q of 4.81 m
3/m
3, reflecting its higher average effluent concentration (38.505 mg/L) compared to the advanced biological treatment plants. In contrast, WWTP5 showed the lowest TN intensity (0.81 m
3/m
3), suggesting a more efficient nitrogen removal performance relative to the baseline threshold. For Total Phosphorus (TP), the dilution requirements were substantially higher across all facilities, with GWF/Q values ranging from 3.58 to 19.56 m
3/m
3. Notably, WWTP7 and WWTP6 showed the highest TP intensities (19.56 and 16.62 m
3/m
3, respectively), even exceeding the intensity of the much larger WWTP1 (13.09 m
3/m
3). This suggests that while WWTP1 dominates the absolute volumetric footprint due to its massive discharge capacity, smaller facilities like WWTP7 and WWTP6 exert a higher per-unit-volume pressure on the receiving environment regarding phosphorus enrichment. These findings highlight that achieving compliance with stringent phosphorus standards remains a critical challenge for the basin’s wastewater infrastructure. The high GWF/Q ratios for TP across all plants, where even the best-performing facility (WWTP5) requires over 3.5 times its own discharge volume for dilution, underscore the necessity for further upgrading phosphorus removal technologies to mitigate the risk of eutrophication in the semi-arid receiving waters.
3.3. Total Grey Water Footprint of the Ankara River Sub-Basin
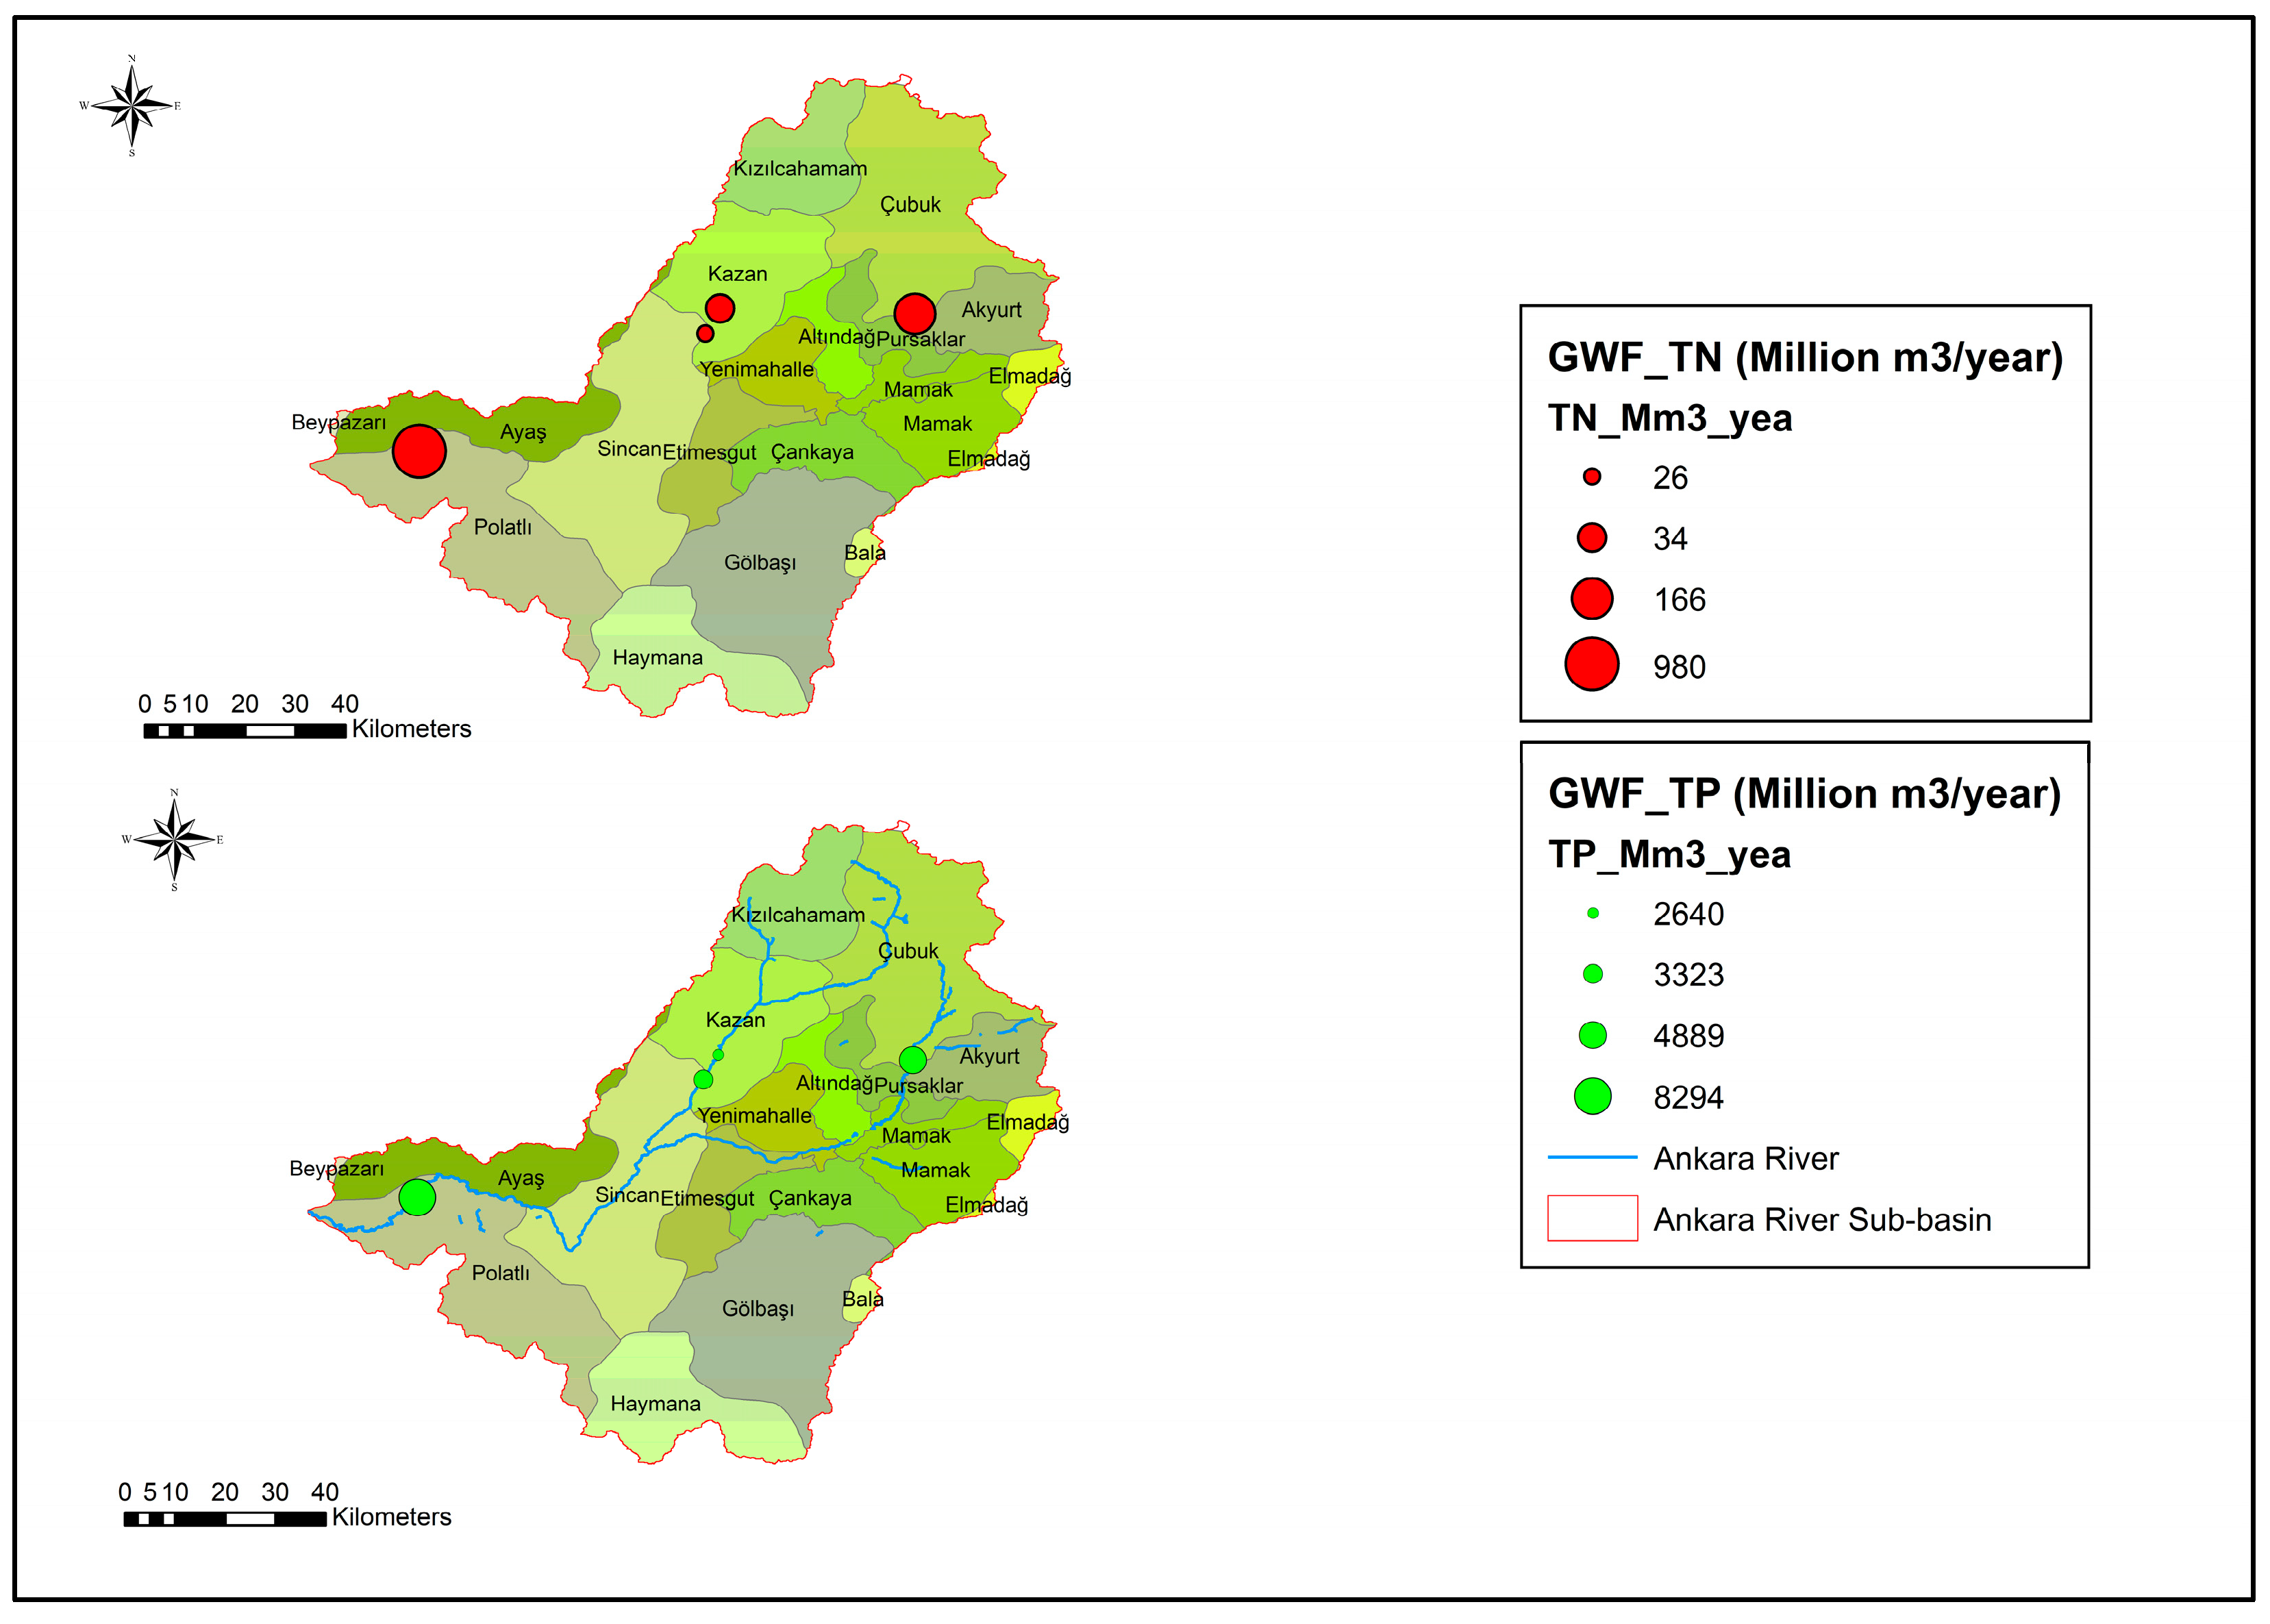
The spatial distribution of nutrient-derived GWF across the Ankara River Sub-basin (
Figure 4) reveals marked spatial variability. TP-based GWF values range from approximately 2640 to 8294 million m
3 yr
−1, whereas TN-based GWF values vary between about 26 and 980 million m
3 yr
−1. Overall, TN-derived GWF values remain comparatively low across all monitoring locations, while TP-derived GWF values are substantially higher. Within the adopted GWF framework, this indicates that phosphorus plays a dominant role in determining the magnitude of the monitored GWF.
The highest TP-based GWF values are observed at the monitoring points near Sincan and at the basin outlet near Polatlı (8294 million m3 yr−1), indicating locations with elevated nutrient pressure. These locations may be interpreted as potential hotspots of phosphorus-related water quality pressure within the basin. In addition, the highest TN-based GWF is also recorded at the outlet monitoring point near Polatlı, reflecting the cumulative impact of upstream sources. In contrast, the northeastern monitoring point at Çubuk exhibits the lowest TP-based GWF (2640 million m3 yr−1), although it ranks second in terms of TN-based GWF. This spatial contrast highlights differences in nutrient dynamics and potential source contributions across the basin.
3.4. Sensitivity of GWF to Input Parameters and Thresholds
The sensitivity analysis reveals that the GWF results are highly susceptible to the selection of water quality standards, particularly for TP. As shown in
Table 6, shifting from the baseline scenario to an ultra-strict threshold (
Cmax = 0.008 mg L
−1) for TP results in a 1400% increase in the dilution requirement, reaching 12,019 Mm
3 yr
−1 for diffuse sources. This exponential increase highlights that in semi-arid basins like the Ankara River, the perceived water footprint is dictated more by the stringency of environmental targets than by the absolute pollutant loads.
Regarding the leaching–runoff fractions, a doubling of the αvalue (from 0.10 to 0.20 for TN) leads to a direct 100% increase in the GWF, confirming a linear sensitivity. The results emphasize that even under permissive threshold scenarios (fair), the TN-GWF remains at 790.80 Mm3 yr−1, which is significantly higher than the total diffuse TN-GWF of the entire basin (142.86 Mm3 yr−1).
These findings underscore two critical management insights: first, the uncertainty in agricultural leaching rates can alter the footprint by a factor of two, necessitating more site-specific field data. Second, the extreme sensitivity to Cmax suggests that policymaking in water-stressed regions must balance ambitious ecological targets with the realistic dilution capacity of the hydrological system.
To provide a quantitative interpretation of the sensitivity analysis, a coefficient of sensitivity (S) was calculated based on the relative change in GWF with respect to the relative change in the tested parameter. For leaching–runoff fraction scenarios, S was equal to 1 for both TN and TP, indicating a direct proportional response of GWF to α. For threshold scenarios, negative S values were obtained because GWF varies inversely with the concentration gradient (Cmax − Cnat). The highest absolute sensitivity was observed under the ultra-strict TP threshold scenario, confirming that TP-based GWF is particularly responsive to small changes in water quality thresholds.
3.5. Comparison of Grey Water Footprints
This study provides a comprehensive spatial and quantitative assessment of the GWF and associated nutrient loads across the Ankara River Sub-basin. The findings demonstrate that phosphorus (TP) is the primary driver of water quality pressure, with TP-derived GWF values consistently exceeding TN-derived estimates across both diffuse and point sources. A critical highlight of the study is that the total monitored GWF at the basin outlet exceeds the river’s annual average flow (11.3 m3 s−1) by a factor of 23. This indicates a severe depletion of the system’s natural assimilation capacity on an annual basis; however, this risk reaches even more dramatic proportions during low-flow periods, when the river’s dilution capacity is at its minimum.
Sectoral analysis reveals that while agricultural fertilizer usage accounts for approximately 10% of the total GWF, wastewater treatment plants (WWTPs) contribute about 31%. This aligns closely with literature, reporting 8% contribution from agricultural sources in the assessment of agricultural, industrial, and domestic GWF, where the domestic sector dominated with a share of 84% [
19]. Interestingly, Chai & Chen found a much higher agricultural contribution of 76%, underscoring how the relative importance of sectors can vary widely depending on the regional context [
31]. Supporting this, the study demonstrated that the proportions of domestic, agricultural, and industrial contributions to the grey water footprint differ markedly across countries worldwide [
28]. These variations emphasize that GWF assessments are highly context-specific, and caution should be exercised when comparing values across different regions.
The comparison between conventional and advanced treatment technologies reveals that their effectiveness is pollutant-dependent rather than uniform. As shown in
Table 5, advanced biological nutrient removal systems provide clear benefits for TN, while their performance for other parameters, particularly TP, remains limited and does not consistently outperform conventional systems. In the study by Stejskalová et al., the grey water footprint reduction efficiency values were reported as approximately 5 for total nitrogen and 7 for total phosphorus, indicating a limited reduction in nutrient-related pollution loads despite the presence of biological treatment processes [
7]. This finding is consistent with the results of the present study. Although WWTP1 operates with biological treatment, the flow-normalized grey water footprint values remain considerable, with GWF/Q ranging between 0.81–4.81 m
3/m
3 for total nitrogen and 3.58–19.56 m
3/m
3 for total phosphorus. In another biological treatment plant study, TN-related GWF decreased from 3.83 L/L at the influent to 0.87 L/L at the effluent, indicating a substantial reduction through biological treatment processes. In contrast, TP showed only a limited decrease, from 5.00 L/L to 4.00 L/L, suggesting relatively low removal efficiency. These results indicate that, even under biologically treated conditions, a substantial volume of receiving water is still required to assimilate nutrient loads, particularly for phosphorus [
32].
These findings suggest that the application of the GWF indicator alongside conventional discharge limits can support a more ecologically meaningful evaluation of WWTP performance [
3]. While current regulatory frameworks in Türkiye and the EU Water Framework Directive (2000/60/EC) primarily emphasize compliance with effluent concentration thresholds, compliance alone does not ensure that the assimilative capacity of receiving waters is respected. Similar to this study, some studies conducted in Spain also identified TP as the key limiting parameter [
33,
34]. Conversely, other studies have reported total nitrogen as the dominant pollutant [
35], highlighting that cross-study comparisons of GWF values are only meaningful when underlying assumptions, pollutant selection, and reference concentrations are explicitly considered [
36]. The plants equipped with advanced treatment processes exhibit substantially lower nutrient-related GWF values.
The water footprint values reported in literature vary widely, reflecting differences in environmental settings as well as methodological assumptions applied in their calculation [
37]. Assumptions related to pollutant loads, maximum allowable concentrations and natural background concentrations exert a strong influence on the results. Generally,
Cmax is set equal to drinking water quality standards—which are less stringent than ambient water quality standards—and
Cnat is assumed to be zero. In this study,
Cnat was assumed to be greater than zero within a defined value of 3.5 mg L
−1 for TN and 0.08 mg L
−1 for TP. This approach was considered more realistic than simply neglecting
Cnat. To further account for the inherent uncertainties in these parameter selections and to evaluate the robustness of the findings, a comprehensive sensitivity analysis was integrated into the study. By testing a range of
Cmax and
Cnat combinations varying from conservative ecological limits to more permissive limits, the analysis quantifies how different environmental protection targets and background concentration assumptions influence the final GWF estimates.
The variability of leaching–runoff fractions is strongly influenced by soil management practices. For instance, no-tillage systems can reduce nitrogen leaching by up to 30% compared to conventional tillage due to enhanced soil structure, increased organic matter, and improved water retention capacity [
38]. Such findings indicate that the use of constant leaching fractions in Tier-1 approaches represents a simplification that does not fully capture the complexity of nutrient transport processes. Similarly, recent field-based studies have demonstrated that leaching–runoff fractions are highly uncertain and context-specific, often deviating substantially from commonly used default values. For example, in situ measurements in sugarcane systems have shown that empirical Tier-1 coefficients may overestimate nitrogen losses by up to a factor of two, while improved fertilizer management practices, such as split or incorporated applications, can significantly reduce actual leaching losses [
39]. These findings further support that fixed leaching fractions do not adequately represent real-world conditions and should be interpreted with caution in large-scale assessments.
Monitoring locations without significant point-source inputs can be used as reference segments to assess the net effect of in-stream processes. Variations in nutrient concentrations between consecutive stations (e.g., near the Kahramankazan district) provide insights into system behavior. This behavior differs markedly between nitrogen and phosphorus due to their distinct biogeochemical characteristics. TN often shows declining concentrations downstream, which can be attributed to processes such as nitrification–denitrification, biological uptake, and other transformation pathways [
40]. In contrast, TP typically exhibits more persistent patterns. Its strong interaction with sediments and limited biological removal results in temporary storage followed by potential release under changing environmental conditions [
41]. Consequently, TP concentrations may remain stable or even increase along the river due to cumulative inputs and internal loading.
3.6. Policy Implications
Effective management of the Ankara River Sub-basin requires an integrated approach that moves beyond administrative boundaries to account for downstream impacts on the Sakarya River system. Future policies should prioritize the promotion of decentralized treatment in organized industrial zones, improved manure management in livestock systems, and the adoption of the GWF as a supplementary indicator to align pollutant loads with the actual assimilative capacity of the river.
Prioritizing the implementation of tertiary phosphorus removal at WWTP1 would yield the most substantial basin-wide reduction in GWF. Furthermore, the flow-normalized GWF intensity analysis revealed that smaller facilities such as WWTP6 and WWTP7 exert disproportionately high per-unit-volume pressure on receiving waters with respect to phosphorus enrichment. Consequently, process optimization at these decentralized plants—particularly improvements in hydraulic retention time—should also be incorporated into investment planning cycles.
Future agricultural policy should prioritize the implementation of nutrient management plans at the district level, supported by mandatory recording and reporting of fertilizer application rates. The establishment of riparian buffer strips and vegetated filter zones along the Ankara River and its tributaries would help intercept nutrient runoff before it reaches the stream channel. Additionally, the promotion of good agricultural practices—including precision fertilization, crop rotation, and reduced tillage—should be embedded within agri-environment schemes and rural development programmes [
42].
The remaining 59% of the monitored GWF, which was not explicitly quantified, points toward the substantial influence of industrial discharges and the rapid intensification of livestock farming in the region. These results suggest that current regulatory frameworks, which focus primarily on effluent concentration thresholds, are insufficient to ensure the ecological health of receiving waters. For Ankara, promoting decentralized treatment plants within organized industrial zones is crucial to promote cleaner industrial practices and, consequently, achieve cleaner water resources. In terms of livestock farming, the number of cattle and sheep in Ankara province has approximately tripled over the last 20 years [
43]. The GWF related to manure can be substantial, particularly in livestock production systems where manure management practices influence nutrient runoff and leaching. A recent study evaluated the water footprint of different livestock production systems and highlighted that nitrogen leaching from manure effluents is a major contributor to GWF, especially in intensive farming systems [
44]. In addition, potential variations in wastewater treatment performance, such as temporary overloading or operational fluctuations, may also contribute to the observed GWF values.
A key limitation identified in this study was the need to rely on long-term average concentrations (2015–2024) due to irregular sampling frequencies and data gaps at several monitoring stations. These temporal averaging risks mask episodic pollution events and seasonal peaks that are critical for GWF estimation, particularly under low-flow conditions. Policy efforts should therefore prioritize the transition to high-frequency, flow-proportional water quality sampling at strategically selected stations, especially at locations identified as pollution hotspots, such as Sincan and Polatlı, and at sites downstream of major industrial discharge points.
From a policy perspective, the inclusion of receiving-water assimilation criteria into discharge permitting processes is critical, particularly for semi-arid, low-flow basins. Future management strategies should evaluate the cost–benefit of technical upgrades (e.g., tertiary phosphorus removal) alongside nature-based solutions like buffer strips and regenerative agriculture. Strengthening stakeholder governance by involving municipal authorities, industry representatives, and farmers in the co-design of mitigation measures will be vital for the long-term protection of the Ankara River and the downstream Sakarya River system.
While the Tier-1 approach employed in this study provides a transparent and reproducible framework for basin-scale GWF estimation, its reliance on fixed leaching–runoff fractions and spatially uniform fertilizer application rates introduces inherent uncertainties. The combination of process-based modelling with remote sensing inputs would also facilitate a more robust source apportionment analysis, enabling the quantitative separation of agricultural, industrial, and domestic contributions to the total GWF. Such methodological advances would not only strengthen the scientific basis of GWF assessments in semi-arid basins but would also enhance their operational utility as decision-support tools for basin managers and policymakers.
3.7. Limitations
Although this study provides a comprehensive assessment of nutrient-driven GWF across the Ankara River Sub-basin, several limitations should be acknowledged. The spatial and temporal resolution of river water quality data necessitated the use of long-term averages (2015–2024). While this approach mitigates data gaps, it may smooth seasonal peaks and episodic pollution events that are critical for GWF estimation, particularly under low-flow conditions [
45]. And, the estimation of agricultural diffuse pollution relies on Tier-1 assumptions, including fixed leaching–runoff fractions and generalized fertilizer application rates for certain districts. These proxies do not explicitly account for soil characteristics, irrigation practices, or in-stream nutrient transformation processes. Furthermore, the selection of
Cmax and
Cnat values, while based on regulatory standards, may not fully capture the natural background variability across different reaches of the basin.
A temporal mismatch exists between the datasets used in this study. While WWTP-related parameters (Qeff and Ceff) are based on operational data for the year 2023, in-stream water quality data are represented by long-term averages (2015–2024). The use of long-term averages was preferred to better characterize baseline river conditions, as monitoring data are often subject to strong seasonal variability and relatively sparse sampling. However, this approach may not capture year-specific variations in hydrological conditions and pollutant loads, and therefore introduces uncertainty in the direct comparison between source-based and monitoring-based GWF estimates. This limitation should be considered when interpreting the results.
Uncertainty in GWF estimates was quantified using the results of the sensitivity analysis. Variations in the leaching–runoff fraction (α) resulted in changes of approximately ±50–100% in GWF values. In contrast, changes in water quality thresholds (Cmax and Cnat) had a more pronounced effect, leading to variations of up to one order of magnitude, particularly for phosphorus. These findings highlight that GWF estimates are highly sensitive to key input parameters and should be interpreted with caution.
The scope of this analysis was focused on TN and TP; however, other pollutants such as pesticides, heavy metals, and emerging contaminants (e.g., pharmaceuticals) also contribute to the total dilution requirement and ecological risk. Recent studies have shown that micropollutants may dominate GWF under certain conditions, which represents an additional source of uncertainty [
46,
47]. This limitation may lead to an underestimation of the overall grey water footprint, particularly in systems where highly toxic substances occur at low concentrations but exert a disproportionate impact due to stringent environmental thresholds [
48].
The grey water footprint calculations are based on the Water Footprint Assessment Methodology, which assumes that pollutants act independently and that the total GWF at a given location is determined by the single most critical pollutant. This approach does not account for interactions between substances or combined effects of pollutant mixtures, which may lead to an incomplete representation of environmental pressure. This framework also does not explicitly incorporate in-stream self-purification processes, such as transformation, degradation, or retention of pollutants [
49]. As a result, monitoring-based GWF values reflect an integrated system response, where both upstream emissions and in-stream processes contribute to observed concentrations. This introduces uncertainty when attempting to attribute GWF values to specific sources [
50]. Exclusion of the self-purification processes from the sustainability assessment can significantly affect evaluation of results [
51].
4. Conclusions
This study applied the grey water footprint framework to evaluate nitrogen (TN) and phosphorus (TP) pollution in the Ankara River Sub-basin by integrating agricultural diffuse sources, wastewater treatment plant discharges, and in-stream monitoring data. The results identify phosphorus as the dominant limiting pollutant across both point and diffuse sources. The total GWF at the outlet was estimated at 8294 million m3 yr−1, exceeding the river’s average annual flow by a factor of 23. This indicates that the assimilative capacity of the Ankara River is significantly exceeded under current conditions.
Sectoral analysis suggests that wastewater treatment plants represent the largest identifiable pressure, followed by agricultural diffuse sources. However, these contributions should be interpreted as indicative due to methodological constraints and data limitations. A substantial portion of the GWF remains unexplained and is likely associated with industrial activities and livestock production.
The findings highlight that compliance with existing discharge standards does not necessarily ensure the protection of receiving water bodies. Incorporating assimilative capacity-based indicators, such as GWF, into water management frameworks can provide a more ecologically meaningful basis for decision-making. From a policy perspective, priority should be given to reducing nutrient loads at the source, particularly through stricter control of phosphorus inputs, improved fertilizer management practices, and enhanced manure management in livestock systems. In parallel, wastewater treatment processes should be upgraded to improve nutrient removal efficiency. The integrated approach presented here can be applied to other semi-arid and data-limited basins facing similar nutrient pressures, providing a practical basis for linking pollutant loads with hydrological constraints and supporting more effective basin-scale management. Overall, the study demonstrates that GWF is a valuable decision-support tool for identifying critical pollution pressures and guiding sustainable water management in semi-arid river basins.