Article

Evaluation of a Partially Hydrolyzed Poly(vinyl acetate) Copolymer for Surface Water Treatment: Application to Water from the Joumine Dam (Tunisia)

1
Laboratory of Resources Sylvo-Pastoral, Institute Sylvo-Pastoral of Tabarka (ISPT), University of Jendouba, Isp. Tabarka BP:345, Tabarka 8110, Tunisia
2
Institute of Biotechnology of Beja, University of Jandouba, Avenue Habib Bourguiba, BP:382, Beja 9000, Tunisia
3
Laboratory of Ecologies and Microbial Technology (LETMI), National Institute of Applied Science and Technology (INSAT), Universite of Carthage, 2 Boulevard de La Terre, BP:676, Tunis 1080, Tunisia
4
Department of Chemical Engineering, Faculty of Sciences, University of Granada, Campus Fuente Nueva s/n, 18071 Granada, Spain
5
Higher Institute of Environmental Science and Technology, Borj Cédria, University of Carthage, BP:1003, Hammam-Lif 2050, Tunisia
6
Smart Cities Research Center (Ci2), Polytechnic University of Tomar, Estrada da Serra, 2300-313 Tomar, Portugal
7
Centre for Technology, Restoration and Art Enhancement (Techn&Art), Polytechnic University of Tomar, Estrada da Serra, 2300-313 Tomar, Portugal
*
Author to whom correspondence should be addressed.
Water 2026, 18(17), 2103; https://doi.org/10.3390/w18172103
Submission received: 22 June 2026 / Revised: 14 August 2026 / Accepted: 21 August 2026 / Published: 26 August 2026
(This article belongs to the Section Water Quality and Contamination)

Abstract

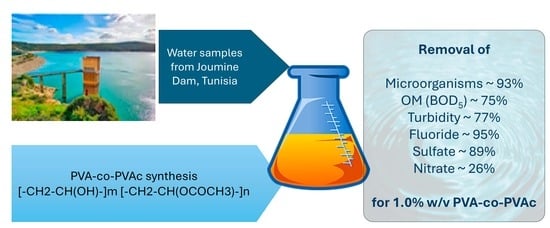
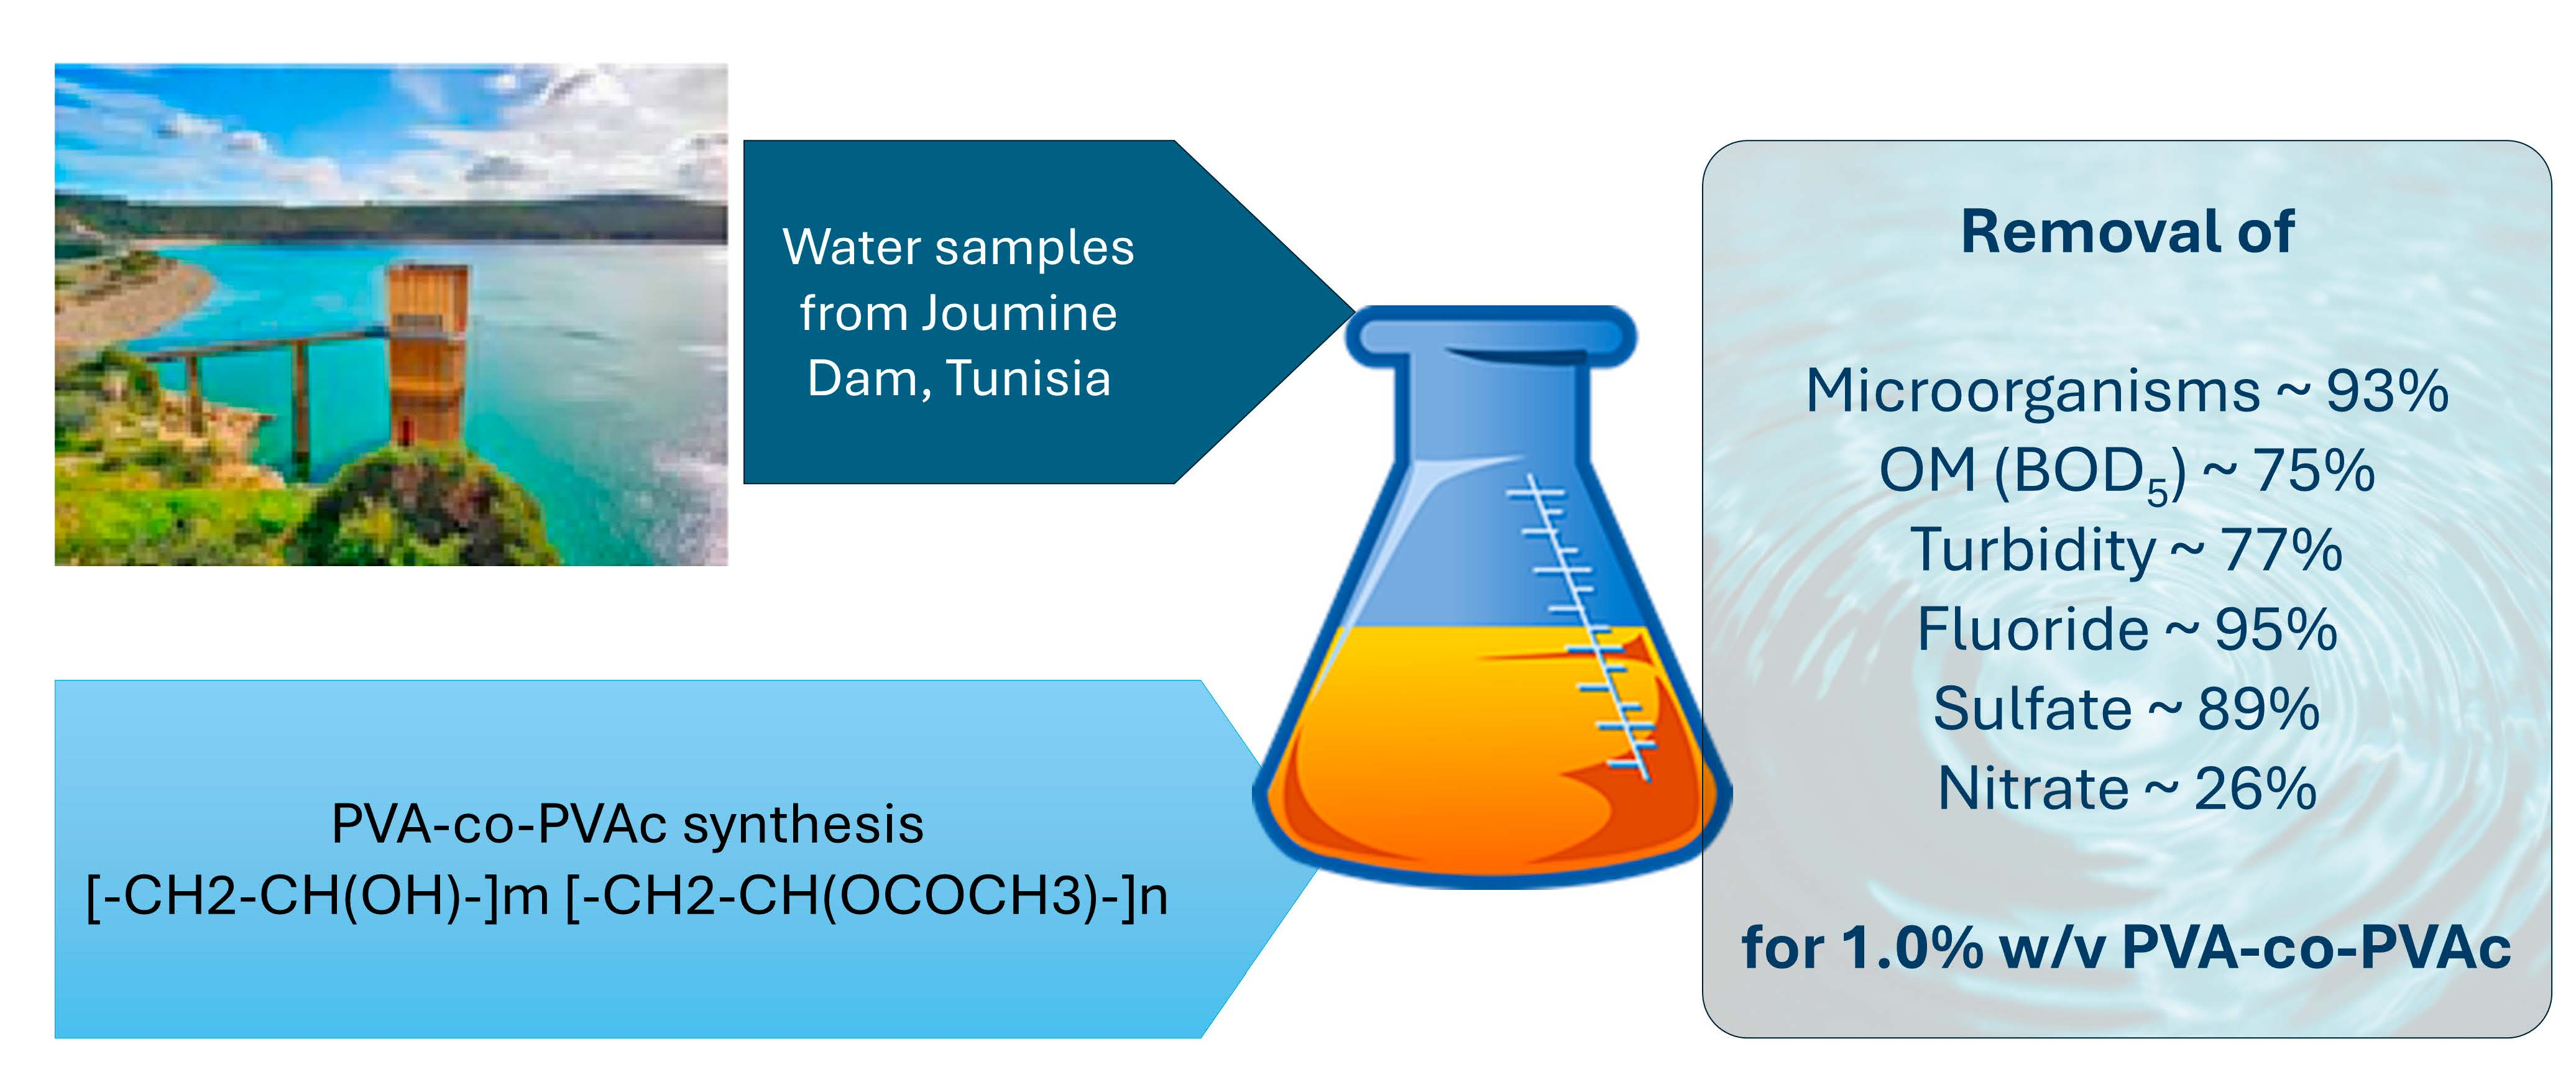
Aquatic ecosystems are increasingly affected by anthropogenic pollution, highlighting the need for efficient and advanced water treatment technologies. Poly(vinyl alcohol-co-vinyl acetate) copolymer (PVA-co-PVAc), a partially hydrolyzed copolymer derived from poly(vinyl acetate), has received limited attention for surface water remediation. To address this gap, PVA-co-PVAc was prepared and evaluated as an alternative material for surface water treatment. The polymer identity was inferred from the synthesis route and degree-of-hydrolysis measurements; comprehensive structural characterization was beyond the scope of the present application-focused study. Physico-chemical and microbiological characterization of water samples collected from six locations in Joumine Dam revealed the highest contamination levels at the dam inlet, indicating a substantial pollution load entering the reservoir. Consequently, water from this site was selected to evaluate the treatment performance of the copolymer. Among the tested copolymer concentrations (0.1%, 0.2%, 0.5%, and 1% w/v), the best performance was achieved at 1% (w/v), resulting in a 93% reduction in total cell density determined by direct microscopic counting, together with significant decreases in turbidity and organic matter and an apparent decrease in fluoride concentration, requiring independent analytical confirmation. These findings demonstrate the potential of PVA-co-PVAc to improve selected surface-water quality parameters under laboratory treatment conditions and support further investigation of this material using natural water matrices.

Graphical Abstract

1. Introduction

Access to clean and safe water is a fundamental requirement for human health, ecosystem stability, and socio-economic development. Despite its critical importance, water scarcity and water quality degradation have emerged as major global challenges. In 2022, approximately 2.2 billion people lacked access to safely managed drinking-water services, while 3.5 billion lacked safely managed sanitation, underscoring the severity of the global water crisis [1]. Anthropogenic activities, including rapid urbanization, population growth, industrialization, and environmental disasters, have significantly increased the discharge of pollutants into aquatic environments.
Aquatic systems are increasingly contaminated by a wide range of chemical and biological pollutants, including heavy metals and metalloids, synthetic dyes, volatile organic compounds (VOCs), pharmaceuticals, pesticides, radionuclides, petroleum-derived compounds, polycyclic aromatic hydrocarbons (PAHs), pathogenic microorganisms, and microplastics. These contaminants occur in diverse forms and concentrations, posing serious risks to water quality and ecosystem functioning [2,3]. Their presence can disrupt biogeochemical cycles and alter the natural dynamics of material transfer within aquatic ecosystems [4].
This situation is particularly critical in arid and semi-arid regions, where climate variability and prolonged drought periods intensify pressure on freshwater resources. Over the past three decades, Tunisia has experienced a marked decline in available water resources due to recurrent drought periods, resulting in increasing hydric stress and reduced per capita water availability. Projections indicate that annual per capita water availability will decrease from 357.9 m3 in 2020 to 286.3 m3 by 2050, placing Tunisia well below the water scarcity threshold [5]. In parallel, the proliferation of cyanobacteria and microalgae has become a growing concern in several Tunisian surface water bodies, negatively affecting water quality and limiting water usability for drinking and agricultural purposes [6].
Among the most affected regions in northern Tunisia, the Joumine Basin has been identified as particularly vulnerable to eutrophication and biological contamination [7]. The Oued Joumine watershed, located in northwestern Tunisia, covers an area of approximately 418 km2. The Joumine Dam, constructed in 1984, serves as a multipurpose reservoir with a storage capacity of about 76 million m3 as of 2021. It plays a strategic role in supplying drinking water and irrigation water to the Mateur plain and Greater Tunis, providing agricultural water to the Cap Bon region, and maintaining freshwater inputs to the Ichkeul ecosystem during periods of hydrological stress [8]. The degradation of water quality in this reservoir therefore represents a significant environmental and public health concern.
To address the growing demand for clean water, cost-effective and efficient treatment technologies are urgently required to convert degraded or unconventional water resources into safe and usable water. Conventional methods, including coagulation–flocculation, filtration, biological treatment, and adsorption, have been widely applied to mitigate water pollution [9]. However, treatment efficiency may vary considerably depending on water composition and contaminant type, and multiple treatment steps are often required to address complex mixtures of chemical and microbiological contaminants [10]. Furthermore, conventional methods may require high operational costs, large chemical inputs, or multiple treatment steps, limiting their feasibility for small- to medium-sized treatment facilities or for rapid deployment during environmental crises [10].
In recent years, poly(vinyl alcohol) (PVA)-based materials have attracted considerable attention for water purification applications owing to their non-toxicity, chemical stability, hydrophilicity, and excellent film-forming properties [11,12]. However, conventional fully hydrolyzed PVA and many PVA-based hydrogels often exhibit excessive swelling, limited long-term mechanical stability, and structural deterioration in aqueous environments [13,14]. Consequently, chemical cross-linking agents such as glutaraldehyde are frequently employed to improve water resistance and mechanical integrity [13,14]. Nevertheless, the use of such cross-linkers raises concerns regarding residual toxicity and environmental safety, motivating the development of alternative stabilization strategies. To overcome these limitations, the present study evaluates a partially hydrolyzed poly(vinyl alcohol-co-vinyl acetate) (PVA-co-PVAc) copolymer as a potential material for surface-water treatment. Partial hydrolysis enables the coexistence of vinyl alcohol and residual vinyl acetate groups within the polymer structure, which may contribute to improved stability in aqueous environments compared with fully hydrolyzed PVA. The resulting material was investigated for its ability to improve the quality of naturally contaminated surface water.
Furthermore, many previous studies have focused on the removal of individual pollutants under controlled laboratory conditions using synthetic water matrices, whereas the treatment of natural surface water containing complex mixtures of chemical and microbiological contaminants has received comparatively less attention. In contrast to the literature on fully hydrolyzed or chemically cross-linked PVA-based materials, the application of a partially hydrolyzed PVA-co-PVAc copolymer to the treatment of reservoir water has been investigated only to a limited extent. Therefore, the objective of this study was to evaluate the performance of this material using water collected from the Joumine Dam and to assess its ability to improve selected physicochemical and microbiological water-quality parameters under laboratory treatment conditions.

2. Materials and Methods

2.1. Study Area and Sampling

The Joumine Reservoir is located in northwestern Tunisia (36°59′49″ N, 9°36′49″ E), within a sub-humid to semi-arid climatic zone characterized by pronounced seasonal and interannual precipitation variability [8]. The Joumine Dam, constructed in 1983, was initially designed for irrigation and the supply of drinking water to the downstream Mateur Plain [15].
The reservoir has a total storage capacity of 118 mm3; however, according to data from the National Observatory of Agriculture (ONAGRI), Tunis, Tunisia [16], the current stored volume is approximately 26 mm3 [3,8]. Between 1988 and 2012, the average annual precipitation in the Joumine basin was about 700 mm year−1.
To assess the hydrobiological quality of the reservoir, water sampling was carried out during a single spring campaign under dry weather conditions and stable hydrological inflow, with no rainfall recorded during or immediately prior to sampling. Six representative sampling sites were selected: the dam inlet (Site 1); four locations within the central reservoir at depths of 0, 10, 20, and 30 m (Sites 2–5); and the reservoir shoreline (Site 6). Sampling in open water was conducted from a motorized boat using a 2 L Ruttner-type sampler. To ensure sample integrity, water was collected in pre-cleaned high-density polyethylene (HDPE) bottles for physicochemical analyses and sterile borosilicate glass containers for microbiological assays. Physicochemical and microbiological analyses were performed on samples from all six sites to evaluate the spatial distribution of water quality. Based on these results, the sample collected from the dam inlet (Site 1), which exhibited the highest overall contamination burden, was selected for the subsequent treatment experiments.
All samples were transported to the laboratory under refrigerated conditions (4 °C) and analyzed shortly after collection in collaboration with the National Water Distribution Utility (SONED) laboratory [8]. The selected sampling locations were intended to capture different environmental zones of the reservoir, including the principal inflow, the central water body at different depths, and the shoreline area, thereby providing a spatial overview of water-quality conditions during the sampling campaign. Sample-specific information, including sampling location, depth, and hydrological context, is summarized in Table 1.

2.2. Physicochemical Nutrient and Ionic Characterization of Dam Water

Water samples were transported to the laboratory under refrigerated conditions (4 °C) prior to analysis. Physicochemical parameters were determined following established protocols. Turbidity was measured using a HACH 2100 AN H turbidimeter (Hach Company, Loveland, CO, USA), pH was recorded with a Metrohm 827 pH meter (Metrohm AG, Herisau, Switzerland), and salinity was determined through electrical conductivity measurements (S m−1) [17]. Nutrient and organic-matter analyses were performed using standard titrimetric and colorimetric methods, including the determination of Biochemical Oxygen Demand (BOD5), ammonium (NH4+), and nitrate (NO3) concentrations [18].
The ionic composition of the water samples was determined according to standard protocols. Total alkalinity (TAC) was measured by acid–base titration, while calcium and total hardness were quantified using EDTA complexometric titration [19]. Magnesium content was calculated as the difference between total hardness and calcium hardness. Total dissolved solids (TDS) were measured gravimetrically by drying the residue. Sulphate (SO42−) and fluoride (F) concentrations were determined according to Tarki et al. [20], and chloride (Cl) was measured by the Mohr titration method [21].
Analytical measurements were performed by an accredited laboratory using standardized methods and established QA/QC procedures. Method-specific limits of detection (LODs) and limits of quantification (LOQs) were not independently determined within the scope of this study; therefore, laboratory-reported limits are provided for the analytical methods identified above. All measurements were performed in triplicate on the same sample, and results are presented as mean ± standard deviation. Consequently, these replicates reflect analytical repeatability and should not be interpreted as independent field-sampling replicates.

2.3. Isolation and Identification of Bacteria

To evaluate the microbiological quality of water from the Joumine Dam, bacteriological analyses were carried out at the National Water Distribution Utility (SONED) laboratory. The investigation focused on key microbial indicators commonly used to assess fecal and hygienic contamination, including total coliforms, fecal (thermotolerant) coliforms, Escherichia coli, fecal streptococci (enterococci), sulfite-reducing anaerobes (Clostridium spp.), and total aerobic mesophilic flora at 37 °C.
To preserve microbiological integrity, water samples were collected in sterile 250 mL glass containers with a 2.5 cm air gap and transported at approximately 4 °C. Escherichia coli and total coliforms were analyzed using the membrane filtration method according to ISO 9308-1:2014 [22]. A 100 mL sample was filtered through a 0.45 µm membrane, placed on a selective agar medium, and incubated at 44.5 °C for 24 h. Colonies were counted as colony-forming units (CFUs) per 100 mL, in accordance with ISO guidelines [22].
Presumptive colonies were confirmed using biochemical tests. At least ten morphologically typical colonies were transferred to non-selective agar and tryptophan broth. The oxidase test was performed after incubation on non-selective agar at 36 ± 2 °C for approximately 21 h; the appearance of a dark violet–blue color within 30 s indicated a positive result. Indole production was assessed in tryptophan broth incubated at 44 ± 0.5 °C for 21 h; the formation of a crimson ring following the addition of 0.2–0.3 mL Kovac’s reagent confirmed the presence of E. coli [22]. These procedures enabled differentiation of fecal coliforms, following accepted biochemical guidelines [22].
Sulfite-reducing anaerobes, primarily spore-forming Clostridium species, were identified according to the ISO 15213-1:2023 standard [23]. Samples (10 mL) were heat-treated at 80 °C for 10 min to inactivate vegetative cells while conserving spores, rapidly cooled (“thermal shock”), inoculated into meat–liver medium, and incubated anaerobically at 37 °C for 48 h. The appearance of a black precipitate indicated sulfite reduction and confirmed anaerobic spores typical of fecal contamination.
Traditional culture-based techniques have been complemented by enzymatic and molecular methods. Chromogenic and fluorogenic assays, such as Colilert®, enable the rapid detection of coliforms and E. coli within 24 h. Although membrane filtration remains a reliable and cost-effective method, enzymatic and molecular approaches generally offer greater sensitivity and specificity, albeit at a higher cost [24,25,26].
All microbiological analyses were performed according to the corresponding ISO standard methods under sterile laboratory conditions. Each water sample was analyzed in triplicate (technical replicates), and these measurements were used to evaluate analytical reproducibility.
Negative (sterility) controls consisting of sterile distilled water were included throughout sample processing to verify the absence of external contamination. The analytical performance of the microbiological methods was consistent with the specifications of the applicable ISO standard methods [24,27]. Quantitative microbiological analyses are reported as colony-forming units (CFUs), whereas qualitative analyses are reported as detected (D) or not detected (ND) according to the corresponding ISO standard methods.

2.4. Microscopic Observation and Cell Enumeration

Water samples were examined using an inverted microscope following the procedure outlined in the NF T90-351 standard [28]. To promote particle sedimentation, a known volume of each homogenized sample was transferred to a sedimentation chamber and allowed to settle under static conditions for at least one hour. This technique enables the direct observation of microalgae, protozoa, and other suspended particles without the need for staining or centrifugation [28,29].
Microscopic evaluation was performed both qualitatively and quantitatively after sedimentation. Cell counts were determined using a Malassez counting chamber, allowing the average number of cells observed across multiple grid sectors to be used for estimation of cell concentration per milliliter [28]. To prevent overestimation, only cells touching the upper and left counting-frame lines were excluded, in accordance with accepted counting practices. The average cell count within the designated grid regions was used to calculate the overall cell concentration, which was then extrapolated to the total sample volume. This direct microscopic counting method provides an estimate of the total concentration of observable cells, including phytoplankton and other microorganisms, and does not distinguish between viable and non-viable cells. Microscopic enumeration was used as an assessment complementary to the culture-based microbiological analyses.

2.5. Chemicals and Equipment for Polymer Synthesis

2.5.1. Reagent and Materials

Vinyl acetate monomer (purity ≥ 99%), absolute ethanol, methanol, sodium hydroxide (NaOH), benzoyl peroxide, and poly(vinyl alcohol) (PVA-4-88) were purchased from Sigma-Aldrich (Merck KGaA, Darmstadt, Germany) and used without further purification. Distilled water was used throughout all experiments.

2.5.2. Synthesis and Recovery of Poly(vinyl acetate)

Using benzoyl peroxide as the initiator under different reaction conditions, vinyl acetate was polymerized via free-radical polymerization to produce three batches of poly(vinyl acetate).
1.
Preparation of Poly(vinyl acetate)
In a 250 mL Erlenmeyer flask, 10 g of vinyl acetate monomer and 20 g of absolute ethanol were combined. The mixture was heated to 80 °C under continuous stirring. Upon the onset of reflux, 0.5 g of benzoyl peroxide was added as the initiator. The polymerization reaction was maintained at this temperature for 4 h. This procedure was based on the method reported by Raffin et al. [30], who described the polymerization of vinyl acetate using benzoyl peroxide under comparable conditions.
2.
Recovery of Synthesized Poly(vinyl acetate)
After cooling to room temperature, the reaction mixture was gradually poured into beakers containing distilled water under continuous stirring. Upon contact with water, a white precipitate formed, indicating polymer formation. The precipitate was recovered by decantation and allowed to dry under ambient conditions. This recovery method is commonly employed for vinyl-based polymers following synthesis or alcoholysis processes [30].

2.5.3. Preparation of PVA-Co-PVAc

The previously synthesized polymer was dried at 70 °C for 2 h and subsequently dissolved in ethanol. The resulting polymer solution was mixed with a saturated sodium hydroxide (NaOH) solution in ethanol and refluxed at approximately 70 °C for 2 h. During this process, the initially clear solution became turbid, leading to the formation of an off-white precipitate. Under these alkaline ethanol conditions, vinyl acetate units were partially converted into vinyl alcohol moieties through base-catalyzed transesterification (partial hydrolysis). This approach has been previously reported for the preparation of PVA-co-PVAc copolymer [30]. The resulting copolymer was recovered by filtration, thoroughly washed with distilled water to remove residual base and reaction by-products, then dried under ambient conditions. In accordance with recent protocols for structurally tailored PVA-based copolymers, the dried material was divided into two portions: one for solubility testing in pure water and the other for physicochemical characterization [30].
1.
Determination of the degree of hydrolysis in the copolymer
The degree of hydrolysis was determined by pH-metric back-titration using a method adapted from the work of Jiang et al. [31]. A precisely weighed amount of copolymer (~0.5 g) was dissolved in 50 mL of sodium hydroxide solution (0.1 mol L−1) and heated at 80 °C. After stirring for 1 h to ensure complete hydrolysis, the excess unreacted NaOH was back-titrated with a standardized hydrochloric acid solution (0.1 mol L−1). pH measurements were carried out using a calibrated pH meter (Metrohm, model 827; accuracy ±0.001 pH units). The same procedure was applied to a commercial poly(vinyl alcohol) standard (PVA-4-88) with a known degree of hydrolysis (88%) to validate the reliability of the method.
2.
Intrinsic viscosity measurement
Intrinsic viscosity ([η]) was determined using a LAUDA viscometer (PVS1/2) equipped with two measurement stations and a VRM cleaning module. Measurements were performed at 25 °C according to standard procedures for dilute polymer solutions [31]. The obtained intrinsic-viscosity values were used exclusively for comparative evaluation of the hydrodynamic behavior of the synthesized PVA-co-PVAc and the commercial PVA reference material (PVA-4-88).

2.5.4. Preparation of PVA-Co-PVAc Solutions for Water Treatment Experiments

The polymer dosage range was evaluated by testing different concentrations of the PVA-co-PVAc matrix across a predefined experimental range to identify suitable working conditions for water treatment applications. Determination of the dry extract (DE) was performed to quantify the actual dry polymer content and account for the water fraction before preparing polymer solutions, ensuring accurate dosage preparation [30]. The DE was determined gravimetrically using the following formula:
D E % = m 3 m 1 m 2 m 1 × 100
where m1 is the mass of the empty crucible (g), m2 is the mass of the crucible containing wet polymer (g), and m3 is the mass of the crucible after 2 h of drying at 120 °C (g).
Based on this, four aqueous PVA-co-PVAc solutions were prepared at concentrations of 0.1%, 0.2%, 0.5%, and 1.0% (w/v), corresponding to dry polymer masses of 1 g, 2 g, 5 g, and 10 g per liter of water, respectively. This concentration range was selected based on previously reported applications of PVA-based coagulants and adsorbents and was used as an exploratory range to evaluate polymer performance [32]. Preliminary laboratory observations suggested that concentrations below 0.1% (w/v) produced limited visible flocculation, whereas concentrations above 1.0% (w/v) did not result in readily observable improvements under the tested conditions. However, future work may be considered to confirm this preliminary finding.
Mixing conditions were strictly controlled using a standardized jar-test apparatus, involving a rapid mixing phase at 200 rpm for 2 min to ensure homogeneous polymer dispersion, followed by a slow flocculation period at 40 rpm for 20 min. The selected mixing conditions were maintained consistently throughout all experiments to ensure reproducible contact between the copolymer and the treated water. All formulations were homogenized under controlled conditions to maintain the reproducibility of the active polymer content, as recommended in advanced water treatment protocols [33]. Following the agitation phase, a settling time of 30 min was maintained to allow the fully formed flocs to sediment completely under gravity, and supernatant samples were collected at a fixed depth of 2 cm below the water surface prior to multi-parameter analysis. All coagulation–flocculation treatment trials were performed in three independent experimental batch runs.

2.5.5. Statistical Analysis

Statistical analysis, including the calculation of standard deviations, one-way ANOVA, and Tukey’s post hoc comparison test, were performed using IBM SPSS Statistics version 30, with a confidence level of 95% (α = 0.05).
For raw-water characterization data, the reported replicates correspond to analytical replicates obtained from samples collected during a single sampling campaign and therefore should not be interpreted as independent temporal or spatial field replicates.

3. Results and Discussion

3.1. Physico-Chemical Characterization of Raw Water

The physico-chemical characterization of water samples collected from the Joumine Dam is presented in Table 2, where the measured parameters are compared with the regulatory limits established by Tunisian standard NT 09.14 [34]. This standard defines quality criteria for raw surface water intended for abstraction and treatment for potable water production rather than for treated drinking water at the point of consumption. However, certain parameters, including organic matter as assessed by biochemical oxygen demand over five days and total alkalinity, are not explicitly regulated under NT 09.14. For these parameters, reference values recommended by international guidelines for source waters used for drinking water supply, such as those of the World Health Organization [35], were adopted.
The mineral composition of natural waters is strongly influenced by the geological formations through which they circulate, as well as by the physico-chemical and biological characteristics of infiltrating waters [35,36]. Assessing the concentrations of dissolved elements is therefore essential for identifying constituents that may compromise water suitability for human consumption or pose potential health risks.
According to the Tunisian standard [34], the acceptable pH range is 6.5–8.5. In this study, the measured pH values ranged from 7.75 to 8.09, falling well within these limits. As an indicator of the water’s acid–base balance and buffering capacity, pH is a key parameter in water-quality assessment. Its values are influenced by several factors, including the nature of geological substrates, biological activity, and the presence of dissolved gases [37,38].
The results indicated that samples collected at Site 1 exhibited significantly higher turbidity than samples from all other sites. The measured value of 11.50 NTU is almost three times the permitted limit and approximately three times higher than that recorded at Site 5, which showed the second-highest turbidity value among the sampled locations. This elevated turbidity is likely attributable to the presence of suspended particulate matter, such as clay and fine sand, which may originate from sediment resuspension and surface runoff. In contrast, samples of Sites 2 to 6 showed lower and more homogeneous turbidity values, ranging from 3.76 to 4.27 NTU. The distinct behavior observed at Site 1 can be explained by its location at the main inflow of the Joumine Reservoir, where runoff and suspended materials transported from the upstream watershed enter the reservoir. This area is therefore expected to receive larger inputs of sediments, organic matter, and other catchment-derived materials transported from the watershed. Furthermore, as the Joumine watershed is predominantly agricultural, diffuse pollution associated with agricultural activities, including the transport of eroded soil particles and, potentially, fertilizers and pesticides, may also contribute to the elevated contamination observed at this site. This interpretation is consistent with previous studies conducted in the Joumine watershed, which identified agricultural runoff and other non-point source inputs as important factors influencing water quality, as well as investigations reporting that reservoir inflow zones generally exhibit higher pollutant loads than central reservoir areas due to the continuous transport of watershed-derived materials [39].
The observed elevated turbidity, particularly at Site 1, may be explained by increased sediment input near the inflow or by higher concentrations of suspended solids in shallow zones compared with deeper areas. Although samples collected at Sites 2 to 6 exhibited lower turbidity values, all readings still exceeded the maximum level of 3 NTU recommended by the Tunisian drinking water standard. Turbidity is a key esthetic and operational parameter because it can reduce disinfection efficiency and may indicate the presence of pathogenic microorganisms [39,40]. Furthermore, turbidity reflects the visual quality of water and the presence of colloidal or finely suspended materials.
In this study, salinity levels were relatively uniform across all samples, averaging approximately 400 mg/L. This stability may be related to a recent period of reduced evaporation, which can influence salt concentrations through changes in water volume [41]. Overall, these values indicate the absence of significant salinization or anthropogenic salt inputs and remain well within the permissible limits for freshwater sources [42].
Although the Tunisian drinking water standards do not specify limits for alkalinity, this parameter is important because it reflects the water’s buffering capacity and the concentration of free alkali, mainly carbonate (CO32−) and bicarbonate (HCO3) ions [40]. The observed range indicates a moderate buffering capacity, which can influence biological activity, metal solubility, and pH stability in natural waters [39,43]. Due to its role in maintaining water quality, TAC should be routinely monitored, particularly in areas where geological or anthropogenic factors may cause variability.
According to the Tunisian drinking water standards, the maximum allowable calcium hardness is 200 mg/L. In the present study, measured values ranged from 77.35 to 84.56 mg/L—well within the national limits and indicative of satisfactory water quality for domestic use.
The examined water samples contained magnesium at concentrations ranging from 14.33 to 20.41 mg/L—well below the national standard limit of 100 mg/L. These values indicate that magnesium levels are adequate and do not affect the water’s potability or suitability for domestic use [44]. Variations in magnesium content are often influenced by geological factors, particularly the mineral composition of aquifer substrates [37]. Together with calcium, magnesium defines the overall water hardness, providing insight into the chemical characteristics and usability of the water.
The total hardness of water from the Joumine Dam ranged from 25.4 to 32.6 °F—well below the national maximum limit of 100 °F. Based on national criteria, the measured values indicate that the water of Joumine Dam falls within the permitted range for potable use and can be classified as moderately hard.
The chloride concentration in the analyzed water samples ranged from 33.93 to 36.56 mg/L—well below the Tunisian regulatory limit of 300 mg/L and compliant with the WHO guideline of 250 mg/L for acceptable taste in drinking water [35]. In natural waters, chloride levels vary considerably depending on the mineral composition of the geological formations encountered along the water’s flow path and other hydrogeological factors [45].
Nitrites are known indicators of recent pollution, formed either by the incomplete oxidation of ammonium or by the reduction of nitrates under anaerobic conditions [46]. The maximum permissible nitrite level in drinking water, according to Tunisian standards and WHO guidelines, is 3 mg/L. In our analysis, nitrite concentrations ranged from 0.007 to 0.185 mg/L—well below these limits, indicating the absence of recent contamination in the water.
Alongside nitrites, nitrates are another critical nitrogen species in water, representing the most oxidized and highly soluble form of nitrogen. They are often associated with agricultural runoff, particularly from the intensive use of nitrogen-based fertilizers [46,47]. Elevated nitrate levels in drinking water can pose serious health risks, including methemoglobinemia in infants. In the studied water samples, nitrate concentrations ranged from 10.587 to 13.037 mg/L—well below the 50 mg/L limit established by the WHO and Tunisian standards, indicating compliance with drinking water requirements.
In addition to nitrogen species, fluoride is another critical parameter in drinking water due to its dual impact on human health. According to Tunisian standards, the maximum permissible concentration is 1.5 mg/L, consistent with WHO guidelines. In the present study, Sites 2–6 exhibited low fluoride concentrations, ranging from 0.58 to 0.64 mg/L, which are values within acceptable limits and beneficial for the formation of dental enamel, providing protection against dental caries [35,48]. However, sample 1, collected at the inflow of the Joumine Dam (Site 1), had a fluoride concentration of 2.03 mg/L, exceeding national and WHO standards. Prolonged exposure to this elevated level may increase the risk of dental or skeletal fluorosis, especially in vulnerable populations [35,41]. Therefore, this site may require closer monitoring or appropriate treatment before human consumption.
Other anions, such as sulfates, are commonly present in natural waters. At elevated concentrations, sulfates may impart a bitter or medicinal taste to drinking water [49,50]. According to Tunisian standards, the maximum acceptable sulfate concentration is 600 mg/L, consistent with WHO guidelines, which suggest a taste threshold of 250–500 mg/L. In the water samples collected from the Joumine Dam, sulfate levels ranged from 116.89 to 189.13 mg/L, well below the regulatory limit, indicating a low risk of taste alteration and raising no concerns regarding water quality or consumer acceptability.
Beyond individual ions and hardness, total dissolved solids provide an overall measure of the mineral content in water. TDS represents the concentration of non-volatile substances dissolved in water, primarily inorganic salts with small amounts of organic matter. According to Quevauviller [51], TDS measurements provide valuable information about the overall mineral composition of water. In the present study, TDS ranged from 404 mg/L at Site 3 to 642 mg/L at Site 1, with other samples (from Sites 2, 4, and 6) showing similarly low values. All measured concentrations are well below the Tunisian maximum permissible limit of 2500 mg/L. These results indicate moderate mineral content, making the water suitable for human consumption. According to the WHO [35] and the U.S. EPA [42], TDS levels below 1000 mg/L are generally considered acceptable for drinking water and are not associated with adverse health effects, although esthetic characteristics such as taste may begin to change above 500 mg/L.
BOD5 levels in Joumine Dam water were relatively high, ranging from 6.43 mg O2/L at Site 6 to 12.288 mg O2/L at Site 1, indicating a significant presence of decomposable organic material derived from plant or animal residues, often through microbial activity [52]. According to Tunisian standards, the maximum allowable concentration of organic matter in drinking water is 5 mg O2/L; thus, all measured values exceed this threshold, signaling organic pollution that may compromise water quality. Elevated organic matter can serve as a nutrient source for bacterial growth and react with disinfectants such as chlorine, forming disinfection by-products (DBPs) and affecting water taste and odor [35,51]. High organic content may also reduce treatment efficiency and pose microbiological risks if not properly managed.
Based on physico-chemical analyses of the Joumine Dam water samples, certain parameters, particularly organic matter, turbidity, and fluoride, exceeded the limits set by Tunisian drinking water standards. Overall, these deviations indicate potential risks to water quality and public health, highlighting the need for appropriate treatment strategies to ensure compliance with regulatory standards and safe water use. Among the sampling locations, Site 1, corresponding to the dam inlet, presented the highest values for the three parameters that exceeded the allowable limits, with statistically significant differences relative to all other sites. Therefore, this site was selected for treatment experiments with the PVA-co-PVAc copolymer, as it represents the most critical water-quality condition observed in the study.

3.2. Microbiological Assessment of Raw Water Quality

The microbiological quality of Joumine Dam water was evaluated using standard bacterial indicators, including total coliforms, Escherichia coli, fecal enterococci, sulfite-reducing anaerobes (Clostridium spp.), and total aerobic mesophilic flora. These indicators are widely recognized for assessing fecal contamination and the sanitary quality of surface waters [35,53]. According to the Tunisian drinking water standard [34], E. coli, fecal coliforms, enterococci, and sulfite-reducing anaerobes must be absent from 100 mL of water intended for human consumption. Although no regulatory threshold has been established for total aerobic mesophilic flora, elevated counts generally indicate increased microbial activity and deterioration of water quality. The microbiological results obtained for each sampling site are summarized in Table 3.
Fecal coliforms were detected at all sampling sites, indicating widespread fecal contamination throughout the reservoir. Their distribution suggests that microbial pollution is primarily associated with surface runoff and inflows from the Joumine wadi, which transport fecal material originating from agricultural activities, livestock, and wildlife within the watershed. The presence of fecal coliforms therefore reflects poor microbiological water quality and indicates a potential health risk [54].
Escherichia coli was detected at Sites 1, 4, and 5 but was absent from Sites 2, 3, and 6, revealing spatial variability in fecal contamination within the reservoir. Since E. coli is considered a reliable indicator of recent fecal pollution, these results suggest localized contamination sources affecting specific areas of the dam. The detection of E. coli confirms that these sampling sites do not comply with the Tunisian drinking water standard requiring its complete absence [34].
Total aerobic mesophilic flora reached up to 180 CFU/100 mL, indicating an elevated microbial load despite the absence of a specific regulatory limit in the Tunisian standard. Such values generally reflect increased biological activity associated with organic-matter inputs and microbial proliferation, suggesting that the reservoir provides favorable conditions for bacterial growth [35].
Fecal enterococci were detected at concentrations ranging from 2 to 20 CFU/100 mL at all sampling sites. Their occurrence, together with fecal coliforms and E. coli, further confirms the presence of fecal contamination within the reservoir. Because enterococci are relatively persistent in aquatic environments, they provide additional evidence of microbiological deterioration and reinforce the need for appropriate treatment before the water can be considered suitable for potable use [35,55].
Sulfite-reducing anaerobes were also detected in all water samples, indicating persistent or historical fecal contamination. The resistance of these spore-forming bacteria to adverse environmental conditions suggests that contamination has occurred over an extended period rather than resulting solely from recent pollution events [35].
Overall, the simultaneous detection of fecal coliforms, E. coli, fecal enterococci, sulfite-reducing anaerobes, and elevated aerobic mesophilic bacteria demonstrates that Joumine Dam water is affected by significant microbiological contamination, most likely resulting from agricultural runoff, watershed activities, and other anthropogenic inputs. Similar patterns of microbial pressure have been reported in other North African aquatic systems. In Algerian water resources, including Sidi Yaakoub Spring, bacteriological quality assessments have highlighted the influence of local environmental conditions and potential contamination sources on microbial water quality [48]. Likewise, in the Sidi Salem Reservoir (Tunisia), Romdhane et al. [49] reported high microbial abundance, with heterotrophic bacterial concentrations reaching up to 3.84 × 10⁷ cells/mL, together with seasonal variations in microbial communities associated with nutrient availability and eutrophic conditions. Although different analytical approaches were applied, these studies emphasize the influence of anthropogenic pressures and nutrient enrichment on microbial dynamics in aquatic systems. These findings highlight the importance of continuous microbiological monitoring and effective water treatment to ensure the safe use of this water resource.

3.3. Microscopic Analysis and Cell Counting Prior to Treatment

3.3.1. Total Cell Enumeration Using a Malassez Counting Chamber

The microbial cell density was estimated by direct microscopic counting using a Malassez counting chamber. This technique allows for rapid and quantitative assessment of total cell numbers in the water samples. The results are summarized in Table 4. Microscopic cell enumeration revealed significant variation in microbial abundance across the six sampling points. The highest concentration was recorded at Site 1, located at the inflow of the Joumine Dam, with 39 cells/µL, while the lowest was observed at Site 5 (30 m depth), with only 3 cells/µL. This distribution suggests a gradual decrease in microbial load with depth and distance from the inflow, likely influenced by sedimentation, sunlight penetration, and oxygen availability. Although no international guideline establishes a maximum threshold for total cell counts in raw water, several studies report that microbial concentrations in surface waters typically range from 103 to 106 cells/mL, depending on nutrient availability and anthropogenic impact [55,56]. The observed value at Site 1, corresponding to 3.9 × 10⁴ cells/mL, is considered moderate and may reflect organic-matter inputs or upstream contamination. These results emphasize the need for ongoing microbial biomass monitoring as a complementary water-quality indicator, particularly when combined with traditional culture-based techniques, which often underestimate the overall microbial load [57]. Overall, the findings underscore the importance of water-treatment processes capable of reducing suspended microbial biomass and improving microbiological water quality before any intended use requiring higher quality standards.

3.3.2. Microscopic Examination

Microscopic examinations performed at various sampling locations using an inverted microscope with ×400 magnification revealed the presence of various aquatic microorganisms.
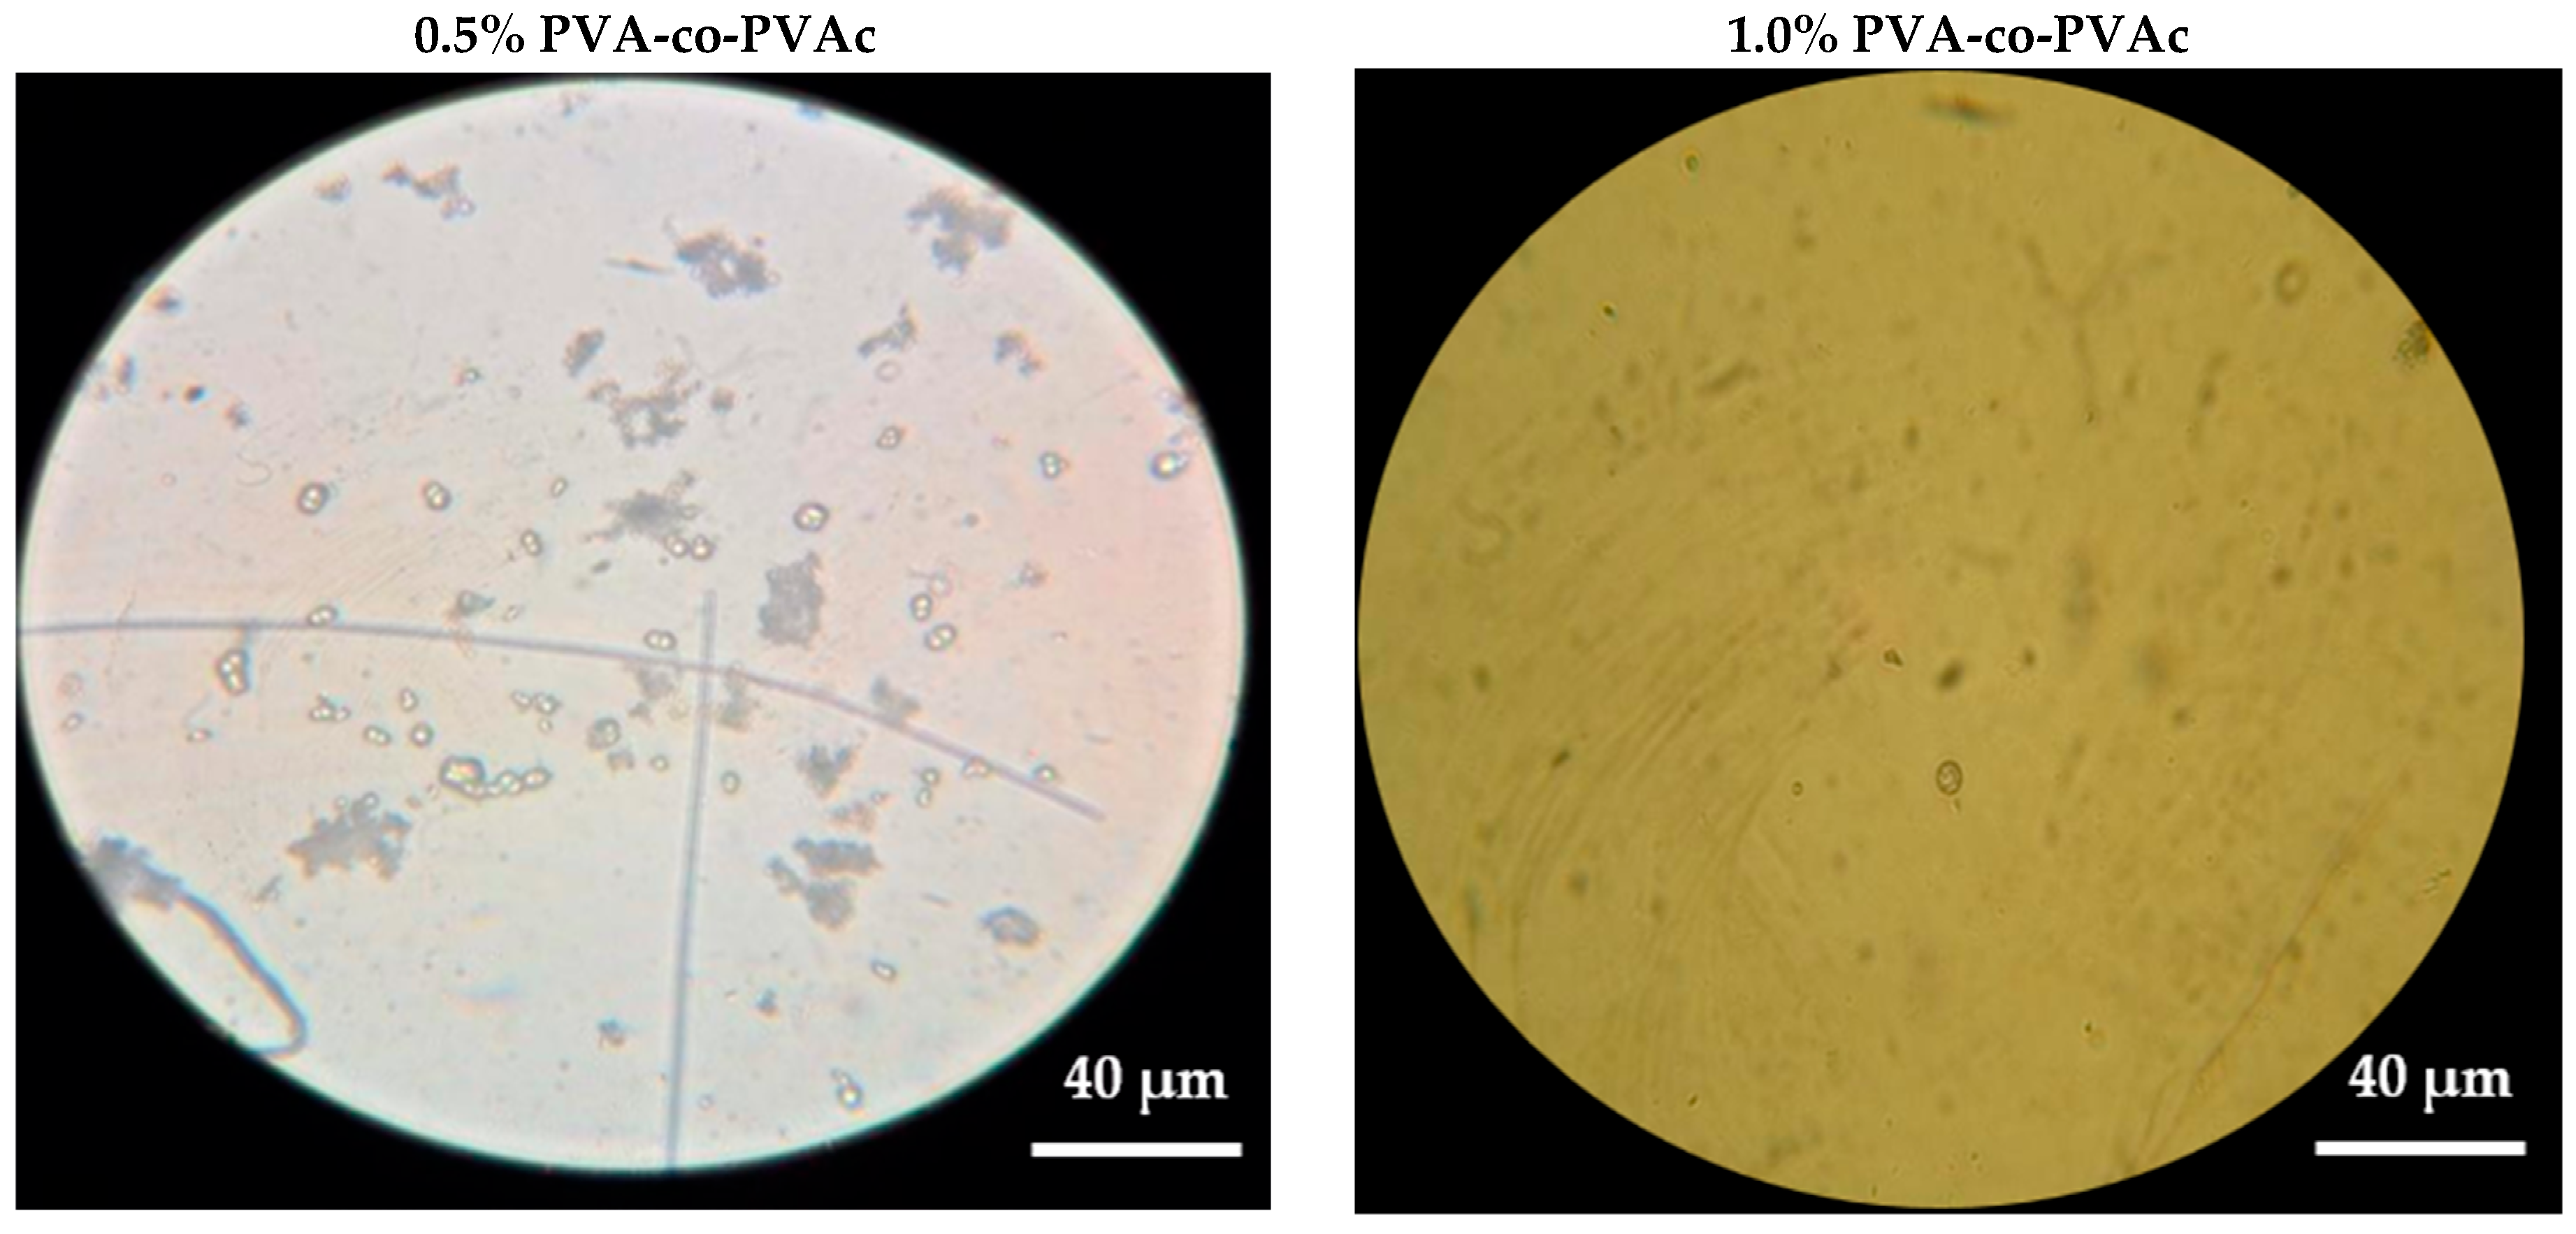
Microscopic observations suggested the formation of visible aggregates following polymer addition, consistent with coagulation–flocculation phenomena. However, the microstructural characteristics of these aggregates were not directly investigated. Therefore, any discussion regarding floc architecture, pore structure, or polymer-network organization should be considered preliminary and requires confirmation through dedicated characterization techniques such as SEM, particle-size analysis, and surface-charge measurements.
1.
Sampling Site 1
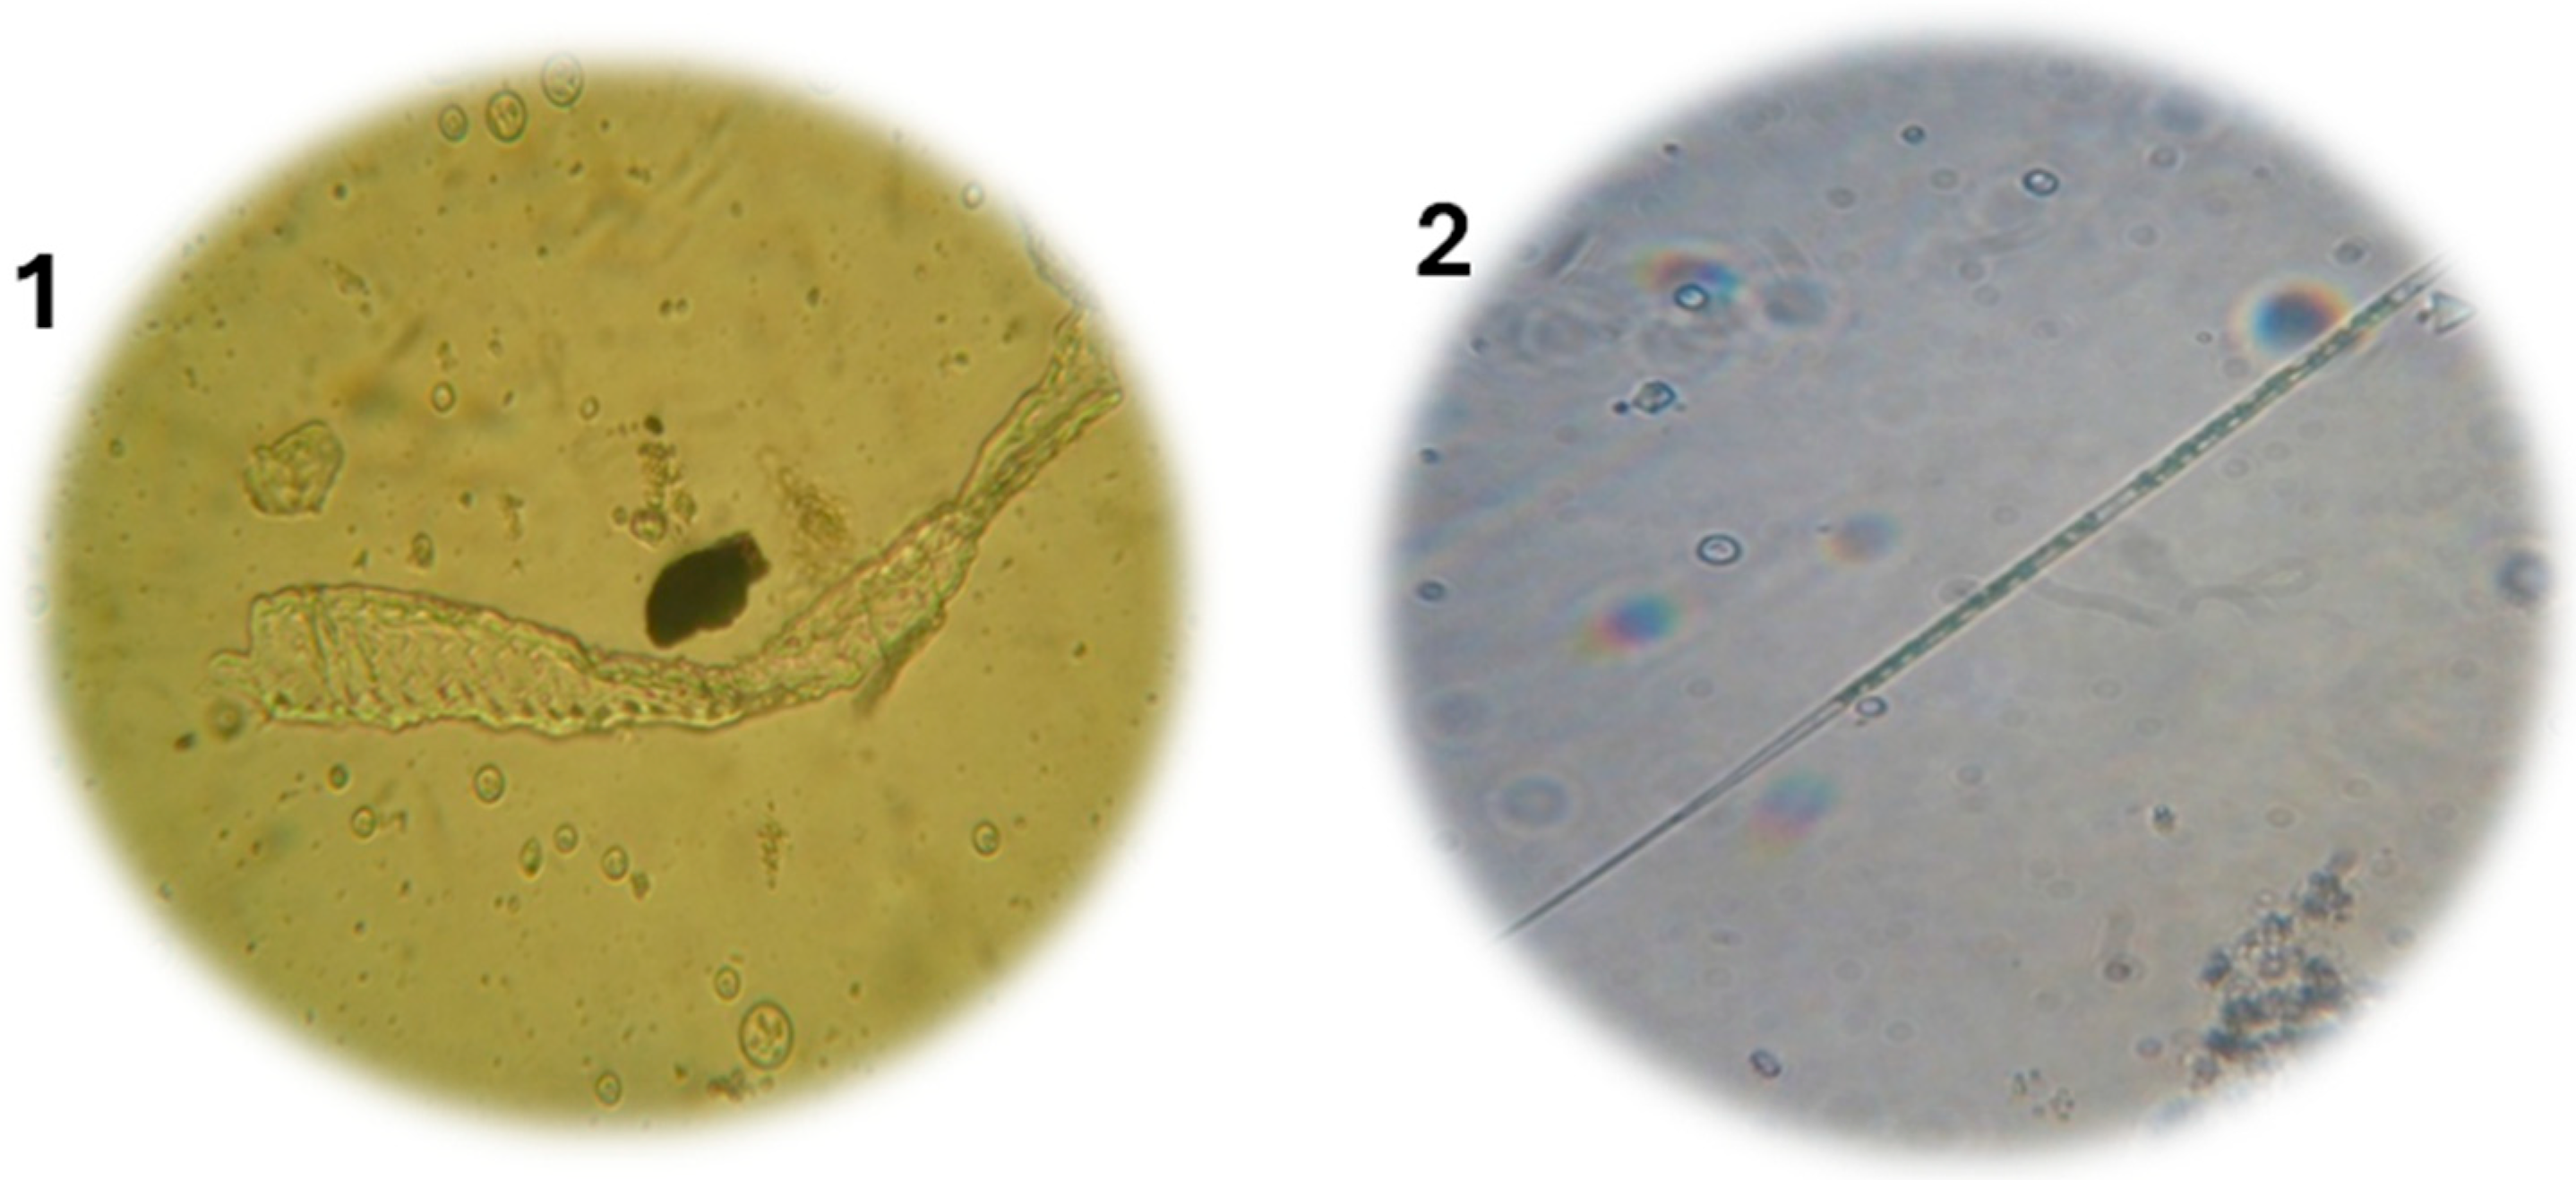
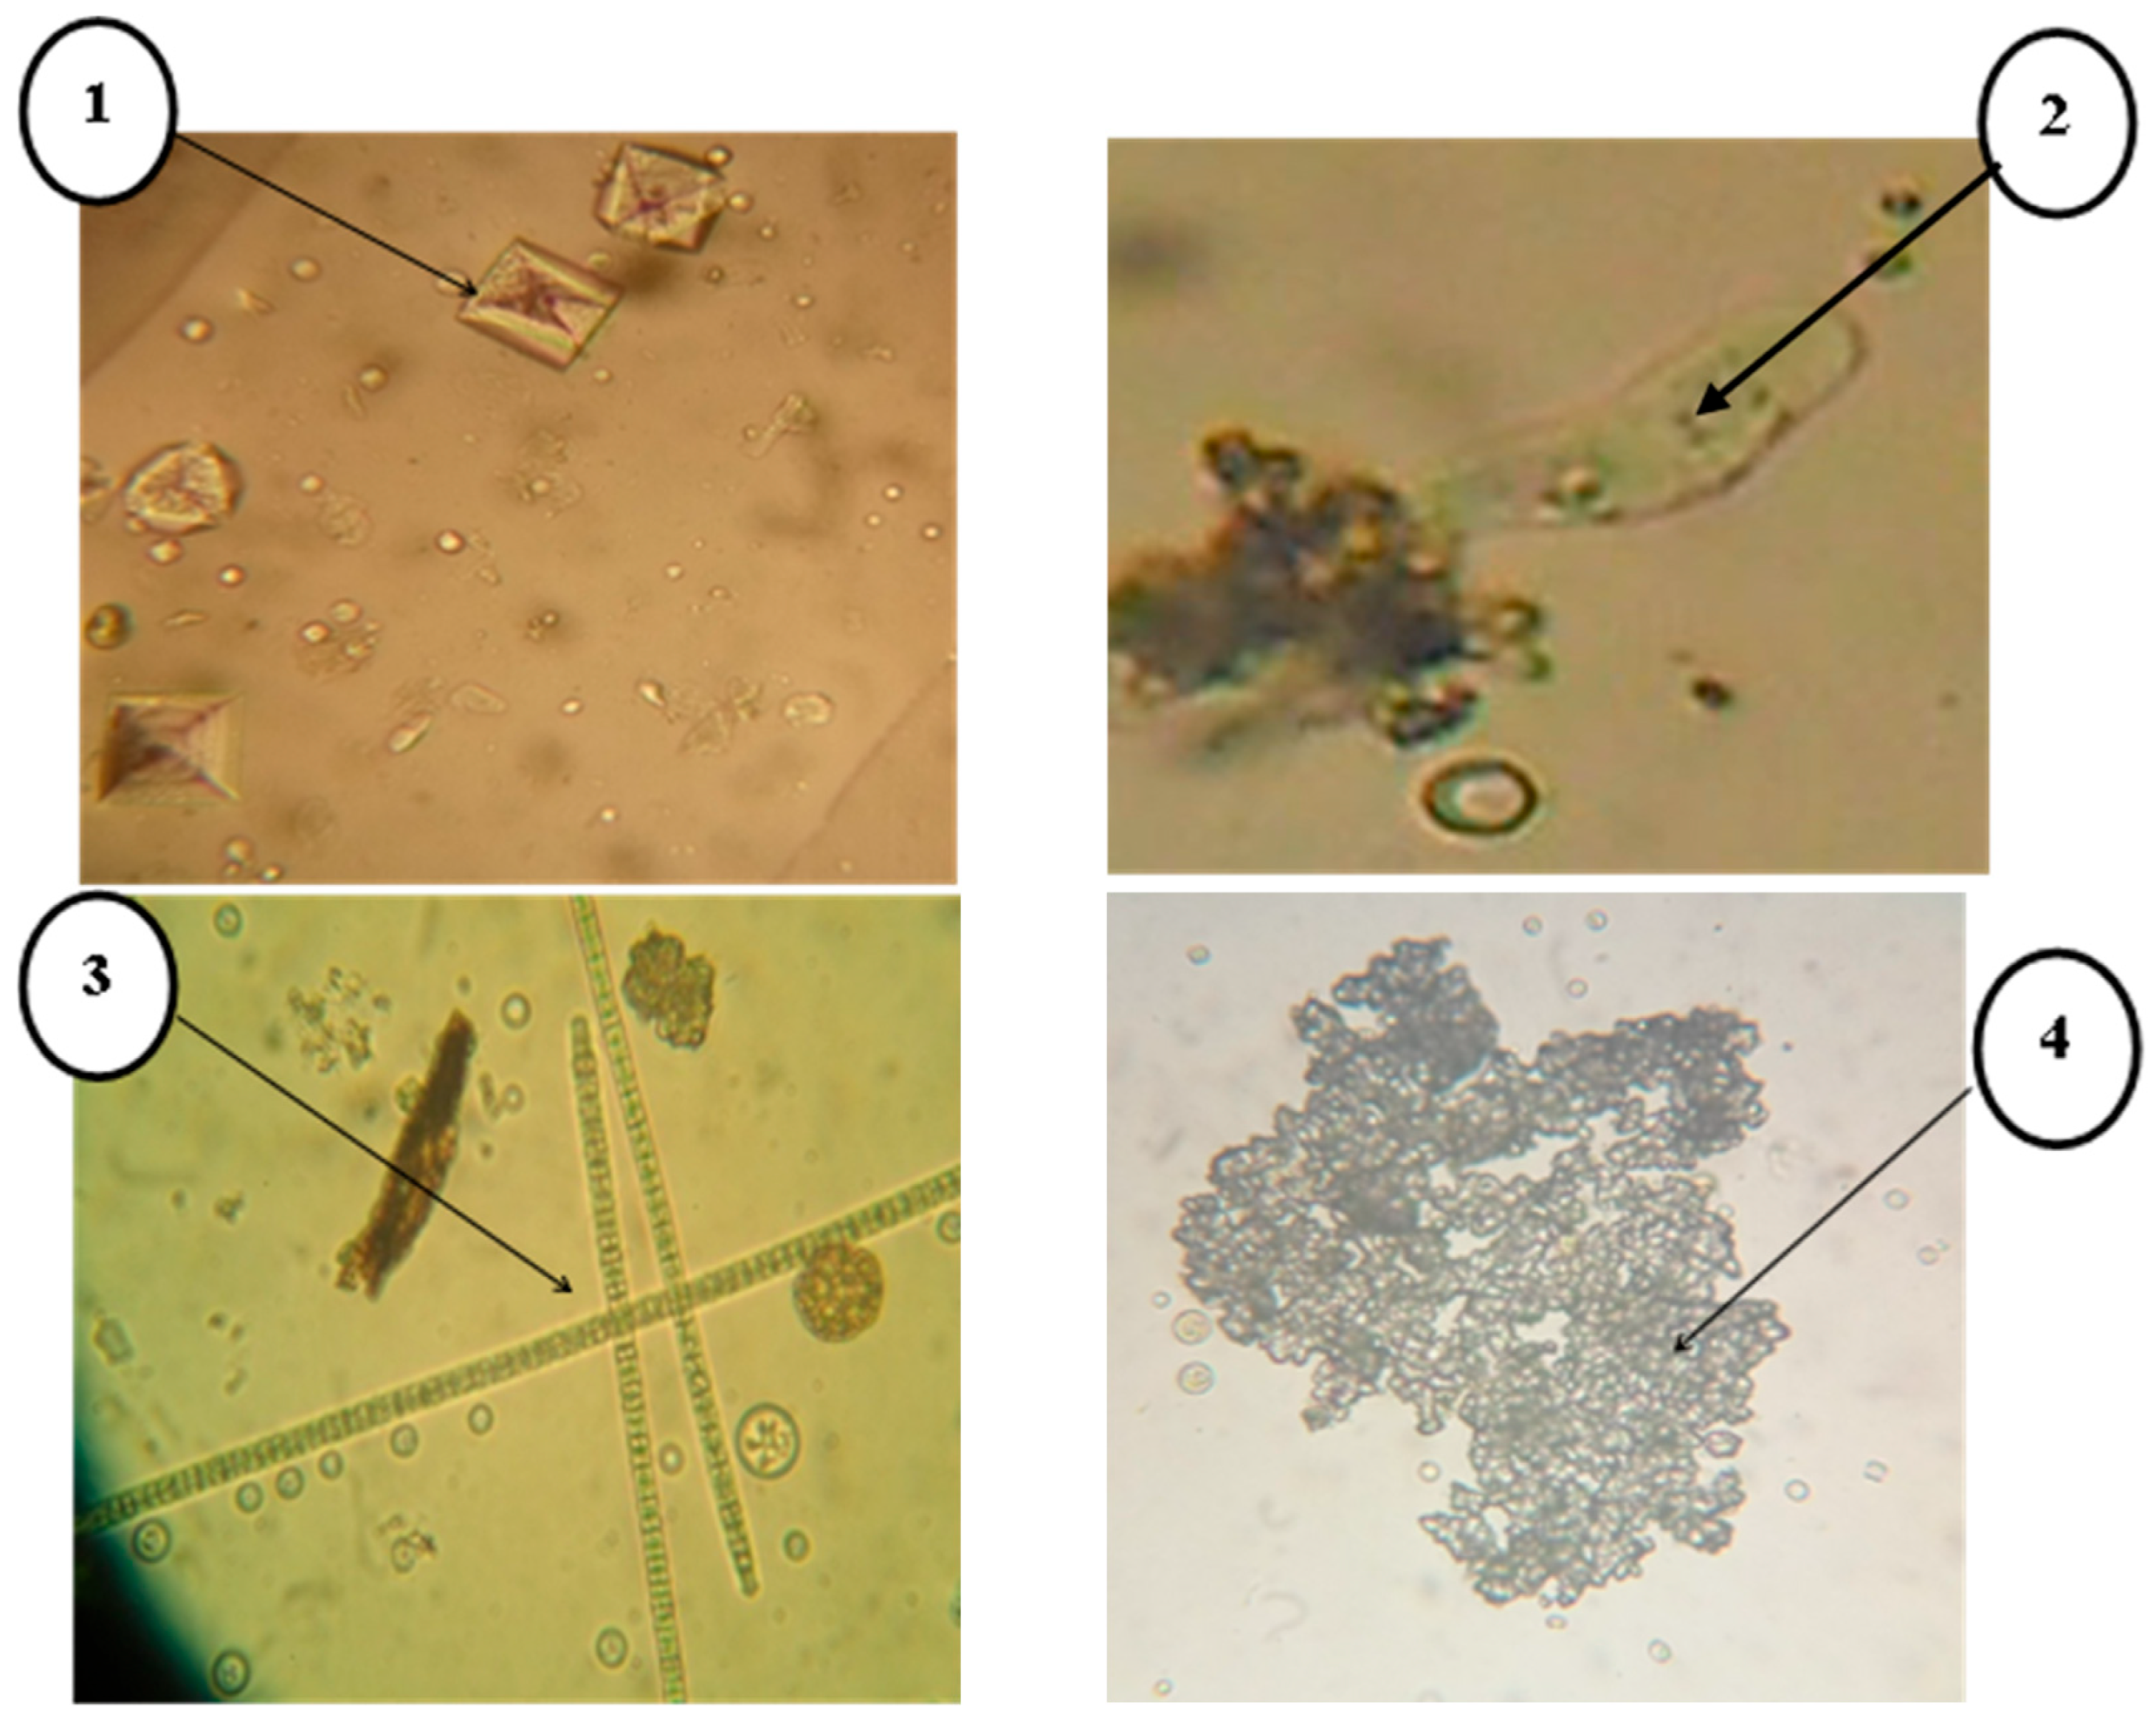
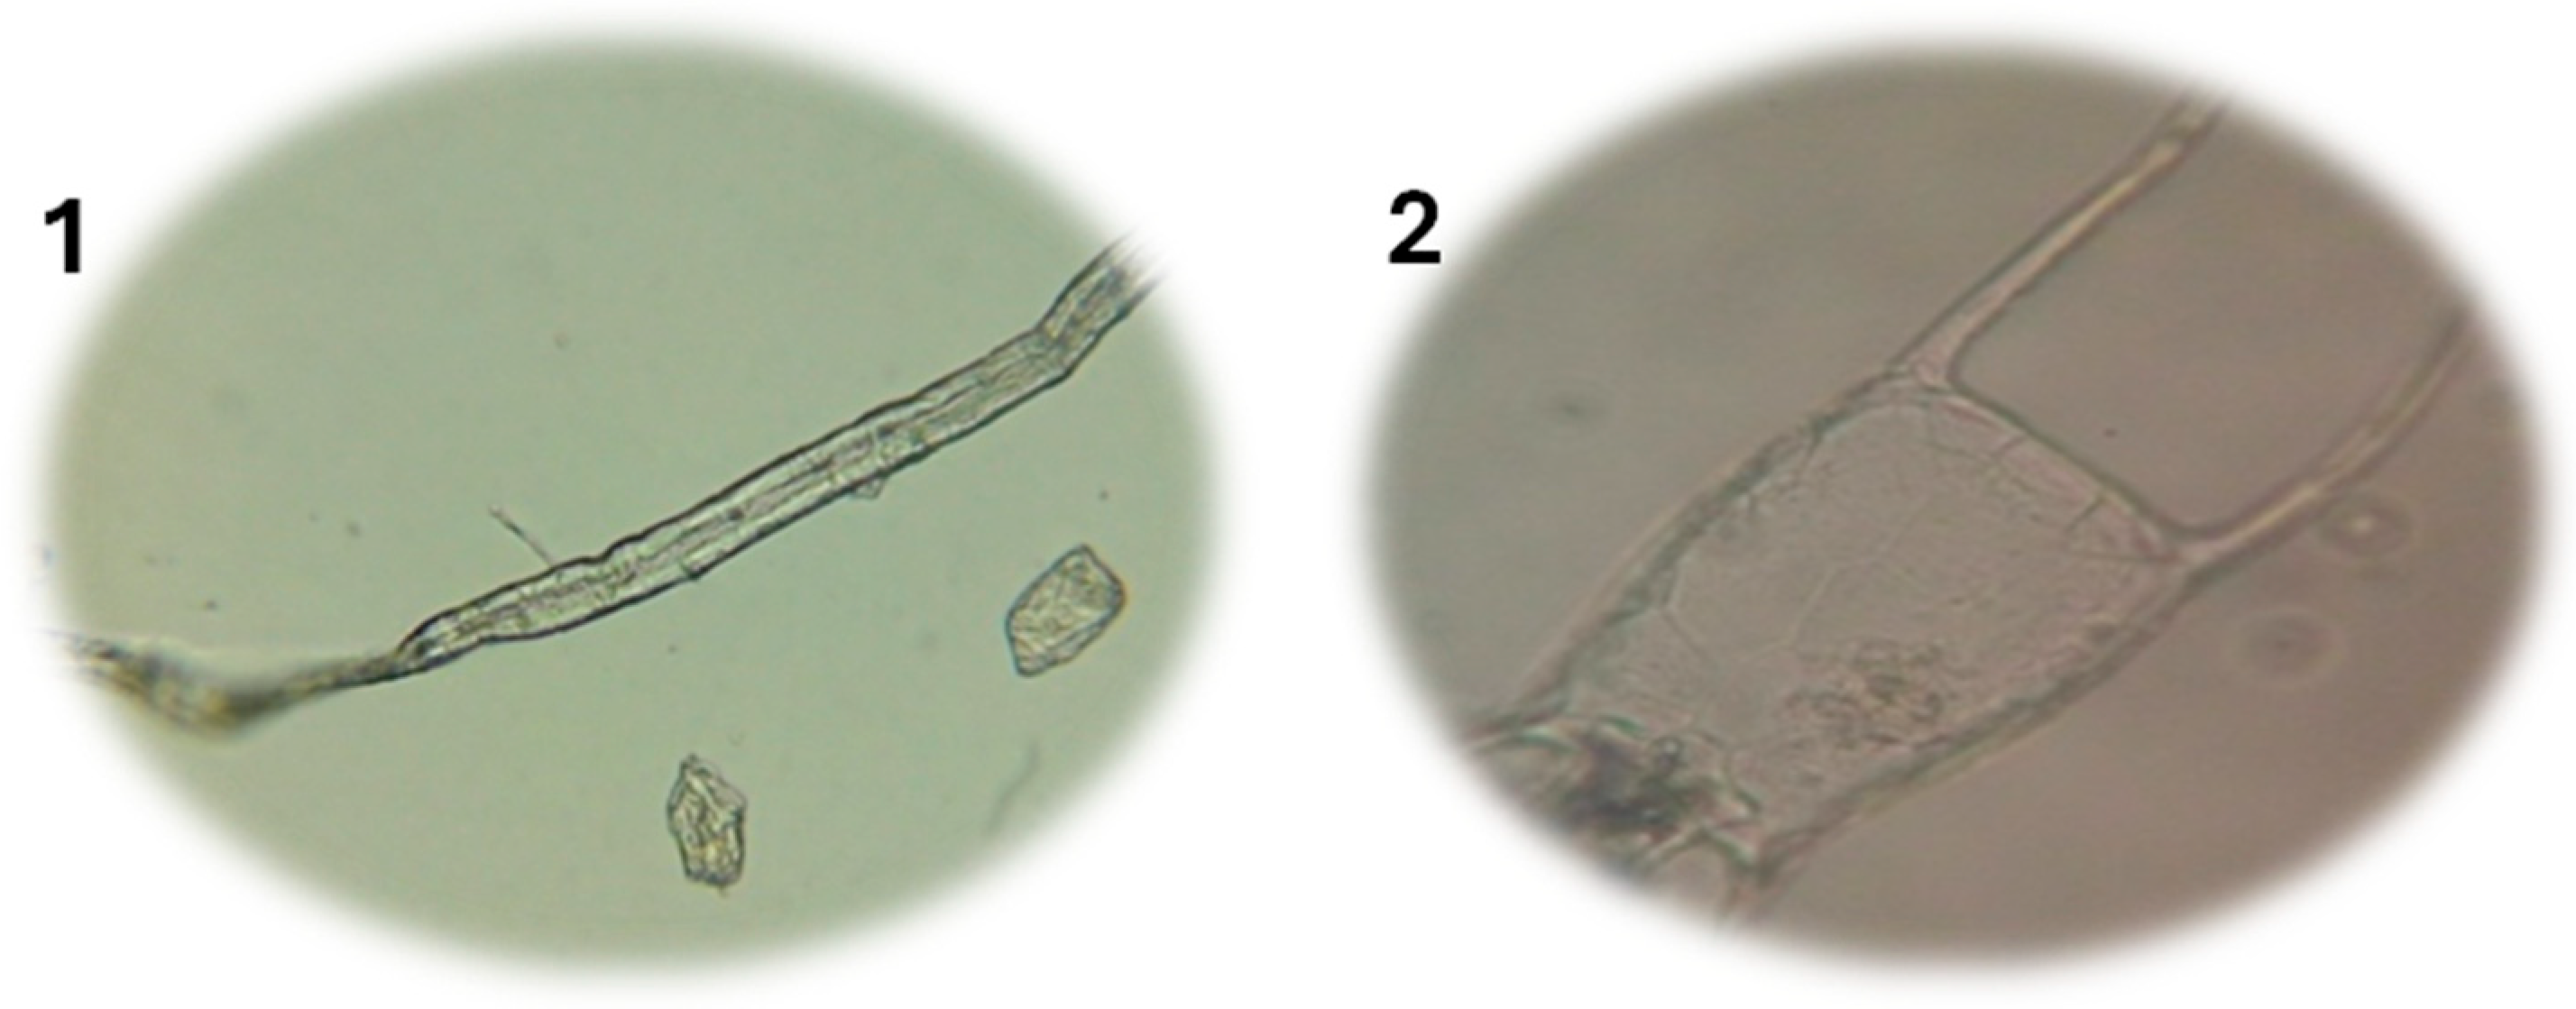
Representative microscopic images of phytoplankton from samples collected at Site 1 are presented in Figure 1. Images 1, 2, and 4 illustrate chlorophyll-bearing green microalgae—namely, Crucigenia tetrapedia, Euglena ehrenbergii var. africana, and Botryococcus braunii. These microorganisms typically thrive in aquatic or highly humid environments and are particularly abundant in stagnant or slow-moving water bodies such as dams, lakes, and ponds, although they may rarely occur as endophytes within plant or animal tissues [58]. Their proliferation is commonly associated with eutrophic conditions driven by elevated nitrate and phosphate concentrations, reduced oxygen availability, and limited light penetration. Such conditions may promote algal blooms capable of releasing harmful gases—notably, hydrogen sulfide (H2S)—posing environmental and public health risks [59]. In contrast, image 3 reveals the presence of filamentous cyanobacterium Oscillatoria coprophila, a phylogenetically ancient Gram-negative prokaryote widely distributed in aquatic environments. Cyanobacteria, whether filamentous or coccoid, are increasingly recognized as key contributors to ecological disturbances in freshwater systems, with their growth strongly favored by phosphorus-rich conditions and restricted water circulation [60,61,62]. The coexistence of these microalgae and cyanobacteria at Site 1 indicates nutrient enrichment and reduced oxygenation, likely linked to anthropogenic nutrient inputs and limited hydrodynamic renewal.
2.
Sampling Site 2
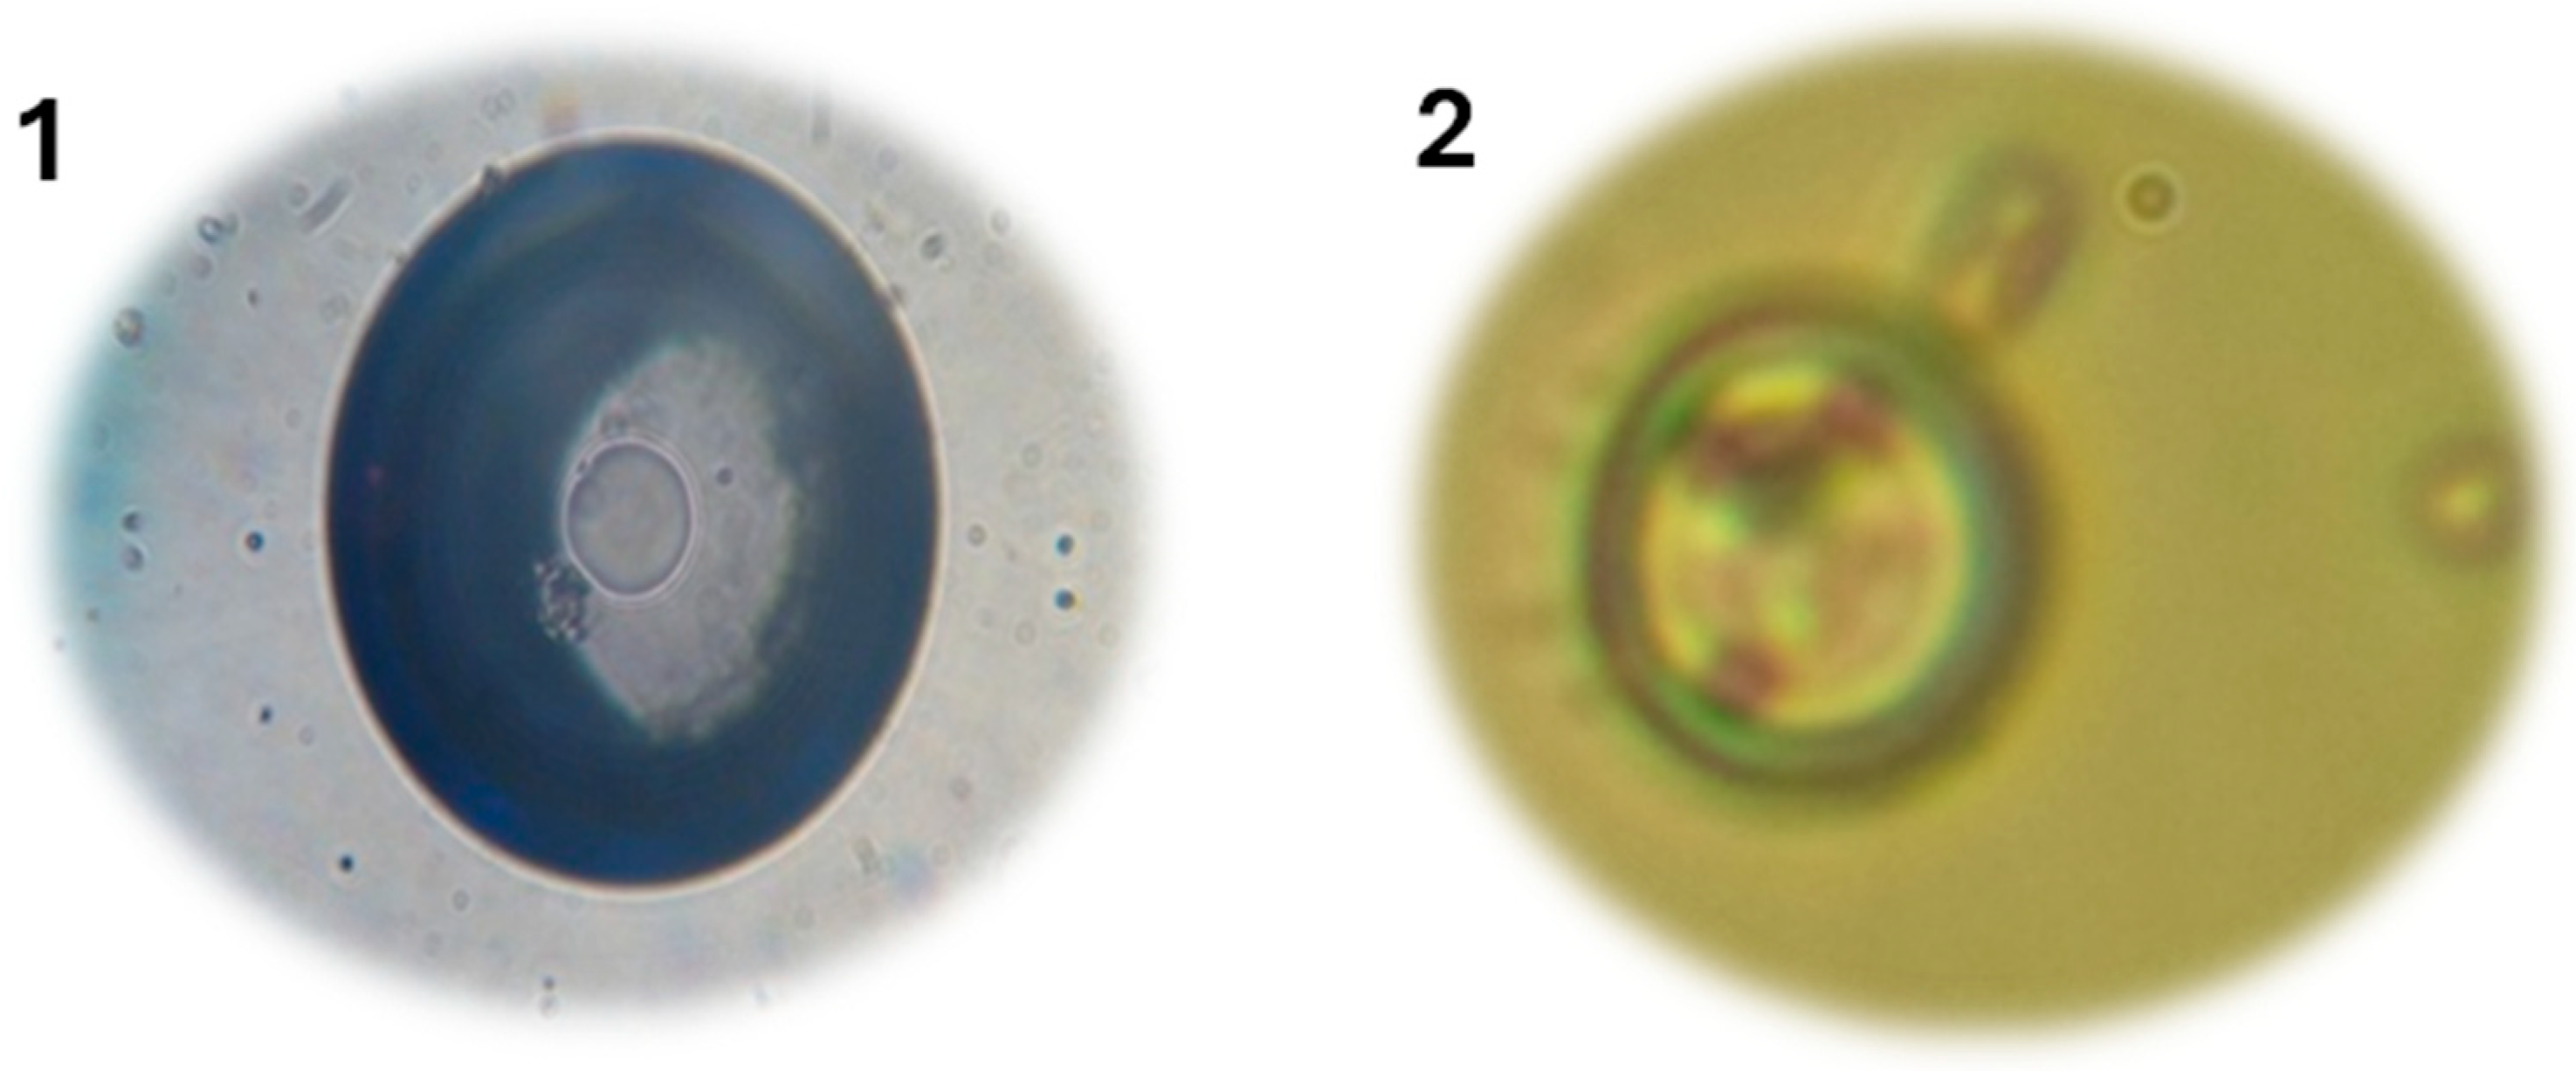
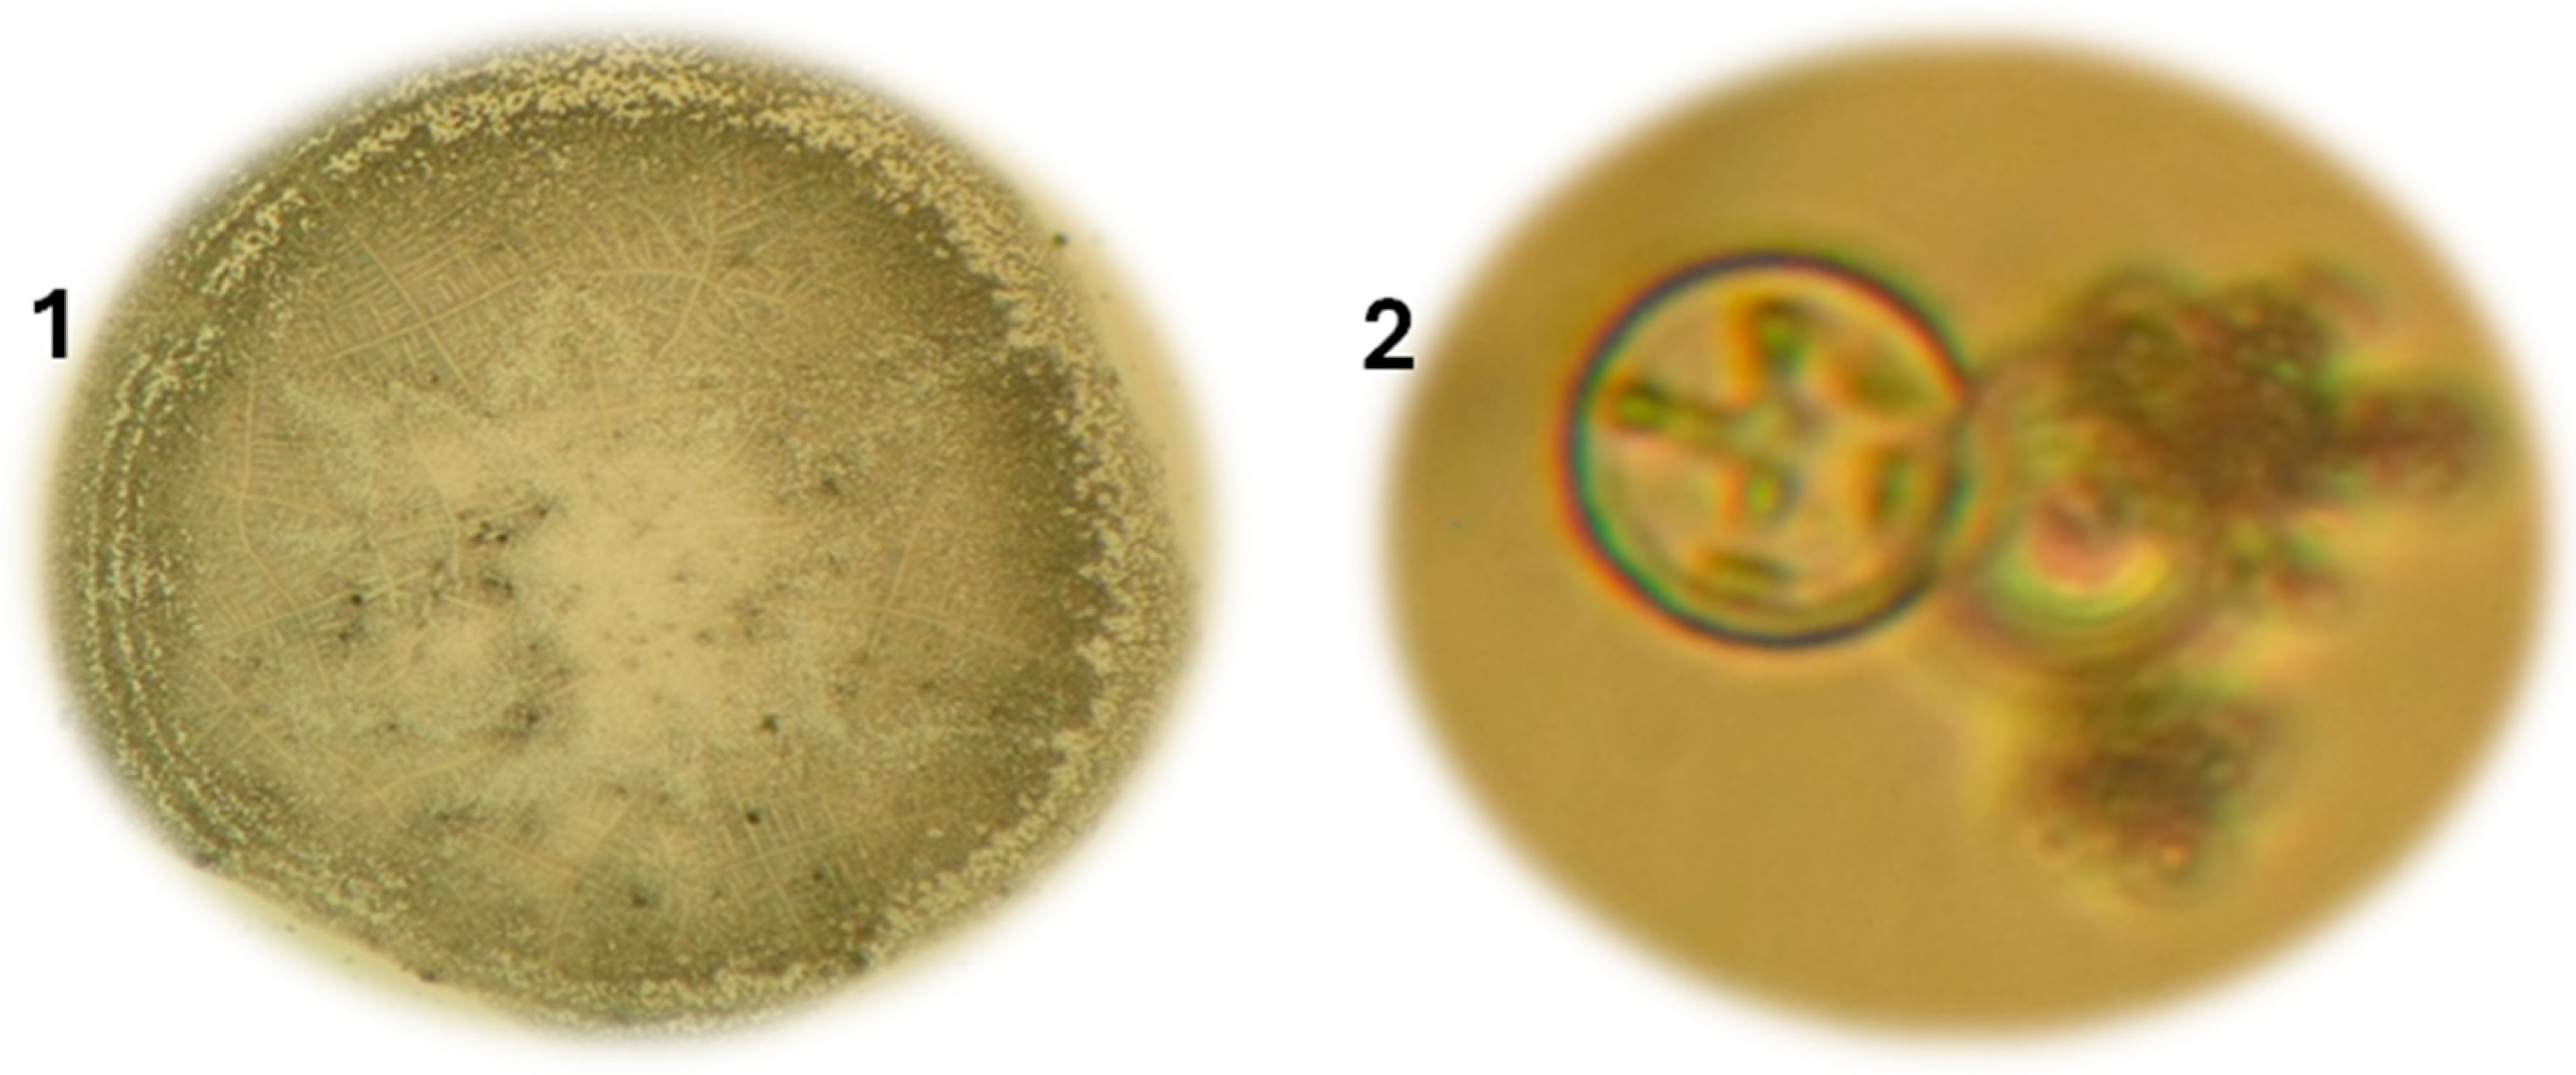
As shown in Figure 2, which presents representative images of the sample collected at Site 2, the assemblage is dominated by green algae occurring in both filamentous and colonial forms, a composition commonly associated with freshwater environments characterized by moderate nutrient availability. The predominance of Chlorophyta suggests relatively favorable oxygenation conditions and adequate light penetration, with no evidence of cyanobacterial proliferation. Among the identified taxa, Dictyosphaerium pulchellum, a small colonial green alga of the Chlorellaceae family characterized by mucilage-embedded cells (scale bar = 10 µm), and Volvox aureus, a colonial volvocalean species forming spherical colonies composed of numerous flagellated cells within a gelatinous matrix (scale bar = 40 µm), were observed. These taxa are widely distributed in freshwater habitats and are generally indicative of stable environmental conditions with moderate nutrient loads and good water quality [58].
3.
Sampling Site 3
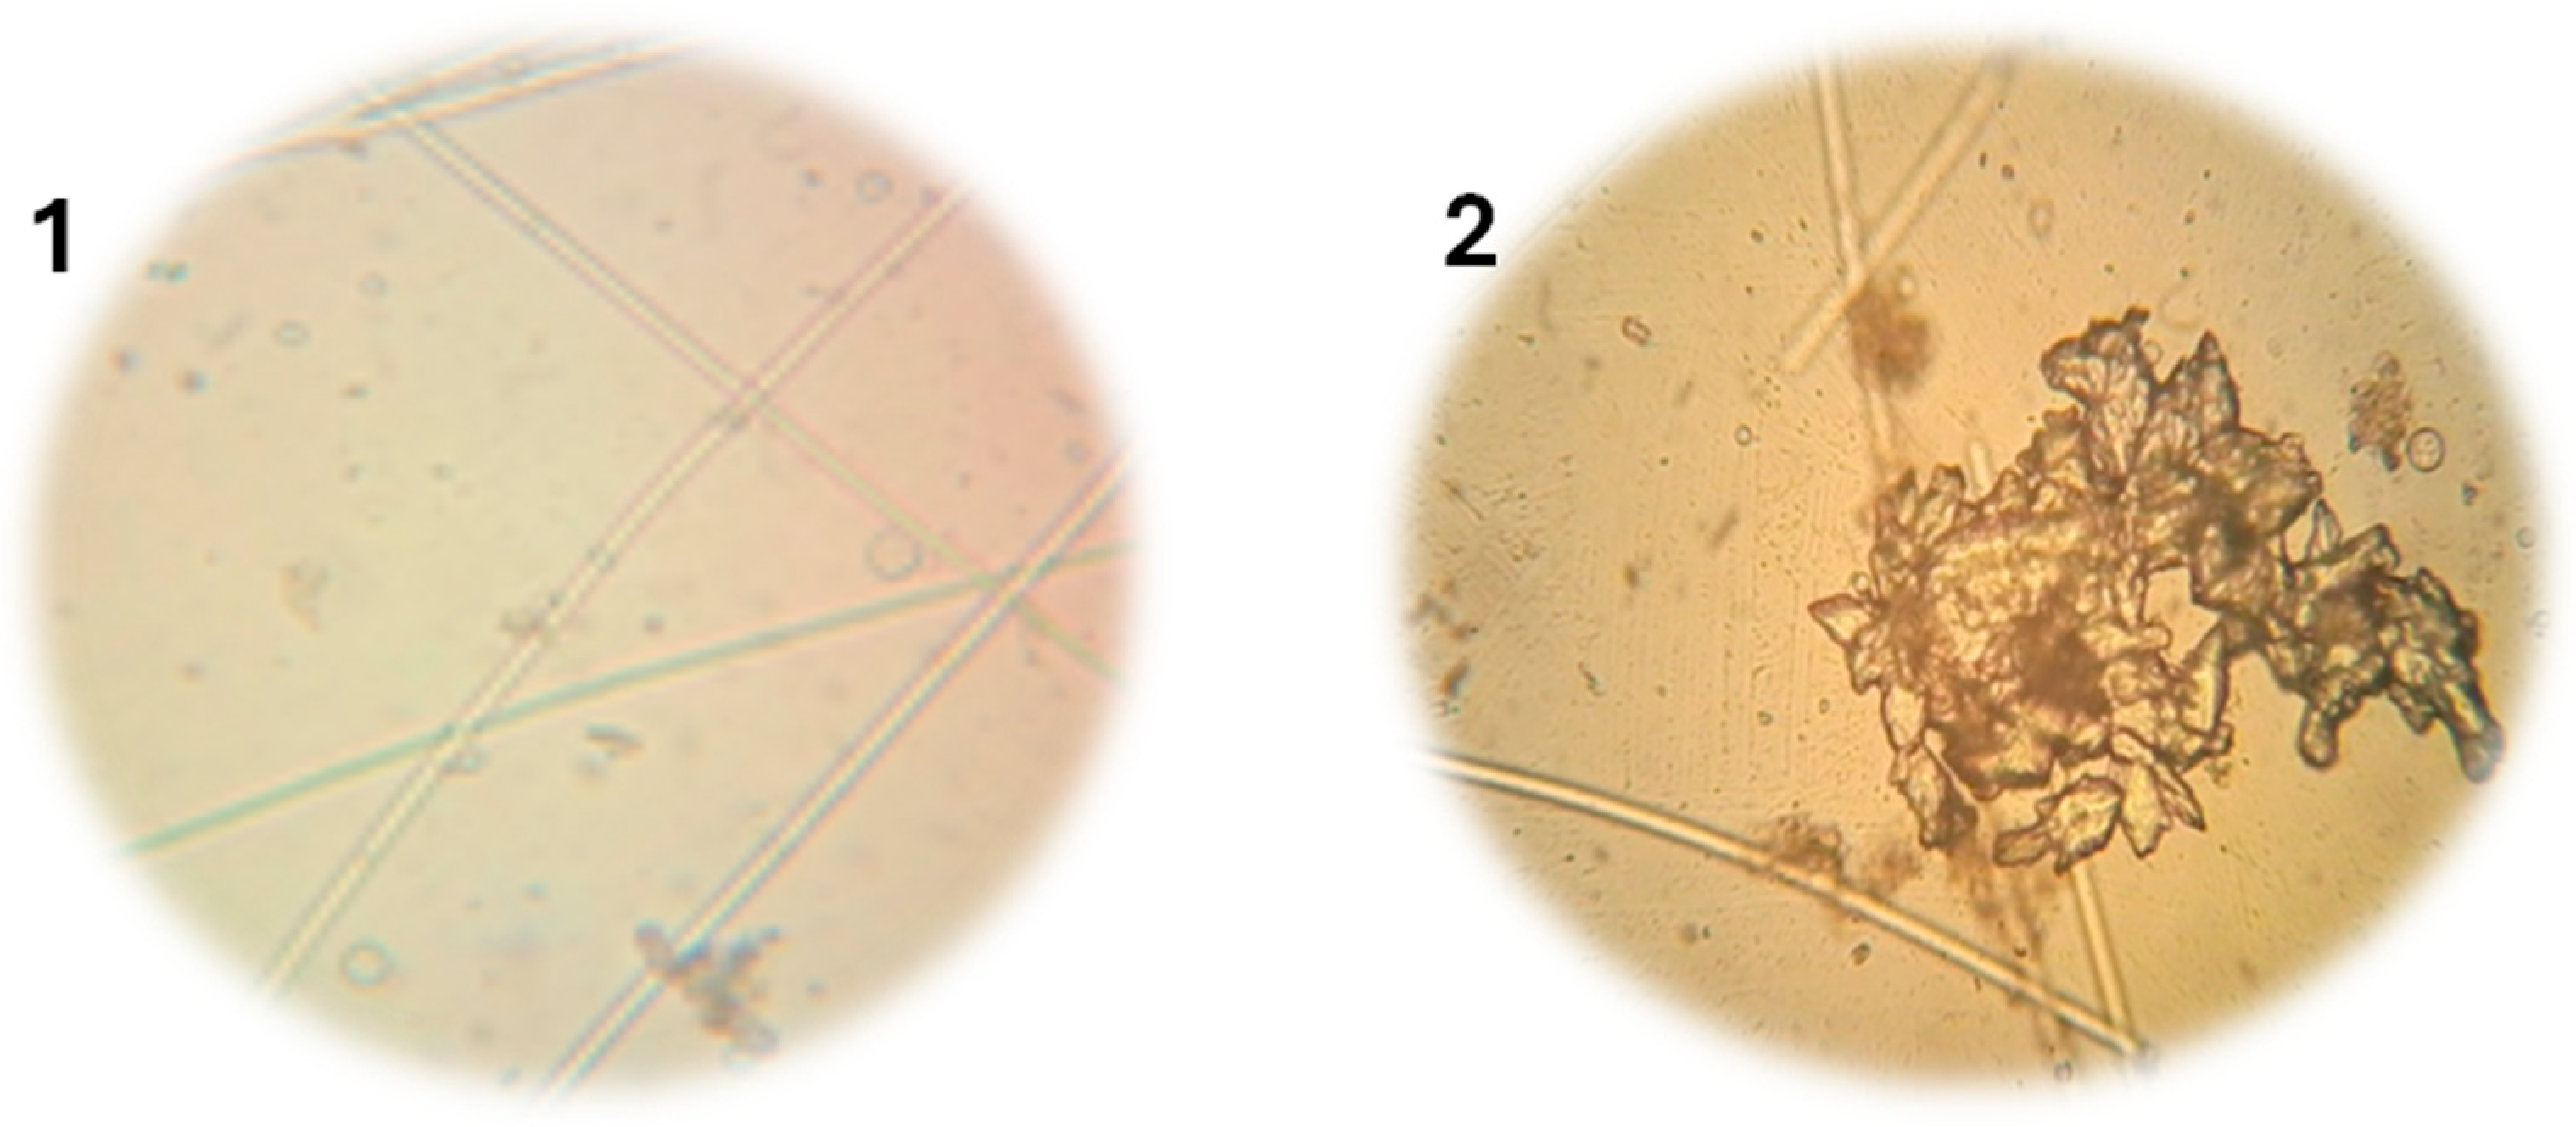
Microscopic observations of phytoplankton in samples collected between 3 and 10 m depth at Site 3 are shown in Figure 3. The assemblage is composed exclusively of green algae (Chlorophyta), represented by Spirogyra sp. and Closterium aciculare. These taxa are characterized by broad ecological tolerance and are capable of developing in diverse freshwater environments under conditions of sufficient light availability [58,63]. Spirogyra sp. forms unbranched filamentous chains with characteristic spiral chloroplasts and is typically associated with mesotrophic to eutrophic waters, whereas Closterium aciculare, a unicellular desmid belonging to Charophyceae, exhibits a slender, crescent-shaped morphology and generally prefers well-illuminated, slightly acidic habitats [64]. The coexistence of these species at this depth range suggests relatively stable underwater conditions with adequate light penetration, supporting the development of green algal communities.
4.
Sampling Site 4
Microscopic observations of samples collected at a depth of 20 m at Site 4 (Figure 4) show the presence of both filamentous green algae and zooplanktonic metazoans, represented by Ulothrix sp. and rotifer Keratella quadrata, respectively. Ulothrix sp. is a filamentous chlorophyte commonly encountered in nutrient-rich freshwater systems, whereas rotifers are among the most abundant metazoans in freshwater and brackish planktonic communities [65]. Rotifers are typically negatively phototactic, a behavioral trait that may explain their preferential occurrence in deeper layers of the water column [66]. Their diet primarily consists of microalgae, which were abundant in the sampled water, potentially accounting for the abundance of K. quadrata at this depth. The co-occurrence of filamentous green algae and rotifers suggests active trophic interaction that may influence microbial and planktonic dynamics within stratified freshwater reservoirs [67].
5.
Sampling Site 5
Microscopic observations of samples collected at sampling Site 5, corresponding to a depth of 30 m, show the presence of two algal genera belonging to distinct taxonomic groups (Figure 5): Oocystis, a planktonic green alga (Chlorophyceae), and Cocconeis placentula, a diatom species (Bacillariophyceae). Oocystis is commonly found in freshwater environments and is frequently associated with stable planktonic conditions [58]. In contrast, Cocconeis placentula belongs to a group of unicellular photosynthetic microalgae widely used as bioindicators in freshwater ecosystems due to their sensitivity to environmental changes and water-quality conditions [67]. The coexistence of chlorophytes and diatoms at this depth suggests environmental conditions that allow for the persistence of diverse algal groups, reflecting relatively stable physicochemical conditions within the deeper water column of the reservoir.
6.
Sampling Site 6
Microscopic observations of samples collected at the margin of the Joumine Dam reservoir (Site 6) show the presence of green algae, represented by Selenastrum gracile and Botryococcus braunii, typical members of freshwater Chlorophyta communities (Figure 6). Selenastrum gracile is frequently employed as an indicator of moderate to high nutrient availability due to its sensitivity to changes in nutrient levels [68]. Botryococcus braunii is a colonial green alga capable of thriving in eutrophic environments and is notable for its high lipid content, which has potential applications in biofuel production [69]. The abundance of these taxa provides insights into the trophic status of the reservoir, with elevated B. braunii populations commonly associated with nutrient enrichment and eutrophication [70]. Bacteriological analyses revealed the presence of key microbial pollution indicators, including total and fecal coliforms, fecal streptococci, and sulfite-reducing Clostridium species, with total microbial counts exceeding the limits established by the Tunisian drinking water standards [34]. Microscopic examinations also revealed considerable populations of algae and cyanobacteria, organisms known to impair water quality and pose health risks [60,71]. These findings underscore the need to explore advanced treatment strategies, such as polymer-based methods, to enhance microbial removal and protect public health.

3.4. Characterization of Polymers

3.4.1. Determination of the Degree of Hydrolysis

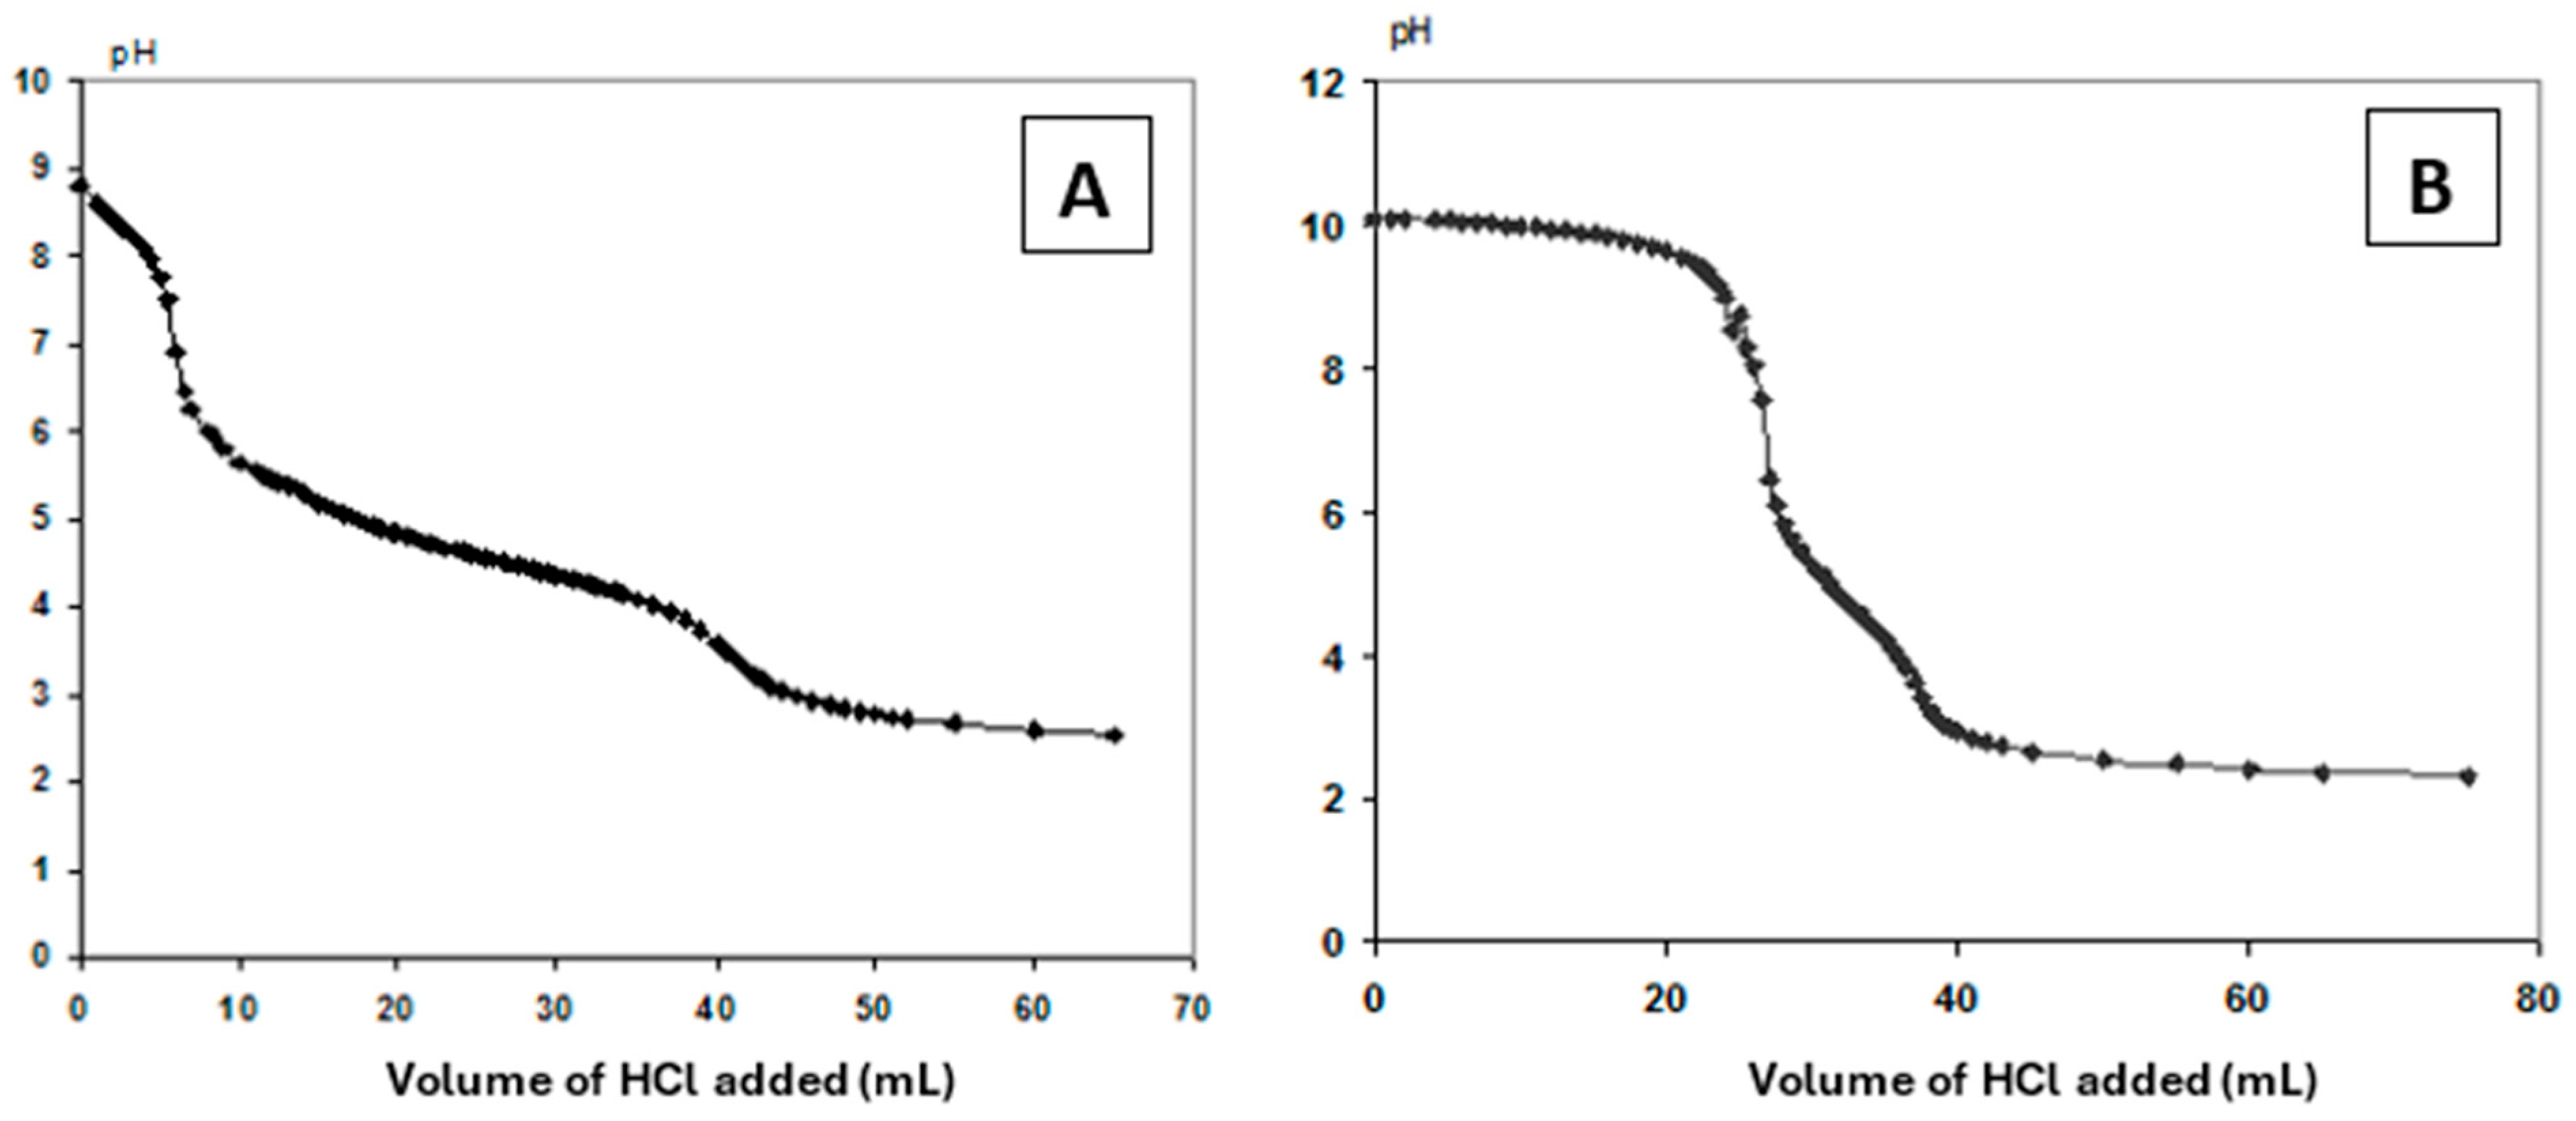
Figure 7 presents the pH variations of both the PVA-co-PVAc and commercial PVA-4-88 during acid–base titration with HCl. The titration curves exhibit two distinct equivalence points corresponding to the neutralization of excess base and residual acetate ions (CH3COO-) released during the saponification process. The inflection points in the curves directly reflect the functional group transformations associated with the partial hydrolysis of acetate moieties into hydroxyl groups (-OH), enabling the quantitative estimation of the degree of hydrolysis.
The degree of hydrolysis of the PVA-co-PVAc was estimated at approximately 83% based on the titration profile. This value agrees with those reported for partially hydrolyzed PVA copolymers and supports the partial conversion of vinyl acetate units into vinyl alcohol units [72]. The titration profile is consistent with the presence of partially hydrolyzed polymer chains containing both hydroxyl groups and residual acetate functionalities. Important properties relevant to water treatment applications, such as solubility, crystallinity, and film-forming ability, are directly influenced by this degree of hydrolysis [72]. Consequently, the degree of hydrolysis may influence physicochemical properties relevant to water-treatment applications, including solubility and polymer–water interactions.

3.4.2. Determination of Intrinsic Viscosity and Estimation of Molar Mass

The intrinsic viscosity of the prepared PVA-co-PVAc was measured at 0.284 dL·g−1, compared to 0.300 dL·g−1 for commercial PVA-4-88. These values indicate that the synthesized and reference polymers exhibit similar hydrodynamic behavior under the employed experimental conditions. The slight difference in intrinsic viscosity may reflect minor variations in hydrodynamic volume and effective chain length under the synthesis conditions.
The measured viscosity values suggest the formation of polymer chains with moderate degrees of polymerization, consistent with literature expectations for dilute polymer solutions [73]. Although intrinsic viscosity provides valuable information regarding polymer-chain characteristics, it should be considered a complementary method rather than a definitive structural characterization technique.

3.5. Evaluation of the Effectiveness of PVA-Co-PVAc for the Treatment of Raw Water from the Joumine Dam

Sampling point 1 (Site 1), located at the dam inlet, exhibited the highest levels of contamination, indicating a substantial pollution load entering the reservoir. To address this contamination, treatment trials were conducted using PVA-co-PVAc, which was prepared in our laboratory. The PVA-co-PVAc was applied to the contaminated water sample under batch conditions at concentrations of 0.1%, 0.2%, 0.5%, and 1% (w/v), with 1 L of raw water for each experimental condition.
The selected concentration range was based on previously reported dosages used for polymer-based coagulation/flocculation processes and was further supported by preliminary laboratory optimization trials [74]. During these preliminary evaluations, concentrations below 0.1% (w/v) were insufficient to induce effective flocculation, whereas concentrations above 1% (w/v) did not produce additional improvements in treatment efficiency. This behavior is consistent with the saturation of available adsorption and polymer-bridging sites at higher polymer dosages, where further polymer addition provides little benefit and may promote overdosing effects [75]. Accordingly, the selected concentration range was used to evaluate the treatment performance of PVA-co-PVAc.
The selection of PVA-co-PVAc was further justified by its structural similarity to poly(vinyl alcohol) (PVA), a hydrophilic and environmentally compatible polymer whose abundant hydroxyl functionalities enable chemical modification and interactions with suspended particles and organic contaminants, making it attractive for water treatment applications [32,75]. Following treatment, the performance of PVA-co-PVAc was evaluated by assessing reductions in physicochemical parameters and microbial load in the water samples to determine its potential as a treatment material for reservoir water remediation.

3.5.1. Physicochemical Analysis of Treated Water from the Joumine Dam

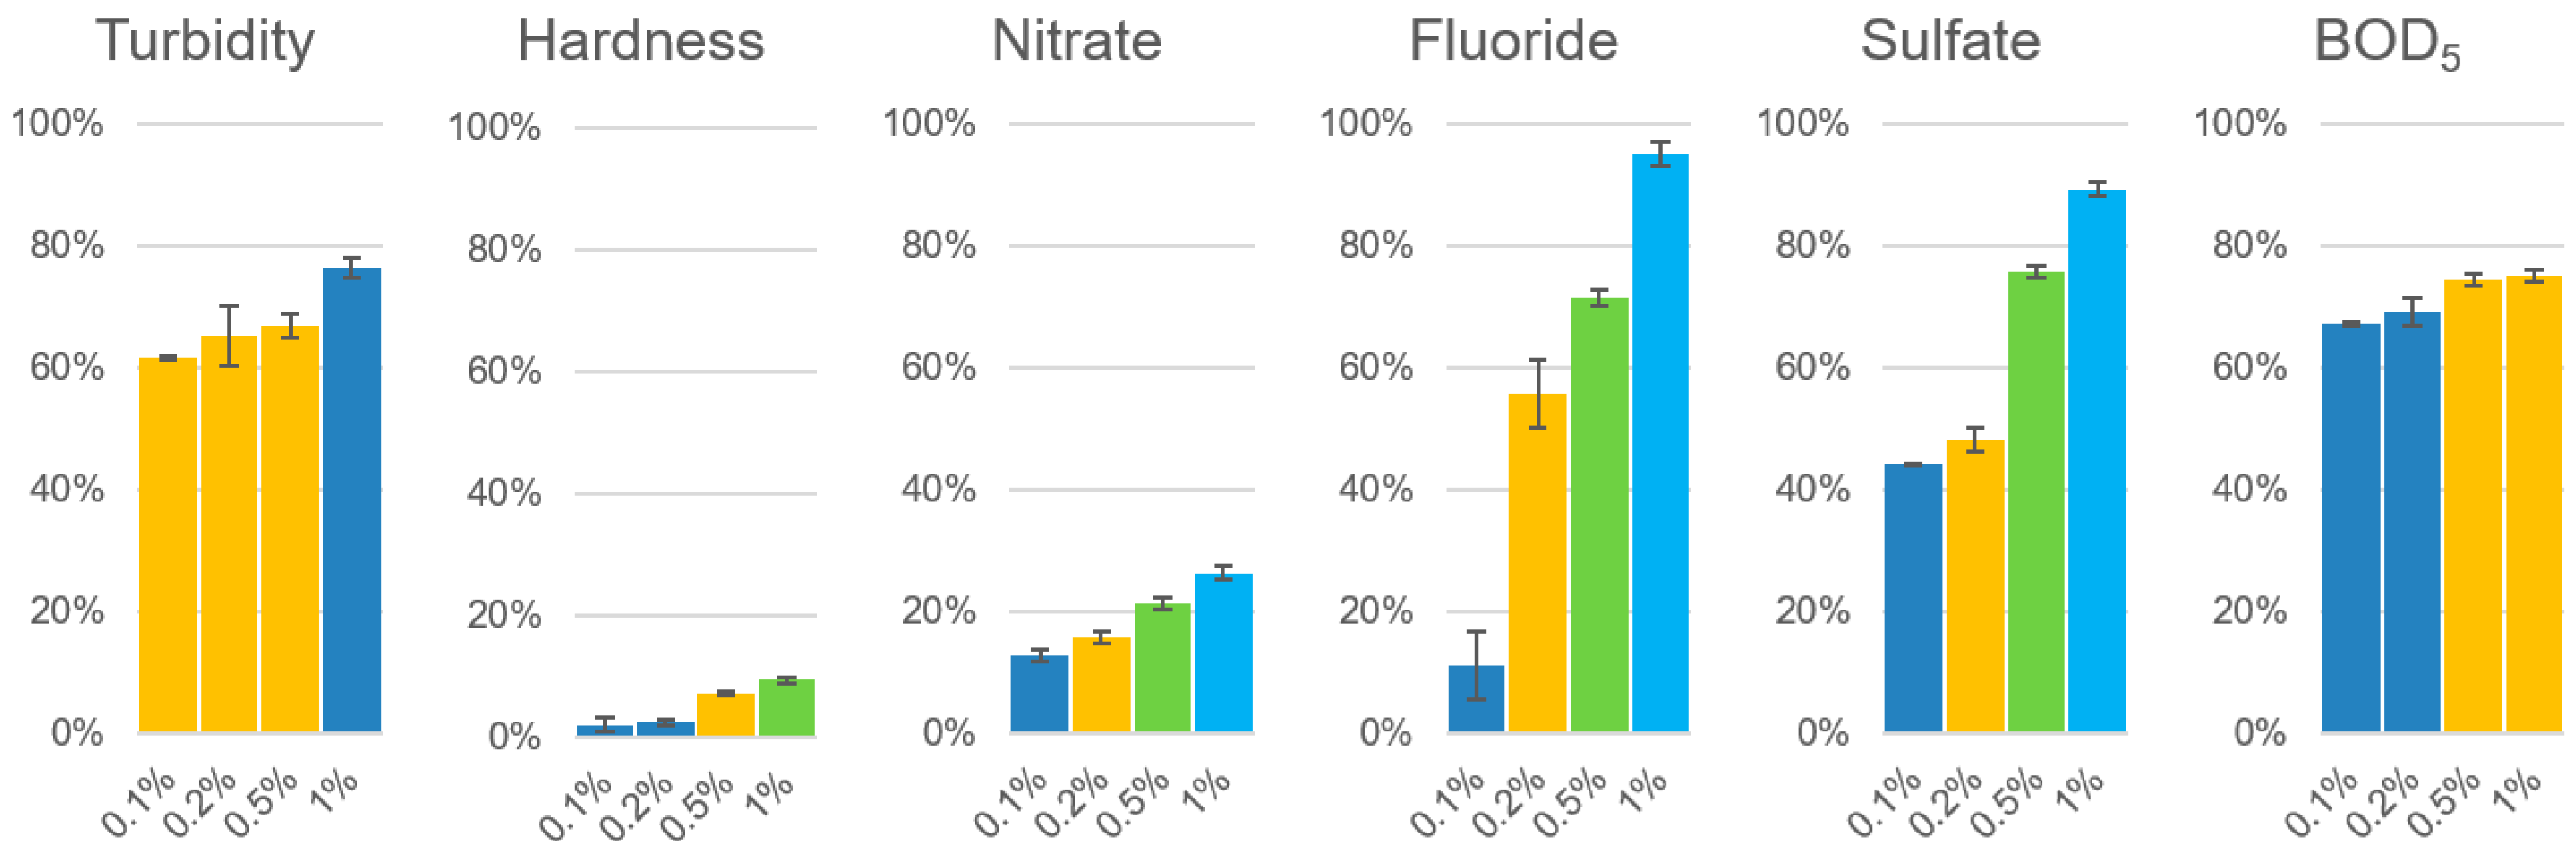
Table 5 presents the variation in the physicochemical parameters of raw water samples collected from the Joumine Dam following treatment with different concentrations of PVA-co-PVAc. The treatment was applied at four polymer dosages (0.1%, 0.2%, 0.5%, and 1% w/v), and the results show marked reductions in turbidity, fluoride concentration, and organic matter content. In contrast, a slight increase in total dissolved solids was observed with increasing polymer concentration, which may be attributed to residual ionic species introduced during the treatment process. Figure 8 presents the removal efficiency (percentage reduction in concentration) of selected parameters.
The pH of water is a key parameter in assessing water quality, as it influences both the physicochemical stability of distribution systems and the efficiency of disinfection processes. Acidic water (pH < 7) may promote the corrosion of concrete and metallic pipelines, leading to the release of toxic elements such as lead and copper [76]. Conversely, alkaline conditions (pH > 8.5) favor scale formation, which can obstruct water flow and reduce treatment efficiency. Moreover, at pH values above 9, the bactericidal effectiveness of chlorine-based disinfectants decreases significantly due to the reduced availability of hypochlorous acid, the most active chlorine species [77]. In the present study, a slight increase in pH was observed with increasing concentrations of PVA-co-PVAc; however, all values remained within the limits prescribed by Tunisian drinking water standards [34], indicating no adverse impact on water safety or treatment performance.
As shown in Table 5, the raw water from the Joumine Dam exhibited a high turbidity level (11.5 NTU), exceeding both Tunisian drinking water standards and WHO guidelines (<5 NTU) [27]. Following treatment with increasing concentrations of PVA-co-PVAc, turbidity decreased significantly, reaching a minimum value of 2.5 NTU at the highest polymer dosage. This reduction may be associated with the flocculation properties of the polymer, which could facilitate the aggregation and settling of suspended colloidal particles, as reported for similar polymer-based treatment systems [78]. These results demonstrate that the PVA-co-PVAc was capable of reducing turbidity under the investigated laboratory conditions. Although turbidity is often considered an aesthetic parameter, it is closely linked to microbial contamination and disinfection resistance, underscoring the importance of its control during primary water treatment [79].
The variation in organic matter (OM) concentration, expressed as BOD5, before and after treatment is also presented in Table 5. Prior to treatment, the OM content was relatively high (12.288 mg O2/L), exceeding the permissible limits set by Tunisian drinking water standards. A progressive decrease in OM concentration was observed with increasing polymer dosage, reaching values consistent with the recommended limit of 5 mg O2/L. This trend indicates that PVA-co-PVAc was effective in reducing organic matter under the conditions evaluated in the present study. Similar results have been reported in recent studies highlighting the role of polymer-based materials in enhancing adsorption and coagulation–flocculation processes [27].
Variations in fluoride concentration during the treatment process are summarized in Table 5. The initial fluoride level (2.03 mg/L) exceeded international drinking water standards. Upon addition of PVA-co-PVAc, a gradual reduction in fluoride concentration was observed. At dosages above 0.1% (w/v), fluoride levels decreased markedly, and at a 1% polymer concentration, residual fluoride became nearly negligible (<0.1 mg/L). The mechanism responsible for the observed fluoride reduction cannot be conclusively established from the available data. Possible explanations include adsorption-related interactions, physical incorporation into settling flocs, and other coagulation–flocculation processes. Additional investigations will be required to clarify the contribution of these mechanisms.
These results indicate that the proposed treatment was effective in reducing fluoride concentration under the investigated conditions, in agreement with previous studies reporting fluoride removal using polymer-based materials and functionalized PVA systems [27,80]. However, given the observed high apparent removal efficiency, further work is required to validate the accuracy of the fluoride measurements and to establish the corresponding LOD and LOQ values.
The variation in TDS during treatment with PVA-co-PVAc is also reported in Table 5. An increase in dry residue concentration was observed with higher polymer dosages, which may be associated with residual soluble species generated during alkaline hydrolysis, including sodium acetate, alongside potential partial water evaporation during drying. Nevertheless, all measured values remained within the limits established by Tunisian drinking water standards. Similar behavior has been reported for polymer-based water treatment materials, where the addition of the polymer may contribute to a temporary increase in the measured dry residue without compromising compliance with drinking water standards [27,81].
Although treatment effects were most pronounced for turbidity, fluoride concentration, and organic matter, statistically significant variations were also observed for several other measured parameters. Nevertheless, for those parameters, all measured values remained within the applicable mandatory limits.

3.5.2. Microscopic Analysis and Total Cell Counting After Water Treatment

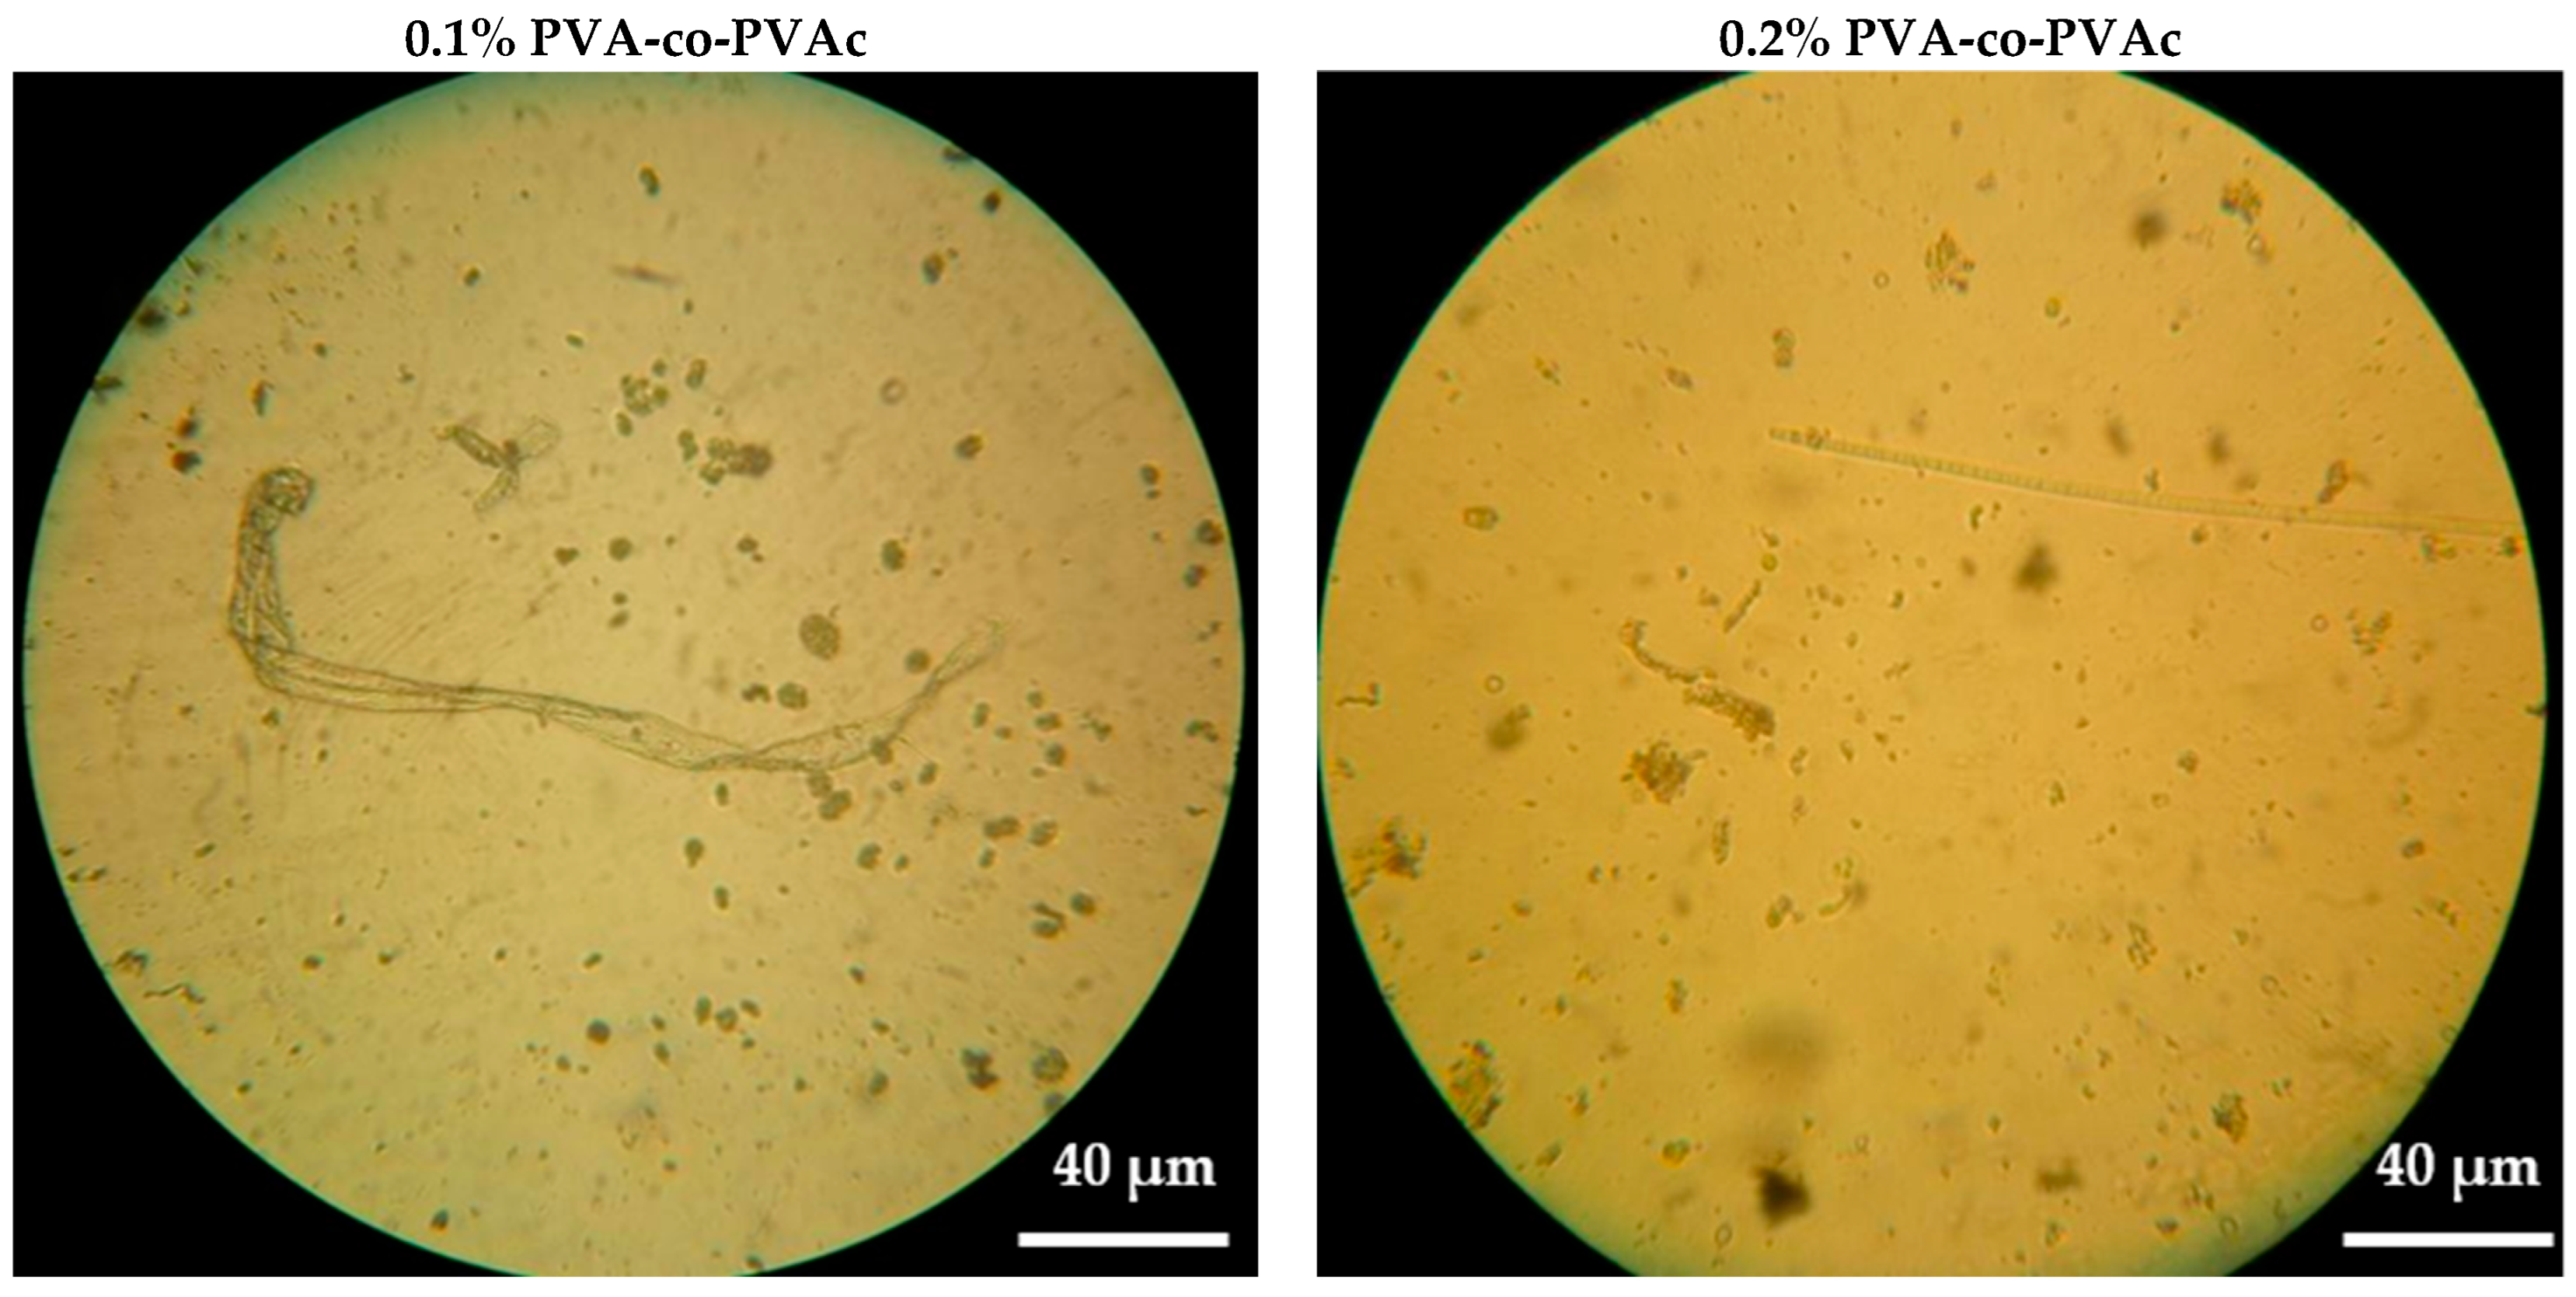
Table 6 illustrates the changes in microbial counts in water samples taken from Site 1 before and after treatment with varying concentrations of PVA-co-PVAc solutions. The reduction in microbial counts after treatment is statistically significant for all polymer concentrations (confirmed by the Tukey’s post hoc test after one-way ANOVA, α = 0.05, p < 0.01). Figure 9 shows representative microscopic images of water samples collected from Site 1 following treatment with increasing doses of PVA-co-PVAc.
Based on the data presented in Table 6, the number of cyanobacteria and algal colonies in the water samples decreased progressively from 39 to 3 following treatment with PVA-co-PVAc. This marked reduction demonstrates the effectiveness of the polymer in removing these microorganisms from the aquatic environment.
The observed reduction in microscopic cell density is consistent with the physical aggregation and settling of suspended microbial biomass during the coagulation–flocculation process [82]. Because no viability assays or cell-integrity assessments were performed, the results should not be interpreted as evidence of antimicrobial or bactericidal activity.
To better contextualize the performance of the synthesized PVA-co-PVAc, a comparison with representative polymer-based water treatment materials reported in the literature is presented in Table 7. The comparison includes polymer type, target contaminant, dosage, removal efficiency, operating conditions, and reported limitations. Under the investigated experimental conditions, the synthesized PVA-co-PVAc effectively reduced turbidity, fluoride concentration, organic matter, and microbial load, demonstrating a treatment performance comparable to that of similar polymer-based materials. However, direct comparisons should be interpreted with caution because treatment efficiency depends on the characteristics of the treated water, polymer composition, dosage, and operating conditions.
While these preliminary results demonstrate the multi-contaminant removal efficiency of PVA-co-PVAc, several environmental and safety evaluations remain to be fully addressed. Future studies will focus on comprehensive ecotoxicological testing, quantification of residual polymer content (TOC) and sodium concentration in treated water, as well as sludge volume characterization and disposal safety. Furthermore, direct comparative evaluations against conventional inorganic coagulants (e.g., alum) and unhydrolyzed PVAc precursors will be required to comprehensively establish the operational feasibility of this material.
Based on the observed treatment performance, contaminant removal may involve a combination of coagulation–flocculation, particle aggregation, adsorption-related interactions, and settling processes. However, the relative contribution of these mechanisms was not directly investigated in the present work. Therefore, these explanations should be considered working hypotheses requiring further validation through dedicated characterization techniques, including zeta-potential measurements, particle-size analysis, and microscopic characterization of the resulting flocs.
To contextualize the performance of PVA-co-PVAc, its treatment performance was considered in relation to conventional coagulants and recently reported polymer-based materials. While traditional inorganic coagulants like aluminum sulfate (alum) achieve satisfactory turbidity removal, they often require high dosages and may leave hazardous residual aluminum in the treated water [85]. In contrast, recent advances in polymer-based water treatment, including both synthetic and bio-based polymers, have demonstrated a high affinity for suspended particles and organic contaminants through efficient coagulation–flocculation mechanisms while offering improved versatility and performance across a wide range of water treatment conditions [86]. Under the investigated experimental conditions, the PVA-co-PVAc developed in this study demonstrated promising pollutant removal performance, highlighting its potential as an alternative polymeric material for water treatment.
Under the investigated laboratory conditions, PVA-co-PVAc demonstrated the ability to improve several water-quality parameters in a natural reservoir-water matrix. Direct comparisons with conventional treatment materials should be interpreted cautiously because treatment performance depends strongly on water characteristics, operating conditions, and dosage requirements. Additional studies, including benchmark comparisons with conventional coagulants, sludge characterization, and economic assessment, will be required to establish practical applicability. Further investigations are required to assess polymer residues, potential leaching, and the environmental safety of the treated water before practical application [32].

4. Conclusions

In summary, this investigation successfully established a detailed assessment of the raw water quality of the Joumine Dam reservoir, as highlighted by substantial non-compliance in turbidity, organic-matter content, and critical fecal indicators. The study demonstrates the potential of a partially hydrolyzed PVA-co-PVAc matrix as an alternative polymeric material for water treatment. The principal contribution of this work lies in the evaluation of its performance using a naturally contaminated surface-water sample collected from the Joumine Dam. The application of PVA-co-PVAc resulted in concentration-dependent improvements in water-quality parameters, yielding up to 93% reduction in total microscopic cell density at a copolymer dosage of 1.0% (w/v), together with significant improvements in the physicochemical quality of the treated water.
Furthermore, although treatment performance was evaluated using water from a single sampling campaign, the synthesized polymer was tested in a real field-collected water sample rather than a laboratory-simulated polluted one, thereby increasing the environmental relevance of the findings.
Future studies should therefore include comprehensive structural characterization, residual polymer concentration and toxicity assessments, evaluation under different seasonal and hydrological conditions, comparison with conventional coagulants, and continuous-flow pilot-scale validation to further assess the applicability of the proposed material for real-world water treatment systems.

Author Contributions

Conceptualization, M.A., N.A. and D.M.; methodology, M.A.; validation, K.F., A.B. and M.G.; formal analysis, M.A.; investigation, M.A., K.F., H.P. and D.M.; writing—original draft preparation, M.A., H.P., N.A. and D.M.; writing—review and editing, M.A., K.F., A.C., H.P., N.A. and D.M.; visualization, K.F., A.B., M.G., A.C. and N.A.; supervision, D.M. and N.A. All authors have read and agreed to the published version of the manuscript.

Funding

The authors acknowledge the support of FCT through the Smart Cities Research Center (grant https://doi.org/10.54499/UID/05567/2025).

Data Availability Statement

The original contributions presented in this study are included in the article. Further inquiries can be directed to the corresponding author.

Acknowledgments

The authors wish to acknowledge the Ministry of Higher Education and Scientific Research in Tunisia, which facilitated this work.

Conflicts of Interest

The authors declare no conflicts of interest.

References

  1. United Nations Children’s Fund & World Health Organization. Progress on Household Drinking Water, Sanitation and Hygiene 2000–2022: Special Focus on Gender; World Health Organization: Geneva, Switzerland, 2024. [Google Scholar]
  2. Ray, R.; Gusain, R.; Kumar, N. Carbon Nanomaterial-Based Adsorbents for Water Purification: Fundamentals and Applications; Elsevier: Amsterdam, The Netherlands, 2020. [Google Scholar]
  3. Bain, R.; Johnston, R.; Slaymaker, T. Drinking water quality and the SDGs. npj Clean Water 2020, 3, 37. [Google Scholar] [CrossRef] [Scilit]
  4. Boukari, A. Impacts de la Pollution Diffuse en Milieu Agricole sur la Qualité des Eaux de Surface à L’échelle du Bassin Versant de L’oued Joumine: Application de Différentesapproches de Modélisation. Ph.D. Thesis, Université de Liège, Liège, France, 2019. [Google Scholar]
  5. Bureau de la Planification et des Equilibres Hydrauliques. Elaboration de la Vision et de la Stratégie du Secteur de l’Eau à l’Horizon 2050 pour la Tunisie (EAU 2050); Ministère de l’Agriculture, des Ressources Hydrauliques et de la Pêche Maritime: Tunis, Tunisia, 2020.
  6. Jenhani, A.; Fathalli, A.; Djemali, I.; Changeux, T.; Romdhane, M. Tunisian reservoirs: Diagnosis and biological potentialities. Aquat. Living Resour. 2019, 32, 17. [Google Scholar] [CrossRef] [Scilit]
  7. Fathalli, A.; Jenhani, A.; Moreira, C.; Azevedo, J.; Welker, M.; Romdhane, M.; Antunes, A.; Vasconcelos, V. Genetic variability of the invasive cyanobacteria Cylindrospermopsis raciborskii from Bir M’cherga reservoir (Tunisia). Arch. Microbiol. 2011, 193, 595–604. [Google Scholar] [CrossRef] [Scilit]
  8. Madyouni, H.; Almanza, V.; Benabdallah, S.; Joaquim-Justo, C.; Romdhane, M.S.; Habaieb, H.; Deliege, J.-F. Assessment of Water Quality Variations and Trophic State of the Joumine Reservoir (Tunisia) by Multivariate Analysis. Water 2023, 15, 3019. [Google Scholar] [CrossRef] [Scilit]
  9. Ali, S.; Abdou, M.; Emara, M.; Farag, R.; Mubarak, M. Eco-friendly solutions: A comprehensive review of natural coagulants for sustainable water treatment. Environ. Geochem. Health 2025, 47, 535. [Google Scholar] [CrossRef] [Scilit]
  10. Gupta, V.; Ali, I.; Saleh, T.; Nayaka, A.; Agarwal, S. Chemical treatment technologies for waste-water recycling—An overview. RSC Adv. 2012, 2, 6380–6388. [Google Scholar] [CrossRef] [Scilit]
  11. Razmgar, K.; Nasiraee, M. Polyvinyl alcohol-based membranes for filtration of aqueous solutions: A comprehensive review. Polym. Eng. Sci. 2022, 62, 25–43. [Google Scholar] [CrossRef] [Scilit]
  12. Mok, C.; Ching, Y.; Muhamad, F.; Osman, N.; Hai, N.; Hassan, C. Adsorption of dyes using poly(vinyl alcohol) (PVA) and PVA-based polymer composite adsorbents: A review. J. Polym. Environ. 2020, 28, 775–793. [Google Scholar] [CrossRef] [Scilit]
  13. Moud, A. Polymer based flocculants: Review of water purification applications. J. Water Proc. Eng. 2022, 48, 102938. [Google Scholar] [CrossRef] [Scilit]
  14. Atanase, L.; Bistac, S.; Riess, G. Effect of poly(vinyl alcohol-co-vinyl acetate) copolymer blockiness on the dynamic interfacial tension and dilational viscoelasticity of polymer–anionic surfactant complex at the water–1-chlorobutane interface. Soft Matter 2015, 11, 2665–2672. [Google Scholar] [CrossRef] [Scilit]
  15. Limam, A. Contribution à l’Étude des Conditions du Milieu et des Peoplements Phytoplanctoniques des Eaux de la Retenue du Barrage Joumineen Relation avec le Réseau de Distribution. Master’s Thesis, Université de Carthage, Carthage, Tunisia, 2003. [Google Scholar]
  16. Observatoire National de l’Agriculture, Ministère de l’Agriculture, des Ressources Hydrauliques et de la Pêche Maritime. Available online: http://www.onagri.nat.tn (accessed on 19 February 2026).
  17. Etteieb, S.; Cherif, S.; Tarhouni, J. Hydrochemical assessment of water quality for irrigation: A case study of the Medjerda River in Tunisia. Appl. Water Sci. 2017, 7, 469–480. [Google Scholar] [CrossRef] [Scilit]
  18. Aouiti, S.; Azaza, F.; El Melki, F.; Hamdi, M.; Celico, F.; Zammouri, M. Groundwater quality assessment for different uses using various water quality indices in semi-arid region of central Tunisia. Environ. Sci. Pollut. Res. 2021, 28, 46669–46691. [Google Scholar] [CrossRef] [Scilit]
  19. APHA. Standard Methods for the Examination of Water and Wastewater, 23rd ed.; American Public Health Association: Washington, DC, USA, 2017. [Google Scholar]
  20. Tarki, M.; Dadi, K.; Dassi, L. Assessment of groundwater quality and suitability with emphasis on the human health risk in North African Saharan oases: A case study from the Tozeur region, southern Tunisia. Euro-Mediterr. J. Environ. Integr. 2022, 7, 223–239. [Google Scholar] [CrossRef] [Scilit]
  21. Blagojević, D.; Polovina, A.; Lazić, D.; Jelić, D. Determination of chloride content in bottled mineral water. Acta Sci. Balc. 2022, 3, 13–21. [Google Scholar] [CrossRef] [Scilit]
  22. ISO 9308-1:2014; Water Quality—Enumeration of Escherichia coli and Coliform Bacteria, Part 1: Membrane Filtration Method for Waters with Low Bacterial Background Flora. International Organization for Standardization: Geneva, Switzerland, 2019.
  23. ISO.15213-1:2023; Microbiology of the Food Chain: Horizontal Method for the Detection and Enumeration of Clostridium spp.—Part 1: Enumeration of Sulfite-Reducing Clostridium spp. by Colony-Count Technique. International Organization for Standardization: Geneva, Switzerland, 2023.
  24. United States Environmental Protection Agency (EPA). Method 1604: Total Coliforms and Escherichia coli in Water by Membrane Filtration Using a Simultaneous Detection Technique (MI Medium); EPA: Washington, DC, USA, 2002.
  25. Edberg, S.; Allen, M.; Smith, D.; Kriz, N. Enumeration of total coliforms and Escherichia coli from source water by the defined substrate technology. Appl. Environ. Microbiol. 1990, 56, 366–369. [Google Scholar] [CrossRef] [Scilit]
  26. Rompré, A.; Servais, P.; Baudart, J.; de-Roubin, M.-R.; Laurent, P. Detection and enumeration of coliforms in drinking water: Current methods and emerging approaches. J. Microbiol. Methods 2002, 49, 31–54. [Google Scholar] [CrossRef] [Scilit]
  27. World Health Organization (WHO). Guidelines for Drinking-Water Quality: Fourth Edition Incorporating the First and Second Addenda; WHO: Geneva, Switzerland, 2022. [Google Scholar]
  28. NF EN 1520; Qualité de l’eau—Norme Guide Pour le Dénombrement du Phytoplancton par Microscopie Inversée (Méthode Utermöhl). Association Française de Normalisation: Paris, France, 2006.
  29. Utermöhl, U. Zur vervollkommnung der quantitativen phytoplankton-methodik: Mit 1 Tabelle und 15 abbildungenim Text und auf 1 Tafel. Int. Ver. Theor. Angew. Limnol. Mitteilungen 1958, 9, 1–38. [Google Scholar] [CrossRef] [Scilit]
  30. Raffin, M.; Dugas, P.-Y.; Melchin, T.; D’Agosto, F.; Lansalot, M. Synthesis of Well-Defined Poly(vinyl alcohol-co-vinyl acetate) Copolymers by Alcoholysis of Poly(vinyl acetate) Synthesized by Macromolecular Design via Interchange of Xanthate Polymerization, and Their Use as a Stabilizer in Emulsion (Co)polymerization of Vinyl Acetate. Biomacromolecules 2024, 25, 6060–6071. [Google Scholar] [CrossRef] [Scilit]
  31. Jiang, L.; Yang, T.; Peng, L.; Dan, Y. Acrylamide modified poly(vinyl alcohol): Crystalline and enhanced water solubility. RSC Adv. 2015, 5, 86598–86605. [Google Scholar] [CrossRef] [Scilit]
  32. Bercea, M. Recent advances in poly(vinyl alcohol)-based hydrogels. Polymers 2024, 16, 2021. [Google Scholar] [CrossRef] [Scilit]
  33. Metcalf & Eddy; AECOM. Wastewater Engineering Treatment and Resource Recovery, 5th ed.; Tchobanoglous, G., Stensel, H., Tsuchihashi, R., Burton, F., Eds.; McGraw-Hill Education: New York, NY, USA, 2014. [Google Scholar]
  34. NT 09.14:2013; Eaux Destinées à la Consummation Humaine à l’Exclusion des Eaux Conditionnées. Institut Tunisien de Normalisation et de la Propriété Industrielle (INNORPI): Tunis, Tunisia, 2013.
  35. World Health Organization (WHO). Guidelines for Drinking-Water Quality: Fourth Edition Incorporating the 1st Addendum; WHO: Geneva, Switzerland, 2017. [Google Scholar]
  36. Hem, J. Study and Interpretation of the Chemical Characteristics of Natural Water, 3rd ed.; U.S. Geological Survey, Water Supply Paper 2254; U.S. Geological Survey: Reston, VA, USA, 1985. [CrossRef] [Scilit]
  37. Rodier, J.; Merlet, N.; Legube, B. L’Analyse de l’Eau, 9th ed.; DUNOD: Paris, France, 2009. [Google Scholar]
  38. Sadiq, R.; Rodriguez, M. Disinfection by-products (DBPs) in drinking water and predictive models for their occurrence: A review. Sci. Total Environ. 2004, 321, 21–46. [Google Scholar] [CrossRef] [Scilit]
  39. Gregory, J. Particles in Water: Properties and Processes; CRC Press: Boca Raton, FL, USA, 2005. [Google Scholar]
  40. Benjamin, M. Water Chemistry, 2nd ed.; Waveland Press: Long Grove, USA, 2015. [Google Scholar]
  41. Obianyo, J. Effect of salinity on evaporation and the water cycle. Emerg. Sci. J. 2019, 3, 255–262. [Google Scholar] [CrossRef] [Scilit]
  42. Environmental Protection Agency (EPA). Secondary Drinking Water Standards: Guidance for Nuisance Chemicals; EPA: Washington, DC, USA, 2025. Available online: https://www.epa.gov/sdwa/secondary-drinking-water-standards-guidance-nuisance-chemicals (accessed on 19 February 2026).
  43. Wetzel, R. Limnology: Lake and River Ecosystems, 3rd ed.; Academic Press: San Diego, CA, USA, 2001. [Google Scholar]
  44. Chapman, D. Water Quality Assessments: A Guide to the Use of Biota, Sediments and Water in Environmental Monitoring, 2nd ed.; CRC Press: London, UK, 2021. [Google Scholar]
  45. Ahmad, A.; Al-Ghouti, M.; Khraisheh, M.; Zouari, N. Hydrogeochemical characterization and quality evaluation of groundwater suitability for domestic and agricultural uses in the state of Qatar. Groundw. Sustain. Dev. 2020, 11, 100467. [Google Scholar] [CrossRef] [Scilit]
  46. Fryar, A.; Macko, S.; Mullican, W., III; Romanak, K.; Bennett, P. Nitrate reduction during ground-water recharge, Southern High Plains, Texas. J. Contam. Hydrol. 2000, 40, 335–363. [Google Scholar] [CrossRef] [Scilit]
  47. Ward, M.; Jones, R.; Brender, J.; De Kok, T.; Weyer, P.; Nolan, B.; Villanueva, C.; Van Breda, S. Drinking Water Nitrates and Human Health: An Updated Review. Int. J. Environ. Res. Public Health 2018, 15, 1557. [Google Scholar] [CrossRef] [Scilit]
  48. Mokeddem, K.; Ouddane, S. Physico-chemical and Bacteriological Quality of Water from Sidi Yaakoub Spring (Mostaganem). Undergraduate Dissertation, Institute of Biology, University of Mascara, Mascara, Algeria, 2005. [Google Scholar]
  49. Romdhane, S.; El Bour, M.; Hamza, A.; Akrout, F.; Kraiem, M.; Jacquet, S. Seasonal patterns of viral, microbial and planktonic communities in Sidi Salem: A freshwater reservoir (North of Tunisia). Ann. Limnol. Int. J. Limnol. 2014, 50, 299–314. [Google Scholar] [CrossRef] [Scilit]
  50. Boumerdassi, H.; Djouadi, L.N.; Hambli, A.; Fardeau, M.-L.; Ouzari, H.-I.; Nateche, F. Physicochemical and microbiological water quality assessment of a Northwestern Algerian dam: Detection of ichtyopathogenic bacteria. Pol. J. Microbiol. 2023, 72, 187–198. [Google Scholar] [CrossRef] [Scilit]
  51. Quevauviller, P. Quality Assurance for Water Analysis; John Wiley & Sons: New York, NY, USA, 2002. [Google Scholar]
  52. Vigiak, O.; Grizzetti, B.; Udias-Moinelo, A.; Zanni, M.; Dorati, C.; Bouraoui, F.; Pistocchi, A. Predicting biochemical oxygen demand in European freshwater bodies. Sci. Total Environ. 2019, 666, 1089–1105. [Google Scholar] [CrossRef] [Scilit]
  53. Cabral, J. Water microbiology. Bacterial pathogens and water. Int. J. Environ. Res. Public Health 2010, 7, 3657–3703. [Google Scholar] [CrossRef] [Scilit]
  54. John, D.; Rose, J. Review of factors affecting microbial survival in groundwater. Environ. Sci. Technol. 2005, 39, 7345–7356. [Google Scholar] [CrossRef] [Scilit]
  55. Prest, E.I.; Hammes, F.; van Loosdrecht, M.C.M.; Vrouwenvelder, J.S. Biological stability of drinking water: Controlling factors, methods, and challenges. Front. Microbiol. 2016, 7, 45. [Google Scholar] [CrossRef] [Scilit]
  56. Leyral, G.; Vierling, E. Microbiologie et Toxicologie des Aliments: Hygiène et Sécurité Alimentaires, 4th ed.; Doin Éditeurs: Paris, France, 2001. [Google Scholar]
  57. Vital, M.; Stucki, D.; Egli, T.; Hammes, F. Evaluating the growth potential of pathogenic bacteria in water. Appl. Environ. Microbiol. 2010, 76, 6477–6484. [Google Scholar] [CrossRef] [Scilit]
  58. Guiry, M. Taxonomy and nomenclature of the Conjugatophyceae (=Zygnematophyceae). Algae 2013, 28, 1–29. [Google Scholar] [CrossRef] [Scilit]
  59. Paerl, H.; Otten, T. Duelling ‘CyanoHABs’: Unravelling the environmental drivers controlling dominance and succession among diazotrophic and non-N2-fixing harmful cyanobacteria. Environ. Microbiol. 2016, 18, 316–324. [Google Scholar] [CrossRef] [Scilit]
  60. Paerl, H.; Otten, T. Harmful cyanobacterial blooms: Causes, consequences, and controls. Microb. Ecol. 2013, 65, 995–1010. [Google Scholar] [CrossRef] [Scilit] [PubMed]
  61. Whitton, B. (Ed.) Ecology of Cyanobacteria II: Their Diversity in Space and Time, 2nd ed.; Springer: Dordrecht, The Netherlands, 2012. [Google Scholar] [CrossRef] [Scilit]
  62. Harke, M.; Steffen, M.; Gobler, C.; Otten, T.; Wilhelm, S.; Wood, S.; Paerl, H. A review of the global ecology, genomics, and biogeography of the toxic cyanobacterium Microcystis spp. Harmful Algae 2016, 54, 4–20. [Google Scholar] [CrossRef] [Scilit] [PubMed]
  63. Barsanti, L.; Gualtieri, P. Algae: Anatomy, Biochemistry, and Biotechnology, 3rd ed.; CRC Press: Boca Raton, FL, USA, 2022. [Google Scholar]
  64. Coesel, P.; Meesters, K. Desmids of the Lowlands: Mesotaeniaceae and Desmidiaceae of the European Lowlands; KNNV Publishing: Zeist, The Netherlands, 2007. [Google Scholar]
  65. Wallace, R.; Snell, T.; Ricci, C.; Nogrady, T. Rotifera, Volume 1: Biology, Ecology and Systematics, 2nd ed.; Kenobi Productions; Backhuys Publishers: Kerkwerve, The Netherlands, 2006. [Google Scholar]
  66. Dumont, H.; Segers, H. Estimating lacustrine zooplankton species richness and complementarity. Hydrobiologia 1996, 341, 125–132. [Google Scholar] [CrossRef] [Scilit]
  67. Thorp, J.; Rogers, D. Thorp and Covich’s Freshwater Invertebrates: Ecology and General Biology, 4th ed.; Academic Press: London, UK, 2015. [Google Scholar]
  68. Li, R.; Xiao, K.; Zhao, G.; Huang, X.; Li, Z.; Wu, H.; Huang, X.; Pan, Y.; Liang, L. Comprehensive assessment of eutrophication and the mechanisms driving phytoplankton blooms in multifunctional reservoirs. Water 2024, 16, 1752. [Google Scholar] [CrossRef] [Scilit]
  69. Rivera, D.; Quintero, A.; Solano, A.; García-Martínez, J.; Martínez, F. Análisis de las aplicaciones de la microalga Botryococcus braunii. Cienc. Desarro. 2021, 12, 129–142. [Google Scholar] [CrossRef] [Scilit]
  70. Suresh, K.; Tang, T.; van Vliet, M.; Bierkens, M.; Strokal, M.; Sorger-Domenigg, F.; Wada, Y. Recent advancement in water quality indicators for eutrophication in global freshwater lakes. Environ. Res. Lett. 2023, 18, 063004. [Google Scholar] [CrossRef] [Scilit]
  71. Carmichael, W. A world overview: One-hundred-twenty-seven years of research on toxic cyanobacteria: Where do we go from here? In Cyanobacterial Harmful Algal Blooms: State of the Science and Research Needs; Advances in Experimental Medicine and Biology; Hudnell, H.K., Ed.; Springer: New York, NY, USA, 2008; Volume 619, pp. 105–125. [Google Scholar] [CrossRef] [Scilit]
  72. Jiang, X.; Li, Y.; Tang, X.; Jiang, J.; He, Q.; Xiong, Z.; Zheng, H. Biopolymer-based flocculants: A review of recent technologies. Environ. Sci. Pollut. Res. 2021, 28, 46934–46963. [Google Scholar] [CrossRef] [Scilit]
  73. Odian, G. Principles of Polymerization, 4th ed.; John Wiley & Sons: Hoboken, NJ, USA, 2004. [Google Scholar]
  74. Sheng, D.; Bilad, M.; Shamsuddin, N. Assessment and optimization of coagulation process in water treatment plant: A review. ASEAN J. Sci. Eng. 2023, 3, 79–100. [Google Scholar] [CrossRef] [Scilit]
  75. Liang, X.; Zhong, H.-J.; Ding, H.; Yu, B.; Ma, X.; Liu, X.; Chong, C.-M.; He, J. Polyvinyl Alcohol (PVA)-Based Hydrogels: Recent Progress in Fabrication, Properties, and Multifunctional Applications. Polymers 2024, 16, 2755. [Google Scholar] [CrossRef] [Scilit]
  76. Zhang, H.; Liu, D.; Zhao, L.; Wang, J.; Xie, S.; Liu, S.; Lin, P.; Zhang, X.; Chen, C. Review on corrosion and corrosion scale formation upon unlined cast iron pipes in drinking water distribution systems. J. Environ. Sci. 2022, 117, 173–189. [Google Scholar] [CrossRef] [Scilit]
  77. Belachqer-El Attar, S.; Soriano-Molina, P.; París-Reche, A.; Jambrina-Hernández, E.; Plaza-Bolaños, P.; Agüera, A.; Pérez, J. Phenomenological insights into the occurrence and abatement of disinfection by-products in the novel solar chlor-photo-Fenton process. J. Hazard. Mater. 2025, 491, 138019. [Google Scholar] [CrossRef] [Scilit]
  78. Kolya, H.; Kang, C.-W. Bio-based polymeric flocculants and adsorbents for wastewater treatment. Sustainability 2023, 15, 9844. [Google Scholar] [CrossRef] [Scilit]
  79. Temesgen, G.; Lelago, A.; Assefa, E.; Admasie, A. Evaluation of chlorination efficiency on improving microbiological and physicochemical parameters in water samples available in Sheble Berenta district, Amhara region, Ethiopia. Appl. Water Sci. 2023, 13, 120. [Google Scholar] [CrossRef] [Scilit]
  80. Rosendo-González, V.; Gutiérrez-Segura, E.; Solache-Rios, M.; Amaya-Chavez, A. Polymeric hydrogels for the removal of fluoride ions from natural water and its toxicity. Desalin. Water Treat. 2025, 321, 100974. [Google Scholar] [CrossRef] [Scilit]
  81. Ghernaout, D.; Elboughdiri, N.; Ghernaout, B.; Ashraf, G.; Benaissa, M. Virus removal by iron coagulation processes. Green Sustain. Chem. 2023, 13, 171–208. [Google Scholar] [CrossRef]
  82. Bertocchi, C.; Navarini, L.; Cesàro, A.; Anastasio, M. Polysaccharides from cyanobacteria. Carbohydr. Polym. 1990, 12, 127–153. [Google Scholar] [CrossRef] [Scilit]
  83. Lee, C.; Robinson, J.; Chong, M. A review on application of flocculants in wastewater treatment. Process Saf. Environ. Prot. 2014, 92, 489–508. [Google Scholar] [CrossRef] [Scilit]
  84. Huang, L.; Luo, Z.; Huang, X.; Wang, Y.; Yan, J.; Liu, W.; Guo, Y.; Arulmani, S.; Shao, M.; Zhang, H. Applications of biomass-based materials to remove fluoride from wastewater: A review. Chemosphere 2022, 301, 134679. [Google Scholar] [CrossRef] [Scilit]
  85. Mensah Akkutteh, H.; Wiafe, S. Optimizing coagulation efficiency in surface water treatment using response surface method. J. Environ. Sci. Health A 2025, 60, 306–321. [Google Scholar] [CrossRef] [Scilit]
  86. Lapointe, M.; Barbeau, B. Understanding the roles and characterizing the intrinsic properties of synthetic vs. natural polymers to improve clarification through interparticle bridging: A review. Sep. Purif. Technol. 2020, 231, 115893. [Google Scholar] [CrossRef] [Scilit]
Figure 1. Microscopic observation of phytoplankton identified at Site 1 (Joumine Dam inlet): (1). Crucigenia tetrapedia (2). Euglena ehrenbergii var. africana, (3). Oscillatoria coprophila, and (4). Botryococcus braunii. Magnification: ×400.
Water 18 02103 g001
Figure 2. Microscopic observation of green algae identified at Site 2 (surface layer): (1). Dictyosphaerium pulchellum and (2). Volvox aureus. Magnification: ×400.
Water 18 02103 g002
Figure 3. Microscopic observation of green algae identified at Site 3 (depth: 3–10 m): (1). Spirogyra sp. and (2). Closterium aciculare. Magnification: ×400.
Water 18 02103 g003
Figure 4. Microscopic observation of microorganisms identified at Site 4 (depth: 20 m): (1). Ulothrix sp. and (2). Keratella quadrata. Magnification: ×400.
Water 18 02103 g004
Figure 5. Microscopic observation of algae identified at Site 5 (depth: 30 m): (1). Cocconeis placentula and (2). Oocystis sp. Magnification: ×400.
Water 18 02103 g005
Figure 6. Microscopic observation of green algae identified at Site 6 (Joumine Dam margin): (1). Selenastrum gracile and (2). Botryococcus braunii. Magnification: ×400.
Water 18 02103 g006
Figure 7. Degree of hydrolysis measured in commercial PVA-4-88 (A) and PVA-co-PVAc (B).
Water 18 02103 g007
Figure 8. Removal (percentage reduction in concentration) of the main water-quality parameters after treatment with PVA-co-PVAc. Bars displayed in the same color represent results that are not statistically different (Tukey’s post-hoc test, α = 0.05, after one-way ANOVA, p < 0.01) for each parameter.
Water 18 02103 g008
Figure 9. Examples of microscopic observation of water samples collected from the inlet of Joumine Dam (Site 1) after treatment with increasing doses of PVA-co-PVAc.
Water 18 02103 g009aWater 18 02103 g009b
Table 1. Sampling sites and characteristics of water samples collected from the Joumine reservoir.
SampleSite DescriptionLocation Within ReservoirDepth (m)Sampling Environment
Site 1Dam inletOpen water0Inflow water
Site 2Central reservoirOpen water0Surface water
Site 3Central reservoirOpen water10Subsurface
Site 4Central reservoirOpen water20Deep water
Site 5Central reservoirOpen water30Bottom water
Site 6Reservoir shorelineLittoral zone0Near-shore water
Table 2. Physicochemical analysis of untreated water from the Joumine Dam in reference to Tunisian standard NT 09.14 [34].
ParametersLimit of
Quantification
Site 1Site 2Site 3Site 4Site 5Site 6Legal or
Recommended Limit
pH-7.75 ± 0.08 a7.76 ± 0.03 a7.80 ± 0.03 a8.02 ± 0.04 b8.09 ± 0.05 b8.01 ± 0.07 b6.5–8.5
Turbidity (NTU)0.111.5 ± 0.2 a3.76 ± 0.20 b3.85 ± 0.05 bc4.05 ± 0.04 cd4.27 ± 0.02 d3.92 ± 0.04 bc≤3
Salinity (mg/L)10400 ± 2 a394 ± 11 a400 ± 3 a400 ± 3 a397 ± 7 a396 ± 8 a≤2500
Total alkalinity (mg/L)5181.04 ± 0.04 a183.87 ± 0.07 b161.0 ± 0.5 c167.53 ± 0.06 d170.45 ± 0.05 e167 ± 1 d100–300
Calcium hardness (mg/L)584.6 ± 0.1 a84.16 ± 0.03 b79.75 ± 0.04 c77.55 ± 0.07 d77.35 ± 0.04 d78.15 ± 0.03 e≤300
Magnesium hardness (mg/L as CaCO3519.68 ± 0.04 a20.41 ± 0.05 b17.25 ± 0.05 c16.76 ± 0.04 d14.33 ± 0.05 e20.16 ± 0.06 f≤150
Total hardness
(F°)
129.86 ± 0.03 a29.4 ± 0.02 b26.80 ± 0.03 c26.5 ± 0.3 c32.6 ± 0.3 d25.42 ± 0.07 e≤100
Chloride (mg/L)536.56 ± 0.07 a34.57 ± 0.06 b34.79 ± 0.03 c35.64 ± 0.05 d35.64 ± 0.04 d33.93 ± 0.04 e≤300
Nitrite (mg/L)0.010.007 ± 0.001 a0.094 ± 0.003 b0.092 ± 0.003 c0.141 ± 0.004 c0.185 ± 0.003 d0.081 ± 0.004 e≤0.2
Nitrate (mg/L)0.111.87 ± 0.04 a11.05 ± 0.04 b11.33 ± 0.06 c11.73 ± 0.05 d13.03 ± 0.04 e10.58 ± 0.03 f≤45
Fluoride (mg/L)0.12.03 ± 0.02 a0.64 ± 0.04 b0.63 ± 0.04 b0.63 ± 0.03 b0.63 ± 0.04 b0.58 ± 0.04 b≤1.5
Sulfate (mg/L)5189.13 ± 0.05 a116.89 ± 0.06 b122.45 ± 0.03 c132.1 ± 0.6 d137.26 ± 0.07 e132.32 ± 0.08 f≤600
Dry residue (mg/L)10642 ± 3 a406 ± 4 b404 ± 5 b430 ± 2 c564 ± 4 d576 ± 3 e2500
BOD5
(mg O2/L)
212.28 ± 0.03 a7.74 ± 0.04 b8.13 ± 0.04 c8.20 ± 0.03 c9.44 ± 0.04 d6.43 ± 0.04 e5
Notes: Values represent mean ± standard deviation of three analytical determinations (technical replicates) performed on water samples collected during a single campaign (n = 3). Values with different superscript letters within the same row are significantly different according to Tukey’s post hoc test following one-way ANOVA (α = 0.05, p < 0.05).
Table 3. Bacteriological profile of raw water samples from selected locations in reference to national standard NT 09.14 [34].
BacteriologicalSite 1Site 2Site 3Site 4Site 5Site 6Tunisian Standards for Drinking
Water (NT 09.14)
Total coliforms (100 mL)DDDDDDNot detected
Fecal coliforms (100 mL)DDDDDDNot detected
Escherichia coli (100 mL)DNDNDDDNDNot detected
Total viable bacteria at 37 °C (100 mL)180608012018050≤103 CFU/100 mL
Fecal enterococci (100 mL)205810152Not detected
Sulfite-reducing anaerobic bacteria (SRB) (100 mL)DDDDDDNot detected
Note: D = Detected; ND = Not detected.
Table 4. Quantification of microbial load at various sampling sites.
Sampling LocationCell Count per µL
Site 1: Inflow point of the Joumine Dam39
Site 2: Surface water at 0 m depth11
Site 3: Water sampled at 10 m depth8
Site 4: Water sampled at 20 m depth6
Site 5: Water sampled at 30 m depth3
Site 6: Surface water near the dam20
Table 5. Changes in physicochemical parameters of Joumine Dam water after polymer-based treatment.
ParameterSite 10.1% PVA-Co-PVAc0.2% PVA-Co-PVAc0.5% PVA-Co-PVAc1% PVA-Co-PVAcLimit or
Recommended Range [34]
Units
Before TreatmentPost Treatment
pH7.757.98 ± 0.03 a8.0 ± 0.5 a8.26 ± 0.03 a8.35 ± 0.03 a6.5–8.5-
Turbidity11.54.40 ± 0.03 a4.0 ± 0.5 a3.6 ± 0.2 a2.5 ± 0.2 b≤3NTU
Salinity400430 ± 2 a450 ± 2 b480 ± 2 c500 ± 5 d≤2500mg/L
Total alkalinity (TAC)18.1015.32 ± 0.03 a16.01 ± 0.03 b16.84 ± 0.03 c17.34 ± 0.04 d10–30°F
Calcium hardness84.56100.02 ± 0.04 a108.45 ± 0.03 b110.94 ± 0.04 c117 ± 1 d≤300mg/L
Magnesium hardness19.687.55 ± 0.03 a6.88 ± 0.03 b4.84 ± 0.03 c3.64 ± 0.03 d≤150mg/L as CaCO3
Total hardness29.8629.5 ± 0.3 a29.06 ± 0.003 b27.68 ± 0.03 c27.04 ± 0.06 d≤100°F
Chloride (Cl)36.5636.5 ± 0.2 a36.31 ± 0.03 ab36.28 ± 0.04 ab35.5 ± 0.6 b≤300mg/L
Nitrite (NO2)0.0070.0651 ± 0.0003 a0.0622 ± 0.002 b0.0270 ± 0.00003c0.00374 ± 0.00002 d≤0.2mg/L
Nitrate (NO3)11.87110.356 ± 0.003 a10.001 ± 0.004 b9.344 ± 0.004 c8.695 ± 0.05 d≤45mg/L
Fluoride
(F)
2.031.8 ± 0.1 a0.9 ± 0.1 b0.55 ± 0.03 c<0.1≤1.5mg/L
Sulfate (SO42−)189.13105.24 ± 0.03 a98.02 ± 0.03 b45.78 ± 0.04 c20.01 ± 0.06 d≤600mg/L
Dry residue
(TDS)
6421100 ± 56 a1238 ± 5 b1514 ± 3 c1838 ± 3 d2500mg/L
Organic matter (BOD5)12.284.01 ± 0.03 a3.8 ± 0.2 a3.14 ± 0.03 b3.04 ± 0.04 b5.0mg O2/L
Notes: Values represent means ± standard deviations of three independent experimental batch runs (n = 3). Values with different superscript letters within the same row are significantly different according to Tukey’s post hoc test following one-way ANOVA (α = 0.05, p < 0.05).
Table 6. Microbial counts in water samples before and after treatment.
TreatmentMicrobial Count (*)% Reduction (#)
Before treatment39 ± 2 a-
0.1% PVA-co-PVAc30 ± 2 b23 ± 3 a
0.2% PVA-co-PVAc26 ± 2 b33 ± 2 b
0.5% PVA-co-PVAc13 ± 2 c67 ± 9 c
1.0% PVA-co-PVAc3 ± 1 d93 ± 5 d
Notes: (*) ± standard deviation, n = 3; (#) ± uncertainty, estimated at a confidence level of 95%. Values with different superscript letters are significantly different according to Tukey’s post hoc test (α = 0.05, 95% confidence level) after one-way ANOVA, p < 0.01.
Table 7. Comparison of representative polymer-based materials for water treatment reported in the literature and the synthesized PVA-co-PVAc investigated in the present study.
Polymer/MaterialTarget
Contaminant(s)
DosageRemoval
Efficiency
Operating ConditionsLimitationsReference
Polyacrylamide (PAM)Turbidity, suspended solids, and organic matterTypically, 0.5–10 mg/LTurbidity removal generally >90%Batch coagulation/flocculation; optimum pH depends on water qualityNon-biodegradable; residual acrylamide concerns[83]
Functionalized PVA-based polymerFluoride and organic pollutants1–10 g/L (depending on formulation)Fluoride removal typically >90%Batch adsorption/flocculation; neutral pHEfficiency depends on contact time and competing ions[84]
Polymeric hydrogel (PVA/PVP-Fe)FluorideBatch (optimized experimentally)Reduced fluoride from 5.0 to <1.5 mg/LBatch and column systemsLong equilibrium time; regeneration not fully evaluated[80]
PVA-CO-PVAc (This study)Turbidity, fluoride, organic matter, and microbial load1% (w/v) = 10 g/LTurbidity: 11.5 → 2.5 NTU; fluoride: 2.03 → < 0.1 mg/L; BOD5 reduced to within Tunisian drinking water standards; 93% reduction in total microscopic cell densityBatch treatment of 1 L of raw reservoir waterHigher required dosage relative to commercial PAM; residual polymer concentration and reusability were not evaluatedThis study
Disclaimer/Publisher’s Note: The statements, opinions and data contained in all publications are solely those of the individual author(s) and contributor(s) and not of MDPI and/or the editor(s). MDPI and/or the editor(s) disclaim responsibility for any injury to people or property resulting from any ideas, methods, instructions or products referred to in the content.