Article

A Multi-Product Robustness Audit of Long-Term Soil-Moisture Trends on the Chinese Loess Plateau

1
State Key Laboratory of Soil and Water Conservation and Desertification Control, College of Soil and Water Conservation Science and Engineering, Northwest A&F University, Yangling 712100, China
2
Institute of Soil and Water Conservation, Chinese Academy of Sciences and Ministry of Water Resources, Yangling 712100, China
*
Author to whom correspondence should be addressed.
Water 2026, 18(17), 2104; https://doi.org/10.3390/w18172104
Submission received: 31 July 2026 / Revised: 21 August 2026 / Accepted: 24 August 2026 / Published: 26 August 2026
(This article belongs to the Special Issue Research on Soil Moisture and Irrigation, 2nd Edition)

Abstract

Long-term soil-moisture trends on the Chinese Loess Plateau are inferred from gridded products, but product choice can alter whether change is read as drying or wetting. We audited trends from the Global Land Data Assimilation System (GLDAS), ECMWF Reanalysis v5 Land (ERA5-Land), Soil Moisture of China by in situ data (SMCI), and Global Land Evaporation Amsterdam Model root-zone soil moisture (GLEAM SMrz) for 2001–2022, with an endpoint-extension test to 2025. We compared product-specific trends, spatial agreement, core-product medians, product-set bridge and leave-one-out sensitivities, and associations with precipitation, vapor pressure deficit, forest–shrub–grass cover change, and a potential-storage proxy. The core products shared substantial detrended interannual variability, yet their regional trend point estimates did not converge in sign. GLDAS gave a positive regional Sen-slope estimate, whereas ERA5-Land, SMCI, and GLEAM SMrz gave negative estimates. The core-product median was negative over 72.7% of the study area, but unanimous decline occurred over only 24.9%, and 63.5% showed mixed product signs. Only 36.9% of the area retained direction across all five robustness checks, and no environmental variable achieved repeatable same-direction support across all core products. Hydrologically, these results indicate that apparent Loess Plateau wetting or drying should be interpreted as product-dependent evidence of soil-water availability rather than as a universally robust soil-moisture trend or direct environmental response.

1. Introduction

Soil moisture is a fundamental state variable in terrestrial hydrology, linking water, energy, and carbon cycles across the land–atmosphere boundary [1]. On the Chinese Loess Plateau, a water-limited region characterized by deep loess deposits and a long history of severe soil erosion, soil moisture directly constrains vegetation growth, agricultural productivity, and the sustainability of large-scale ecological restoration programs [2,3]. Root-zone soil moisture, in particular, represents the principal water source for plant transpiration and exerts a strong control on ecosystem carbon uptake, surface-energy partitioning, and the formation of persistent dry soil layers [4,5,6]. Consequently, obtaining reliable information on long-term soil-moisture and root-zone soil-moisture change is essential for assessing the effectiveness of the Grain for Green revegetation initiative, diagnosing emerging water-resource pressures, and understanding the evolving land–atmosphere feedbacks that shape regional climate [7].
However, regional assessments of long-term soil-moisture trends rely almost exclusively on gridded products—satellite-retrieved, reanalysis-based, land-surface-model (LSM) simulations, or blended datasets—because spatially distributed in situ observations with adequate temporal depth remain scarce across the plateau [8,9,10]. These products differ in their land-surface model physics, soil-layer configurations, meteorological forcing, data-assimilation procedures, parameterization schemes, and representations of vegetation and surface heterogeneity [11,12,13,14]. These structural and input-data differences can give rise to diverging representations of soil moisture at interannual to multi-decadal scales, and several global and regional inter-comparisons have demonstrated that trend magnitude, sign, and spatial pattern can vary markedly among products [15]. On the Loess Plateau specifically, evidence from both in situ profiles and gridded products shows that vegetation restoration has been accompanied by soil moisture decline in many locations, yet the magnitude, depth distribution, and even the sign of change remain actively debated, with some analyses suggesting wetting trends under changing precipitation regimes [16,17]. Because no single product offers a universally accepted truth, the scientific community increasingly urges that multiple soil-moisture products be analyzed jointly and their disagreements made explicit before trend conclusions are drawn [18,19,20,21].
Despite this recognition, many Loess Plateau assessments have relied on a single soil-moisture product or data source to infer restoration-related soil-water change [16,17], whereas broader multi-product studies commonly show product disagreement through intercomparisons, ensemble behavior, or large-scale trend summaries [18,19,20]. Such summaries can obscure four distinctions that are central to trend interpretation. Interannual coherence does not establish long-term trend robustness. A monotonic trend estimate does not show whether products share a common nonlinear trajectory or breakpoint structure. Extending a fixed record endpoint does not test sensitivity to product-set composition. Environmental association does not provide causal attribution unless it is repeatable across products and evaluated against potential source dependence. Without these distinctions, it remains unclear whether an inferred soil-moisture trend or soil-moisture–environment relationship reflects a shared regional signal or a product-dependent result.
Here, we use the Chinese Loess Plateau to test whether long-term soil-moisture trend interpretation remains robust across products, temporal trend formulations, record endpoints, product-set perturbations, and environmental-association analyses. We ask whether shared interannual variability translates into common trend direction, whether monotonic Sen slopes conceal nonlinear or breakpoint behavior, whether endpoint extension has the same effect as changing product composition, and whether environmental associations persist across products after source-exclusion checks. This framework audits product-specific trends, temporal trend-form robustness, ensemble structure, endpoint and product-set sensitivity, and environmental-association repeatability, without ranking product accuracy or attributing causal drivers.

2. Materials and Methods

2.1. Study Area

The study was conducted over the Chinese Loess Plateau, a large semi-arid to sub-humid region in north-central China that forms a major part of the middle reaches of the Yellow River basin. The plateau is underlain by thick, highly permeable loess deposits and has strong topographic gradients, pronounced spatial heterogeneity in water availability, and a marked west-to-east precipitation gradient of approximately 200–650 mm yr−1 [22,23]. Most precipitation falls during the summer monsoon season, while the long dry season increases the importance of stored soil water for vegetation growth. Since the late 1990s, intensive vegetation restoration under the Grain for Green program has substantially altered land cover across the region, and deep-rooted revegetation has been associated with sub-surface water depletion in many locations. These combined characteristics make the region a suitable natural laboratory for assessing whether long-term soil-moisture trends inferred from gridded products are spatially coherent and robust to product choice.

2.2. Datasets

2.2.1. Soil-Moisture Products and Analytical Roles

Four gridded soil-moisture products were harmonized and assigned analytical roles before analysis. GLDAS, ERA5-Land, and SMCI formed the core product group, whereas GLEAM SMrz was retained as an alternative root-zone sensitivity product rather than a fourth equal core vote. GLDAS and ERA5-Land were used to represent 0–100 cm soil moisture. GLDAS-2.1 Noah three-hourly soil-water layers from Google Earth Engine collection NASA/GLDAS/V021/NOAH/G025/T3H were averaged by calendar year; the 0–10, 10–40, and 40–100 cm layers were summed to obtain a 0–100 cm soil-water column in kg m−2, numerically equivalent to mm of water [24,25,26]. ERA5-Land monthly aggregated data from ECMWF/ERA5_LAND/MONTHLY_AGGR were used to calculate a 0–100 cm thickness-weighted mean of volumetric soil water from the first three layers, with layer thicknesses of 0.07, 0.21, and 0.72 m [26,27]. SMCI was treated as a 10–100 cm profile composite derived from the 10, 20, …, 100 cm depth-point series [28]. For a valid daily profile, the trapezoidal mean was
X g t SMCI = 5 X g t , 10 + 10 d = 20 , 30 , , 90 X g t , d + 5 X g t , 100 90 .
GLEAM v4.3a SMrz was used as a model-defined root-zone soil-moisture product [29,30,31].
The products were not treated as physically interchangeable or as strictly identical-depth measurements. GLDAS and ERA5-Land both represent fixed upper-1-m soil profiles, whereas the SMCI composite represents 10–100 cm and therefore does not include the uppermost 0–10 cm represented by GLDAS and ERA5-Land. GLDAS, ERA5-Land, and SMCI formed the core group for the main 2001–2022 trend comparison, the core-product median trend, the directional-composition analysis, the inter-product median absolute deviation, and the leave-one-out tests because they provide substantially overlapping upper-profile soil-moisture information. The primary comparison was conducted on locally standardized annual anomalies and therefore evaluates cross-product robustness in trend direction and spatial pattern rather than equivalence in absolute water-storage magnitude, vertical support, native units, model formulation, or product accuracy. GLEAM SMrz represents a model-defined root-zone soil-moisture state rather than a fixed-depth 0–100 cm profile. It was retained as an alternative root-zone sensitivity product, as a member of the fixed endpoint-extension group, and as a separate response in the environmental-association analysis, but not as a fourth equal vote in the core group. Comparisons involving GLEAM therefore do not isolate root-zone definition alone, because GLEAM also differs from the core products in formulation, forcing, temporal processing, and source-data availability.

2.2.2. Environmental, Boundary, and Cartographic Data

Google Earth Engine was used to access and export the GLDAS, ERA5-Land, CHIRPS, TerraClimate, and SRTM raster products before local harmonization and statistical analysis [26]. Product-specific citations were retained for each source dataset. Private Earth Engine assets containing the study boundary were used only to clip exported rasters and are not cited as public data sources. Non-GEE data, including GLEAM SMrz, SMCI, CLCD, S CWDX 80 , the Loess Plateau boundary, and the provincial boundary, were cited only through their original data providers or publications.
Four environmental predictors were used to examine whether spatial associations with soil-moisture trends were repeatable across products. Precipitation was represented by the Sen slope of CHIRPS Daily Version 2.0 Final annual precipitation totals during 2001–2022, in mm decade−1, using the exported band P_annual_sum from UCSB-CHG/CHIRPS/DAILY [26,32]. Atmospheric water demand was represented by the Sen slope of TerraClimate annual mean vapor pressure deficit (VPD) during 2001–2022, in kPa decade−1, using IDAHO_EPSCOR/TERRACLIMATE; the GEE export scaled the source vpd band by 0.01 to kPa [26,33]. Land-cover change was represented by the change in the combined forest, shrub, and grass cover fraction from CLCD between 2001 and 2020 [34,35],
100 [ F S G 2020 F S G 2001 ] ,
reported in percentage points. Potential subsurface water-storage background was represented by global rooting-zone water-storage capacity, S CWDX 80 (source variable cwdx80, mm). The predictor used in the association and joint-model analyses was log ( 1 + S CWDX 80 / 1 mm ) , treated here as a modeled potential-storage proxy rather than an observed rooting-depth or observed soil-water-capacity variable [36,37].
The full source-data inventory, including native resolution, analysis period, and analytical role, is summarized in Table 1.
The product-group definitions and sensitivity checks used in the multi-product audit are summarized in Table 2.

2.2.3. Analysis Periods, Valid Domains, and Data Quality Control

The main analysis period was 2001–2022, using January–December calendar-year aggregation. A nested endpoint-extension analysis was conducted for 2001–2025 using the fixed extension group GLDAS, ERA5-Land, and GLEAM SMrz. This extension group was selected because those products supported the longer comparison under a common product composition. The endpoint-extension workflow retained the same 1178-cell analysis domain after confirming finite annual values for GLDAS, ERA5-Land, and GLEAM SMrz through 2025 under the product-specific annual aggregation rules. The 2001–2025 comparison is therefore an endpoint-extension sensitivity test within a fixed available product set, not an independent temporal validation. Land-cover change was evaluated over 2001–2020. The primary fixed soil-moisture comparison domain contained 1178 target grid cells and represented 649,260.5 km2 after boundary-area weighting. The precipitation and land-cover analyses used the full 1178-cell domain. The VPD analysis used 1164 valid cells, corresponding to 643,852.2 km2, and the potential-storage proxy analysis used 1135 cells, corresponding to 626,504.5 km2. The complete joint-model domain contained 1122 cells and covered 621,706.3 km2.
Product-specific quality control and temporal harmonization were applied before trend estimation. Implementation details are provided in the Supplementary Materials under “Technical Preprocessing and Quality-Control Procedures.” These include missing-value handling, daily and annual validity thresholds, time-coordinate corrections, product-specific temporal aggregation, spatial preprocessing, and unused auxiliary exports.
Table 1. Main datasets used in the manuscript. Native resolution refers to each source dataset before aggregation to the common target grid; citations are listed with dataset names.
Dataset/SourceVariable UsedNative ResolutionPeriodAnalytical Role
Loess Plateau boundary [38]Study maskVector boundaryStaticStudy extent, clipping, and boundary-overlap weights
China provincial boundary [39]Provincial linesVector boundary2022Figure 1 cartographic reference only
Global Land Data Assimilation System (GLDAS)-2.1 Noah [24,25,26]Fixed-depth 0–100 cm soil-water column 0.25° 2001–2025Core product; fixed endpoint-extension product
ECMWF Reanalysis v5 Land (ERA5-Land) [26,27]Fixed-depth 0–100 cm thickness-weighted volumetric soil water0.1° GEE export2001–2025Core product; fixed endpoint-extension product
Soil Moisture of China by in situ data (SMCI) [28]10–100 cm profile composite with overlapping but non-identical vertical support0.1° local archive2001–2022Core product; not used in 2001–2025 endpoint extension
Global Land Evaporation Amsterdam Model (GLEAM) v4.3a SMrz [29,30,31]Model-defined root-zone soil-moisture state, not a fixed-depth 0–100 cm profile 0.1° 2001–2025Alternative root-zone sensitivity product; not a fourth equal core vote; fixed endpoint-extension product; separate environmental response
CHIRPS Daily v2.0 Final [26,32]Annual precipitation total 0.05° 2001–2022Precipitation-trend predictor for 2001–2022 associations
TerraClimate [26,33]Annual mean VPD 1/24° 2001–2022Atmospheric-demand predictor for 2001–2022 associations
CLCD [34,35]Forest–shrub–grass fraction30 m2001, 2020Land-cover-change predictor
S CWDX 80 potential-storage proxy [36,37]Log-transformed potential-storage proxy0.05° NetCDFStaticModeled storage-capacity background predictor
SRTM DEM [26,40,41]Elevation shading1 arc-secondStaticFigure 1 topographic background only; excluded from statistical analyses
Table 2. Analytical roles of product groups and sensitivity checks.
Analysis ComponentProduct SetPurpose
Core comparisonGLDAS, ERA5-Land, SMCIMain 2001–2022 standardized trend audit using products with substantially overlapping but non-identical upper-profile vertical support
GLEAM sensitivity layerGLEAM SMrzAlternative model-defined root-zone response; used separately rather than as a fourth vote in the core ensemble
Supplementary sensitivity and diagnostic checksGLDAS, ERA5-Land, SMCI, and GLEAM SMrz; environmental predictors where applicableCommon-depth storage, seasonal aggregation, processing-choice, temporal-structure, hydroclimatic-dryness, and monthly error-dependence checks used to test whether product dependence was tied to analysis choices or source dependence
Endpoint and product-set robustness checksFixed extension set; core median; core leave-one-out subsetsFixed endpoint extension, core-to-extension product-set bridge, and core-product leave-one-out comparisons used to separate record-endpoint and product-composition sensitivity
Environmental-association auditProduct-specific soil-moisture trends and four environmental predictorsTest of whether spatial associations are repeatable across products after analysis-specified source-exclusion rules
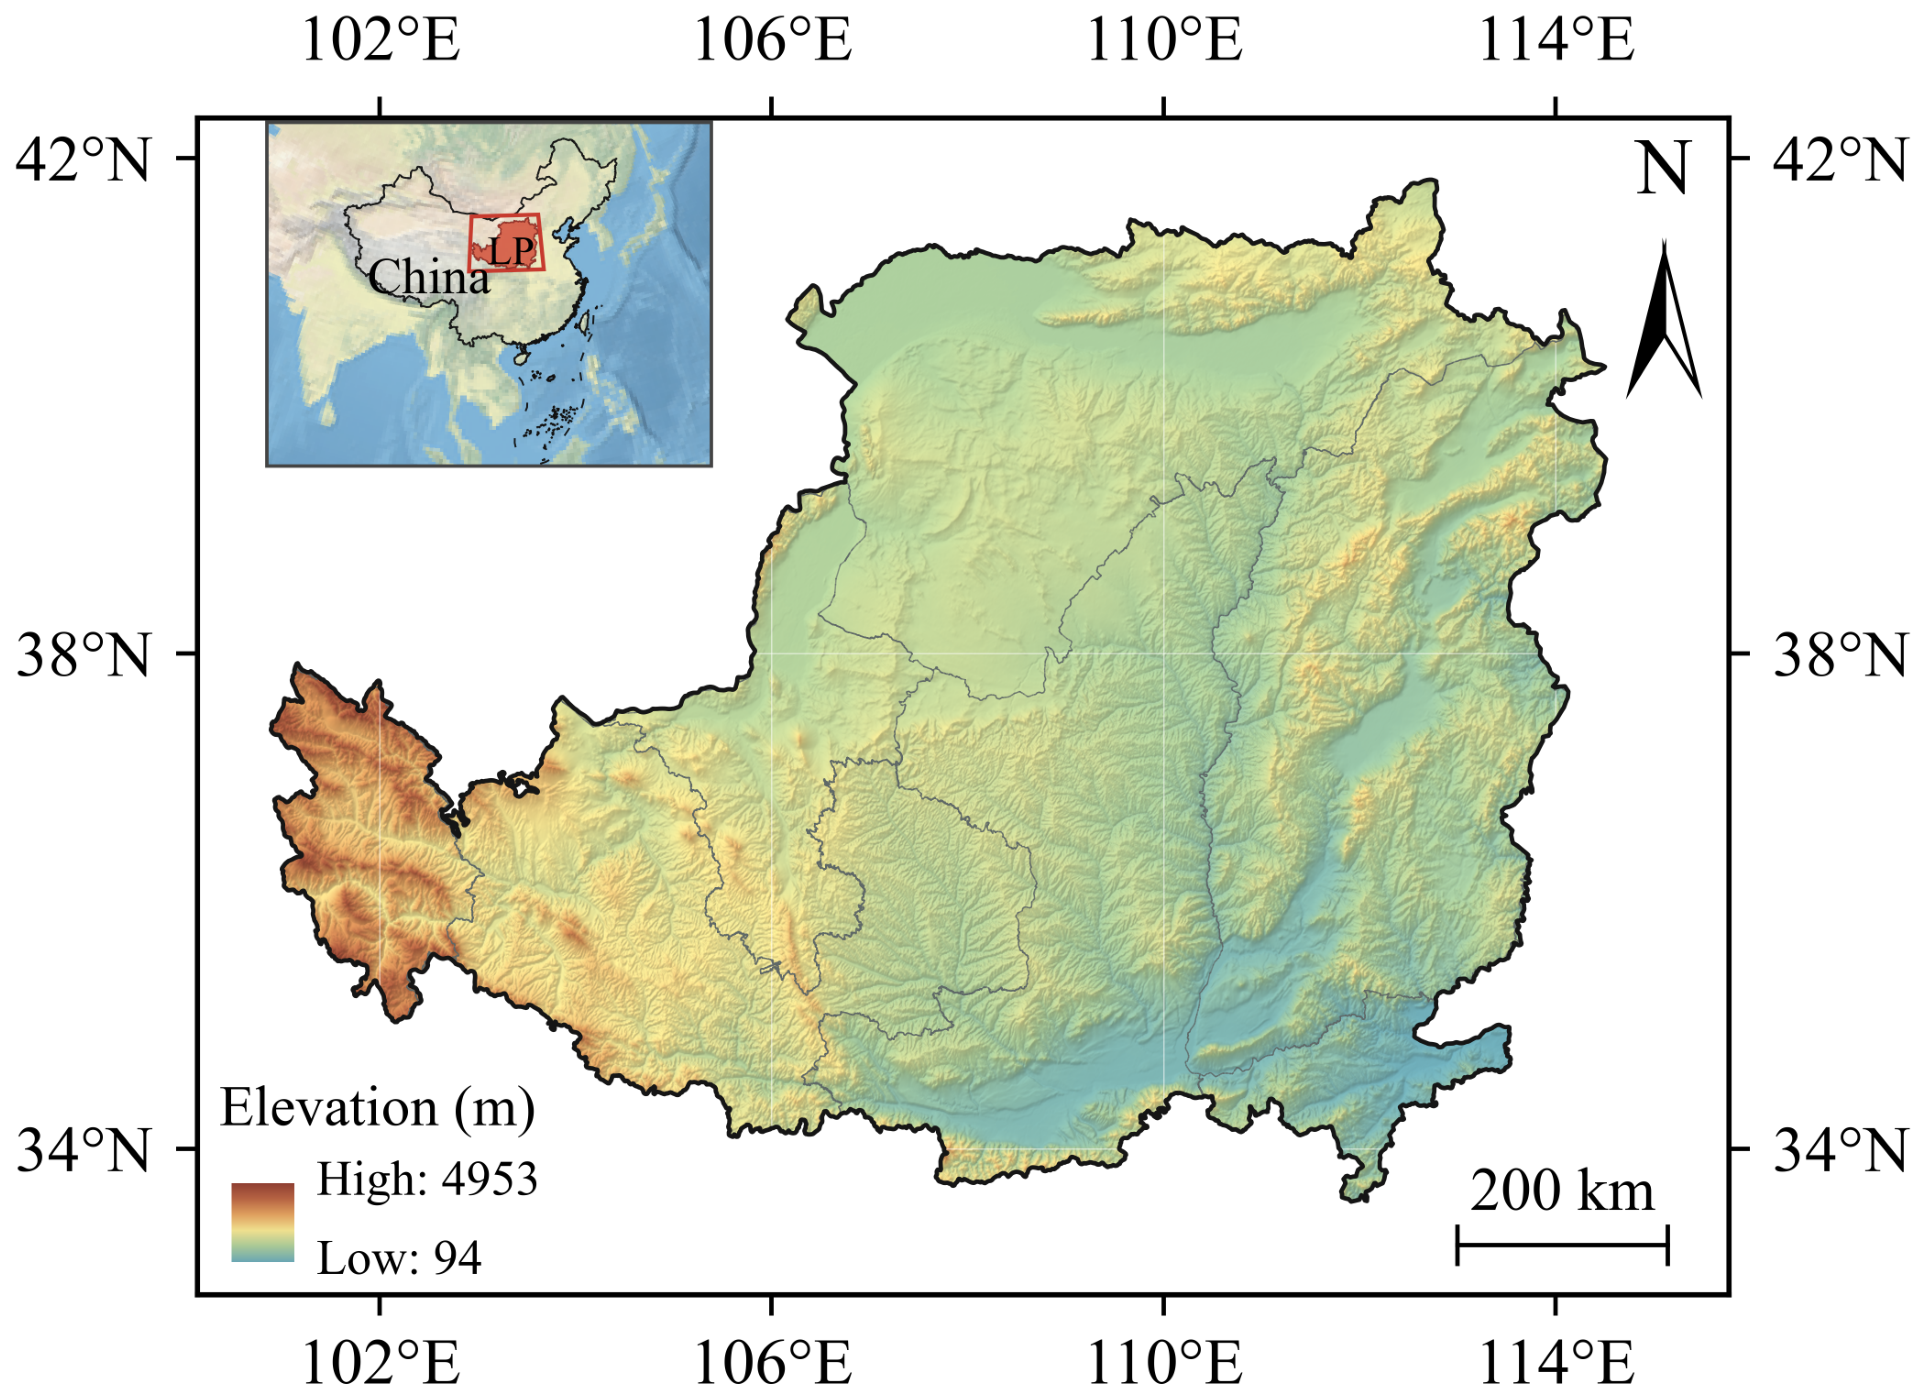
Figure 1. Study area and topographic setting of the Chinese Loess Plateau. The study boundary is overlaid on SRTM elevation shading; internal lines show provincial boundaries, and the inset locates the plateau within China. Elevation is in meters.
Water 18 02104 g001

2.3. Methodology

2.3.1. Analytical Design

All analyses were conducted on a common gridded framework with fixed boundary-area weights. The workflow was designed to separate four questions. First, we quantified product-specific and cross-product agreement in regional annual variability, grid-cell trends, and pairwise spatial patterns. Second, we used predefined sensitivity and diagnostic checks to test whether the main interpretation depended on product definition, temporal aggregation, preprocessing choices, temporal trend form, source dependence, endpoint selection, or product-set composition. Third, we examined ensemble structure and direction retention across the selected robustness checks. Fourth, we tested whether associations between soil-moisture trends and environmental variables were repeatable across products after analysis-specified source-exclusion rules and joint-model diagnostics. The product roles and sensitivity checks are summarized in Table 2. The analysis was therefore a multi-product robustness audit, not a ranking of product accuracy and not a causal attribution framework (Figure 2).

2.3.2. Spatial Framework and Grid-Cell Area Weighting

To ensure spatially consistent area summaries across gridded products with different native projections and resolutions, we defined a fixed spatial framework and grid-cell weighting scheme using the boundary and grid sources listed in Table 1. Products and predictors were harmonized to a common GLDAS-derived 0.25° longitude–latitude target grid before area-weighted analysis. Boundary repair, projection handling, source-overlap rules, and land-cover aggregation details are provided in the Supplementary Materials.
For each target grid cell g, the boundary-overlap fraction was calculated as f g = A Alb ( G g B ) / A Alb ( G g ) , where G g is the full target cell and B is the repaired study boundary. The analysis weight was then defined as w g = f g A g geod , where A g geod is the WGS84 geodesic area of the full longitude–latitude target cell. These geodesically scaled boundary-overlap weights were applied uniformly across all subsequent computations, including regional means, area percentages, spatial correlations, bootstrap summaries, and weighted model fitting.

2.3.3. Spatial Harmonization and Annual Standardization

All gridded products and environmental predictors were evaluated on the common target grid after product-specific spatial harmonization. Annual soil-moisture, precipitation, VPD, land-cover-change, and potential-storage variables were then prepared for trend and association analyses. Detailed regridding, valid-overlap, temporal-aggregation, and auxiliary-variable construction rules are provided in the Supplementary Materials under “Technical Preprocessing and Quality-Control Procedures.”
For each grid cell g, product p, and year t, the annual soil-moisture value X g p t was converted to a local standardized anomaly,
Z g p t = X g p t X ¯ g p s g p ,
where X ¯ g p and s g p are the grid-cell- and product-specific sample mean and sample standard deviation over 2001–2022. Grid cells with incomplete standardized sequences or non-positive local standard deviation were excluded from the fixed common mask. Standardized Sen slopes are reported in local interannual standard deviations per decade. For the endpoint-extension analysis, the 2001–2022 mean and sample standard deviation were held fixed and used to standardize the extended 2001–2025 sequence, so the two endpoint periods were compared on the same local anomaly scale.

2.3.4. Regional Variability and Product-Specific Trends

Area-weighted regional annual standardized anomalies were first calculated for each product. To compare interannual variability independently of each product’s long-term linear component, a trend line was removed from each regional series before calculating ordinary Pearson temporal correlations among products. Regional long-term trend point estimates and conventional 95% intervals were obtained with the Theil–Sen estimator applied to the 22-year regional standardized anomaly series [42,43].
Grid-cell trends were estimated independently for each product from the annual standardized anomaly series. The Sen slope was calculated as the median of all pairwise annual slopes and multiplied by 10 to express the result per decade [43]. Statistical support for monotonic change was evaluated with a two-sided Hamed–Rao modified Mann–Kendall test using lag 1, implemented to match the lag semantics of pyMannKendall 1.4.x [44,45,46]. Within each product, the resulting p values were adjusted with the Benjamini–Yekutieli false-discovery-rate procedure, which controls FDR under arbitrary dependence among tests [47]. Grid cells with q < 0.05 were classified as FDR-supported. Positive and negative trend-sign areas were defined from the sign of the Sen slope, whereas FDR-supported areas were defined only as the statistically supported subsets of those signed areas.

2.3.5. Pairwise Spatial Agreement

Pairwise spatial agreement between product trend maps was quantified with two complementary metrics. The first was an area-weighted spatial rank correlation, ρ w . For each pair of products, the two trend maps were separately converted to midranks, and a weighted Pearson correlation was then calculated between the ranked values using w g as weights. This statistic was used as a weighted Spearman-type spatial correlation [48,49]. The second metric was same-direction area, defined as the boundary-area-weighted fraction of cells for which two products had the same Sen-slope sign. These two metrics were kept separate because similar trend signs do not necessarily imply similar spatial ranking of trend magnitudes.
Uncertainty in spatial agreement metrics was evaluated with a paired spatial-block bootstrap, following block-resampling principles for dependent data [50,51]. Grid-cell centers were transformed to the study-region Krasovsky 1940 Albers projection, and blocks were defined from the projected xy coordinates so that block size represented a fixed physical distance rather than a fixed longitude–latitude span. If K non-empty blocks were available for a given statistic, each bootstrap replicate sampled K block identifiers with replacement. Repeated block draws retained duplicate cells and their corresponding weights. The primary interval used 200-km projected blocks and 2000 bootstrap replicates; 100- and 300-km projected blocks were used only as block-size sensitivity audits. For pairwise product comparisons, the same block draws were applied to both products within each bootstrap replicate.

2.3.6. Core-Product Ensemble Characterization

The core ensemble was defined only from GLDAS, ERA5-Land, and SMCI. Let B g p denote the standardized Sen slope for grid cell g and core product p, and let C denote the set of the three core products. The core-product median trend was defined as
M g = median p C ( B g p ) .
The number of core products matching the median direction was summarized as
S g = p C I sign ( B g p ) = sign ( M g ) .
Directional composition was also classified into three mutually exclusive classes: all-decreasing, where all three core slopes were below zero; all-increasing, where all three slopes were above zero; and mixed-direction, where positive and negative core slopes coexisted.
Inter-product spread around the ensemble center was quantified with the median absolute deviation
D g = median p C | B g p M g | .
Area-weighted distributions of M g , S g , and  D g were then summarized over the fixed common mask. Additional summaries included the product identity opposing the median direction in mixed-direction cells, the area-weighted spatial association between D g and | M g | , and the area fraction where D g > | M g | . The median M g was interpreted only as the center of the selected core-product set; S g described sign composition, and  D g described inter-product spread rather than a confidence interval, measurement error, or product-accuracy ranking.

2.3.7. Sensitivity and Diagnostic Analyses

Sensitivity analyses were used to test whether the main product-dependence pattern was tied to particular data representations, preprocessing decisions, temporal assumptions, record endpoints, or product-set composition. Detailed implementation rules, formulas, and supplementary results are provided in the Supplementary Materials.
Product-definition and preprocessing checks assessed whether the principal trend pattern changed under alternative depth or storage representations, seasonal aggregation, preprocessing choices, temporal trend formulations, hydroclimatic diagnostics, and source-dependence diagnostics. Endpoint and product-set sensitivity were evaluated by contrasting fixed-period extension, product-set replacement, and leave-one-out configurations with the baseline core-product median. These checks were summarized with area-weighted spatial agreement and direction-retention metrics. They were used only to characterize robustness within the selected products and periods, not to validate a true trend.

2.3.8. Environmental Association and Repeatability Analyses

Single-predictor environmental associations were evaluated as cross-sectional spatial associations between product-specific standardized soil-moisture trends and the four environmental predictors. For each predictor and product, ρ w was calculated with boundary-area weights. Paired projected spatial-block bootstrap intervals were used so that the same block sample was applied across products within a given predictor and replicate [50,51]. The 200-km block interval was treated as primary, with 100- and 300-km blocks retained as scale audits. Figure summaries also included a display-only association for the core-product median and a separate GLEAM SMrz response, but neither the core median nor GLEAM entered the three-core-product repeatability classification.
Each core product’s association with a predictor was converted to an interval sign using the primary 200-km interval:
s = + 1 , L 200 km > 0 , 1 , U 200 km < 0 , 0 , L 200 km 0 U 200 km .
The core-output classification was then assigned from the three core-product signs. R + or R indicated that all three core products had the same non-zero sign; P + or P indicated that at least two core products had the same non-zero sign and no core product had the opposite non-zero sign; C indicated that positive and negative non-zero signs both occurred; and W denoted the remaining weak or unresolved combinations. After analysis-specified input-domain overlap exclusions, U indicated that one-directional support remained but was insufficient for repeatability, and 0 indicated that all remaining eligible product intervals crossed zero. The SMCI land-cover association was marked as an analysis-specified input-domain overlap because land-cover information was used in the SMCI training workflow, and it was excluded from the source-excluded support count. GLEAM responses were recorded separately and did not change the core classification. The repeatability classification was based on interval signs, not on false-discovery-rate adjusted q values.

2.3.9. Joint-Model Fitting and Diagnostics

A simplified four-predictor weighted model was fitted separately for each soil-moisture product over the complete joint domain of 1122 grid cells. The model was
Y g p = α p + β 1 p P g + β 2 p V g + β 3 p L g + β 4 p C g + ε g p ,
where Y g p is the standardized Sen slope of product p, P g is the CHIRPS precipitation trend, V g is the TerraClimate VPD trend, L g is forest–shrub–grass cover change, and  C g is the log ( 1 + S CWDX 80 / 1 mm ) -transformed potential-storage proxy. Predictors were standardized over the joint-model domain using boundary-area weights before model fitting. The response variable was not additionally standardized over space, because  Y g p was already expressed as a local standardized soil-moisture trend. Coefficients were reported on a predictor-standardized scale, in local soil-moisture standard-deviation units per decade per one spatial standard deviation of the corresponding predictor. They were treated only as descriptive adjusted associations conditional on the other included covariates, not as causal effects, contribution estimates, or measures of relative driver importance.
Model diagnostics included weighted predictor rank correlations, weighted variance inflation factors (VIFs), five-fold spatial-block cross-validated R 2 , and residual Moran’s I. VIFs were used to assess multicollinearity among standardized environmental predictors [52]. Cross-validation folds were formed from complete 200-km projected spatial blocks and greedily balanced by boundary-area weight. Held-out predictions were pooled to calculate weighted cross-validated R 2 , which served as a diagnostic for spatially structured prediction error rather than independent external validation [53,54]. Residual Moran’s I was calculated from queen-neighbor grid adjacency and assessed with 999 random permutations [55]. The standard diagnostic formulas are provided in the Supplementary Materials under “Technical Preprocessing and Quality-Control Procedures.” Spatial cross-validation and residual Moran’s I were used to assess whether the fitted model provided transferable spatial predictive skill and whether substantial residual spatial structure remained. Coefficient uncertainty was estimated with paired projected spatial-block bootstrap intervals, using the 200-km block interval as primary and 100- and 300-km intervals as scale audits. The joint model was retained only as a descriptive multivariable sensitivity diagnostic. When the diagnostics indicated weak spatial predictive performance or persistent residual spatial autocorrelation, coefficient estimates were not interpreted substantively. The model was not used for causal attribution, driver identification or ranking, contribution partitioning, or product-accuracy assessment.

2.3.10. Reproducibility and Scope of Inference

All analyses were implemented in Python 3.11.15 in the audited rsgeo environment. The workflow used fixed target-grid definitions, masks, boundary-area weights, random seeds, 2000 spatial-block bootstrap replicates, 200-km primary projected blocks with 100- and 300-km scale audits, and 999 permutations for Moran’s I. Source inventories, file hashes, intermediate products, and plotting inputs were retained as reproducibility audit outputs.
The resulting inference is limited to agreement, sensitivity, and repeatability within the selected products, periods, masks, and spatial-block design. Product agreement does not establish accuracy, the core-product median is not an observed truth, and the endpoint-extension test is not an independent temporal validation. Environmental analyses describe repeatable spatial associations only; they do not identify causal drivers.

3. Results

3.1. Cross-Product Trend Agreement

3.1.1. Regional Variability and Trend Contrasts

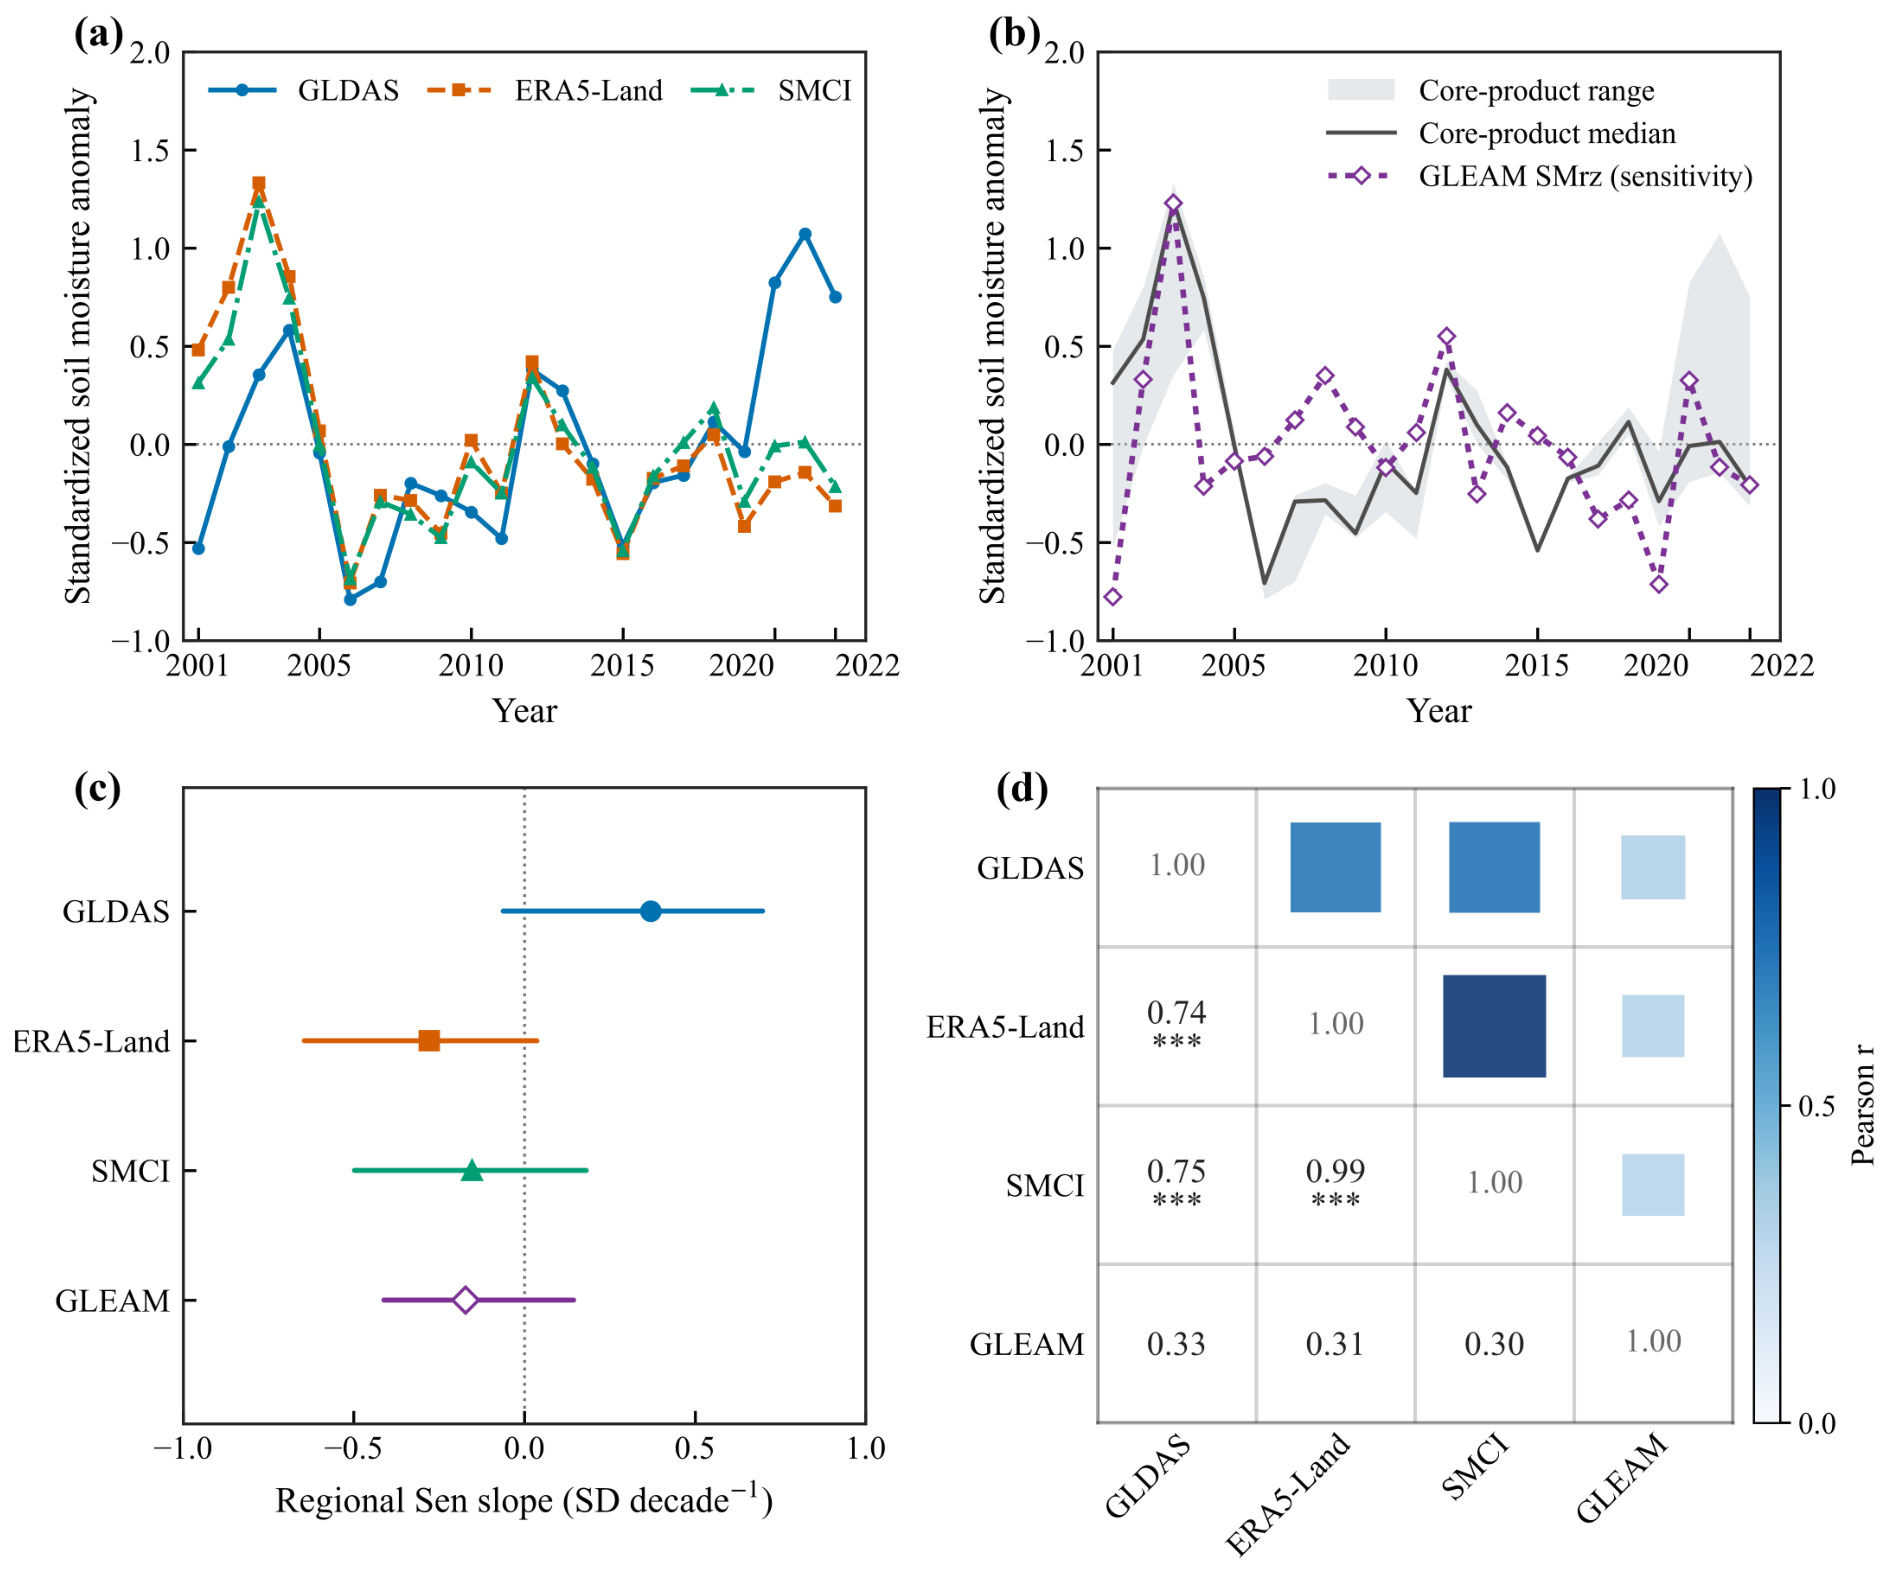
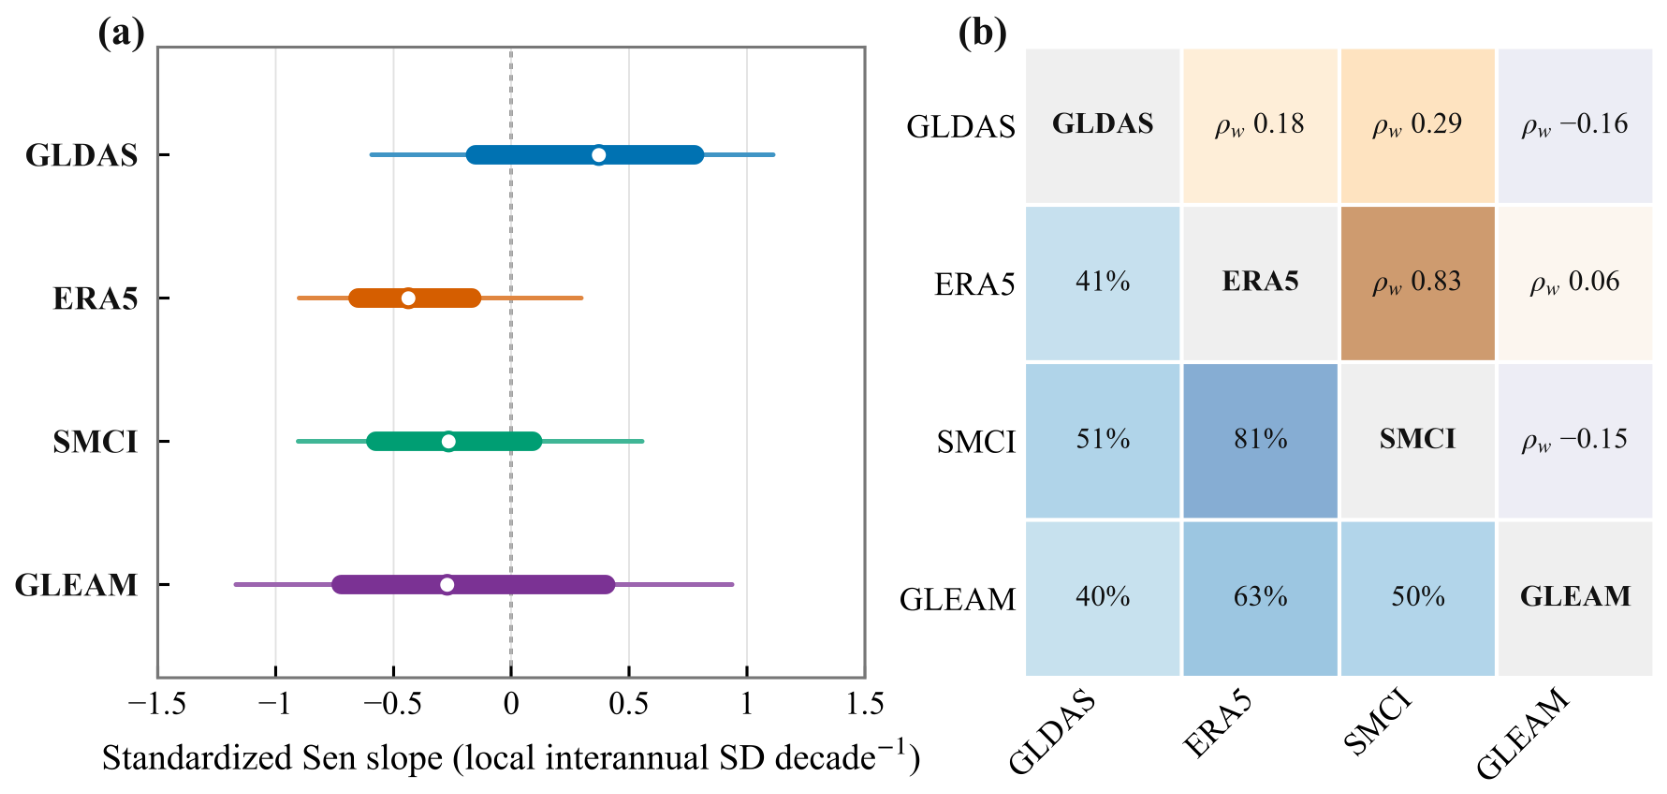
Interannual agreement did not translate into a consistent long-term trend direction (Figure 3). To quantify this contrast, we compared the detrended regional annual anomalies with the corresponding regional Sen slopes. The three core products captured the same major year-to-year excursions, including the positive anomaly around 2003 and the negative anomaly around 2006. Their detrended regional annual anomalies were correlated at r = 0.74 for GLDAS–ERA5-Land, r = 0.75 for GLDAS–SMCI, and r = 0.99 for ERA5-Land–SMCI, with p < 0.001 for all three pairs (Figure 3a,d). However, the core-product range widened markedly near the end of the record. In 2021–2022, GLDAS showed positive anomalies, whereas ERA5-Land remained negative and SMCI stayed close to zero (Figure 3b). GLEAM SMrz showed weaker correspondence with the core products, with correlations of r = 0.33 , 0.31, and 0.30 with GLDAS, ERA5-Land, and SMCI, respectively; none reached p < 0.05 (Figure 3b,d).
The contrast became evident when the comparison was shifted from interannual covariability to regional trend estimates (Figure 3c). The regional Sen slopes were 0.370 , 0.279 , 0.154 , and 0.172 SD decade−1 for GLDAS, ERA5-Land, SMCI, and GLEAM SMrz, respectively. Thus, GLDAS had a positive trend point estimate, whereas the other three products had negative point estimates. Nevertheless, the conventional 95% Theil–Sen intervals for all four products crossed zero. Taken together, the regional annual anomaly series showed substantial shared interannual variation among the core products, while the product-specific long-term trend point estimates did not converge in sign and none of the corresponding intervals excluded zero.
Additional sensitivity analyses confirmed that this product dependence was not substantially altered by the monthly source-dependence audit, the common-depth physical-storage conversion, seasonal aggregation, preprocessing-choice variants, or alternative temporal-structure assumptions. These supplementary checks are reported in the Supplementary Materials (Supplementary Figures S1–S5; Supplementary Tables S1–S7) and are treated as robustness diagnostics rather than as independent product validation.

3.1.2. Spatial Trends and Pairwise Agreement

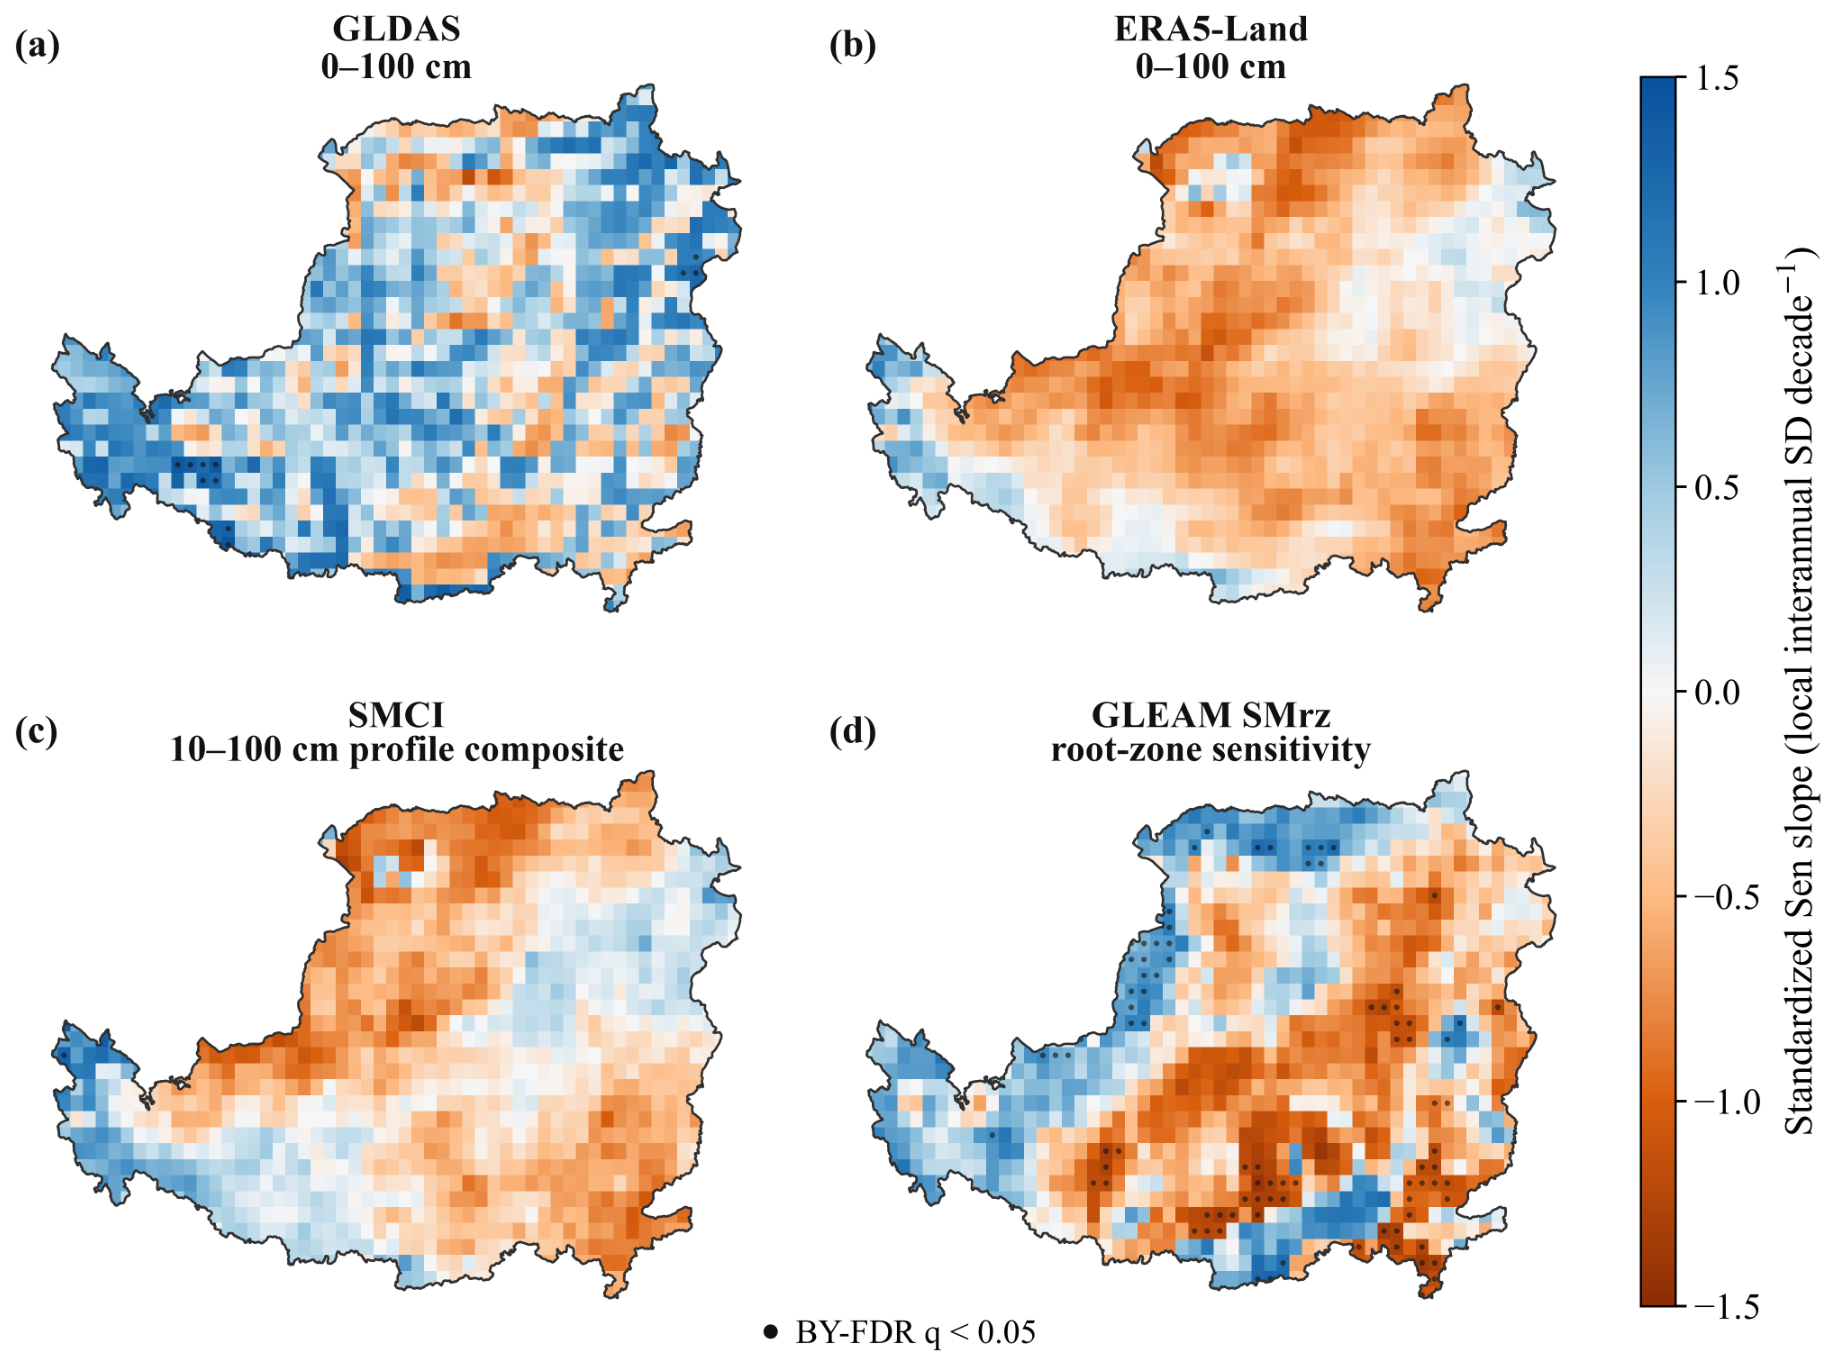
Grid-cell trend maps showed a clear directional split between GLDAS and the other products (Figure 4 and Figure 5a). GLDAS produced positive Sen-slope estimates over 67.7% of the boundary-area-weighted study area, with a weighted median of 0.371 local interannual SD decade−1. By contrast, negative estimates covered 85.3% of the area for ERA5-Land, 68.5% for SMCI, and 61.6% for GLEAM SMrz; their weighted medians were 0.437 , 0.266 , and 0.272 SD decade−1, respectively. ERA5-Land was the only product whose weighted interquartile range lay entirely below zero, extending from 0.650 to 0.168 SD decade−1; the central 50% of the estimates from the other three products included both positive and negative values. The prevalence of a trend sign was not accompanied by equally extensive FDR support. FDR-supported grid cells occupied only 1.11% of the study area for GLDAS, 0.04% for ERA5-Land, and 0.12% for SMCI after the Benjamini–Yekutieli adjustment. GLEAM SMrz had the largest supported area at 8.40%, comprising 3.11% positive and 5.29% negative trends. Thus, particularly among the core products, the broad areas classified by slope sign were accompanied by limited grid-cell support at q < 0.05 .
Directional agreement did not necessarily imply agreement in the spatial ranking of trend estimates (Figure 5b). For comparisons involving GLEAM SMrz, spatial rank correlations remained weak, with ρ w ranging from 0.162 to 0.057. The corresponding primary 200-km projected spatial-block intervals were [ 0.311 , 0.013 ] for GLDAS–GLEAM SMrz, [ 0.169 , 0.277] for ERA5-Land–GLEAM SMrz, and [ 0.363 , 0.091] for SMCI–GLEAM SMrz; their same-sign areas were 40.1%, 62.8%, and 49.7%, respectively. By contrast, ERA5-Land and SMCI combined a high spatial rank correlation of ρ w = 0.829 with a 95% interval of 0.726–0.903 and had the same trend sign over 80.8% of the area. Agreement was weaker for GLDAS–ERA5-Land and GLDAS–SMCI, which yielded ρ w = 0.181 and 0.285, primary 200-km intervals of 0.029–0.309 and 0.156–0.391, and same-sign areas of 41.0% and 51.1%, respectively. ERA5-Land–SMCI was therefore the only product pair that combined strong spatial rank correspondence with extensive directional agreement.

3.2. Ensemble Pattern and Robustness

3.2.1. Ensemble Agreement and Inter-Product Spread

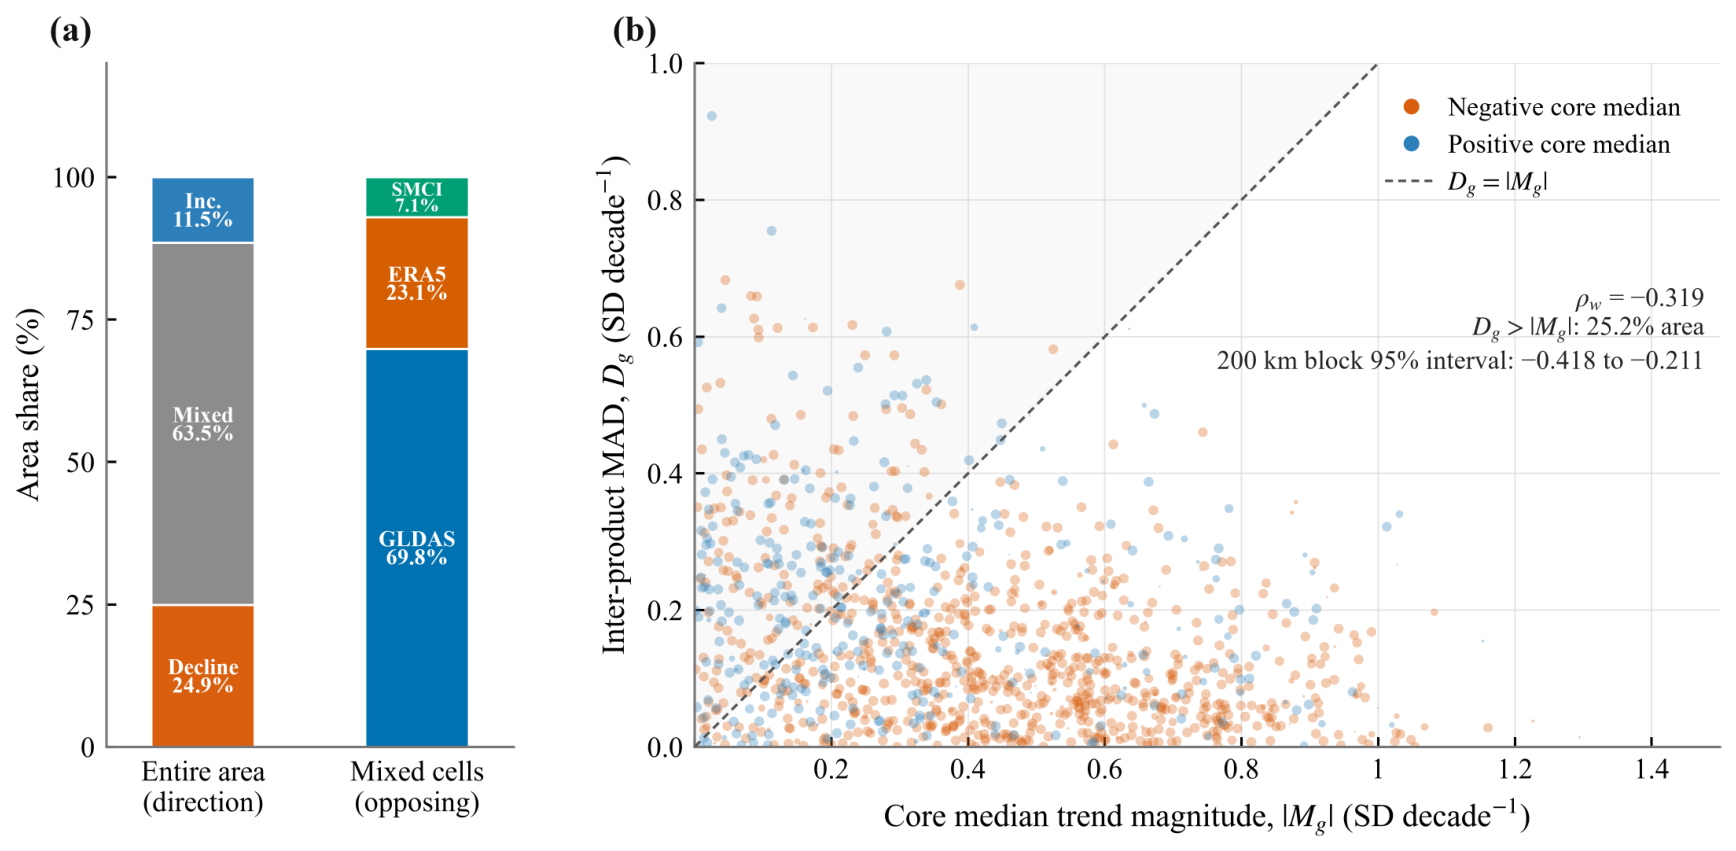
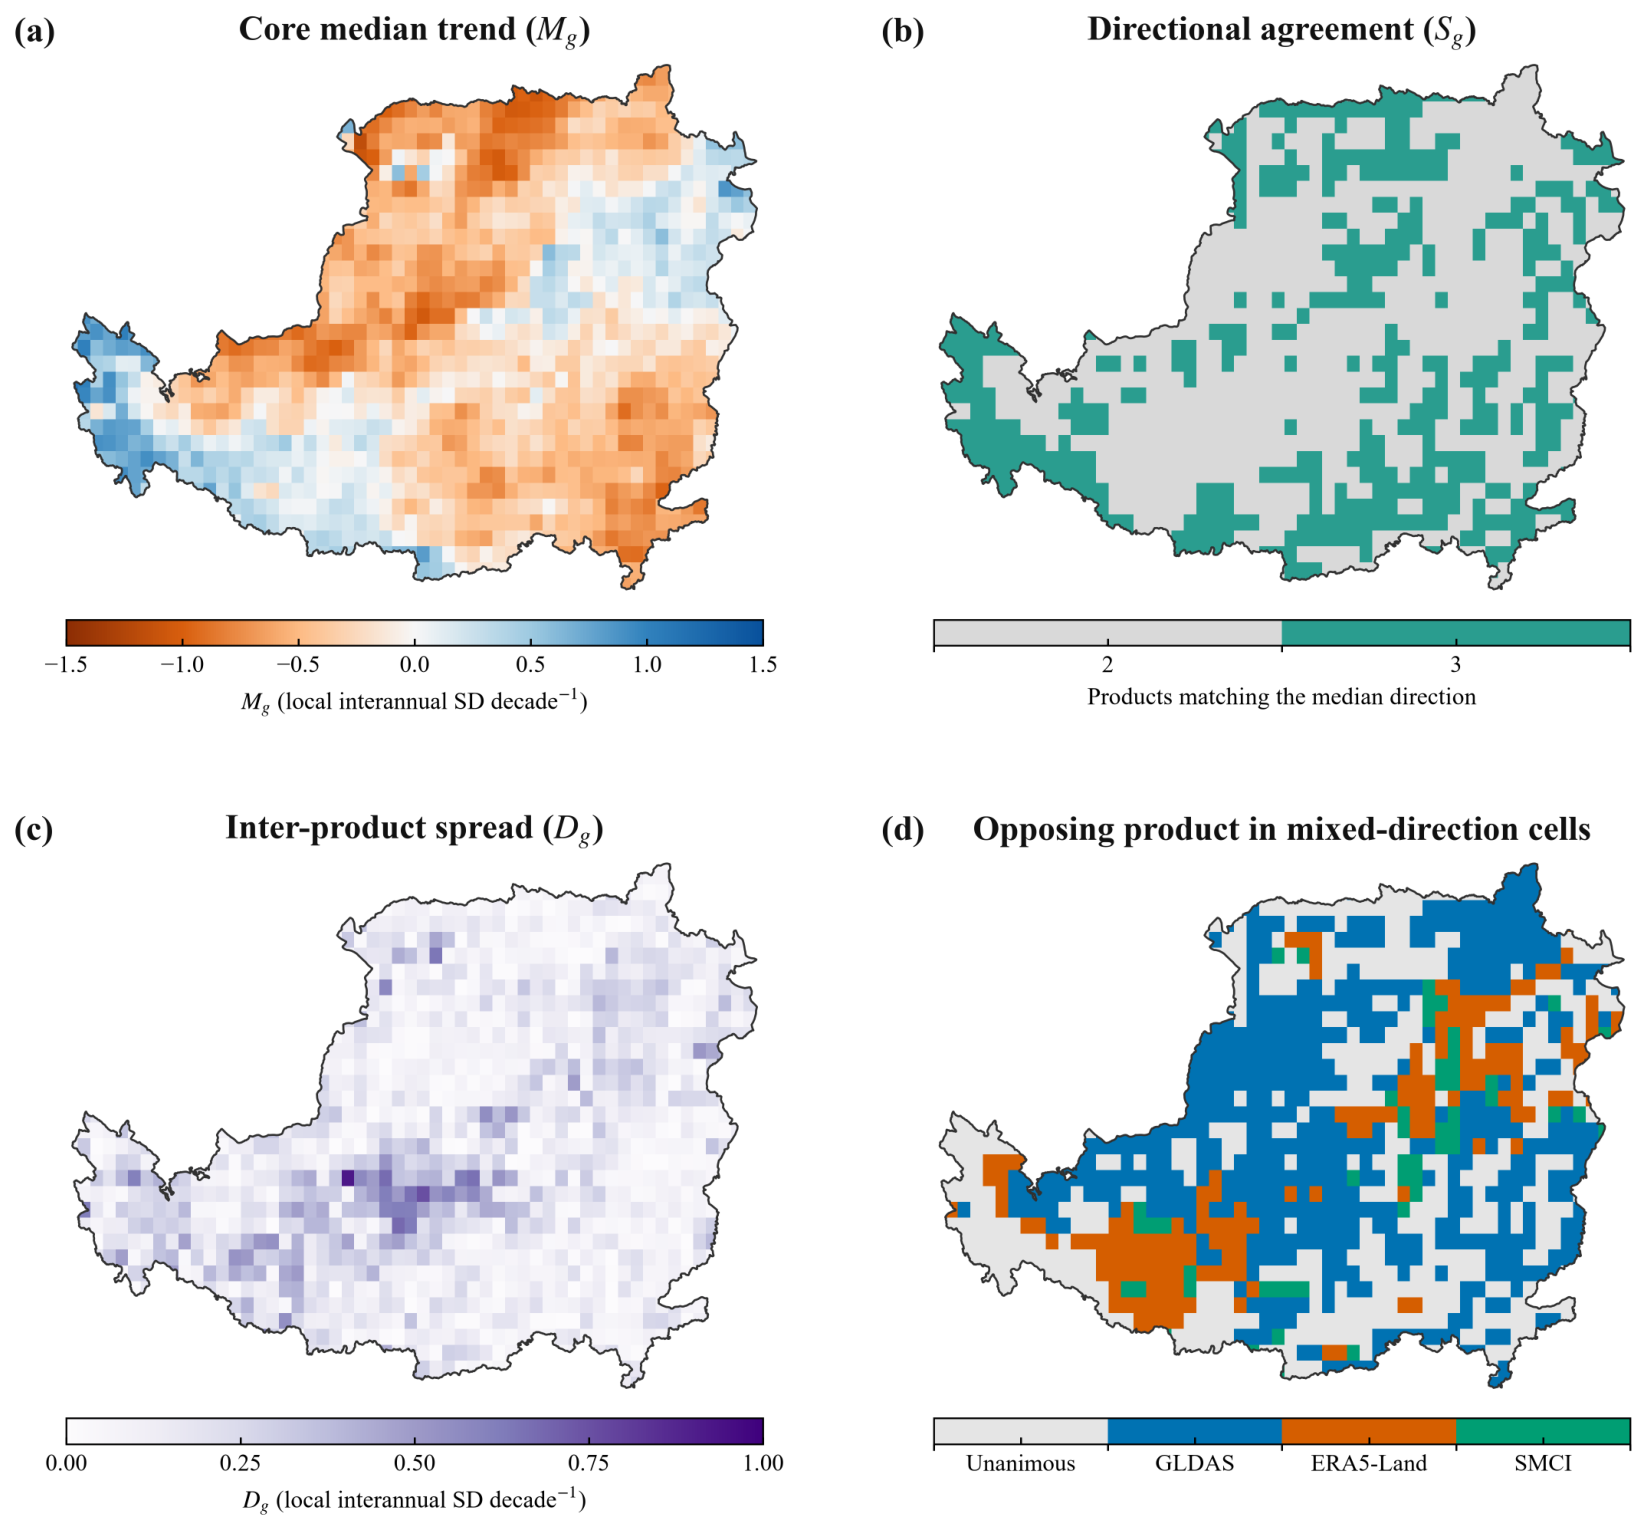
The ensemble center was predominantly negative, but product-level signs were often mixed (Figure 6 and Figure 7). The core median trend, M g , was negative over 72.7% of the boundary-area-weighted study area and positive over 27.3%, with a weighted median of 0.292 local interannual SD decade−1. Negative median trends formed a broad central belt extending into the northern and southeastern portions of the plateau, whereas positive trends were concentrated along the western and southwestern margins and in parts of the northeastern edge (Figure 6a). However, unanimous decline occupied only 24.9% of the study area, and unanimous increase occupied 11.5%. The remaining 63.5% had mixed trend directions, where only two of the three core products matched the median direction (Figure 6b and Figure 7a). Thus, the 72.7% negative-median area contrasted with three-product agreement on decline over only 24.9% of the area.
In most mixed-direction areas, GLDAS was the sole opposing product. GLDAS differed in sign from the other two core products over 69.8% of the mixed-direction area, compared with 23.1% for ERA5-Land and 7.1% for SMCI (Figure 6d and Figure 7a). GLDAS-opposing cells formed the most spatially extensive class, whereas ERA5-Land-opposing cells occurred mainly in several southwestern and east-central patches. SMCI-opposing cells were comparatively sparse. Inter-product spread tended to be larger where the core median trend was weaker (Figure 6c and Figure 7b). The boundary-area-weighted median of D g was 0.129 local interannual SD decade−1, increasing to 0.234 at the 75th percentile and 0.431 at the 95th percentile. Higher values were concentrated in a central-southern band, with additional isolated cells elsewhere. Mixed-direction cells had a median D g of 0.171, compared with 0.139 in unanimous-increase cells and 0.078 in unanimous-decline cells. Across the study area, | M g | and D g were negatively associated ( ρ w = 0.319 ), and the corresponding primary 200-km projected spatial-block interval remained below zero, ranging from 0.418 to 0.211 . The core median therefore coexisted with extensive directional mixture; notably, D g exceeded | M g | over 25.2% of the study area. The core median only describes the ensemble center and must be interpreted together with directional composition and inter-product MAD.

3.2.2. Record-Endpoint and Product-Set Sensitivity

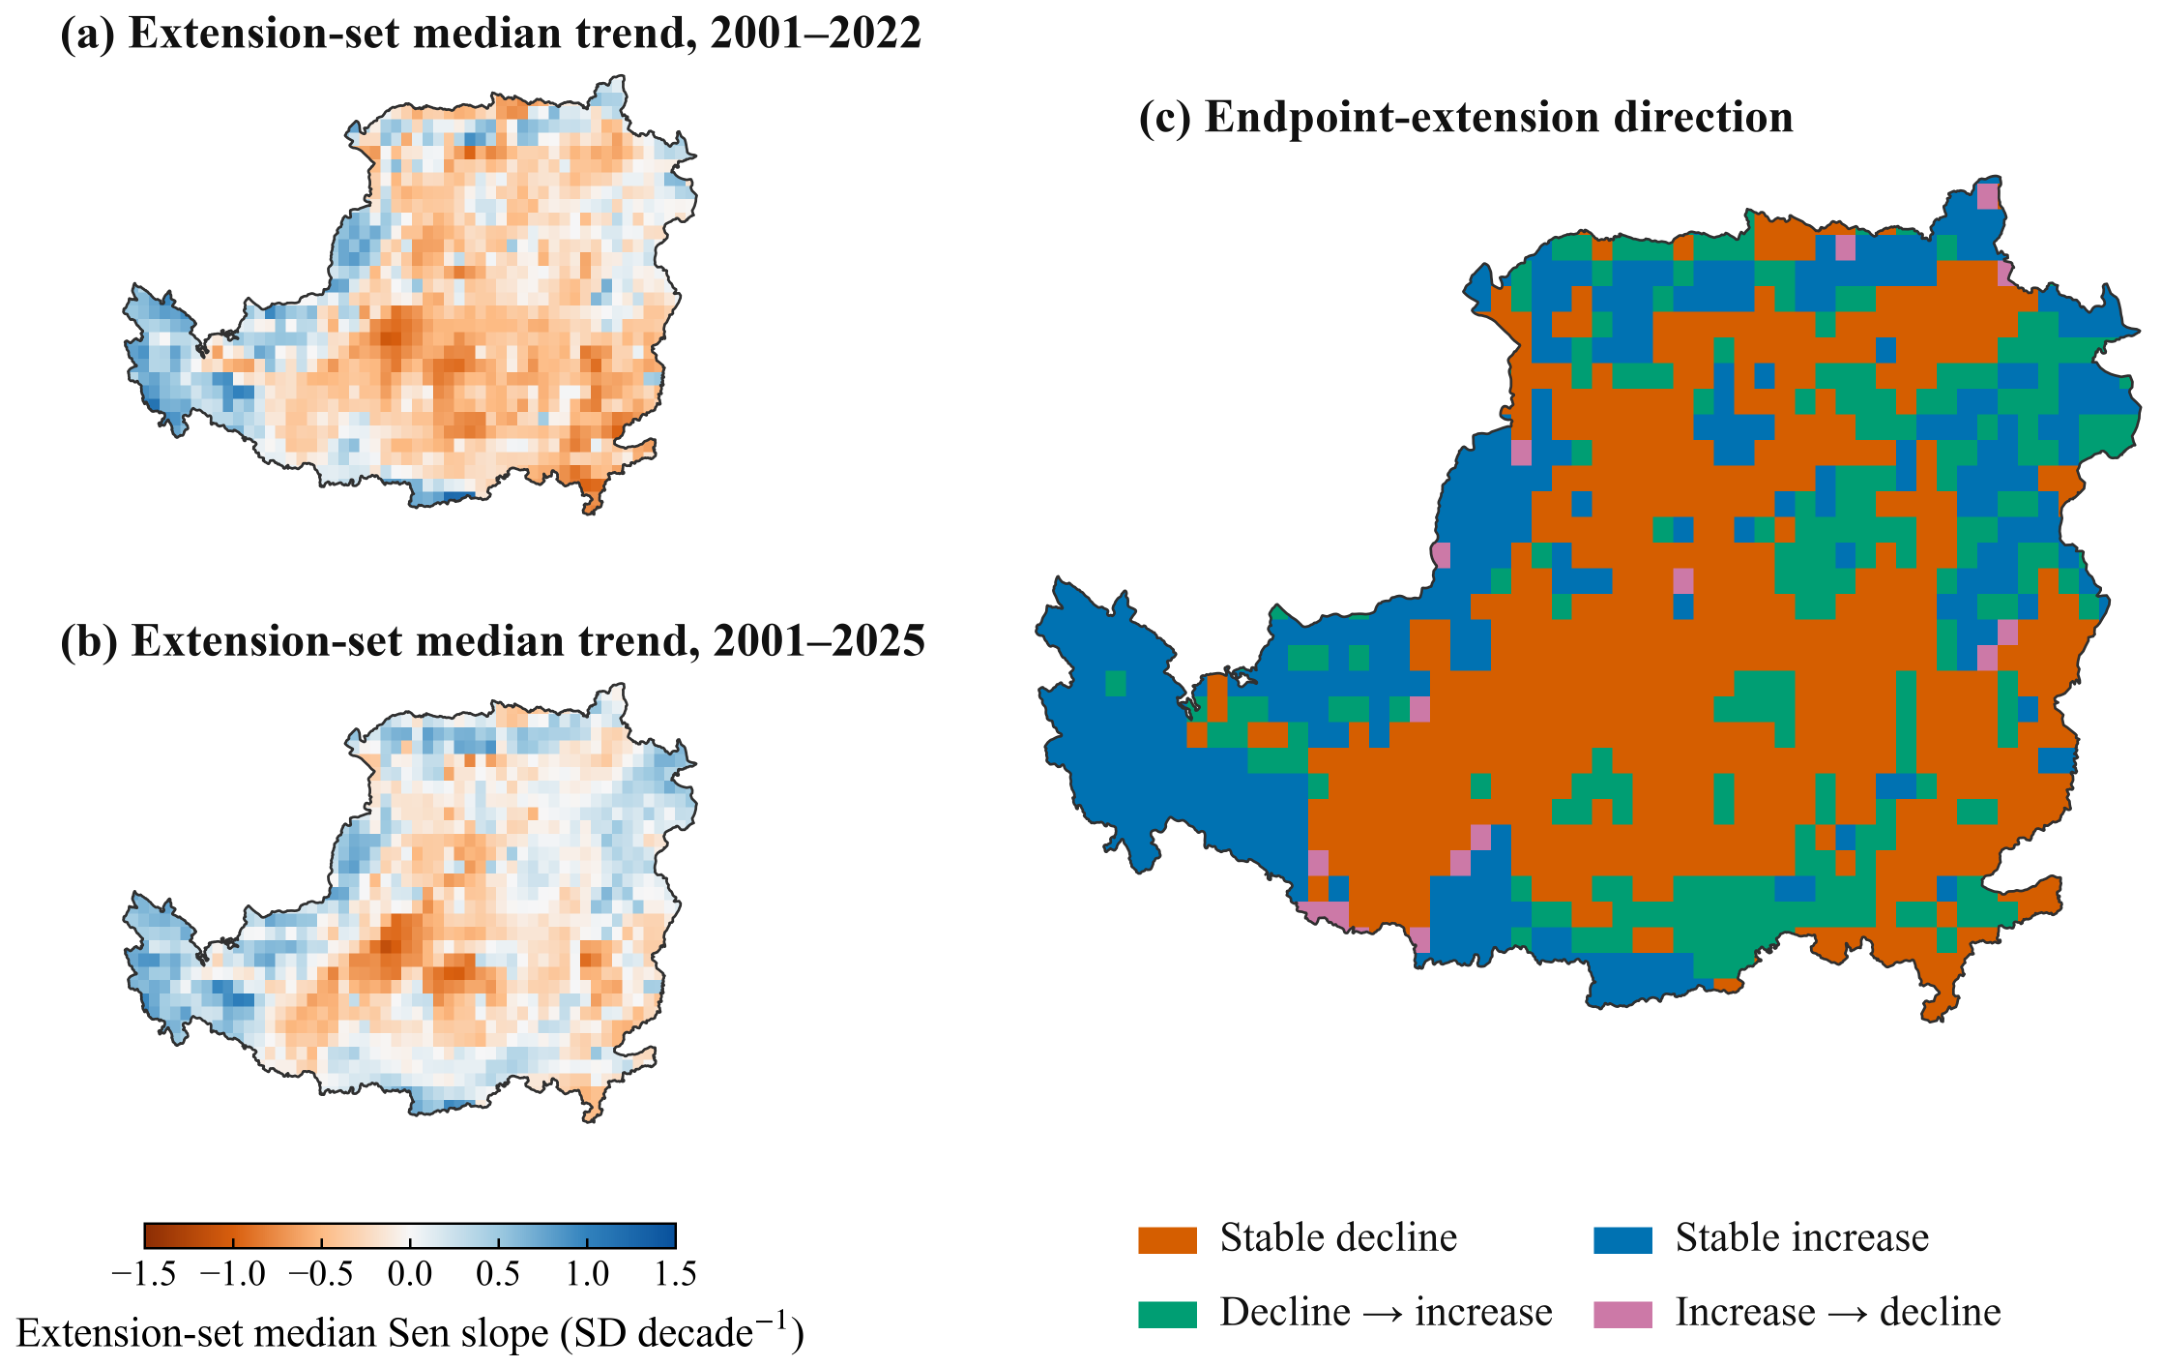
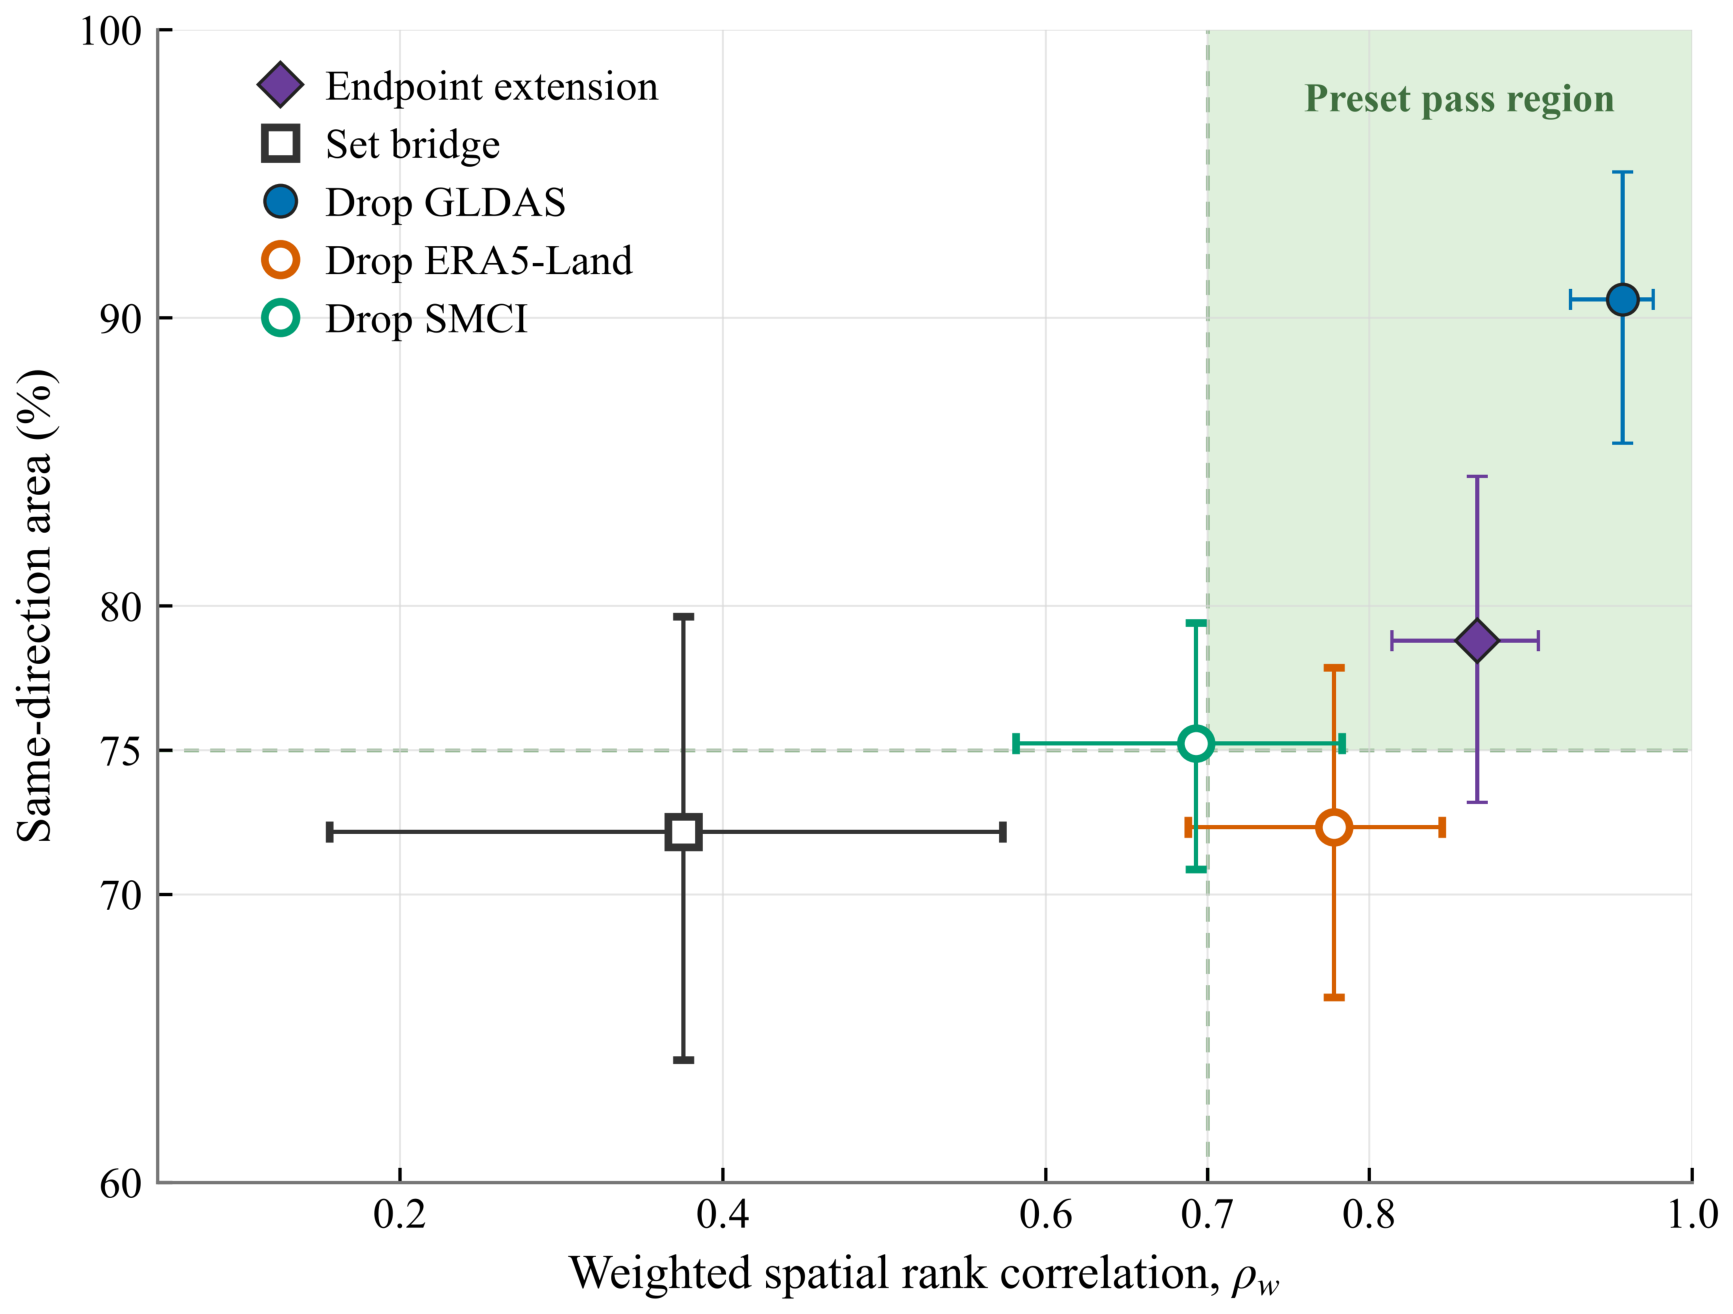
Extending the record endpoint largely preserved the trend pattern within the fixed extension set, but this temporal stability did not transfer directly to the core-product result (Figure 8, Figure 9 and Figure 10). For the extension set comprising GLDAS, ERA5-Land, and GLEAM SMrz, the 2001–2022 and 2001–2025 median-trend maps had a weighted spatial rank correlation of ρ w = 0.867 and retained the same trend direction over 78.8% of the study area. This comparison met the descriptive operating benchmark of ρ w 0.70 and same-direction area 75 % . However, the spatial-block interval for same-direction area had a lower bound below 75%, so this result was retained as conditional endpoint stability rather than an interval-supported pass. Stable decline and stable increase occupied 50.3% and 28.5% of the area, respectively. The remaining 21.2% changed direction, overwhelmingly from decline in 2001–2022 to increase in 2001–2025 (19.8%); the reverse transition occupied only 1.4% (Figure 8c). The weighted median absolute difference between the two extension-set trend estimates was 0.176 local interannual SD decade−1. Spatially, stable decline dominated much of the interior, whereas stable increase was concentrated mainly along the western and other peripheral parts of the plateau; direction changes occurred in discontinuous transition zones.
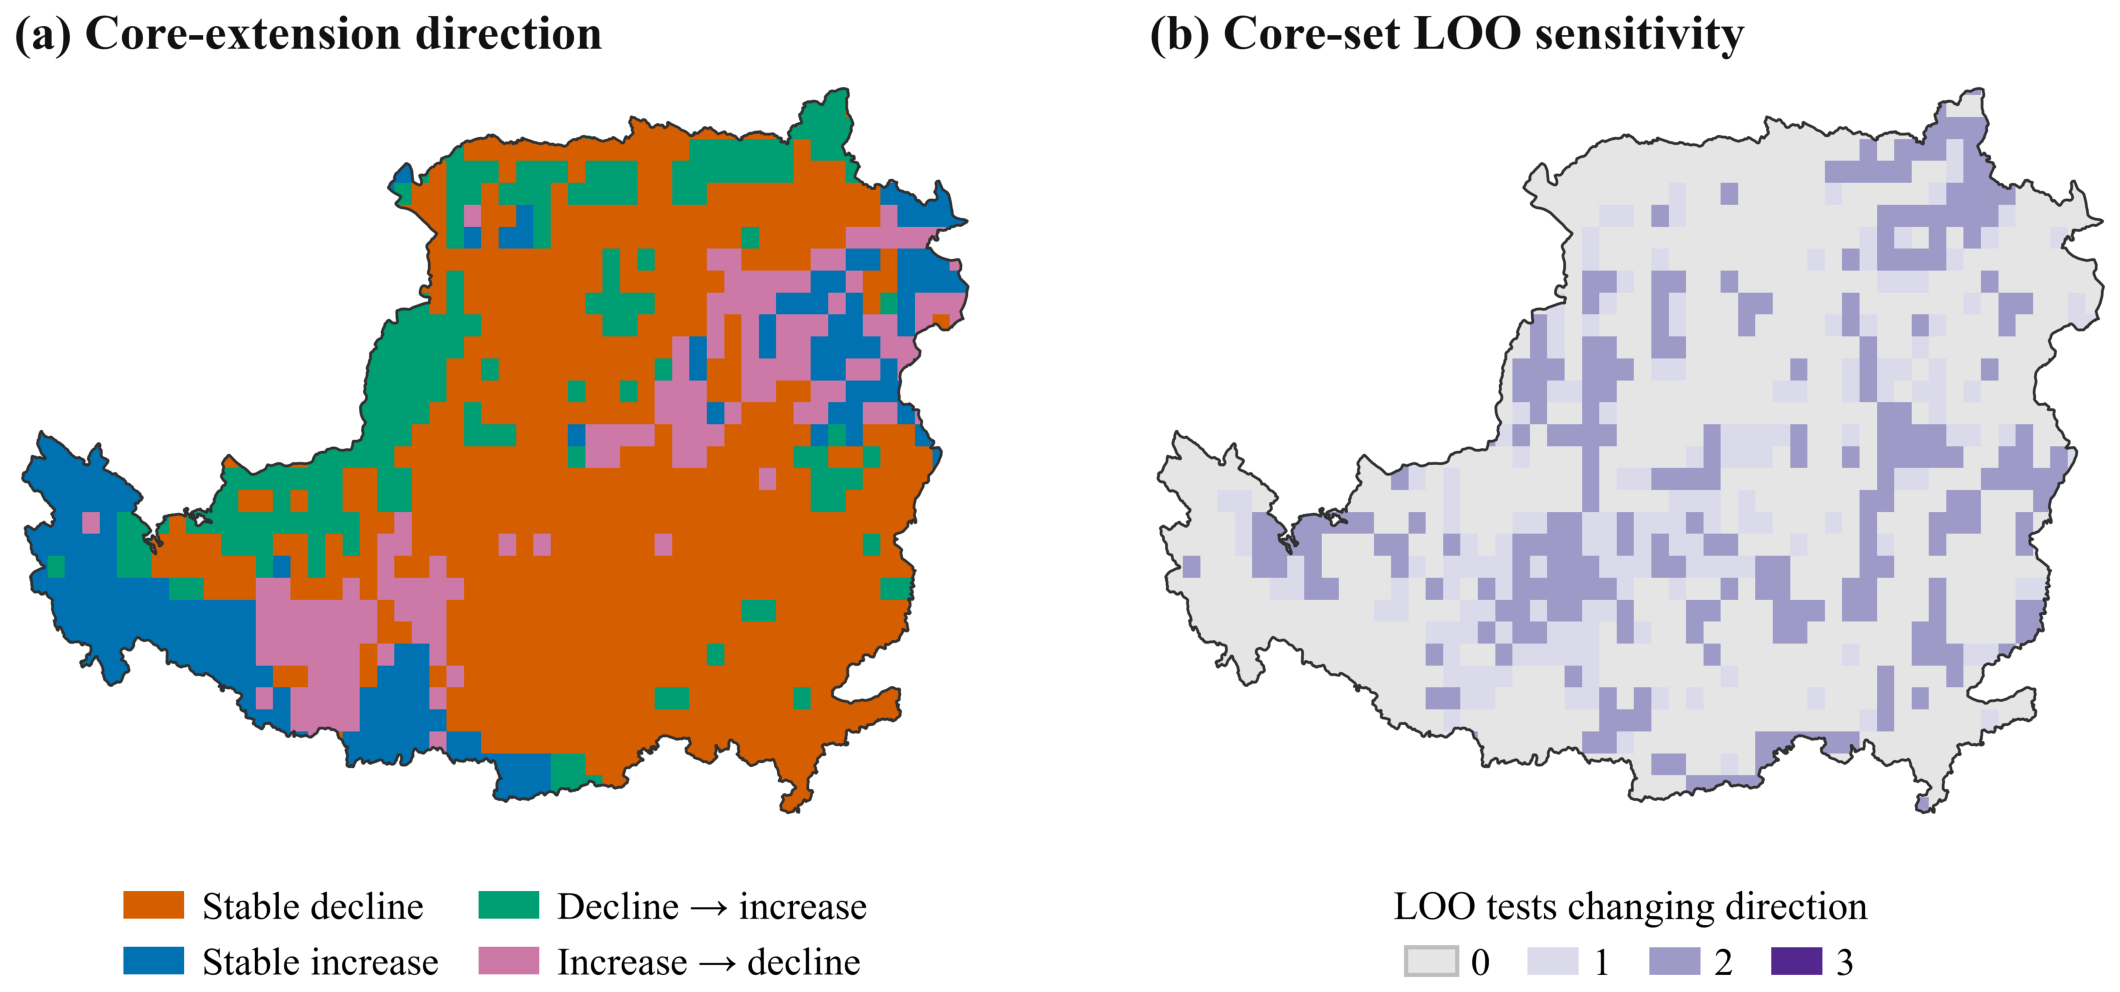
The agreement was substantially weaker when the product set, rather than the record endpoint, was changed (Figure 9a and Figure 10). Over the common 2001–2022 period, the core-set median based on GLDAS, ERA5-Land, and SMCI and the extension-set median based on GLDAS, ERA5-Land, and GLEAM SMrz yielded ρ w = 0.375 and the same direction over 72.2% of the area. Both metrics fell below the descriptive operating benchmark. Direction reversals occupied 27.8% of the study area and were divided relatively evenly between core-set decline changing to extension-set increase (15.2%) and core-set increase changing to extension-set decline (12.7%). The weighted median absolute difference was 0.234 SD decade−1. Thus, the apparent stability under endpoint extension was conditional on the fixed extension set and did not, by itself, establish temporal robustness of the original core-product median. The leave-one-out tests further showed that sensitivity depended strongly on which core product was removed (Figure 9b and Figure 10). Removing GLDAS produced the closest correspondence with the full core median, with ρ w = 0.957 , 90.6% same-direction area, and only 9.4% direction change; this was the only leave-one-out comparison that met both criteria of the descriptive operating benchmark. By contrast, removing ERA5-Land gave ρ w = 0.778 but preserved direction over only 72.3% of the area, while removing SMCI preserved direction over 75.2% but yielded ρ w = 0.693 . Their direction-change areas were 27.7% and 24.8%, respectively. The weighted median absolute difference was also smallest after removing GLDAS (0.086 SD decade−1), compared with 0.251 after removing ERA5-Land and 0.211 after removing SMCI. Across the three leave-one-out tests, 38.9% of the study area was sensitive to the removal of at least one core product.
Across the three leave-one-out tests, trend direction was preserved in every test over 61.1% of the study area (Figure 9b). Direction changed in one test over 16.1% of the area and in two tests over 22.9%; no grid cell changed direction in all three tests. Only two of the five comparison points–the endpoint extension and removal of GLDAS–fell within the descriptive benchmark region in Figure 10. When all three leave-one-out tests, the endpoint extension, and the core-extension bridge were considered jointly, direction was preserved across all five checks over only 36.9% of the area, comprising 24.4% stable decline and 12.5% stable increase. The sensitivity analysis therefore supported conditional stability with respect to the record endpoint but demonstrated substantial dependence on product composition.

3.3. Environmental Associations and Repeatability

3.3.1. Single-Predictor Associations and Repeatability Audit

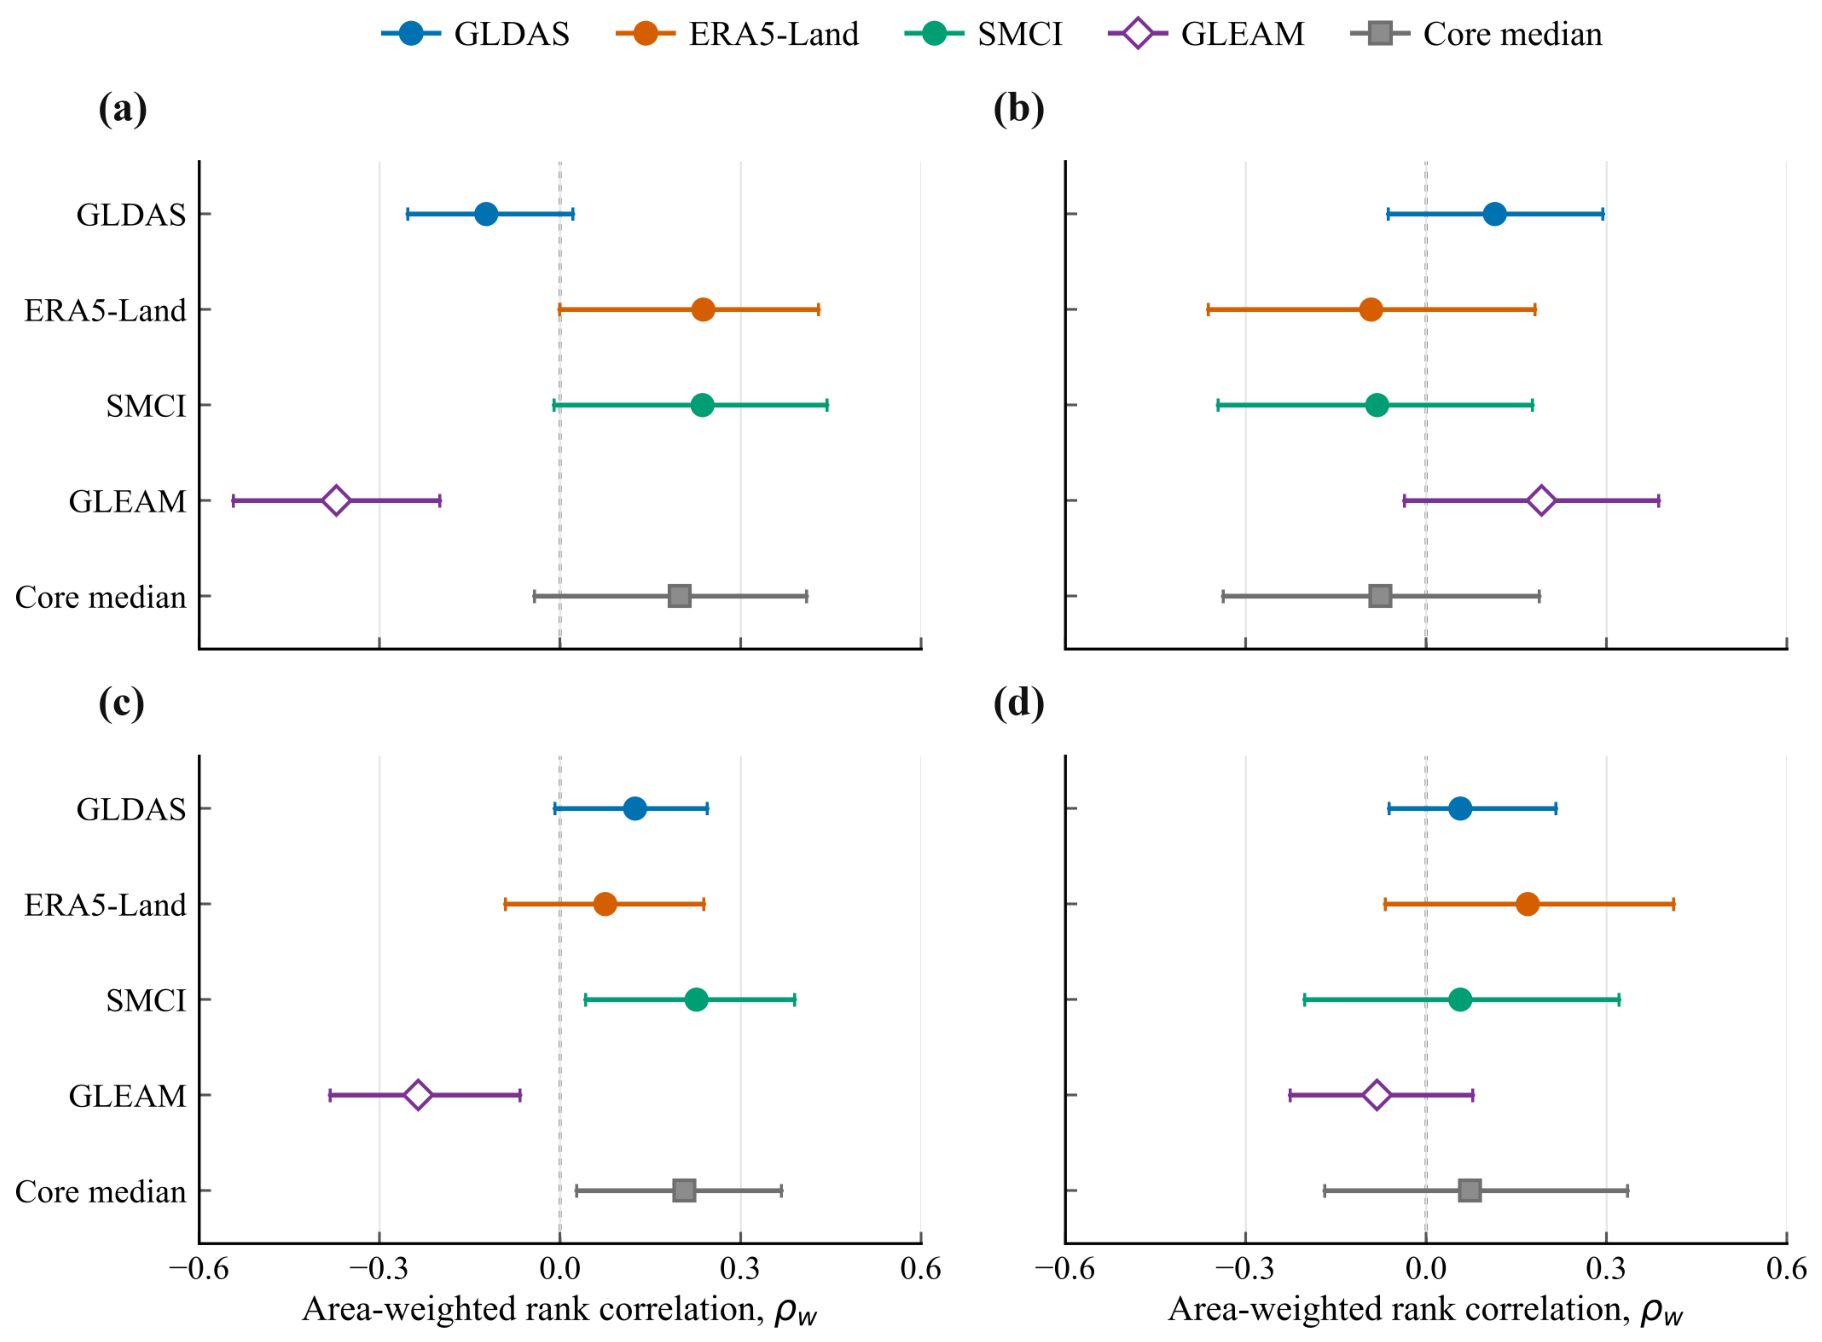
Environmental associations were product-specific rather than repeatable across the core products. All intervals reported in this section are 95% confidence intervals from the primary 200-km projected spatial-block bootstrap unless otherwise stated. We first evaluated single-predictor spatial associations between annual soil-moisture Sen trends and four environmental variables over 2001–2022 (Figure 11). The full frozen mask contained 1178 grid cells and represented 649,260.5 km2. The precipitation and forest–shrub–grass-cover analyses used this full mask, whereas the VPD and potential-storage analyses used 1164 and 1135 valid grid cells, corresponding to 643,852.2 and 626,504.5 km2, respectively. Precipitation-trend associations varied in sign and interval support among products (Figure 11a). The area-weighted spatial rank correlations, ρ w , were 0.123 for GLDAS, 0.238 for ERA5-Land, 0.236 for SMCI, and 0.372 for GLEAM; the corresponding intervals were [ 0.254 , 0.021], [ 0.001 , 0.429], [ 0.010 , 0.444], and [ 0.544 , 0.200 ]. Thus, all three core-product intervals crossed zero under the primary 200-km projected blocks, while GLEAM remained negative. The display-only core median had ρ w = 0.199 with an interval of [ 0.043 , 0.410]. VPD associations were closer to zero relative to their uncertainty ranges (Figure 11b). GLDAS, ERA5-Land, SMCI, and GLEAM had ρ w = 0.114 , 0.092 , 0.082 , and 0.192, with intervals of [ 0.063 , 0.294], [ 0.362 , 0.181], [ 0.346 , 0.176], and [ 0.036 , 0.387], respectively; all intervals crossed zero. The core median was also near zero ( ρ w = 0.076 , [ 0.338 , 0.188]). For forest–shrub–grass cover change (Figure 11c), the SMCI interval was positive ( ρ w = 0.226 , [0.042, 0.390]), whereas GLDAS and ERA5-Land crossed zero ( ρ w = 0.124 , [ 0.009 , 0.245]; and ρ w = 0.075 , [ 0.091 , 0.239]). GLEAM showed an interval entirely below zero ( ρ w = 0.236 , [ 0.383 , 0.067 ]), and the display-only core median was positive ( ρ w = 0.207 , [0.027, 0.368]). For the potential-storage proxy, all product-specific intervals crossed zero (Figure 11d): GLDAS ρ w = 0.057 [ 0.062 , 0.216], ERA5-Land 0.169 [ 0.068 , 0.411], SMCI 0.056 [ 0.202 , 0.320], GLEAM 0.082 [ 0.227 , 0.077], and the core median 0.073 [ 0.169 , 0.335].
The VPD QC/source sensitivity separated predictor-source uncertainty from soil-moisture trend uncertainty (Supplementary Table S8). The TerraClimate negative-value QC treatment itself had no effect on the VPD-association classification relative to the zero-floor sensitivity. Replacing TerraClimate VPD with ERA5-Land VPD changed the 200-km interval-support classification for ERA5-Land, SMCI, and the core median, whose intervals became negative. This sensitivity was therefore treated as uncertainty in the environmental-association analysis rather than in the soil-moisture trend estimate.
The interval-sign classification summarized these single-predictor results into a cross-product repeatability audit (Table 3). Precipitation had support signs [0, 0, 0] across GLDAS, ERA5-Land, and SMCI and was classified as weak or unresolved, W (0/3); GLEAM was negative, the post-audit category was 0 (0/3), and the classification was not stable across the 100-, 200-, and 300-km block settings. VPD had zero support signs in all three core products, W (0/3), with a zero GLEAM response, a post-audit category of 0 (0/3), and stable classification across block sizes. Forest–shrub–grass cover change was also classified as weak or unresolved, W (1/3), because only SMCI retained positive interval support under the primary 200-km blocks; GLEAM was negative but recorded as product-specific rather than contrary because the core products no longer had repeated positive support. After the analysis-specified overlap-exclusion audit, the category was 0 (0/2), and the core-output classification was not stable across block sizes. The potential-storage proxy was W (0/3), had a zero GLEAM response, remained 0 (0/3) after the audit, and was stable across block sizes. No environmental variable achieved repeated same-direction support in all three core products, and all post-audit classifications were zero-supported.

3.3.2. Joint-Model Sensitivity

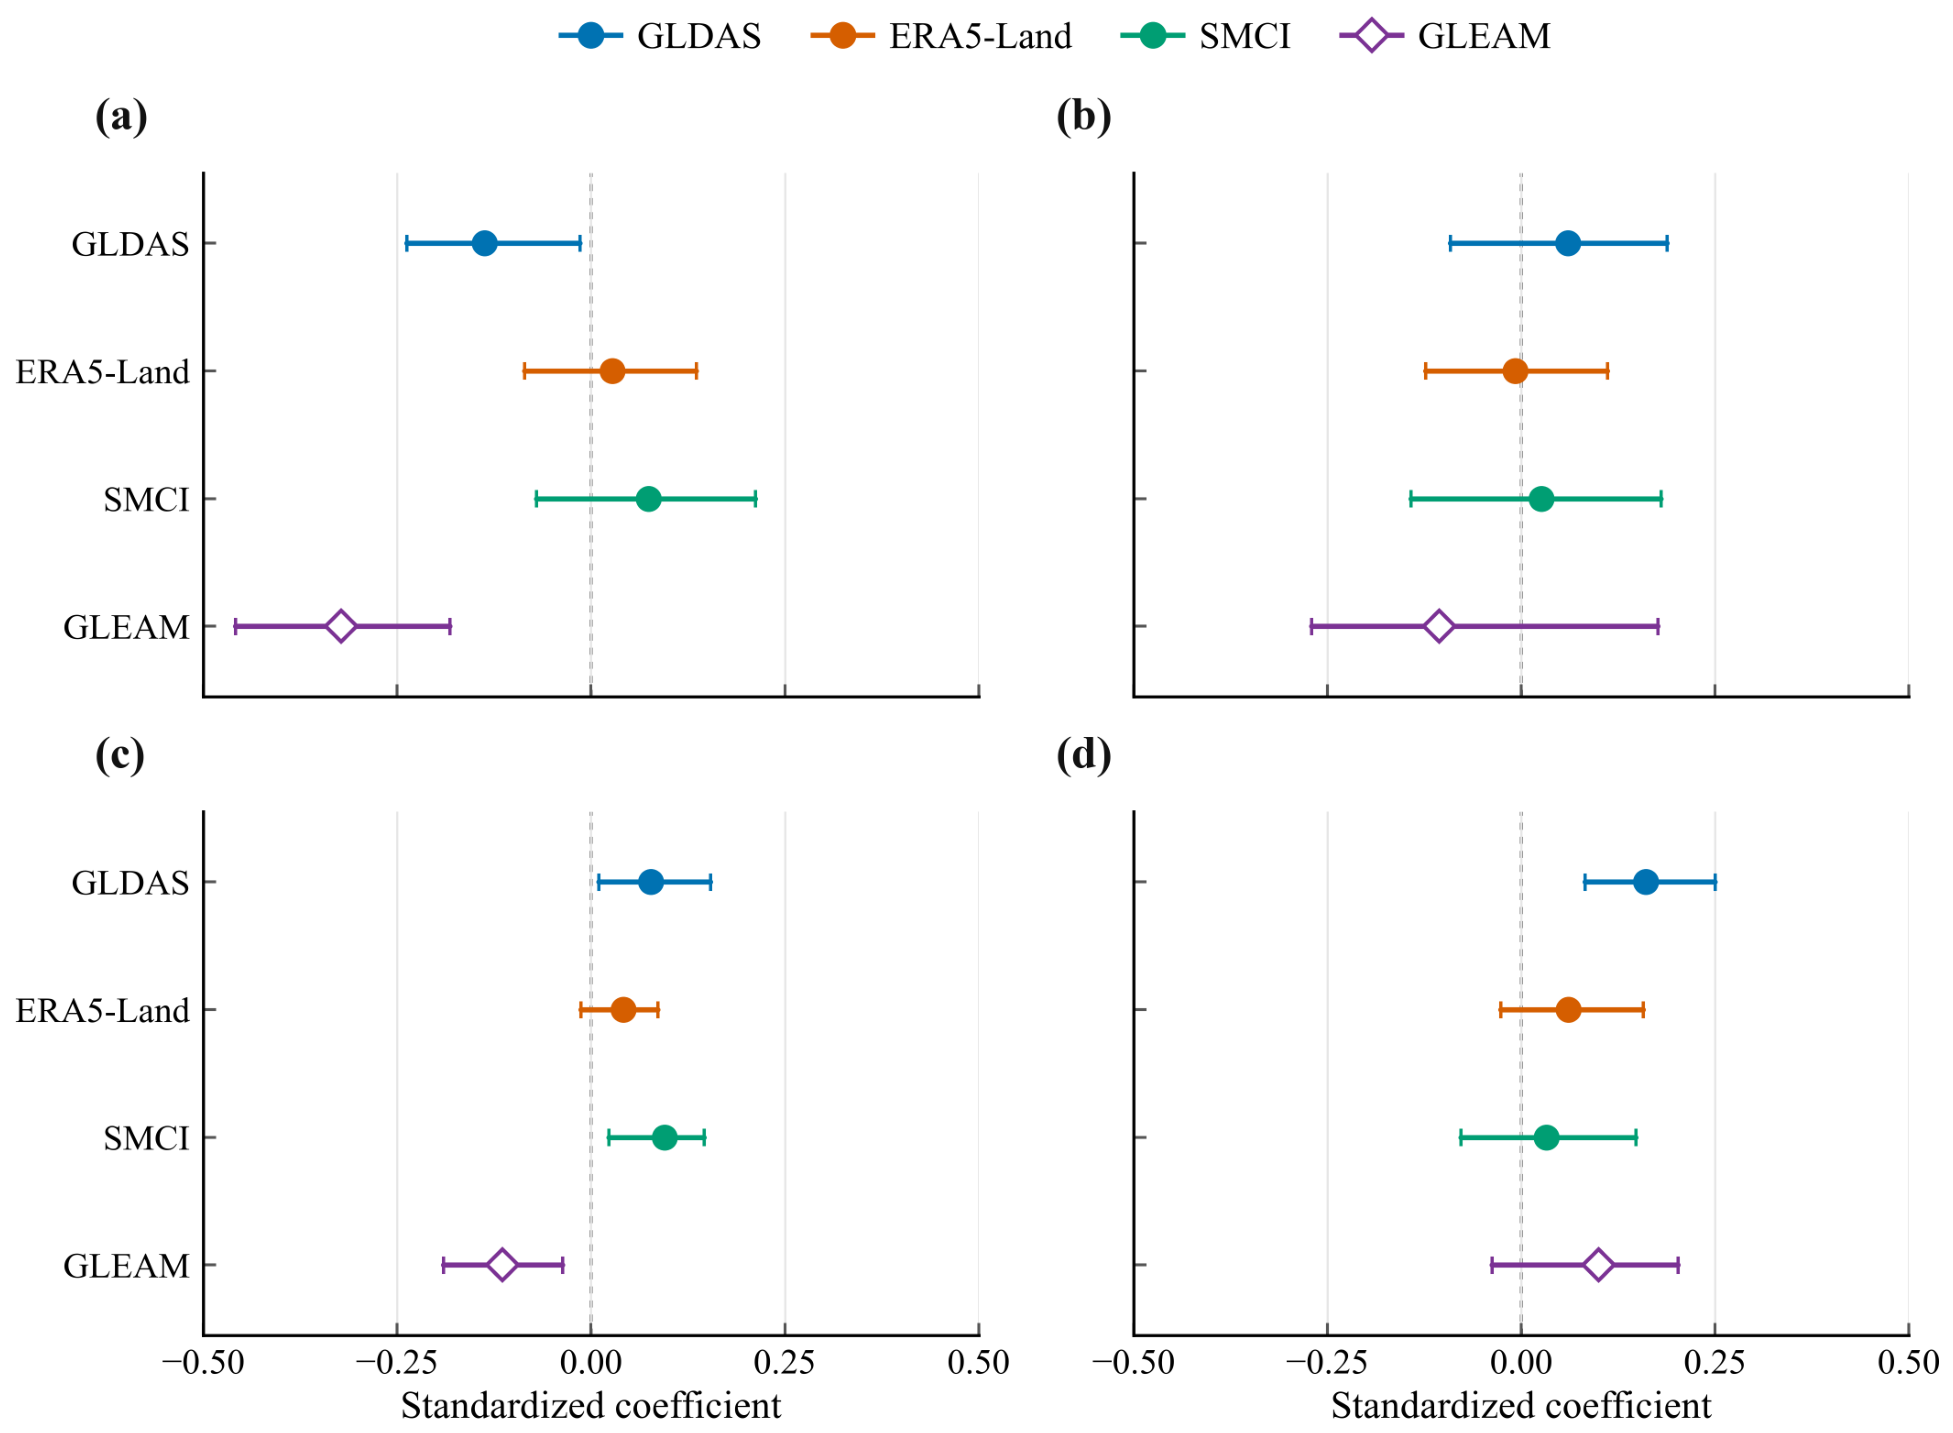
The joint model did not recover cross-product repeatability after simultaneous adjustment. We fitted a simplified four-predictor model as a descriptive multivariable sensitivity analysis over 1122 complete grid cells, representing 621,706.3 km2 (Figure 12). Pairwise weighted rank correlations among the four predictors ranged from 0.424 to 0.663; the largest absolute value was between precipitation trend and the potential-storage proxy ( ρ w = 0.663 ). The maximum weighted variance inflation factor (VIF) was 2.440. The joint models showed weak spatial generalization and substantial residual spatial structure. Five-fold spatial cross-validation using complete 200-km projected blocks gave R 2 values of 0.009 for GLDAS, 0.127 for ERA5-Land, 0.070 for SMCI, and 0.053 for GLEAM. Residual Moran’s I values were 0.370, 0.752, 0.731, and 0.665, respectively, with permutation p = 0.001 for all four products. These diagnostics indicate little transferable spatial predictive skill and substantial residual spatial structure left unexplained.
Given these diagnostics, the standardized coefficients in Figure 12 were treated only as descriptive adjusted-association diagnostics conditional on the included predictors. Coefficient signs and interval support varied among products. Several product-specific intervals excluded zero, but no predictor showed same-direction interval support across all three core products after simultaneous adjustment. The joint model therefore did not recover a repeatable cross-product multivariable association pattern and was not used for driver identification, relative-contribution estimation, or causal-mechanism inference.

4. Discussion

4.1. Directional Contrasts Among Products

The three core products captured broadly similar year-to-year wet and dry excursions, but their regional Sen-slope point estimates did not converge in sign. GLDAS had a positive regional trend point estimate, whereas ERA5-Land, SMCI, and the root-zone sensitivity product GLEAM SMrz had negative point estimates. This distinction matters because interannual coherence is often used to build confidence in gridded soil-moisture products. Our results show that such coherence is not a reliable proxy for low-frequency trend robustness. The monthly extended-collocation-style diagnostic supports this cautious wording. Agreement was used to describe cross-product concurrence within the selected product set rather than independent validation, and the main trend-robustness findings do not rely on assuming that the products provide independent evidence. Product-to-product disagreement in soil-moisture trend magnitude, sign, and spatial pattern has also been reported in broader intercomparisons [20]. Recent trend-focused audits likewise highlight divergent low-frequency behavior among major products [18]. Evidence from northwestern China further shows that different gridded soil-moisture products can produce contrasting wetting and drying tendencies in dryland settings [56].
The supplementary diagnostics support the same interpretation without turning the Discussion into a second Results section. The persistence of product dependence under alternative storage representations suggests that this uncertainty is not limited to standardized soil-moisture indices but also affects physical water-storage interpretations. Seasonal analyses further indicate that annual trends may integrate contrasting seasonal signals, particularly for root-zone products. Alternative temporal formulations did not yield a consistent regional regime-shift interpretation across products, and hydroclimatic correspondence was treated as a consistency diagnostic rather than causal evidence.
The spatial results further show why an ensemble center cannot be read as an unconditional regional trend statement. The core-product median trend was predominantly negative, but most of the domain contained directional mixture among the three core products. GLDAS was the main contributor to this directional contrast, whereas ERA5-Land and SMCI formed the strongest pairwise spatial agreement. This pattern does not identify which product is closer to the true trend. Rather, product-design differences may be large enough to alter the sign of inferred long-term change. Product evaluations over China show substantial differences among model-based soil-moisture datasets [57]. Broader uncertainty assessments point to structural and forcing-related sources of disagreement [58]. Model–reanalysis comparisons also report substantial soil-moisture uncertainty [59]. The present analysis cannot attribute the contrast to any single mechanism, but the persistent directional pattern provides a diagnostic signal for future mechanistic investigations.

4.2. A Layered Assessment Framework for Product-Dependent Trends

The sensitivity tests indicate that product composition exerted stronger leverage on the mapped trend than the extension of a fixed product group by three years. Within the fixed extension set, the 2001–2022 and 2001–2025 median trends retained the same sign over most of the study area. However, replacing SMCI with GLEAM SMrz over the common 2001–2022 period reduced spatial rank agreement and changed trend direction over a larger fraction of the domain. Across the endpoint extension, product-set bridge, and three leave-one-out tests, only 36.9% of the study area retained direction across all five analysis-defined checks. This fraction should be interpreted as a conditional direction-retention area under the present audit. It is not a true stable region, a high-confidence trend area, or an upper bound on cross-product consensus.
The processing-choice audit further supports this layered interpretation: alternative defensible preprocessing configurations introduced measurable uncertainty but did not reverse the principal core-product pattern. We therefore treat preprocessing choice as a supplementary robustness diagnostic rather than as an additional line of evidence for a true regional trend.
This logic motivates a layered assessment framework for regional soil-moisture trends. Such an assessment should include product-specific trend maps, the ensemble center, direction-composition metrics, inter-product dispersion, endpoint sensitivity, product-set bridging, and leave-one-out sensitivity. Multi-product comparisons provide a basis for exposing disagreement rather than suppressing it [20]. Trend-specific product audits show why product agreement must be assessed explicitly before drawing regional conclusions [18]. Error-correlation methods for multiple soil-moisture datasets further caution that apparent agreement among products should not be treated as fully independent evidence [60]. The key value of the framework is conceptual separation: shared interannual variability does not imply long-term trend agreement, a fixed-product endpoint extension does not test product-set sensitivity, and an ensemble median can conceal opposing product signs.

4.3. Limited Repeatability of Environmental Associations

The environmental analyses provide a second layer of caution. Single-predictor associations between soil-moisture trends and precipitation, VPD, forest–shrub–grass cover change, or the potential-storage proxy were product-specific. An association that excluded zero in one product often crossed zero or changed sign in another product. Product dependence in soil-moisture evaluation is well documented across satellite, model, and reanalysis products [61]. Recent regional analyses also show that inferred soil-moisture relationships can vary with the selected product [19]. On the Loess Plateau, vegetation sensitivity to soil moisture is itself spatially and temporally variable [7]. Remote-sensing studies in dryland environments also show that soil-moisture retrievals and vegetation conditions can be closely intertwined [62]. After the source-exclusion audit, none of the four environmental variables retained same-direction support across the three core products. The result does not show that these environmental variables are unimportant for soil-moisture change. It shows that the present product set does not support a repeatable cross-product environmental-association pattern for the mapped trend structure.
In contrast to the soil-moisture processing envelope, VPD association support showed sensitivity to predictor source. This reinforces the need to interpret environmental associations as product- and source-dependent rather than as robust driver attribution.
The joint model did not resolve this limitation. Simultaneously including precipitation, VPD, forest–shrub–grass cover change, and the potential-storage proxy did not recover same-direction interval support across the three core products for any adjusted coefficient. Evidence from dryland soil-water studies shows that soil-moisture change can vary strongly by depth and regional water context [63]. Loess Plateau studies also emphasize that soil-water responses to vegetation and climate are spatially heterogeneous [64]. Low or negative spatial cross-validated R 2 values from complete 200-km block folds and persistent residual Moran’s I show that the simplified model leaves substantial spatial structure unexplained. The joint model is therefore best interpreted as a descriptive adjusted-association sensitivity analysis, not as an explanatory environmental regression. Spatial causal-inference studies warn that spatial association alone can be misleading when dependence, heterogeneity, and confounding remain unresolved [65]. Accordingly, differences in coefficient sign or magnitude among products were not used to rank environmental controls, quantify predictor contributions, or infer causal mechanisms. Under the analysis-defined audit, the selected hydroclimatic and landscape variables did not reveal a repeatable cross-product adjusted-association pattern for the mapped soil-moisture trends.

4.4. Broader Implications for Restoration and Monitoring

The findings also have implications for interpreting soil moisture within ecological restoration assessments on the Loess Plateau. Large-scale revegetation has delivered widely documented benefits for erosion control, vegetation recovery, and ecosystem services [2]. At the same time, water-resource limits have been identified as an important constraint on revegetation in parts of the plateau [3]. Recent work continues to highlight vegetation-related soil-moisture dynamics in water-limited environments [66]. Our results do not evaluate the overall success of the Grain for Green program. They show that the soil-moisture component of such assessment can depend strongly on which gridded product is treated as the reference. A product with a positive regional trend point estimate and products with negative point estimates cannot be reconciled into a single unqualified soil-moisture trend statement without independent validation.
This ambiguity argues for treating regional soil-moisture trends as uncertain boundary conditions in water-limited restoration assessments rather than as known inputs. Product-disagreement zones should be flagged explicitly in monitoring reports. Direction-retention zones should be viewed as candidates for targeted field verification rather than as verified stable areas or management priority zones. Single-product maps should therefore be described as product-specific evidence, not as definitive inputs for policy assessment. Restoration monitoring in semi-arid environments benefits from designs that compare intervention areas with suitable controls rather than relying only on before–after change within the treated area [67]. Restoration science also increasingly emphasizes prediction, uncertainty, and iterative learning [68]. Such a design would place new field observations where they can most directly adjudicate product disagreement and improve process understanding.

4.5. Limitations and Future Directions

Several limitations should be noted. First, the products compared here are not independent observations. They differ in depth definitions, forcing data, model structures, input information, and vertical support, and some products may share common forcing or modeling assumptions. The resulting comparisons should therefore be interpreted as robustness tests within a selected product set rather than as comparisons among physically interchangeable measurements or as a ranking of product accuracy.
Second, direct validation remains limited. The Loess Plateau lacks a dense, long-term, multi-depth in situ network that can evaluate all products at the common grid scale. Point observations face representativeness and scale-mismatch constraints when they are compared with coarse gridded products [69]. A regional evaluation in the Loess hilly and gully region illustrates how multi-source soil-moisture products can vary under complex terrain and land-cover conditions [70]. Existing observations are therefore essential but insufficient for ranking all products over the full plateau.
Third, the temporal record constrains inference. The 2001–2022 common period captures recent variability but remains short for multi-decadal hydroclimatic-transition assessment, and the 2001–2025 comparison is a nested endpoint extension rather than an independent temporal validation. Future verification should combine longer records, targeted field observations, and product-disagreement maps to test where product-dependent interpretations are most consequential. Until stronger observational constraints are available, the main conclusion should remain bounded: within the selected products, period, masks, and spatial-block design, long-term soil-moisture trend interpretation over the Loess Plateau is strongly product-dependent, and environmental associations show limited cross-product repeatability.

5. Conclusions

This study audited long-term soil-moisture trend interpretation across the Chinese Loess Plateau, using multiple gridded products, endpoint checks, product-set perturbations, and environmental-association tests. The main conclusions are as follows:
  • Shared interannual variability among the core products did not translate into a common long-term trend statement.
  • The core-product median was negative over 72.7% of the study area, but 63.5% of the area showed mixed product signs rather than unanimous decline.
  • Endpoint extension preserved trend direction over much of the domain, whereas product-set bridge and leave-one-out tests showed stronger product-composition dependence. Only 36.9% of the study area retained direction across all five robustness checks.
  • Environmental associations did not achieve repeatable same-direction support across all core products, even after joint-model adjustment.
Thus, within the selected products, periods, masks, and spatial-block design, Loess Plateau soil-moisture trends should be reported with explicit product-set dependence, direction composition, and sensitivity diagnostics rather than as product-validated or causally attributed changes.

Supplementary Materials

The following supporting information can be downloaded at: https://www.mdpi.com/article/10.3390/w18172104/s1. Supplementary Methods: technical preprocessing and quality-control procedures; monthly extended-collocation-style error-dependence audit; common-depth physical water-storage sensitivity; seasonal aggregation sensitivity; temporal-structure and breakpoint diagnostics; endpoint, product-set, and leave-one-out sensitivity design; processing-choice uncertainty audit. Table S1: Pairwise monthly residual agreement and extended-collocation-style estimated error dependence among the four soil-moisture products; Table S2: Common-depth 10–100 cm physical water-storage trend sensitivity; Table S3: Pairwise spatial agreement among common-depth 10–100 cm storage-slope maps; Table S4: Seasonal aggregation sensitivity; Table S5: Regional temporal-model comparison; Table S6: Temporal alignment and detrended soil-moisture–dryness consistency diagnostics; Table S7: Sensitivity of core soil-moisture trend metrics to deterministic preprocessing choices; Table S8: VPD quality-control and source sensitivity; Figure S1: Monthly residual agreement and extended-collocation-style error dependence; Figure S2: Common-depth 10–100 cm physical water-storage trend sensitivity; Figure S3: Seasonal aggregation sensitivity; Figure S4: AICc profiles for candidate continuous single-break segmented models; Figure S5: Temporal structure of regional soil-moisture anomalies and hydroclimatic dryness.

Author Contributions

R.L. (Rongqi Li): Conceptualization, Methodology, Software, Validation, Formal analysis, Investigation, Data curation, Writing—original draft, Writing—review and editing, Visualization. H.A.: Writing—review and editing. Y.B.: Writing—review and editing. R.L. (Ruixuan Lan): Writing—review and editing. F.W.: Conceptualization, Methodology, Resources, Writing—review and editing, Supervision, Project administration, Funding acquisition. All authors have read and agreed to the published version of the manuscript.

Funding

This research was funded by the National Natural Science Foundation of China, grant numbers 42177344 and 41771558, and the 111 Project, grant number B20052.

Data Availability Statement

The data and analysis scripts presented in this study are openly available in Zenodo at https://doi.org/10.5281/zenodo.21679065, reference number 21679065. These data were derived from the following publicly available resources: GLDAS, ERA5-Land, SMCI, GLEAM SMrz, CHIRPS, TerraClimate, CLCD, S CWDX 80 , SRTM DEM, and boundary datasets. The original third-party input datasets are available from the data providers and repositories listed in Table 1 and cited in the reference list. Google Earth Engine was used to access and export several public raster products as described in the Materials and Methods.

Acknowledgments

The authors acknowledge the providers of the GLDAS, ERA5-Land, SMCI, GLEAM, CHIRPS, TerraClimate, CLCD, SRTM, boundary, and potential-storage proxy datasets used in this study. ERA5-Land information contains modified Copernicus Climate Change Service information.

Conflicts of Interest

The authors declare no conflicts of interest. The funders had no role in the design of the study; in the collection, analyses, or interpretation of data; in the writing of the manuscript; or in the decision to publish the results.

Abbreviations

The following abbreviations are used in this manuscript:
BYBenjamini–Yekutieli
CHIRPSClimate Hazards Group InfraRed Precipitation with Station data
CLCDChina Land Cover Dataset
ECExtended collocation
ERA5-LandECMWF Reanalysis v5 Land
FDRFalse discovery rate
FSGForest–shrub–grass
GLDASGlobal Land Data Assimilation System
GLEAMGlobal Land Evaporation Amsterdam Model
LOOLeave-one-out
MADMedian absolute deviation
SMCISoil Moisture of China by in situ data
SMrzRoot-zone soil moisture
VIFVariance inflation factor
VPDVapor pressure deficit

References

  1. Seneviratne, S.I.; Corti, T.; Davin, E.L.; Hirschi, M.; Jaeger, E.B.; Lehner, I.; Orlowsky, B.; Teuling, A.J. Investigating soil moisture–climate interactions in a changing climate: A review. Earth-Sci. Rev. 2010, 99, 125–161. [Google Scholar] [CrossRef] [Scilit]
  2. Fu, B.; Wang, S.; Liu, Y.; Liu, J.; Liang, W.; Miao, C. Hydrogeomorphic Ecosystem Responses to Natural and Anthropogenic Changes in the Loess Plateau of China. Annu. Rev. Earth Planet. Sci. 2017, 45, 223–243. [Google Scholar] [CrossRef] [Scilit]
  3. Feng, X.; Fu, B.; Piao, S.; Wang, S.; Ciais, P.; Zeng, Z.; Lü, Y.; Zeng, Y.; Li, Y.; Jiang, X.; et al. Revegetation in China’s Loess Plateau is approaching sustainable water resource limits. Nat. Clim. Change 2016, 6, 1019–1022. [Google Scholar] [CrossRef] [Scilit]
  4. Li, B.B.; Li, P.P.; Zhang, W.T.; Ji, J.Y.; Liu, G.B.; Xu, M.X. Deep soil moisture limits the sustainable vegetation restoration in arid and semi-arid Loess Plateau. Geoderma 2021, 399, 115122. [Google Scholar] [CrossRef] [Scilit]
  5. Jia, X.; Shao, M.; Zhang, C.; Zhao, C. Regional temporal persistence of dried soil layer along south–north transect of the Loess Plateau, China. J. Hydrol. 2015, 528, 152–160. [Google Scholar] [CrossRef] [Scilit]
  6. Jia, X.; Zhao, C.; Wang, Y.; Zhu, Y.; Wei, X.; Shao, M. Traditional dry soil layer index method overestimates soil desiccation severity following conversion of cropland into forest and grassland on China’s Loess Plateau. Agric. Ecosyst. Environ. 2020, 291, 106794. [Google Scholar] [CrossRef] [Scilit]
  7. Wang, X.; Zhao, F.; Wu, Y. Increased sensitivity of vegetation to soil moisture and its key mechanisms in the Loess Plateau, China. Ecohydrology 2024, 17, e2602. [Google Scholar] [CrossRef] [Scilit]
  8. Cheng, S.; Guan, X.; Huang, J.; Ji, F.; Guo, R. Long-term trend and variability of soil moisture over East Asia. J. Geophys. Res. Atmos. 2015, 120, 8658–8670. [Google Scholar] [CrossRef] [Scilit]
  9. Zhou, S.; Zhang, B.; Wang, X.; Feng, J.; Zheng, Z.; Pang, B.; Nie, J.; Yin, W.; Zhao, X.; Shamseldin, A.Y. An Grided Soil Moisture Profile Data Set Based on an Optimal Land Surface Model with Measured Hydraulic Parameters and Data Assimilation over the Loess Plateau. Water Resour. Res. 2026, 62, e2025WR040305. [Google Scholar] [CrossRef] [Scilit]
  10. Bai, X.; Jia, X.; Jia, Y.; Shao, M.; Hu, W. Modeling long-term soil water dynamics in response to land-use change in a semi-arid area. J. Hydrol. 2020, 585, 124824. [Google Scholar] [CrossRef] [Scilit]
  11. Jagdhuber, T.; Jach, L.; Fluhrer, A.; Chaparro, D.; Hellwig, F.M.; Portal, G.; Bauer, H.S.; Kunstmann, H. Assessing the Spatial Similarity of Soil Moisture Patterns and Their Environmental and Observational Drivers from Remote Sensing and Earth System Modeling Across Europe. Remote Sens. 2026, 18, 608. [Google Scholar] [CrossRef] [Scilit]
  12. Yi, C.; Li, X.; Zeng, J.; Fan, L.; Xie, Z.; Gao, L.; Xing, Z.; Ma, H.; Boudah, A.; Zhou, H.; et al. Assessment of five SMAP soil moisture products using ISMN ground-based measurements over varied environmental conditions. J. Hydrol. 2023, 619, 129325. [Google Scholar] [CrossRef] [Scilit]
  13. Qiao, L.; Zuo, Z.; Xiao, D. Evaluation of Soil Moisture in CMIP6 Simulations. J. Clim. 2022, 35, 779–800. [Google Scholar] [CrossRef] [Scilit]
  14. Baatz, R.; Hendricks Franssen, H.J.; Euskirchen, E.; Sihi, D.; Dietze, M.; Ciavatta, S.; Fennel, K.; Beck, H.; De Lannoy, G.; Pauwels, V.R.N. Reanalysis in Earth System Science: Toward Terrestrial Ecosystem Reanalysis. Rev. Geophys. 2021, 59, 2020RG000715. [Google Scholar] [CrossRef] [Scilit]
  15. Hirschi, M.; Stradiotti, P.; Crezee, B.; Dorigo, W.; Seneviratne, S.I. Potential of long-term satellite observations and reanalysis products for characterising soil drying: Trends and drought events. Hydrol. Earth Syst. Sci. 2025, 29, 397–425. [Google Scholar] [CrossRef] [Scilit]
  16. Jiao, Q.; Li, R.; Wang, F.; Mu, X.; Li, P.; An, C. Impacts of Re-Vegetation on Surface Soil Moisture over the Chinese Loess Plateau Based on Remote Sensing Datasets. Remote Sens. 2016, 8, 156. [Google Scholar] [CrossRef] [Scilit]
  17. Wang, Y.; Hu, W.; Sun, H.; Zhao, Y.; Zhang, P.; Li, Z.; Zhou, Z.; Tong, Y.; Liu, S.; Zhou, J.; et al. Soil moisture decline in China’s monsoon loess critical zone: More a result of land-use conversion than climate change. Proc. Natl. Acad. Sci. USA 2024, 121, e2322127121. [Google Scholar] [CrossRef] [Scilit] [PubMed]
  18. Ding, T.; Yang, Y.; Zhao, W.; Wu, J.; Xie, X.; Yin, G.; Gaona, J.; Brocca, L. Assessment of soil moisture trend coherence among major global soil moisture products. J. Hydrol. 2026, 674, 135568. [Google Scholar] [CrossRef] [Scilit]
  19. Xu, X.; Wang, X.; Xiao, J.; Zhang, S.; Yang, Y.; Li, X.; Sha, T.; Li, Z. Inconsistencies in global soil moisture products and discrepancies in their relationship with vegetation productivity. J. Hydrol. 2025, 659, 133298. [Google Scholar] [CrossRef] [Scilit]
  20. Guan, Y.; Gu, X.; Slater, L.J.; Li, J.; Kong, D.; Zhang, X. Spatio-temporal variations in global surface soil moisture based on multiple datasets: Intercomparison and climate drivers. J. Hydrol. 2023, 625, 130095. [Google Scholar] [CrossRef] [Scilit]
  21. Gu, X.; Li, J.; Chen, Y.D.; Kong, D.; Liu, J. Consistency and Discrepancy of Global Surface Soil Moisture Changes from Multiple Model-Based Data Sets Against Satellite Observations. J. Geophys. Res. Atmos. 2019, 124, 1474–1495. [Google Scholar] [CrossRef] [Scilit]
  22. Miao, C.; Sun, Q.; Duan, Q.; Wang, Y. Joint analysis of changes in temperature and precipitation on the Loess Plateau during the period 1961–2011. Clim. Dyn. 2016, 47, 3221–3234. [Google Scholar] [CrossRef] [Scilit]
  23. Zhu, Y.; Jia, X.; Qiao, J.; Shao, M. What is the mass of loess in the Loess Plateau of China? Sci. Bull. 2019, 64, 534–539. [Google Scholar] [CrossRef] [Scilit] [PubMed]
  24. Rodell, M.; Houser, P.R.; Jambor, U.; Gottschalck, J.; Mitchell, K.; Meng, C.J.; Arsenault, K.; Cosgrove, B.; Radakovich, J.; Bosilovich, M.; et al. The Global Land Data Assimilation System. Bull. Am. Meteorol. Soc. 2004, 85, 381–394. [Google Scholar] [CrossRef] [Scilit]
  25. Beaudoing, H.; Rodell, M.; NASA/GSFC/HSL. GLDAS Noah Land Surface Model L4 3 Hourly 0.25 x 0.25 Degree V2.1.; Goddard Earth Sciences Data and Information Services Center (GES DISC): Greenbelt, MD, USA, 2020. Available online: https://disc.gsfc.nasa.gov/datasets/GLDAS_NOAH025_3H_2.1/summary (accessed on 10 July 2026).
  26. Gorelick, N.; Hancher, M.; Dixon, M.; Ilyushchenko, S.; Thau, D.; Moore, R. Google Earth Engine: Planetary-scale geospatial analysis for everyone. Remote Sens. Environ. 2017, 202, 18–27. [Google Scholar] [CrossRef] [Scilit]
  27. Muñoz Sabater, J. ERA5-Land Hourly Data from 1950 to Present. Copernicus Climate Change Service (C3S) Climate Data Store (CDS), 2019. Available online: https://cds.climate.copernicus.eu/datasets/reanalysis-era5-land (accessed on 10 July 2026).
  28. Shangguan, W.; Li, Q.; Shi, G. A 1 km Daily Soil Moisture Dataset over China Based on In-Situ Measurement (2000–2022). National Tibetan Plateau Data Center, 2024. Available online: https://data.tpdc.ac.cn/en/data/49b22de9-5d85-44f2-a7d5-a1ccd17086d2/ (accessed on 10 July 2026).
  29. Miralles, D.G.; Holmes, T.R.H.; De Jeu, R.A.M.; Gash, J.H.; Meesters, A.G.C.A.; Dolman, A.J. Global land-surface evaporation estimated from satellite-based observations. Hydrol. Earth Syst. Sci. 2011, 15, 453–469. [Google Scholar] [CrossRef] [Scilit]
  30. Miralles, D.G.; Bonte, O.; Koppa, A.; Baez-Villanueva, O.M.; Tronquo, E.; Zhong, F.; Beck, H.E.; Hulsman, P.; Dorigo, W.; Verhoest, N.E.C.; et al. GLEAM4: Global land evaporation and soil moisture dataset at 0.1 degrees resolution from 1980 to near present. Sci. Data 2025, 12, 416. [Google Scholar] [CrossRef] [Scilit]
  31. Hulsman, P.; Keune, J.; Koppa, A.; Schellekens, J.; Miralles, D.G. Incorporating Plant Access to Groundwater in Existing Global, Satellite-Based Evaporation Estimates. Water Resour. Res. 2023, 59, e2022WR033731. [Google Scholar] [CrossRef] [Scilit]
  32. Funk, C.; Peterson, P.; Landsfeld, M.; Pedreros, D.; Verdin, J.; Shukla, S.; Husak, G.; Rowland, J.; Harrison, L.; Hoell, A.; et al. The climate hazards infrared precipitation with stations—A new environmental record for monitoring extremes. Sci. Data 2015, 2, 150066. [Google Scholar] [CrossRef] [Scilit] [PubMed]
  33. Abatzoglou, J.T.; Dobrowski, S.Z.; Parks, S.A.; Hegewisch, K.C. TerraClimate, a high-resolution global dataset of monthly climate and climatic water balance from 1958–2015. Sci. Data 2018, 5, 170191. [Google Scholar] [CrossRef] [Scilit]
  34. Yang, J.; Huang, X. The 30 m Annual Land Cover Datasets and Its Dynamics in China from 1985 to 2025. Zenodo, 2026, Version 1.0.5. Available online: https://zenodo.org/records/18180184 (accessed on 10 July 2026).
  35. Yang, J.; Huang, X. The 30 m annual land cover dataset and its dynamics in China from 1990 to 2019. Earth Syst. Sci. Data 2021, 13, 3907–3925. [Google Scholar] [CrossRef] [Scilit]
  36. Stocker, B.D.; Tumber-Davila, S.J.; Konings, A.G.; Anderson, M.C.; Hain, C.; Jackson, R.B. Global patterns of water storage in the rooting zones of vegetation. Nat. Geosci. 2023, 16, 250–256. [Google Scholar] [CrossRef] [Scilit]
  37. Stocker, B.D. Global Rooting Zone Water Storage Capacity and Rooting Depth Estimates. Zenodo, 2021, Version v1.0. Available online: https://zenodo.org/records/5515246 (accessed on 10 July 2026).
  38. Shangguan, Z.; Mao, S. 1:5,000,000 Geographic Feature Dataset of the Loess Plateau (2000 and 2020), Layer Used: Loess Boundary 2000 (Loess Boundary 2000 Shapefile); National Earth System Science Data Center, National Science & Technology Infrastructure of China: Beijing, China, 2024; Available online: https://www.geodata.cn/data/datadetails.html?dataguid=14955480171164 (accessed on 10 July 2026). (In Chinese)
  39. Xu, X. China Multi-Year Provincial Administrative Boundary Dataset; Resource and Environmental Science Data Registration and Publication System: Beijing, China, 2023; Available online: https://www.resdc.cn/ (accessed on 10 July 2026). (In Chinese)
  40. NASA JPL. NASA Shuttle Radar Topography Mission Global 1 Arc Second V003; NASA EOSDIS Land Processes Distributed Active Archive Center: Sioux Falls, SD, USA, 2013. Available online: https://lpdaac.usgs.gov/products/srtmgl1v003/ (accessed on 10 July 2026).
  41. Farr, T.G.; Rosen, P.A.; Caro, E.; Crippen, R.; Duren, R.; Hensley, S.; Kobrick, M.; Paller, M.; Rodriguez, E.; Roth, L.; et al. The Shuttle Radar Topography Mission. Rev. Geophys. 2007, 45, RG2004. [Google Scholar] [CrossRef] [Scilit]
  42. Theil, H. A rank-invariant method of linear and polynomial regression analysis, I, II, III. Proc. K. Ned. Akad. Van. Wet. 1950, 53, 386–392+512–525+1397–1412. [Google Scholar]
  43. Sen, P.K. Estimates of the Regression Coefficient Based on Kendall’s Tau. J. Am. Stat. Assoc. 1968, 63, 1379–1389. [Google Scholar] [CrossRef]
  44. Mann, H.B. Nonparametric Tests Against Trend. Econometrica 1945, 13, 245–259. [Google Scholar] [CrossRef] [Scilit]
  45. Kendall, M.G. Rank Correlation Methods, 4th ed.; Charles Griffin: London, UK, 1975. [Google Scholar]
  46. Hamed, K.H.; Rao, A.R. A modified Mann-Kendall trend test for autocorrelated data. J. Hydrol. 1998, 204, 182–196. [Google Scholar] [CrossRef] [Scilit]
  47. Benjamini, Y.; Yekutieli, D. The Control of the False Discovery Rate in Multiple Testing under Dependency. Ann. Stat. 2001, 29, 1165–1188. [Google Scholar] [CrossRef] [Scilit]
  48. Spearman, C. The Proof and Measurement of Association between Two Things. Am. J. Psychol. 1904, 15, 72–101. [Google Scholar] [CrossRef] [Scilit]
  49. Haining, R. Bivariate Correlation with Spatial Data. Geogr. Anal. 1991, 23, 210–227. [Google Scholar] [CrossRef] [Scilit]
  50. Künsch, H.R. The Jackknife and the Bootstrap for General Stationary Observations. Ann. Stat. 1989, 17, 1217–1241. [Google Scholar] [CrossRef] [Scilit]
  51. Lahiri, S.N. Resampling Methods for Dependent Data; Springer: New York, NY, USA, 2003. [Google Scholar] [CrossRef] [Scilit]
  52. Kutner, M.H.; Nachtsheim, C.J.; Neter, J.; Li, W. Applied Linear Statistical Models; McGraw-Hill Education: Noida, India, 2004. [Google Scholar]
  53. Roberts, D.R.; Bahn, V.; Ciuti, S.; Boyce, M.S.; Elith, J.; Guillera-Arroita, G.; Hauenstein, S.; Lahoz-Monfort, J.J.; Schroder, B.; Thuiller, W.; et al. Cross-validation strategies for data with temporal, spatial, hierarchical, or phylogenetic structure. Ecography 2017, 40, 913–929. [Google Scholar] [CrossRef] [Scilit]
  54. Wadoux, A.M.C.; Heuvelink, G.B.; de Bruin, S.; Brus, D.J. Spatial cross-validation is not the right way to evaluate map accuracy. Ecol. Model. 2021, 457, 109692. [Google Scholar] [CrossRef] [Scilit]
  55. Moran, P.A.P. Notes on Continuous Stochastic Phenomena. Biometrika 1950, 37, 17–23. [Google Scholar] [CrossRef] [Scilit]
  56. Wang, M.; Yin, G.; Mao, M.; Zhang, H.; Zhang, H.; Hu, Z.; Chen, X. Spatiotemporal features of the soil moisture across Northwest China using remote sensing data, reanalysis data, and global hydrological model. Front. Environ. Sci. 2023, 11, 1164895. [Google Scholar] [CrossRef] [Scilit]
  57. Bai, W.; Gu, X.; Li, S.; Tang, Y.; He, Y.; Gu, X.; Bai, X. The Performance of Multiple Model-Simulated Soil Moisture Datasets Relative to ECV Satellite Data in China. Water 2018, 10, 1384. [Google Scholar] [CrossRef] [Scilit]
  58. Cheng, S.; Huang, J.; Ji, F.; Lin, L. Uncertainties of soil moisture in historical simulations and future projections. J. Geophys. Res. Atmos. 2017, 122, 2239–2253. [Google Scholar] [CrossRef] [Scilit]
  59. Agutu, N.; Ndehedehe, C.; Awange, J.; Kirimi, F.; Mwaniki, M. Understanding uncertainty of model-reanalysis soil moisture within Greater Horn of Africa (1982–2014). J. Hydrol. 2021, 603, 127169. [Google Scholar] [CrossRef] [Scilit]
  60. Gruber, A.; Su, C.H.; Crow, W.T.; Zwieback, S.; Dorigo, W.A.; Wagner, W. Estimating error cross-correlations in soil moisture data sets using extended collocation analysis. J. Geophys. Res. Atmos. 2016, 121, 1208–1219. [Google Scholar] [CrossRef] [Scilit]
  61. Beck, H.E.; Pan, M.; Miralles, D.G.; Reichle, R.H.; Dorigo, W.A.; Hahn, S.; Sheffield, J.; Karthikeyan, L.; Balsamo, G.; Parinussa, R.M.; et al. Evaluation of 18 satellite- and model-based soil moisture products using in situ measurements from 826 sensors. Hydrol. Earth Syst. Sci. 2021, 25, 17–40. [Google Scholar] [CrossRef] [Scilit]
  62. Kergoat, L.; Grippa, M.; Baille, A.; Eymard, L.; Lacaze, R.; Mougin, E.; Ottlé, C.; Pellarin, T.; Polcher, J.; de Rosnay, P.; et al. Remote sensing of the land surface during the African Monsoon Multidisciplinary Analysis (AMMA). Atmos. Sci. Lett. 2011, 12, 129–134. [Google Scholar] [CrossRef] [Scilit]
  63. He, L.; Guo, J.; Liu, X.; Yang, W.; Chen, L.; Jiang, Q.; Bai, M. Exploring the multifaceted reason for deficits in soil water within different soil layers in China’s drylands. J. Environ. Manag. 2025, 373, 123634. [Google Scholar] [CrossRef] [Scilit] [PubMed]
  64. Deng, Y.; Wang, S.; Bai, X.; Luo, G.; Wu, L.; Chen, F.; Wang, J.; Li, C.; Yang, Y.; Hu, Z.; et al. Vegetation greening intensified soil drying in some semi-arid and arid areas of the world. Agric. For. Meteorol. 2020, 292–293, 108103. [Google Scholar] [CrossRef] [Scilit]
  65. Akbari, K.; Winter, S.; Tomko, M. Spatial Causality: A Systematic Review on Spatial Causal Inference. Geogr. Anal. 2023, 55, 56–89. [Google Scholar] [CrossRef] [Scilit]
  66. Lan, L.; Zhang, T.; He, F.; Wang, B.; Bao, J. Impact of vegetation restoration on soil moisture dynamics in temperate water-limited regions. J. Hydrol. Reg. Stud. 2025, 60, 102605. [Google Scholar] [CrossRef] [Scilit]
  67. Meroni, M.; Schucknecht, A.; Fasbender, D.; Rembold, F.; Fava, F.; Mauclaire, M.; Goffner, D.; Di Lucchio, L.M.; Leonardi, U. Remote sensing monitoring of land restoration interventions in semi-arid environments with a before–after control-impact statistical design. Int. J. Appl. Earth Obs. Geoinf. 2017, 59, 42–52. [Google Scholar] [CrossRef] [Scilit]
  68. Brudvig, L.A.; Catano, C.P. Prediction and uncertainty in restoration science. Restor. Ecol. 2024, 32, e13380. [Google Scholar] [CrossRef] [Scilit]
  69. Crow, W.T.; Berg, A.A.; Cosh, M.H.; Loew, A.; Mohanty, B.P.; Panciera, R.; de Rosnay, P.; Ryu, D.; Walker, J.P. Upscaling sparse ground-based soil moisture observations for the validation of coarse-resolution satellite soil moisture products. Rev. Geophys. 2012, 50, RG2002. [Google Scholar] [CrossRef] [Scilit]
  70. Chen, W.; Guo, Y.; Zhang, Q.; Sun, C. Adaptability Evaluation of Multi-source Remote Sensing Products to Soil Moisture Retrieval in Loess Hilly and Gully Region. J. Basic Sci. Eng. 2023, 31, 1155–1169. [Google Scholar] [CrossRef]
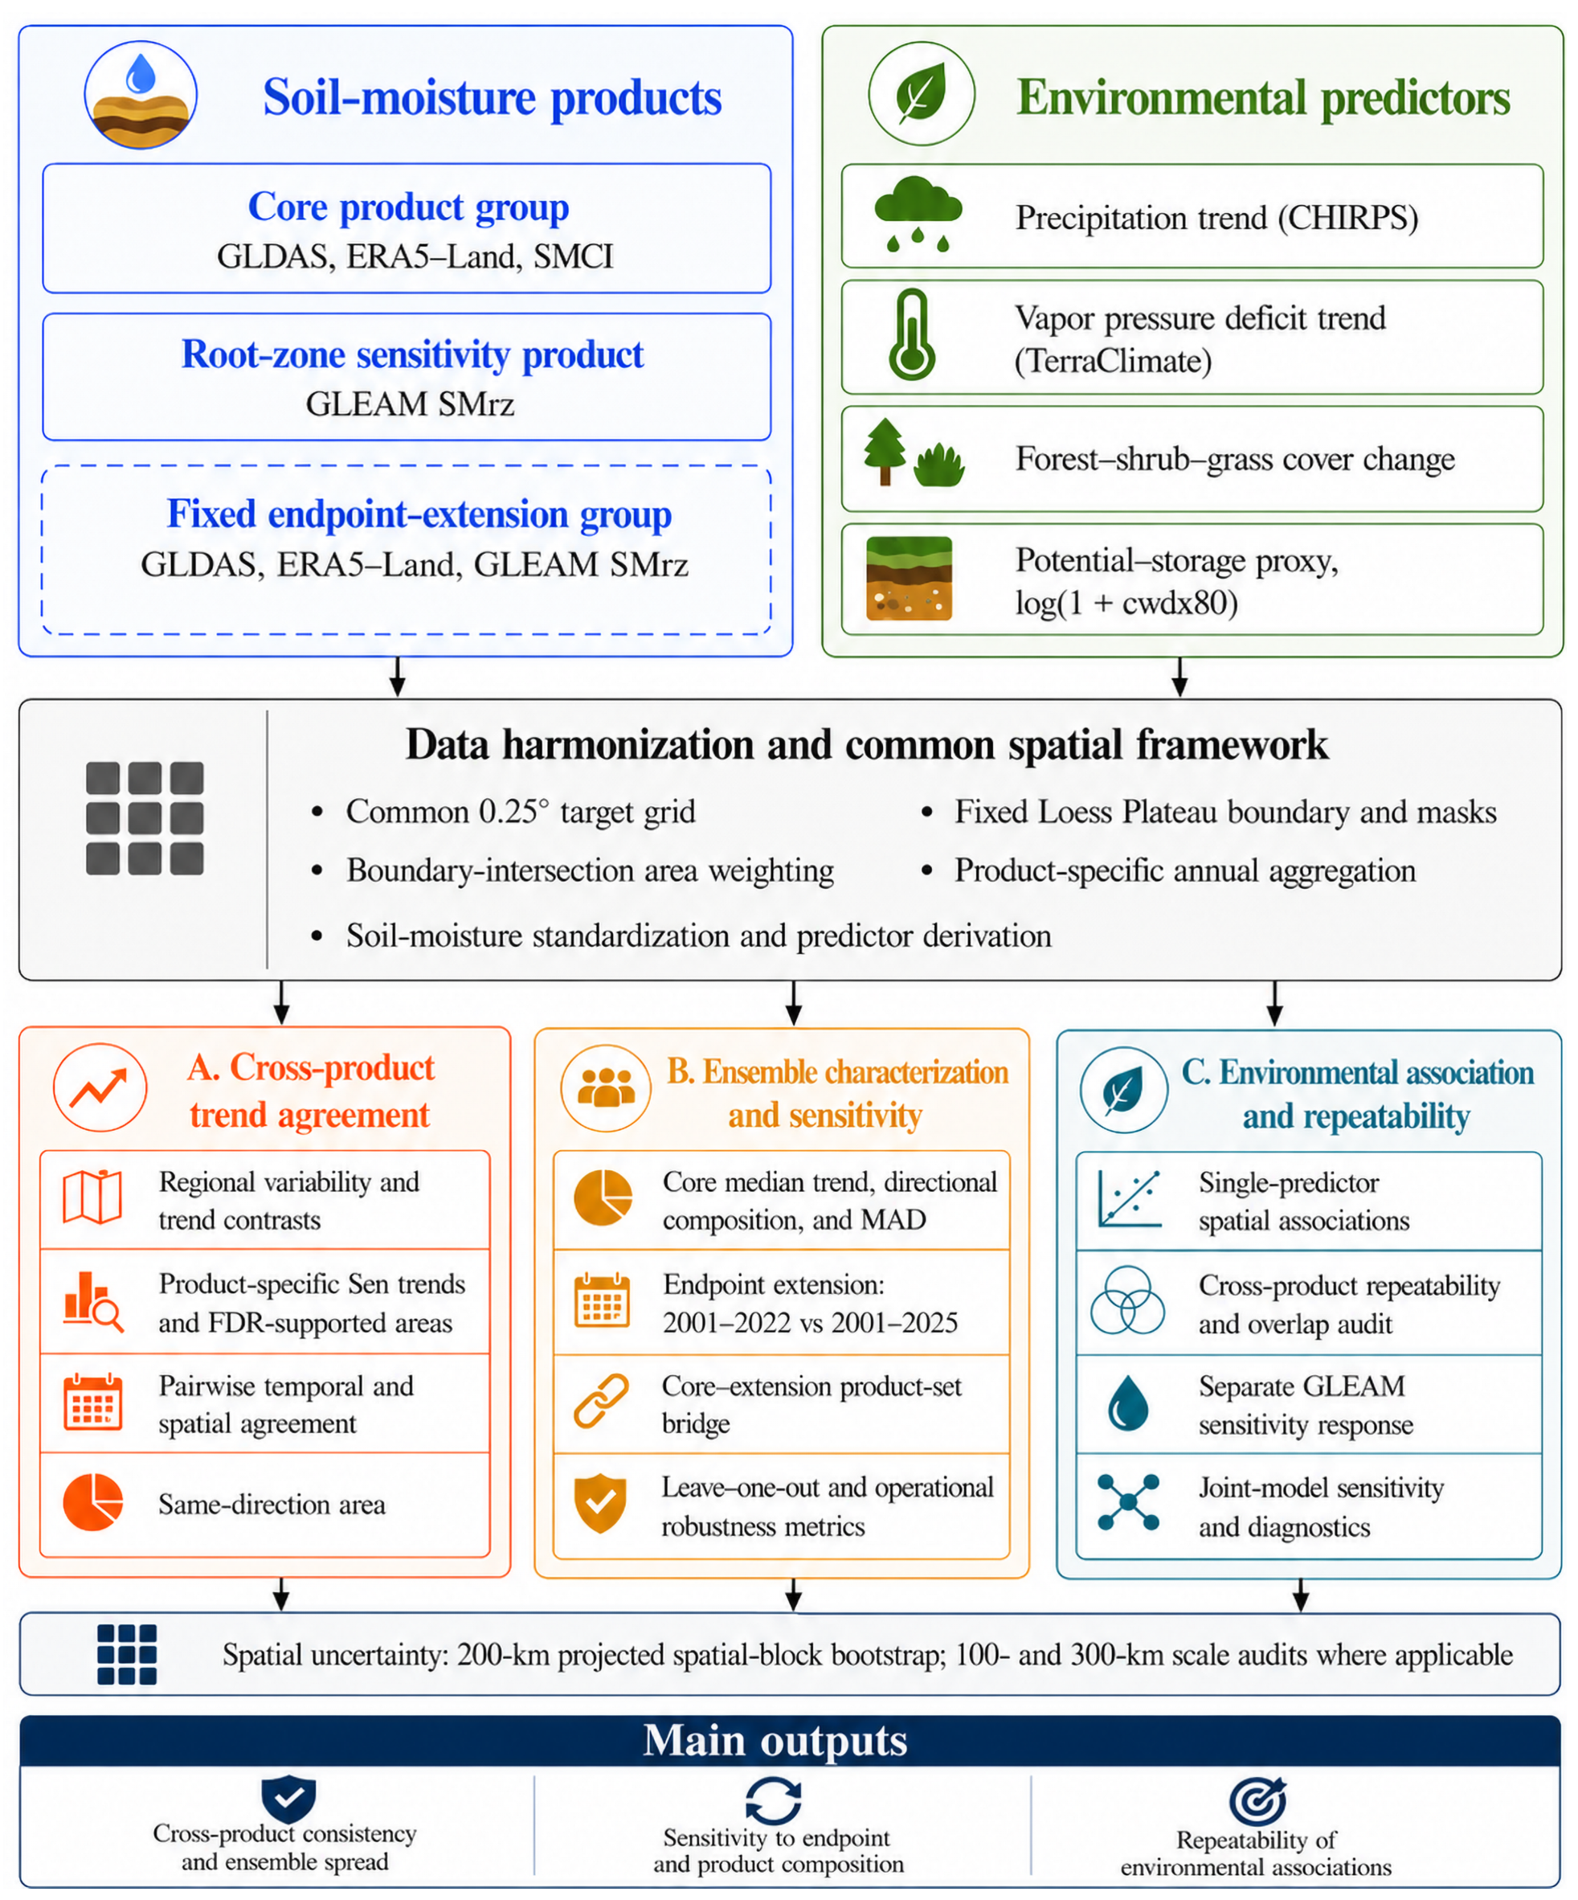
Figure 2. Analytical framework for the multi-product soil-moisture trend robustness audit. The workflow harmonizes products and predictors to a common boundary-area-weighted grid, then evaluates product-specific trends, ensemble structure, endpoint and product-set sensitivity, and environmental-association repeatability. Global Land Data Assimilation System (GLDAS), ECMWF Reanalysis v5 Land (ERA5-Land), and Soil Moisture of China by in situ data (SMCI) form the core group; Global Land Evaporation Amsterdam Model root-zone soil moisture (GLEAM SMrz) is retained as a sensitivity product.
Water 18 02104 g002
Figure 3. Regional annual variability and trend contrasts among soil-moisture products, 2001–2022. (a) Regional standardized anomaly series for GLDAS, ERA5-Land, and SMCI. (b) GLEAM SMrz compared with the core-product median and range; shading denotes inter-product range, not a confidence interval. (c) Regional Sen slopes with ordinary 95% Theil–Sen intervals. (d) Pearson correlations among Sen-detrended regional series; the upper triangle encodes magnitude, and the lower triangle gives coefficients and temporal p-value markers. *** denotes p < 0.001.
Water 18 02104 g003
Figure 4. Spatial patterns of product-specific standardized Sen slopes, 2001–2022. Panels show (a) GLDAS, (b) ERA5-Land, (c) SMCI, and (d) GLEAM SMrz. Trend units are local interannual SD decade−1. Black stippling marks cells with q < 0.05 after the modified Mann–Kendall test and within-product Benjamini–Yekutieli FDR adjustment. All maps use the fixed common mask and a shared 1.5 to 1.5 color scale.
Water 18 02104 g004
Figure 5. Product-specific trend distributions and pairwise spatial agreement, 2001–2022. (a) Boundary-area-weighted trend distributions; thin lines show 5th–95th percentiles, thick segments show interquartile ranges, and open circles show medians. (b) Pairwise agreement matrix. The upper triangle gives area-weighted spatial rank correlation, ρ w ; the lower triangle gives same-sign area. Directional agreement uses Sen-slope signs without a q-value threshold. Panel (a) colors identify the four soil-moisture products; in panel (b), purple-to-orange shading represents signed spatial rank correlation, and blue shading represents same-sign area.
Water 18 02104 g005
Figure 6. Core-product median trend, directional agreement, and inter-product spread, 2001–2022. (a) Core median trend, M g , from GLDAS, ERA5-Land, and SMCI. (b) Number of core products matching the sign of M g . (c) Inter-product median absolute deviation, D g . (d) Product with a sign opposing the median in mixed-direction cells; gray cells have unanimous signs. Trend and spread units are local interannual SD decade−1.
Water 18 02104 g006
Figure 7. Directional composition and spread relative to median-trend magnitude, 2001–2022. (a) Area shares of unanimous decline, mixed direction, and unanimous increase, plus the opposing-product composition within mixed-direction cells. (b) Relationship between | M g | and D g ; marker area follows boundary weight, color denotes the sign of M g , and the dashed line marks D g = | M g | . The reported ρ w = 0.319 interval for panel (b) is 0.418 to 0.211 , from the primary 200-km projected spatial-block bootstrap. Directional classes use Sen-slope signs without a q-value threshold.
Water 18 02104 g007
Figure 8. Endpoint-extension sensitivity for the fixed extension set. (a) Median trend for 2001–2022. (b) Median trend for 2001–2025, standardized to the 2001–2022 reference period. (c) Sign persistence or reversal between the two endpoints. Stable classes refer only to Sen-slope sign and do not imply FDR support. The extension set comprises GLDAS, ERA5-Land, and GLEAM SMrz.
Water 18 02104 g008
Figure 9. Product-set bridge and core-set leave-one-out sensitivity, 2001–2022. (a) Sign correspondence between core-set and extension-set median trends. (b) Number of core-product leave-one-out tests that changed the sign relative to the full core median. Stable and change classes use Sen-slope signs without a q-value threshold. The core set is GLDAS, ERA5-Land, and SMCI; the extension set replaces SMCI with GLEAM SMrz.
Water 18 02104 g009
Figure 10. Operational metric space for endpoint-extension and product-selection checks. Points summarize area-weighted spatial rank correlation, ρ w , and same-direction area; error bars are 95% confidence intervals from the primary 200-km projected spatial-block bootstrap. The shaded region marks the descriptive benchmark ρ w 0.70 and same-direction area 75 % . Classification is based on point estimates, not a hypothesis test.
Water 18 02104 g010
Figure 11. Single-predictor environmental associations with annual soil-moisture trends, 2001–2022. Panels show ρ w between standardized soil-moisture Sen slopes and (a) precipitation trend, (b) VPD trend, (c) forest–shrub–grass cover change, and (d) log-transformed S CWDX 80 . Points are estimates, horizontal bars are 95% confidence intervals from the primary 200-km projected spatial-block bootstrap, and the dashed line marks zero. Colors denote products and the display-only core-product median.
Water 18 02104 g011
Figure 12. Joint-model sensitivity of environmental associations, 2001–2022. Panels show predictor-standardized adjusted coefficients for (a) precipitation trend, (b) VPD trend, (c) forest–shrub–grass cover change, and (d) log-transformed S CWDX 80 . Points are coefficients, horizontal bars are 95% confidence intervals from the primary 200-km projected spatial-block bootstrap, and the dashed line marks zero. Coefficients are shown only as descriptive adjusted-association diagnostics conditional on the included predictors. They are not interpreted as causal effects, contribution estimates, or measures of relative driver importance. Spatial cross-validation and residual Moran’s I indicated limited spatial predictive skill and substantial unexplained residual spatial structure.
Water 18 02104 g012
Table 3. Cross-product repeatability and overlap audit of environmental associations, 2001–2022. Entries summarize the interval-sign classifications from Figure 11; +, −, and 0 denote intervals above zero, below zero, and crossing zero, respectively. Classifications are descriptive and are based on interval signs rather than q-value thresholds.
Environmental VariableCore Output ClassificationGLEAM ResponseClassification After Overlap ExclusionsStability Across 100-, 200-, and 300-km Blocks
PrecipitationW (0/3)− (negative)0 (0/3)No
VPDW (0/3)0 (crosses zero)0 (0/3)Yes
Forest–shrub–grass cover changeW (1/3)− (product-specific)0 (0/2)No
S CWDX 80 potential-storage proxyW (0/3)0 (crosses zero)0 (0/3)Yes
R = repeated same-direction support in all three core products; P = partial same-direction support in at least two of three core products; W = weak or unresolved support; C = product-dependent or conflicting support; U = unresolved support after analysis-specified overlap exclusions. “Stability” indicates whether the categorical result was unchanged when the spatial-block size was varied among 100-, 200-, and 300-km projected blocks.
Disclaimer/Publisher’s Note: The statements, opinions and data contained in all publications are solely those of the individual author(s) and contributor(s) and not of MDPI and/or the editor(s). MDPI and/or the editor(s) disclaim responsibility for any injury to people or property resulting from any ideas, methods, instructions or products referred to in the content.