1. Introduction
Suspended solids (SS) constitute a fundamental parameter in the assessment of water quality in karst plateau lakes, as they directly influence water transparency, light penetration, and the processes of nutrient migration and transformation [
1,
2,
3]. As a representative karst plateau lake, Pingzhai Reservoir serves as a crucial source of irrigation and drinking water in Guizhou Province. Its aquatic environment is influenced by a combination of natural factors and anthropogenic activities [
4,
5,
6]. Traditional empirical models and machine learning approaches have achieved some progress in SS concentration inversely estimated; however, they exhibit notable limitations. Conventional single-band linear models and dual-band ratio models are commonly applied in plain lake environments, yet their accuracy diminishes considerably in karst plateau lakes due to interference from elevated pH levels and high concentrations of suspended particulate matter [
7,
8,
9]. Spectral reflectance is fundamental to remote sensing identification and retrieval. Singh and Garg [
10] showed that target discrimination depends on spectral characteristics, sensor resolution, and wavelength selection. This finding highlights the importance of selecting sensitive spectral features for quantitative remote sensing.
In recent years, machine learning models have demonstrated considerable potential in the remote sensing inversion of complex water bodies, owing to their strong nonlinear fitting capabilities [
11]. Algorithms such as Random Forest (RF) and Extreme Gradient Boosting (XGBoost) have been employed for SS concentration inversion in inland lakes and coastal waters, exhibiting significantly higher accuracy compared to traditional empirical models [
12]. For instance, the coefficient of determination (R
2) of the RF model for SS inversion in turbid water bodies can exceed 0.85, representing an improvement of approximately 40% over conventional linear models [
12,
13,
14]. Nevertheless, these models have not been extensively investigated with respect to their adaptation to the distinctive “alkaline trap” effect and seasonal hydrological variations characteristic of karst plateau lakes, and a comprehensive SS inversion methodology remains undeveloped [
3,
15,
16]. As an advancement of the RF model, the Extremely Randomized Trees (ERT) algorithm mitigates the risk of overfitting by increasing the randomness in decision tree construction and exhibits enhanced robustness in handling high-dimensional spectral features and complex interference factors [
17,
18,
19]. Consequently, ERT holds promise for addressing the technical challenges associated with SS inversion in karst plateau lakes.
Recent research has concurrently investigated innovative remote sensing methodologies specifically adapted to the distinctive optical characteristics of karst wetlands. Lao et al. [
20] introduced a constrained PROSAIL-PRO spectral matching (CPSM) technique to extend UAV multispectral reflectance measurements across the 400–2500 nm range, enabling highly accurate estimations of canopy nitrogen and phosphorus contents in karst wetland vegetation. Yang et al. [
21] estimated chlorophyll-a concentrations in karst wetlands by integrating multi-sensor data (ASD, UAV, Planet CubeSat) within a transfer learning framework, thereby demonstrating the efficacy of multi-source data fusion in complex aquatic environments. Addressing non-optically active water-quality parameters, including total nitrogen, total phosphorus, ammonia nitrogen, and dissolved oxygen, Fu et al. [
22] proposed a pH-based hierarchical analysis framework that elucidates the spectral specificity of alkaline karst waters and enhances estimation accuracy to R
2 > 0.9. Yang et al. [
21] combined deep learning algorithms (Transformer, MDN) with multi-platform (UAV and satellite) multispectral and hyperspectral imagery to precisely map chlorophyll-a, phycocyanin, turbidity, and dissolved oxygen in karst wetlands. Collectively, these advancements suggest that approaches such as feature engineering, hierarchical modeling, and the incorporation of physical constraints can effectively mitigate the spectral mixing effects induced by elevated pH levels and calcite particles in karst waters. However, a comprehensive methodology that fully leverages Sentinel-2 red-edge bands and nonlinear features to disentangle SS concentrations from carbonate particle signals in karst plateau lakes remains absent, thereby motivating the present study.
The Multispectral Instrument (MSI) aboard the Sentinel-2 satellite offers several advantages, including high spatial resolution (ranging from 10 to 60 m), a short revisit interval of five days, and a broad spectral range encompassing blue, green, red, red edge, and near-infrared bands. These features provide robust data support for remote sensing-based water-quality monitoring [
12,
23]. Previous research has demonstrated that Sentinel-2 data can mitigate the interference caused by calcium carbonate in karst water bodies through the utilization of red-edge bands, thereby enhancing the accuracy of water-quality parameter retrievals [
4,
24]. For instance, Dan et al. [
5] successfully retrieved chlorophyll a concentrations in Pingzhai Reservoir using Sentinel-2 imagery, reporting that the inclusion of red-edge bands improved inversion accuracy by more than 35%. Similarly, Wen et al. [
4] effectively estimated water transparency in Pingzhai Reservoir based on Sentinel-2 data, confirming that multi-band combinations can significantly reduce the interference from suspended particulate matter. Nevertheless, investigations into SS concentration retrieval in karst plateau lakes using Sentinel-2 data in conjunction with the ERT model remain limited. Furthermore, the identification of sensitive spectral features and the elucidation of inversion mechanisms for SS in these water bodies warrant further comprehensive study.
To address the aforementioned research gaps, this study focuses on Pingzhai Reservoir, a representative karst plateau lake. Utilizing Sentinel-2 MSI Level 2A imagery alongside field sampling data collected from 40 sites, a feature engineering approach is proposed that selects the top 20 spectral features exhibiting the highest correlation with SS concentration. This approach includes both sensitive single-band features and their linear and nonlinear combinations. Leveraging the robust nonlinear modeling capabilities of the ERT algorithm, a remote sensing inversion framework for estimating SS concentration in karst plateau lakes is developed. The specific objectives of this research are: (1) to identify spectral features sensitive to near-surface SS concentration in karst plateau lakes using Sentinel-2 data; (2) to evaluate the performance of the ERT model relative to other machine learning and traditional empirical models in SS concentration inversion; and (3) to characterize the spatiotemporal distribution patterns and driving factors influencing near-surface SS concentration in Pingzhai Reservoir. To enable high-precision remote sensing monitoring of SS concentration in karst plateau lakes, this study aims to construct a technical framework combining sensitive feature selection and machine learning techniques, which delivers scientific basis for regional water-quality management and ecological conservation practices.
2. Materials and Methods
2.1. Overview of the Study Area
2.1.1. Geographic Location
Located in the karst mountainous region of northwestern Guizhou Province, Pingzhai Reservoir (105°17′3″ E–105°26′44″ E, 26°29′33″ N–26°35′38″ N) spans the administrative junction of Nayong County, Zhijin County, Liuzhi Special District, and Shuicheng District of Liupanshui City. Formed by the convergence of five rivers, it serves as the source reservoir for the Qianzhong Water Conservancy Hub Project [
25]. It constitutes a critical resource for irrigation and potable water supply in Guizhou Province. As a globally significant core area of karst human settlement, approximately one-quarter of the world’s karst population depends on karst water resources for sustenance, with over 100 million individuals residing in the karst regions of southern China alone. The karst landforms are characterized by a thin soil layer, extensively developed fractures, and complex underground river systems, rendering aquifers highly susceptible to pollution [
26,
27]. SS concentration, as a key vector of pollutants in aquatic environments, directly influences the water quality and safety of the reservoir. Consequently, research focused on the remote sensing inversion of SS concentration in this region holds substantial practical importance [
5,
6].
2.1.2. Geological and Climatic Characteristics
In the Pingzhai Reservoir basin, the majority of exposed strata belong to the Triassic and Permian systems, including the Triassic Yelang Formation (T1y), Guanling Formation (T2g), Daye Formation (T1d), Jialingjiang Formation (T1j), and the Permian Maokou Formation (P2m), Dalong Formation (P3d), Longtan Formation (P3l). The lithological composition is chiefly characterized by carbonate rocks, including limestone and dolomite, interbedded with sandstone, mudstone, and coal seams. The widespread presence of carbonate rocks leads to suspended particulate matter in the water being primarily composed of calcite (CaCO3), which constitutes over 65% of the total. The high backscattering coefficient (b_b(555) = 1.2 m−1) associated with this composition substantially complicates the separation of spectral signals.
The study area features a subtropical humid monsoon climate, with a mean annual temperature of 14.5 °C and average annual precipitation of 1089.6 mm. Rainfall is concentrated mainly from May to September, making up roughly 70% of the total annual precipitation. This pronounced seasonal precipitation results in significant fluctuations in reservoir water levels, with an increase of approximately 2 m during the summer and a decrease of 2 to 3 m in winter, leading to the formation of extensive exposed shoals. These seasonal variations in water level not only modify the hydraulic conditions of the water body but also influence the resuspension and sedimentation dynamics of suspended particulate matter, thereby underpinning the spatiotemporal heterogeneity of SS concentration.
The land use/land cover surrounding the Pingzhai Reservoir basin is predominantly characterized by agricultural cropland, forest, and scattered residential areas, with cropland being the dominant type along the inflow river valleys and gentle slopes, while forest and grassland primarily occupy the steeper karst hillslopes. Although a systematic quantitative assessment of land-use composition is beyond the scope of this study, field observations and regional land-use records indicate that agricultural activities and rural settlements are the major anthropogenic sources contributing to suspended solids and associated nutrient inputs to the reservoir. This land-use setting, combined with the region’s pronounced topographic relief and well-developed karst fracture networks, facilitates the rapid transport of terrigenous particulate matter into the water body during rainfall events, thereby exerting considerable influence on the spatiotemporal dynamics of SS concentration.
2.1.3. Socio-Economic Impacts
The Pingzhai Reservoir basin encompasses 12 towns and townships characterized by a dense population. Human activities, including agricultural production, residential living, and seasonal tourism, constitute the primary factors influencing SS concentration in the water. During the summer, the application of agricultural chemical fertilizers can reach up to 300 kg/ha [
28,
29]. Consequently, a substantial amount of nutrients enters the water body alongside particulate matter, which not only facilitates algal growth but also directly elevates SS concentration. In the peak tourism season of summer, domestic pollution generated by tourists and disturbances caused by tourism activities contribute to SS concentrations reaching their annual maximum. Conversely, during the off-peak tourism season in winter, pollution inputs decline, resulting in the lowest SS concentrations. The interplay between human activities and natural factors produces complex spatiotemporal variations in SS concentration within the Pingzhai Reservoir.
2.2. Field-Measured Data
2.2.1. Field Sampling and Data Collection
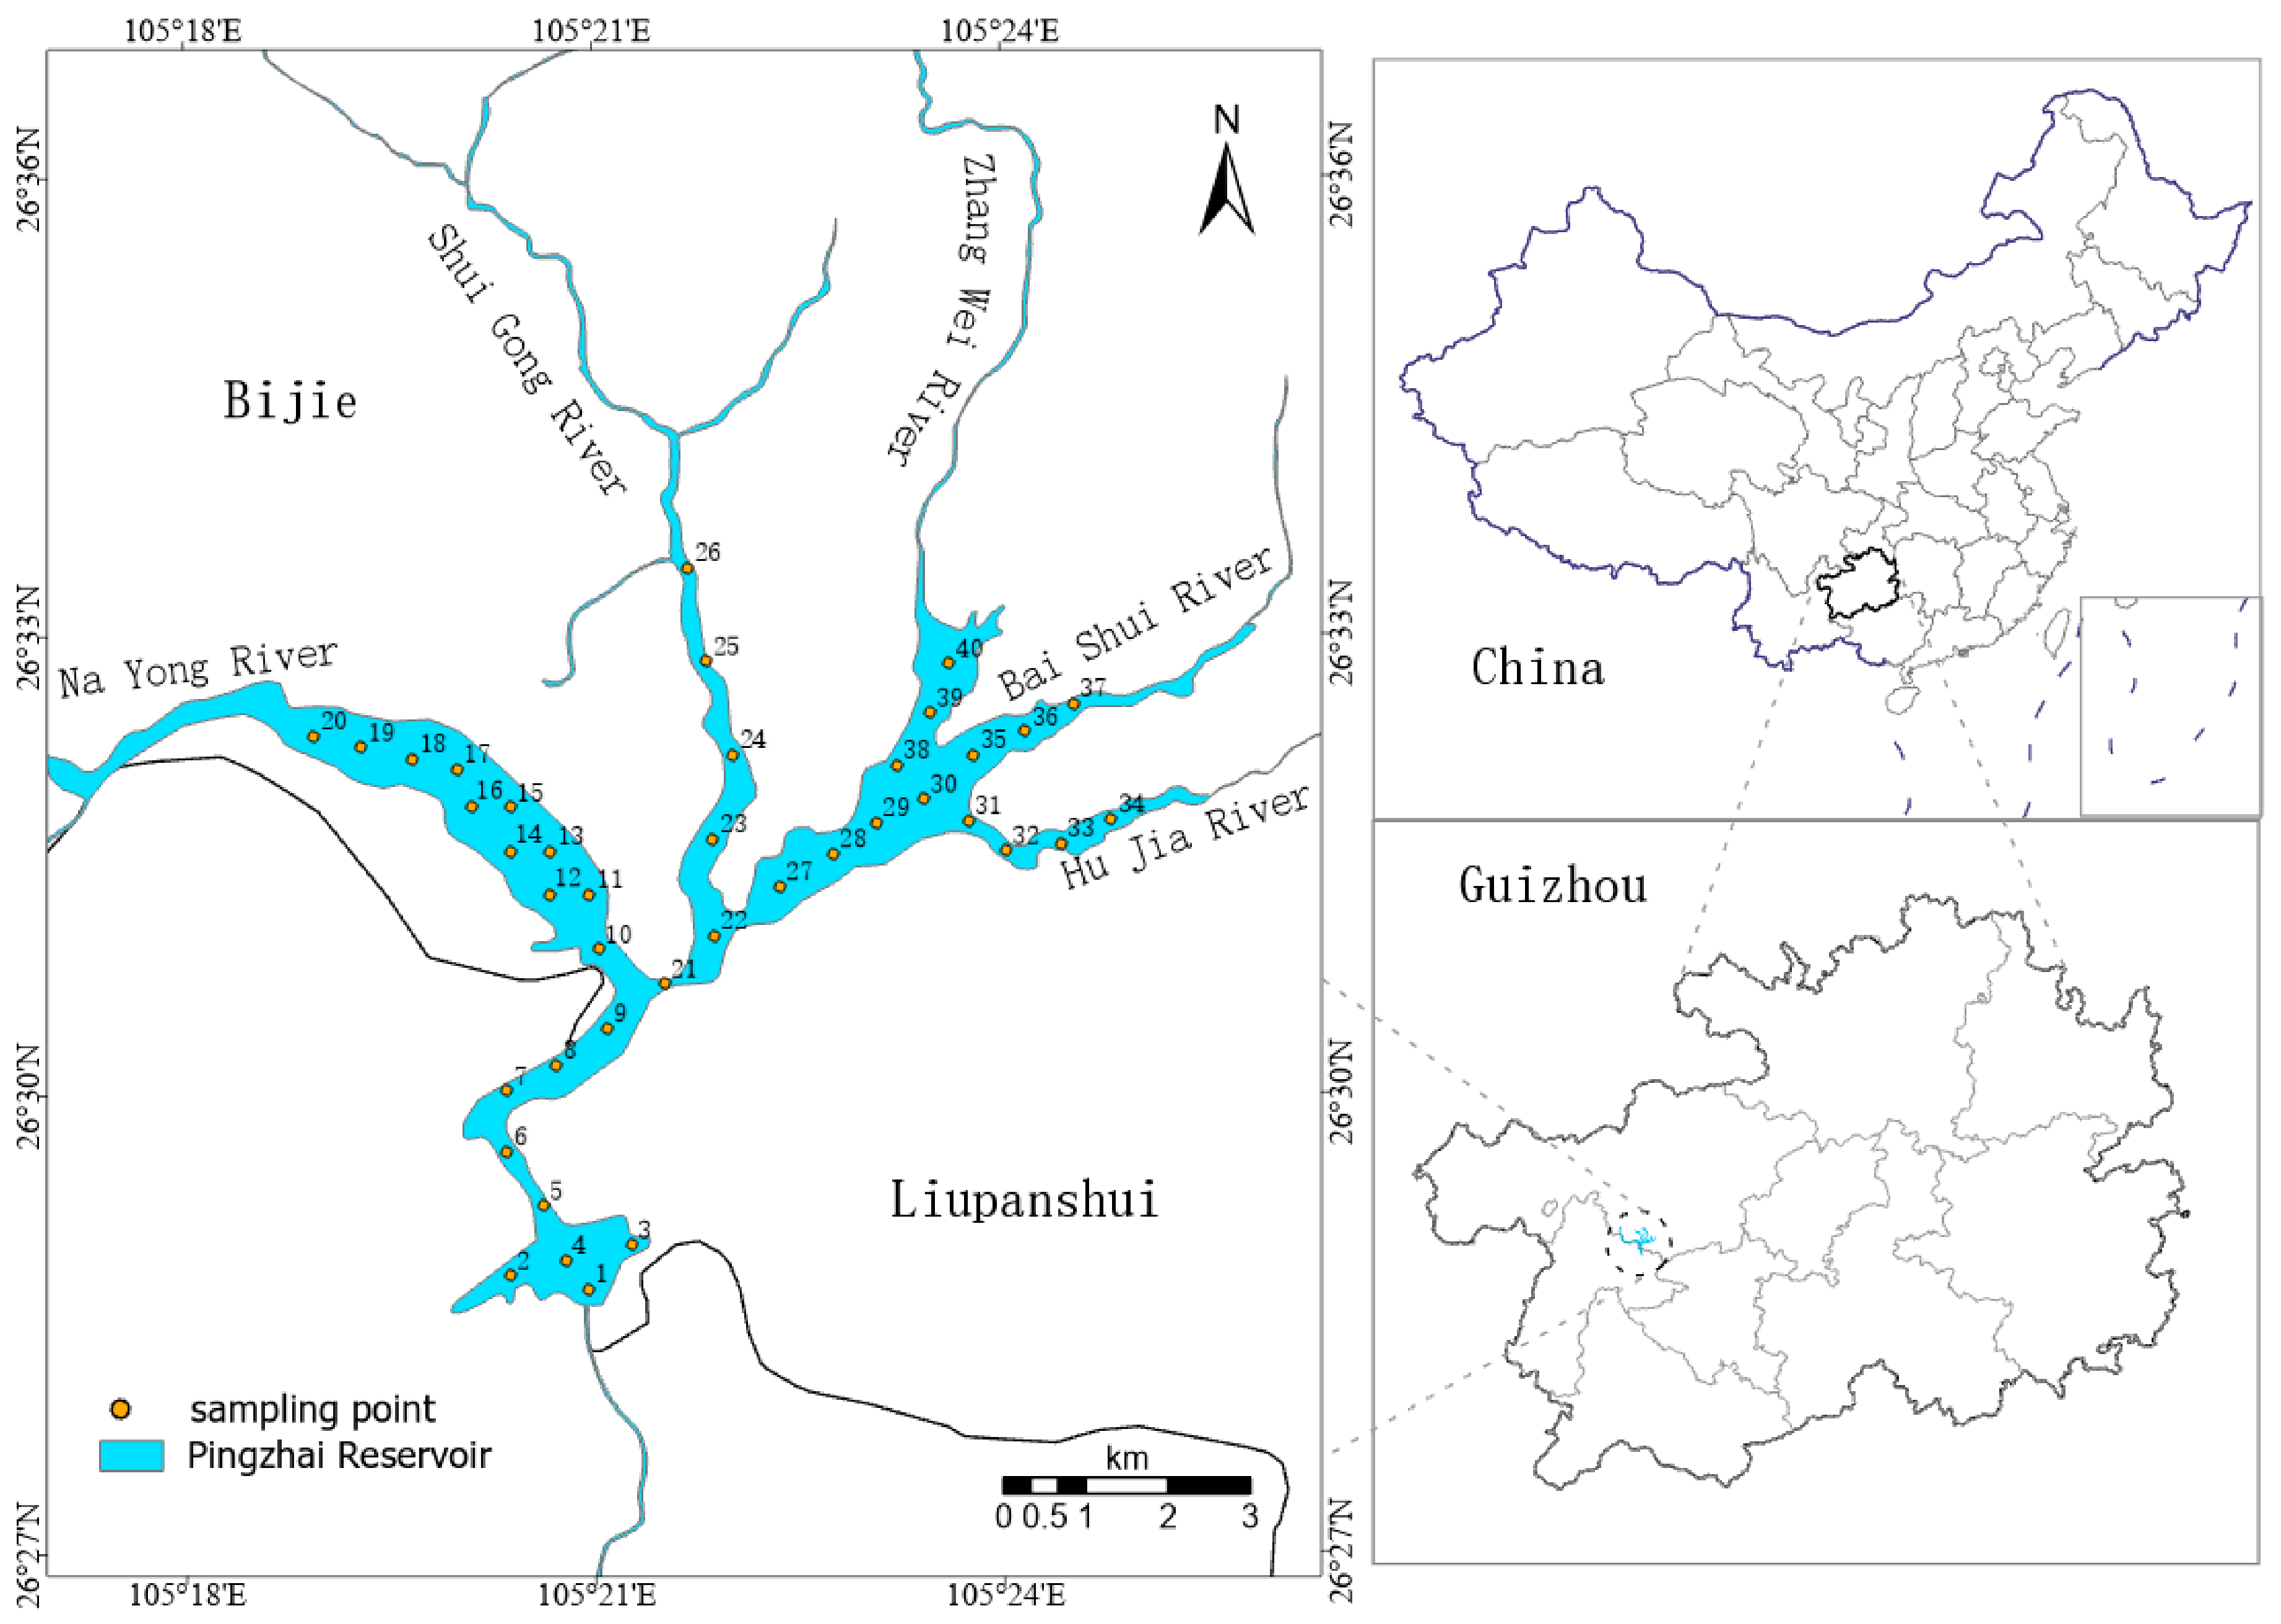
To account for both the accessibility of the five rivers discharging into Pingzhai Reservoir and the mountain shadow effect at a 45° solar zenith angle (computed from DEM data in ArcGIS 10.8), a stratified random sampling method was adopted to fix the number of sampling points [
30]. In light of the reservoir’s surface area and the statistical power required for water-quality analysis, 40 sampling sites were deemed sufficient to represent the reservoir’s overall water quality with an acceptable margin of error. The reservoir was partitioned into multiple subzones based on the flow directions of the five inflow rivers and the potential effects of mountain shadows. Sampling points were uniformly allocated across these subzones to ensure representativeness of the reservoir’s varied hydrological and environmental conditions. Moreover, the sampling scheme followed the principles of avoiding mountain shadow interference and preserving even spatial coverage (see
Figure 1).
Five sampling campaigns were carried out in November 2023, April 2024, July 2024, October 2024, and January 2025, all under clear weather with low wind speeds. Sampling was conducted by boat, and sampling locations were recorded using a handheld GPS unit. A 500 mL water sample was collected at a depth of 0.5 m below the water surface and stored in a polyethylene bottle that had been pre-washed with deionized water. Field measurements of pH, water temperature (WT), electrical conductivity (EC) and dissolved oxygen (DO) were acquired using a WTW Multi3430 (Weilheim, Germany) portable multi-parameter water-quality analyzer, which underwent repeated calibration with laboratory standard solutions. The instrument delivers respective accuracies of ±0.01 pH units, ±0.01 °C, ±1 μS/cm and ±0.01 mg/L for the four parameters.
In situ hyperspectral data of water bodies were acquired using an ASD FieldSpec 4 (Boulder, CO, USA) Standard-Res portable spectroradiometer. This instrument operates over a wavelength range of 350 to 2500 nm, offering higher spectral resolution in the visible region and standard resolution in the short-wave near-infrared region. Featuring low noise and high accuracy, the instrument is well suited for fast, precise field spectral measurements. In accordance with the above-water measurement protocol, ten synchronous spectral curves were collected for each of the 40 water samples during 09:00–16:00 on 28–29 April, 24–25 July, and 22–23 October 2024, under clear, cloudless skies and calm water conditions. Due to adverse weather conditions, spectral data collection was unsuccessful during sampling campaigns conducted in November 2023 and January 2025.
2.2.2. Laboratory Analysis
Upon return to the laboratory, the collected water samples were processed and analyzed following established standard procedures. The concentration of SS was determined in accordance with the national standard “Water Quality—Determination of Suspended Solids—Gravimetric Method” (GB 11901-89) [
31]. The primary steps involved filtering the water samples through a 0.45 μm membrane filter, followed by drying and weighing to calculate the concentration. Throughout the analysis, strict adherence to quality control protocols was maintained.
A synchronous analysis of water-quality parameters—including total organic carbon (TOC), total nitrogen (TN), total phosphorus (TP), turbidity, transparency, phytoplankton carbon (PC), and dissolved organic carbon (DOC)—was performed. TN was determined via alkaline potassium persulfate oxidation combined with ultraviolet spectrophotometry, using a DeChem-Tech CleverChem Petro automatic petrochemical water-quality analyzer (Jena, Germany), and the standard curve yielded an R
2 value of 0.99. The determinations of TOC, TN, and TP adhered to the ISO 21793:2020 standard, utilizing the wet chemical catalytic ozonation hydroxyl radical oxidation method [
32]. Turbidity measurements were conducted using a Hach 2100Q turbidimeter (Loveland, CO, USA), while transparency was assessed via the Secchi disk method [
33,
34]. Parallel samples were prepared for all analyses to ensure data reliability.
2.3. Remote Sensing Data Acquisition and Processing
The Multispectral Instrument (MSI) aboard the Sentinel-2 satellite offers notable advantages, including high spatial resolution (ranging from 10 to 60 m) and a short revisit interval of five days. It encompasses 13 spectral bands spanning wavelengths from 440 nm to 2200 nm, thereby providing extensive spectral information across the visible, red edge, and near-infrared regions. This capability facilitates high-quality data acquisition for the remote sensing inversion of SS concentration [
35,
36]. The primary band parameters are detailed in
Table 1. Notably, the blue bands (B1, B2), green band (B3), red band (B4), and red-edge bands (B5, B6, B7, B8a) exhibit particular sensitivity to the scattering and absorption properties of suspended solids in aquatic environments, enabling effective detection of spectral responses associated with variations in SS concentration.
The Sentinel-2 MSI Level 2A data utilized in this study were acquired from the Copernicus Open Access Hub of the European Space Agency (ESA) [
37]. At this data level, full preprocessing including radiometric calibration, geometric correction and atmospheric correction has been carried out by ESA, yielding pixel values that directly correspond to surface reflectance. Consequently, the data are suitable for immediate use in subsequent spectral analyses, thereby minimizing error propagation during data preprocessing.
Given the distinctive optical conditions characterized by high turbidity and spectral mixing in karst plateau lakes, this study preferentially employed Sentinel-2 MSI multispectral data rather than Light Detection and Ranging (LiDAR) technology. LiDAR depends on the backscattering of laser pulses, which exhibits severely limited penetration depth in turbid karst waters and is incapable of providing vertical distribution information of suspended solids. Furthermore, LiDAR data acquisition is costly and significantly influenced by weather conditions, rendering it unsuitable for long-term monitoring of seasonal hydrological variations in karst plateau lakes. In contrast, the 443–865 nm spectral bands of Sentinel-2 MSI data effectively capture the short-wave absorption and red-edge scattering features of suspended solids through water surface reflectance, thus better resolving the spectral complexities caused by the mixing of calcite particles and suspended solids in karst water bodies [
38]. Additionally, its spatial resolution ranging from 10 to 60 m aligns well with the suspended solid inversion requirements at the scale of the study area [
39,
40,
41].
The selection of images adhered strictly to the following criteria: cloud cover less than 5% to minimize interference from cloud contamination on spectral signals; temporal alignment within ±3 days of field sampling to ensure spatiotemporal correspondence between remote sensing data and measured observations; and exclusion of images captured within one week following precipitation events to mitigate abnormal fluctuations in suspended solids concentration resulting from terrigenous sediment input. Ultimately, five qualified images were selected from the period 2023 to 2025, representing winter, spring, summer, autumn, and the subsequent winter, thereby comprehensively capturing the seasonal dynamic characteristics of the study area [
37].
Data preprocessing followed an established workflow from previous studies [
42,
43]. Secondary atmospheric correction was conducted using the Sen2Cor plugin to further mitigate the effects of aerosol and atmospheric molecular scattering. The Normalized Difference Water Index (NDWI) was employed to delineate the water body, applying a threshold of 0.03 to accurately define the study area in correspondence with the locations of 40 sampling points. Subsequently, the extracted water pixels were clipped to remove interference from shoreline mixed pixels. Verification based on partially synchronous measurement points showed that the mean relative error of key bands (B2, B3, and B4) was below 5%, thus meeting the accuracy requirements for suspended solid inversion [
44].
To mitigate the inherent errors of Sen2Cor in aerosol optical thickness (AOT) inversion, a stochastic perturbation simulation analysis was conducted to determine the uncertainty range of suspended solids concentration. By introducing ±5% random perturbations to the reflectance values of key spectral bands, the inversion process was repeated 100 times. Subsequently, the standard deviation and coefficient of variation in the suspended solids concentration were calculated to serve as metrics for assessing the reliability of the inversion results [
45].
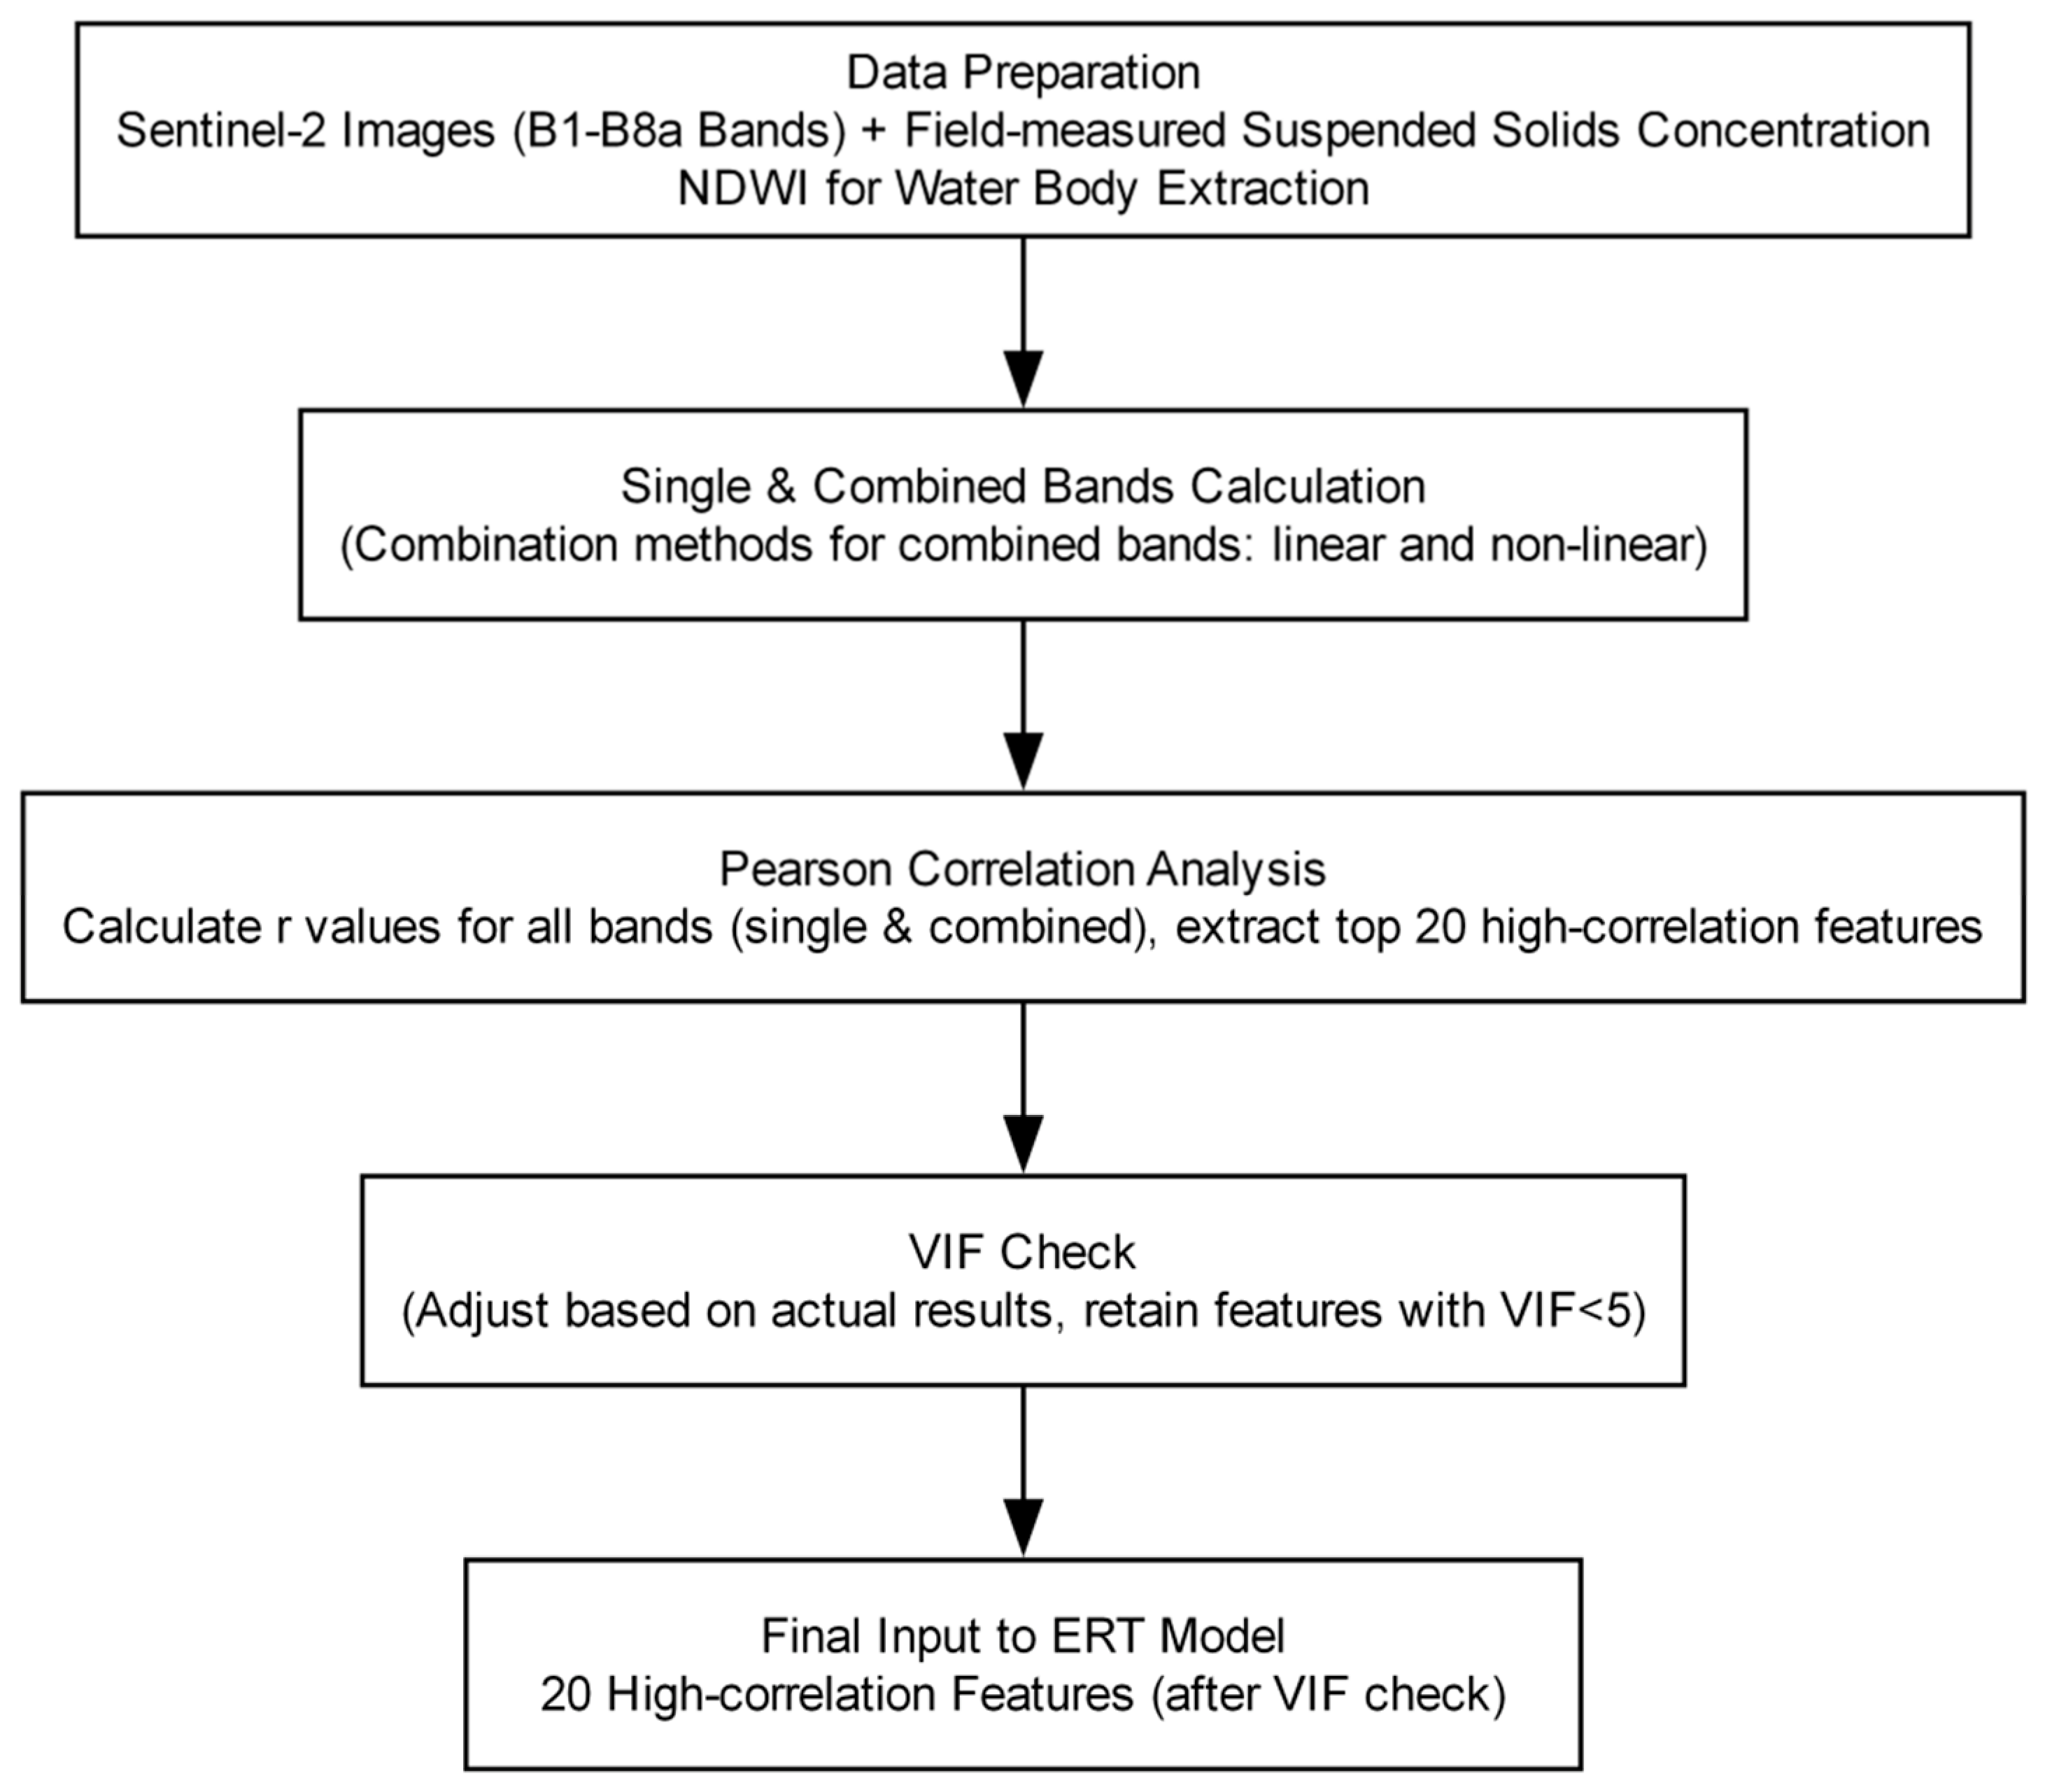
The workflow of sensitive band and feature selection was implemented as follows: first, the actual surface reflectance data from Sentinel-2 MSI Level 2A imagery were directly adopted, and the effective wavelength range of each band was determined in combination with the sensor’s spectral response function (SRF(λ)). Subsequently, Pearson correlation analysis was performed between the in situ measured suspended solids concentrations at 40 sampling points and the surface reflectance values of each band, revealing that the sensitive spectral region for suspended solids primarily spans 443 to 842 nm [
46]. Based on this sensitive spectral region, a total of 81 features were constructed, including single bands, linear combinations (e.g., Bi + Bj, Bi − Bj), and nonlinear combinations (e.g., Bi/Bj, log_Bi). Pearson correlation coefficients between each feature and suspended solids concentration were then calculated, and the top 20 features exhibiting the highest correlations were selected as candidate input variables. Finally, a variance inflation factor (VIF) test was conducted to assess multicollinearity. The VIF values for all 20 features ranged from 1.32 to 4.87, all below the threshold of 5, indicating the absence of significant multicollinearity among the selected features [
47,
48].
The calculation of band reflectance is based on the intrinsic spectral response of the sensor, as illustrated in Equation (2).
Of these, SRF(λ) refers to the spectral response function of Sentinel-2 MSI, whereas Rsurf(λ) corresponds to the actual surface reflectance extracted from Sentinel-2 MSI Level 2A products, thus ensuring consistency with the sensor’s actual sensing properties.
2.4. Extremely Randomized Trees (ERT) Model
A remote sensing inversion model for SS concentration in karst plateau lakes was developed based on geospatial data analysis and remote sensing image feature engineering [
49]. The model’s input features comprise the top 20 highly sensitive spectral variables identified through correlation analysis, encompassing three categories: individual spectral bands, linear combinations (e.g., Bi + Bj, Bi − Bj), and nonlinear combinations (e.g., Bi/Bj, log_Bi). These features comprehensively integrate spectral information from the blue, green, red, red edge, and near-infrared bands, thereby effectively capturing the optical characteristics of suspended solids in karst water bodies.
Feature preprocessing strictly followed established protocols from prior research [
50]. Z-score standardization was applied to eliminate dimensional disparities, thereby ensuring equitable weighting across different bands and combined features. The potential outliers were identified using the interquartile-range criterion. This way was removed to enhance the stability of model training. Variance inflation factor (VIF) analysis revealed that the VIF values of the 20 input features ranged from 1.32 to 4.87, all below the threshold of 5 [
51]. This indicates the absence of significant multicollinearity among the features, thereby preventing parameter distortion due to collinearity interference (see
Figure 2).
The ERT hyperparameters were optimized using randomized search combined with repeated five-fold cross-validation. The candidate values were n_estimators = [100, 200, 300, 500, 800] and max_depth = [None, 3, 5, 8, 10]. Therefore, our candidate combinations totaled 25 groups (
Tables S1 and S2). Finally, we compared the cross-validated RMSE values of all the combinations. The parameter combination yielding the lowest cross-validated RMSE was selected. The optimal values were n_estimators = 100 and max_depth = 3. By increasing the randomness in decision tree construction—specifically through the random selection of split features and split points—the ERT model effectively mitigates the risk of overfitting. Compared to traditional machine learning models, ERT exhibits enhanced robustness in managing high-interference and complex nonlinear relationships. Although models such as RF, XGBoost, and Gradient Boosting Machine (GBM) have been extensively applied in water quality remote sensing, they encounter limitations when applied to karst plateau lakes due to extreme spectral mixing caused by elevated pH levels and the presence of calcite particles. In contrast, ERT introduces greater randomness by randomly selecting both split features and split points for each decision tree, which not only reduces overfitting risk but also improves generalization capability when handling high-dimensional, highly collinear spectral features. Moreover, the ensemble strategy employed by ERT is less sensitive to outliers and noisy features, a characteristic particularly advantageous in the complex optical environment of karst water bodies, where signals from suspended solids and calcite are strongly intermixed [
52].
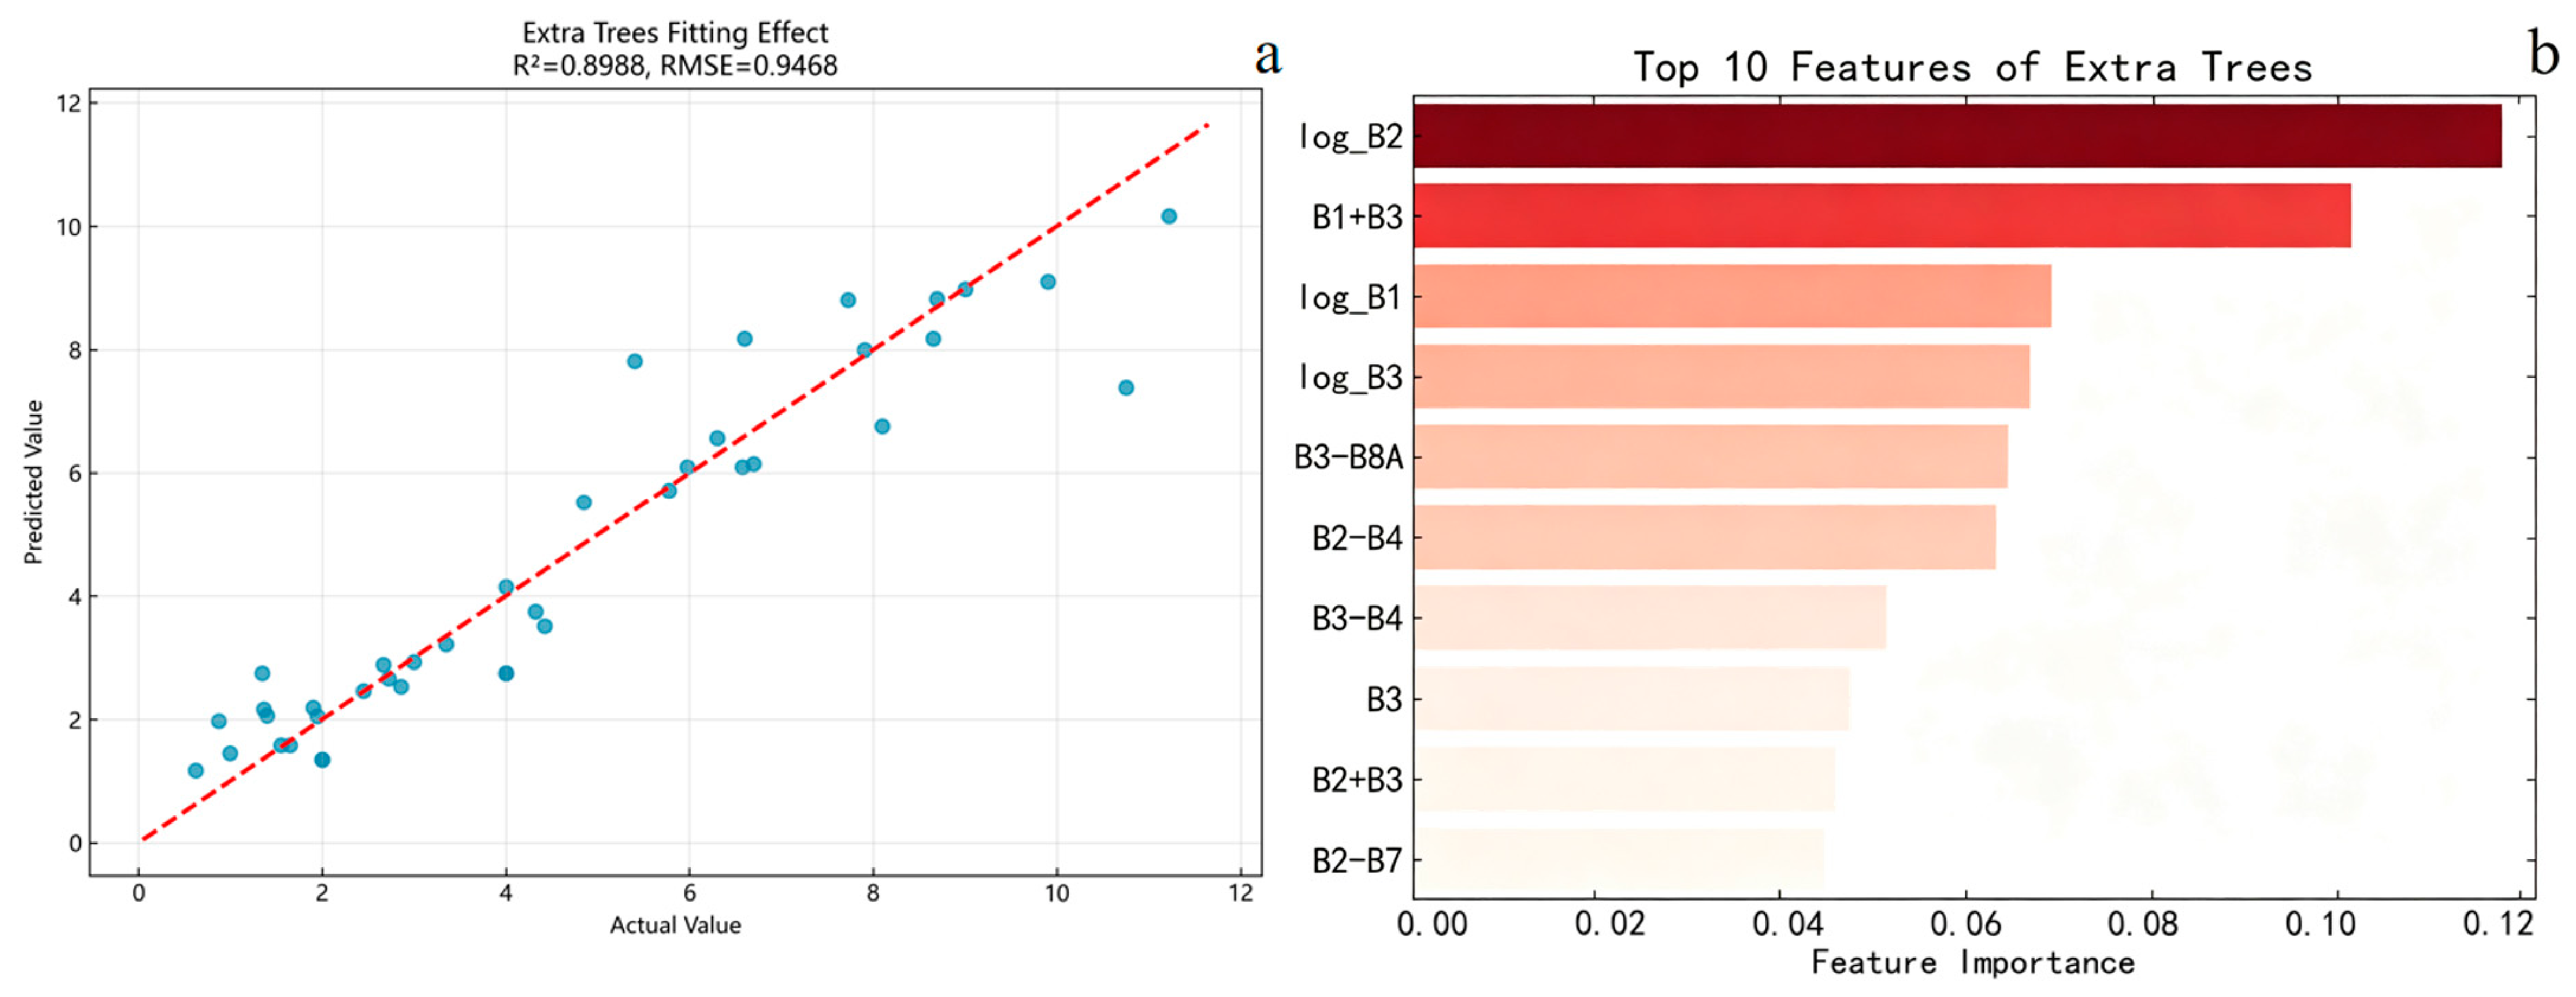
The evaluation of feature importance revealed that the top ten features, ranked in descending order of significance, are as follows: log_B2, B1 + B3, log_B1, log_B3, B3 − B8A, B2 − B4, B3 − B4, B3, B2 + B3, and B2 − B7. Among these, nonlinear logarithmic transformation features (log_B2, log_B1, log_B3) constitute 30%, linear combination features (e.g., B1 + B3, B3 − B8A) account for 60%, and single-band features (B3) represent 10%. These findings suggest that nonlinear transformations and cross-band combinations of blue-green spectral bands effectively enhance the spectral signals associated with suspended solids while mitigating interference from elevated pH levels and calcite particles in karst water bodies.
For the comparative models, the hyperparameters were configured as follows: RF employed n_estimators = 200, max_depth = 8, and random_state = 42; GBM utilized n_estimators = 200, max_depth = 3, learning_rate = 0.05, subsample = 1.0, and random_state = 42; XGBoost was configured with optimal parameters determined through 5-fold cross-validation (n_estimators = 150, max_depth = 5, learning_rate = 0.03, subsample = 0.8, and random_state = 42). All models used mean squared error (MSE) as the loss function and were trained on an identical data split (70% training, 30% validation) with a fixed random seed (42) to ensure a fair comparison. These configurations align with standard practices widely adopted in water quality remote sensing research.
2.5. Model Accuracy Evaluation
Three metrics—coefficient of determination (
R2), root mean square error (
RMSE), and mean absolute error (
MAE)—were employed to comprehensively assess the accuracy and reliability of the ERT model in estimating
SS concentration. The formulas for calculating these three metrics are presented in Equations (3), (4) and (5), respectively.
Among the evaluation metrics, the
RMSE quantifies the overall deviation between the model’s predicted values and the observed measurements. The Coefficient of R
2 assesses the model’s capacity to explain the variability in the data, ranging from 0 to 1, with values closer to 1 indicating a better fit. The MAE represents the average magnitude of the deviations between predicted and observed values in an intuitive manner. In the corresponding formulas,
denotes the model-predicted SS concentration;
represents the measured SS concentration at the i-th sampling point;
is the mean of the measured SS concentrations;
n is the total number of samples (here,
n = 40); and i indexes the individual samples. In addition, we used the global performance indicator (
GPI) to evaluate the overall performance of the model. The formulas for calculating these three metrics are presented in Equations (6)–(9) [
53].
SD represents standard deviation of the residual.
In the accuracy evaluation process, the dataset is partitioned into training and validation sets at a ratio of 7:3. Ten iterations of repeated validation are conducted through random sampling, and the mean value is adopted as the final accuracy metric to ensure the objectivity and stability of the evaluation results. Additionally, spatial autocorrelation analysis is employed to examine the spatial distribution characteristics of the model residuals. The absence of significant spatial clustering in the residuals suggests that the model has not omitted critical spatial factors, thereby indicating the reliability of the inversion results.
3. Results
3.1. Correlation Analysis
To align with the spectral resolution of the Sentinel-2 MSI sensor, we first applied the spectral response function (Equation (2)) to convert field-measured hyperspectral data into corresponding band reflectance. Leveraging the simulated reflectance values, SS concentrations obtained from 40 sampling points, and surface reflectance data derived from Sentinel-2 MSI Level 2A images spanning 2023 to 2025, Pearson correlation analysis was adopted to quantify the association between spectral features and SS concentrations. According to the results, the spectral range most responsive to SS concentrations is predominantly located in the 443 nm to 842 nm interval.
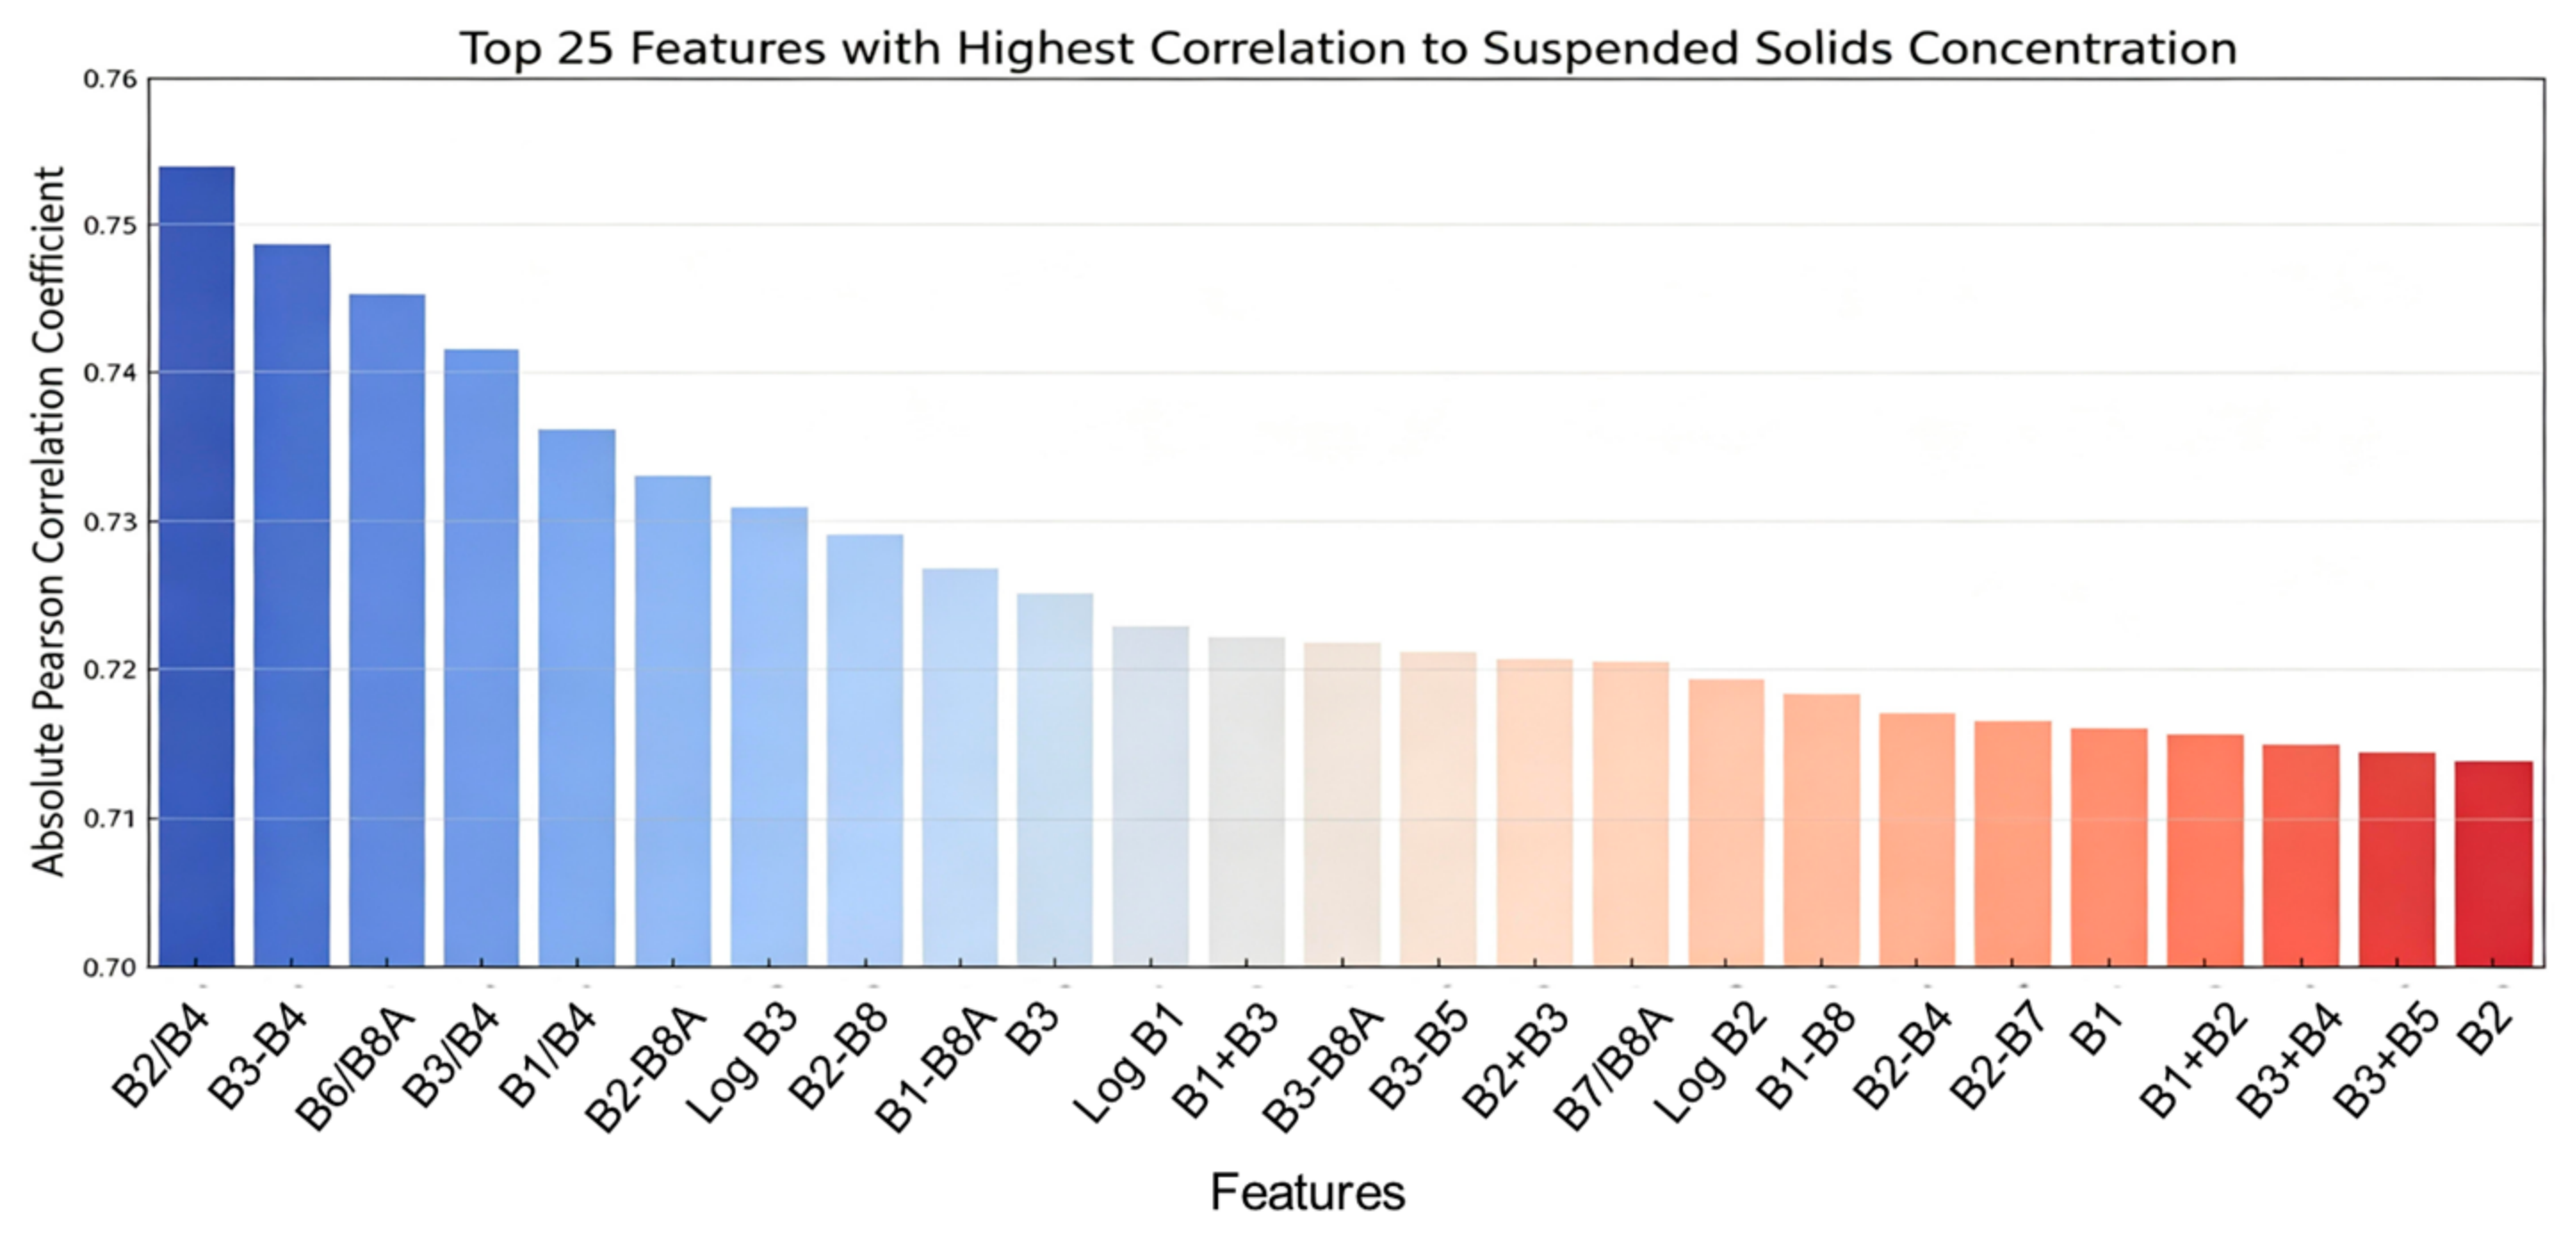
For single-band evaluation, the strongest linear correlation with SS concentration was detected in the blue band B2 (492.1 nm), with a Pearson correlation coefficient of 0.7536 (p < 0.01). It was sequentially followed by blue band B1 (442.3 nm, r = 0.75), green band B3 (559 nm, r = 0.75), red-edge band B6 (739.1 nm, r = 0.74) and red band B4 (665 nm, r = 0.74). These findings echo the scattering characteristics of SS in the short-wave spectrum and their optical interplay with calcite particles present in karst water bodies, which is in line with the fact that calcite accounts for the majority of suspended particulates in this study area.
In terms of band combination feature construction, 81 linear (e.g., band addition and subtraction) and nonlinear (e.g., band ratio, logarithmic transformation) calculation methods were adopted to build a complete feature space. We then selected the 15 combined features that showed the highest correlation with SS concentration from all candidates. Notably, blue-green band superpositions accounted for the majority of high-performing linear combinations, with B3 − B4 and B2 − B8A both achieving a correlation coefficient of 0.75. This type of combination strengthens SS scattering signals through the complementarity of spectral information, and effectively reduces the scattering interference caused by calcite particles in longer wavelength bands. For nonlinear combinations, log_B2 and B2/B4 (both r = 0.75) delivered the most satisfactory results. These mathematical transformations enlarged the spectral differences between SS and other water constituents, thus greatly improving the spectral separability of SS in complex karst water systems (see
Figure 3).
All selected single-band and combined-band features passed the significance test at the p < 0.01 level. The top 20 features with the highest correlation coefficients, including 10 single bands and 10 combined bands, were then chosen as candidate input variables. VIF analysis showed that the VIF values of these 20 features ranged from 1.32 to 4.87, all below the threshold of 5, indicating no significant multicollinearity and thus reducing parameter distortion caused by collinearity. These features combine the merits of “short-wave sensitive linear response” and “red edge–near infrared nonlinear feature engineering”, enabling effective differentiation of spectral contributions from SS and non-SS components. This approach is highly compatible with the inversion demands of highly turbid, optically complex karst water bodies.
3.2. Construction and Validation of the Extremely Randomized Trees Model
The top 20 most sensitive features, comprising 10 individual spectral bands and 10 combined bands, were selected as input variables to develop a remote sensing inversion model for SS concentration based on the ERT algorithm. This approach effectively captured the complex nonlinear relationship between spectral features and SS concentration through an ensemble learning strategy. The chosen parameters ensured stable performance in fitting high-dimensional spectral data and adequately satisfied the requirements for SS inversion in karst water bodies without necessitating further optimization.
The evaluation of feature importance revealed that the top ten features, ranked in descending order of significance, are as follows: log_B2, B1 + B3, log_B1, log_B3, B3 − B8A, B2 − B4, B3 − B4, B3, B2 + B3, and B2 − B7. Among these, nonlinear logarithmic transformation features (log_B2, log_B1, log_B3) constitute 30%, linear combination features (e.g., B1 + B3, B3 − B8A) account for 60%, and single-band features (B3) represent 10%. These findings suggest that nonlinear transformations and cross-band combinations of blue-green spectral bands effectively enhance the spectral signals of SS while mitigating interference from elevated pH levels and calcite particles in karst water bodies. Additionally, features related to red-edge bands (B3 − B8A, B2 − B7) contribute 13.7% to the overall importance, further corroborating the critical role of red-edge bands in reducing calcium carbonate interference and improving the accuracy of SS inversion (see
Figure 4).
The model training process was marked by a continuous reduction in loss, which dropped from the initial 8.92 to 0.156 by the end of training. This trend clearly signals successful model convergence and the steady improvement of the model’s fitting performance on the training dataset. As indicated by validation findings, the ERT model delivered high inversion accuracy, as evidenced by an R
2 of 0.90, RMSE of 0.95 mg/L, and MAE of 0.66 mg/L. When a spatial autocorrelation test was applied to the model residuals, the resulting Moran’s I value reached 0.13 with a p-value of 0.35. The statistic implies no remarkable spatial clustering effect, which confirms that the spatial independence assumption for the model is valid. In comparison with the traditional linear model that adopts the optimal single band B3 (R
2 = 0.57), the ERT model achieved an accuracy increase of around 57%. This promotion effectively addresses the drawback of linear models, which are incapable of adequately capturing nonlinear correlations (see
Figure 5 and
Figure 6). By incorporating highly sensitive features from both single bands and band combinations, and making full use of the ensemble learning performance of the ERT model, an SS inversion model adapted to the intricate optical environment of karst plateau lakes was established, providing a high-precision technical solution for dynamically monitoring eutrophication in regional water bodies.
3.3. Comparison with Other Machine Learning Models
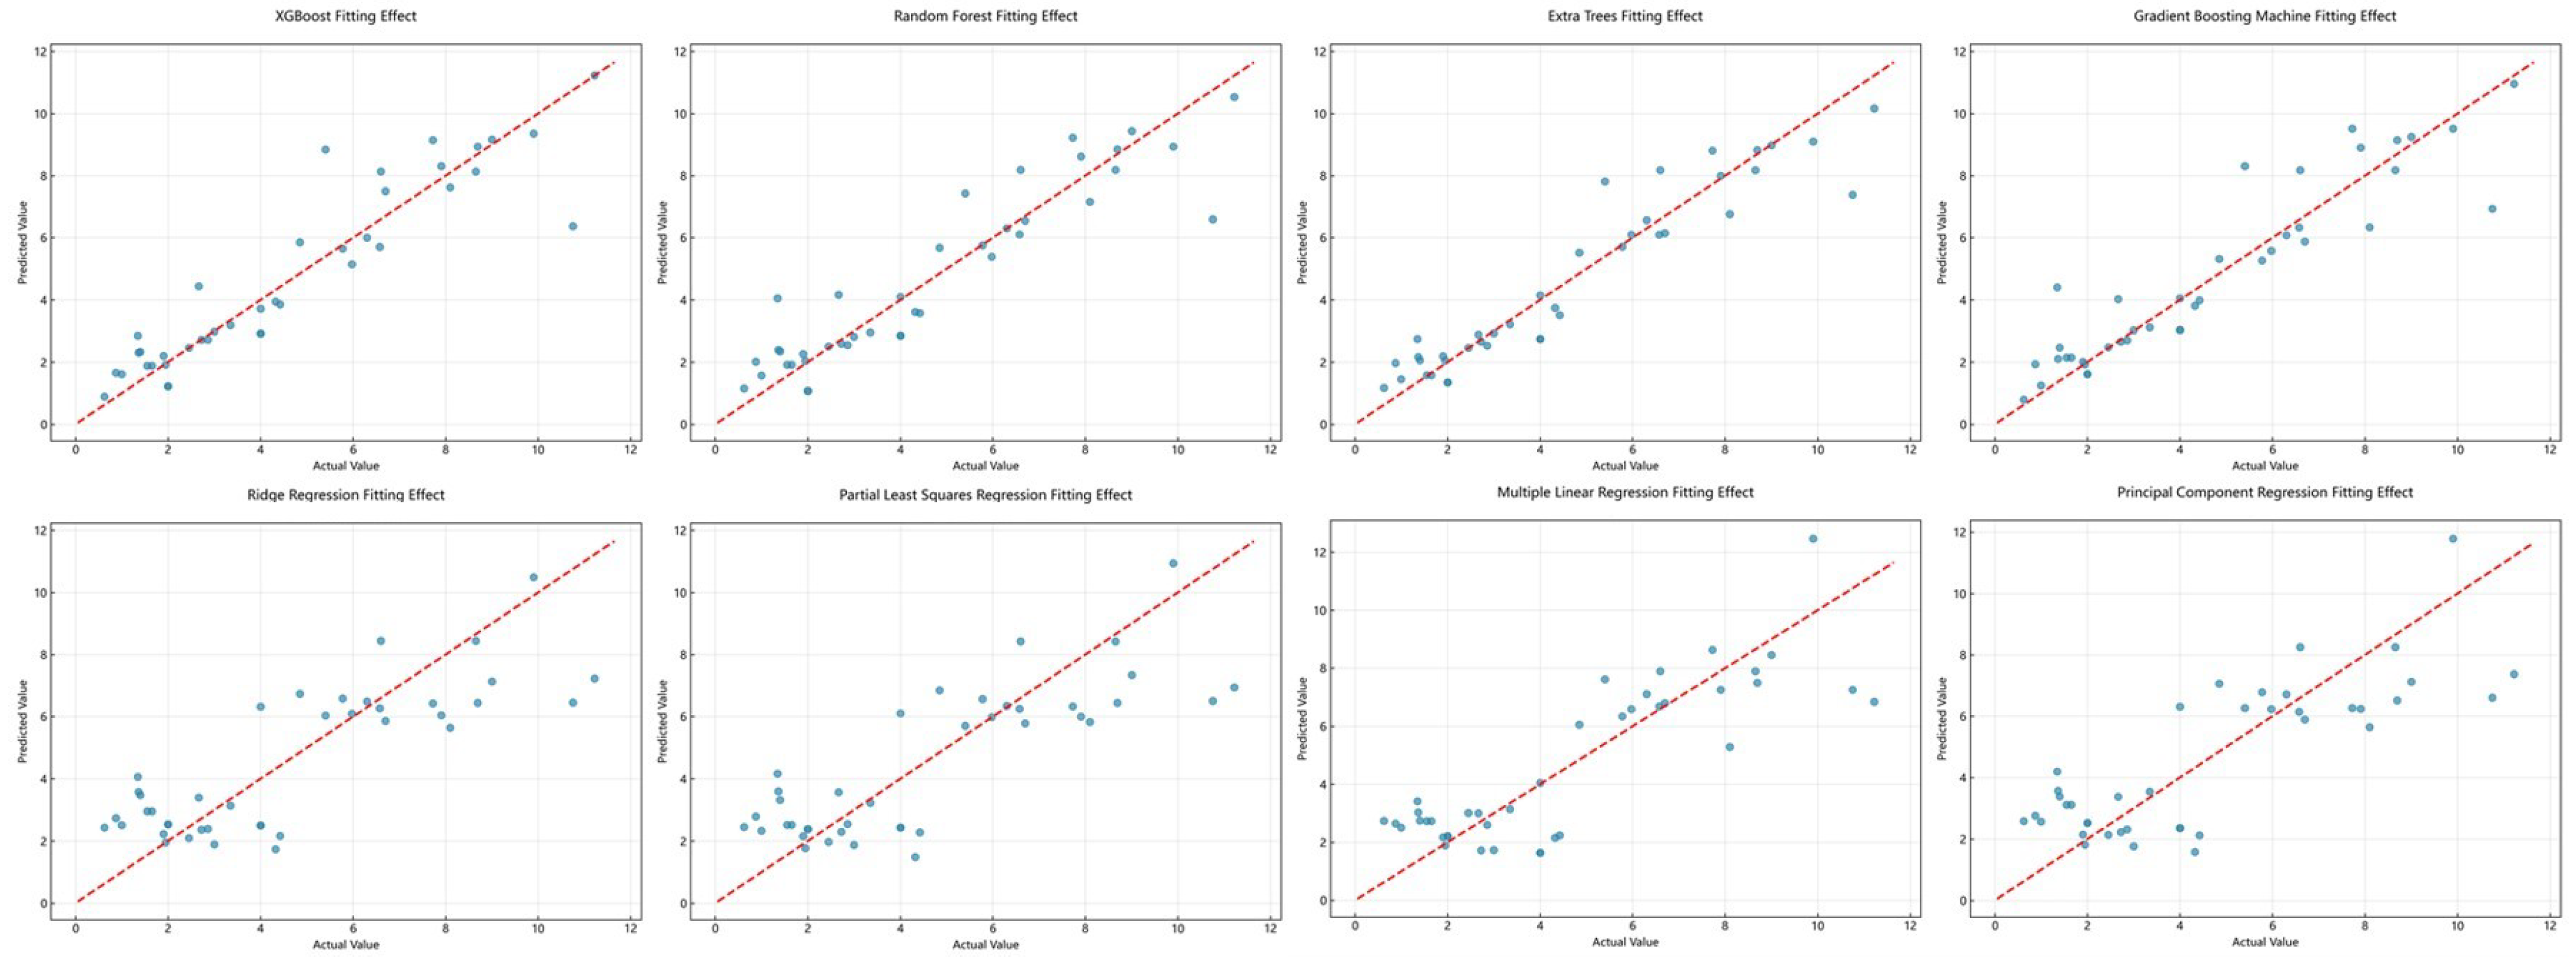
To assess the superiority of the ERT model in SS inversion for karst plateau lakes, three widely used machine learning algorithms—RF, XGBoost, and GBM—were selected for comparative performance analysis. According to the evaluation metrics in
Table 2, the ERT model exhibited the best performance, with an R
2 of 0.90, a root mean square error (RMSE) of 0.95 mg/L, and a mean absolute error (MAE) of 0.66 mg/L. These results suggest that the ERT model can effectively characterize the nonlinear relationship between spectral features and SS concentration.
The RF model, leveraging the ensemble advantage of multiple decision trees, demonstrated stable performance in processing highly correlated spectral features, such as the synergy among the top 20 most sensitive features. It mitigated the risk of overfitting through bootstrap sampling and random feature selection, achieving an R2 of 0.84 and an RMSE of 1.12 mg/L. Its accuracy was marginally lower than that of the ERT model, primarily due to limited randomness in the construction of decision trees, which resulted in a slightly weaker fit in regions exhibiting large SS concentration gradients, such as the Nayong River inflow area. The XGBoost model (R2 = 0.85, RMSE = 1.14 mg/L) and the GBM model (R2 = 0.85, RMSE = 1.1 mg/L) minimized residuals by iteratively optimizing decision trees, thereby better capturing the enhanced backscattering effect of SS in red edge and combined spectral bands. Nevertheless, these models were somewhat less effective than the ERT model in accommodating the “alkaline trap” effect and calcite particle interference characteristic of karst water bodies, particularly exhibiting reduced inversion stability in areas with high SS concentrations (>10 mg/L).
By increasing the randomness in the construction of decision trees—specifically through the random selection of split features and split points—the ERT model further mitigated the risk of overfitting. Compared to other machine learning models, the ERT model demonstrated greater robustness in handling high-dimensional spectral features and complex interference factors. Its inversion errors in both high SS concentration areas (>10 mg/L), such as the Nayong River inflow region, and low SS concentration areas (<5 mg/L) within the reservoir center were lower than those observed in other models. These results confirm the model’s adaptive advantage in karst water bodies characterized by significant spatiotemporal heterogeneity in SS concentration.
3.4. Comparison with Traditional Empirical Models
To address the challenges of SS inversion under the complex optical conditions characteristic of karst plateau lakes, this study assessed the performance of traditional empirical models, including single-band regression, multiple linear regression (MLR), partial least squares regression (PLSR), ridge regression (RR), and principal component regression (PCR). These models were compared with the ERT model to elucidate the differences in applicability among various methods in high-turbidity aquatic environments.
Logarithmic and exponential transformations were adopted to establish single-band regression models for SS concentration inversion. The highest modeling accuracy was recorded in the green band B3 (559 nm), yielding an R2 of 0.57 and an RMSE of 2.01 mg/L. The two blue bands, B1 (442.3 nm) and B2 (492.1 nm), both presented R2 values higher than 0.55, indicating that short-wavelength spectra are sensitive to SS variations. While logarithmic transformation led to accuracy improvements for short-wavelength bands (for instance, the R2 of B2 rose to 0.58), the exponential model still yielded low overall accuracy with all R2 values no higher than 0.50. This result implies that longer wavelength bands are subject to strong scattering interference from calcite particles. Moreover, the dual-band ratio model (e.g., B1/B3), which rests on the assumption of a linear relationship between algal absorption and non-algal scattering, failed to achieve acceptable performance in high-turbidity karst water bodies, with R2 below 0.3. The application of logarithmic transformation also brought no accuracy gain to this model, proving that band ratio approaches are insufficient to separate overlapping spectral signals in complex aquatic environments.
The MLR model incorporated the top five most sensitive single bands (B1 − B5), resulting in an improved coefficient of determination (R2) of 0.71, representing a 15% increase compared to the single-band model. Nevertheless, due to the inherent linearity assumption, the model exhibited systematic underestimation in regions with high SS concentrations (>10 mg/L), and the residuals demonstrated a pronounced nonlinear pattern. Partial least squares regression (PLSR; R2 = 0.67, RMSE = 1.71 mg/L), ridge regression (RR; R2 = 0.67, RMSE = 1.71 mg/L), and principal component regression (PCR; R2 = 0.65, RMSE = 1.76 mg/L) enhanced the model through dimensionality reduction or regularization techniques. However, these approaches were unable to adequately address the combined effects of SS and elevated pH levels, thereby limiting the overall inversion accuracy.
Benefiting from the advantages of ensemble learning, the ERT model outperformed all traditional models in inversion accuracy, achieving an R2 of 0.90, RMSE of 0.95 mg/L, and MAE of 0.66 mg/L. Compared with the best-performing MLR model among conventional approaches, the accuracy of the ERT model was improved by approximately 27%. Through the iterative optimization of multiple weak learners, the ERT model can effectively characterize multiple optical and biogeochemical processes: the intensified backscattering of SS in red-edge bands, the scattering interference of calcite particles suppressed by blue-green band combinations, and the nonlinear effect of total nitrogen bioavailability on SS in high-pH environments. Moreover, the model presented robust inversion performance in both high (>10 mg/L) and low (<5 mg/L) extreme SS concentration ranges. This compensates for the shortcomings of traditional models, such as limited nonlinear fitting ability and insufficient capacity to resolve complex mixed spectral signals.
Constrained by linear assumptions, oversimplified spectral transformation approaches and the absence of mechanistic underpinnings, traditional empirical models have been repeatedly shown in relevant studies to have significant shortcomings in SS inversion targeting karst plateau lakes. For this reason, their scope of application is generally restricted to relatively simple aquatic environments with stable water-quality parameters. In contrast, the ERT model facilitates accurate modeling of highly heterogeneous water bodies by leveraging feature engineering and ensemble learning techniques. This approach offers a robust technical framework for remote sensing-based monitoring of SS concentration in such regions. The model’s high precision is critically important for effective water-quality management and the dynamic assessment of eutrophication processes.
3.5. Summary of Model Comparisons
In the SS inversion of karst plateau lakes, machine learning models generally demonstrated superior performance compared to traditional empirical models. The ERT model ranked first in inversion accuracy among all candidates, recording an R2 of 0.90, RMSE of 0.95 mg/L, and MAE of 0.66 mg/L. By constructing nonlinear features from red-edge and near-infrared spectral bands, the model can effectively discriminate between the spectral signals of SS and calcite particles, thereby adapting to the high turbidity and variable particulate composition typical of karst water systems. For the RF model, it demonstrated robust performance when dealing with highly correlated features (R2 = 0.86), yet showed a somewhat insufficient local fitting performance. Meanwhile, the Extreme Gradient Boosting (XGBoost; R2 = 0.85) and Gradient Boosting Machine (GBM; R2 = 0.85) models were constrained by their gradient optimization strategies, resulting in limited adaptability to the “alkaline trap” phenomenon observed in karst aquatic environments.
Among traditional models, the single-band linear model (optimal B3, R
2 = 0.57) was significantly affected by the interference from SS and calcite particles. The dual-band ratio model proved entirely ineffective, exhibiting an R
2 value below 0.3. The MLR model (R
2 = 0.71) underestimated high-value regions due to its inherent linearity assumptions. Additionally, the predictive accuracies of PLSR, RR, and PCR were all below 0.7, rendering them inadequate for monitoring purposes. The SVR model, which was not previously listed, achieved an R
2 of 0.64 but was constrained by the efficiency of kernel function mapping, sensitivity to sample size and outliers, and limited generalization capability. Spectral index models, such as the normalized difference chlorophyll index (NDCI), were inconsistent with the actual conditions of karst water bodies due to the assumption of a “pure water background,” resulting in very low inversion accuracy (R
2 ≤ 0.10); consequently, these models were excluded from the final comparison (see
Figure 7). As shown in
Table 2, ERT achieved the best GPI (1.36 × 10
−4), confirming its superior overall predictive performance. However, the GPI-based ranking of the remaining models differed slightly from the ranking based on any single metric. This difference occurred because GPI simultaneously accounts for explanatory ability and prediction errors rather than emphasizing one individual performance measure.
3.6. Spatiotemporal Distribution Characteristics of SS Concentration
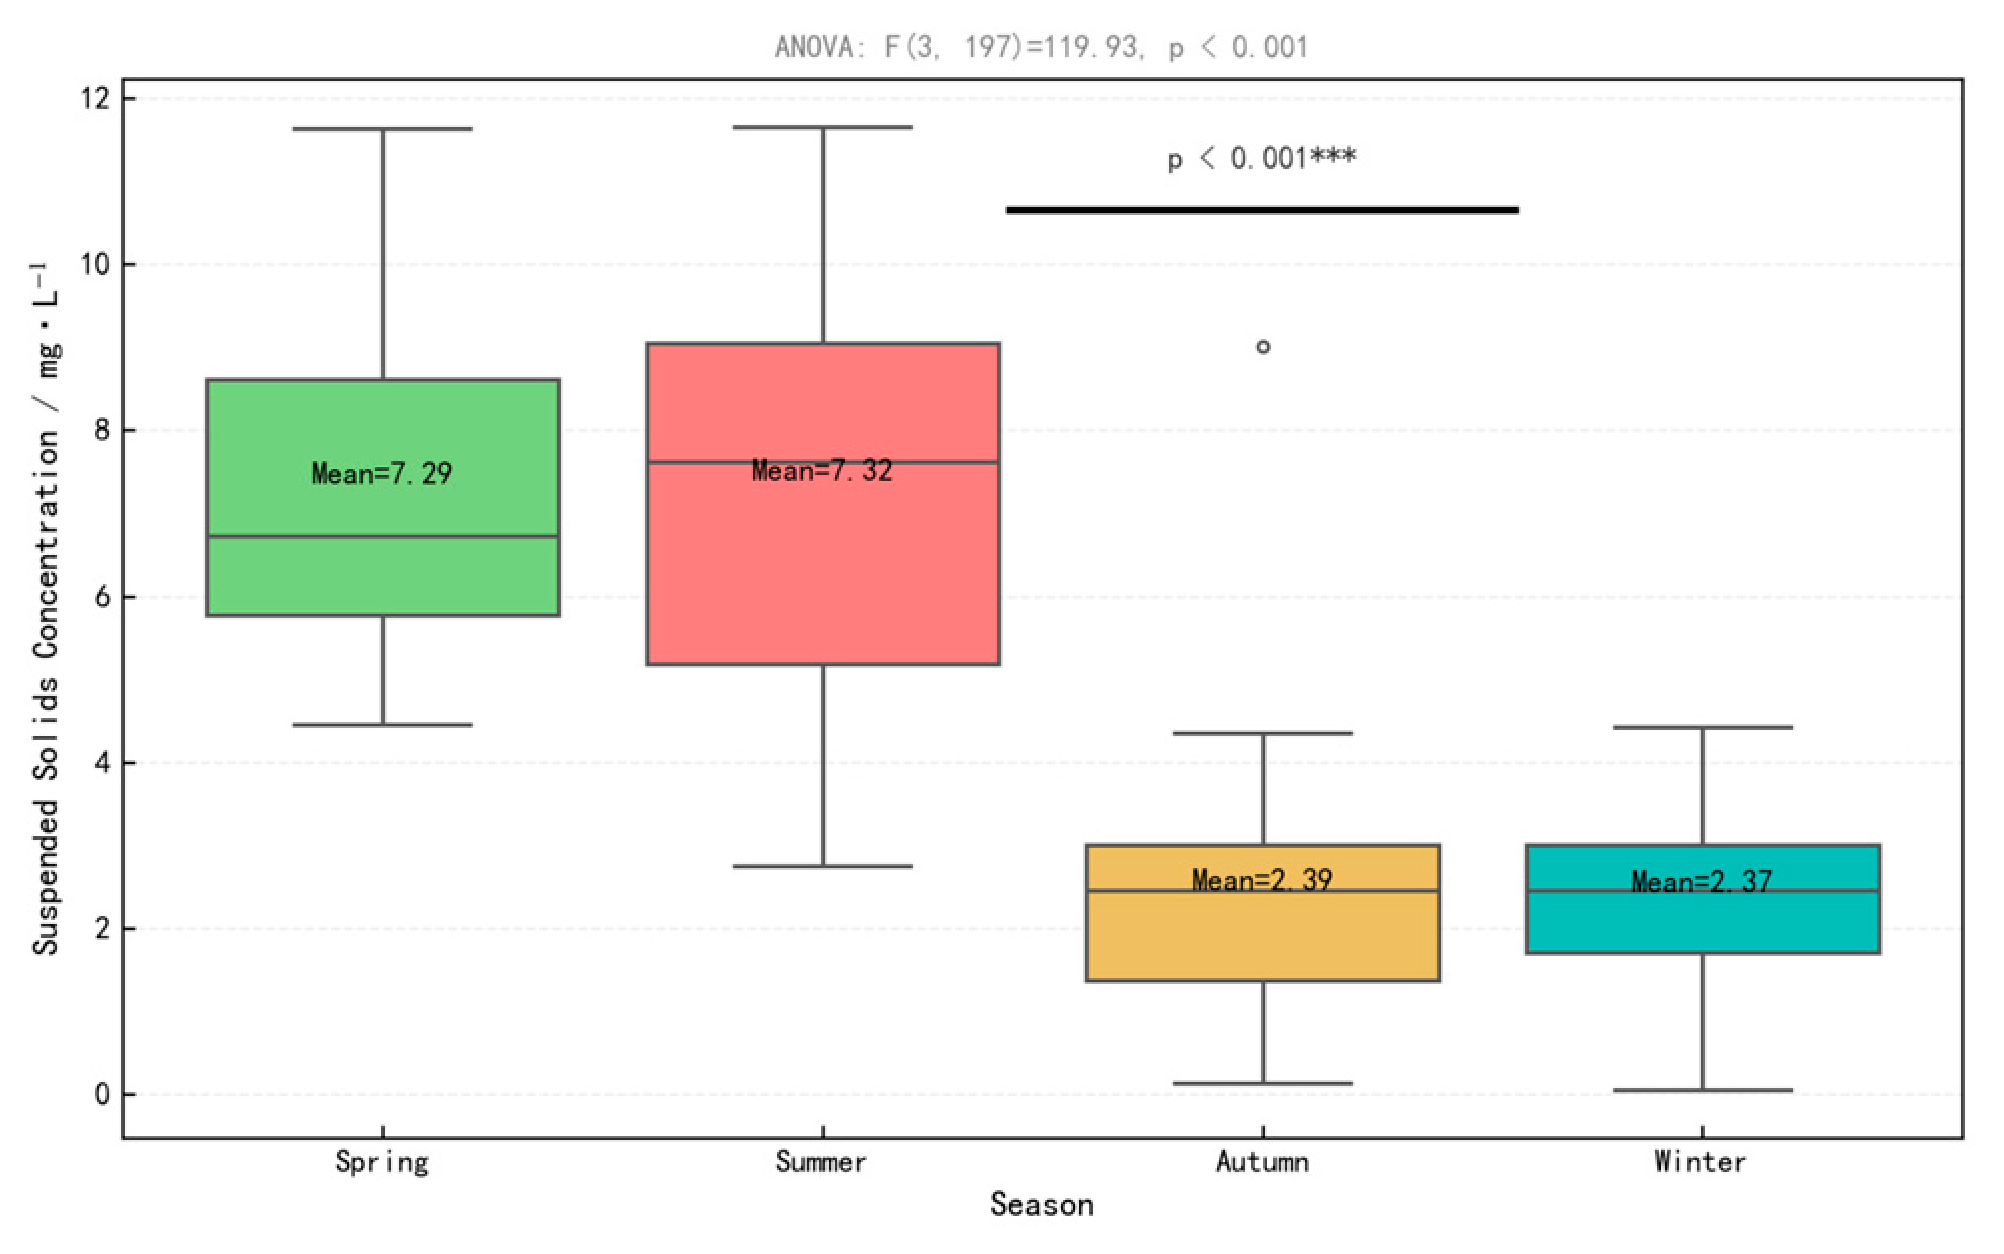
The concentration of SS in Pingzhai Reservoir demonstrated pronounced seasonal variation (ANOVA: F (3197) = 119.93,
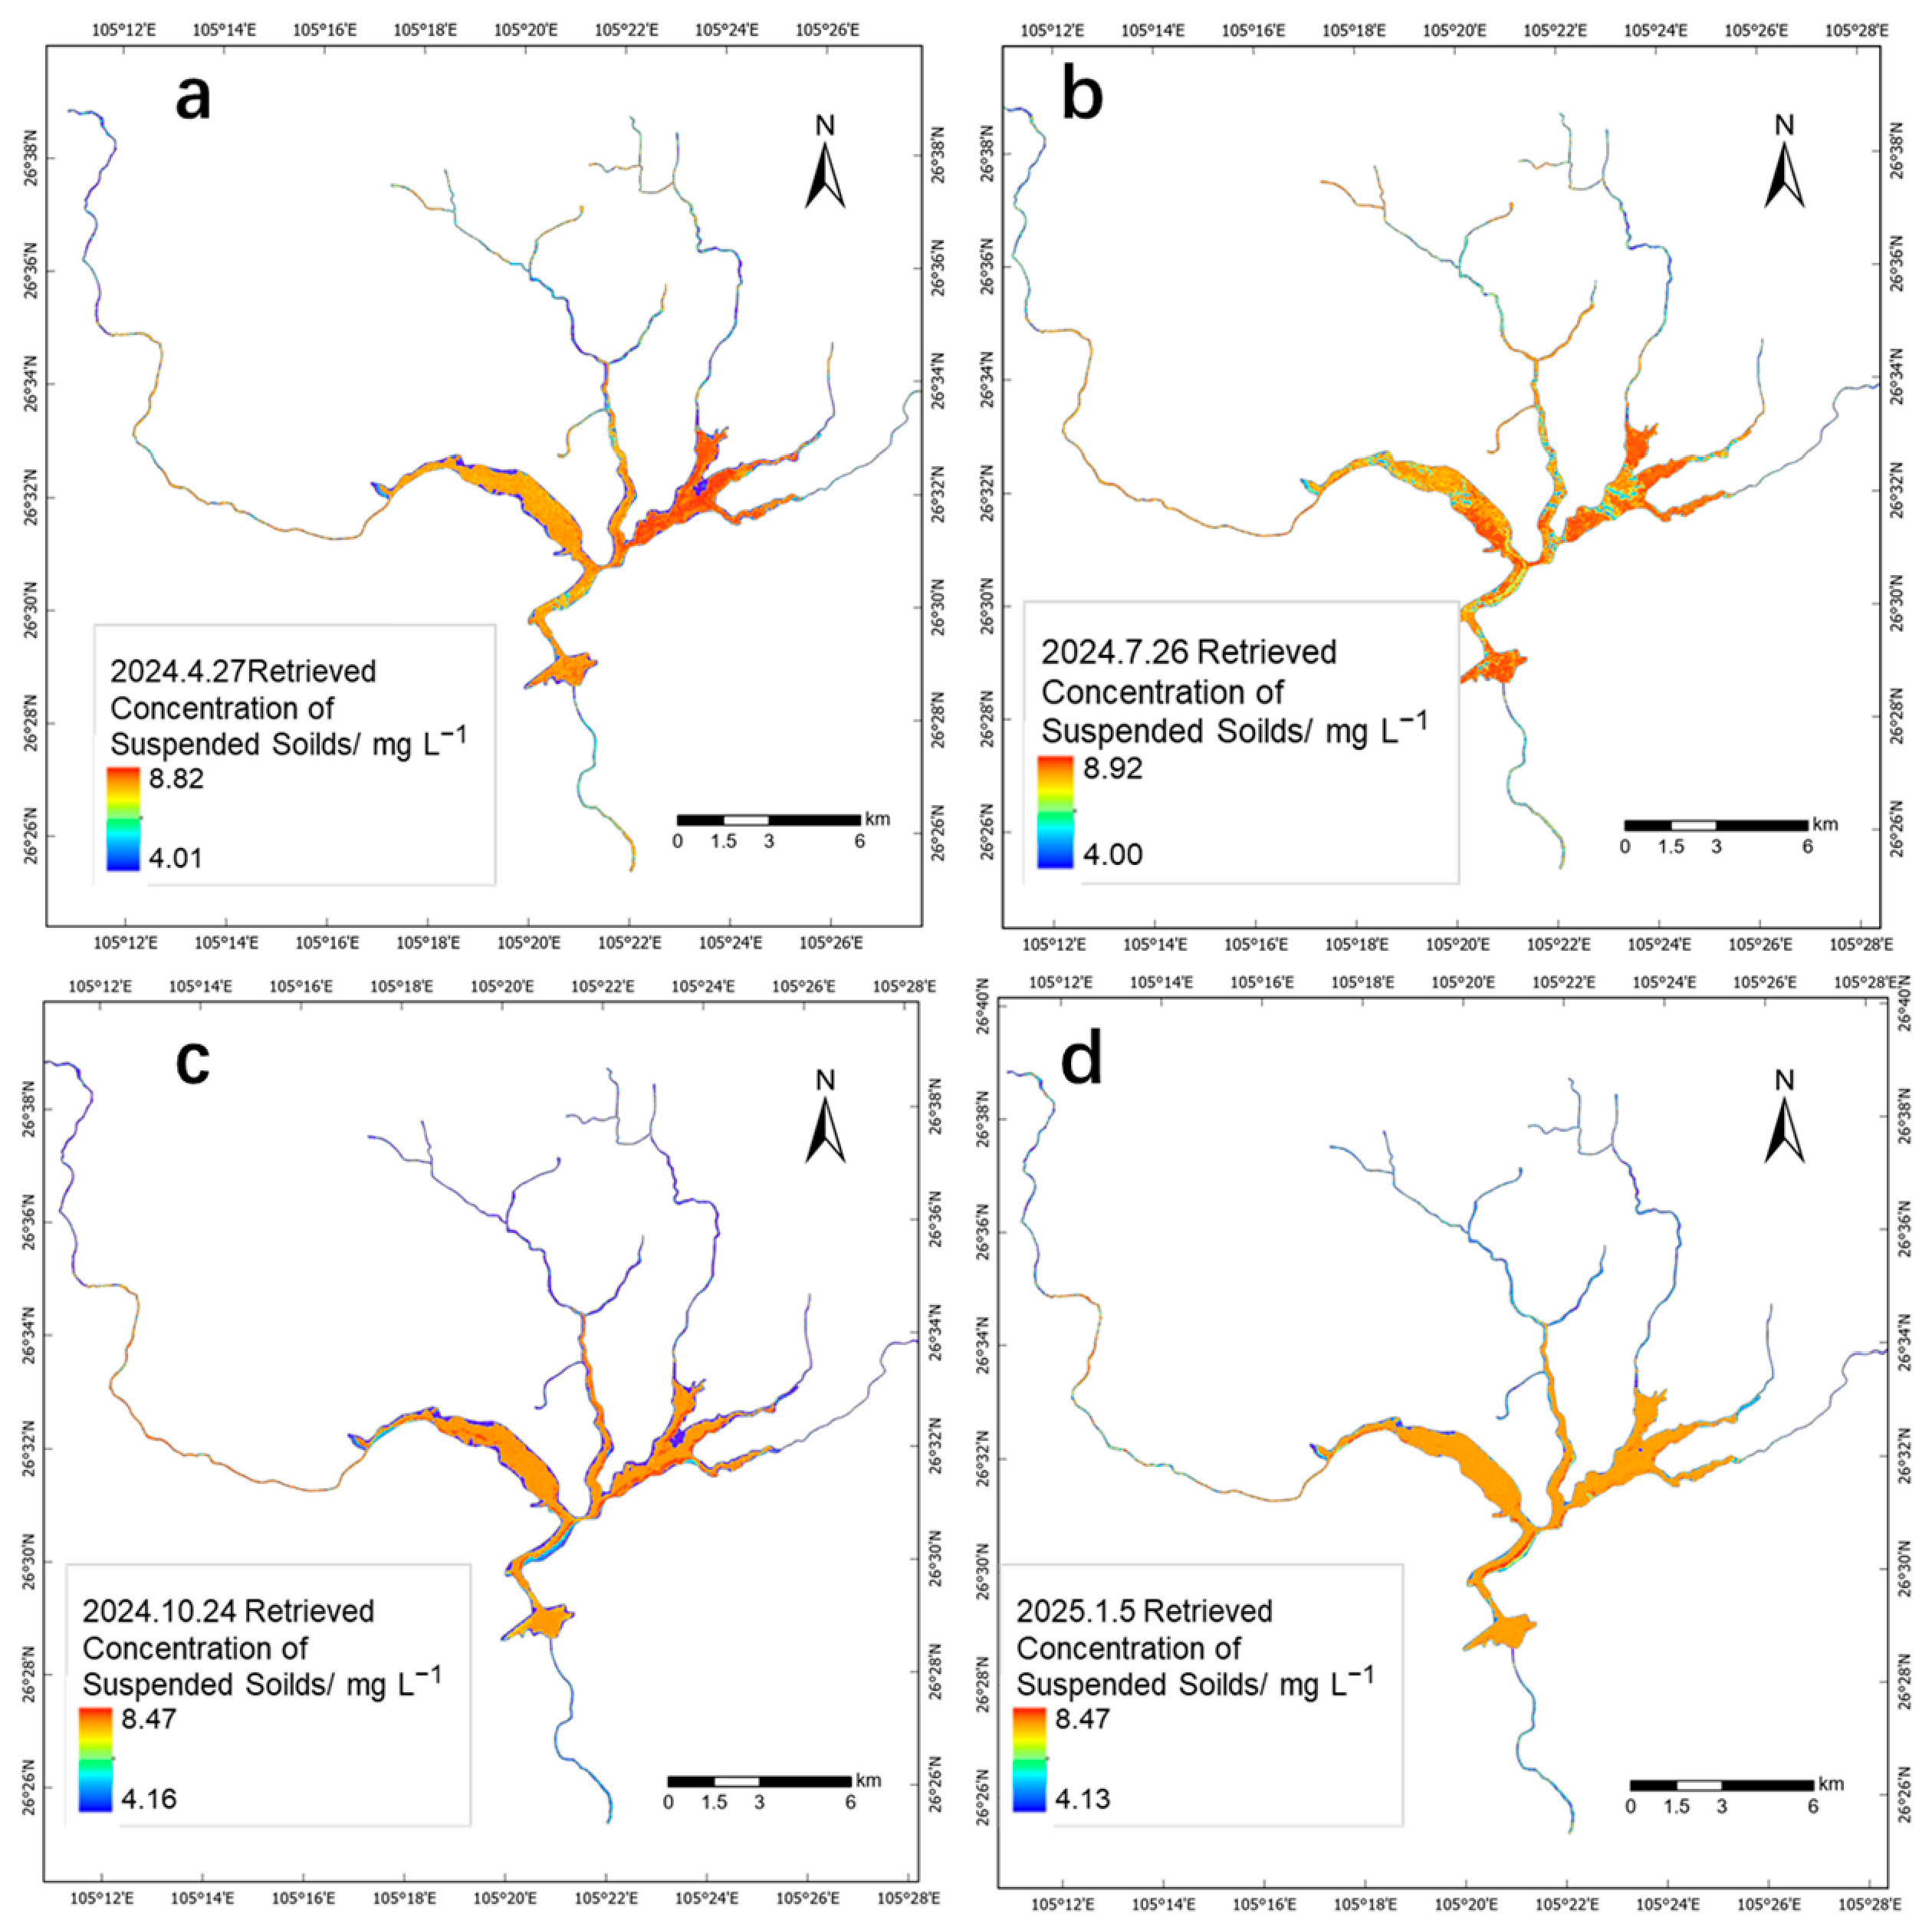
p < 0.001), with the highest mean concentration observed in summer (7.32 mg/L), followed closely by spring (7.29 mg/L), and notably lower concentrations recorded in autumn (2.37 mg/L) and winter (2.39 mg/L). Spatial analysis revealed that elevated SS concentrations were predominantly localized in the inflow regions, including the Nayong River and Shuigong River, where maximum values reached 10.75 mg/L in summer and 11.30 mg/L in spring. Conversely, the central area of the reservoir exhibited relatively low SS concentrations, with a minimum value of 0.75 mg/L recorded in winter (see
Figure 6).
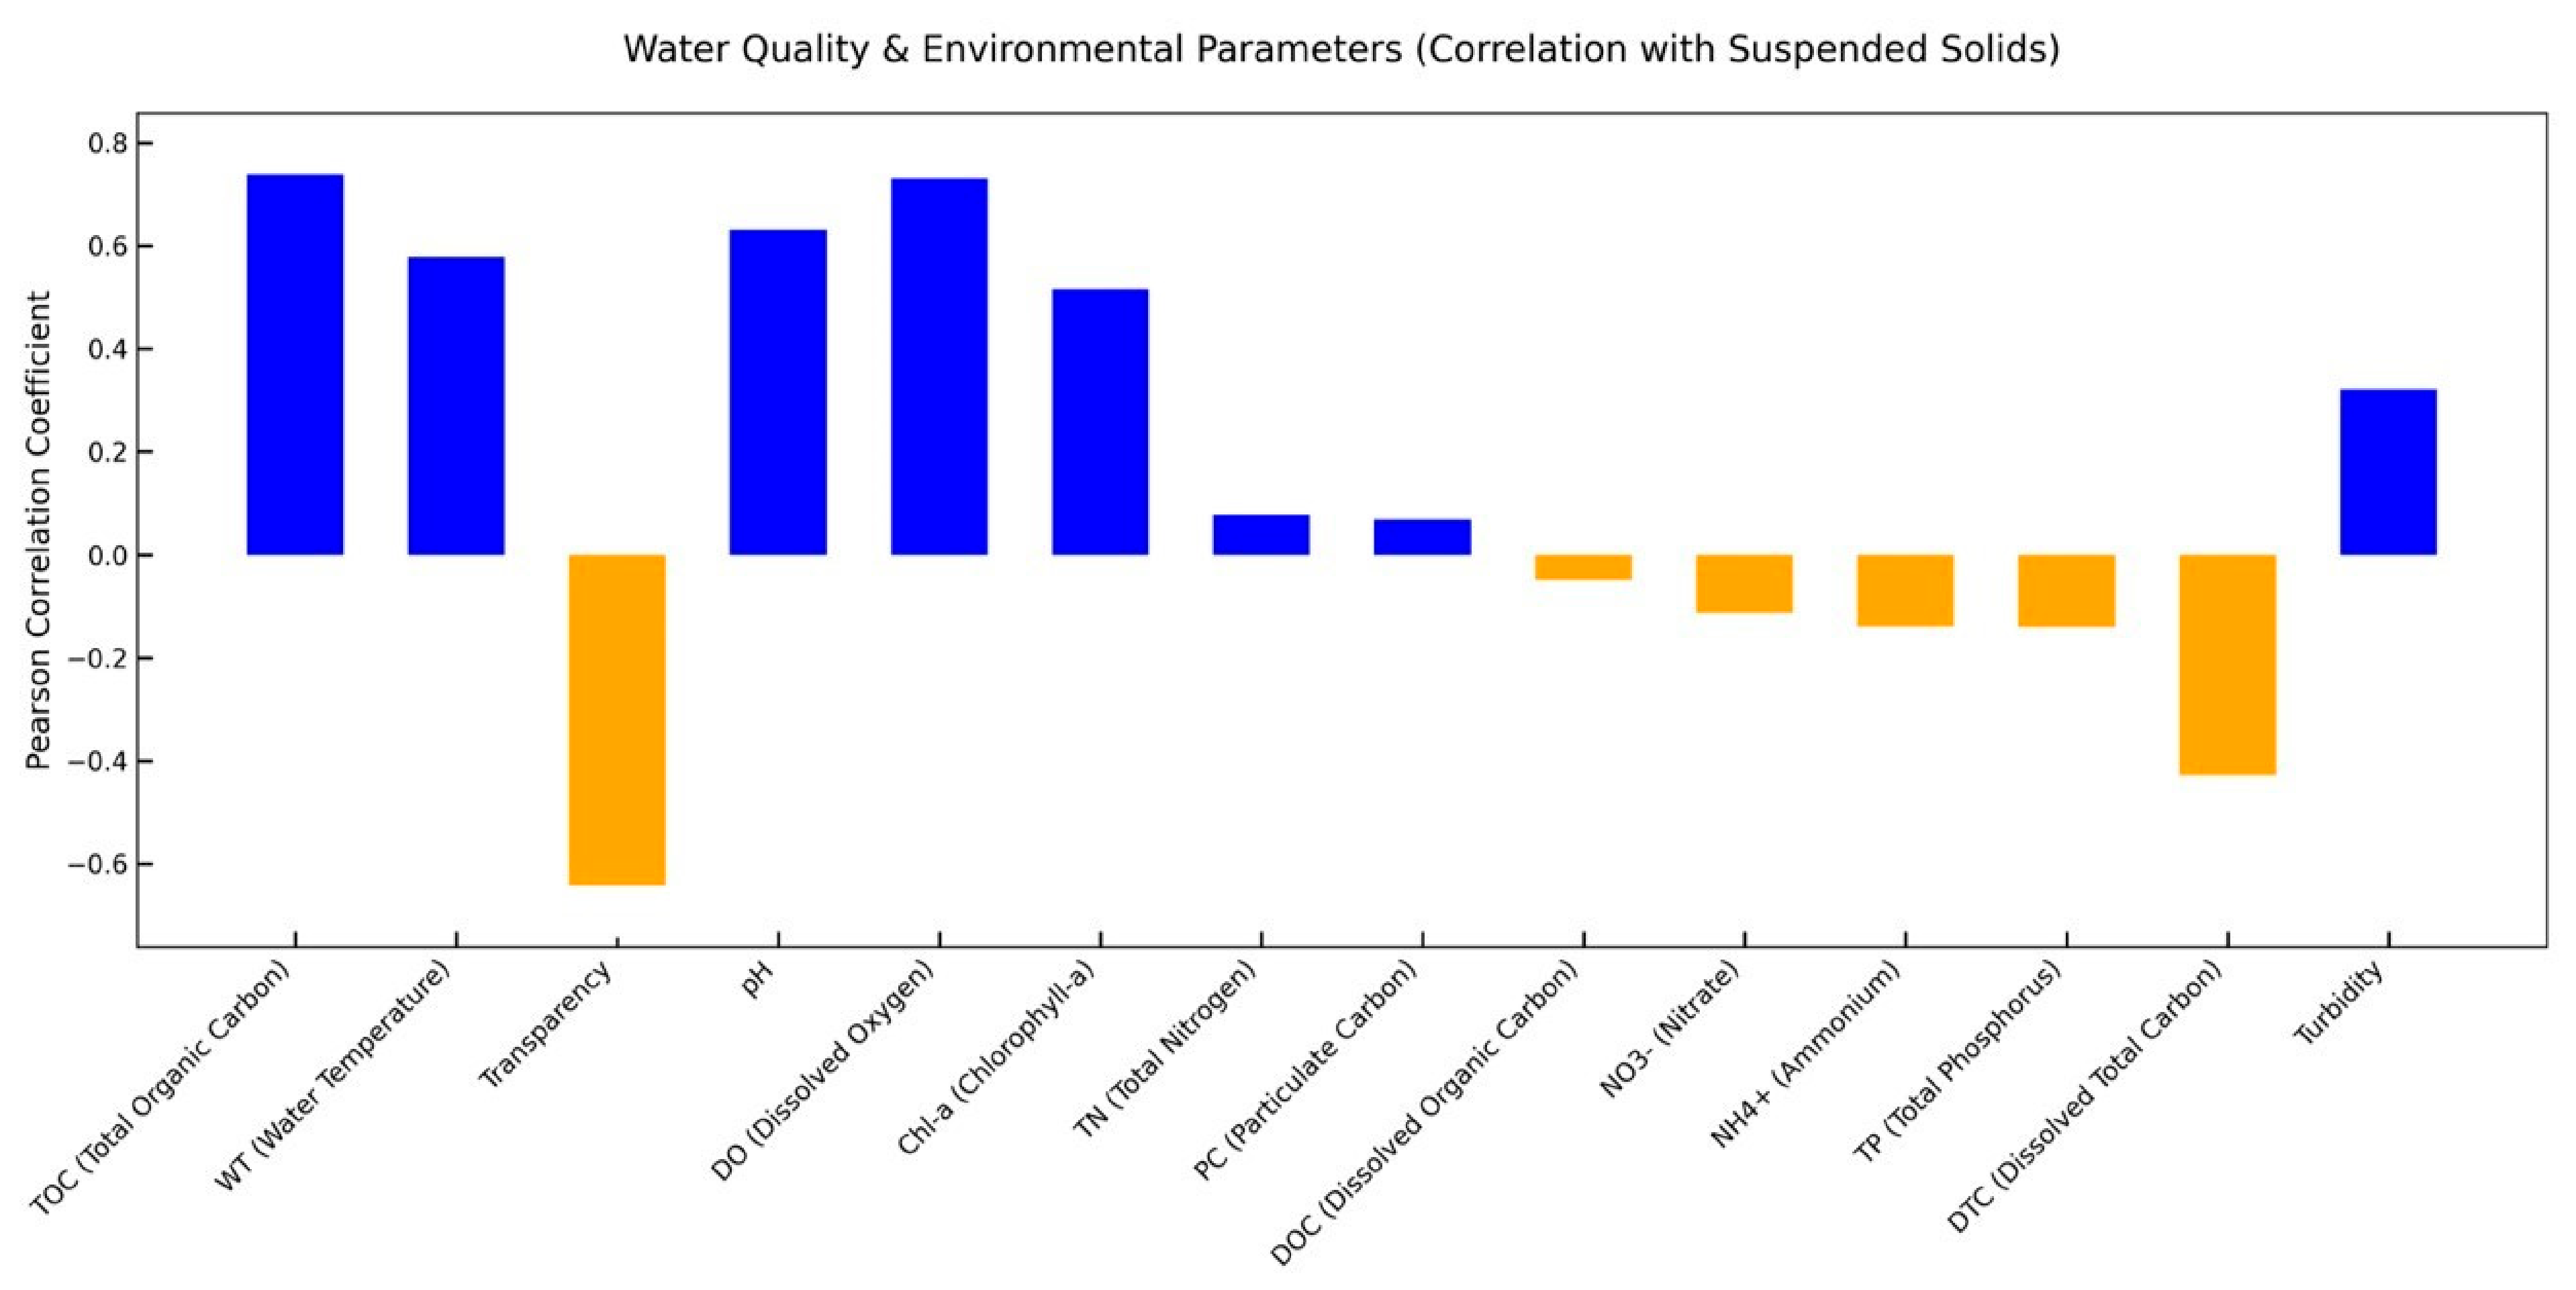
Seasonal dynamic analysis revealed that elevated temperatures during summer (average 28.00 °C) facilitated algal proliferation, which, in conjunction with the input of exogenous particulate matter from agricultural chemical fertilizer application (300 kg/ha), resulted in a marked increase in SS concentration. Increased precipitation in spring induced surface runoff scouring, transporting substantial amounts of terrigenous particulate matter (e.g., carbonate rock weathering debris) into the reservoir, thereby sustaining elevated SS levels. Conversely, reduced precipitation in autumn enhanced water column stability, promoting significant particle sedimentation and consequently decreasing SS concentration. During winter, lower temperatures (average 12.27 °C) inhibited algal metabolism, while diminished human activity during the off-peak tourism season reduced exogenous inputs, culminating in the lowest annual SS concentrations. Pearson correlation analysis demonstrated that SS concentration was significantly positively correlated with water temperature (r = 0.73) and total organic carbon (TOC; r = 0.74), and significantly negatively correlated with water transparency (r = −0.64). These findings substantiate the underlying mechanisms whereby water temperature regulates algal growth, TOC serves as a carbon source, and SS diminishes water transparency.
The spatial distribution of SS concentrations was primarily influenced by terrain and anthropogenic activities. Inflow regions consistently exhibited elevated SS concentrations, attributable to river inputs and adjacent agricultural practices. Conversely, the reservoir’s central zone, characterized by greater depth and gentle water flow, facilitated particle sedimentation, resulting in lower SS concentrations. The dissolution of carbonate rocks within karst landforms contributed to a high proportion of inorganic suspended solids, thereby intensifying the concentration disparity between inflow areas and the reservoir center. Redundancy Analysis (RDA) revealed that water temperature, TOC, and the application of agricultural chemical fertilizers collectively accounted for 72.4% of the variation in SS concentration. Notably, human activities alone explained 41.2% of this variation, underscoring that the combined effects of natural factors and anthropogenic influences constitute the principal drivers of the spatiotemporal dynamics of SS concentration.
4. Discussion
4.1. Physical Mechanism of the ERT Model
The superior inversion performance of the ERT model is attributed to its precise representation of the synergistic mechanism involving “short-wave enhancement and red edge scattering” in karst water bodies, which effectively addresses the issue of spectral mixing in high-turbidity conditions. Feature importance analysis indicates that the nonlinear feature log_B2 (importance = 0.22) and the linear combination feature B1 + B3 (importance = 0.19) are the most significant contributors. The underlying rationale is as follows: the blue bands (B2, B1) are sensitive to scattering signals from suspended solids (SS), and the logarithmic transformation (log_B2, log_B1) enhances the spectral response of low-concentration SS while mitigating the strong scattering interference caused by calcite particles. Additionally, the combination of the green band (B3) with the blue bands (B1 + B3) further accentuates the optical distinctions between SS and other water constituents through complementary spectral information.
The significance of red-edge band-related features (B3 − B8A, B2 − B7) constitutes 13.7% of the total importance, underscoring their distinctive role in karst water bodies. The wavelength range of the red-edge bands (B8A, B7) spans 779.7 to 864 nm, corresponding precisely to the transition zone between SS scattering and calcite particle scattering. By employing difference combinations with the green band (B3 − B8A), the spectral signals of these components can be effectively disentangled. This finding aligns with the conclusions of Li et al. [
46], who reported that red-edge bands can reduce calcium carbonate interference and enhance inversion accuracy by over 20%. Mechanistically, elevated pH levels (>8.2) facilitate the formation of calcite (CaCO
3) particles measuring 2–5 μm, which are comparable in size to the wavelength of red light (0.6–0.7 μm). This size similarity induces strong Mie scattering and results in significant spectral mixing within the red bands. In contrast, the blue-green and red-edge band combinations utilized in this study effectively isolate SS signals from calcite interference.
Suspended particulate matter in karst water bodies is predominantly composed of calcite (CaCO3), accounting for more than 65% of the total composition. The backscattering coefficient at 555 nm (b (555) = 1.2 m−1) in these environments is significantly higher than that observed in plain lakes. Consequently, the accuracy of traditional linear models decreases markedly (R2 < 0.60) due to their limited capacity to address nonlinear spectral interference. By employing an ensemble learning approach, the ERT model iteratively refines weak learners to minimize residual errors, thereby effectively capturing the complex nonlinear relationship between spectral features and SS concentration. Notably, the model maintains stable error margins (mean absolute error < 0.7 mg/L) in extreme concentration ranges, including high SS levels (>10 mg/L) and low SS levels (<5 mg/L). This robustness is especially evident in highly heterogeneous regions, such as the Nayong River inflow area. By integrating R2, RMSE, and MAE, the GPI provides a unified assessment of model performance. ERT achieved the lowest GPI, indicating the best overall predictive performance. Nevertheless, individual metrics remain important because GPl is affected by metric selection, normalization, and weighting. The superior performance of machine learning models indicates that nonlinear spectral interactions provide information beyond traditional regression. To mitigate overfitting with the small sample size n = 40), feature screening and multicollinearity control were applied. However, the ERT results require cautious interpretation and validation with larger, independent datasets.
4.2. Comparison with Previous SS and Turbidity Retrieval Studies
Previous studies have used empirical band models, Random Forest, XGBoost, support vector regression, and other machine learning methods to retrieve SS or turbidity [
54,
55]. Empirical models are simple and easy to interpret. However, their performance may decrease in optically complex waters. Machine learning models can represent nonlinear relationships but require representative samples and rigorous validation. Within the present dataset, ERT showed competitive performance compared with the other evaluated models. It achieved an R
2 of 0.90, an RMSE of 0.95 mg/L, and an MAE of 0.66 mg/L. The corresponding results for Random Forest, XGBoost, support vector regression, and empirical models were (
Table 3). The performance of ERT may result from its ability to capture nonlinear interactions among visible and red-edge features. Direct comparison among studies remains difficult. Reported accuracy depends on the SS concentration range, sample size, optical water type, sensor resolution, atmospheric correction, and image-field matching criteria. A broad concentration range may produce a high R2 but also a high RMSE. A narrow range may produce a low RMSE without indicating strong model transferability. SS, TSS, TSM, suspended sediment, and turbidity are also different variables and should not be treated as equivalent. Validation methods further affect reported performance. Training accuracy is usually optimistic. A single train–test split may also be unstable for a small dataset. Cross-validation gives a more systematic estimate but may still contain information leakage. Independent validation across dates, sites, or lakes provides stronger evidence of transferability.
Table 3 compares representative studies by target variable, concentration range, sample size, sensor, model, atmospheric correction, validation method, and accuracy. The comparison shows that ERT is competitive under the conditions of Pingzhai Reservoir.
4.3. Practical Implications for Water-Quality Monitoring and Model Transferability
The “sensitive spectral feature combination + ERT model” framework provides a practical approach for high-resolution monitoring of suspended solids (SS) in karst plateau reservoirs. The spatial and temporal resolution of Sentinel-2 enables the identification and tracking of SS hotspots, particularly near river inflows. For example, the model-derived maps clearly captured the summer SS maximum of 10.75 mg/L near the Nayong River inflow, demonstrating their potential to support pollution-source identification and watershed management. The observed seasonal variations provide a basis for targeted management. In summer, attention should focus on controlling agricultural non-point source pollution and intercepting terrestrial particles transported by inflow rivers, for example through reduced fertilizer application and riparian buffer zones. Ecological bank restoration in spring may reduce runoff-driven soil erosion, whereas sediment disturbance and resuspension should be minimized during winter water-level decline. Combining satellite-derived SS maps with automatic monitoring stations could further improve monitoring frequency and spatial coverage. The relationships between SS and environmental variables also indicate possible drivers of water-quality variation. SS was positively correlated with total organic carbon (TOC; r = 0.74) and water temperature (WT; r = 0.73), but negatively correlated with water transparency (r = −0.64). Although these correlations do not demonstrate causality, they suggest that organic matter inputs, seasonal warming, and hydrological changes may jointly affect SS dynamics. Management efforts should therefore consider controlling organic pollution from domestic sewage and livestock farming while accounting for seasonal environmental conditions. The trained ERT model should not, however, be directly transferred to other water bodies. It was calibrated using samples representative of calcite-rich karst waters with high pH (>8.2) and high calcite content (>65%). Its selected spectral features and learned relationships may be unsuitable for waters dominated by different mineral particles, phytoplankton, or colored dissolved organic matter. Therefore, it is the methodological workflow, rather than the fitted model, that is potentially transferable. For regional adaptation, the hydrochemical and optical properties of the target water body should first be characterized, including SS range, pH, calcite content, chlorophyll-a, colored dissolved organic matter, and particle-size distribution. Local field samples matched with Sentinel-2 observations should cover the main seasons, hydrological zones, water types, and SS ranges. Spectral sensitivity should then be reassessed because features such as log_B2 and B1 + B3 may not remain optimal under different conditions. The ERT model should be retrained and optimized using local data, followed by independent spatial or temporal validation. Its applicability domain should be explicitly defined according to SS ranges and optical conditions, and prediction uncertainty should be quantified where sufficient data are available. Thus, local sampling, feature screening, model calibration, independent validation, and uncertainty assessment form a transferable adaptation framework, while the spectral variables, model parameters, and learned relationships remain site-specific.
4.4. Model Transferability, Limitations, and Future Directions
The ERT model was developed for karst plateau waters with high pH (>8.2) and high calcite content (>65% of suspended particles). Its selected features, including log_B2, B1 + B3, and B3 − B8A, may be less effective in non-karst waters. For application to a new region, sensitive features should first be reselected using local field and spectral data. The model should then be retrained and validated under local optical and hydrological conditions. Several limitations remain. First, sampling sites were sparse in deep-water areas because of access and terrain constraints. Model accuracy in these areas should therefore be interpreted cautiously. Second, satellite acquisition and field sampling differed by up to three days. Images acquired within one week after rainfall were excluded, but rapid discharge changes and wind-induced resuspension may still introduce uncertainty. The perturbation experiment produced a coefficient of variation below 8%, indicating limited sensitivity to small reflectance changes. However, it does not fully represent actual short-term hydrological variability. Third, the model uses surface reflectance and cannot capture vertical SS gradients. This limits its application in stratified waters. Fourth, the measured SS concentrations did not exceed 11.30 mg/L. The model has therefore not been validated for extreme concentrations above 15 mg/L, and extrapolation beyond the observed range should be avoided. Future studies should expand sampling in deep-water and high-SS areas. Same-day field sampling and satellite or UAV observations should be prioritized, especially during rapidly changing hydrological conditions. UAV-Sentinel-2 data fusion could improve spatial detail. ADCP or other profiling instruments could provide vertical SS information and support three-dimensional modeling. Hydrological and socio-economic models could also help assess long-term climatic and anthropogenic effects. Finally, laboratory experiments are needed to clarify how carbonate dissolution affects SS spectra and nutrient adsorption.
5. Relationships Between Suspended Solids and Water Quality and Environmental Parameters
SS, as a significant vector of pollutants in aquatic environments, exhibit concentration variations that are closely associated with water quality and environmental parameters, thereby reflecting the material cycling and energy flow processes within aquatic ecosystems. Utilizing Pearson correlation analysis, this study investigates the relationships and underlying mechanisms between SS concentration and eight key parameters: TOC, WT, transparency, pH, DO, PC, turbidity, and TN (see
Figure 8).
5.1. Relationship Between Total Organic Carbon and Suspended Solids
TOC exhibited a significant positive correlation with SS concentration (r = 0.738, p < 0.01), indicating a coupling effect between the water organic carbon cycle and SS dynamics. TOC comprises both dissolved and particulate organic carbon, originating from sources such as organic products of phytoplankton metabolism, terrigenous organic matter from terrestrial inputs, and organic pollutants adsorbed onto SS. Elevated TOC concentrations provide ample carbon sources that facilitate algal growth, thereby promoting phytoplankton proliferation and increasing the organic fraction of SS. Conversely, as a carrier of organic carbon, SS can adsorb organic substances from the water column, further elevating TOC levels. This bidirectional positive feedback mechanism was especially pronounced during the summer season (mean TOC = 6.50 mg/L; mean SS = 6.65 mg/L), reflecting the synergistic accumulation processes of organic carbon and SS under eutrophic conditions.
5.2. Relationship Between Water Temperature and Suspended Solids
WT impacts SS concentration through two primary mechanisms: firstly, elevated temperatures within the range of 20 to 30 °C enhance aquatic microbial activity, which facilitates the resuspension of sediment particles and consequently increases SS content in the water column; secondly, optimal temperatures promote algal growth and reproduction, thereby elevating the proportion of organic SS. In the Pingzhai Reservoir, the average WT during summer was 28.00 °C, coinciding with the annual peak in SS concentration (7.32 mg/L), whereas in winter, the average WT decreased to 12.27 °C, corresponding with the lowest SS concentration (2.39 mg/L), further substantiating the driving effect of WT. Moreover, increased WT intensifies water stratification, which diminishes material exchange between the upper and lower water layers, resulting in the accumulation of surface SS and the formation of concentration peaks.
5.3. Relationship Between Transparency and Suspended Solids
Transparency exhibited a significant negative correlation with SS concentration (r = −0.642, p < 0.01), indicating the predominant influence of SS on the optical properties of water. As primary scatterers, elevated SS concentrations increase the absorption and scattering of sunlight, thereby reducing light penetration depth and diminishing water transparency. In karst aquatic systems, SS primarily consist of calcite particles and algae, with the high reflectivity of calcite further intensifying light attenuation. Previous studies have demonstrated that when SS concentrations exceed 5 mg/L, the rate of transparency decline accelerates markedly, following an exponential decay pattern. This phenomenon was particularly pronounced during spring (average SS = 6.16 mg/L, average transparency = 1.26 m) and summer (average SS = 6.65 mg/L, average transparency = 1.00 m) in Pingzhai Reservoir.
5.4. Relationship Between pH and Suspended Solids
pH exhibited a positive correlation with SS concentration (r = 0.63, p < 0.01), a relationship fundamentally linked to carbonate equilibrium and algal metabolism. Karst water bodies are naturally alkaline (pH 7.5–8.5) due to the dissolution of carbonate rocks, wherein the dissolution and precipitation of calcite particles (CaCO3) directly influence SS concentration. Algae assimilate CO2 via photosynthesis, which promotes the decomposition of bicarbonate ions (HCO3−) in the water to supply carbon sources, thereby elevating pH levels. Elevated pH conditions favor the proliferation of alkaliphilic algae, such as cyanobacteria, resulting in increased organic SS content. This positive feedback loop—characterized by rising pH, algal proliferation, and SS accumulation—was most pronounced during the summer season (mean pH = 8.82; mean SS = 7.32 mg/L), illustrating the synergistic interplay between geological factors and biological processes.
5.5. Relationship Between Dissolved Oxygen and Suspended Solids
DO exhibited a positive correlation with SS concentration (r = 0.52, p < 0.01), with algal photosynthesis identified as the primary driving factor. Regions characterized by elevated SS concentrations typically correspond to areas of dense algal presence, where phytoplankton release oxygen through photosynthesis, thereby increasing DO levels in surface waters, occasionally resulting in supersaturation. For instance, the average DO concentration in high-SS zones of Pingzhai Reservoir during summer—such as the Nayong River inflow area—was 11.09 mg/L, which was significantly higher than that observed in the reservoir center (average DO = 8.50 mg/L). It is important to note, however, that algal respiration consumes oxygen during nighttime, potentially causing substantial diurnal fluctuations in DO concentrations within high-SS areas. This study exclusively collected daytime DO data, which limits the ability to fully capture these dynamic temporal variations.
5.6. Relationship Between Phytoplankton Carbon and Suspended Solids
PC exhibited a significant positive correlation with SS concentration (r = 0.58, p < 0.01), with both parameters serving as key indicators of phytoplankton biomass. PC represents the carbon content stored within phytoplankton cells, whereas the organic fraction of SS primarily consists of algal cells and their metabolic byproducts. Previous studies have demonstrated that each milligram of phytoplankton carbon corresponds to approximately 0.01 to 0.02 mg of SS concentration; however, this proportional relationship is influenced by the dominant algal species. Specifically, when cyanobacteria predominate, the correlation between PC and SS is stronger, attributable to their large cell volume and thick cell walls. Conversely, when diatoms dominate, the correlation tends to be weaker, likely due to their higher cell density and propensity for sedimentation. In Pingzhai Reservoir, cyanobacteria accounted for over 60% of the phytoplankton community during summer, and the correlation between PC and SS was significantly greater in this season compared to others, thereby corroborating this relationship.
5.7. Relationship Between Turbidity and Suspended Solids
Turbidity exhibited a positive correlation with SS concentration (r = 0.32, p < 0.01), indicating the influence of SS on water turbidity. Turbidity represents a comprehensive measure of light scattering caused by suspended particles in water, with its magnitude closely associated with particle concentration, size, and shape. In karst aquatic environments, SS primarily consist of calcite particles (2–5 μm) and algal cells (5–20 μm), whose combined scattering effects contribute to increased turbidity. Nevertheless, turbidity is also influenced by dissolved organic matter, colloids, and other factors, resulting in a weaker correlation with SS concentration compared to parameters such as TOC and WT. When SS concentration is below 5 mg/L, turbidity is predominantly governed by calcite particles; however, at concentrations exceeding 5 mg/L, the relative contribution of algal cells increases markedly.
5.8. Relationship Between Total Nitrogen and Suspended Solids
TN exhibited a significant negative correlation with SS concentration (r = −0.43, p < 0.01), indicative of the distinctive nutrient cycling dynamics characteristic of karst aquatic systems. The alkaline conditions (pH > 8.2) diminish the bioavailability of TN, thereby inhibiting algal proliferation and consequently reducing the generation of organic SS. Concurrently, calcite particles within SS have the capacity to adsorb nitrate (NO3−) from the water column, facilitating the transfer of nitrogen from the aqueous phase to sediments via sedimentation processes, which results in a decline in water column TN concentrations. This negative feedback mechanism, described as “high SS—nitrogen adsorption and sedimentation,” was particularly pronounced during winter (mean SS = 2.39 mg/L; mean TN = 1.85 mg/L) and autumn (mean SS = 2.37 mg/L; mean TN = 1.92 mg/L), thereby reflecting the coupled migration patterns of nitrogen and SS in karst water bodies.
The aforementioned correlation analysis demonstrates that SS concentration is comprehensively influenced by physical, chemical, biological, and other factors. TOC and WT supply the material basis and energy conditions necessary for SS accumulation. pH and DO indirectly regulate SS concentration by affecting biological metabolism. Transparency and turbidity serve as direct optical indicators of SS concentration. Furthermore, the observed negative correlation with TN highlights the distinctive characteristics of karst water bodies. These relationships not only elucidate the internal dynamics of aquatic ecosystems but also provide a scientific foundation for selecting parameters in SS remote sensing inversion. This understanding holds significant implications for water-quality monitoring and the ecological protection of karst plateau lakes.
6. Conclusions
This study develops a remote sensing inversion framework for suspended solids (SS) concentration in karst plateau lakes by integrating highly sensitive spectral features with the Extremely Randomized Trees (ERT) algorithm, using Sentinel-2 MSI imagery and field measurements from 40 sampling sites at Pingzhai Reservoir. The ERT model achieves excellent performance (R2 = 0.90, RMSE = 0.95 mg/L, MAE = 0.66 mg/L), substantially outperforming traditional single-band linear models (57% improvement) and multiple linear regression (27% improvement), as well as other machine learning algorithms including Random Forest, XGBoost, and GBM. Feature importance analysis identifies log-transformed band B2, the combination of B1 and B3, and log-transformed B1 as the most influential predictors, underscoring the critical role of nonlinear transformations and cross-band combinations of blue-green spectral bands in enhancing SS signals while mitigating calcite particle interference in karst waters.
SS concentrations in Pingzhai Reservoir exhibit significant seasonal variation (ANOVA, p < 0.001), with peaks in spring (7.29 mg/L) and summer (7.32 mg/L), and notably lower values in autumn (2.37 mg/L) and winter (2.39 mg/L). Spatially, elevated SS concentrations are predominantly concentrated in inflow zones (e.g., Nayong and Shuigong Rivers), while the reservoir center maintains lower levels. Correlation analysis reveals that SS is significantly positively correlated with TOC (r = 0.74) and water temperature (r = 0.73), and negatively correlated with transparency (r = −0.64). Notably, the negative correlation with total nitrogen under high-pH conditions (r = −0.43) highlights a distinctive nutrient cycling mechanism in karst aquatic systems, wherein calcite particles adsorb nitrate and facilitate its sedimentation. The proposed framework offers a high-spatiotemporal-resolution (10–60 m, 5-day revisit) remote sensing solution for SS monitoring, providing scientific support for pollution source tracing and adaptive water-quality management in karst plateau lakes and analogous turbid aquatic environments.