Article

Investigating Dissolved Harmful Algal Blooms Phycotoxins in New Jersey Aquatic Environments

1
Department of Environmental & Sustainability Sciences, Kean University, 1000 Morris Avenue, Union, NJ 07083, USA
2
Department of Environmental & Sustainability Sciences, Kean Ocean, Toms River, NJ 08754, USA
3
Department of Biological Sciences, Kean University, Union, NJ 07083, USA
4
Department of Criminal Justice and Public Affairs, Kean University, Union, NJ 07083, USA
5
School of Integrative Science and Technology, Kean University, Union, NJ 07083, USA
6
Department of Chemistry and Physics, Kean University, Union, NJ 07083, USA
*
Author to whom correspondence should be addressed.
Water 2026, 18(16), 2017; https://doi.org/10.3390/w18162017
Submission received: 14 July 2026 / Revised: 9 August 2026 / Accepted: 16 August 2026 / Published: 18 August 2026
(This article belongs to the Section Water Quality and Contamination)

Abstract

Harmful algal blooms (HABs) are recurring problems in New Jersey (NJ). Some HABs produce organic phycotoxins that are detrimental to both ecosystem organisms and human health. While most studies on HABs and phycotoxins focus on freshwater in NJ, comparative measurements of phycotoxins in marine coastal environments are understudied. In the summer of 2025, surface water from 11 freshwater, 3 brackish rivers, and 10 coastal sites in northern and central NJ was collected and analyzed for 12 dissolved phycotoxins using a combination of solid phase extraction and liquid chromatography-tandem mass spectrometry. Phycotoxin concentrations and distribution varied spatially among sampling sites. Total okadaic acid (OA) and total dinophysistoxin-1(DTX-1) were present with the highest concentrations, followed by brevetoxin and microcystin. Cluster analysis revealed separation of phycotoxin patterns mostly between freshwater and brackish/marine sites. Correlation analysis revealed significantly positive correlations among total OA, total DTX-1, and pectenotoxin-2 concentrations, revealing their potential common source from the same HAB species. Temperature, dissolved oxygen, and pH were mostly correlated with multiple phycotoxins, suggesting their important role in shaping HABs and phycotoxin production. This study detects phycotoxins at low levels, which can help to provide early warnings of HABs to establish water quality baselines and maintain environmental health.

1. Introduction

Harmful algal blooms (HABs) are gaining increasing recognition as a major environmental and public health concern in aquatic systems worldwide [1,2]. HABs occur when certain species of phytoplankton, such as cyanobacteria, dinoflagellates, and diatoms, multiply rapidly under ideal environmental conditions and form dense colonies in either freshwater or marine water. These blooms can often produce biologically active secondary metabolites, known as phycotoxins. Among thousands of phytoplankton species, about 300 are involved in HAB events and more than 100 produce persistent phycotoxins that can result in intoxication or death in humans and animals [3]. These toxins can accumulate in water, sediments, and aquatic organisms, posing risks to ecosystem health, wildlife, and human populations through recreational exposure, respiration, or consumption of contaminated seafood or drinking water [3,4,5]. In addition to ecological issues, HAB events can impose severe economic burdens on inland and coastal communities. Fishery closures, shellfish harvest restrictions, and public health advisories can result in significant financial loss and disruption in tourism economies [6]. It is estimated that annual losses due to the algal blooms in the US have risen from $50 to $82 million dollars per year [7].
The occurrence and persistence of HABs depend on various physical, chemical, and biological factors [8]. Increased nutrient loading and pollution from urban development and agricultural activities, food web alterations, introduced species, and hydrological pattern modifications all play a role in contributing to the occurrence of HABs [9,10,11,12]. While the ecological drivers of HAB formation have been studied extensively, the diversity and dynamics of individual phycotoxins produced during bloom events remain comparatively understudied [13,14]. Based on poisoning syndrome, phycotoxins from freshwater and marine water can be grouped into cyanotoxins, amnesic shellfish poisoning (ASP) toxins, azaspiracid shellfish poisoning (AZP) toxins, diarrhetic shellfish poisoning (DSP) toxins, neurotoxic shellfish poisoning (NSP) toxins, paralytic shellfish poisoning (PSP) toxins, and ciguatera fish poisoning (CFP) toxins [15]. Many monitoring programs focus primarily on detecting the presence of bloom-forming organisms or measuring broad toxin categories, yet individual phycotoxins can vary significantly in their concentration, toxicity, persistence, and ecological effects [16,17]. For instance, variants of microcystin (MC) produced by cyanobacteria and present dominantly in freshwater, MC-LR, MC-RR, and MC-YR, showed different toxicity profiles, with the highest toxicity associated with MC-LR, followed by MC-YR [18,19]. Monitoring programs frequently assessing HABs through broad toxin groupings may thus overlook variations in individual toxin compounds and limit the ability to detect emerging or low-concentration toxins. Moreover, certain toxins may be present even when visible bloom conditions are not apparent, suggesting that phycotoxin detection has the potential to serve as an early warning indicator of developing HAB events [20]. Improved characterization of specific toxins is therefore critical for understanding bloom development, assessing ecological and human health risks, and strengthening monitoring frameworks.
HABs are recurring problems in New Jersey (NJ) aquatic environments [21,22,23]. It is estimated that confirmed HAB events increased by 26% between 2019 and 2020 in the 1900 lentic waterbodies in NJ [21]. In NJ, HAB monitoring and research have historically been concentrated on well-documented freshwater blooms overseen by the New Jersey Department of Environmental Protection (NJDEP) [22,24]. Based on the HAB cell abundance and phycotoxin levels, NJDEP divided the water into five alert categories from least to most severe conditions as: HAB not present, watch, advisory, warning, and danger [24]. When reaching the advisory level of confirmed HAB with moderate risk of adverse health effects and increasing potential for toxins above the public health threshold, NJDEP will typically close the water access to the public and post the alert sign. In the summer of 2023, 12 out of over 100 monitoring sites in NJ freshwaters showed HAB events above the health advisory level [24]. In addition to freshwater, HABs have also become an increasing event throughout the coastal environments [25]. Red tide blooms have been observed in the Hudson-Raritan estuary and NJ coastal waters, and brown tide blooms also occurred in the Barnegat Bay, NJ, in the past [26,27]. Coastal waters of NJ support diverse phytoplankton communities that can produce a range of harmful toxins [23]. However, NJ marine and estuarine environments remain comparatively less studied for HABs, despite their ecological and economic importance. In particular, the distribution and composition of phycotoxins in local marine environments remain insufficiently characterized [28,29]. Determining detection limits of these phycotoxins in marine waters will help predict HAB events in the water body before harmful ecological or environmental damage occurs. A more detailed understanding of specific phycotoxin occurrence could improve early detection of bloom events and inform more targeted mitigation strategies in marine and estuarine systems.
The present study examines dissolved phycotoxin presence and diversity in both freshwater and marine environments in northern and central NJ over the summer of 2025, with particular attention to individual toxin compounds rather than broad toxin categories using the liquid chromatography coupled with tandem mass spectrometry (LC-MS/MS) technique. Dissolved toxins pose the first threat to recreational water use and cannot be filtered out by membrane treatment of water. This work aims to contribute to a more detailed understanding of HAB-related extracellular toxin dynamics in the region. By focusing on toxin level characterization, this study seeks to provide insight into the potential for phycotoxins to serve as early indicators of HAB activity, to address current knowledge gaps surrounding HABs in NJ’s coastal waters, and to enhance regional monitoring coverage.

2. Method

2.1. Sampling Locations and Water Collection

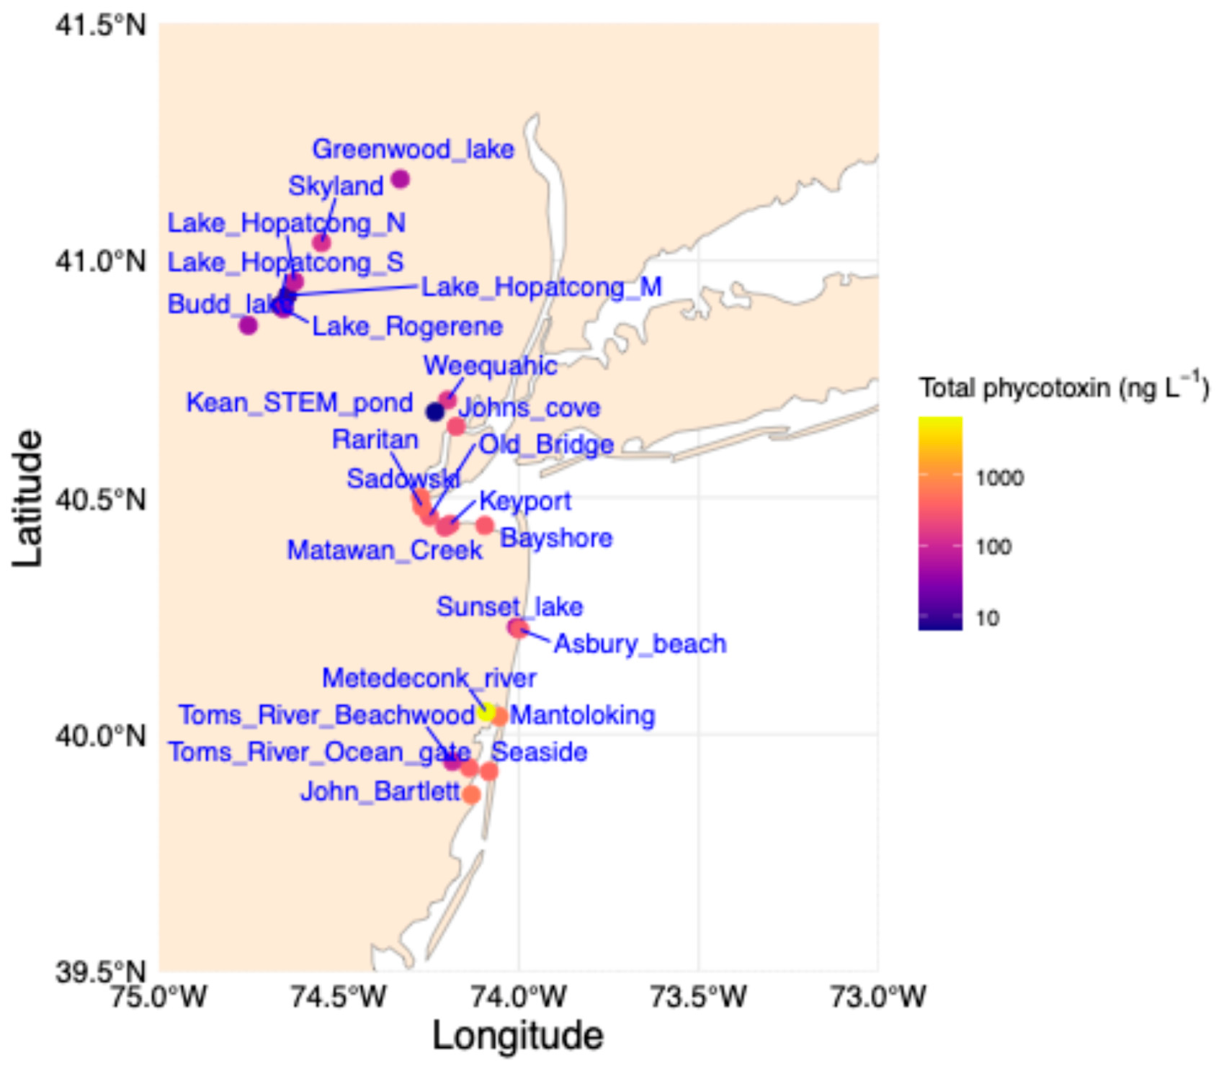
The sampling locations with potential HAB occurrence were selected in the northern and central New Jersey areas (Figure 1) mainly based on water monitoring data collected by NJDEP and Barnegat Bay Partnership (BBP) [24,30]. A total of 32 water samples occupying 24 different locations (11 freshwater, 3 brackish river, and 10 marine sites) were collected during May–August 2025 (Table 1). At every study site, physicochemical environmental parameters, including temperature, pressure, dissolved oxygen (DO), specific conductivity, salinity, pH, chlorophyll (Chl), and phycoerythrin, were collected from the surface water using a Yellow Spring Instrument (YSI) sonde (YSI Inc., Yellow Springs, OH, USA), which is a multiparameter field meter. Two-liter water was sampled using polycarbonate bottles from the top surface at the sampling locations, and the samples were brought to the laboratory for extraction and analysis.

2.2. Phycotoxin Extraction

To extract dissolved phycotoxins from the water samples, water was first filtered through GF/F filters (Whatman™, Cytiva, Malborough, MA, USA), then through 0.2 μm pore size polyethersulfone filters (Supor®, Cytiva, Malborough, MA, USA) to remove particulate matter, and extracted with solid phase extraction (SPE) using C18 cartridges [31,32,33]. During the SPE, the C18 (HyperSep™, 1 g, 6 mL, Thermo Scientific™,Thermo Fisher Scientific Inc., Waltham, MA, USA) cartridges were conditioned with one cartridge volume of methanol (LC-MS grade) and Milli-Q water, then 2 L of water filtrate was passed through the cartridge, and the cartridges were washed with four cartridge volumes of Milli-Q water before final elution with 8 mL methanol (LC-MS grade). Eluates were then dried under nitrogen, resuspended in 1 mL methanol, and filtered through 0.2 μm pore size polyvinylidene fluoride (PVDF) syringe filters into 2 mL amber glass vials to be stored at −20 °C until analysis. To test the SPE extraction efficiency, 5 ng mL−1 phycotoxin standards were extracted using the C18 cartridge following the same procedure as samples and analyzed as described below.
Total okadaic acid (OA) and total dinophysistoxin (DTX) were measured after alkaline hydrolysis, which converted DSP toxin derivatives to parental toxins. In brief, 0.5 mL SPE extracts were hydrolyzed in 0.28 N NaOH at 76 °C for 40 min, and then an equal amount of HCl as NaOH was added to reach a final pH between 4 and 5 [34].

2.3. Phycotoxin Analysis

For analysis of the phycotoxins, samples were measured on an Ultra-High Performance Liquid Chromatography-Triple Quadrupole Mass Spectrometry (Waters™ Acquity UPLC-Xevo TQ Absolute MS/MS, Waters Corporation, Milford, CT, USA). Twelve phycotoxins, including three microcystin congeners (MC-LR, MC-RR, MC-YR), domoic acid (DA), azaspiracid-1 (AZA1), azaspiracid-2 (AZA2), OA, yessotoxin (YTX), pectenotoxin-2 (PTX2), two dinophysistoxins (DTX1, DTX2), and brevetoxin (PbTx2), were analyzed. DA leads to ASP, OA and DTX are associated with DSP, YTX and PTX2 are often found alongside DSP toxins, AZA results in AZP, and PbTx2 leads to NSP [15,17]. External standards were used for calibration curves and quantification. Concentrations of calibration standards ranged from 0.1 to 100 ng mL−1, except for AZA1 and AZA2, which ranged from 0.001 to 100 ng mL−1, and PbTx2 from 1 to 1000 ng mL−1.
LC-MS/MS analysis methods followed [35] with modifications. Chromatography was conducted using a Waters™ Acquity UPLC BEH C18 column (1.7 μm, 2.1 × 50 mm, Waters Corporation, Milford, CT, USA) at 60 °C. Samples were held at the sample manager at 10 °C, and the injection volume was 10 μL. For MC-LR, MC-RR, MC-YR, and DA analysis, 0.1% formic acid in water was used as mobile phase A and 0.1% formic acid in acetonitrile was used as mobile phase B. Flow rate was 0.6 mL min−1 and the gradient program followed: 2% B increasing to 25% B at 0.5 min, keeping at 25% B until 1.5 min, increasing to 40% B at 3 min and 50% B at 4 min, rising to 95% B at 4.1 min, then keeping at 95% B until 4.5 min before dropping back to 2% B at 5 min. The total run time was 7 min. For AZA1 and AZA2, mobile phase A was 50 mM (0.2%) formic acid and 2 mM ammonium formate in water, and mobile phase B was acetonitrile. The gradient was run at a flow rate of 0.5 mL min−1 with an initial 5% B going up to 95% B at 5 min and kept at 95% B between 5 min and 6 min until decreasing back to 5% B at 6.5 min. The total run time was 7 min. For the analysis of OA, YTX, PTX2, DTX1, DTX2, and PbTx2, 0.01% ammonium hydroxide in water was mobile phase A, and acetonitrile was mobile phase B. The flow was 0.5 mL min−1, and the gradient program was: 5% B increasing to 95% B over 7 min, maintaining at 95% B for another 1 min, then decreasing to 5% B at 8.5 min. The total run time was 9 min.
MS/MS tune parameters were set as: 120 °C source temperature, 3.10 kV capillary voltage, 500 °C desolvation temperature, 1000 L h−1 desolvation gas flow, 150 L h−1 cone gas flow, 0.15 mL min−1 collision gas flow. Nitrogen was used as the desolvation, cone, and nebulizer gas, and Argon was used as the collision gas. Samples were ionized under an electrospray ionization (ESI) probe. Multiple reaction monitoring (MRM) transitions were acquired under positive mode for MC-LR, MC-RR, MC-YR, DA, AZA1, AZA2, PTX2, PbTx2, and negative mode for OA, YTX, DTX1, DTX2 (Table 2). During the analysis for OA, YTX, PTX2, DTX1, DTX2, and PbTx2, the first 4 min were set as negative ionization mode while 4–9 min were set as positive ionization mode. Limit of detection (LOD) and limit of quantification (LOQ) for each phycotoxin were determined as: LOD = 3.3 × Sy/S and LOQ = 10 × Sy/S, where Sy was the standard deviation of blanks and S was the slope of the calibration curve derived from running triplicate methanol blanks and calibration standards across the quantification concentration range (Table S2). Quantification of phycotoxins in samples against calibration standards was conducted in the TargetLynx application of MassLynx software (version 4.1). Peaks with signal-to-noise (S/N) ratio ≥ 3 were quantified. Phycotoxin concentrations were corrected with the SPE extraction efficiency (Table S1), which fell in the recovery range (10–>100%) as determined before [32], except for the low recovery (4%) for DA due to its high polarity, hydrophilic feature, and low retention on the reversed SPE cartridge.

2.4. Data Analysis

Data were analyzed using the software R (version 4.2.1). A sampling map was drawn using the rnaturalearthhires and ggplot2 packages [36,37]. Comparison of all analyzed phycotoxins among sampling sites was performed through a heatmap and cluster analysis generated using R packages ggplot2 and ggdendro [37,38]. To further identify grouping of samples and the driving phycotoxins for each group, non-metric multidimensional scaling (NMDS) analysis and Permutational Multivariate Analysis of Variance (PERMANOVA) analysis were conducted with the vegan package [39]. Results of Pearson correlation analysis among all environmental physicochemical variables and individual phycotoxin concentrations derived from the Hmisc and Car packages were presented in a heatmap [40,41].

3. Results

3.1. Physicochemical Environmental Parameters

Over the 24 sampling locations, 11 lake or river sites with salinity of 0.04–2.3 ppt and specific conductivity of 84.3–4298 μS cm−1 were assigned as freshwater, 3 river sites with salinity of 9.96–13.68 ppt and specific conductivity of 16,896–22,602 μS cm−1 were assigned as brackish river, and 10 coastal sites with salinity of 13.90 ± 2.48 ppt and specific conductivity of 22,950 ± 3749 μS cm−1 were designated as marine sites (Table 1, Figure 1). During the summer sampling period, the surface water temperature was 23.0 ± 4.4 °C and pressure ranged from 14.203 to 14.891 psi. DO was above 6.4 ppm for all sites except the Old Bridge site, with a low value of 4.8 ppm. pH in freshwater was more variable (6.56–9.50) compared to marine water and brackish river (7.22–8.22). Chlorophyll ranged as low as 1.44 μg L−1 and as high as 246.78 μg L−1 across the sampling locations in the summer of 2025. The highest concentration of chlorophyll occurred at freshwater Sunset Lake, followed by the marine site at Old Bridge (100.84 μg L−1). Chlorophyll in Lake Hopatcong and Weequahic increased from June to July and then decreased from July to August. Phycoerythrin, a red pigment that better detects marine algae, generally followed similar patterns as chlorophyll among sites, except higher in Old Bridge than in Sunset Lake and lower in a few freshwater sites, such as Weequahic, Toms River Beachwood, Kean STEM pond, Lake Rogerene, and Lake Hopatcong South, than in the marine or brackish river sites with comparable chlorophyll concentrations.

3.2. Phycotoxin Concentrations

Total dissolved phycotoxin concentrations across the 24 sampling sites ranged from 6.32 to 6502.45 ng L−1, with an average of 488.03 ng L−1 and most below 615.21 ng L−1 except at Metedeconk River (Figure 1). There was an increasing trend of total phycotoxin concentrations from the northern New Jersey sites to the central New Jersey sites. Total phycotoxin concentrations ranged from 6.32 to 144.46 ng L−1 in the freshwater sampling sites, 230.42–6502.45 ng L−1 in the brackish river sites, and 253.42–615.21 ng L−1 in the coastal sites, showing higher concentrations of total analyzed phycotoxins in the marine and brackish river water than in the freshwater.
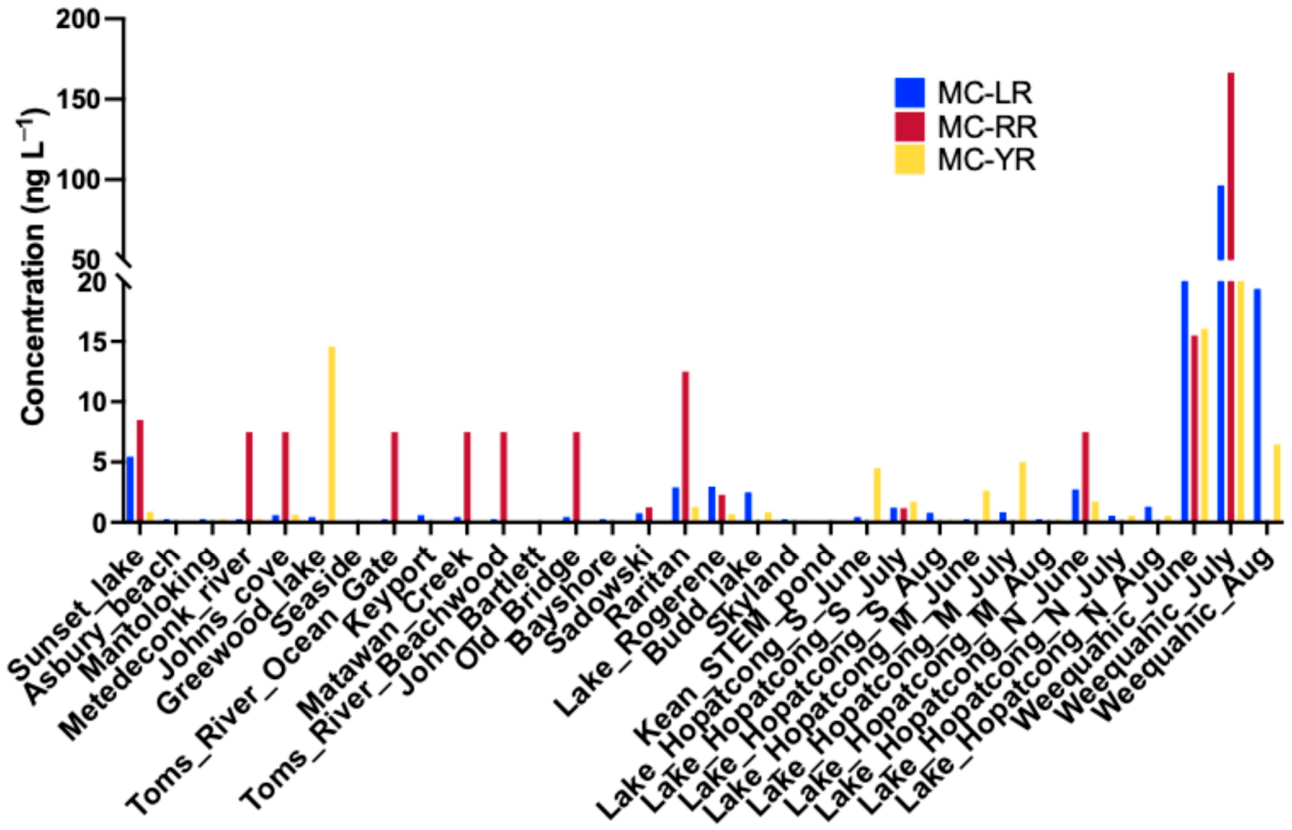
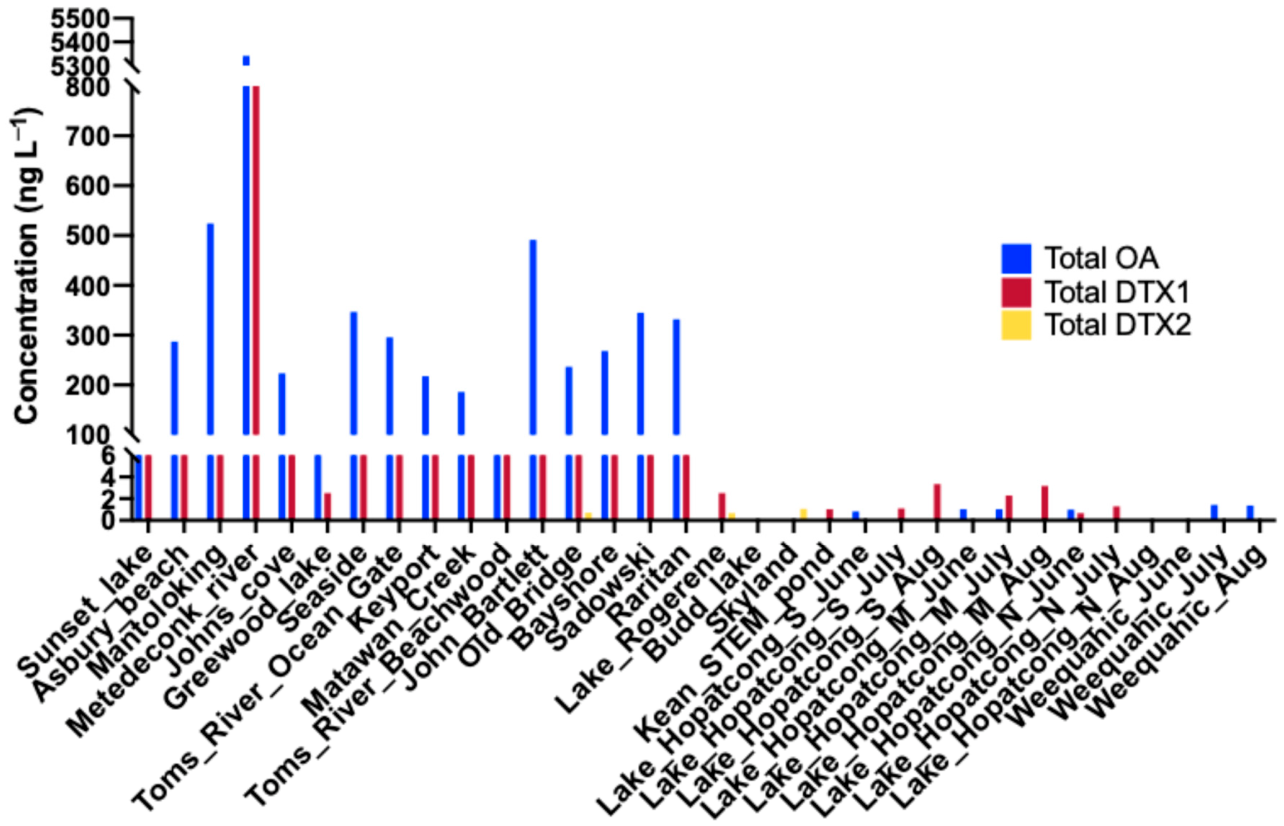
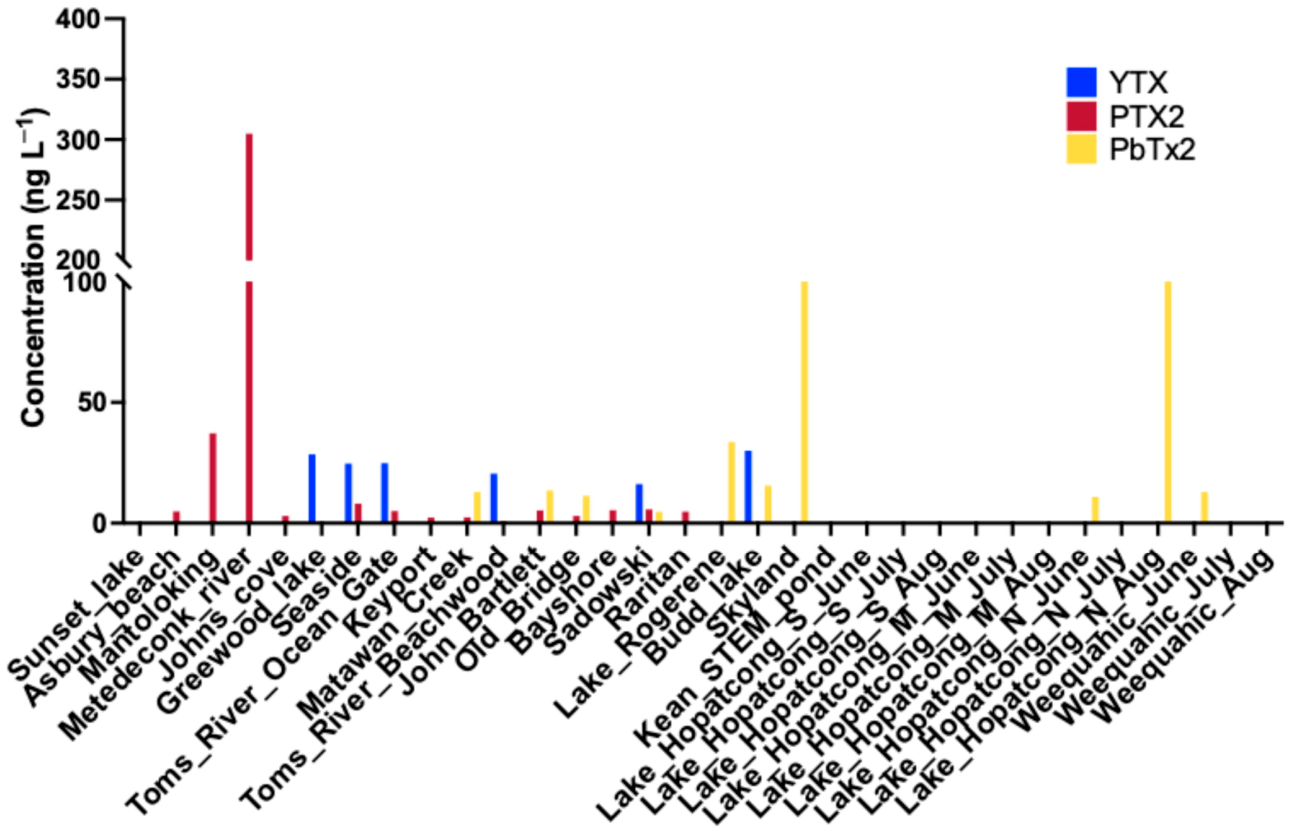
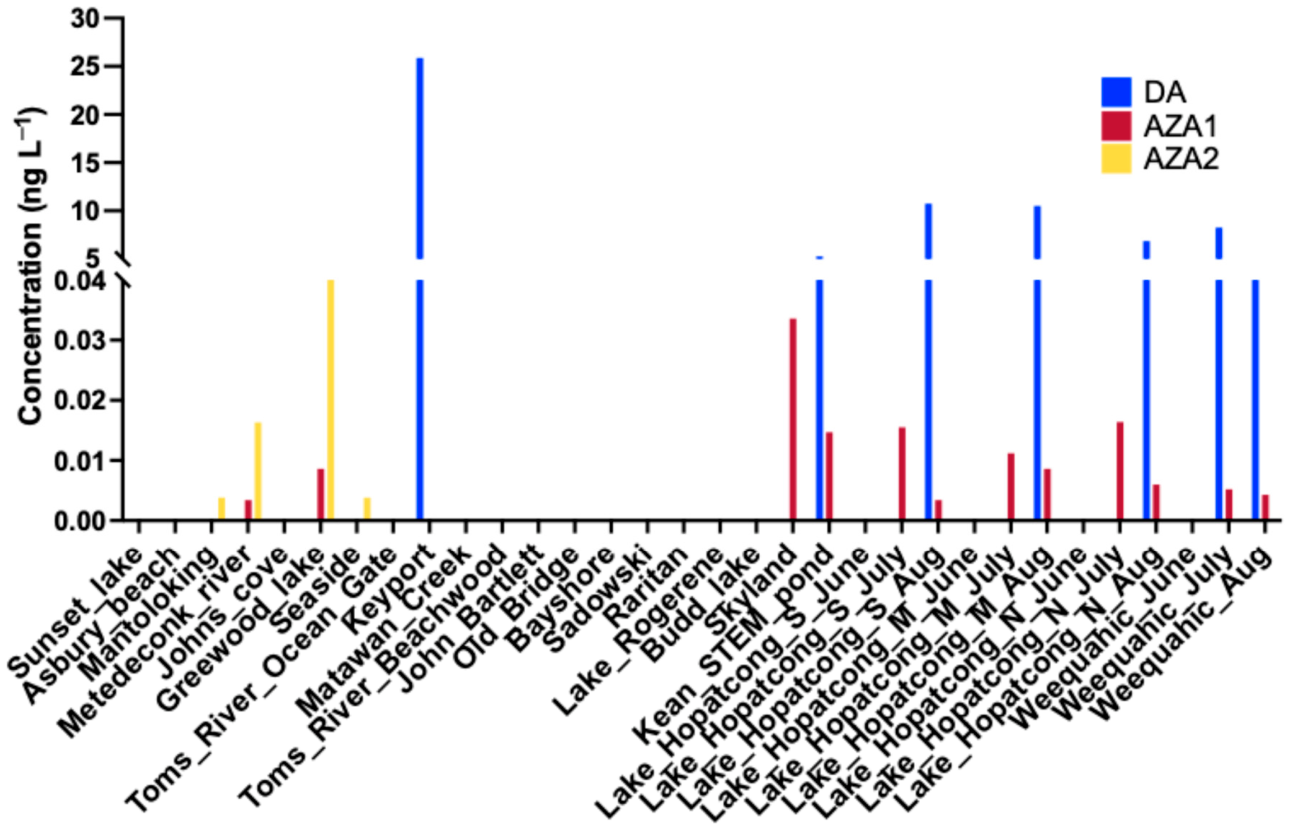
The extremely high concentration of total dissolved phycotoxin at the Metedeconk River was due to the presence of total OA and total DTX1 (Figure 2). Total OA and total DTX1 ranked as the highest concentrations in all the brackish river and marine sites, together with two freshwater sites. No obvious spatial pattern was observed for YTX, PTX2, and PbTx2 concentrations, with sporadic high values of PTX2 in the Metedeconk River and Mantoloking sites, and high concentrations of PbTx2 in the Skyland and Lake Hopatcong North sites (Figure 3). DA, AZA1, and AZA2 were of the lowest concentrations among all analyzed phycotoxins, ranging from undetectable to 25.88 ng L−1 (Figure 4). In comparison to total OA and total DTX1, the highest concentrations of MC congeners (up to 166.51 ng L−1) were mainly in the freshwater lakes, the Weequahic site in particular (Figure 5).

3.3. Temporal Shift of Phycotoxins in Lake Hopatcong and Weequahic Park

At the Lake Hopatcong and Weequahic Park sample sites, dissolved phycotoxins were analyzed over three months from June to August for temporal patterns. Total OA, total DTX, YTX, PTX2, PbTX2, and AZA were undetected or at low concentrations (0.0034–13 ng L−1) at all times with no obvious temporal patterns, except one high concentration sample of PbTx2 at the Lake Hopatcong North site in August (Figure 2, Figure 3 and Figure 4). DA concentrations remained below the detection limit in Lake Hopatcong over June and July and in Weequahic Park during June, but increased to 6.86–10.75 ng L−1 in August at all three sites in Lake Hopatcong and increased to 3.80–8.26 ng L−1 in July and August in Weequahic Park (Figure 4). MC toxins showed different temporal shifts across sites. While MC-LR and MC-RR concentrations increased from June to July and then decreased in August at the Lake Hopatcong South and Middle sites, all three MC congeners were at their highest concentrations in June at the Lake Hopatcong North site and then decreased afterwards (Figure 5). Similar to the temporal pattern in the Lake Hopatcong South and Middle sites, the Weequahic site showed an increase in all three MC congener concentrations from June to July and a decrease afterwards. MC concentrations were highest in Weequahic Park compared to other sites, ranging between 6.44 and 166.51 ng L−1 over the summer.

3.4. Spatial Separation Based on Phycotoxin Patterns

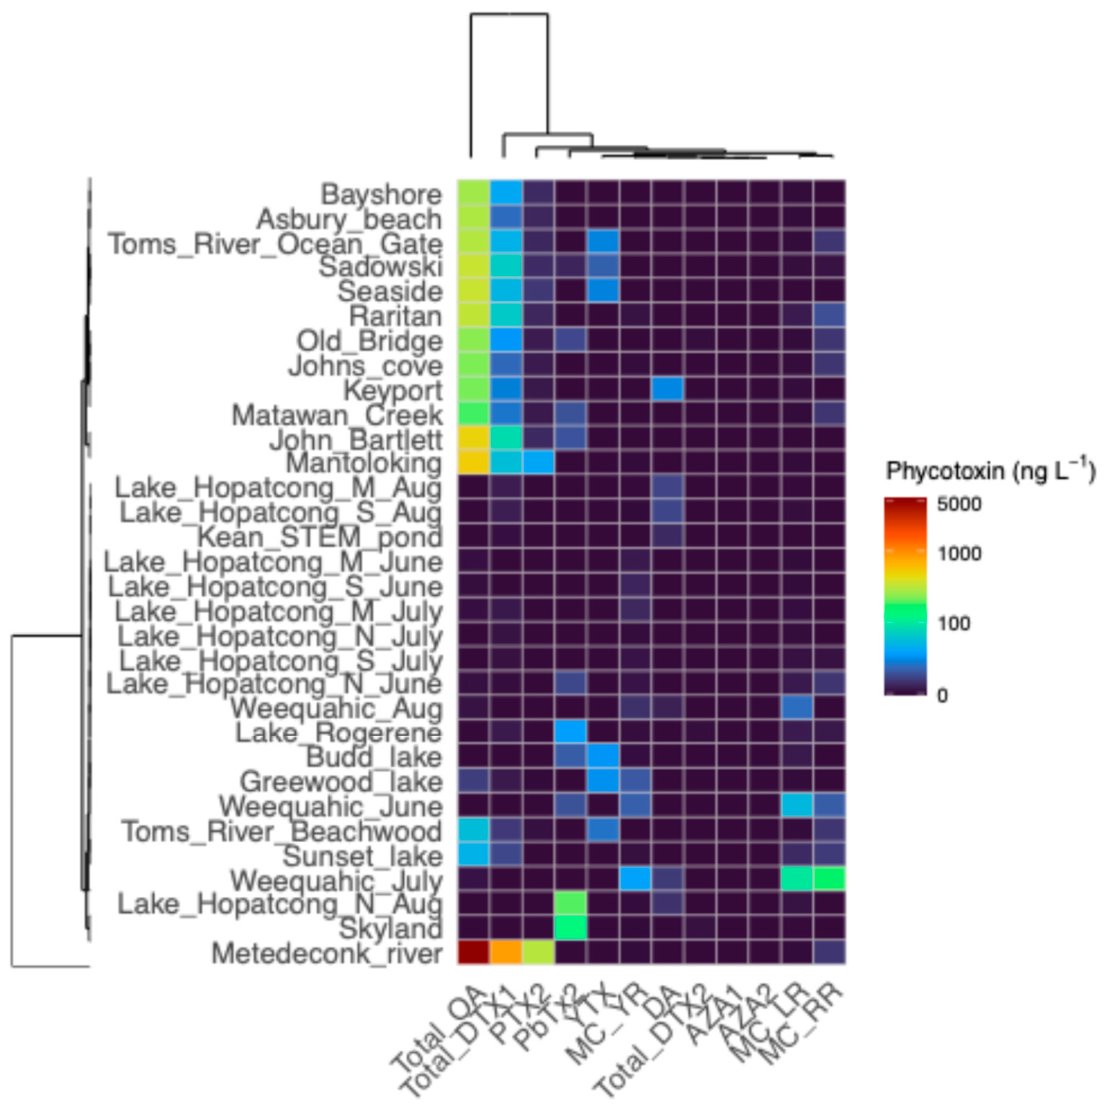
Heatmap of analyzed dissolved phycotoxins across all sampling locations showed the distinct separation between mainly marine sites and freshwater sites (Figure 6). Excluding the extreme at Metedeconk River, total OA and total DTX1 ranked as the top two highest phycotoxins in the coastal sites, followed by YTX and PTX2. In contrast, total OA, PbTx2, YTX, MC-LR, MC-RR, and MC-YR showed high concentrations at sporadic freshwater locations.
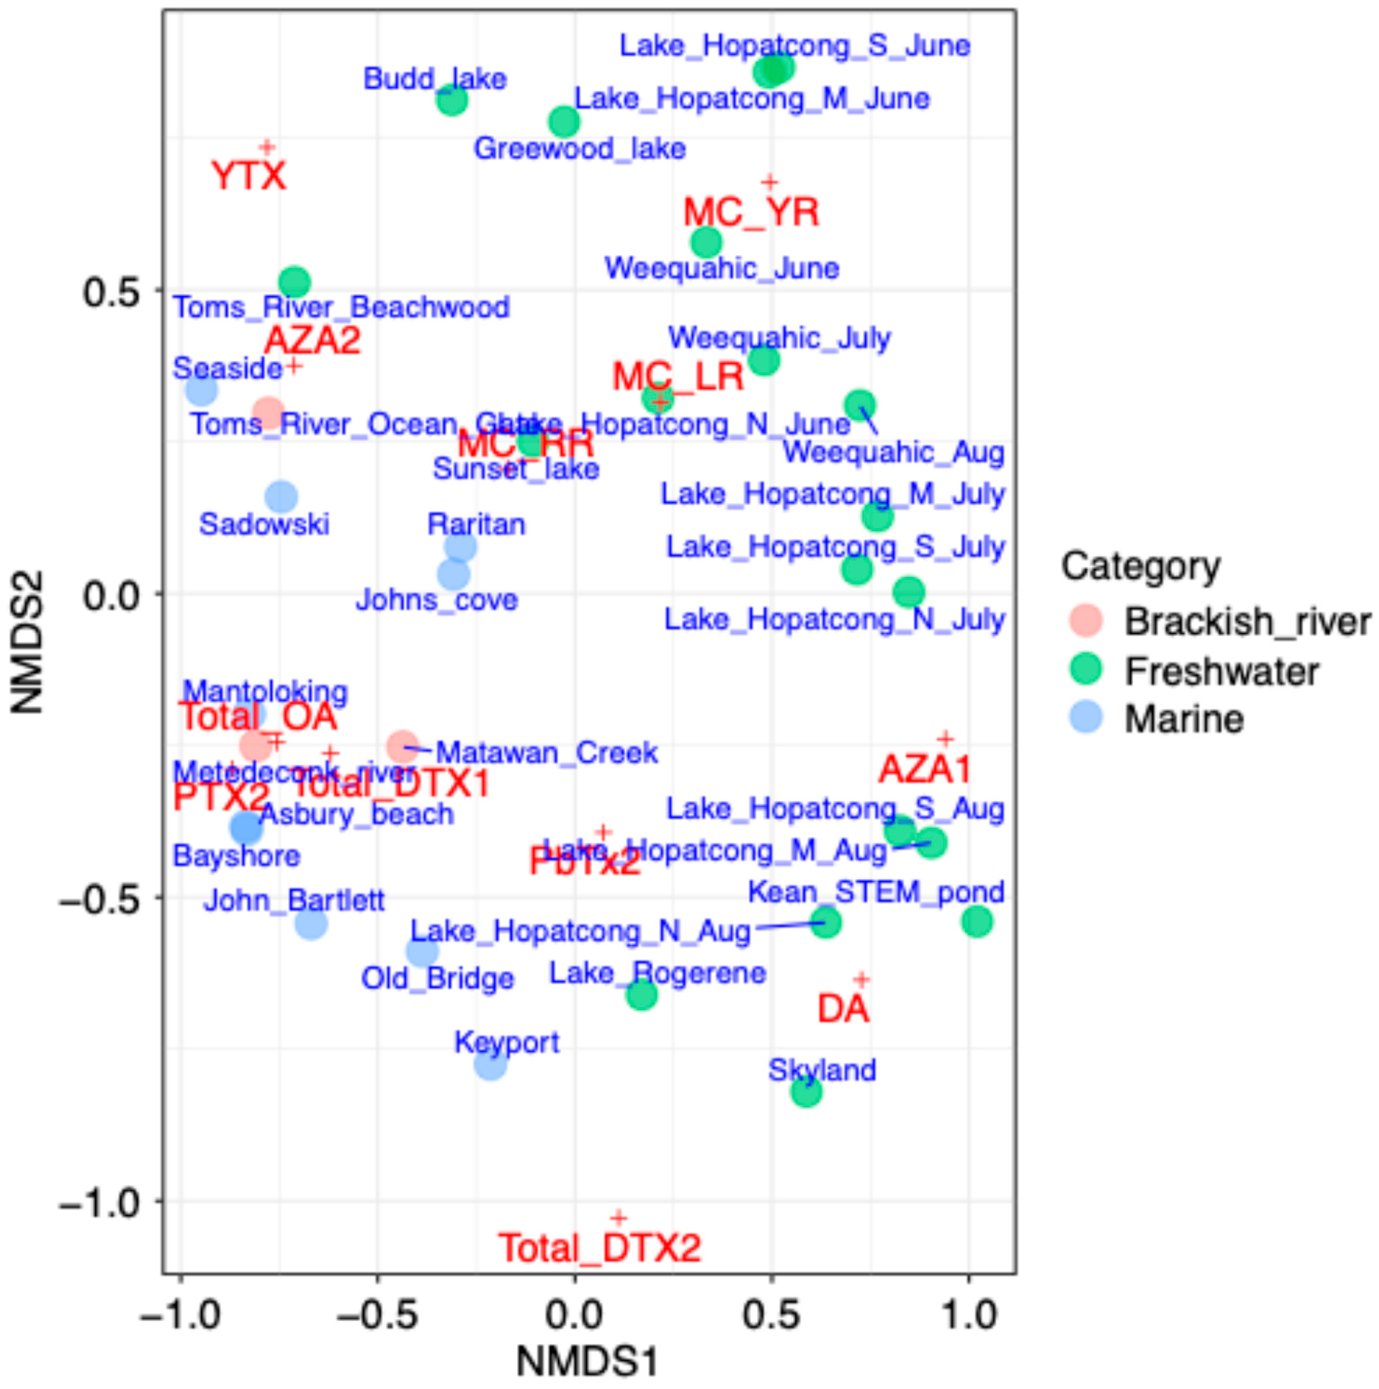
When grouping sampling locations into marine, brackish river, and freshwater categories, the NMDS plot indicated that phycotoxins in the brackish river were grouped together with those in the marine water, which distinguished them from those in the freshwater sites (Figure 7). PERMANOVA analysis showed a significant difference between marine/brackish river samples and freshwater samples (p = 0.001). Marine and brackish river samples were clustered in the left portion of the NMDS plot, whereas freshwater samples were grouped on the right side of the plot. Phycotoxin loadings in the NMDS plot suggested the marine and brackish river group was driven by the pattern of total OA, total DTX1, and PTX2 toxins, while freshwater samples were driven mainly by MC phycotoxins. The NMDS plot also connected certain sampling locations in proximity. For instance, Toms River, which is geographically close to the Seaside site, was near the Seaside sample on the plot; Metedeconk River and Mantoloking were also close by on the plot due to their tight physical connection (Figure 1).

3.5. Correlation to Environmental Parameters

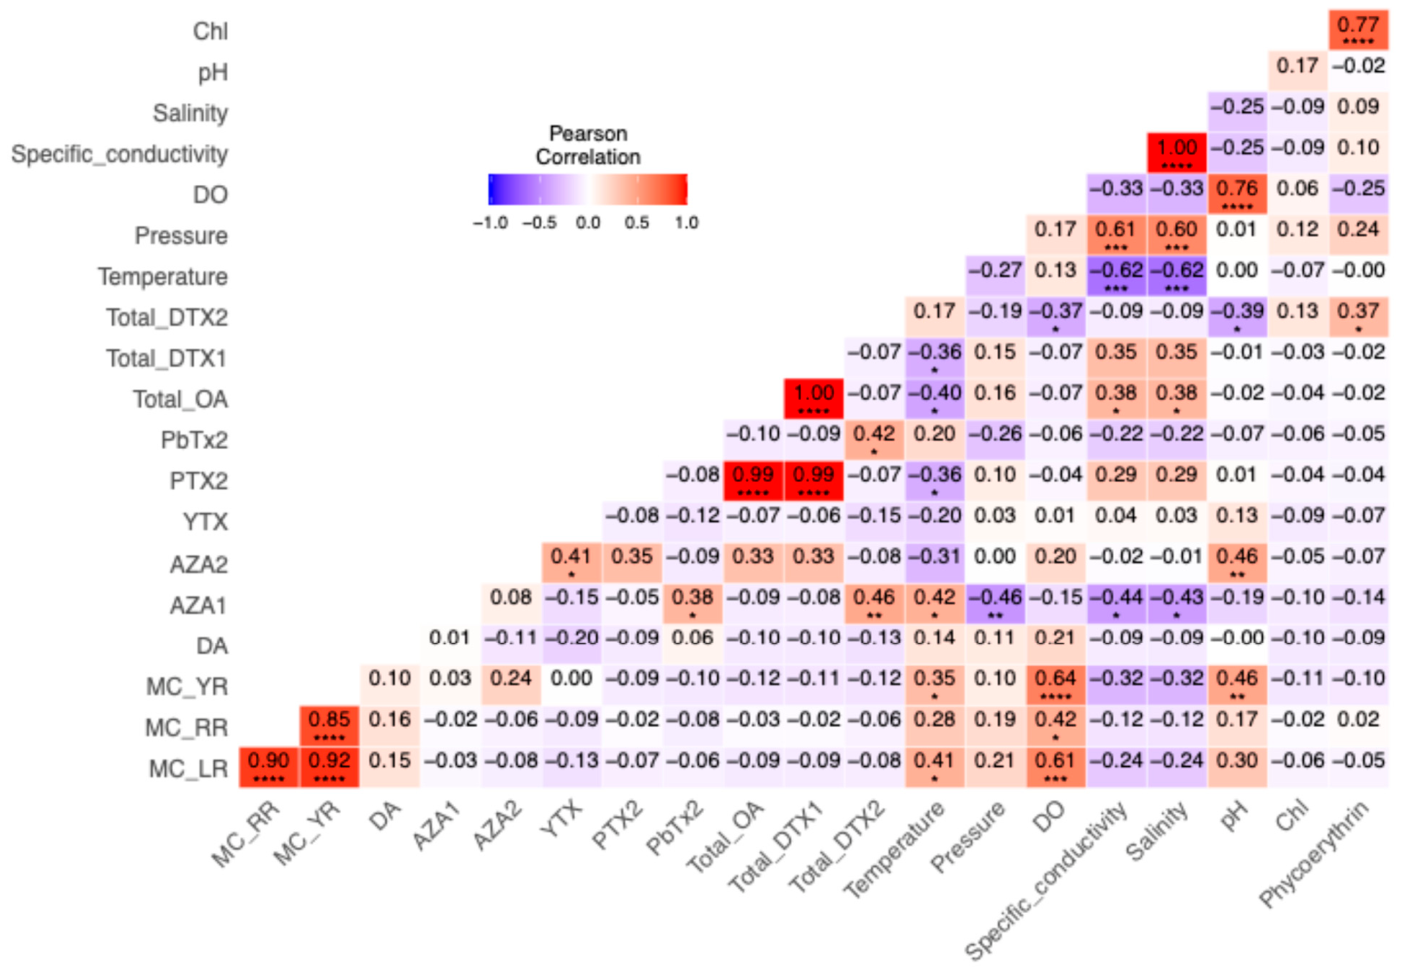
Correlations between individual dissolved phycotoxins and between phycotoxins and physicochemical environmental parameters were shown in a heatmap (Figure 8). Among the analyzed phycotoxins, total OA, total DTX1, and PTX2 were significantly and positively correlated with each other, reaching a tight correlation coefficient of 0.99–1.00. Similarly, MC-LR, MC-RR, and MC-YR showed a tight positive correlation with each other, with a correlation coefficient of 0.85–0.92. Significantly positive correlations were also observed between phycotoxin pairs of AZA2 and YTX, AZA1 and PbTx2, total DTX2 and PbTx2, and total DTX2 and AZA1. Between phycotoxins and environmental physicochemical properties, temperature, DO, and pH showed the most significant correlations with individual phycotoxin concentrations. Surprisingly, chlorophyll concentrations were not significantly correlated with any of the analyzed phycotoxins.

4. Discussion

4.1. Distinct Phycotoxin Patterns in Coastal Environments Compared to Freshwater Systems and Connections Between Brackish Rivers and Coasts

In this study, dissolved (extracellular) phycotoxins, rather than total phycotoxins (including both extracellular and intracellular toxins), were measured to indicate the presence of readily bioavailable, highly toxic chemicals in the water that pose risks to aquatic organisms via the drinking pathway and to humans through direct contact. Similarly, other studies used another extraction method, solid phase adsorption toxin tracking (SPATT), to assess dissolved phycotoxins in environmental samples [29,42]. Our results showed relatively high concentrations of phycotoxins in the sampled marine coastal/brackish waters compared to freshwater (Figure 1), indicating a necessity for coastal phycotoxin monitoring in NJ. However, it is acknowledged that sporadic sampling over the summer and across the limited spatial scale may omit some extremely high phycotoxin events in freshwater in NJ.
Distinct phycotoxin patterns between coastal/brackish water and freshwater environments were related to different HAB species present in two systems. MC congener toxins were mainly produced by cyanobacteria Microcystis spp., Dolichospermum spp., Aphanizomenon spp., Planktothrix spp., and Oscillatoria spp., which are typical dominant phytoplankton species in freshwater lakes, ponds, and rivers, though also found in less saline estuaries and bays [1,43,44,45]. In contrast, species of Dinophysis and Prorocentrum, which are either planktonic or epibenthic in marine environments, produce toxins such as OA, DTX1, DTX2, and PTX2 [3,44,46], leading to their high concentrations in the marine samples (Figure 6 and Figure 7). As brackish rivers mix freshwater upstream and coastal water downstream, phycotoxins in the studied brackish rivers resemble patterns in the coastal environments, indicating a tight coupling between brackish rivers and coastal waters.
MC are cyanotoxins that can affect the nervous and liver systems and cause health effects ranging from abdominal pain, diarrhea, vomiting, to pneumonia [47]. NJDEP monitoring standards define MC >= 2 μg L−1 as HAB advisory level [24]. This standard value was measured using the ELISA method for total MC that includes all MC congeners and both extracellular and intracellular toxins. Our results distinguished three MC congeners, MC-LR, MC-RR, and MC-YR, which are detected as the main microcystin toxins varying in proportions produced by Microcystis spp. from both culture and field samples globally [1,48]. Each MC congener concentration was well below the total 2 μg L−1 value across all sites, even under HAB events according to the NJDEP monitoring program, such as in the Weequahic Lake and Sunset Lake (Figure 5). This suggests that a diverse group of congeners contributed to the total toxin concentrations in the water and that extracellular toxin concentrations were orders of magnitude lower than total toxin concentrations. On 17 June 2025, NJDEP identified Microcystis and an advisory level of MC toxins in Budd Lake [24]. On 23 July 2025, microcystin concentrations decreased to low values in Budd Lake, consistent with the no-HAB condition monitored by NJDEP on 30 July 2025, suggesting microcystin degradation occurred within one month, which was in agreement with the half-life of 0.2–5 days via biodegradation [49,50]. In addition to dominant MC in freshwater, MC were also present in brackish rivers and bays such as at the Metedeconk River, Toms River, Johns Cove, Old Bridge, and Raritan sites (Figure 5). Most rivers in the estuary tend to favor water quality conditions for HABs to grow [51], indicating tolerance of freshwater HAB species in brackish environments and potential discharge of phycotoxin from rivers to coastal waters. Several common genera, such as Microcystis, Anabaena, Anabaenopsis, and Oscillatoria, that produce MC may even grow rapidly in saline waters [52]. Old Bridge and Raritan sites belong to the Raritan Bay region, and Raritan Bay in NJ is a drowned river estuary receiving freshwater discharge from the Hudson River, Raritan River, Hackensack River, and Passaic River [53]. The bay has a history of ocean pollution, industrial chemicals, and urban contaminants, which provide eutrophication conditions for HABs and phycotoxin production. Similarly, in other studies, MC toxins were found to have been transferred from land to sea otters in the Monterey Bay, California [54]; MC was transported across a 265 km distance in Kansas [55]; Microcystis biomass and produced toxins have been documented as present across 180 km of waterways from freshwater to brackish and marine water continuum [8]. Salinity tolerance of freshwater HAB species reinforces the importance of freshwater management to go beyond lacustrine and riverine systems. Linking river and coastal environments together highlights the need for improved management strategies to address HAB and phycotoxin issues from the watershed level on a larger spatial scale.
OA, DTX1, DTX2, and their derivatives are lipophilic DSP toxins, and PTX2 is historically classified as a DSP toxin although it does not actually cause diarrhea. DSP toxins emerged in the US Gulf Coast in 2008 and then spread to the West and East Coasts [56]. Dinophysis cells exceeded 2 × 10⁶ cells L−1, and DSP toxins in shellfish were found to be above the US Food and Drug Administration (FDA) guidance level of 160 μg kg−1 in 2011–2012 on Long Island, New York [57,58]. However, no direct water quality standard has been established for dissolved DSP toxins in the water. In our study, total OA and DTX1 toxins ranked as the highest concentrations among all and were predominantly present in brackish river and marine waters, as expected, due to their marine HAB producers (Figure 2), consistent with results from another study in the NJ bays [29]. Prorocentrum lima was found as an abundant phytoplankton species in the Barnegat Bay in NJ and was associated with blue crab kills west of Barnegat Inlet in 1987 [26]. Total OA, DTX1, and PTX2 toxins were of extremely high concentrations at the brackish Metedeconk River site (Figure 2 and Figure 3), indicating high presence of Dinophysis or persistent toxins from Dinophysis at the time of sampling. The dominant land-use cover in the Metedeconk River watershed is urban (46%), which may contribute to nutrient pollution in the area that provides conditions for HABs [59]. Although no direct measurement of HAB species in the Metedeconk River was available, Dinophysis acuminata Claparede et Lachmann has been found to be present in the Barnegat Bay, which is connected to the Metedeconk River [23]. YTX toxin is not currently regulated in US seafood; however, it has been revealed to be associated with fish and invertebrate kills in the US [60]. Its presence reaching up to 16–30 ng L−1 (Figure 3) in NJ waters suggests a certain extent of marine and freshwater dinoflagellate species such as Protoceratium reticulatum, Lingulodinium polyedrum, and Gontaulax [44]. Our study expanded the first detection of YTX on the US East Coast in Barnegat Bay and Great Bay [29] to more NJ coastal waters.
DA primarily comes from the marine diatom Pseudo-nitzschia species [61], which can survive high ocean temperatures and low nutrient conditions [62]. ASP events have significantly increased from the US West Coast to emergent outbreaks on the East Coast and Gulf regions [56]. In NJ, Pseudo-nitzschia was identified near Sandy Hook and has been abundant in coastal and nearshore waters in fall and winter, although not sufficient to cause human health issues [26]. As a shallow estuary of the Raritan Bay that connects to the Sandy Hook Bay, Keyport Harbor is heavily polluted with diatoms and dinoflagellates as dominant phytoplankton [63]. Although well below the large toxic event with particulate DA concentrations of 6000 ng L−1 on the US West Coast before [64], the detection of dissolved DA with low but noticeable concentrations in Keyport (Figure 4) draws attention to the necessity for future monitoring of ASP toxins to cope with potential HAB outbreaks in the area. Similarly, NSP toxin PbTx2 stems from marine or brackish flagellate species such as Karenia brevis in the Gulf of Mexico, Chattonella subsalsa identified in the Chesapeake Bay, and Chloromorum toxicum found in Delaware [44,65,66] and were also found to be present at low but noticeable concentrations in certain NJ brackish and marine waters such as Matawan Creek, John Bartlett, Old Bridge, and Sadowski (Figure 3). Among over nine different brevetoxins, PbTx2 was a major one [67]. Surprisingly, DA and PbTx2 were also found in some freshwater environments (Figure 3 and Figure 4), possibly due to marine and freshwater exchange through tidal activities, atmospheric deposition via birds, wildlife food web transfer, or anthropogenic introductions such as ballast water discharge, biofouling on vessels, and improper effluent release from marine aquaculture operations [68]. Moreover, certain Pseudo-nitzschia strains can produce DA in low-salinity environments [69], suggesting toxigenesis for historically marine toxins should not be overlooked in inland systems.
Connections between brackish rivers and coastal bays were revealed from the similar phycotoxin patterns between the Metedeconk River and Mantoloking and between Toms River and Seaside (Figure 7). As two of the biggest rivers discharging into the Barnegat Bay [70], the Metedeconk River is close to the Mantoloking site in the bay while the Toms River is close to the Seaside site (Figure 1). Dominant total OA, total DTX1, and PTX2 in the Metedeconk River and Mantoloking, and dominant total OA, total DTX1, and YTX in the Toms River and Seaside (Figure 6) suggest that brackish rivers were tightly coupled with chemicals in the coastal bay and tidal mixing in the bays and estuaries was strong.

4.2. Early Warning of HABs Through Phycotoxin Monitoring

With recent development of mass spectrometry, LC-MS/MS has become more prevalent in phycotoxin analysis [71,72]. Compared to LC with ultraviolet detection and enzyme-linked immunoassay (ELISA), LC-MS/MS can detect phycotoxins at lower concentrations and differentiate individual phycotoxins in good resolution [73,74]. LC-MS/MS for phycotoxin analysis was first applied to detect OA and DTX [75]. LC-MS/MS allows analysis of both lipophilic (such as MC, OA, DTX, YTX, PTX2, PbTx2) and hydrophilic (such as DA) phycotoxins at sub-picomolar concentrations (Table S2). The high sensitivity allows quantitative measurement of phycotoxins from the water column and serves as a potential tool for early detection or warning of HAB events.
Taking three sites as examples, Greenwood Lake, Budd Lake, and Lake Rogerene contained only 3.3–15 ng L−1 of the three total analyzed dissolved MC toxins at sampling time in late May, late July, and late July, respectively (Figure 5, Table 1). Extracellular (dissolved) toxins are released into the surrounding waters mainly during cell senescence, death, and lysis and typically account for less than 10% of total toxins during healthy culture, while increasing in proportion at the stationary or death phase or under nutrient stress [76,77,78]. Therefore, total MC toxins during the sampling time were at most 33–150 ng L−1, still lower than the 2 μg L−1 threshold. However, after one week to one month, there were documented HAB events in Greenwood Lake from late June to August, in Budd Lake from late June to August, and in Lake Rogerene from the end of July to August [24]. In Greenwood Lake, Aphanizomenon and Phormidium were predominant HAB taxa, while in Budd Lake and Lake Rogerene, Microcystis and Dolichospermum were the dominant taxa. Although much lower than the NJDEP MC toxin standards and the exact threshold needs further investigation, the detectable concentrations of phycotoxins can provide an early warning before actual HABs. This observation is also shown in other lakes and bays, as phycotoxins were present before visible blooms of toxin-forming cyanobacteria developed, and DSP toxins were more sensitive indicators than visual cues, as harmful Dinophysis blooms generally do not reach enough density to lead to water discoloration and may form in the subsurface layers [20,56]. These indicate the necessity for early sampling and monitoring of phycotoxins for ecosystem health and human risks.
Temporal changes of phycotoxins in Lake Hopatcong and Weequahic Lake captured dynamic shifts of toxin concentrations before, during, and after HAB events. On 22 July 2025, blooms of Aphanizomenon occurred in Weequahic Lake [24], corresponding to the highest concentrations of MC toxins in the same month, which increased over 3 times compared to before bloom in June and over 10 times compared to after blooms in August (Figure 5). Similarly, when Aphanizomenon HABs occurred in June at a northern site in Lake Hopatcong [24], which was mostly close to our Lake Hopatcong North station, MC toxin concentrations were higher in June than after blooms in July and August (Figure 5). The relative proportion of MC congeners also differed over the bloom stage. While MC-LR dominated before and after blooms at both sites, MC-RR became the dominant phycotoxin during the peak of HABs, consistent with the pattern observed in other studies with Aphanizomenon blooms [79] and suggesting the active exudation of MC-RR during the Aphanizomenon growth cycle. Therefore, appropriate precautions on the choice of individual phycotoxin as an early warning indicator for HABs should be taken.
Among all analyzed phycotoxins in this study, AZA ranked as the lowest value, which is consistent with previous studies [29]. AZA1 and AZA2 were detected for the first time on the US East Coast in the Chesapeake Bay and Virginia coastal bays, and showed broad spatial distribution in estuaries and coasts, although with uniformly low concentrations [80]. AZA toxins come from previously overlooked dinoflagellates such as Azadinium spinosum and Azadinium poporum [29]. The low values suggest that those HABs and toxins are not threats to NJ aquatic environments yet. However, whether the detected low concentrations of AZA will serve as an early warning for future AZP HABs requires ongoing monitoring.
It should be acknowledged that toxin concentrations may exceed safety thresholds while responsible HAB species remain low in density below bloom conditions in some cases [81]. In such cases, early warning for HABs through toxin monitoring is not straightforward, but toxin monitoring still provides warning for inaccessibility of water use and caution for recreation or economic activities in such water.

4.3. Phycotoxin Correlated to Environmental Parameters and Implications of HABs Monitoring Under Climate Change

Co-occurrence of phycotoxins was common [80]. Tight correlation among total OA, total DTX1, and PTX2 (Figure 8) suggested a common source from HAB species such as Dinophysis, and significant positive correlation between MC congeners indicated their shared source such as Microcystis and Aphanizomenon [44]. Chlorophyll and phycoerythrin concentrations were not significantly correlated with any of the analyzed phycotoxins in this study (Figure 8), which was not uncommon. For instance, in a two-basin lake in New York, chlorophyll and toxin concentrations were correlated with different sets of environmental parameters, indicating different drivers between these two indices and suggesting that management policies of phycotoxins need to go beyond monitoring only algal biomass and bloom density and include other limnological factors [82]. Algae other than HAB species may also contribute to the mismatch between algal biomass and phycotoxin concentration. At the Old Bridge site, phycotoxin concentrations were not among the highest, but chlorophyll concentration ranked as the second highest among all sites (Table 1), possibly due to the fragments produced by green filamentous macroalgae Ulva (“sea lettuce”) present during sampling (Figure S1), which are not harmful algae and do not produce toxins. In addition, phycotoxin production can be species-dependent. The production of DA by Pseudo-nitzschia was affected by external nutrients and was species-specific, which was not reflected in the bulk chlorophyll signal [83].
Multiple phycotoxins were significantly correlated, either in positive or negative relationships, with environmental parameters temperature, DO, and pH (Figure 8). Consistently, temperature was most associated with HAB species throughout the Hudson-Raritan estuary [84]. Although salinity drove the separation of overall patterns of phycotoxins between freshwater and marine/brackish sites in this study (Figure 7), surprisingly salinity did not correlate with most phycotoxins (Figure 8), suggesting individual phycotoxins might be spread across the salinity gradient. Nutrients were not analyzed in this study. Although some studies showed recurring HABs and phycotoxins were correlated with dissolved inorganic nitrogen [85], others found the majority of US HABs cannot be simply tied to anthropogenic nutrient loading and tend to be weakly correlated to ambient nutrient concentrations [25,26,84]. The measured environmental parameters in our study were not exhaustive, and other factors may contribute to HAB development and phycotoxin patterns. Rothenberger et al. [84] revealed that more biotic parameters than abiotic parameters were associated with HAB species. Therefore, more factors such as species life history, zooplankton grazing, interspecies competition, or symbiosis are necessary for a comprehensive understanding of phycotoxin dynamics. In addition, anthropogenic forces such as watershed-level regulation on nutrient discharge and toxin-producing algae also impact the interactions between environmental factors and phycotoxin concentrations in water. For instance, treatment and prevention of HABs will influence toxin production while environmental conditions remain the same [86].
The important environmental parameters in this study, temperature, DO, and pH, were all tightly related to climate change, and their positive or negative correlations with phycotoxins indicate that climate change has varying effects on individual phycotoxins in aquatic environments. As a consequence of climate change, freshwater and marine systems experience increasing water temperature, longer duration of water column thermal stratification, deoxygenation, and lower pH. At the same time, HAB events and phycotoxin expansion occur globally [87,88,89,90]. Models linking warming surface temperature with growth rates of Dinophysis acuminata showed an expanding niche of toxic algal blooms and increasing duration of the blooms across the North Atlantic coast and isolated regions of the North Pacific coast during the ocean warming from 1982 to 2017 [91]. Karenia brevis blooms severity and duration have increased with increasing temperature in the Gulf of Mexico over 50 years since the mid 1990s [92], although other cold-water Karenia species can survive and persist under suitable conditions without expansion to warmer regions [93]. Thus, effects of ocean warming on red tides can be complex, and classifying the cysts for red tide species that produce cysts is important for early warning of red tides, as they are dependent on seed sources [94]. Anomalous ocean warming during El Niño on the North Pacific coast was linked to a Pseudo-nitzschia bloom and elevated DA concentrations in 2015 [95]. Heatwaves increased the stress resistance of lake HAB species through stimulating oxidative stress that induces intracellular polyphosphate storage [96]. Toxic microalgae Vicicitus globosus have a selective advantage under ocean acidification, promoting their proliferation under climate change [97]. Overall, these indicate that monitoring environmental parameters such as temperature, DO, and pH under climate change is vital for future prediction of HABs and their phycotoxin production.
In addition to temperature, DO, and pH, climate change also leads to heavy rainfall and floods, which often play a role in transporting HAB species and phycotoxins across freshwater-marine boundaries [52]. Climate change-related alteration of currents and storms also disrupts the natural dispersal of HAB species [56]. Climate change can make aquatic environments more vulnerable to invasive species, which can be another source of HAB introduction outside their historical geographic locations [11]. Undoubtedly, under climate change, there will be both winners and losers, but certainly local changes in algae species composition, abundance, and timing of blooms will affect the frequency, magnitude, and geographic extent of HABs and their phycotoxins over the preceding years.

5. Conclusions

Through analyzing different dissolved phycotoxin concentrations across a selection of NJ freshwater, brackish river, and marine sites, spatial patterns revealed distinctions between freshwater and brackish/marine waters, implying that different HAB species dominate each ecosystem. Total OA and total DTX-1 were mostly present in brackish/marine sites, whereas the highest concentrations of MC-LR, MC-RR, and MC-YR were mostly found in freshwater locations. This suggests that monitoring of phycotoxins in freshwater can be focused on microcystins and their producers, cyanobacteria, while management of phycotoxins in brackish and marine water should shift to OA, DTX, and PTX2 toxins and their producers such as Dinophysis and Prorocentrum. The tight connection of phycotoxins between brackish rivers and coastal waters suggests HAB management strategies should incorporate upstream locations and expand to watershed scales. Using a highly sensitive LC-MS/MS technique, sub-picomolar concentrations of dissolved phycotoxins detected in the water provide potential early warning of HAB occurrence, which can support advanced HAB monitoring efforts and future management. Under climate change with increasing temperature, decreasing DO, and reducing pH in the water, algae species composition will shift, and phycotoxins produced by HAB species will change dynamically.

Supplementary Materials

The following supporting information can be downloaded at: https://www.mdpi.com/article/10.3390/w18162017/s1, Figure S1: Macroalgae Ulva at the Old Bridge Waterfront Park during sampling; Table S1: SPE extraction efficiency of analyzed phycotoxins; Table S2: LOD and LOQ of analyzed phycotoxins.

Author Contributions

Conceptualization, S.L.; Methodology, S.L., S.U., D.J.M., and M.S.; Software, S.L., S.U., and M.S.; Validation, S.L. and M.S.; Formal Analysis, S.L., E.M., J.D., M.G., L.R., D.S., and J.J.; Investigation, S.L., E.M., J.D., M.G., L.R., D.S., J.J., and K.M.; Resources, S.L.; Data Curation, S.L. and K.M.; Writing—Original Draft Preparation, S.L., E.M., J.D., and M.G.; Writing—Review and Editing, S.L.; Visualization, S.L.; Supervision, S.L.; Project Administration, S.L.; Funding Acquisition, S.L. All authors have read and agreed to the published version of the manuscript.

Funding

This project was funded by the National Science Foundation (NSF) Major Research Instrumentation (MRI) program (award 2409248), NSF Improving Undergraduate STEM Education (IUSE) program (award 2247157), the GSSRP program, which is a partner of the STEM PUSH Network as an NSF-funded alliance (award 1930990), and United States Geological Survey (award G21AP10595-05 Project ID 841193 Sub#4038).

Data Availability Statement

The raw data supporting the conclusions of this article will be made available by the authors on request.

Acknowledgments

We thank C. Li, K. Bhargava, A. Handsman, C. Nemeth, S. Paez, and B. Sang, who were enrolled in the Group Summer Scholars Research Program (GSSRP) in the summer of 2025 and participated in water sampling and lab work. We appreciate the help from G. Velaj, B. Hannah, and E. Guaman for sample processing and analysis in the lab. We thank R. DePinto, P. Gallea, S. Wu, and D. Than from Waters Corporation for their support with the LC-MS instrument. We thank Henning College and the Department of Environmental & Sustainability Sciences at Kean for all the in-kind support. We thank Lake Rogerene Association for their support with field sampling. We are grateful for the public data from monitoring stations provided by the New Jersey Department of Environmental Protection (NJDEP) and Barnegat Bay Partnership (BBP).

Conflicts of Interest

The authors declare no conflicts of interest. Any opinions, findings, and conclusions or recommendations expressed in this material are those of the authors and do not necessarily reflect the views of the National Science Foundation.

References

  1. Chorus, I.; Welker, M. Toxic Cyanobacteria in Water: A Guide to Their Public Health Consequences, Monitoring and Management; CRC Press: Boca Raton, FL, USA, 2021. [Google Scholar]
  2. Anderson, D.M.; Wells, M.L.; Trainer, V.L.; Suddleson, M.; Claridge, K.; Coyne, K.J.; Dortch, Q.; Gobler, C.J.; Heil, C.A.; Inaba, N.; et al. Controlling harmful algal blooms (HABs) in marine waters: Review of current status and future prospects. Harmful Algae 2025, 150, 102989. [Google Scholar] [CrossRef] [Scilit]
  3. Visciano, P.; Schirone, M.; Berti, M.; Milandri, A.; Tofalo, R.; Suzzi, G. Marine Biotoxins: Occurrence, Toxicity, Regulatory Limits and Reference Methods. Front. Microbiol. 2016, 7, 1051. [Google Scholar] [CrossRef] [Scilit] [PubMed]
  4. Landsberg, J.H. The Effects of Harmful Algal Blooms on Aquatic Organisms. Rev. Fish. Sci. 2002, 10, 113–390. [Google Scholar] [CrossRef] [Scilit]
  5. Landsberg, J.; Van Dolah, F.; Doucette, G. Marine and Estuarine Harmful Algal Blooms: Impacts on Human and Animal Health. In Oceans and Health: Pathogens in the Marine Environment; Belkin, S., Colwell, R.R., Eds.; Springer: Boston, MA, USA, 2005; pp. 165–215. [Google Scholar]
  6. Kudela, R.M.; Berdalet, E.; Bernard, S.; Burford, M.; Fernand, L.; Lu, S.; Roy, S.; Tester, P.; Usup, G.; Magnien, R.; et al. Harmful Algal Blooms: A Scientific Summary for Policy Makers; IOC/INF-1320; UNESCO/IOC: Paris, France, 2015. [Google Scholar]
  7. Hoagland, P.; Scatasta, S. The Economic Effects of Harmful Algal Blooms. In Ecology of Harmful Algae; Granéli, E., Turner, J.T., Eds.; Springer: Berlin/Heidelberg, Germany, 2006; pp. 391–402. [Google Scholar]
  8. Kudela, R.M.; Howard, M.D.A.; Monismith, S.; Paerl, H.W. Status, Trends, and Drivers of Harmful Algal Blooms Along the Freshwater-to-Marine Gradient in the San Francisco Bay–Delta System. San Fr. Estuary Watershed Sci. 2023, 20, 6. [Google Scholar] [CrossRef] [Scilit]
  9. Hamilton, D.P.; Salmaso, N.; Paerl, H.W. Mitigating harmful cyanobacterial blooms: Strategies for control of nitrogen and phosphorus loads. Aquat. Ecol. 2016, 50, 351–366. [Google Scholar] [CrossRef] [Scilit]
  10. Elser, J.J. The pathway to noxious cyanobacteria blooms in lakes: The food web as the final turn. Freshw. Biol. 1999, 42, 537–543. [Google Scholar] [CrossRef] [Scilit]
  11. Marampouti, C.; Buma, A.G.J.; de Boer, M.K. Mediterranean alien harmful algal blooms: Origins and impacts. Environ. Sci. Pollut. Res. 2021, 28, 3837–3851. [Google Scholar] [CrossRef] [Scilit] [PubMed]
  12. Kim, J.; Jones, J.R.; Seo, D. Factors affecting harmful algal bloom occurrence in a river with regulated hydrology. J. Hydrol. Reg. Stud. 2021, 33, 100769. [Google Scholar] [CrossRef] [Scilit]
  13. Paerl, H.W. Human and Climatic Drivers of Harmful Cyanobacterial Blooms (CyanoHABs). In Assessing the Microbiological Health of Ecosystems; John Wiley & Sons, Inc.: Hoboken, NJ, USA, 2022; pp. 31–48. [Google Scholar]
  14. Anderson, D.M.; Cembella, A.D.; Hallegraeff, G.M. Progress in Understanding Harmful Algal Blooms: Paradigm Shifts and New Technologies for Research, Monitoring, and Management. Annu. Rev. Mar. Sci. 2012, 4, 143–176. [Google Scholar] [CrossRef] [Scilit] [PubMed]
  15. Backer, L.C.; McGillicuddy, D.J., Jr. Harmful algal blooms: At the interface between coastal oceanography and human health. Oceanography 2006, 19, 94. [Google Scholar] [CrossRef] [Scilit] [PubMed]
  16. Van Dolah, E.R.; Paolisso, M.; Sellner, K.; Place, A. Employing a socio-ecological systems approach to engage harmful algal bloom stakeholders. Aquat. Ecol. 2016, 50, 577–594. [Google Scholar] [CrossRef] [Scilit] [PubMed]
  17. Pulido, O.M. Phycotoxins by harmful algal blooms (HABS) and human poisoning: An overview. Int. Clin. Pathol. J. 2016, 2, 145–152. [Google Scholar] [CrossRef] [Scilit]
  18. Gupta, N.; Pant, S.C.; Vijayaraghavan, R.; Rao, P.V.L. Comparative toxicity evaluation of cyanobacterial cyclic peptide toxin microcystin variants (LR, RR, YR) in mice. Toxicology 2003, 188, 285–296. [Google Scholar] [CrossRef] [Scilit] [PubMed]
  19. Puerto, M.; Pichardo, S.; Jos, Á.; Cameán, A.M. Comparison of the toxicity induced by microcystin-RR and microcystin-YR in differentiated and undifferentiated Caco-2 cells. Toxicon 2009, 54, 161–169. [Google Scholar] [CrossRef] [Scilit] [PubMed]
  20. Christensen, V.G.; Maki, R.P.; Stelzer, E.A.; Norland, J.E.; Khan, E. Phytoplankton community and algal toxicity at a recurring bloom in Sullivan Bay, Kabetogama Lake, Minnesota, USA. Sci. Rep. 2019, 9, 16129. [Google Scholar] [CrossRef] [Scilit] [PubMed]
  21. NJDEP. Cyanobacterial Harmful Algal Bloom (HAB) Freshwater Recreational Response 2020 Summary Report. 2020. Available online: https://www.state.nj.us/dep/hab/download/2020-Annual-HAB-Report-Final_3-17-21.pdf (accessed on 29 October 2025).
  22. NJDEP. Cyanobacterial Harmful Algal Bloom (HAB) Freshwater 2021 Summary Report; New Jersey Department of Environmental Protection: Trenton, NJ, USA, 2022.
  23. Ren, L. Baseline Characterization of Phytoplanton and Harmful Algal Blooms in Barnegat Bay-Little Egg Harbor, New Jersey; New Jersey Department of Environmental Protection, Division of Science, Research and Environmental Health: Trenton, NJ, USA, 2013; pp. 1–72.
  24. NJDEP. 2025. Available online: https://www.arcgis.com/apps/dashboards/49190166531d4e5a811c9a91e4a41677 (accessed on 29 October 2025).
  25. Davidson, K.; Gowen, R.J.; Harrison, P.J.; Fleming, L.E.; Hoagland, P.; Moschonas, G. Anthropogenic nutrients and harmful algae in coastal waters. J. Environ. Manag. 2014, 146, 206–216. [Google Scholar] [CrossRef] [Scilit] [PubMed]
  26. Gastrich, M.D. Harmful Algal Blooms in Coastal Waters of New Jersey; New Jersey Department of Environmental Protection: Trenton, NJ, USA, 2000.
  27. Mahoney, J.B.; McLaughlin, J.J.A. The association of phytoflagellate blooms in lower New York bay with hypertrophication. J. Exp. Mar. Biol. Ecol. 1977, 28, 53–65. [Google Scholar] [CrossRef] [Scilit]
  28. Armstrong, C.T. Impact of Plant-Derived Allelochemicals on Harmful Algal Blooms; University of Maryland: College Park, MD, USA, 2023. [Google Scholar]
  29. Armstrong, C.T.; Sakowicz, G.P.; Smith, J.L.; Sanderson, M.P.; Reece, K.S.; Place, A.R. Phycotoxins Along Two New Jersey Estuaries—Limitations of Passive Samplers in a Complex System. Estuaries Coasts 2025, 48, 106. [Google Scholar] [CrossRef] [Scilit]
  30. NJDEP. Barnegat Bay Partnership. 2025. Available online: https://njdep.rutgers.edu/continuous/ (accessed on 29 October 2025).
  31. Suzuki, T.; Mitsuya, T.; Matsubara, H.; Yamasaki, M. Determination of pectenotoxin-2 after solid-phase extraction from seawater and from the dinoflagellate Dinophysis fortii by liquid chromatography with electrospray mass spectrometry and ultraviolet detection. Evidence of oxidation of pectenotoxin-2 to pectenotoxin-6 in scallops. J. Chromatogr. A 1998, 815, 155–160. [Google Scholar] [CrossRef] [Scilit] [PubMed]
  32. Klijnstra, M.D.; Faassen, E.J.; Gerssen, A. A Generic LC-HRMS Screening Method for Marine and Freshwater Phycotoxins in Fish, Shellfish, Water, and Supplements. Toxins 2021, 13, 823. [Google Scholar] [CrossRef] [Scilit] [PubMed]
  33. Lefler, F.W.; Barbosa, M.; Zimba, P.V.; Smyth, A.R.; Berthold, D.E.; Laughinghouse, H.D. Spatiotemporal diversity and community structure of cyanobacteria and associated bacteria in the large shallow subtropical Lake Okeechobee (Florida, United States). Front. Microbiol. 2023, 14, 1219261. [Google Scholar] [CrossRef] [Scilit] [PubMed]
  34. Villar-González, A.; Rodríguez-Velasco, M.L.; Ben-Gigirey, B.; Yasumoto, T.; Botana, L.M. Assessment of the hydrolysis process for the determination of okadaic acid-group toxin ester: Presence of okadaic acid 7-O-acyl-ester derivates in Spanish shellfish. Toxicon 2008, 51, 765–773. [Google Scholar] [CrossRef] [Scilit] [PubMed]
  35. Onofrio, M.D.; Mallet, C.R.; Place, A.R.; Smith, J.L. A Screening Tool for the Direct Analysis of Marine and Freshwater Phycotoxins in Organic SPATT Extracts from the Chesapeake Bay. Toxins 2020, 12, 322. [Google Scholar] [CrossRef] [Scilit] [PubMed]
  36. South, A.; Michael, S.; Massicotte, P. rnaturalearthhires: High Resolution World Vector Map Data from Natural Earth Used in rnaturalearth. R Package Version 1.0.0.9000. 2025. Available online: https://github.com/ropensci/rnaturalearthhires (accessed on 29 October 2025).
  37. Wickham, H. ggplot2: Elegant Graphics for Data Analysis; Springer: New York, NY, USA, 2016. [Google Scholar]
  38. de Vries, A.; Ripley, B.D. ggdendro: Create Dendrograms and Tree Diagrams Using ‘ggplot2’. R Package Version 0.2.0. 2025. Available online: https://andrie.github.io/ggdendro/ (accessed on 29 October 2025).
  39. Oksanen, J.; Kindt, R.; Legendre, P.; O’Hara, B.; Stevens, M.H.H.; Oksanen, M.; Suggests, M. The Vegan Package. Community Ecology Package; R Foundation for Statistical Computing: Vienna, Austria, 2007; Volume 10, pp. 631–637. [Google Scholar]
  40. Harrell, F., Jr.; Dupont, C. Hmisc: Harrell Miscellaneous; R Foundation for Statistical Computing: Vienna, Austria, 2019. [Google Scholar]
  41. Fox, J.; Weisberg, S. An R Companion to Applied Regression; Sage: Thousand Oaks, CA, USA, 2019. [Google Scholar]
  42. Shartau, R.B.; Turcotte, L.D.M.; Bradshaw, J.C.; Ross, A.R.S.; Surridge, B.D.; Nemcek, N.; Johnson, S.C. Dissolved Algal Toxins along the Southern Coast of British Columbia Canada. Toxins 2023, 15, 395. [Google Scholar] [CrossRef] [Scilit] [PubMed]
  43. Chaffin, J.D.; Westrick, J.A.; Furr, E.; Birbeck, J.A.; Reitz, L.A.; Stanislawczyk, K.; Li, W.; Weber, P.K.; Bridgeman, T.B.; Davis, T.W.; et al. Quantification of microcystin production and biodegradation rates in the western basin of Lake Erie. Limnol. Oceanogr. 2022, 67, 1470–1483. [Google Scholar] [CrossRef] [Scilit] [PubMed]
  44. Sanderson, M.P.; Hudson, K.L.; Gregg, L.S.; Chesler-Poole, A.B.; Small, J.M.; Reece, K.S.; Carnegie, R.B.; Smith, J.L. Detection of toxins and harmful algal bloom cells in shellfish hatcheries and efforts toward removal. Aquaculture 2023, 562, 738714. [Google Scholar] [CrossRef] [Scilit]
  45. Marshall, H.G.; Lane, M.F.; Nesius, K.K.; Burchardt, L. Assessment and significance of phytoplankton species composition within Chesapeake Bay and Virginia tributaries through a long-term monitoring program. Environ. Monit. Assess. 2009, 150, 143–155. [Google Scholar] [CrossRef] [Scilit] [PubMed]
  46. García, C.; Contreras, H.R.; Oyaneder-Terrazas, J. Instrumental Methods for Detection of Lipophilic Marine Toxins in Endemic Species from Pacific Austral Fjords. In Endemic Species; Cano Carmona, E., Musarella, C.M., Cano Ortiz, A., Eds.; IntechOpen: London, UK, 2018. [Google Scholar]
  47. USEPA. Learn About Cyanobacteria and Cyanotoxins. 2021. Available online: https://www.epa.gov/HABs/learn-about-cyanobacteria-and-cyanotoxins (accessed on 29 October 2025).
  48. Kemp, A.; John, J. Microcystins associated with Microcystis dominated blooms in the Southwest wetlands, Western Australia. Environ. Toxicol. 2006, 21, 125–130. [Google Scholar] [CrossRef] [Scilit] [PubMed]
  49. Lam, A.K.Y.; Fedorak, P.M.; Prepas, E.E. Biotransformation of the Cyanobacterial Hepatotoxin Microcystin-LR, as Determined by HPLC and Protein Phosphatase Bioassay. Environ. Sci. Technol. 1995, 29, 242–246. [Google Scholar] [CrossRef] [Scilit] [PubMed]
  50. Park, H.-D.; Sasaki, Y.; Maruyama, T.; Yanagisawa, E.; Hiraishi, A.; Kato, K. Degradation of the cyanobacterial hepatotoxin microcystin by a new bacterium isolated from a hypertrophic lake. Environ. Toxicol. 2001, 16, 337–343. [Google Scholar] [CrossRef] [Scilit] [PubMed]
  51. Acosta Caraballo, Y. Assessment of Phytoplankton Assemblages and Harmful Algal Blooms in New Jersey; Montclair State University: Montclair, NJ, USA, 2023. [Google Scholar]
  52. Preece, E.P.; Hardy, F.J.; Moore, B.C.; Bryan, M. A review of microcystin detections in Estuarine and Marine waters: Environmental implications and human health risk. Harmful Algae 2017, 61, 31–45. [Google Scholar] [CrossRef] [Scilit]
  53. Jeffries, H.P. Environmental characteristics of Raritan Bay, a polluted estuary. Limnol. Oceanogr. 1962, 7, 21–31. [Google Scholar] [CrossRef] [Scilit]
  54. Miller, M.A.; Kudela, R.M.; Mekebri, A.; Crane, D.; Oates, S.C.; Tinker, M.T.; Staedler, M.; Miller, W.A.; Toy-Choutka, S.; Dominik, C.; et al. Evidence for a Novel Marine Harmful Algal Bloom: Cyanotoxin (Microcystin) Transfer from Land to Sea Otters. PLoS ONE 2010, 5, e12576. [Google Scholar] [CrossRef] [Scilit] [PubMed]
  55. Graham, J.; Ziegler, A.C.; Loving, B.; Loftin, K. Fate and Transport of Cyanobacteria and Associated Toxins and Taste-and-Odor Compounds from Upstream Reservoir Releases in the Kansas River, Kansas, September and October 2011; Scientific Investigations Report; U.S. Geological Survey: Reston, VA, USA, 2012.
  56. Anderson, D.M.; Fensin, E.; Gobler, C.J.; Hoeglund, A.E.; Hubbard, K.A.; Kulis, D.M.; Landsberg, J.H.; Lefebvre, K.A.; Provoost, P.; Richlen, M.L.; et al. Marine harmful algal blooms (HABs) in the United States: History, current status and future trends. Harmful Algae 2021, 102, 101975. [Google Scholar] [CrossRef] [Scilit] [PubMed]
  57. Hattenrath-Lehmann, T.K.; Marcoval, M.A.; Berry, D.L.; Fire, S.; Wang, Z.; Morton, S.L.; Gobler, C.J. The emergence of Dinophysis acuminata blooms and DSP toxins in shellfish in New York waters. Harmful Algae 2013, 26, 33–44. [Google Scholar] [CrossRef] [Scilit]
  58. Regueiro, J.; Rossignoli, A.E.; Álvarez, G.; Blanco, J. Automated on-line solid-phase extraction coupled to liquid chromatography–tandem mass spectrometry for determination of lipophilic marine toxins in shellfish. Food Chem. 2011, 129, 533–540. [Google Scholar] [CrossRef] [Scilit] [PubMed]
  59. NJDEP. Metedeconk River Watershed Protection Plan: Watershed Management Area 13; New Jersey Department of Environmental Protection: Trenton, NJ, USA, 2021.
  60. Torrey, H.B. An unusual occurrence of dinoflagellata on the California coast. Am. Nat. 1902, 36, 187–192. [Google Scholar] [CrossRef] [Scilit] [PubMed]
  61. Perl, T.M.; Bédard, L.; Kosatsky, T.; Hockin, J.C.; Todd, E.C.; Remis, R.S. An outbreak of toxic encephalopathy caused by eating mussels contaminated with domoic acid. N. Engl. J. Med. 1990, 322, 1775–1780. [Google Scholar] [CrossRef] [Scilit] [PubMed]
  62. Kelly, K.J.; Mansour, A.; Liang, C.; Kim, A.M.; Mancini, L.A.; Bertin, M.J.; Jenkins, B.D.; Hutchins, D.A.; Fu, F.X. Simulated upwelling and marine heatwave events promote similar growth rates but differential domoic acid toxicity in Pseudo-nitzschia australis. Harmful Algae 2023, 127, 102467. [Google Scholar] [CrossRef] [Scilit] [PubMed]
  63. McCarthy, A.J. An Ecological Study of the Phytoplankton of Raritan Bay; ETD Collection for Fordham University: New York, NY, USA, 1965. [Google Scholar]
  64. Anderson, C.R.; Siegel, D.A.; Kudela, R.M.; Brzezinski, M.A. Empirical models of toxigenic Pseudo-nitzschia blooms: Potential use as a remote detection tool in the Santa Barbara Channel. Harmful Algae 2009, 8, 478–492. [Google Scholar] [CrossRef] [Scilit]
  65. Giner, J.-L.; Zhao, H.; Tomas, C. Sterols and fatty acids of three harmful algae previously assigned as Chattonella. Phytochemistry 2008, 69, 2167–2171. [Google Scholar] [CrossRef] [Scilit] [PubMed]
  66. Magaña, H.A.; Contreras, C.; Villareal, T.A. A historical assessment of Karenia brevis in the western Gulf of Mexico. Harmful Algae 2003, 2, 163–171. [Google Scholar] [CrossRef] [Scilit]
  67. Kirkpatrick, B.; Fleming, L.E.; Squicciarini, D.; Backer, L.C.; Clark, R.; Abraham, W.; Benson, J.; Cheng, Y.S.; Johnson, D.; Pierce, R.; et al. Literature Review of Florida Red Tide: Implications for Human Health Effects. Harmful Algae 2004, 3, 99–115. [Google Scholar] [CrossRef] [Scilit] [PubMed]
  68. Hallegraeff, G.M. Harmful algal blooms: A global overview. In Manual on Harmful Marine Microalgae; UNESCO Publishing: Paris, France, 2003; Volume 33, pp. 1–22. [Google Scholar]
  69. Van Meerssche, E.; Greenfield, D.I.; Pinckney, J.L. Coastal eutrophication and freshening: Impacts on Pseudo-nitzschia abundance and domoic acid allelopathy. Estuar. Coast. Shelf Sci. 2018, 209, 70–79. [Google Scholar] [CrossRef] [Scilit]
  70. Buchanan, G.A.; Belton, T.J.; Paudel, B. The Comprehensive Barnegat Bay Research Program. J. Coast. Res. 2017, 78, 1–6. [Google Scholar] [CrossRef] [Scilit]
  71. Greer, B.; McNamee, S.E.; Boots, B.; Cimarelli, L.; Guillebault, D.; Helmi, K.; Marcheggiani, S.; Panaiotov, S.; Breitenbach, U.; Akçaalan, R.; et al. A validated UPLC–MS/MS method for the surveillance of ten aquatic biotoxins in European brackish and freshwater systems. Harmful Algae 2016, 55, 31–40. [Google Scholar] [CrossRef] [Scilit] [PubMed]
  72. Pekar, H.; Westerberg, E.; Bruno, O.; Lääne, A.; Persson, K.M.; Sundström, L.F.; Thim, A.-M. Fast, rugged and sensitive ultra high pressure liquid chromatography tandem mass spectrometry method for analysis of cyanotoxins in raw water and drinking water—First findings of anatoxins, cylindrospermopsins and microcystin variants in Swedish source waters and infiltration ponds. J. Chromatogr. A 2016, 1429, 265–276. [Google Scholar] [CrossRef] [Scilit] [PubMed]
  73. Birbeck, J.A.; Westrick, J.A.; O’Neill, G.M.; Spies, B.; Szlag, D.C. Comparative Analysis of Microcystin Prevalence in Michigan Lakes by Online Concentration LC/MS/MS and ELISA. Toxins 2019, 11, 13. [Google Scholar] [CrossRef] [Scilit] [PubMed]
  74. Lawton, L.A.; Edwards, C.; Codd, G.A. Extraction and high-performance liquid chromatographic method for the determination of microcystins in raw and treated waters. Analyst 1994, 119, 1525–1530. [Google Scholar] [CrossRef] [Scilit] [PubMed]
  75. Quilliam, M.A. The role of chromatography in the hunt for red tide toxins. J. Chromatogr. A 2003, 1000, 527–548. [Google Scholar] [CrossRef] [Scilit] [PubMed]
  76. Rapala, J.; Sivonen, K.; Lyra, C.; Niemelä, S.I. Variation of microcystins, cyanobacterial hepatotoxins, in Anabaena spp. as a function of growth stimuli. Appl. Environ. Microbiol. 1997, 63, 2206–2212. [Google Scholar] [CrossRef] [Scilit] [PubMed]
  77. Wiedner, C.; Visser, P.M.; Fastner, J.; Metcalf, J.S.; Codd, G.A.; Mur, L.R. Effects of light on the microcystin content of Microcystis strain PCC 7806. Appl. Environ. Microbiol. 2003, 69, 1475–1481. [Google Scholar] [CrossRef] [Scilit] [PubMed]
  78. Merel, S.; Walker, D.; Chicana, R.; Snyder, S.; Baurès, E.; Thomas, O. State of knowledge and concerns on cyanobacterial blooms and cyanotoxins. Environ. Int. 2013, 59, 303–327. [Google Scholar] [CrossRef] [Scilit] [PubMed]
  79. Jurczak, T.; Tarczyñska, M.; Karlsson, K.; Meriluoto, J. Characterization and Diversity of Cyano- bacterial Hepatotoxins (Microcystins) in Blooms from Polish Freshwaters Identified by Liquid Chromatography-Electrospray Ionisation Mass Spectrometry. Chromatographia 2004, 59, 571–578. [Google Scholar] [CrossRef] [Scilit]
  80. Onofrio, M.D.; Egerton, T.A.; Reece, K.S.; Pease, S.K.D.; Sanderson, M.P.; Iii, W.J.; Yeargan, E.; Roach, A.; DeMent, C.; Wood, A.; et al. Spatiotemporal distribution of phycotoxins and their co-occurrence within nearshore waters. Harmful Algae 2021, 103, 101993. [Google Scholar] [CrossRef] [Scilit] [PubMed]
  81. Busch, J.A.; Andree, K.B.; Diogène, J.; Fernández-Tejedor, M.; Toebe, K.; John, U.; Krock, B.; Tillmann, U.; Cembella, A.D. Toxigenic algae and associated phycotoxins in two coastal embayments in the Ebro Delta (NW Mediterranean). Harmful Algae 2016, 55, 191–201. [Google Scholar] [CrossRef] [Scilit] [PubMed]
  82. Smith, Z.J.; Conroe, D.E.; Schulz, K.L.; Boyer, G.L. Limnological Differences in a Two-Basin Lake Help to Explain the Occurrence of Anatoxin-a, Paralytic Shellfish Poisoning Toxins, and Microcystins. Toxins 2020, 12, 559. [Google Scholar] [CrossRef] [Scilit] [PubMed]
  83. Bates, S.S.; Hubbard, K.A.; Lundholm, N.; Montresor, M.; Leaw, C.P. Pseudo-nitzschia, Nitzschia, and domoic acid: New research since 2011. Harmful Algae 2018, 79, 3–43. [Google Scholar] [CrossRef] [Scilit] [PubMed]
  84. Rothenberger, M.; Gleich, S.J.; Flint, E. The underappreciated role of biotic factors in controlling the bloom ecology of potentially harmful microalgae in the Hudson-Raritan Bay. Harmful Algae 2023, 124, 102411. [Google Scholar] [CrossRef] [Scilit] [PubMed]
  85. Sterling, A.R.; Kirk, R.D.; Bertin, M.J.; Rynearson, T.A.; Borkman, D.G.; Caponi, M.C.; Carney, J.; Hubbard, K.A.; King, M.A.; Maranda, L.; et al. Emerging harmful algal blooms caused by distinct seasonal assemblages of a toxic diatom. Limnol. Oceanogr. 2022, 67, 2341–2359. [Google Scholar] [CrossRef] [Scilit] [PubMed]
  86. Zamyadi, A.; Greenstein, K.E.; Glover, C.M.; Adams, C.; Rosenfeldt, E.; Wert, E.C. Impact of Hydrogen Peroxide and Copper Sulfate on the Delayed Release of Microcystin. Water 2020, 12, 1105. [Google Scholar] [CrossRef] [Scilit]
  87. Griffith, A.W.; Gobler, C.J. Harmful algal blooms: A climate change co-stressor in marine and freshwater ecosystems. Harmful Algae 2020, 91, 101590. [Google Scholar] [CrossRef] [Scilit] [PubMed]
  88. Beardall, J.; Raven, J.A. The potential effects of global climate change on microalgal photosynthesis, growth and ecology. Phycologia 2004, 43, 26–40. [Google Scholar] [CrossRef] [Scilit]
  89. Paerl, H.W.; Otten, T.G. Harmful Cyanobacterial Blooms: Causes, Consequences, and Controls. Microb. Ecol. 2013, 65, 995–1010. [Google Scholar] [CrossRef] [Scilit] [PubMed]
  90. Van Dolah, F.M. Marine algal toxins: Origins, health effects, and their increased occurrence. Environ. Health Perspect. 2000, 108, 133–141. [Google Scholar] [CrossRef] [Scilit] [PubMed]
  91. Gobler, C.J.; Doherty, O.M.; Hattenrath-Lehmann, T.K.; Griffith, A.W.; Kang, Y.; Litaker, R.W. Ocean warming since 1982 has expanded the niche of toxic algal blooms in the North Atlantic and North Pacific oceans. Proc. Natl. Acad. Sci. USA 2017, 114, 4975–4980. [Google Scholar] [CrossRef] [Scilit] [PubMed]
  92. Glibert, P.M.; Heil, C.A.; Li, M. Climate shifts and anthropogenic footprints driving increased severity and duration of toxic Karenia brevis blooms in the Gulf of Mexico over the past ~50 years. Front. Mar. Sci. 2026, 13, 2026. [Google Scholar] [CrossRef] [Scilit]
  93. Orlova, T.Y.; Aleksanin, A.I.; Lepskaya, E.V.; Efimova, K.V.; Selina, M.S.; Morozova, T.V.; Stonik, I.V.; Kachur, V.A.; Karpenko, A.A.; Vinnikov, K.A.; et al. A massive bloom of Karenia species (Dinophyceae) off the Kamchatka coast, Russia, in the fall of 2020. Harmful Algae 2022, 120, 102337. [Google Scholar] [CrossRef] [Scilit] [PubMed]
  94. Liu, Y.; Deng, Y.; Shang, L.; Yi, L.; Hu, Z.; Tang, Y.Z. Geographic distribution and historical presence of the resting cysts of Karenia mikimotoi in the seas of China. Harmful Algae 2021, 109, 102121. [Google Scholar] [CrossRef] [Scilit] [PubMed]
  95. McCabe, R.M.; Hickey, B.M.; Kudela, R.M.; Lefebvre, K.A.; Adams, N.G.; Bill, B.D.; Gulland, F.M.D.; Thomson, R.E.; Cochlan, W.P.; Trainer, V.L. An unprecedented coastwide toxic algal bloom linked to anomalous ocean conditions. Geophys. Res. Lett. 2016, 43, 10,366–10,376. [Google Scholar] [CrossRef] [Scilit] [PubMed]
  96. Wang, C.; Wang, M.; Xie, M.; Qi, L.; Chen, M.; Song, X.; Zhou, Z.; Shi, X.; Yin, J.; Wei, Y.A.; et al. Climate extremes intensify global lake eutrophication by increasing the stress resistance of harmful bloom-forming algae. Nat. Commun. 2026, 17, 2859. [Google Scholar] [CrossRef] [Scilit] [PubMed]
  97. Riebesell, U.; Aberle-Malzahn, N.; Achterberg, E.P.; Algueró-Muñiz, M.; Alvarez-Fernandez, S.; Arístegui, J.; Bach, L.T.; Boersma, M.; Boxhammer, T.; Guan, W.; et al. Toxic algal bloom induced by ocean acidification disrupts the pelagic food web. Nat. Clim. Change 2018, 8, 1082–1086. [Google Scholar] [CrossRef] [Scilit]
Figure 1. Map of all sampling locations and concentrations of total phycotoxins. Colors of points correspond to total phycotoxin concentrations. The color scale was on a log scale to avoid bias from high phycotoxin concentrations at one site. Note that the average of three-month data was used for phycotoxin concentrations at the Lake Hopatcong and Weequahic sites.
Water 18 02017 g001
Figure 2. Bar plot of total OA, total DTX1, and total DTX2 concentrations at all sampling sites.
Water 18 02017 g002
Figure 3. Bar plot of YTX, PTX2, and PbTx2 concentrations at all sampling sites.
Water 18 02017 g003
Figure 4. Bar plot of DA, AZA1, and AZA2 concentrations at all sampling sites.
Water 18 02017 g004
Figure 5. Bar plot of MC-LR, MC-RR, and MC-YR concentrations at all sampling sites.
Water 18 02017 g005
Figure 6. Heatmap of individual phycotoxin concentrations across all samples. The color scale was on a log scale to avoid bias from high phycotoxin concentrations at one site. Hierarchical clustering among phycotoxins and samples was shown on the top and left dendrograms beside the heatmap.
Water 18 02017 g006
Figure 7. NMDS plot of phycotoxin concentrations among all samples. Sample points with different colors were categorized into three groups: freshwater, brackish river, and marine. Red crosses and labels indicated phycotoxin loadings, and blue labels indicated sampling sites.
Water 18 02017 g007
Figure 8. Heatmap of correlation between all environmental parameters and phycotoxins. The Pearson correlation coefficient was shown in colors, and significance levels were shown with asterisks (* p < 0.05, ** p < 0.01, *** p < 0.001, **** p < 0.0001).
Water 18 02017 g008
Table 1. Physicochemical data at all sampling sites.
Site NameStation Full NameCategorySampling DateTemperature (°C)Pressure (psi)DO (ppm)Specific Conductivity (µS cm−1)Salinity (ppt)pHChl
(µg L−1)
Phycoerythrin (µg L−1)
Sunset_lakeSunset lakeFreshwater19 May 202519.914.61511.97175.20.088.79246.78200.41
Abury_
beach
Asbury beachMarine19 May 202515.614.6189.2028,56317.667.772.796.21
MantolokingMantolokingMarine22 May 202514.814.6258.6128,26317.467.701.443.14
Metedeconk_riverMetedeconk riverBrackish river22 May 202515.614.6228.8922,60213.687.8715.2927.05
Johns_coveJohn’s CoveMarine26 May 202515.614.8338.2218,79211.197.402.053.26
Greewood_ lakeGreenwood lakeFreshwater26 May 202519.214.50811.56177.20.089.5014.5823.86
SeasideSeaside parkMarine30 May 202517.614.5939.1519,17811.447.5511.122.40
Toms_River_Ocean_
gate
Toms River (Ocean Gate)Brackish river30 May 202519.214.5838.2319,52611.667.4515.8435.12
KeyportKeyport HarborMarine2 June 202520.714.70710.1218,56411.037.789.0016.20
Matawan_
Creek
Matawan CreekBrackish river2 June 202520.714.7078.6716,8969.967.477.0211.11
Lake_
Hopatcong_S
Lake Hopatcong southFreshwater6 June 202520.714.2248.94315.60.158.057.1715.66
Lake_
Hopatcong_M
Lake Hopatcong middleFreshwater6 June 202522.014.22510.22313.30.158.703.6710.24
Lake_
Hopatcong_N
Lake Hopatcong northFreshwater6 June 202524.714.2197.43233.20.117.806.8010.51
WeequahicWeequahic parkFreshwater6 June 202528.714.67212.505600.268.295.897.01
Toms_River_BeachwoodToms River (Beachwood beach)Freshwater9 June 202519.414.6738.4342982.36.565.2613.19
John_BartlettJohn Bartlett ParkMarine9 June 202520.814.6728.1825,01415.267.536.3513.48
Old_BridgeOld Bridge Waterfront ParkMarine13 June 202522.214.7944.8020,89212.537.22100.84326.98
BayshoreBayshore Waterfront ParkMarine13 June 202522.214.7929.9221,58012.988.2226.7058.54
SkylandKean Skyland lakeFreshwater9 July 202526.114.2037.1984.30.046.827.6311.45
Lake_
Hopatcong_S
Lake Hopatcong southFreshwater10 July 202527.114.2487.38332.50.167.1733.4341.29
Lake_
Hopatcong_M
Lake Hopatcong middleFreshwater10 July 202527.614.2508.683280.157.766.1111.46
Lake_
Hopatcong_N
Lake Hopatcong northFreshwater10 July 202528.514.2508.863160.157.8612.3920.55
WeequahicWeequahic parkFreshwater10 July 202530.014.70513.645150.258.447.0631.77
Kean_STEM_pondKean STEM pondFreshwater21 July 202527.614.6567.12490.10.237.2527.7742.25
SadowskiSadowski Waterfront ParkMarine22 July 202525.914.7916.4925,28815.387.2521.5749.01
RaritanRaritan Waterfront ParkMarine22 July 202526.214.7988.3123,36714.17.5413.9550.62
Lake_
Rogerene
Lake RogereneFreshwater23 July 202527.514.3708.492340.117.0429.2040.07
Budd_lakeBudd LakeFreshwater23 July 202525.814.3709.72286.80.148.6013.4135.32
Lake_
Hopatcong_S
Lake Hopatcong southFreshwater8 August 202525.114.4288.72340.30.167.1620.0543.67
Lake_
Hopatcong_M
Lake Hopatcong middleFreshwater8 August 202525.214.4288.62331.20.167.536.3015.93
Lake_
Hopatcong_N
Lake Hopatcong northFreshwater8 August 202525.314.4259.95329.80.168.2011.5925.22
WeequahicWeequahic parkFreshwater8 August 202527.214.89113.92488.20.238.825.2412.46
Table 2. MS MRM settings for phycotoxin analytes.
AnalyteIonization ModeAdductMRM TransitionsCone Voltage (V)Collision Energy (eV)
MC-LRESI+2H+498.3 > 482.5; 135.0; 70.0208; 12; 58
MC-RRESI+2H+520.0 > 135.5; 103.5; 70.42030; 50; 50
MC-YRESI+H+1045.5 > 213.3; 135.72060; 70
DAESI+H+312.1 > 266.0; 133.1; 91.12020; 30; 50
AZA1ESI+H+842.4 > 824.0; 126.12030; 80
AZA2ESI+H+856.4 > 838.0; 126.12030; 70
OAESI--H803.5 > 255.1; 113.22050; 70
YTXESI--2H570.2 > 466.9; 97.02030; 50
DTX1ESI--H818.0 > 255.3; 113.32050; 70
DTX2ESI--H803.5 > 255.1; 113.22050; 60
PTX2ESI+NH4+876.5 > 841.1; 823.0; 213.32020; 20; 40
PbTx2ESI+H+895.4 > 877.1; 625.4; 129.22020; 30; 60
Disclaimer/Publisher’s Note: The statements, opinions and data contained in all publications are solely those of the individual author(s) and contributor(s) and not of MDPI and/or the editor(s). MDPI and/or the editor(s) disclaim responsibility for any injury to people or property resulting from any ideas, methods, instructions or products referred to in the content.