Article

Multidimensional Rainfall Risk for Hydropower Dam Safety from Extreme-Weighted CMIP6 Ensembles Across the Mekong Basin


by
Phengxiong Tongnamavong
1,
Anongrit Kangrang
1 and
Haris Prasanchum
2,*
1
Faculty of Engineering, Maha Sarakham University, Maha Sarakham 44150, Thailand
2
Faculty of Engineering, Rajamangala University of Technology Isan, Khon Kaen Campus, Khon Kaen 40000, Thailand
*
Author to whom correspondence should be addressed.
Water 2026, 18(16), 2013; https://doi.org/10.3390/w18162013
Submission received: 18 July 2026 / Revised: 14 August 2026 / Accepted: 15 August 2026 / Published: 17 August 2026
(This article belongs to the Section Water and Climate Change)

Abstract

Climate change affects the intensity of extreme rainfall, which is an important factor for design flood assessment and dam safety, particularly in the monsoon region of Southeast Asia and the Mekong Basin, where seasonal rainfall variability is high and there are many hydropower dams that are vulnerable to changes in extreme rainfall. This study developed a framework for assessing design rainfall and probable maximum precipitation (PMP) under climate change for three dam catchments of different sizes in Thailand and Lao PDR, namely the Ubolrat Dam, the Nam Theun 1, and the Nam Kong 3 Dam. The framework connects the bias correction of GCM data from 10 CMIP6 models using CMhyd, extreme-focused model selection with catchment-specific ranking, and the construction of the top-three ensemble median, through to the analysis of the return period, DDF, IDF, PMP, and extreme rainfall trends under the SSP2–4.5 and SSP5–8.5 scenarios. The results show that the suitable models are catchment-specific and that each catchment has a different risk profile under SSP5–8.5. The Ubolrat Dam shows a 63.20% increase in the 100-year 1-day rainfall, the Nam Theun 1 shows a 40.64% increase in the 100-year 7-day rainfall, while the Nam Kong 3 has the highest PMP value and the steepest Rx7day trend at 18.03 mm per decade. The results indicate that the assessment of extreme rainfall risk must consider magnitude, variability, and trend together, and the outputs can serve as input data for the assessment of PMF and hydropower dam safety under future climate variability.

1. Introduction

Extreme rainfall is a primary controlling factor of flood generation, hydraulic structure design, reservoir management, and dam safety assessment [1]. The term “extreme rainfall” refers to the upper tail of the rainfall distribution, represented by the annual maximum 1- to 7-day accumulated rainfall and the high-percentile rainfall amounts, whereas the term “heavy rainfall” is retained only for the day-count index of days with rainfall of at least 10 mm. Changes in rainfall depth, accumulation duration, and the frequency of extreme events directly affect the peak flow, flood volume, time to peak, and water management capacity of reservoirs [2]. The rise in global temperature affects the water cycle and the capacity of the atmosphere to hold water vapor, which may increase the frequency and intensity of extreme rainfall events in many regions [3]. This is particularly the case for short-duration extreme rainfall, for which studies indicate that intensity and frequency may change significantly under future climate conditions [4,5]. However, changes in rainfall are important not only in terms of the annual mean but also in terms of short-duration extreme rainfall and multi-day accumulated rainfall, which play different roles in catchment response. Specifically, the maximum 1-day rainfall is often associated with flash floods and the rapid response of small catchments [6], whereas 3- to 7-day accumulated rainfall is important for flood volume and for the rise of reservoir water levels [7,8,9]. Considering multiple rainfall durations is therefore necessary for the assessment of design rainfall that can be practically applied in engineering, particularly for dams that must account for both extreme events and water management capacity under climate uncertainty [10,11,12]. For this reason, work in the field of climate extremes proposes that changes in extreme rainfall should be evaluated using multidimensional indicators, including daily maximum rainfall, multi-day accumulated rainfall, number of heavy rainfall days, and high-percentile rainfall [13,14,15].
For the assessment of future rainfall changes, general circulation models (GCMs) under the Coupled Model Intercomparison Project Phase 6 (CMIP6) have been widely used because they provide climate data under the shared socioeconomic pathways (SSPs) that reflect economic development, society, and greenhouse gas emissions [16]. This makes it possible to systematically compare the impacts among different emission pathways [17]. However, rainfall data from GCMs often contain systematic bias arising from limitations in spatial resolution, the representation of cloud and rainfall processes, and the averaging of values within large grid cells. Bias correction is therefore a necessary step before the data can be used in basin-scale hydrological studies [18,19], particularly when analyzing extreme rainfall and design rainfall, which are more sensitive to maximum values than to mean values [20]. Among the tools developed for this purpose, CMhyd (Climate Model data for hydrologic modeling) is used to extract and correct climate model data against station-level observations through various methods, such as linear scaling, distribution mapping, and quantile mapping [21,22,23].
Similarly, one important issue is the selection of a suitable climate model because using the mean of all GCMs without evaluating the performance of each model may result in high uncertainty in the design rainfall, since each model has a different ability to simulate rainfall in each region and each catchment [24]. Moreover, model selection should not consider only the mean rainfall or the annual total rainfall, but should give importance to extreme rainfall indicators, such as maximum 1-day rainfall (Rx1day), maximum 3-day rainfall (Rx3day), maximum 7-day rainfall (Rx7day), and number of heavy rainfall days, because these indicators directly affect the construction of the annual maximum series (AMS), the analysis of the return period, and the assessment of maximum extreme rainfall [25,26,27]. Therefore, model selection at the catchment scale that emphasizes extreme rainfall indicators, together with the use of the median of the selected model group (ensemble median) to reduce the influence of a single model that gives anomalous values, is an approach that increases the reliability of the results, as accepted in climate projection studies [15,28]. However, although many studies have applied bias-corrected GCM data to assess future extreme rainfall, most of these studies encounter limitations when proceeding to the stage of analyzing extreme rainfall indices or intensity-duration-frequency (IDF) curves and are conducted at the large-basin scale, which leaves two gaps. First, work that connects the complete process, from bias correction, extreme-focused model selection, and areal rainfall calculation, through to the assessment of depth-duration-frequency (DDF)/IDF and probable maximum precipitation (PMP) at the dam catchment scale, remains limited, even though the PMP value is an important variable for the assessment of the probable maximum flood (PMF) and dam safety. Second, design rainfall assessment in Southeast Asia mostly still relies on historical observed data under the stationarity assumption without adjusting for the non-stationarity conditions under climate change. Therefore, the assessment of design rainfall and PMP, which serve as input data, is a necessary upstream step before design flood simulation and dam safety assessment [29,30].
The study area in this work consists of the catchments of three dams located in the monsoon region of Southeast Asia, namely the Ubolrat Dam (UB) in the Upper Chi Basin of Thailand and the Nam Theun 1 Dam (NT1) and the Nam Kong 3 Dam (NK3) in the Lower Mekong Basin of Lao People’s Democratic Republic (PDR). These three dams play important roles in hydropower generation, irrigation, flood mitigation, and spatial water management, and they differ clearly in catchment area, reservoir storage capacity, and installed capacity, ranging from the large catchment of more than 12,000 square kilometers (sq.km) of the UB to the small catchment of approximately 645 sq.km of the NK3. This physical difference makes the three study areas suitable for assessing how design rainfall under climate change responds differently in catchments with different sizes and topographic characteristics. In addition, because the study area covers both Thailand and Lao PDR, which are under the influence of the same monsoon system while having different spatial rainfall characteristics, the study results have implications for transboundary water resource management in the Mekong Basin. Furthermore, all three dams are areas in which design rainfall values are important for further application in hydrological models to evaluate the hydrograph, peak discharge, reservoir inflow, and future PMF cases, which is an observation that leads to the definition of the objectives of this study.
Based on the context and the gaps mentioned above, this study developed a framework for assessing design rainfall and PMP under climate change for the three dam catchments, with three main objectives. First, to develop an integrated framework that connects bias correction using CMhyd, extreme-focused climate model selection with catchment-specific ranking, and the construction of the top-three ensemble median, through to the analysis of the return period, DDF, IDF, and PMP of 1- to 7-day accumulated rainfall, with results that can be directly used as input data for the assessment of PMF and dam safety. Second, to compare the risk profile of design rainfall among dam catchments with different sizes and topographic characteristics in Thailand and Lao PDR, which has implications for transboundary water management in the Mekong Basin. Third, to demonstrate that the assessment of extreme rainfall risk under climate change requires the joint consideration of multiple dimensions, namely magnitude, variability, and long-term trend, rather than the consideration of the mean anomaly in a single dimension. Taken together, these objectives define the novelty of this study in three respects. This study connects the complete workflow from bias correction through to PMP at the dam-catchment scale, whereas most previous assessments in the region treat these steps separately or operate at the large-basin scale. It replaces the common practice of a single region-wide model set selected from mean climate performance with a catchment-specific ranking weighted toward extreme rainfall indicators. It also expresses the outcome not as a single-dimension design value but rather as a multidimensional risk profile, covering magnitude, variability, long-term trend, and the upper bound for three transboundary catchments that differ in area by more than an order of magnitude. In this way, the results provide design rainfall information consistent with the changing climate and serve as a basis for the design flood analysis, PMP assessment, and water risk management planning of the three dams.

2. Materials and Methods

2.1. Methodological Framework

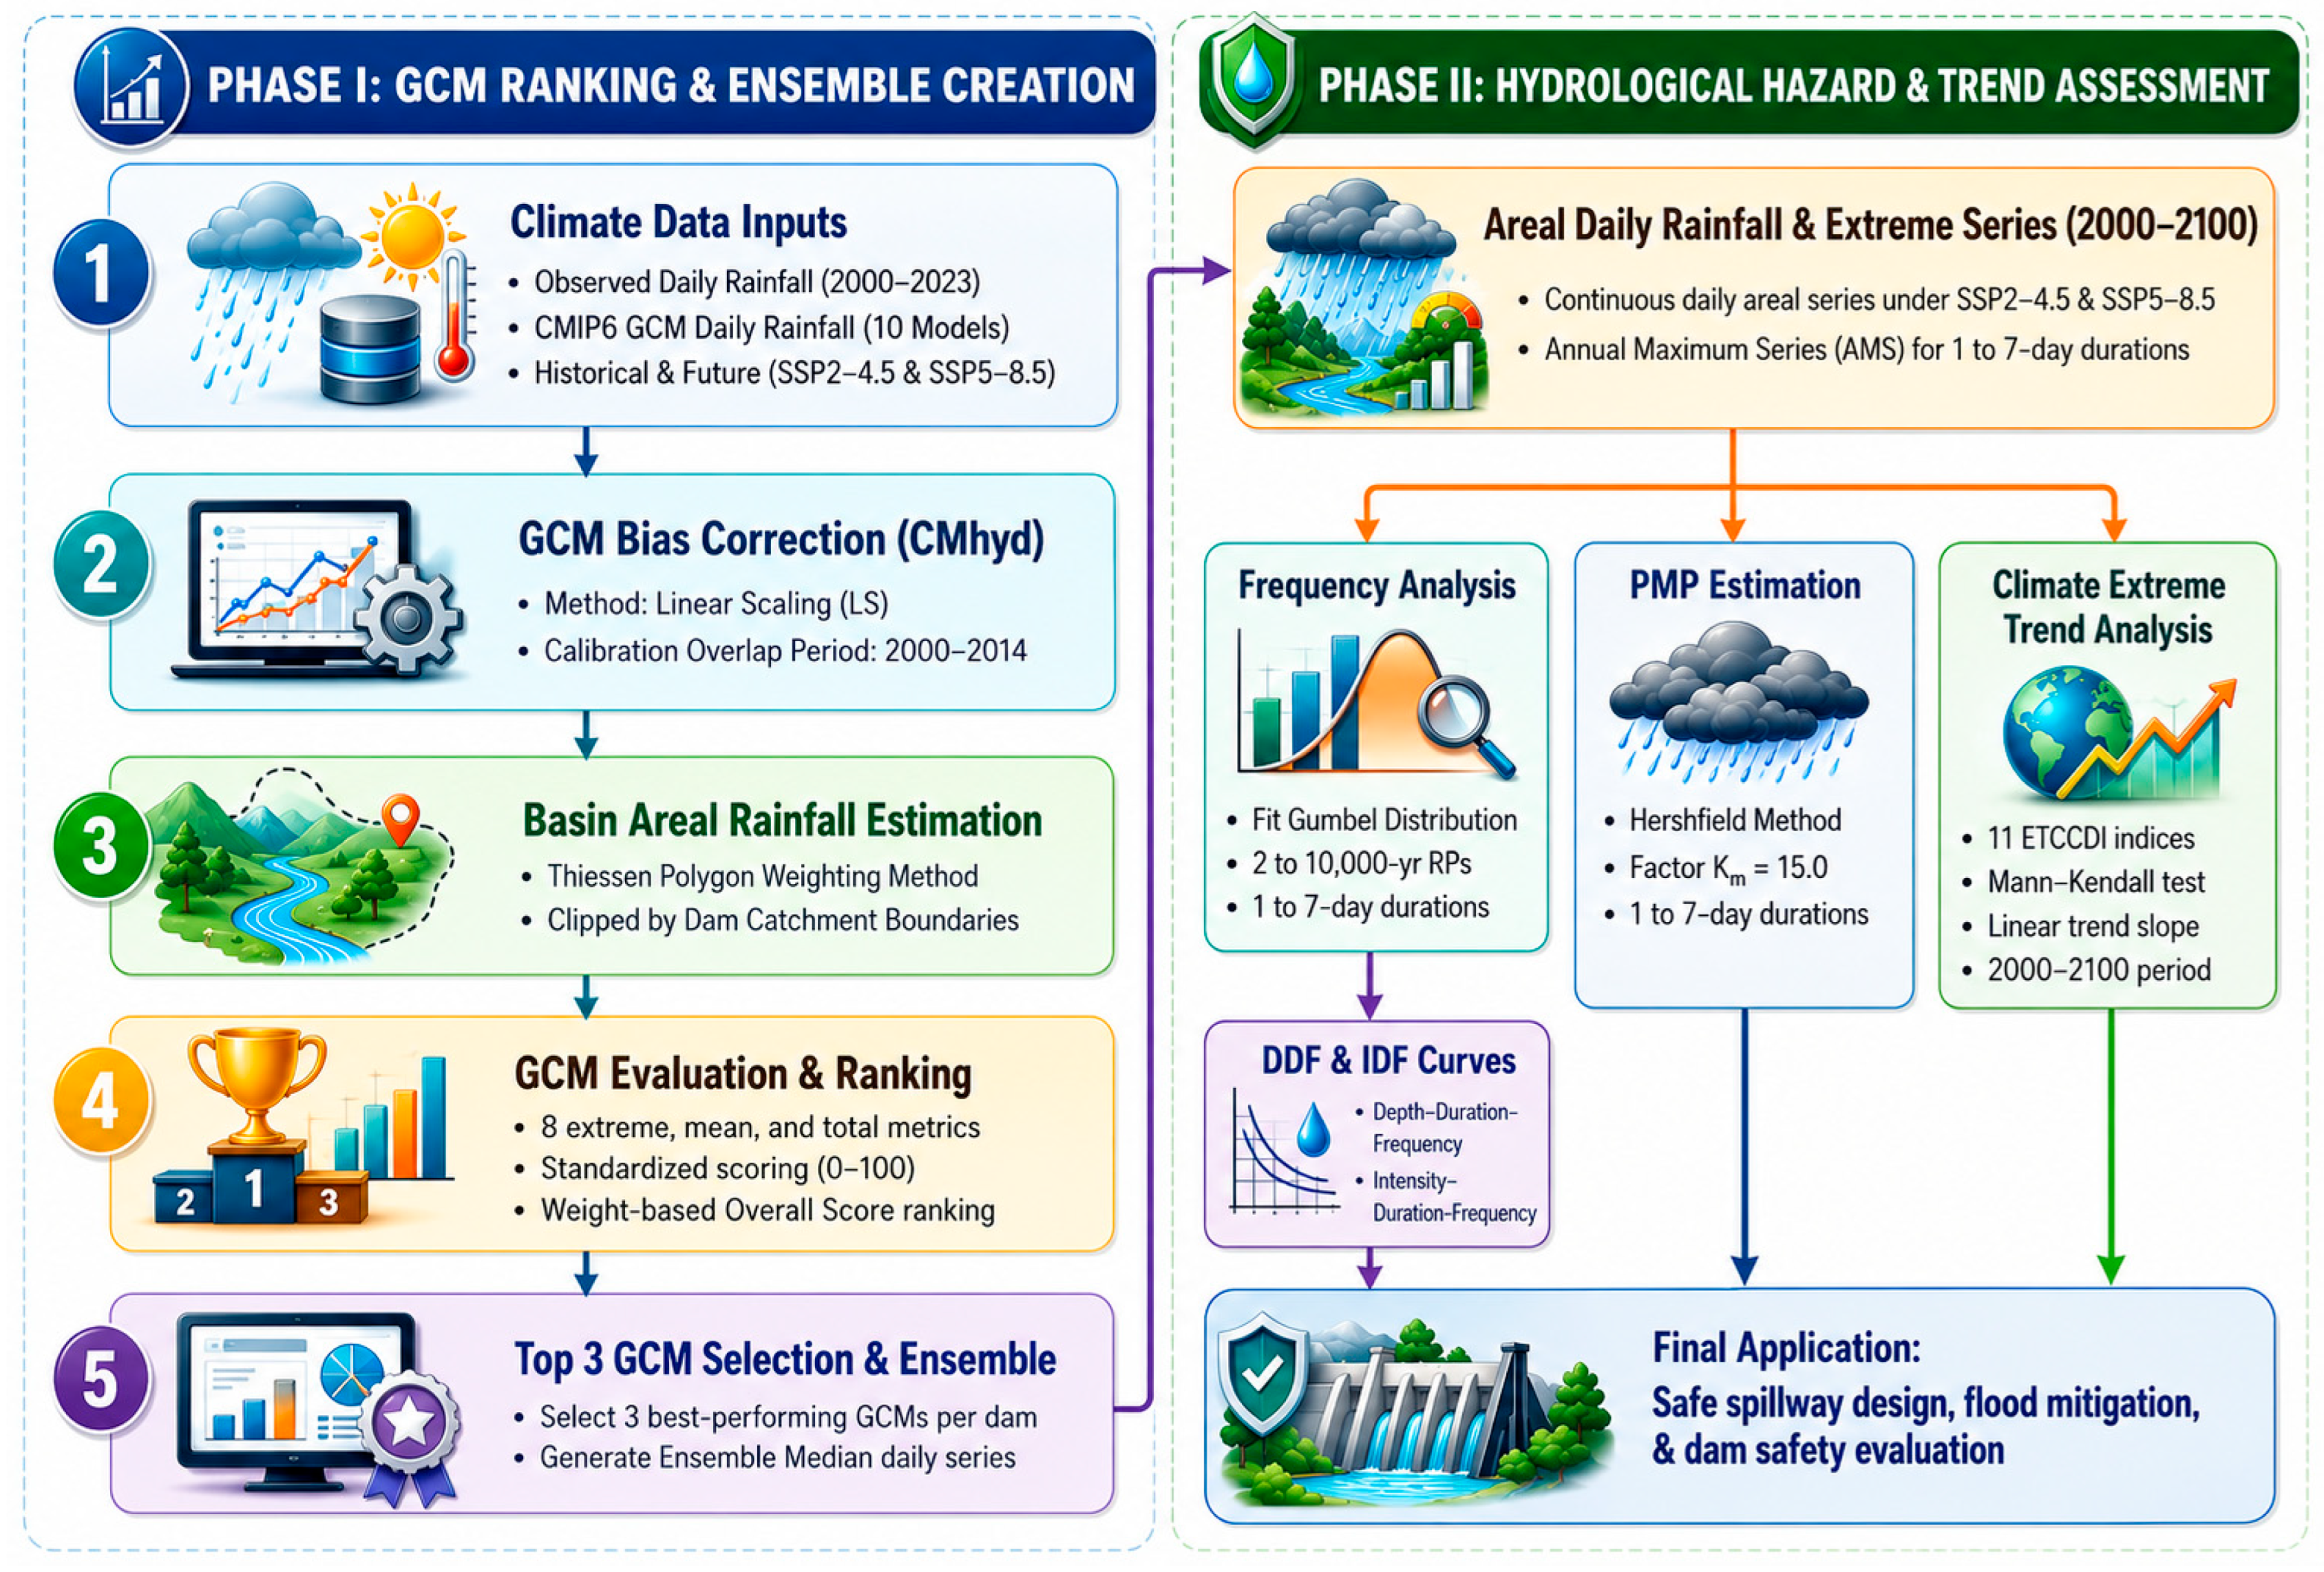
The analytical framework (Figure 1) connects observed rainfall, GCM data bias-corrected using climate model data for hydrologic modeling (CMhyd), areal rainfall calculation, model selection and ranking, ensemble construction, and design rainfall analysis in a sequential manner. It begins with two groups of daily rainfall: observed data used as the reference and GCM data under the SSP2–4.5 and SSP5–8.5 scenarios, covering both the historical simulation and the future projection. The GCM data was then bias-corrected with CMhyd over the overlap period between the observed and historical simulation data, so that the model’s statistical characteristics became more consistent with the observed data in the baseline period [21]. The corrected daily rainfall was used to compute areal rainfall for each catchment, applying Thiessen weighting where multiple stations exist and station data directly for a single station, making the analysis more consistent with the spatial characteristics of the catchment than using individual stations separately [31].
Next, the areal rainfall from the observed and GCM data over the historical overlap period was compared to rank the climate models, using indicators emphasizing extreme and total rainfall (Rx1day, Rx3day, Rx7day, number of heavy rainfall days, annual maximum series correlation, monthly total rainfall error, annual total rainfall bias, and overall bias). The top-three models of each catchment were selected to construct the top-three ensemble median for the subsequent analysis; using the median stabilizes the results and reduces the influence of any single model with anomalously high or low rainfall [15,28]. Finally, the Ensemble median dataset was used to analyze design and extreme rainfall in multiple dimensions: the AMS of 1- to 7-day rainfall, frequency analysis for return period rainfall, DDF and IDF curves, PMP, and extreme rainfall trends from Expert Team on Climate Change Detection and Indices (ETCCDI)-based indices. The conceptual framework is therefore not the direct calculation of design rainfall from GCM data, but rather a process that systematically links bias correction, model performance evaluation, areal rainfall calculation, ensemble construction, extreme rainfall analysis, and the interpretation of results for hydrological application.

2.2. Study Area and Rainfall Data

2.2.1. Dam Catchments

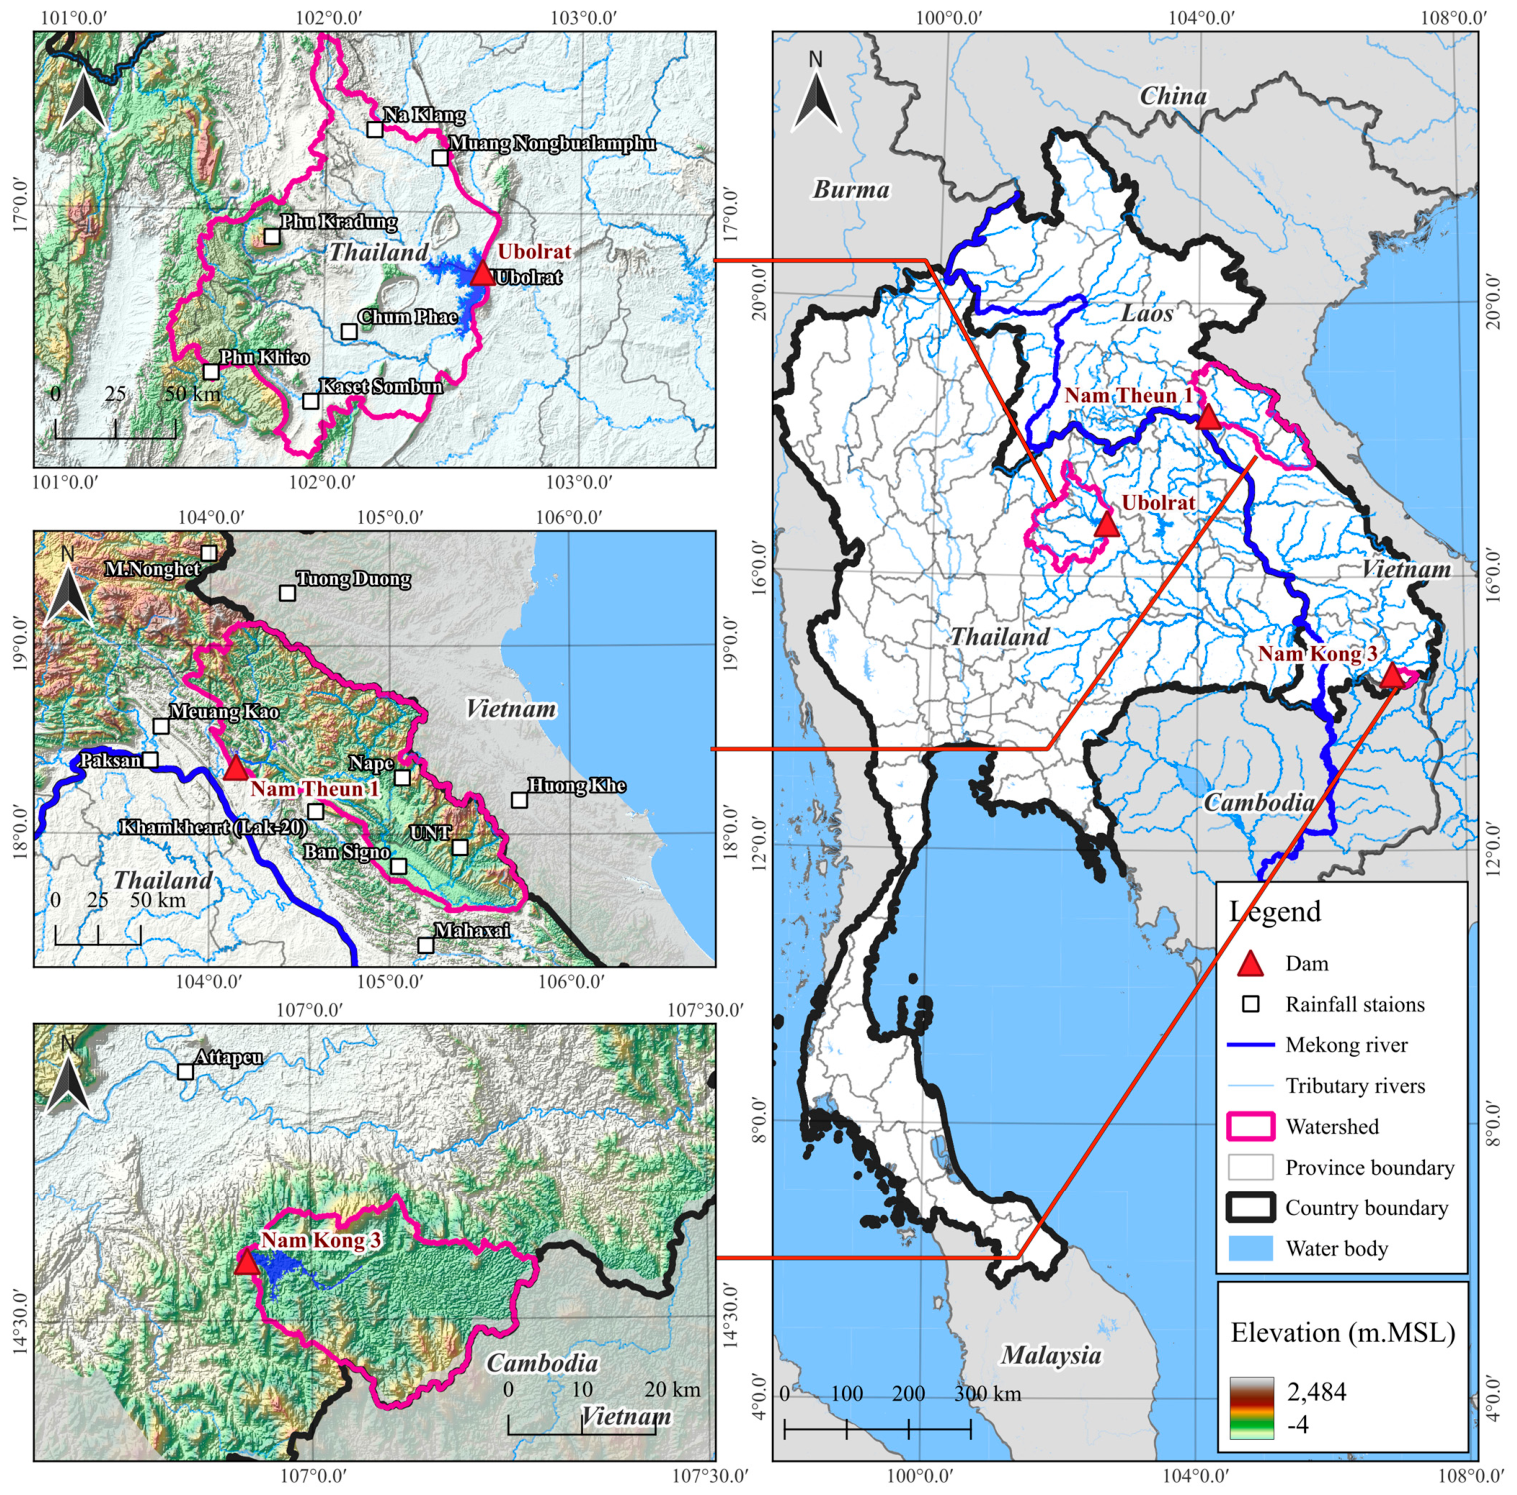
The study area comprises the catchments of three dams: the UB in Thailand and the NT1 and NK3 in Lao PDR. All three lie in the monsoon region of Southeast Asia, which has high seasonal rainfall variability and is important for water management, hydropower generation, flood risk reduction, and long-term dam safety planning. The study areas and the rainfall stations used in the analysis are shown in Figure 2. The UB is located in Ubolrat District, Khon Kaen Province, Thailand, on the Phong River, an important tributary of the Upper Chi Basin. This multipurpose dam serves hydropower generation, irrigation, flood mitigation, fisheries, and water management in northeastern Thailand. Its catchment covers approximately 12,104 sq.km, with a reservoir storage capacity of approximately 2431.3 million cubic meters (MCM), a reservoir surface area of approximately 410 sq.km, and an installed capacity of 25.2 megawatts (MW), reflecting a large catchment important for both the power generation system and the water management of the Upper Chi Basin [10,18].
The NT1 is located on the Nam Theun River in Lao PDR and is a large hydropower project in the Lower Mekong Basin [32]. Its catchment covers approximately 2623 sq.km, with a reservoir storage capacity of approximately 2772 MCM, a maximum reservoir surface area of approximately 93.6 sq.km, and an installed capacity of approximately 650 MW. This area is important for design rainfall assessment because changes in multi-day accumulated rainfall affect the reservoir inflow volume and future water risk assessment [8]. The NK3 on the Nam Kong River in Lao PDR has a catchment of approximately 644.91 sq.km, a reservoir storage capacity of approximately 471 MCM, a maximum reservoir surface area of approximately 32 sq.km, and an installed capacity of approximately 54 MW. With the smallest installed capacity and catchment area in the study group, the NK3 represents a small catchment suitable for comparing the differences in extreme rainfall among catchments with different sizes and climatic characteristics [2,6].
The three study areas were selected for three main reasons. First, all three dams play a role in hydropower and water management while differing in catchment area, reservoir storage capacity, installed capacity, and topographic characteristics and are therefore suitable for assessing how design rainfall under climate change responds differently in catchments with different sizes and characteristics. Second, the study area covers both Thailand and Lao PDR, which are under the influence of the same monsoon system while having different spatial rainfall characteristics. Third, all three dams are important for the further application of design rainfall results in hydrological models to evaluate the hydrograph, peak discharge, flood volume, reservoir inflow, and future PMF cases.

2.2.2. Rainfall Stations and Analysis Periods

The observed and climate model rainfall data were prepared in daily format, with a total of 18 rainfall stations: 7 for the UB group, 10 for the NT1 group, and 1 for the NK3 group. The observed data were used as the reference during the historical overlap period between 2000–2014 to compare with the historical simulation data of the GCMs and to serve as the basis for evaluating the capability of the climate models. Grouping the stations by catchment is important for the calculation of areal rainfall because the hydrological response of a dam depends on the mean rainfall over the entire catchment rather than on any single station. For the UB and the NT1, which have multiple stations, Thiessen weighting reflects the spatial influence of each station better than a simple arithmetic mean. The NK3 has only a single station, and its rainfall is therefore used directly as the catchment representative, a limitation that must be considered when interpreting the results, particularly for the trend analysis and the uncertainty assessment of extreme rainfall.
The analysis period was divided into four periods, namely Historical–Present (2000–2025), Near Future (2026–2050), Mid Future (2051–2075), and Far Future (2076–2100), under the SSP2–4.5 and SSP5–8.5 scenarios [33]. For the Historical–Present period, the observed rainfall data were used as the basis, and years with incomplete observed data were filled with data from the selected models to obtain a continuous dataset up to 2025. This division allows the changes in future design rainfall to be compared systematically: the Near Future reflects short-term to medium-term planning, the Mid Future the period in which many water infrastructures may still be within their service life [11], and the Far Future the long-term risk under more severe climate change.

2.3. CMhyd Bias Correction and Climate Data

2.3.1. GCM Data and SSP Scenarios

The assessment of future rainfall changes relies on daily rainfall data from 10 general circulation models (GCMs) under the CMIP6 project, developed by leading climate research institutions in several countries and listed with their institutions, countries, and spatial resolutions in Table 1. Each model has a spatial resolution of approximately 100–250 km, which requires bias correction before use in catchment-scale analysis [34]. Using 10 models from several institutions covers the model structural diversity and allows a suitable model to be selected for each catchment in the subsequent step, rather than fixing on any single model in advance [24,28]. Two future climate scenarios are considered: SSP2–4.5, a middle-of-the-road scenario reflecting moderate development and greenhouse gas emission trends, and SSP5–8.5, a high-emission scenario used to assess risk under the worst-case framework. These two clearly different scenarios allow the range of design rainfall changes to be assessed for both the moderate and the severe case [35].

2.3.2. Bias Correction Using CMhyd

The daily GCM rainfall data were bias-corrected with the CMhyd program using the linear scaling approach, which relates the observed and GCM rainfall over the 2000–2014 overlap period and applies the resulting correction factor to the historical and future data of each model. The correction concept is shown in Equation (1) [36]:
P corr , t   =   P gcm , t   ×   CF ,   CF   =   P ¯ obs P ¯ gcm
where Pcorr,t is the bias-corrected daily rainfall on day t, Pgcm,t is the daily rainfall from the GCM on day t, CF is the correction factor calculated from the overlap period,  P ¯ obs is the mean observed rainfall during the overlap period, and  P ¯ gcm is the mean GCM rainfall during the same period.
This correction reduces the systematic error of the rainfall data before the subsequent steps. Bias correction does not turn the GCM data into observed data, but rather adjusts its statistical characteristics to be more consistent with the observed data in the baseline period [37]; future results should therefore be interpreted together with the uncertainty of the models and the climate scenarios. Linear scaling was chosen for its simplicity, computational efficiency, and ability to preserve the pattern and variability of the model data and is accepted and widely used in hydrological and climate studies [20,22,38]. However, it focuses mainly on adjusting the monthly mean and therefore has a limitation in adjusting the quantile of extreme values compared with the quantile mapping method, which is treated as a limitation of the study and discussed in the section on uncertainty assessment.
In addition, both the observed and model daily rainfall data underwent preliminary quality control, in which negative or anomalously high rainfall values were treated as missing data according to defined criteria, and the time period, number of days, and data completeness during the overlap period were checked so that the comparison between the observed and model data was consistent. This step is particularly important for extreme rainfall analysis because only a few anomalous daily values may significantly affect the annual maximum series, return period, and PMP values [39]. Checking the data before calculation, therefore, reduces the risk that the design rainfall results are dominated by values arising from data errors rather than reflecting the actual or model rainfall.

2.4. Areal Rainfall and Climate Model Selection

2.4.1. Areal Rainfall by Thiessen Weighting

Because the UB and the NT1 have more than one rainfall station, the areal rainfall was calculated before further analysis using the Thiessen polygon method, which uses the proportion of the area of influence of each station as the spatial weight. This fundamental approach for estimating the mean areal rainfall of a basin with unevenly distributed stations is consistent with that used in the previous studies of the research team in basins within the same region [18,40]. The daily areal rainfall is calculated from the weighted sum of the station rainfall, with the weight of each station defined by the proportion of its Thiessen polygon area to the entire catchment. For the NK3, which has only one station, the areal rainfall was defined directly from that station’s rainfall. Areal rainfall is more suitable for catchment-scale work than a single station because the flood at the catchment outlet results from rainfall distributed across the entire area rather than from any single location. The Thiessen method does not consider the influence of topography, wind direction, or detailed spatial rainfall mechanisms; however, it remains suitable when areal rainfall must be constructed from station data and transparency of the calculation process is required.

2.4.2. Model Ranking Metrics and Scoring

The selection of climate models was carried out by comparing the areal rainfall from each model with the areal rainfall from the observed data during the period 2000–2014, considering eight indicators that simultaneously emphasize extreme rainfall and the reasonableness of total rainfall, namely Rx1day_RE, Rx3day_RE, Rx7day_RE, HeavyDays_RE, AMS1_Corr, MonthlyTotal_NRMSE, AnnualTotal_RE, and PBIAS_abs. The details and weights of each indicator are shown in Table 2 [41].
Among the eight indicators, the relative error was used to assess the error of indicators that are rainfall amounts or numbers of days, as shown in Equation (2):
RE j   =   M sim , j     M obs , j M obs , j
where  R E j is the relative error of indicator j M sim , j is the indicator value from the model, and  M obs , j is the indicator value from the observed data. Similarly, the error of the monthly total rainfall was assessed using the normalized root mean square error (MonthlyTotal_NRMSE), the overall bias was assessed using the absolute percent bias (PBIAS_abs), and the consistency of the inter-annual variability of the maximum rainfall was assessed using the correlation coefficient of the annual maximum series (AMS1_Corr), as defined in Table 2.
The weighting gives greater importance to extreme rainfall than to general mean rainfall. Rx1day_RE receives the highest weight of 0.25 because the maximum 1-day rainfall is directly related to the rapid response of the catchment and the assessment of the flood peak, followed by Rx3day_RE and HeavyDays_RE at 0.15, whereas MonthlyTotal_NRMSE, AnnualTotal_RE, and PBIAS_abs ensure that the selected model remains reasonable in terms of monthly and annual total rainfall. The extreme rainfall group (Rx1day_RE, Rx3day_RE, Rx7day_RE, and HeavyDays_RE) together carries a weight of 0.65, the majority of the scoring system, consistent with the objective of design rainfall and PMP assessment. The weights follow the design objective rather than an arbitrary choice: the extreme rainfall group receives the largest share (0.65) because design rainfall and PMP depend primarily on the annual maxima, with Rx1day_RE weighted highest (0.25) for its direct link to the flood peak, whereas the total rainfall metrics (0.35) preserve the seasonal and annual realism of the selected models. Each indicator is then converted into a standardized score, in which the error-type indicators give a high score when the error is low, as shown in Equation (3) [42]:
Score m , j   =   Score min   +   ( 100 Score min )   ×   error max error m , j error max   error min
where Scorem,j is the score of model m for indicator j, Scoremin is the defined minimum score, errorm,j is the error value of model m, and errormax and errormin are the maximum and minimum error values of that indicator among all models. The correlation-type indicators use the principle that a high score is given when the correlation is high, as illustrated in Equation (4) [42]:
Score m , j   =   Score min   +   ( 100 Score min )   ×   T m , j T min T max   T min
where Scorem,j is the model m for indicator j and Tmax and Tmin are the maximum and minimum correlations among all models. The overall score of each model is then calculated from the weighted sum of the scores of all indicators, as shown in Equation (5) [42]:
Score overall , m   =   j = 1 p w j   Score m , j  
where Scoreoverall,m is the overall score of model m, wj is the weight of indicator j (according to Table 2), and p is the total number of indicators. The model with the highest overall score in each dam catchment was ranked first.
The ranking was carried out separately for each catchment because a model that performs well in one area may not always perform well in another. Such differences arise from topographic characteristics, rainfall regimes, seasonal variability, and the ability of the model to simulate the rainfall mechanisms of each region [43]. Ranking separately for each dam, therefore, makes the ensemble construction more suitable for the characteristics of the catchment than selecting a single set of models for all areas. In addition, weighting in this manner is transparent and interpretable in hydrological terms, unlike ranking by a black-box method. The gap in the overall score between the top-ranked models and the subsequent models in each catchment indicates that a small change in the weights does not significantly change the order of the top-ranked models. This stability was tested through a weight sensitivity analysis [44], in which all eight weights of the 10 models in each catchment were perturbed by ±20% and ±30% using a Monte Carlo procedure, with the sample size per perturbation level set at the lower bound recommended for Monte Carlo simulation [45], the weights renormalized in each run, and the resulting rankings compared with the baseline to determine whether the selected models remained stable. The selected models were then used to construct the ensemble median that provides the basis for the annual maximum series and design rainfall analysis presented in the Results.

2.4.3. Top-Three Ensemble Median

After ranking all 10 models, this study selected the top three of each catchment to construct the main output as the ensemble median, as shown in Equation (6):
P ens , t   =   median   ( P 1 , t ,   P 2 , t ,   P 3 , t )
where Pens,t is the ensemble median rainfall on day t and P1,t, P2,t, and P3,t are the rainfall from the first-ranked, second-ranked, and third-ranked models, respectively.
The median reduces the influence of anomalous values from any single model, which suits extreme rainfall analysis that is highly sensitive to outliers. Multi-model ensembles are a popular approach in climate projection studies because they reduce the uncertainty from a single model [28,46]. Here, the ensemble median is not used to represent the mean of all models, but rather is a representative value from the models selected as suitable for the extreme rainfall of that catchment, which increases the reliability of the resulting design rainfall data.

2.5. Design Rainfall, PMP, and Trend Analysis

2.5.1. Annual Maximum Series

The design rainfall analysis used the annual maximum series (AMS) of 1- to 7-day accumulated rainfall. The continuous accumulated rainfall of duration d days was first calculated as a moving sum, and the maximum value of each year was then selected as the annual maximum accumulated rainfall of that duration, as shown in Equation (7) [47]:
AMS d , y   =   max t y   k = 0 d   1 P ens , t - k
where AMSd,y is the annual maximum accumulated rainfall of duration  d in year y, Pens,t-k is the ensemble median areal rainfall  k days back from day t, and  d is the duration of the accumulated rainfall (1 to 7 days). In addition, the annual total rainfall was calculated in parallel for use in the trend analysis. The accumulated rainfall dataset was checked for physical consistency, that is, the accumulated rainfall value must not decrease as the duration increases.
AMS is suitable for the frequency analysis of extreme rainfall [48,49] because it selects the maximum accumulated rainfall event of each year as the representative annual extreme event. Considering multiple durations allows both short-duration and multi-day accumulated rainfall to be assessed, which differ in importance depending on the catchment characteristics and the design objective. The maximum 1-day rainfall is related to the rapid response of the catchment and the flood peak, whereas the 3- to 7-day accumulated rainfall is related to the flood volume and the rise of reservoir water levels.

2.5.2. Frequency Analysis and Return Period Rainfall

The AMS of each duration was analyzed with the Gumbel distribution (Extreme Value Type I), one of the methods most widely used for extreme rainfall and flood values [50,51,52], to estimate the rainfall for return periods of 2, 5, 10, 25, 50, 100, 200, 500, 1000, and 10,000 years. The design rainfall for return period T is calculated from the mean and standard deviation of the AMS together with the frequency factor, as shown in Equation (8):
P T   =   P ¯   +   K T   ×   S ,   K T   =   y T y ¯ n S n ,   y T   =   ln ln T T     1
where PT is the design rainfall value of return period T P ¯ is the mean of the AMS, S is the standard deviation of the AMS, KT is the frequency factor of the Gumbel distribution, yT is the reduced variate of return period T, and  y ¯ n and  S n are the mean and standard deviation of the reduced variate for sample size n.
The analysis of high return periods, such as 500, 1000, and 10,000 years, is an estimation lying outside the direct range of the data and must therefore be interpreted with caution according to the uncertainty of the extrapolation. These values are nevertheless useful for comparing the severity of rainfall among catchments, scenarios, and periods and as input data for considering critical cases in design work and dam safety [53]. The uncertainty of the estimation at high return periods is considered in the Section 3.6.

2.5.3. Probable Maximum Precipitation

The probable maximum precipitation (PMP) was assessed using the statistical method of Hershfield, from the mean and standard deviation of the AMS together with the frequency factor, as shown in Equation (9) [54]:
PMP d   =   P ¯ d   +   K m   ×   S d ,       K m   =   15
where PMPd is the PMP value of the accumulated rainfall of duration d P ¯ d is the mean of the AMS of duration d, Sd is the standard deviation of the AMS of duration d, and Km is the frequency factor. This study sets Km = 15 according to the value proposed by Hershfield [55], and the PMP value of each duration was checked for physical consistency, that is, the PMP value must not decrease as the duration increases.
The PMP assesses the upper bound of the statistically possible extreme rainfall under the analyzed dataset, and a constant Km allows the results to be compared among dams, scenarios, and periods under the same criteria. However, the Hershfield method is a statistical PMP assessment, which differs from the moisture-maximization PMP based on the meteorological approach [56], and setting Km equal to 15 may give a relatively high (conservative) estimate in some areas [57]. In actual design application, the PMP value may therefore need to be considered together with meteorological methods and the specific requirements of the relevant agencies [54]. The statistical method was chosen here mainly for the consistency of the methodological framework when comparing catchments with different data availability.

2.5.4. DDF and IDF Development

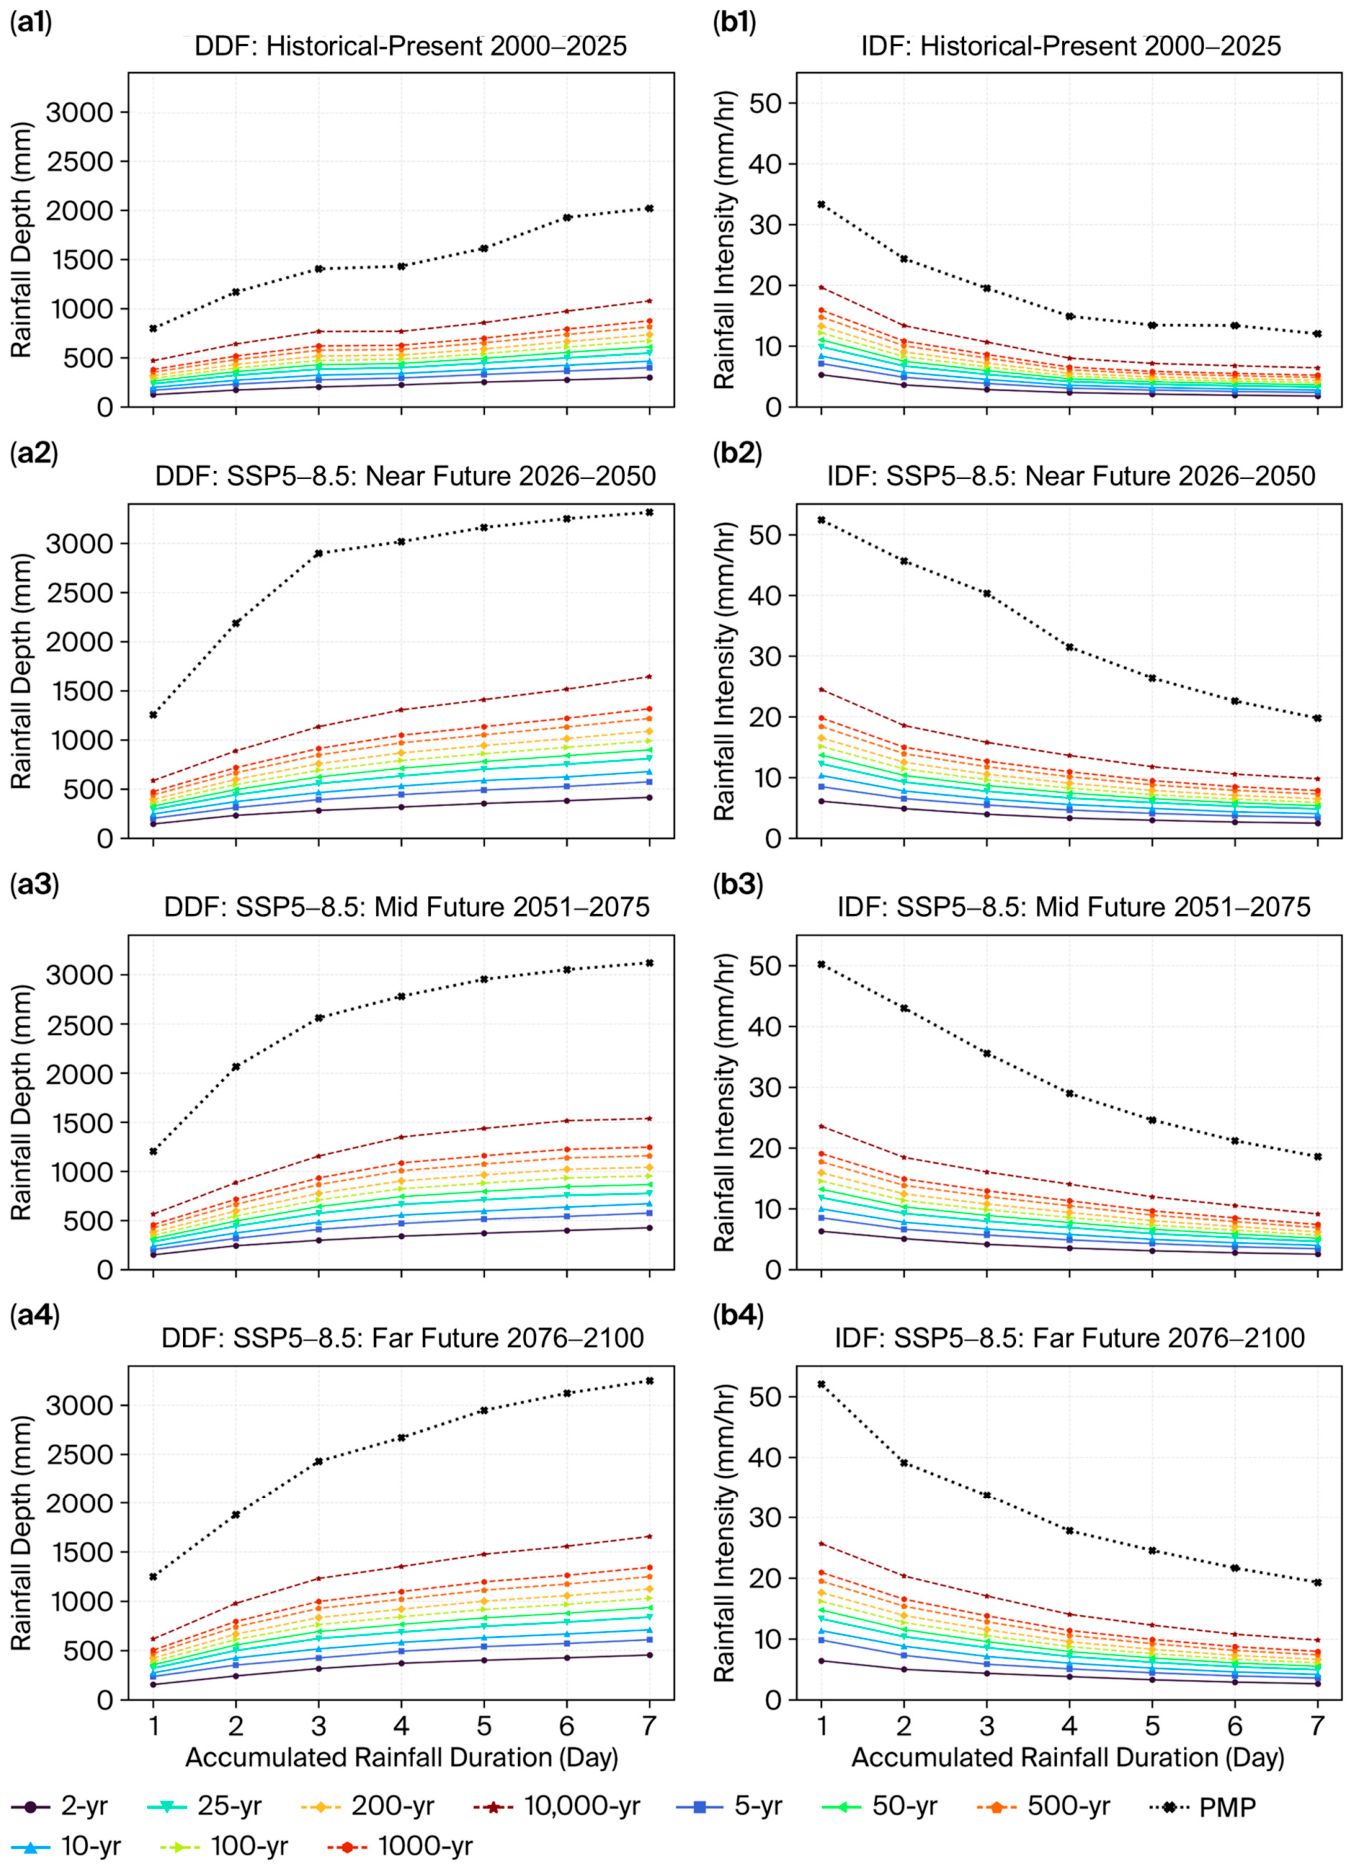
The return period and PMP results were developed into depth-duration-frequency (DDF) curves, relating rainfall depth, duration, and return period, and intensity-duration-frequency (IDF) curves, relating rainfall intensity, duration, and return period, in which the intensity is obtained by dividing the accumulated rainfall depth by the accumulation duration. The DDF curves are the main table and graph for defining the accumulated rainfall values in design flood analysis [58], while the IDF is used to check the rainfall intensity and to compare the change characteristics of rainfall by duration. Developing both makes the results usable in hydrological engineering and for comparing the extreme rainfall characteristics among areas, as well as for constructing the design hyetograph in subsequent rainfall-runoff models [59].

2.5.5. ETCCDI-Based Extreme Indices and Trend Analysis

The analysis of rainfall and extreme rainfall trends used indices based on the concept of the ETCCDI [60], selecting only the indices related to rainfall that are suitable for assessing hydrological impacts, for a total of 11 indices, namely PRCPTOT, WetDays_R1mm, HeavyRainDays_R10mm, VeryHeavyRainDays_R20mm, CDD, CWD, Rx1day, Rx3day, Rx7day, R95pTOT, and R99pTOT. These indices make the assessment of climate change impacts more comprehensive than the design rainfall by return period [13,15], that is, they can systematically describe the changes in annual total rainfall, number of rainy days, number of heavy rainfall days, consecutive dry periods, consecutive wet periods, and rainfall in the high-percentile group. The definitions of the indices used in this study are shown in Table 3.
The trend of each index was analyzed by two combined methods. The first is linear trend analysis, which gives the slope per year, the slope per decade, the percent change per decade, and the coefficient of determination (R2). The second is the non-parametric Mann–Kendall test, which assesses the direction and significance of the trend and suits climate and hydrological data that may not be normally distributed [13,61]. In this test, the standardized test statistic (Z) is assessed from the sign sum (S) and its variance, as shown in Equation (10):
Z   = S     1 Var ( S ) ,   S   >   0   0 ,                           S   =   0 S   +   1 Var ( S ) ,   S   <   0  
where Z is the standardized test statistic, S is the Mann–Kendall sign sum calculated from the differences of the data pairs in chronological order, and Var(S) is the variance of S. The trend is interpreted as increasing when Z > 0 and decreasing when Z < 0, considered together with the p-value to assess statistical significance. The use of both linear regression and the Mann–Kendall test makes it possible to describe both the magnitude of the change and the statistical significance of the trend at the same time. The results of the trend analysis were considered together with the magnitude of the rainfall and the variability of the AMS in order to assess the risk of extreme rainfall in multiple dimensions, rather than considering the mean anomaly in a single dimension.

3. Results

3.1. Climate Model Ranking and Top-Ranked Ensemble

3.1.1. Overall Model Ranking and Score Comparison

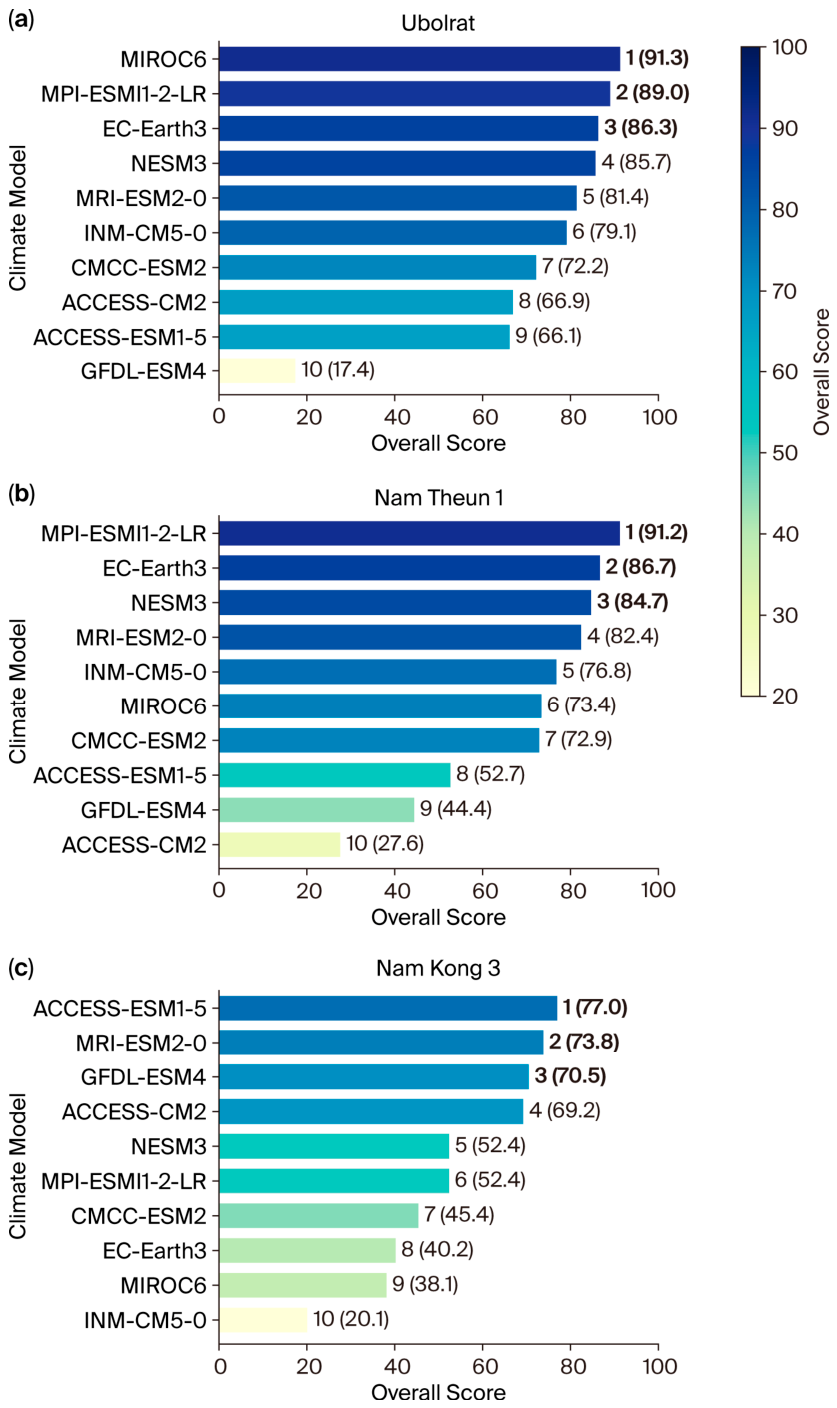
Climate model selection compared the areal rainfall from all 10 GCMs with the observed rainfall data during the historical overlap period between 2000–2014, using the eight indicators defined in Table 2, which emphasize extreme rainfall and the consistency of total rainfall. The overall score of each model was calculated as the weighted sum according to Equation (5), and the top-three models of each catchment were selected to construct the main dataset as the top-three ensemble median according to Equation (6). The selected models are shown in Table 4, and the overall scores of all models are shown in Figure 3.
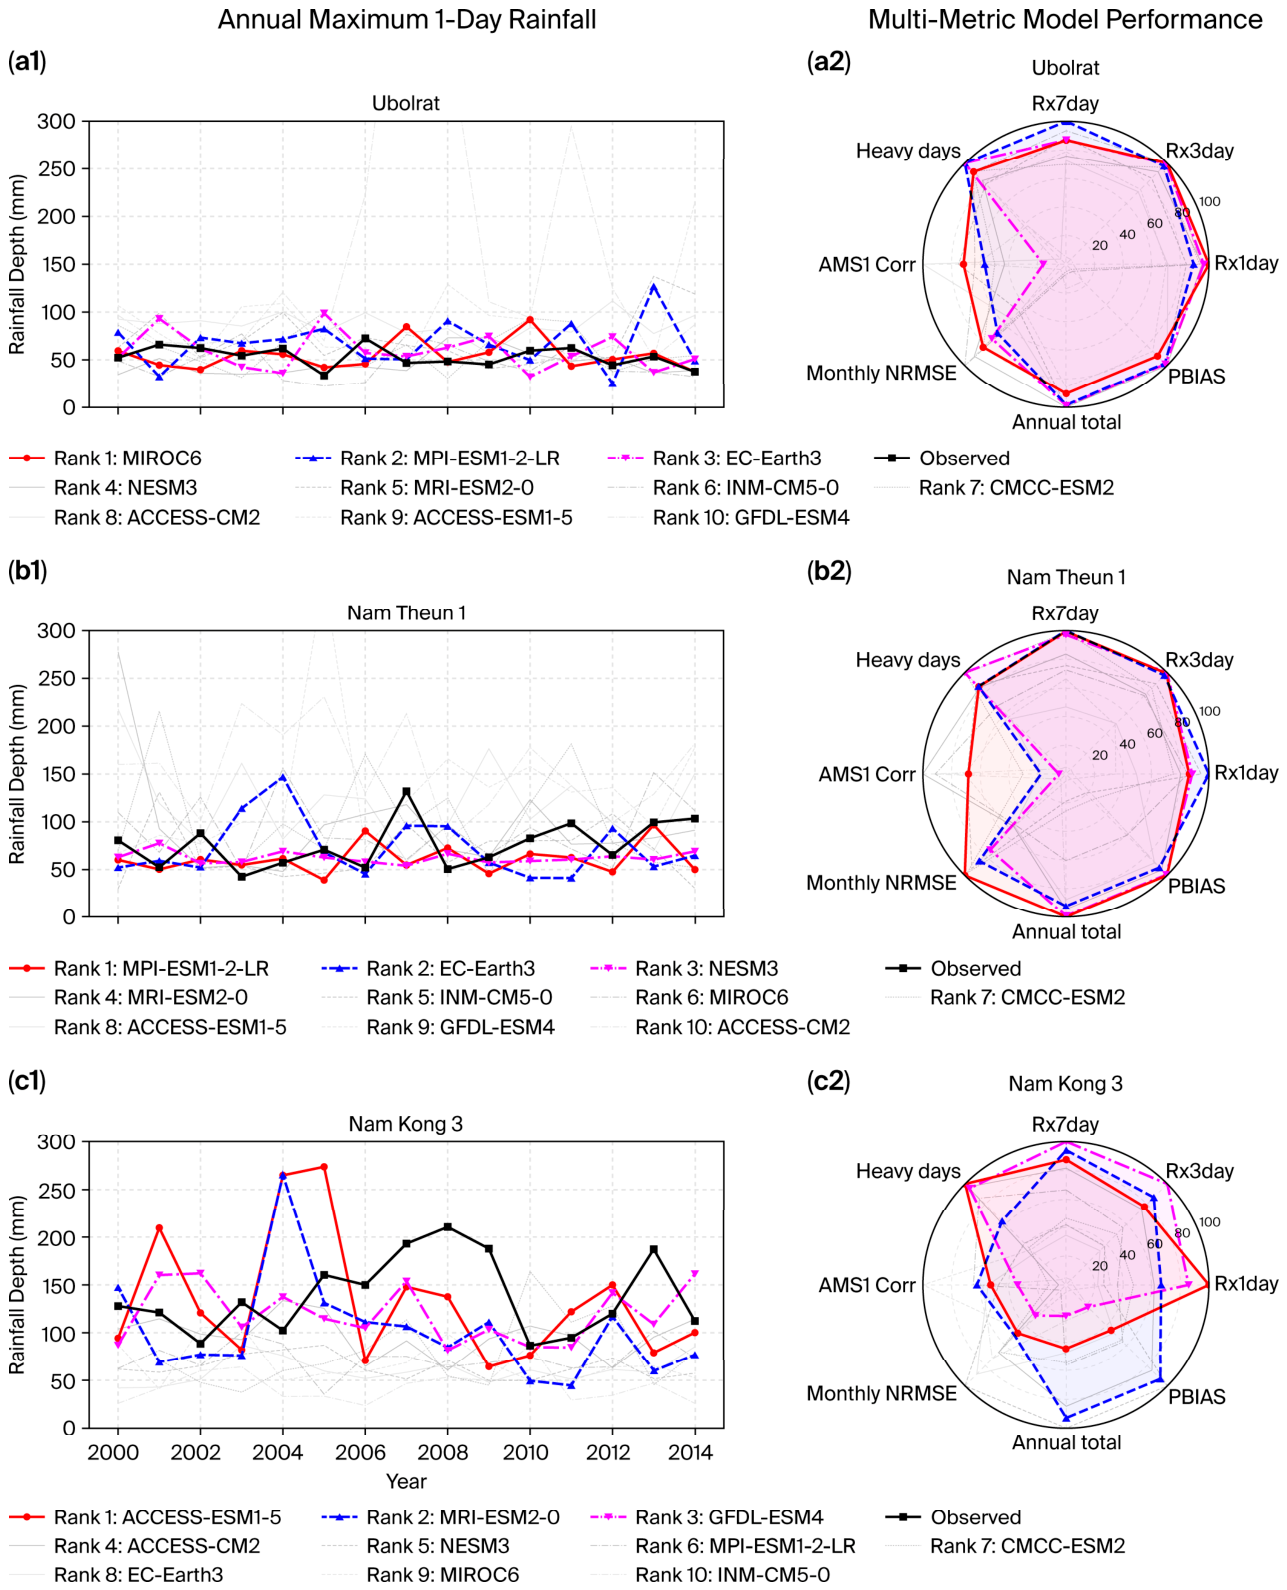
According to Figure 3, the top-three models of the UB are MIROC6, MPI-ESM1-2-LR, and EC-Earth3, with overall scores of 91.28, 89.02, and 86.33; the NT1 selects MPI-ESM1-2-LR, EC-Earth3, and NESM3, with scores of 91.17, 86.66, and 84.68; the NK3 selects ACCESS-ESM1-5, MRI-ESM2-0, and GFDL-ESM4, with scores of 77.05, 73.76, and 70.51, respectively. The scores of the NK3 are clearly lower than those of the first two areas, reflecting the higher uncertainty in simulating the extreme rainfall of a small catchment with only a single representative rainfall station, consistent with the data limitation described in Section 2.2.2. The gap in the overall score between the third-ranked and the subsequent model in each catchment is also clear, indicating that the order of the top-ranked models is stable against small adjustments of the weights. The weight sensitivity analysis (Table 5) confirmed the stability of this ranking: under Monte Carlo perturbation at ±20% and ±30%, the first-ranked model of the UB and the NT1 remained unchanged in all 10,000 runs at every level, while that of the NK3 remained unchanged in no fewer than 94.9% of the runs; the top-two members were fully stable in every catchment, and the mean Spearman rank correlation stayed at no lower than 0.989. Interchange was confined to the third position among models of near-equal score, with little effect on the ensemble median. The slightly lower stability of the NK3 accords with the higher uncertainty of a catchment represented by a single rainfall station, as described in Section 2.2.2.

3.1.2. Multimetric Performance and Ensemble Selection

Beyond the overall score, the annual maximum 1-day rainfall was also examined together with the multimetric performance (Figure 4), which shows that the top-three models of each dam perform more evenly across extreme rainfall, multi-day accumulated rainfall, and annual total rainfall than the others. For the UB, the observed mean Rx1day is 53.27 mm, whereas the top-three models give 54.47, 66.59, and 58.73 mm, with Rx1day_RE values of 2.26%, 25.00%, and 10.26%, respectively. GFDL-ESM4, by comparison, gives a mean as high as 161.05 mm, an error of 202.35%, and is therefore unsuitable here despite its high extreme rainfall values. This illustrates why Rx1day_RE carries the highest weight in Table 2 since models producing excessively high rainfall are screened out by the relative error indicator according to Equation (2).
For the NT1, the observed mean Rx1day is 75.86 mm, and the top-three models give 61.02, 71.90, and 62.61 mm, with Rx1day_RE values of 19.57%, 5.23%, and 17.47%, respectively. The spider plot also shows low errors for Rx3day and Rx7day, with Rx3day_RE of 3.54–6.46% and Rx7day_RE of 3.48–6.12%, suiting these models to multi-day accumulated rainfall, which governs the NT1 flood volume and reservoir inflow. For the NK3, the observed mean Rx1day is 138.27 mm; ACCESS-ESM1-5 gives 132.94 mm with a Rx1day_RE of only 3.86%, whereas GFDL-ESM4 is stronger in multi-day rainfall, with a Rx3day_RE of 1.44% and a Rx7day_RE of 4.18%. However, the AMS1_Corr of the top-ranked models is low, and some are negative, showing high uncertainty in simulating the annual variability sequence of the maximum rainfall. The top-three ensemble median according to Equation (6) therefore reduces the influence of a single model and gives more stable representative data before the return period, DDF/IDF, and PMP analysis.
In summary, Figure 3 and Figure 4 consistently show that the suitable models are catchment-specific. The UB and the NT1 have high overall scores and simulate extreme rainfall relatively evenly, whereas the NK3 has higher uncertainty, with its top-three models still outperforming the others in the key extreme rainfall indicators. This difference is consistent with studies indicating that GCM rainfall performance depends on the region and the characteristics of the area, so models should be evaluated and selected separately by area rather than using a single set for all areas [23,43]. This supports the top-three ensemble median as the main data for the design rainfall analysis below and confirms the catchment-specific ranking established in Section 2.4.2.

3.2. Five-Year Rainfall Anomaly Under SSP2–4.5 and SSP5–8.5

3.2.1. Anomaly of Maximum 1-Day Rainfall

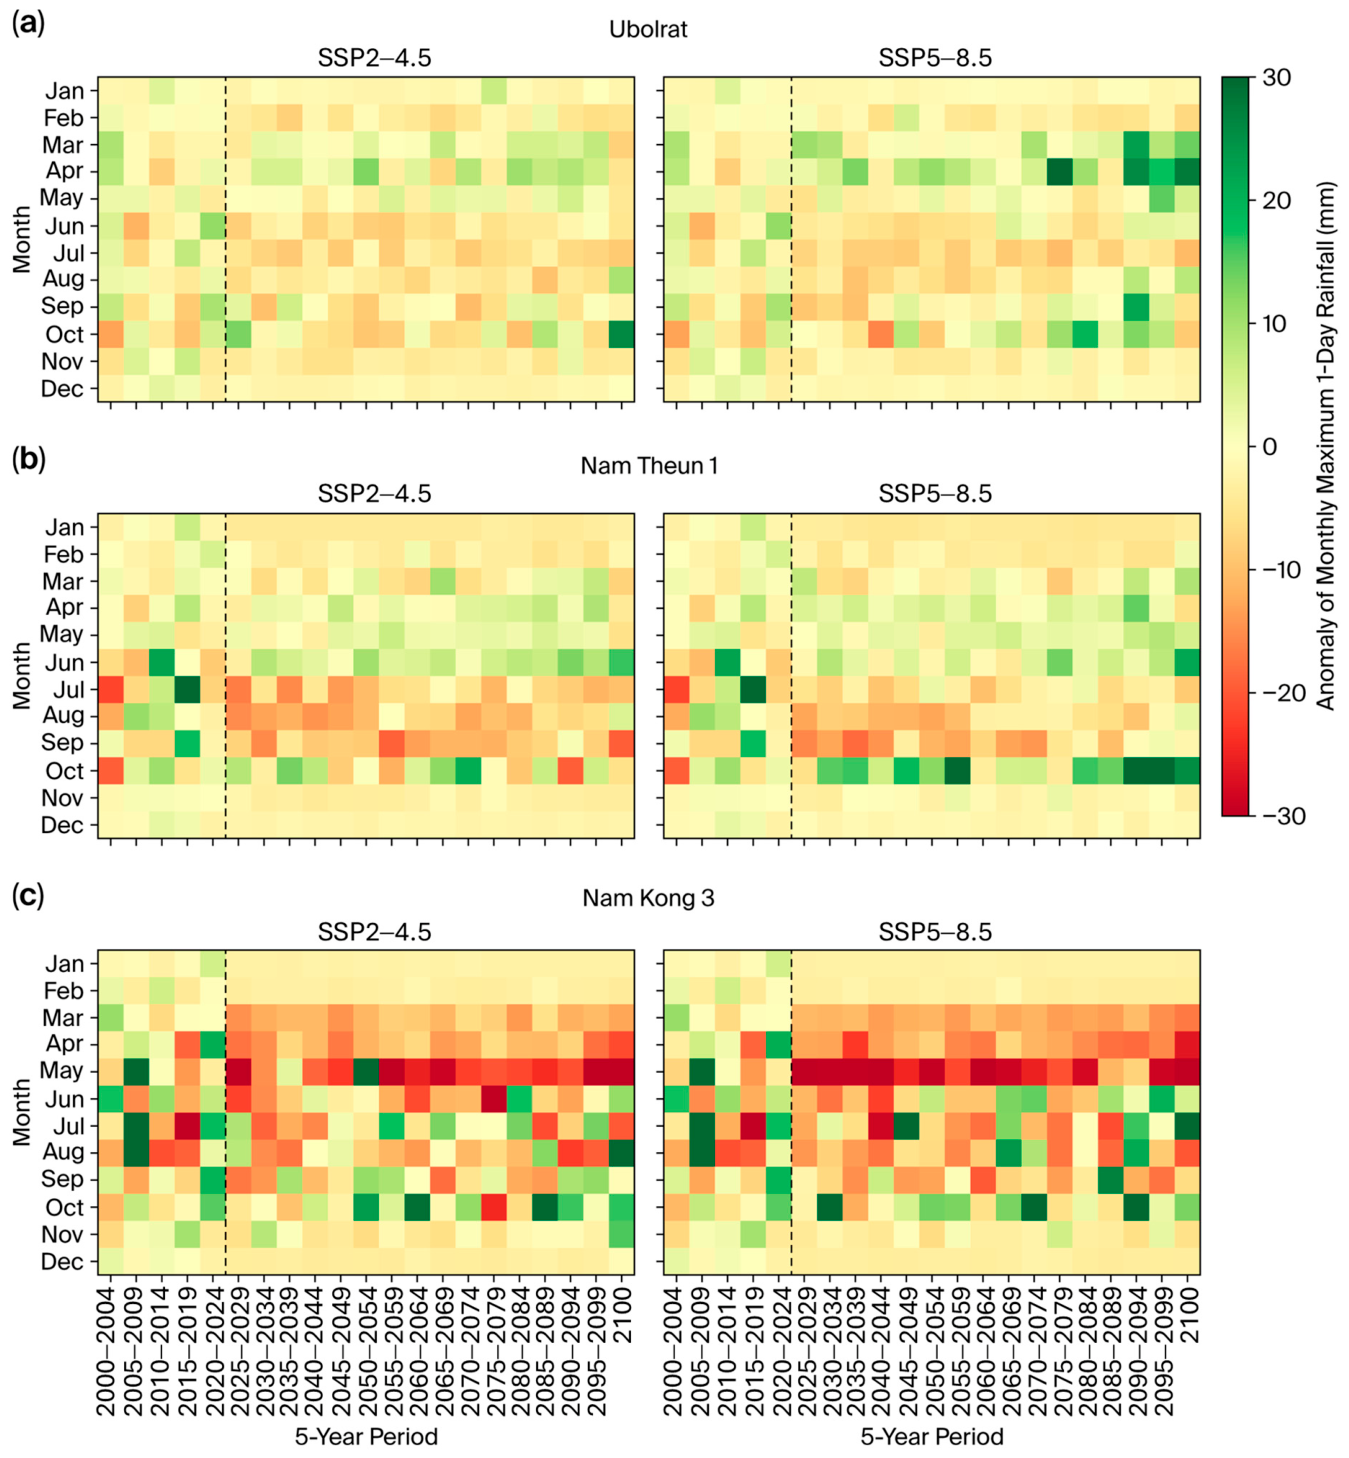
Figure 5 shows clearly different changes in the maximum 1-day rainfall among the catchments. For the UB under SSP5–8.5, the positive anomaly becomes more pronounced toward the end of the century, particularly in the early and late rainy season; the Far Future Rx1day increases from 57.44 mm in the baseline period to 84.33 mm, a rise of 26.89 mm or 46.82%, whereas under SSP2–4.5, it increases by 28.62%, indicating that daily extreme rainfall at the UB tends to increase markedly under the high greenhouse gas emission scenario. Similarly, for the NT1, the 1-day signal under SSP5–8.5 is more pronounced in the late than the mid rainy season, particularly in the mid-to-late future, with the Far Future Rx1day increasing from 80.08 mm to 94.87 mm, a rise of 14.79 mm or 18.47%, whereas under SSP2–4.5, it decreases by 5.60%; SSP5–8.5, therefore, provides a clearer risk framework for daily extreme rainfall at the NT1 than SSP2–4.5. In contrast, the NK3 differs from the other two areas, with Figure 5 showing a negative anomaly in several months of the rainy season and the Far Future Rx1day under SSP5–8.5 decreasing from 131.85 mm to 104.86 mm, or 20.47% below the baseline period. However, this describes only the period-averaged maximum 1-day rainfall and does not mean that the risk of the NK3 decreases entirely because this area has very high design rainfall magnitudes in the DDF/IDF, and the annual maximum series shows an increasing trend of multi-day accumulated rainfall under SSP5–8.5.

3.2.2. Anomaly of Maximum 7-Day Rainfall

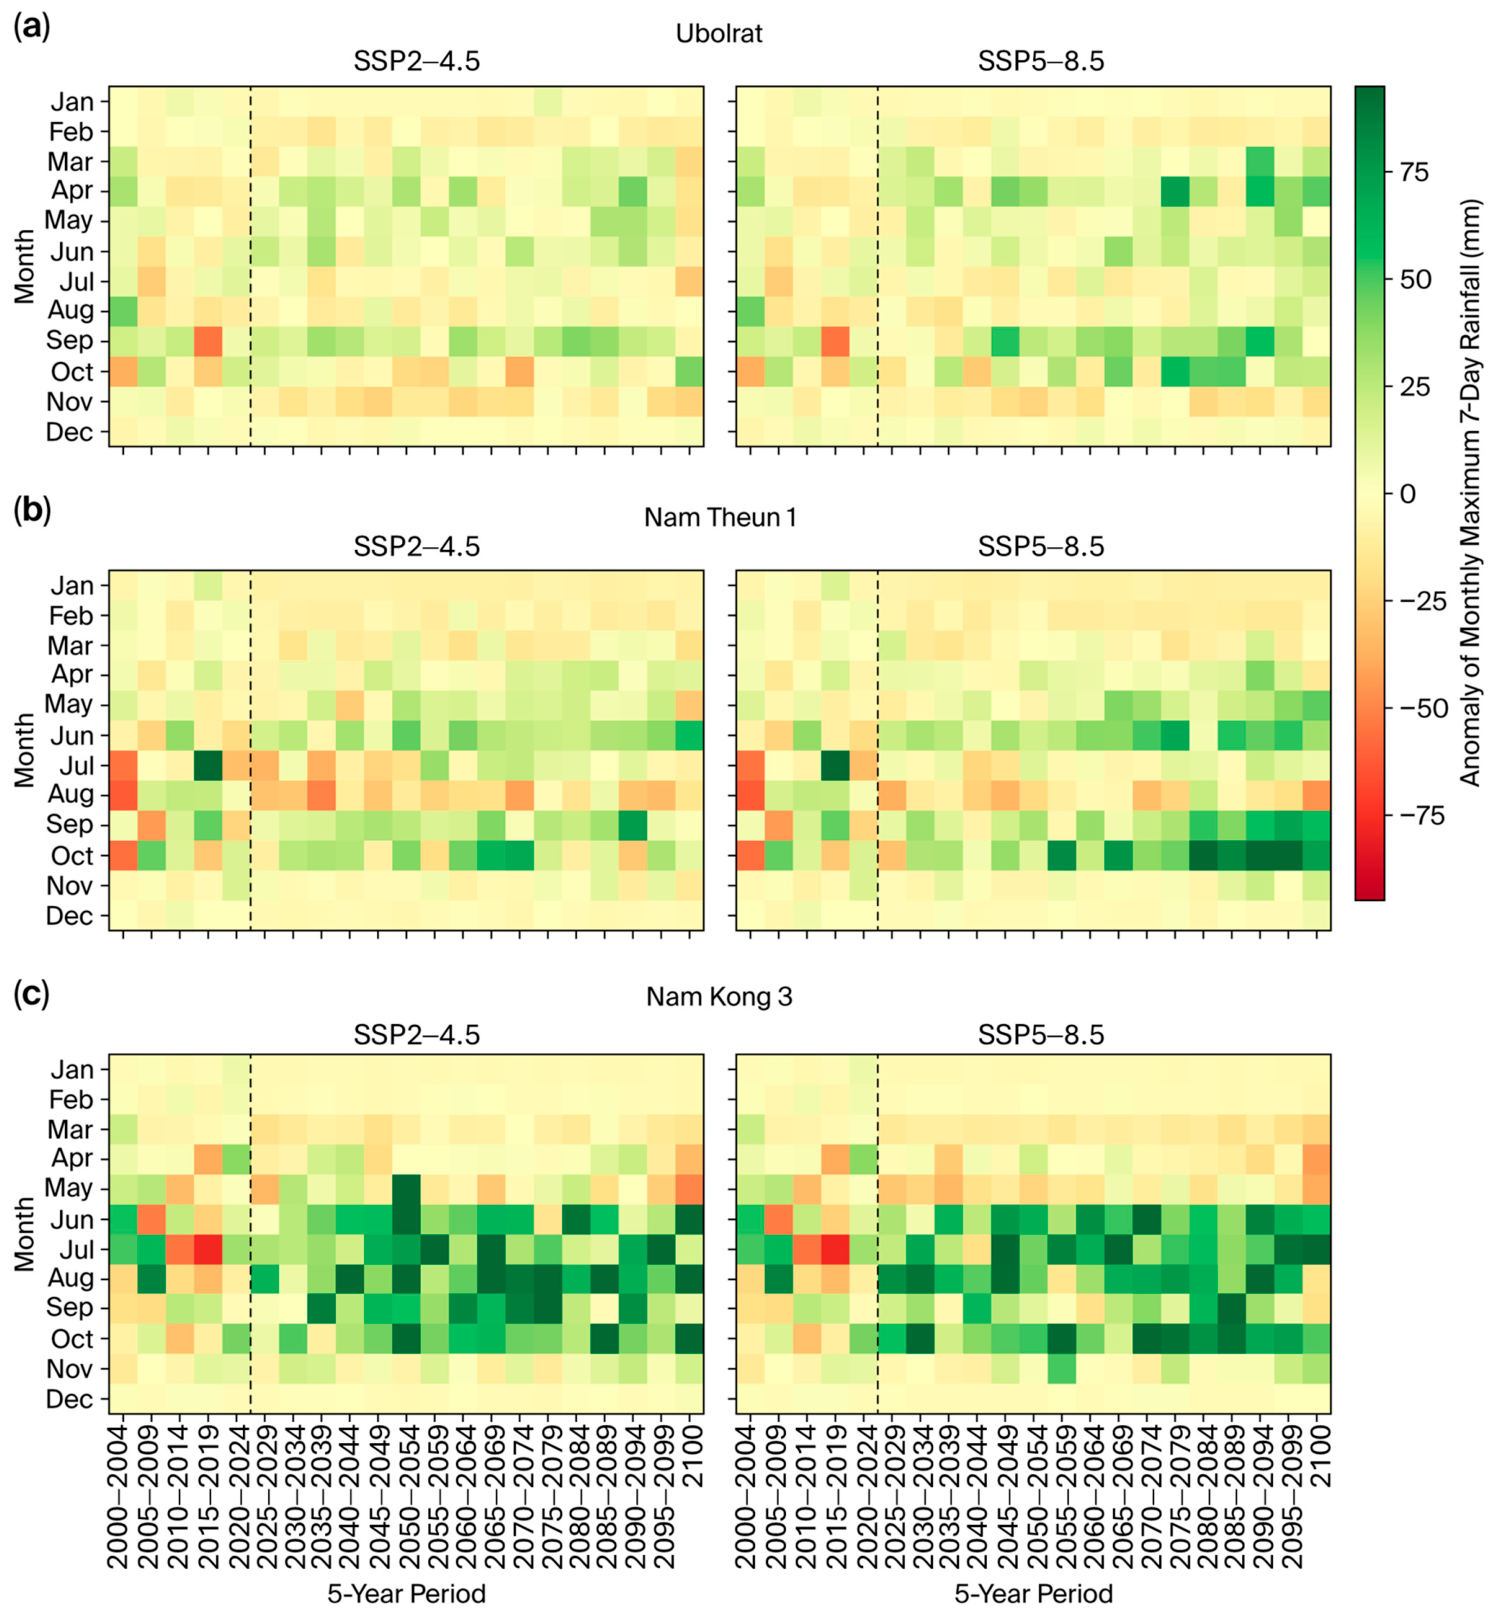
The 7-day accumulated rainfall often conveys clearer hydrological information than the 1-day rainfall because it relates directly to the flood volume, the accumulated moisture in the catchment, and the reservoir inflow volume. As depicted in Figure 6, the Far Future Rx7day of the UB under SSP5–8.5 increases from 177.12 mm to 235.24 mm, a rise of 58.12 mm or 32.81%, whereas under SSP2–4.5, it increases by 19.72%; this positive signal therefore confirms that multi-day accumulated rainfall plays an important role in the future flood volume risk of the UB. Similarly, the NT1 exhibits the most pronounced increase in the study group, with the Far Future Rx7day under SSP5–8.5 rising from 255.86 mm to 334.60 mm, an increase of 78.74 mm or 30.77%, whereas under SSP2–4.5, it increases by only 4.00%. This agrees with the positive anomaly band during the late rainy season, particularly from the Mid Future to the Far Future, indicating that multi-day accumulated rainfall, rather than short-duration extreme rainfall alone, is the main variable explaining the risk of the NT1.
In contrast, the Far Future Rx7day of the NK3 under SSP5–8.5 changes from 314.34 mm to 313.19 mm, a slight decrease of 0.37% in period-averaged terms. However, Figure 6 clearly reveals a marked variability of the anomaly among months and periods, and the following section identifies very high design rainfall and PMP values for the NK3. The risk of this area is therefore not reflected by the period-averaged anomaly alone, but rather arises from the combination of high magnitude and the pronounced variability of extreme rainfall events.

3.2.3. Scenario Comparison and Implications

Read together, Figure 5 and Figure 6 establish SSP5–8.5 as the scenario that frames extreme rainfall risk more prominently than SSP2–4.5, particularly for the UB and the NT1, where both Rx1day and Rx7day increase clearly in the Far Future. This tendency of the high emission scenario to yield a more pronounced signal of increasing extreme rainfall than the intermediate scenario accords with the CMIP6 projections of Tang et al. [62] for the Indochina Peninsula, which document the same direction. The NK3, by contrast, follows an area-specific pattern, in which the period-averaged anomaly does not increase as prominently as in the first two dams, but rather reflects high-magnitude extreme rainfall values together with an increasing long-term trend of the annual maximum 7-day rainfall. This area-specific behaviour of the NK3 departs from the broadly uniform increase reported in regional-scale assessments. The difference is expected since the dynamic component of extreme rainfall change generates strong spatial heterogeneity across Southeast Asia [4], and a dam-catchment analysis preserves local signals that regional averaging smooths out. These contrasting patterns explain why the analysis of the DDF/IDF and the annual maximum rainfall in the following sections treats SSP5–8.5 as the main case, so as to characterize the high-risk framework of design rainfall and multi-day accumulated rainfall for the assessment of flooding and dam safety.

3.3. Design Rainfall Under SSP5–8.5: DDF and IDF Results

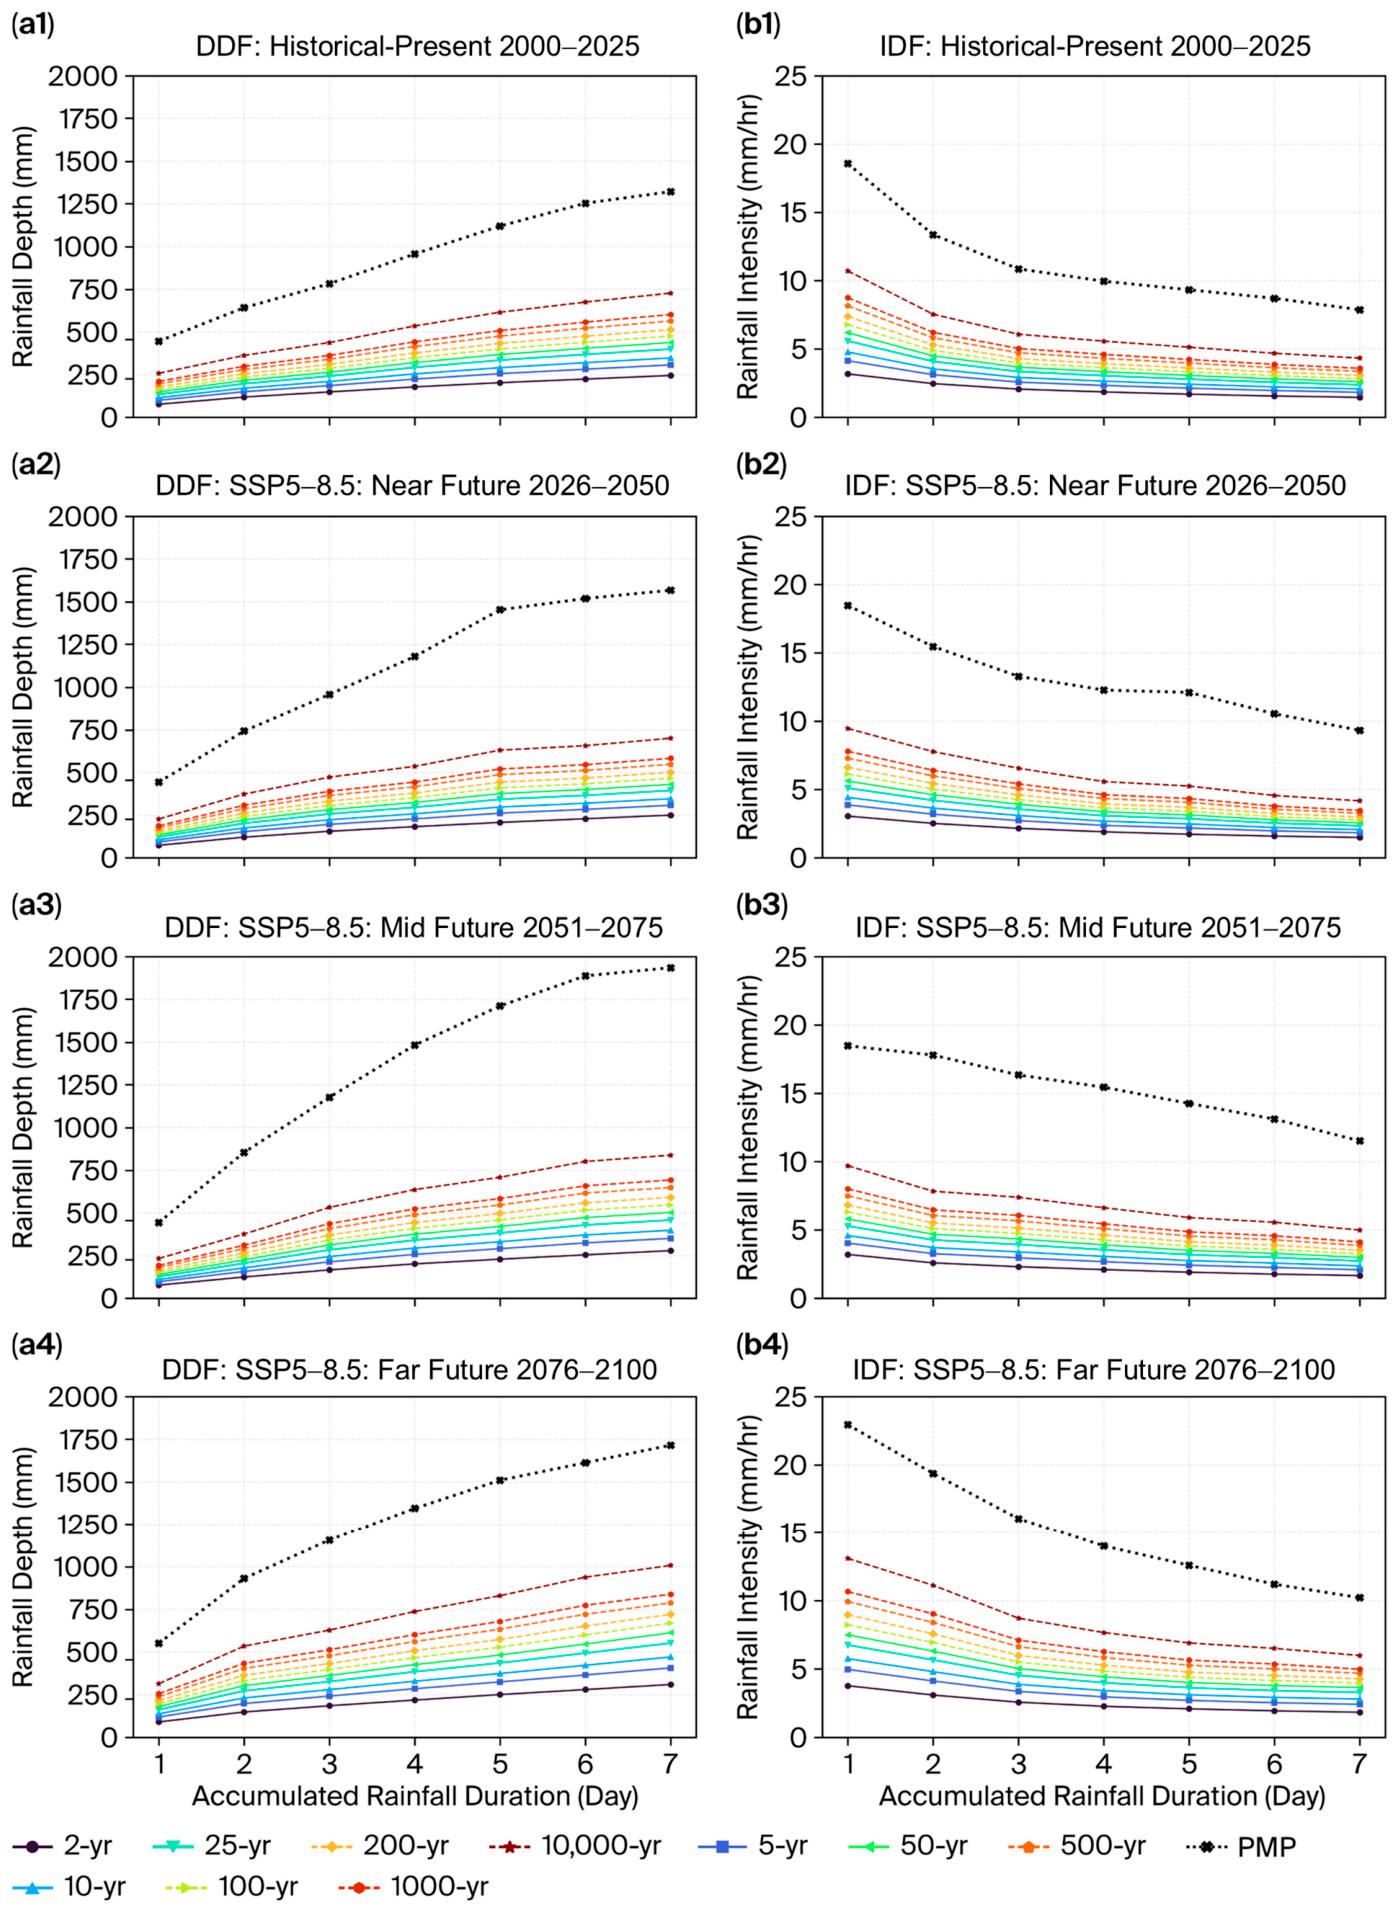
The anomaly analysis in Section 3.2 identifies SSP5–8.5 as the scenario that reflects the high-risk framework of extreme rainfall more clearly than SSP2–4.5, particularly for the UB and the NT1; for the NK3, the period-averaged anomaly increases less prominently, yet the design rainfall values are very high, and the 7-day accumulated rainfall in the annual maximum series follows an increasing trend under SSP5–8.5. This section, therefore, presents the DDF and IDF results under SSP5–8.5, describing the design rainfall within the high-risk framework of each catchment. The results appear in three catchment-specific figures, each combining DDF and IDF graphs so that the accumulated rainfall depth and the rainfall intensity can be read together. Design rainfall by return period follows Equation (8), and PMP follows Equation (9), presented alongside the DDF/IDF and discussed as part of the extreme rainfall framework for the assessment of PMF and dam safety.

3.3.1. Design Rainfall and PMP for the UB

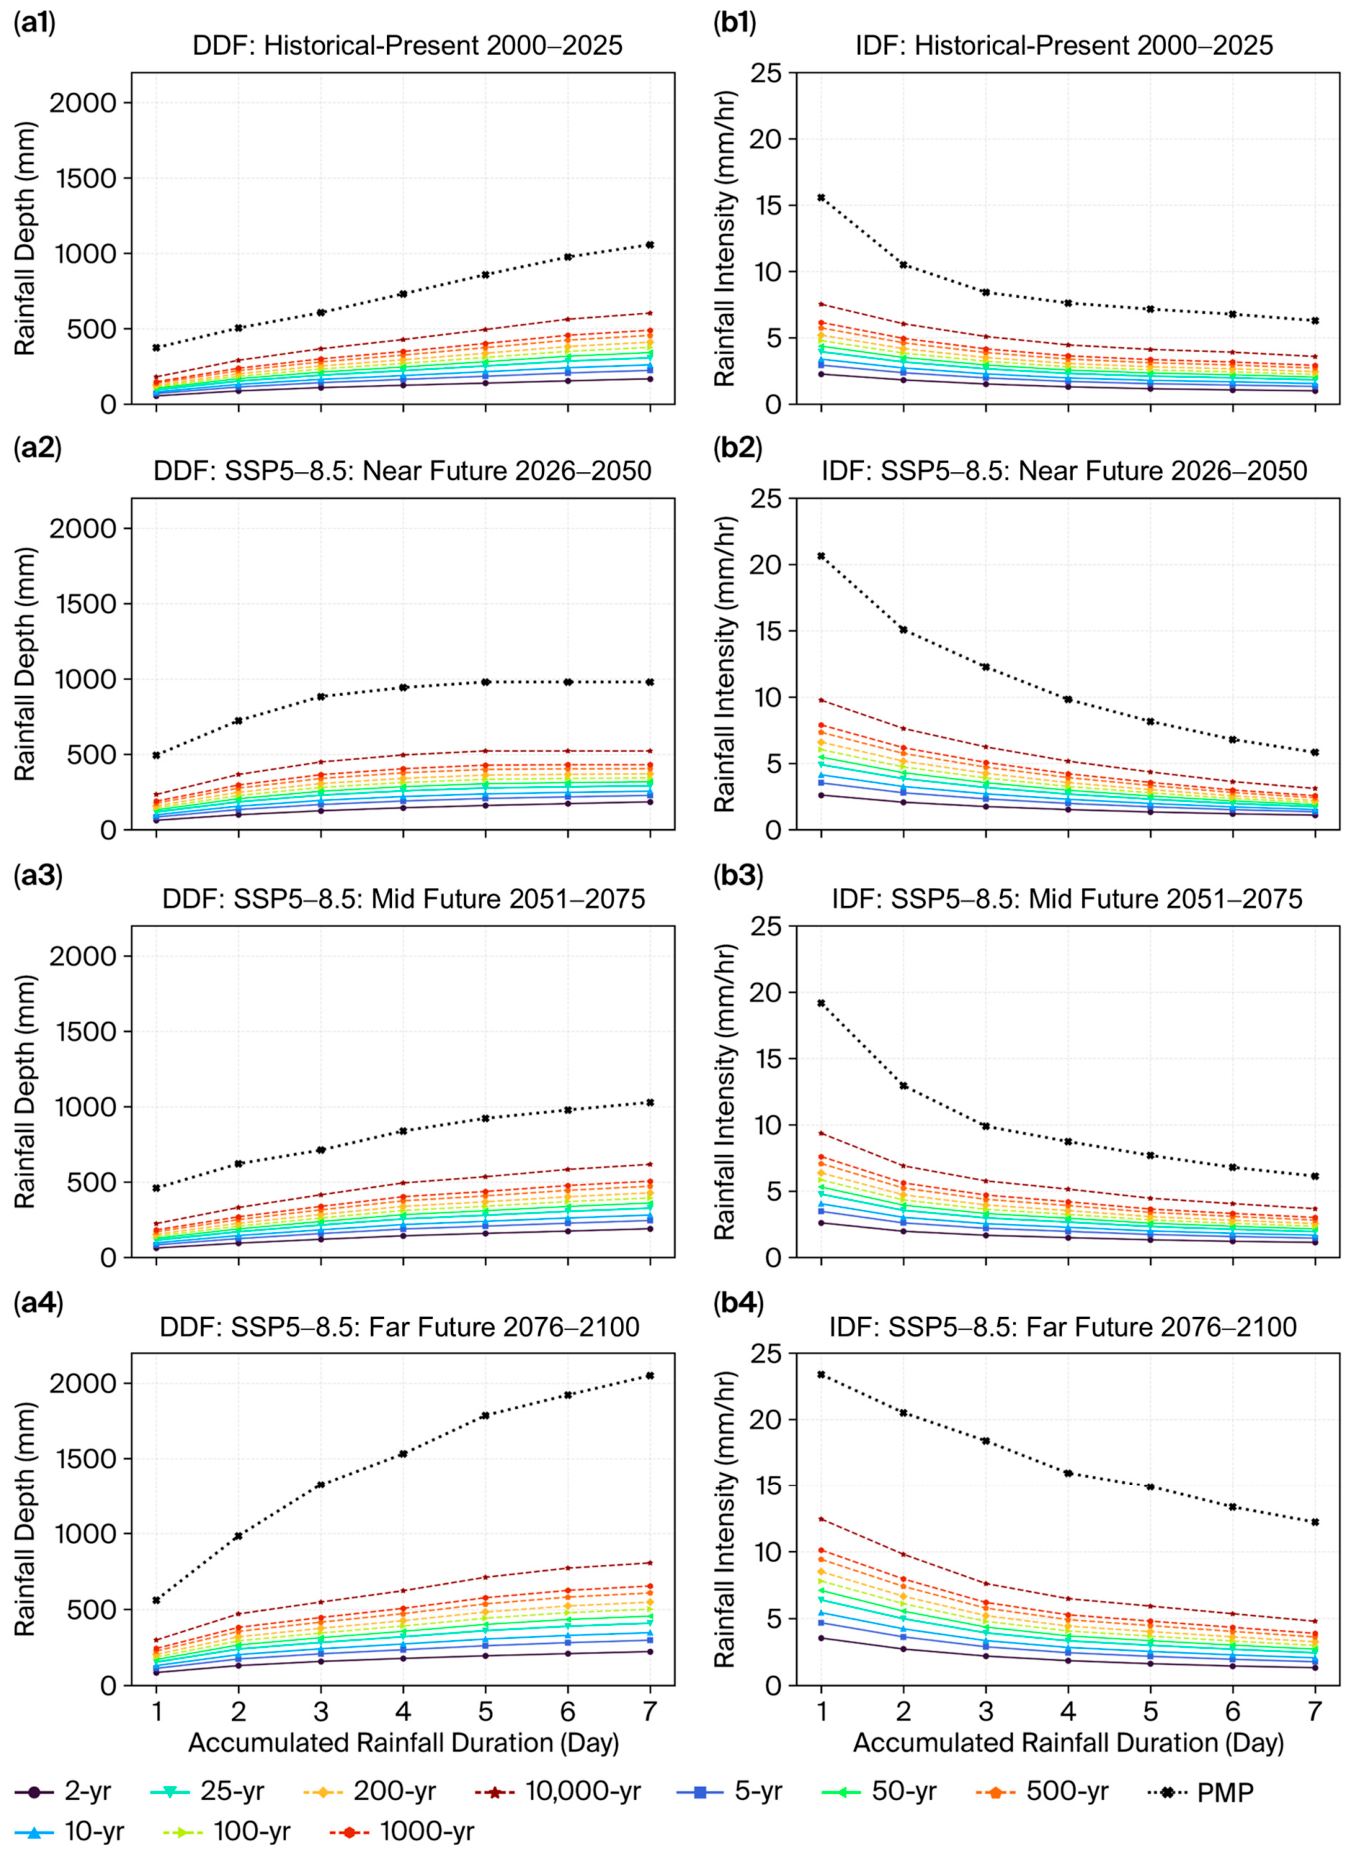
The UB exhibits the clearest increase in design rainfall during the Far Future (Figure 7), particularly for short-duration rainfall and multi-day accumulated rainfall in the medium-to-high return period group. The 100-year 1-day rainfall increases from 114.74 mm in the Historical–Present period to 187.27 mm in the Far Future, a rise of 63.20%, whereas the 100-year 7-day rainfall increases from 376.02 mm to 501.92 mm, or 33.48%. This mirrors the Rx1day and Rx7day anomalies in Section 3.2, and an increase in short-duration design rainfall of this magnitude accords with studies reporting the upward shift of the IDF curves under climate change in monsoon regions [63], arising from the increased capacity of the atmosphere to hold water vapor with rising temperature. Compared with the ensemble-median changes reported by Ge et al. [15] for Southeast Asia under SSP5–8.5 toward the end of the century, the increase in the 100-year 1-day rainfall of the UB stands clearly above the regional central estimate. This difference is expected: values at high return periods lie in the tail of the distribution, which intensifies more strongly than central-tendency indices, while catchment-scale assessment combined with extreme-focused model selection yields a stronger local signal than the regional average. The upward shift of the DDF curves emerges in both general design level and very rare events: the 10-year 1-day rainfall increases from 81.15 mm to 130.52 mm, the 1000-year 7-day rainfall from 489.67 mm to 654.06 mm, and the 7-day PMP from 1057.66 mm in the baseline period to 2051.04 mm, a rise of 93.92% that marks a large increase in the upper bound of extreme rainfall toward the end of the century.
In terms of the IDF, the 100-year 1-day rainfall intensity increases from 4.78 to 7.80 mm per hour and the 100-year 7-day intensity from 2.24 to 2.99 mm per hour. The short-duration IDF increase reflects the risk to the peak response of the catchment, whereas the DDF and PMP increases over the 7-day duration reflect the risk to the flood volume and reservoir inflow. The UB is therefore prominent in both short-duration extreme rainfall and multi-day accumulated rainfall, with the percentage increase of the 1-day rainfall the most prominent.

3.3.2. Design Rainfall and PMP for the NT1

Multi-day accumulated rainfall, rather than 1-day rainfall, dominates the change in design rainfall for the NT1 (Figure 8). The 100-year 1-day rainfall increases from 162.65 mm in the Historical–Present period to 197.57 mm in the Far Future, a rise of 21.47%, whereas the 100-year 7-day rainfall increases from 475.34 mm to 668.51 mm, or 40.64%, identifying multi-day continuous rainfall events as the main component of the risk profile for the NT1. By period, the 100-year 7-day rainfall reaches 465.30, 546.41, and 668.51 mm in the Near, Mid, and Far Future, respectively, exceeding the baseline period clearly from the Mid Future onward. For very rare events, the 1000-year 7-day rainfall increases from 601.19 mm in the baseline period to 837.31 mm, confirming that the increase in multi-day accumulated rainfall extends continuously from the design level to the high return period.
The 7-day PMP increases from 1320.96 mm in the baseline period to 1566.94, 1935.01, and 1715.45 mm in the Near, Mid, and Far Future, respectively, peaking in the Mid Future even though the 100-year value peaks in the Far Future. This behaviour arises because the PMP is sensitive to the mean and standard deviation of the AMS in each period, following the structure of Equation (9), and need not peak in the same period as the 100-year return period. In terms of the IDF, the 100-year 1-day rainfall intensity increases from 6.78 to 8.23 mm per hour in the Far Future, whereas the 100-year 7-day intensity increases from 2.83 to 3.98 mm per hour. The parallel increase in DDF and IDF at the 7-day duration ties to the rising Rx7day trend in Section 3.4 and confirms that the main risk of the NT1 lies in multi-day accumulated rainfall, which relates directly to flood volume, reservoir inflow, and PMF-related assessment.

3.3.3. Design Rainfall and PMP for the NK3

Unlike the UB and the NT1, the NK3 combines a very high design rainfall magnitude from the Historical–Present period onward with little increase in the 1-day rainfall relative to the baseline period (Figure 9). The 100-year 1-day rainfall decreases from 292.33 mm in the baseline period to 280.76 mm in the Far Future, or 3.96%, whereas the 100-year 7-day rainfall increases from 667.71 mm to 742.60 mm, or 11.22%, marking an upward shift in multi-day accumulated rainfall. At high return periods, the 1000-year 7-day rainfall climbs from 869.78 mm in the Historical–Present period to 956.65, 928.92, and 968.85 mm in the Near, Mid, and Far Future, respectively, the Far Future clearly exceeding the baseline. The 7-day PMP increases from 1997.86 mm to 2656.48, 2453.24, and 2342.38 mm over the same periods, peaking in the Near Future, which indicates wide variation in extreme rainfall events and a PMP strongly controlled by the variance of the AMS in each period. This peak in the Near Future rather than the Far Future must be read together with the limitation of the Hershfield method, whose PMP is sensitive to the variance of the AMS in an area with only a single representative station [54,59]. Such a temporal ordering of the PMP may therefore differ from studies based on dense station networks or gridded data, in which the variance of the AMS is spatially averaged and the PMP behaves more stably across periods; the difference is an expected outcome of a single-station catchment rather than an anomaly of the method.
For the IDF, the NK3 registers the highest rainfall intensities in the study group, with the 100-year 1-day intensity at 12.18 mm per hour in the baseline period and 11.70 mm per hour in the Far Future, whereas the 100-year 7-day intensity increases from 3.97 to 4.42 mm per hour. Although the 1-day rainfall does not increase from the baseline period, the rainfall intensity and PMP values remain very high in engineering terms, so that the NK3 faces risk from high magnitude, the variability of extreme events, and an increasing trend of multi-day accumulated rainfall together. Comparing Figure 7, Figure 8 and Figure 9, each dam presents a clearly different risk profile: the UB records the largest percentage increase in the 100-year 1-day rainfall (63.20%, Far Future); the NT1 the largest increase in the 100-year 7-day rainfall (40.64%), consistent with the multi-day rainfall trend in Section 3.4; and the NK3 the highest design rainfall and PMP magnitudes, with a 100-year 1-day rainfall of 280.76 mm and a 7-day PMP of 2342.38 mm in the Far Future, alongside a long-term increasing trend of the annual maximum 7-day rainfall.
In summary, the DDF and IDF results under SSP5–8.5 indicate that interpreting design rainfall requires the return period, duration, PMP, future period, and specific characteristics of the catchment to be considered jointly. Low-to-moderate return periods frame the design rainfall for more frequent events, whereas high return periods and the PMP frame very rare events related to dam safety. Hydrologically, the 1-day rainfall relates to the peak response, whereas the 7-day rainfall relates to flood volume, reservoir inflow, and PMF-related assessment. The difference among the three dams, therefore, confirms that design rainfall under climate change cannot use a single value for all catchments, but rather must be analyzed separately according to the rainfall characteristics and response of each dam.

3.4. Annual Maximum Rainfall and ETCCDI-Based Trends Under SSP5–8.5

3.4.1. Annual Maximum Rainfall Trends by Catchment

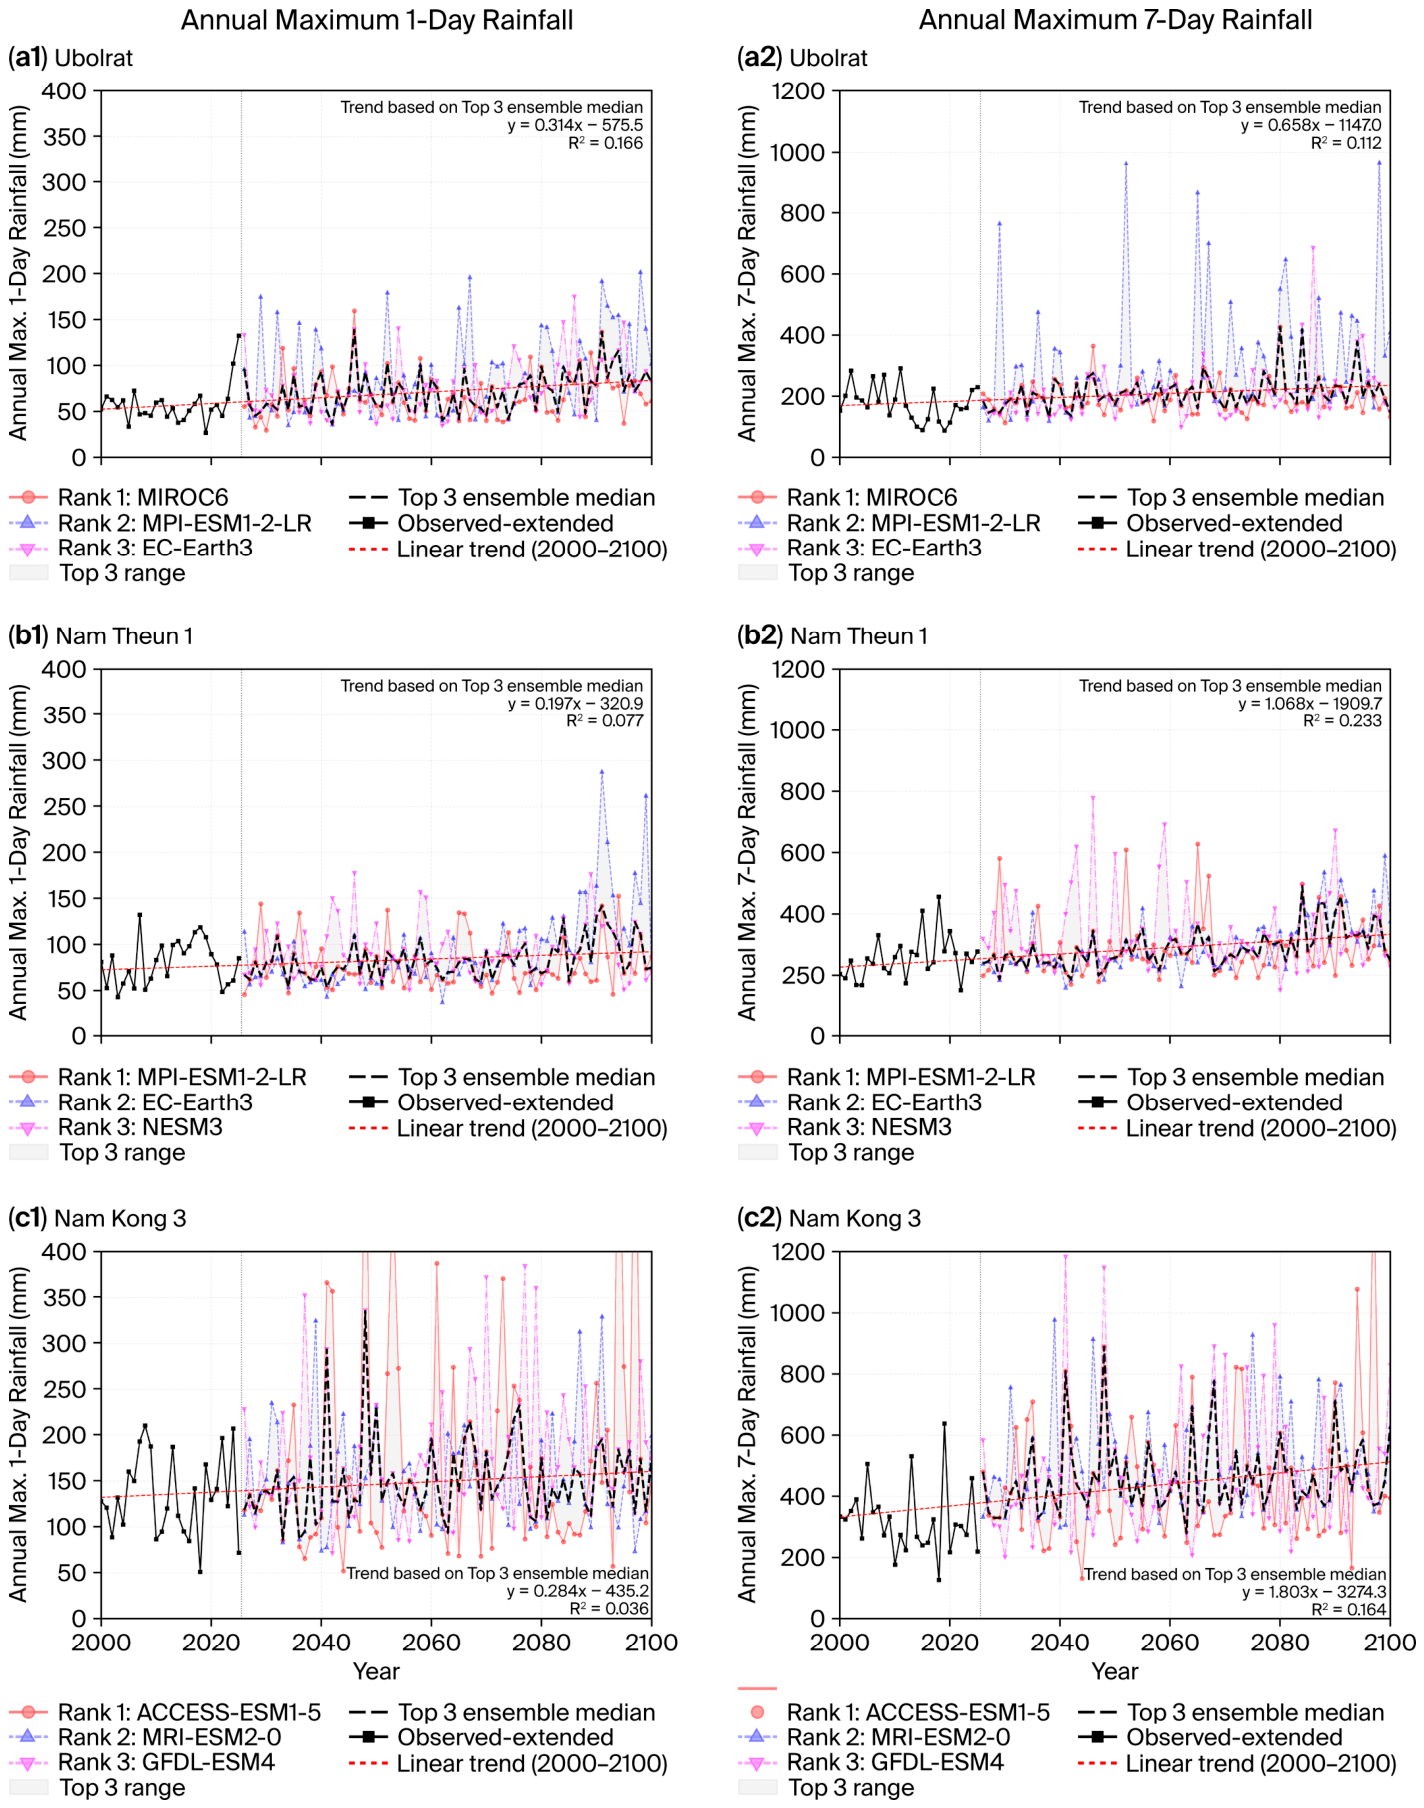
At the UB, the annual maximum rainfall trends upward for both the 1-day and 7-day durations (Figure 10). The 1-day rainfall yields a slope of 3.14 mm per decade with R2 = 0.166, whereas the 7-day rainfall yields 6.58 mm per decade with R2 = 0.112. Although these R2 values are modest, reflecting the high interannual variability of extreme rainfall data, the direction of the trend lines aligns with the DDF/IDF results in Figure 7 for the 100-year 1-day rainfall and the 7-day PMP in the Far Future, so the UB faces increasing risk from both short-duration extreme rainfall and multi-day accumulated rainfall. For the NT1, the 7-day trend is clearly more prominent than the 1-day trend: the 1-day rainfall yields a slope of 1.97 mm per decade with R2 = 0.08, whereas the 7-day rainfall reaches 10.68 mm per decade with R2 = 0.23, the highest R2 among the trends considered. Multi-day accumulated rainfall therefore rises more consistently than short-duration extreme rainfall, matching the 100-year 7-day increase reported in Figure 8, so the risk profile of the NT1 is governed prominently by multi-day continuous rainfall, which directly affects flood volume and reservoir inflow.

3.4.2. Significant ETCCDI-Based Trends

The ETCCDI indices that show significant trends under SSP5–8.5 are summarized in Table 6, together with the trend direction and the engineering interpretation.
In every catchment, the maximum 7-day rainfall carries a greater slope than the maximum 1-day rainfall (Table 6), most notably the NK3, whose Rx7day slope of 18.03 mm per decade is the highest recorded, even though its R2 falls below that of the NT1. Read together with the very high design rainfall and PMP values of the NK3 in Figure 9, this bears significant engineering implications for flood volume, reservoir inflow, and PMF-related assessment. The consistently steeper slope of Rx7day relative to Rx1day is a finding of the present analysis itself. When set against the observed-record analysis of Liu et al. [64], which documented pronounced spatial heterogeneity of extreme precipitation change within the Mekong Basin, with increases concentrated in the lower basin and declines in some areas, the catchment-to-catchment differences in trend magnitude found here indicate that such spatial heterogeneity persists under the projected climate, reinforcing the need for catchment-specific assessment.
Overall, Figure 10 and Table 6 establish that interpreting extreme rainfall under SSP5–8.5 requires magnitude, trend, and duration to be considered together. The period anomaly alone may not fully explain the risk of every area, particularly the NK3, whose risk profile is controlled by the high level of severe rainfall, the variability of the annual maximum, and the increasing trend of the 7-day accumulated rainfall, whereas the UB and the NT1 display greater consistency among the anomaly, the DDF/IDF, and the annual maximum trends. The 1-day rainfall, therefore, suits the peak response, whereas the 7-day rainfall plays an important role in flood volume, reservoir inflow, and PMF assessment in the dam catchments.

3.5. Synthesis

3.5.1. Cross-Catchment Risk Profile Differentiation

Although the three dam catchments lie under the same monsoon system and were analyzed with the same methodological framework, their design rainfall risk profiles differ systematically, as summarized in Table 7 across five dimensions: the level of short-duration design rainfall, the level of multi-day accumulated design rainfall, the PMP level, the interannual variability, and the long-term trend. The dominant risk driver of each catchment differs systematically. The UB is driven by short-duration extreme rainfall, its 100-year 1-day rainfall increasing by 63.20% in the Far Future, the largest percentage increase in the study group and one tied to the peak response of the catchment. The NT1 is driven by multi-day accumulated rainfall, which rises most prominently and consistently, with the 100-year 7-day rainfall increasing by 40.64% and the Rx7day trend carrying the highest R2 (0.233), a mark of directional consistency. The NK3, by contrast, is driven not by the percentage increase in design rainfall, but rather by the highest baseline magnitude (7-day PMP of 2342 mm), the high variability, and the steepest Rx7day trend (18.03 mm per decade). These differences are rooted in the physical characteristics of the catchments, including the catchment area, the topography, and the hydrological response, and accord with the principle that a catchment responds to extreme rainfall according to its size and specific characteristics [2,6]. They provide empirical evidence that assessing design rainfall at the dam catchment scale yields more specific and applicable information than assessment at the large-basin scale, which averages over a wide area. Overall, the direction of the changes found here agrees with regional assessments of the Mekong Basin and the monsoon region [62,64], whereas the catchment-level magnitudes stand above or depart from the regional central estimates [15]. These departures are attributable to the catchment scale, the tail of the distribution at high return periods, and the extreme-focused model selection, and they constitute precisely the information that the multidimensional, catchment-specific framework is designed to preserve for dam safety assessment.

3.5.2. Multidimensional Nature of Extreme Rainfall Risk

A central point of this study is that assessing extreme rainfall risk under climate change requires multiple dimensions to be considered together, rather than a single indicator, and the NK3 offers the clearest example. Judging from the period-averaged anomaly of the maximum 1-day rainfall alone, the NK3 decreases by 20.47% in the Far Future, which could be read as a decreasing risk. Set against the risk dimensions in Table 7, however, the picture reverses: this area holds the highest PMP level in the study group, high variability of the annual maximum series, and the steepest increasing trend of the 7-day accumulated rainfall at 18.03 mm per decade. Its true risk is therefore higher than the period-averaged anomaly in a single dimension implies.
This carries an important methodological implication: assessing extreme rainfall risk from the change in the mean or the period anomaly alone may underestimate the risk in areas combining high variability with a high baseline level of severe rainfall. Weighing the three dimensions together, namely magnitude, variability, and trend, as organized in Table 7, therefore yields a more complete and safer picture for dam safety assessment. This accords with proposals in extreme rainfall research that the assessment of change should address the magnitude, frequency, and variability of events, rather than a mean-based indicator alone.

3.5.3. Implications for Design Rainfall Practice and Transboundary Water Management

Two practical implications follow. First, for design rainfall practice, the differing risk profiles summarized in Table 7 confirm that design rainfall under climate change cannot rest on a single value or adjustment factor for all areas, but rather must be analyzed separately according to the rainfall characteristics and response of each dam. The framework developed here, linking bias correction and extreme-focused model selection through to DDF/IDF and PMP assessment, can serve to update design rainfall criteria for a changing climate and to supply input data for PMF assessment and dam safety review [65,66]. Second, for transboundary water management, the study area spans Thailand (the UB) and Lao PDR (the NT1 and the NK3) within the Mekong Basin, each catchment displaying different risk characteristics under the same monsoon system, which bears on regional cooperation in water resource management. Because changes in extreme rainfall and flooding in the dam catchment of one country may affect water management downstream in another, assessing design rainfall and risk across borders within one methodological framework forms an important basis for joint water management planning and flood preparedness in the Mekong Basin [13,14].

3.6. Limitations and Uncertainty

The results should be interpreted together with several limitations and sources of uncertainty affecting the input data, the correction method, the design rainfall assessment, and the model structure, of which three are most consequential.
First, the NK3 catchment has only a single rainfall station (Section 2.2.2), so its areal rainfall relies on station data directly rather than multi-station weighting. This raises the uncertainty of the annual maximum series, the PMP, and the trend analysis, most visibly in the 7-day PMP of the NK3 peaking in the Near Future rather than the Far Future. The quantitative results for this catchment are therefore better read in a comparative, risk-ranking sense than as absolute values, and a denser observation network or remotely sensed rainfall would reduce this uncertainty. Second, the linear scaling correction aligns the monthly mean with the observed data in the baseline period, yet adjusts the mean rather than the full distribution, so it treats the quantiles of extreme values less effectively than quantile or distribution mapping. Because this study rests on extreme rainfall, comparing results across correction methods merits further work.
Third, the Hershfield statistical PMP with a constant Km = 15 (Section 2.5.3) supports comparison across catchments under one framework, yet differs from the meteorological moisture-maximization approach and may yield a relatively high estimate in some areas. The PMP values are therefore best read as a statistical upper bound for comparison, to be weighed with meteorological methods and agency requirements before design use. Two further sources of uncertainty warrant note: design rainfall at return periods of 500 years and above extrapolates beyond the data length (Section 2.5.2), so these values and the PMP suit comparison of the severe risk framework among areas, scenarios, and periods rather than use as absolute design values; structural differences among the climate models persist, mitigated here by extreme-focused model selection and the ensemble median, and a systematic weight sensitivity analysis (Table 5, Section 3.1.1) confirmed the robustness of the selection. Overall, these limitations do not diminish the main findings, namely the comparative difference in risk profile among the catchments and the multidimensional nature of the risk, but rather frame their careful interpretation and point to future work on denser observation data, comparison of bias correction and PMP assessment methods, and sensitivity analysis of the model selection.

4. Conclusions

This study developed a framework for assessing design rainfall and PMP under climate change for the catchments of the UB in Thailand and the NT1 and the NK3 in Lao PDR, linking the bias correction of GCM data using CMhyd, the calculation of areal rainfall, the extreme-focused climate model selection with catchment-specific ranking, and the construction of the top-three ensemble median through to the analysis of the return period, DDF, IDF, PMP, and the annual maximum rainfall trends under SSP5–8.5. The suitable climate models prove catchment-specific: the UB selects MIROC6, MPI-ESM1-2-LR, and EC-Earth3; the NT1 selects MPI-ESM1-2-LR, EC-Earth3, and NESM3; the NK3 selects ACCESS-ESM1-5, MRI-ESM2-0, and GFDL-ESM4, supporting catchment-specific ranking rather than a single set of models for all areas.
The design rainfall and extreme rainfall trends under SSP5–8.5 separate the risk profiles of the catchments. The UB stands out in short-duration heavy rainfall, its 100-year 1-day rainfall increasing by 63.20% in the Far Future; the NT1 in multi-day accumulated rainfall, its 100-year 7-day rainfall increasing by 40.64%; and the NK3 in magnitude, with the highest 7-day PMP of 2342.38 mm and the steepest Rx7day trend at 18.03 mm per decade. Rx7day carries a greater slope than Rx1day in all dams, underlining the role of multi-day accumulated rainfall in risk assessment. NK3 yields an important methodological conclusion: although the mean anomaly of its 1-day rainfall decreases, the catchment remains at high risk once magnitude, variability, and trend are weighed together. Risk assessment resting on a mean-based indicator in a single dimension may therefore underestimate the actual risk, whereas the three dimensions together give a more complete and safer picture for dam safety assessment.
In summary, this study delivers an integrated framework linking climate projection with design rainfall and PMP assessment at the dam catchment scale, demonstrates how risk profiles differ among catchments of different sizes and characteristics across the Thailand–Lao PDR border, and confirms the need to assess extreme rainfall risk in multiple dimensions. The results can serve as input for constructing the design hyetograph and for flood simulation with rainfall-runoff models, in which the 1-day rainfall reflects the peak response, whereas multi-day accumulated rainfall, particularly the 7-day, governs flood volume, reservoir inflow, and PMF assessment. Catchment-specific analysis, therefore, informs design flood and dam safety assessment under future climate conditions better than a regional-scale average. Future work should increase the density of observation data in areas with limited stations, compare bias correction and PMP assessment methods, and extend the framework toward design flood simulation and transboundary dam safety assessment in the Mekong Basin.

Author Contributions

Conceptualization, P.T., A.K. and H.P.; methodology, P.T. and H.P.; software, P.T. and H.P.; validation, P.T., A.K. and H.P.; formal analysis, P.T., A.K. and H.P.; investigation, P.T. and H.P.; resources, P.T.; data curation, P.T.; writing—original draft preparation, P.T., A.K. and H.P.; writing—review and editing, A.K. and H.P.; visualization, P.T. and H.P.; supervision, A.K.; project administration, A.K. and H.P. All authors have read and agreed to the published version of the manuscript.

Funding

This research received no external funding.

Data Availability Statement

The data presented in this study are available on request from the corresponding author. The raw datasets are third-party data owned by the responsible government and hydropower project agencies; they cannot be redistributed by the authors, but may be obtained free of charge from those agencies through their standard request procedures.

Acknowledgments

The authors gratefully acknowledge the TMD and the EGAT for providing the daily rainfall records of the stations in the Ubolrat Dam catchment and the Nam Theun 1 and Nam Kong 3 Hydropower Projects for providing the corresponding data for the dams in Lao PDR. During the preparation of this manuscript, the authors used ChatGPT-5.6 Sol for the purposes of preparing the research framework flowchart (Figure 1) and Claude Fable 5 for the purposes of checking the language usage. The authors have reviewed and edited the output and take full responsibility for the content of this publication.

Conflicts of Interest

The authors declare no conflicts of interest.

Abbreviations

The following abbreviations are used in this manuscript:
AMSannual maximum series
CMhydClimate Model data for hydrologic modeling
CMIP6Coupled Model Intercomparison Project Phase 6
DDFdepth-duration-frequency
EGATElectricity Generating Authority of Thailand
ETCCDIExpert Team on Climate Change Detection and Indices
GCMgeneral circulation model
IDFintensity-duration-frequency
Lao PDRLao People’s Democratic Republic
MCMmillion cubic meters
MWmegawatt
m.MSLmeters above mean sea level
NK3Nam Kong 3 Dam
NRMSEnormalized root mean square error
NT1Nam Theun 1 Dam
PBIASpercent bias
PMFprobable maximum flood
PMPprobable maximum precipitation
R2coefficient of determination
RErelative error
RPreturn period
Rx1daymaximum 1-day rainfall
Rx3daymaximum 3-day rainfall
Rx7daymaximum 7-day rainfall
SSPshared socioeconomic pathway
TMDThai Meteorological Department
UBUbolrat Dam

References

  1. Coelho, G.d.A.; Ferreira, C.M.; Johnston, J.; Kinter, J.L., III; Dollan, I.J.; Maggioni, V. Potential Impacts of Future Extreme Precipitation Changes on Flood Engineering Design Across the Contiguous United States. Water Resour. Res. 2022, 58, e2021WR031432. [Google Scholar] [CrossRef] [Scilit]
  2. Seawell, A.; Fowler, H.J.; Blenkinsop, S.; Hewett, C.J.M.; Villalobos Herrera, R. Analysing Flash Flood Hydrographs from Different Rainfall Temporal Profiles. J. Flood Risk Manag. 2025, 18, e70133. [Google Scholar] [CrossRef] [Scilit]
  3. Fowler, H.J.; Lenderink, G.; Prein, A.F.; Westra, S.; Allan, R.P.; Ban, N.; Barbero, R.; Berg, P.; Blenkinsop, S.; Do, H.X.; et al. Anthropogenic Intensification of Short-Duration Rainfall Extremes. Nat. Rev. Earth Environ. 2021, 2, 107–122. [Google Scholar] [CrossRef] [Scilit]
  4. Lin, Z.; Ge, F.; Chen, Q.; Fraedrich, K.; Jin, Z. Projected Changes in Precipitation Extremes over Southeast Asia: Unraveling the Roles of Thermodynamic and Dynamic Contributions. Clim. Dyn. 2025, 63, 1. [Google Scholar] [CrossRef] [Scilit]
  5. Dallan, E.; Marra, F.; Fosser, G.; Marani, M.; Borga, M. Dynamical Factors Heavily Modulate the Future Increase of Sub-Daily Extreme Precipitation in the Alpine-Mediterranean Region. Earth’s Future 2024, 12, e2024EF005185. [Google Scholar] [CrossRef] [Scilit]
  6. Voit, P.; Heistermann, M. A Downward-Counterfactual Analysis of Flash Floods in Germany. Nat. Hazards Earth Syst. Sci. 2024, 24, 2147–2164. [Google Scholar] [CrossRef] [Scilit]
  7. Xie, Y.; Guo, S.; Zhong, S.; Wang, X.; Tian, J.; Liang, Z. A Novel Time-Varying P-III Distribution Curve Fitting Model to Estimate Design Floods in Three Gorges Reservoir Operation Period. Hydrology 2024, 11, 203. [Google Scholar] [CrossRef] [Scilit]
  8. Hiraga, Y.; Iseri, Y.; Warner, M.D.; Duren, A.M.; England, J.F.; Frans, C.D.; Kavvas, M.L. Model-Based Estimation of Long-Duration Design Precipitation for Basins with Large Storage Volumes of Reservoirs and Snowpacks. J. Flood Risk Manag. 2024, 17, e12992. [Google Scholar] [CrossRef] [Scilit]
  9. Griffin, A.; Kay, A.L.; Sayers, P.; Bell, V.; Stewart, E.; Carr, S. Widespread Flooding Dynamics under Climate Change: Characterising Floods Using Grid-Based Hydrological Modelling and Regional Climate Projections. Hydrol. Earth Syst. Sci. 2024, 28, 2635–2650. [Google Scholar] [CrossRef] [Scilit]
  10. Ngamsert, R.; Techarungruengsakul, R.; Kaewplang, S.; Hormwichian, R.; Prasanchum, H.; Sivanpheng, O.; Kangrang, A. Optimizing Solution in Decision Supporting System for River Basin Management Consisting of a Reservoir System. Water 2023, 15, 2510. [Google Scholar] [CrossRef] [Scilit]
  11. Martel, J.-L.; Brissette, F.P.; Lucas-Picher, P.; Troin, M.; Arsenault, R. Climate Change and Rainfall Intensity–Duration–Frequency Curves: Overview of Science and Guidelines for Adaptation. J. Hydrol. Eng. 2021, 26, 03121001. [Google Scholar] [CrossRef] [Scilit]
  12. Ngamsert, R.; Kangrang, A. Applying of Marine Predators Algorithm Linked with Reservoir Simulation Model considering Sedimentation for Reservoir Operation. Adv. Civ. Eng. 2022, 2022, 1631914. [Google Scholar] [CrossRef] [Scilit]
  13. Rojpratak, S.; Supharatid, S. Regional Extreme Precipitation Index: Evaluations and Projections from the Multi-Model Ensemble CMIP5 over Thailand. Weather Clim. Extrem. 2022, 37, 100475. [Google Scholar] [CrossRef] [Scilit]
  14. Li, S.; Chen, Y.; Wei, W.; Fang, G.; Duan, W. The Increase in Extreme Precipitation and Its Proportion over Global Land. J. Hydrol. 2023, 628, 130456. [Google Scholar] [CrossRef] [Scilit]
  15. Ge, F.; Zhu, S.; Luo, H.; Zhi, X.; Wang, H. Future Changes in Precipitation Extremes over Southeast Asia: Insights from CMIP6 Multi-Model Ensemble. Environ. Res. Lett. 2021, 16, 024013. [Google Scholar] [CrossRef] [Scilit]
  16. Eyring, V.; Bony, S.; Meehl, G.A.; Senior, C.A.; Stevens, B.; Stouffer, R.J.; Taylor, K.E. Overview of the Coupled Model Intercomparison Project Phase 6 (CMIP6) Experimental Design and Organization. Geosci. Model Dev. 2016, 9, 1937–1958. [Google Scholar] [CrossRef] [Scilit]
  17. O’Neill, B.C.; Tebaldi, C.; van Vuuren, D.P.; Eyring, V.; Friedlingstein, P.; Hurtt, G.; Knutti, R.; Kriegler, E.; Lamarque, J.-F.; Lowe, J.; et al. The Scenario Model Intercomparison Project (ScenarioMIP) for CMIP6. Geosci. Model Dev. 2016, 9, 3461–3482. [Google Scholar] [CrossRef] [Scilit]
  18. Prasanchum, H.; Hormwichian, R.; Techarungruengsakul, R.; Kangrang, A.; Kaewplang, S.; Ngamsert, R.; Supakosol, J.; Sriworamas, K.; Wongsasri, S. Integrated WEAP–Hippopotamus Optimization Framework for Climate-Resilience Reservoir Operation: A Case Study of Ubolrat Reservoir, Thailand. Water 2026, 18, 477. [Google Scholar] [CrossRef] [Scilit]
  19. Hormwichian, R.; Kaewplang, S.; Kangrang, A.; Supakosol, J.; Boonrawd, K.; Sriworamat, K.; Muangthong, S.; Songsaengrit, S.; Prasanchum, H. Understanding the Interactions of Climate and Land Use Changes with Runoff Components in Spatial-Temporal Dimensions in the Upper Chi Basin, Thailand. Water 2023, 15, 3345. [Google Scholar] [CrossRef] [Scilit]
  20. Zhang, H.; Chapman, S.; Trancoso, R.; Toombs, N.; Syktus, J. Assessing the Impact of Bias Correction Approaches on Climate Extremes and the Climate Change Signal. Meteorol. Appl. 2024, 31, e2204. [Google Scholar] [CrossRef] [Scilit]
  21. Teutschbein, C.; Seibert, J. Bias Correction of Regional Climate Model Simulations for Hydrological Climate-Change Impact Studies: Review and Evaluation of Different Methods. J. Hydrol. 2012, 456–457, 12–29. [Google Scholar] [CrossRef] [Scilit]
  22. Yalcin, E. A CMIP6 Multi-Model Ensemble-Based Analysis of Potential Climate Change Impacts on Irrigation Water Demand and Supply Using SWAT and CROPWAT Models: A Case Study of Akmese Dam, Turkey. Theor. Appl. Climatol. 2024, 155, 679–699. [Google Scholar] [CrossRef] [Scilit]
  23. Ghafoor, J.; Forio, M.A.E.; Nolivos, I.; Arias-Hidalgo, M.; Goethals, P.L.M. Model-Based Analysis of the Impact of Climate Change on Hydrology in the Guayas River Basin (Ecuador). J. Water Clim. Change 2024, 15, 5021–5040. [Google Scholar] [CrossRef] [Scilit]
  24. Humphries, U.W.; Waqas, M.; Hlaing, P.T.; Dechpichai, P.; Wangwongchai, A. Assessment of CMIP6 GCMs for Selecting a Suitable Climate Model for Precipitation Projections in Southern Thailand. Results Eng. 2024, 23, 102417. [Google Scholar] [CrossRef] [Scilit]
  25. Tang, B.; Hu, W.; Duan, A. Assessment of Extreme Precipitation Indices over Indochina and South China in CMIP6 Models. J. Clim. 2021, 34, 7507–7524. [Google Scholar] [CrossRef] [Scilit]
  26. Xiao, H.; Zhuo, Y.; Jiang, P.; Zhao, Y.; Pang, K.; Zhang, X. Evaluation and Projection of Extreme Precipitation Using CMIP6 Model Simulations in the Yellow River Basin. J. Water Clim. Change 2024, 15, 2326–2347. [Google Scholar] [CrossRef] [Scilit]
  27. Chen, C.-A.; Hsu, H.-H.; Liang, H.-C. Evaluation and Comparison of CMIP6 and CMIP5 Model Performance in Simulating the Seasonal Extreme Precipitation in the Western North Pacific and East Asia. Weather Clim. Extrem. 2021, 31, 100303. [Google Scholar] [CrossRef] [Scilit]
  28. Kim, Y.-T.; Yu, J.-U.; Kim, T.-W.; Kwon, H.-H. A Novel Approach to a Multi-Model Ensemble for Climate Change Models: Perspectives on the Representation of Natural Variability and Historical and Future Climate. Weather Clim. Extrem. 2024, 44, 100688. [Google Scholar] [CrossRef] [Scilit]
  29. Lompi, M.; Mediero, L.; Soriano, E.; Caporali, E. Climate Change and Hydrological Dam Safety: A Stochastic Methodology Based on Climate Projections. Hydrol. Sci. J. 2023, 68, 745–763. [Google Scholar] [CrossRef] [Scilit]
  30. Wan Ariffin, W.N.H.; Mohd Sidek, L.; Basri, H.; Idros, N.; Torres Adrian, M.; Abd Ghani, N.H.; Mohd Khambali, H.; Allias Omar, S.M.; Azhar Khebir, M.I.; Ahmed, A.N. Overtopping Risk of High-Hazard Embankment Dam under Climate Change Condition. PLoS ONE 2025, 20, e0311181. [Google Scholar] [CrossRef]
  31. Liu, D.; Zhao, Q.; Fu, D.; Guo, S.; Liu, P.; Zeng, Y. Comparison of Spatial Interpolation Methods for the Estimation of Precipitation Patterns at Different Time Scales to Improve the Accuracy of Discharge Simulations. Hydrol. Res. 2020, 51, 583–601. [Google Scholar] [CrossRef] [Scilit]
  32. Stanzel, P.; Kling, H.; Fuchs, M.; Martin, S. Hydrological and Reservoir Modelling for Enhanced Design, Construction and Operation—The Case of Nam Theun 1 Hydropower Project. In Proceedings of the Seventh International Conference and Exhibition on Water Resources and Renewable Energy Development in Asia (ASIA 2018), Danang, Vietnam, 13–15 March 2018. [Google Scholar]
  33. Ghazi, B.; Przybylak, R.; Pospieszyńska, A. Projection of Climate Change Impacts on Extreme Temperature and Precipitation in Central Poland. Sci. Rep. 2023, 13, 18772. [Google Scholar] [CrossRef] [Scilit] [PubMed]
  34. Jimenez, D.A.; Menapace, A.; Zanfei, A.; Pinto, E.J.D.A.; Brentan, B. Assessing Downscaling Techniques for Frequency Analysis, Total Precipitation and Rainy Day Estimation in CMIP6 Simulations over Hydrological Years. Hydrol. Earth Syst. Sci. 2024, 28, 1981–1997. [Google Scholar] [CrossRef] [Scilit]
  35. O’Neill, B.C.; Kriegler, E.; Ebi, K.L.; Kemp-Benedict, E.; Riahi, K.; Rothman, D.S.; van Ruijven, B.J.; van Vuuren, D.P.; Birkmann, J.; Kok, K.; et al. The Roads Ahead: Narratives for Shared Socioeconomic Pathways Describing World Futures in the 21st Century. Glob. Environ. Change 2017, 42, 169–180. [Google Scholar] [CrossRef] [Scilit]
  36. Lenderink, G.; Buishand, A.; van Deursen, W. Estimates of Future Discharges of the River Rhine Using Two Scenario Methodologies: Direct versus Delta Approach. Hydrol. Earth Syst. Sci. 2007, 11, 1145–1159. [Google Scholar] [CrossRef] [Scilit]
  37. Maraun, D.; Shepherd, T.G.; Widmann, M.; Zappa, G.; Walton, D.; Gutiérrez, J.M.; Hagemann, S.; Richter, I.; Soares, P.M.M.; Hall, A.; et al. Towards Process-Informed Bias Correction of Climate Change Simulations. Nat. Clim. Change 2017, 7, 764–773. [Google Scholar] [CrossRef] [Scilit]
  38. Shrestha, M.; Acharya, S.C.; Shrestha, P.K. Bias Correction of Climate Models for Hydrological Modelling—Are Simple Methods Still Useful? Meteorol. Appl. 2017, 24, 531–539. [Google Scholar] [CrossRef] [Scilit]
  39. Villalobos-Herrera, R.; Blenkinsop, S.; Guerreiro, S.B.; O’Hara, T.; Fowler, H.J. Sub-Hourly Resolution Quality Control of Rain-Gauge Data Significantly Improves Regional Sub-Daily Return Level Estimates. Q. J. R. Meteorol. Soc. 2022, 148, 3252–3271. [Google Scholar] [CrossRef] [Scilit] [PubMed]
  40. Supakosol, J.; Prasanchum, H.; Kangrang, A.; Hormwichian, R.; Busababodhin, P.; Sriworamas, K.; Muangthong, S.; Pholkern, K.; Wongsasri, S.; Chaowiwat, W. Water Scarcity Risk Assessment for Multi-Administrative Units in Agricultural Watersheds Using Integrated QSWAT–WEAP and GIS-Based Approach. Sustainability 2026, 18, 1932. [Google Scholar] [CrossRef] [Scilit]
  41. Moriasi, D.N.; Arnold, J.G.; Van Liew, M.W.; Bingner, R.L.; Harmel, R.D.; Veith, T.L. Model Evaluation Guidelines for Systematic Quantification of Accuracy in Watershed Simulations. Trans. ASABE 2007, 50, 885–900. [Google Scholar] [CrossRef] [Scilit]
  42. Patel, G.; Das, S.; Das, R. Evaluation of Optimal Normalization Techniques in Multi-Criteria Decision-Making to Rank CMIP6 Climate Models. Theor. Appl. Climatol. 2025, 156, 385. [Google Scholar] [CrossRef] [Scilit]
  43. Nguyen-Duy, T.; Ngo-Duc, T.; Desmet, Q. Performance Evaluation and Ranking of CMIP6 Global Climate Models over Vietnam. J. Water Clim. Change 2023, 14, 1831–1846. [Google Scholar] [CrossRef] [Scilit]
  44. Więckowski, J.; Sałabun, W. Sensitivity Analysis Approaches in Multi-Criteria Decision Analysis: A Systematic Review. Appl. Soft Comput. 2023, 148, 110915. [Google Scholar] [CrossRef] [Scilit]
  45. Mazurek, J.; Strzałka, D. On the Monte Carlo Weights in Multiple Criteria Decision Analysis. PLoS ONE 2022, 17, e0268950. [Google Scholar] [CrossRef] [Scilit] [PubMed]
  46. Vrac, M.; Allard, D.; Mariéthoz, G.; Thao, S.; Schmutz, L. Distribution-Based Pooling for Combination and Multi-Model Bias Correction of Climate Simulations. Earth Syst. Dyn. 2024, 15, 735–762. [Google Scholar] [CrossRef] [Scilit]
  47. Vargas Godoy, M.R.; Papalexiou, S.M.; Markonis, Y. HYADES—A Global Archive of Annual Maxima Daily Precipitation. Sci. Data 2024, 11, 298. [Google Scholar] [CrossRef] [Scilit] [PubMed]
  48. Gründemann, G.J.; Zorzetto, E.; Beck, H.E.; Schleiss, M.; van de Giesen, N.; Marani, M.; van der Ent, R.J. Extreme Precipitation Return Levels for Multiple Durations on a Global Scale. J. Hydrol. 2023, 621, 129558. [Google Scholar] [CrossRef] [Scilit]
  49. Prahadchai, T.; Shin, Y.; Busababodhin, P.; Park, J.-S. Analysis of Maximum Precipitation in Thailand Using Non-Stationary Extreme Value Models. Atmos. Sci. Lett. 2023, 24, e1145. [Google Scholar] [CrossRef] [Scilit]
  50. Ballarin, A.S.; Calixto, K.G.; Anache, J.A.A.; Wendland, E. Combined Predictive and Descriptive Tests for Extreme Rainfall Probability Distribution Selection. Hydrol. Sci. J. 2022, 67, 1130–1140. [Google Scholar] [CrossRef] [Scilit]
  51. Das, S.; Jarag, A.; Bandivadekar, R.; Parkar, P.; Bardaskar, K.; Inamdar, S. Flood Frequency Analysis of Panchganga River Basin Using Gumbel and Log-Pearson Type III Models. Sci. Rep. 2026, 16, 16689. [Google Scholar] [CrossRef] [Scilit] [PubMed]
  52. Thepprasit, C.; Intavong, A.; Chompuchan, C.; Chulee, N.; Sittichok, K. Spillway Capacity Estimation Using Flood Peak Analysis and Probable Maximum Flood Method. Water 2024, 16, 1727. [Google Scholar] [CrossRef] [Scilit]
  53. Koutsoyiannis, D. Statistics of Extremes and Estimation of Extreme Rainfall: I. Theoretical Investigation. Hydrol. Sci. J. 2004, 49, 575–590. [Google Scholar] [CrossRef] [Scilit]
  54. Fernando, W.C.D.K.; Wickramasuriya, S.S. Concept of Threshold in the Estimation of Probable Maximum Precipitation: Hershfield’s Method Revisited. J. Hydrol. Eng. 2021, 26, 04020069. [Google Scholar] [CrossRef] [Scilit]
  55. Hershfield, D.M. Estimating the Probable Maximum Precipitation. J. Hydraul. Div. ASCE 1961, 87, 99–116. [Google Scholar] [CrossRef] [Scilit]
  56. Bhatt, A.; Srinivas, V.V. A Framework for Evaluating Uncertainty from Multiple Sources in Probable Maximum Precipitation Estimation by the Hershfield Method Using Imprecise Probability. Water Resour. Res. 2025, 61, e2024WR038052. [Google Scholar] [CrossRef] [Scilit]
  57. Sarkar, S.; Maity, R. Estimation of Probable Maximum Precipitation in the Context of Climate Change. MethodsX 2020, 7, 100904. [Google Scholar] [CrossRef] [Scilit] [PubMed]
  58. Buonacera, G.; Palazzolo, N.; Cancelliere, A.; Peres, D.J. Deriving Future Rainfall Depth–Duration–Frequency Curves from Hourly Regional Climate Projections and Simple Scaling in Sicily. Water Resour. Manag. 2025, 39, 5619–5635. [Google Scholar] [CrossRef] [Scilit]
  59. Jun, C.; Qin, X.; Chen, M.; Seo, H. Investigating Event-Based Temporal Patterns of Design Rainfall in a Tropical Region. Hydrol. Sci. J. 2021, 66, 1986–1996. [Google Scholar] [CrossRef] [Scilit]
  60. Zhang, X.; Alexander, L.; Hegerl, G.C.; Jones, P.; Klein Tank, A.; Peterson, T.C.; Trewin, B.; Zwiers, F.W. Indices for Monitoring Changes in Extremes Based on Daily Temperature and Precipitation Data. WIREs Clim. Change 2011, 2, 851–870. [Google Scholar] [CrossRef] [Scilit]
  61. Hu, Z.; Liu, S.; Zhong, G.; Lin, H.; Zhou, Z. Modified Mann-Kendall Trend Test for Hydrological Time Series under the Scaling Hypothesis and Its Application. Hydrol. Sci. J. 2020, 65, 2419–2438. [Google Scholar] [CrossRef] [Scilit]
  62. Tang, B.; Hu, W.; Duan, A. Future Projection of Extreme Precipitation Indices over the Indochina Peninsula and South China in CMIP6 Models. J. Clim. 2021, 34, 8793–8811. [Google Scholar] [CrossRef] [Scilit]
  63. Perera, C.; Peiris, N.; Gunawardhana, L.; Rajapakse, L.; Wijayaratna, N.; Dissanayake, B.C.; De Silva, K. Designing for the Past in a Nonstationary Climate: Evidence from Cyclone Ditwah’s Extreme Rainfall in Sri Lanka. Hydrology 2026, 13, 47. [Google Scholar] [CrossRef] [Scilit]
  64. Liu, L.; Bai, P.; Liu, C.; Tian, W.; Liang, K. Changes in Extreme Precipitation in the Mekong Basin. Adv. Meteorol. 2020, 2020, 8874869. [Google Scholar] [CrossRef] [Scilit]
  65. Suwannachai, L.; Phumiphan, A.; Kuntiyawichai, K.; Supakosol, J.; Sriworamas, K.; Sivanpheng, O.; Kangrang, A. Integrating Hydrological Models for Improved Flash Flood Risk Assessment and Mitigation Strategies in Northeastern Thailand. Water 2025, 17, 345. [Google Scholar] [CrossRef] [Scilit]
  66. Suwannachai, L.; Sriworamas, K.; Sivanpheng, O.; Kangrang, A. Application of SWAT Model for Assessment of Surface Runoff in Flash Flood Areas. Water 2024, 16, 495. [Google Scholar] [CrossRef] [Scilit]
Figure 1. Methodological workflow. Blue arrows denote the sequential workflow, purple the inter-phase transfer, orange the parallel branching, and purple, light-blue, and green the frequency, PMP, and trend paths.
Water 18 02013 g001
Figure 2. Study area and rainfall stations.
Water 18 02013 g002
Figure 3. Climate model ranking scores for the three dam catchments. (a) UB, (b) NT1, and (c) NK3. Values in parentheses denote the overall scores, and bold entries indicate the top three models of each catchment selected for constructing the Ensemble median.
Water 18 02013 g003
Figure 4. Annual maximum 1-day rainfall and multimetric performance comparison of all GCMs for the three dam catchments: (a1c1) annual maximum 1-day areal rainfall for the UB, the NT1, and the NK3 and (a2c2) multimetric spider plots for the UB, the NT1, and the NK3. Colored lines denote the three top-ranked models of each catchment and black the observed series, whereas the remaining models (Ranks 4–10) appear as thin gray lines for context only; each legend lists the models in the catchment-specific rank order.
Water 18 02013 g004
Figure 5. Five-year anomaly heatmap of the monthly maximum 1-day rainfall for the three dam catchments: (a) UB, (b) NT1, and (c) NK3. The vertical dashed line marks the boundary between the Historical-Present period (2000–2025) and the future projection periods.
Water 18 02013 g005
Figure 6. Five-year anomaly heatmap of the monthly maximum 7-day rainfall for the three dam catchments: (a) UB, (b) NT1, and (c) NK3. The vertical dashed line marks the boundary between the Historical-Present period (2000–2025) and the future projection periods.
Water 18 02013 g006
Figure 7. DDF and IDF curves under SSP5–8.5 for the UB: (a1a4) depth-duration-frequency curves and (b1b4) intensity-duration-frequency curves.
Water 18 02013 g007
Figure 8. DDF and IDF curves under SSP5–8.5 for the NT1: (a1a4) depth-duration-frequency curves and (b1b4) intensity-duration-frequency curves.
Water 18 02013 g008
Figure 9. DDF and IDF curves under SSP5–8.5 for the NK3: (a1a4) depth-duration-frequency curves and (b1b4) intensity-duration-frequency curves.
Water 18 02013 g009
Figure 10. Annual maximum 1-day and 7-day rainfall under SSP5–8.5 for the three dam catchments. (a1c1) Annual maximum 1-day rainfall for the UB, the NT1, and the NK3 and (a2c2) annual maximum 7-day rainfall for the UB, the NT1, and the NK3.
Water 18 02013 g010
Table 1. GCMs used for CMhyd bias correction and climate model selection.
No.GCM ModelModelling Center/InstitutionCountry/
Region
Approximate
Resolution
1ACCESS-CM2Commonwealth Scientific and Industrial Research Organization/Australian Research Council Centre of Excellence for Climate System Science (CSIRO-ARCCSS)Australia250 × 250 km
2ACCESS-ESM1-5Commonwealth Scientific and Industrial Research Organization (CSIRO)Australia250 × 250 km
3CMCC-ESM2Centro Euro-Mediterraneo sui Cambiamenti Climatici (CMCC)Italy100 × 100 km
4EC-Earth3EC-Earth ConsortiumEurope100 × 100 km
5GFDL-ESM4NOAA Geophysical Fluid Dynamics Laboratory (NOAA-GFDL)multinational100 × 100 km
6INM-CM5-0Institute of Numerical Mathematics, Russian Academy of Sciences (INM)consortium250 × 250 km
7MIROC6MIROC Consortium: Atmosphere and Ocean Research Institute, National Institute for Environmental Studies,
and Japan Agency for Marine-Earth Science and Technology
United States250 × 250 km
8MPI-ESM1-2-LRMax Planck Institute for Meteorology (MPI-M)Russia250 × 250 km
9MRI-ESM2-0Meteorological Research Institute (MRI)Japan100 × 100 km
10NESM3Nanjing University of Information Science
and Technology (NUIST)
Germany250 × 250 km
Table 2. Metrics and weights for climate model ranking.
MetricWeightMeaning
Rx1day_RE0.25Relative error of annual maximum 1-day basin rainfall
Rx3day_RE0.15Relative error of annual maximum 3-day basin rainfall
Rx7day_RE0.10Relative error of annual maximum 7-day basin rainfall
HeavyDays_RE0.15Relative error of heavy rainfall days
AMS1_Corr0.10Correlation of annual maximum 1-day rainfall series
MonthlyTotal_NRMSE0.10Normalized RMSE of monthly rainfall totals
AnnualTotal_RE0.08Relative error of annual rainfall total
PBIAS_abs0.07Absolute percent bias of rainfall total
Table 3. ETCCDI-based precipitation indices used in the trend analysis.
IndexDescriptionUnit
PRCPTOTAnnual total precipitation from wet daysmm/year
WetDays_R1mmNumber of wet days with rainfall ≥ 1 mmdays/year
HeavyRainDays_R10mmNumber of heavy rainfall days with rainfall ≥ 10 mmdays/year
VeryHeavyRainDays_R20mmNumber of very heavy rainfall days with rainfall ≥ 20 mmdays/year
CDDMaximum consecutive dry daysdays
CWDMaximum consecutive wet daysdays
Rx1dayAnnual maximum 1-day rainfallmm
Rx3dayAnnual maximum 3-day rainfallmm
Rx7dayAnnual maximum 7-day rainfallmm
R95pTOTAnnual rainfall total above historical wet-day 95th percentilemm/year
R99pTOTAnnual rainfall total above historical wet-day 99th percentilemm/year
IndexDescriptionUnit
Table 4. Selected top-three GCMs for each dam catchment.
Dam CatchmentRank 1Rank 2Rank 3
UBMIROC6MPI-ESM1-2-LREC-Earth3
NT1MPI-ESM1-2-LREC-Earth3NESM3
NK3ACCESS-ESM1-5MRI-ESM2-0GFDL-ESM4
Table 5. Weight sensitivity analysis of the catchment-specific model ranking under Monte Carlo perturbation of all eight weights (10,000 runs per level, weights renormalized in each run).
CatchmentPerturbationRank-1
Unchanged (%)
Top-2 Set
Unchanged (%)
Top-3 Set
Unchanged (%)
Mean Spearman
UB±20%10010087.00.994
UB±20%10010076.30.991
NT1±20%10010097.70.996
NT1±20%10010087.50.994
NK3±20%99.810084.10.992
NJ3±20%94.910074.60.989
Table 6. Significant ETCCDI-based trends under SSP5–8.5.
Dam
Catchment
IndicatorSlope
(mm per Decade)
R2DirectionEngineering Interpretation
UBRx1day3.140.17IncreasingShort-duration extreme rainfall increasing; related to peak response
Rx7day6.580.11IncreasingMulti-day accumulated rainfall increasing; related to flood volume and reservoir inflow
NT1Rx1day1.970.08Increasing1-day rainfall increasing, though less pronounced than the 7-day accumulated rainfall
Rx7day10.680.23Increasing7-day accumulated rainfall increasing clearly; related to flood volume and PMF-related assessment
NK3Rx1day2.840.04Increasing1-day rainfall showing an increasing trend, though with high interannual variability
Rx7day18.030.16Increasing7-day accumulated rainfall increasing prominently; linked to the very high DDF/PMP values
Table 7. Synthesis of cross-catchment extreme rainfall risk profiles.
Risk DimensionUBNT1NK3
Short-duration design rainfall (100-year, Rx1day)Most prominent increase (+63.20%)Moderate increase (+21.47%)High baseline level; slight change (−3.96%)
Multi-day design rainfall (100-year, Rx7day)Moderate increase (+33.48%)Most prominent increase (+40.64%)High level (+11.22%)
PMP magnitude
(7-day, Far Future)
High (2051 mm)Moderate (1715 mm)Highest (2342 mm)
Interannual variability (AMS)ModerateLowHigh
Long-term trend
(Rx7day, mm/decade)
+6.58+10.68+18.03
Dominant risk driverShort-duration heavy rainfall (peak response)Multi-day accumulated rainfall (flood volume)Magnitude + variability + trend
Disclaimer/Publisher’s Note: The statements, opinions and data contained in all publications are solely those of the individual author(s) and contributor(s) and not of MDPI and/or the editor(s). MDPI and/or the editor(s) disclaim responsibility for any injury to people or property resulting from any ideas, methods, instructions or products referred to in the content.