Article

Assessing Water Security in Dhaka City Slums

by
Shamsunnahar Runu
and
M. Shahjahan Mondal
*
Institute of Water and Flood Management, Bangladesh University of Engineering and Technology, Dhaka 1000, Bangladesh
*
Author to whom correspondence should be addressed.
Water 2026, 18(16), 1974; https://doi.org/10.3390/w18161974
Submission received: 7 July 2026 / Revised: 31 July 2026 / Accepted: 11 August 2026 / Published: 12 August 2026
(This article belongs to the Section Water Use and Scarcity)

Abstract

Water security is a prerequisite for achieving the Sustainable Development Goals, yet water insecurity remains a critical challenge in urban slums. This study assesses the water security in the slums of Dhaka City, Bangladesh by integrating multiple dimensions of water security, such as water supply, sanitation and hygiene, water environment, water and climatic risks, and water governance. Suitable indicators and variables are used to capture the key dimensions of water security. A mixed-method approach, incorporating quantitative water quality assessment, waterlogging assessment and household survey, and qualitative focus group discussions, in-depth interviews and key informant interviews, is followed for data collection. The results reveal that the water security index (WSI), on a scale of 5.00, varies from 1.72 for Rajur slum to 3.34 for Nabinagar Housing slum. Among the dimensions, the score varies from 1.86 for water environment to 3.05 for water supply. Thus, there is a wide variation in WSI from slum to slum and in score from dimension to dimension. The study suggests improving drainage, sewerage and household solid waste collection systems, cleaning water bodies, improving drinking water quality, and raising awareness on menstrual hygiene management for enhancing water security in Dhaka’s slums.

1. Introduction

Since the early 2000s, water security has emerged as a central goal in both national and global development agendas, reflecting a growing recognition of the fundamental role of water in sustaining public health and livelihoods [1]. It gained prominence as concerns over water scarcity and water quality intensified worldwide due to rapid urbanization and climate-related risks. Water security is conceptualized as the availability of an acceptable quantity and quality of water for health, livelihoods, ecosystems, and production, coupled with an acceptable level of water-related risks to people, environments, and economies [2]. Several international organizations, including the United Nations, the Asian Development Bank, and the Global Water Partnership, have further refined and operationalized the concept within policy, governance, and sustainable development discourses [3,4,5]. Water security has thus evolved into a multidimensional and integrated concept that encompasses not only water availability and quality but also issues of accessibility, affordability, governance, equity, resilience, and risk.
The principle that ‘what cannot be measured cannot be effectively managed’ underscores the importance of developing robust indicators for water security [5]. Consequently, a range of tools, approaches and frameworks have been developed to assess water security across different spatial, temporal, and social scales. Broadly, water security assessments can be categorized into two main approaches: resource-based and experiential [1]. Resource-based assessments typically employ physical, environmental, institutional, and service-related indicators to evaluate the status of water resources, identify key challenges, and support policy formulation and management interventions. In contrast, experiential assessments focus on individual’s and household’s lived experiences of water insecurity, capturing its social, economic, psychological, and health-related consequences over relatively short time periods. While experiential approaches offer a deeper understanding of how water insecurity is experienced by vulnerable populations at the household and community levels, resource-based approaches provide valuable insights into strategic planning and governance.
In the resource-based approach, the Water Security Index (WSI) has become an important analytical tool for assessing water security by identifying existing water-related challenges, establishing improvement targets, evaluating the potential impacts of interventions, benchmarking performance, and facilitating the transfer of lessons learned from successful practices [5]. As a multidimensional assessment framework, the WSI incorporates a range of dimensions and indicators that vary according to the objectives, contexts and spatial scale of individual studies.
Over the past decades, numerous WSIs have been developed and applied at regional, national and transboundary scales to assess water security conditions and support policy decision-making [3,4,6,7,8]. While these large-scale assessments provide valuable strategic insights, they often fail to capture local-level variations and context-specific challenges. National-level indices tend to overlook disparities associated with gender, age, income, settlement type, and other forms of social inequality that shape water security outcomes. To overcome some of these limitations, several city-level WSIs have been developed using four to five core dimensions of water security and secondary data obtained from government agencies and relevant institutions [9,10,11,12,13,14,15]. Although these studies have advanced the understanding of urban water security, they often inadequately represent the water insecurity problems of low-income communities and households. Critical aspects such as water accessibility, quality, affordability, reliability, sanitation and hygiene conditions, exposure to water-related hazards, environmental quality, and participation in water governance remain insufficiently represented.
At the household level, only a limited number of studies are available that investigate water security [16,17]. Also, the available studies primarily focus on the water availability, and sanitation and hygiene dimensions, and suffer from not considering water environment, water and climatic risks, and water governance. In the context of Dhaka’s slums, previous studies have largely focused on the provisioning of physical infrastructure and services [18,19,20,21,22,23,24], with comparatively limited attention paid to soft governance and management measures [25,26,27,28,29,30]. Therefore, this study focuses on assessing water security in urban slums using a multidimensional WSI. Such assessments would reveal slum- and group-specific challenges, and inform the design of targeted, inclusive, and sustainable interventions to improve water security. Moreover, such assessments can provide evidence-based guidance for urban policymakers, planners, and development practitioners, and directly contribute to the achievement of Sustainable Development Goals (SDGs), particularly SDG 3 (Good health and well-being), SDG 5 (Gender equality), SDG 6 (Clean water and sanitation), and SDG 11 (Sustainable cities and communities).

2. Materials and Methods

2.1. Study Area

Dhaka, the capital city of Bangladesh, is situated in the central region of the country and is surrounded by several major river systems, including the Buriganga, Turag, Balu, and Tongi Khal. These rivers play a significant role in surface water supply and rainwater drainage of the city [31]. As one of the world’s fastest-growing megacities, Dhaka is expected to become the largest urban agglomeration globally by 2050, surpassing Jakarta in population size [32]. Rapid urbanization, coupled with continuous rural-to-urban migration, is contributing to the expansion of informal settlements throughout the city. About 1.8 million people reside in slum settlements in Bangladesh, with a substantial concentration in Dhaka [33,34]. Water supply services within the city are managed by the Dhaka Water Supply and Sewerage Authority (DWASA). However, the slums have limited access to the DWASA water supply system. Also, water points and sanitation facilities in slums are commonly shared among multiple households. Therefore, slum settlements of Dhaka City are selected for this study.
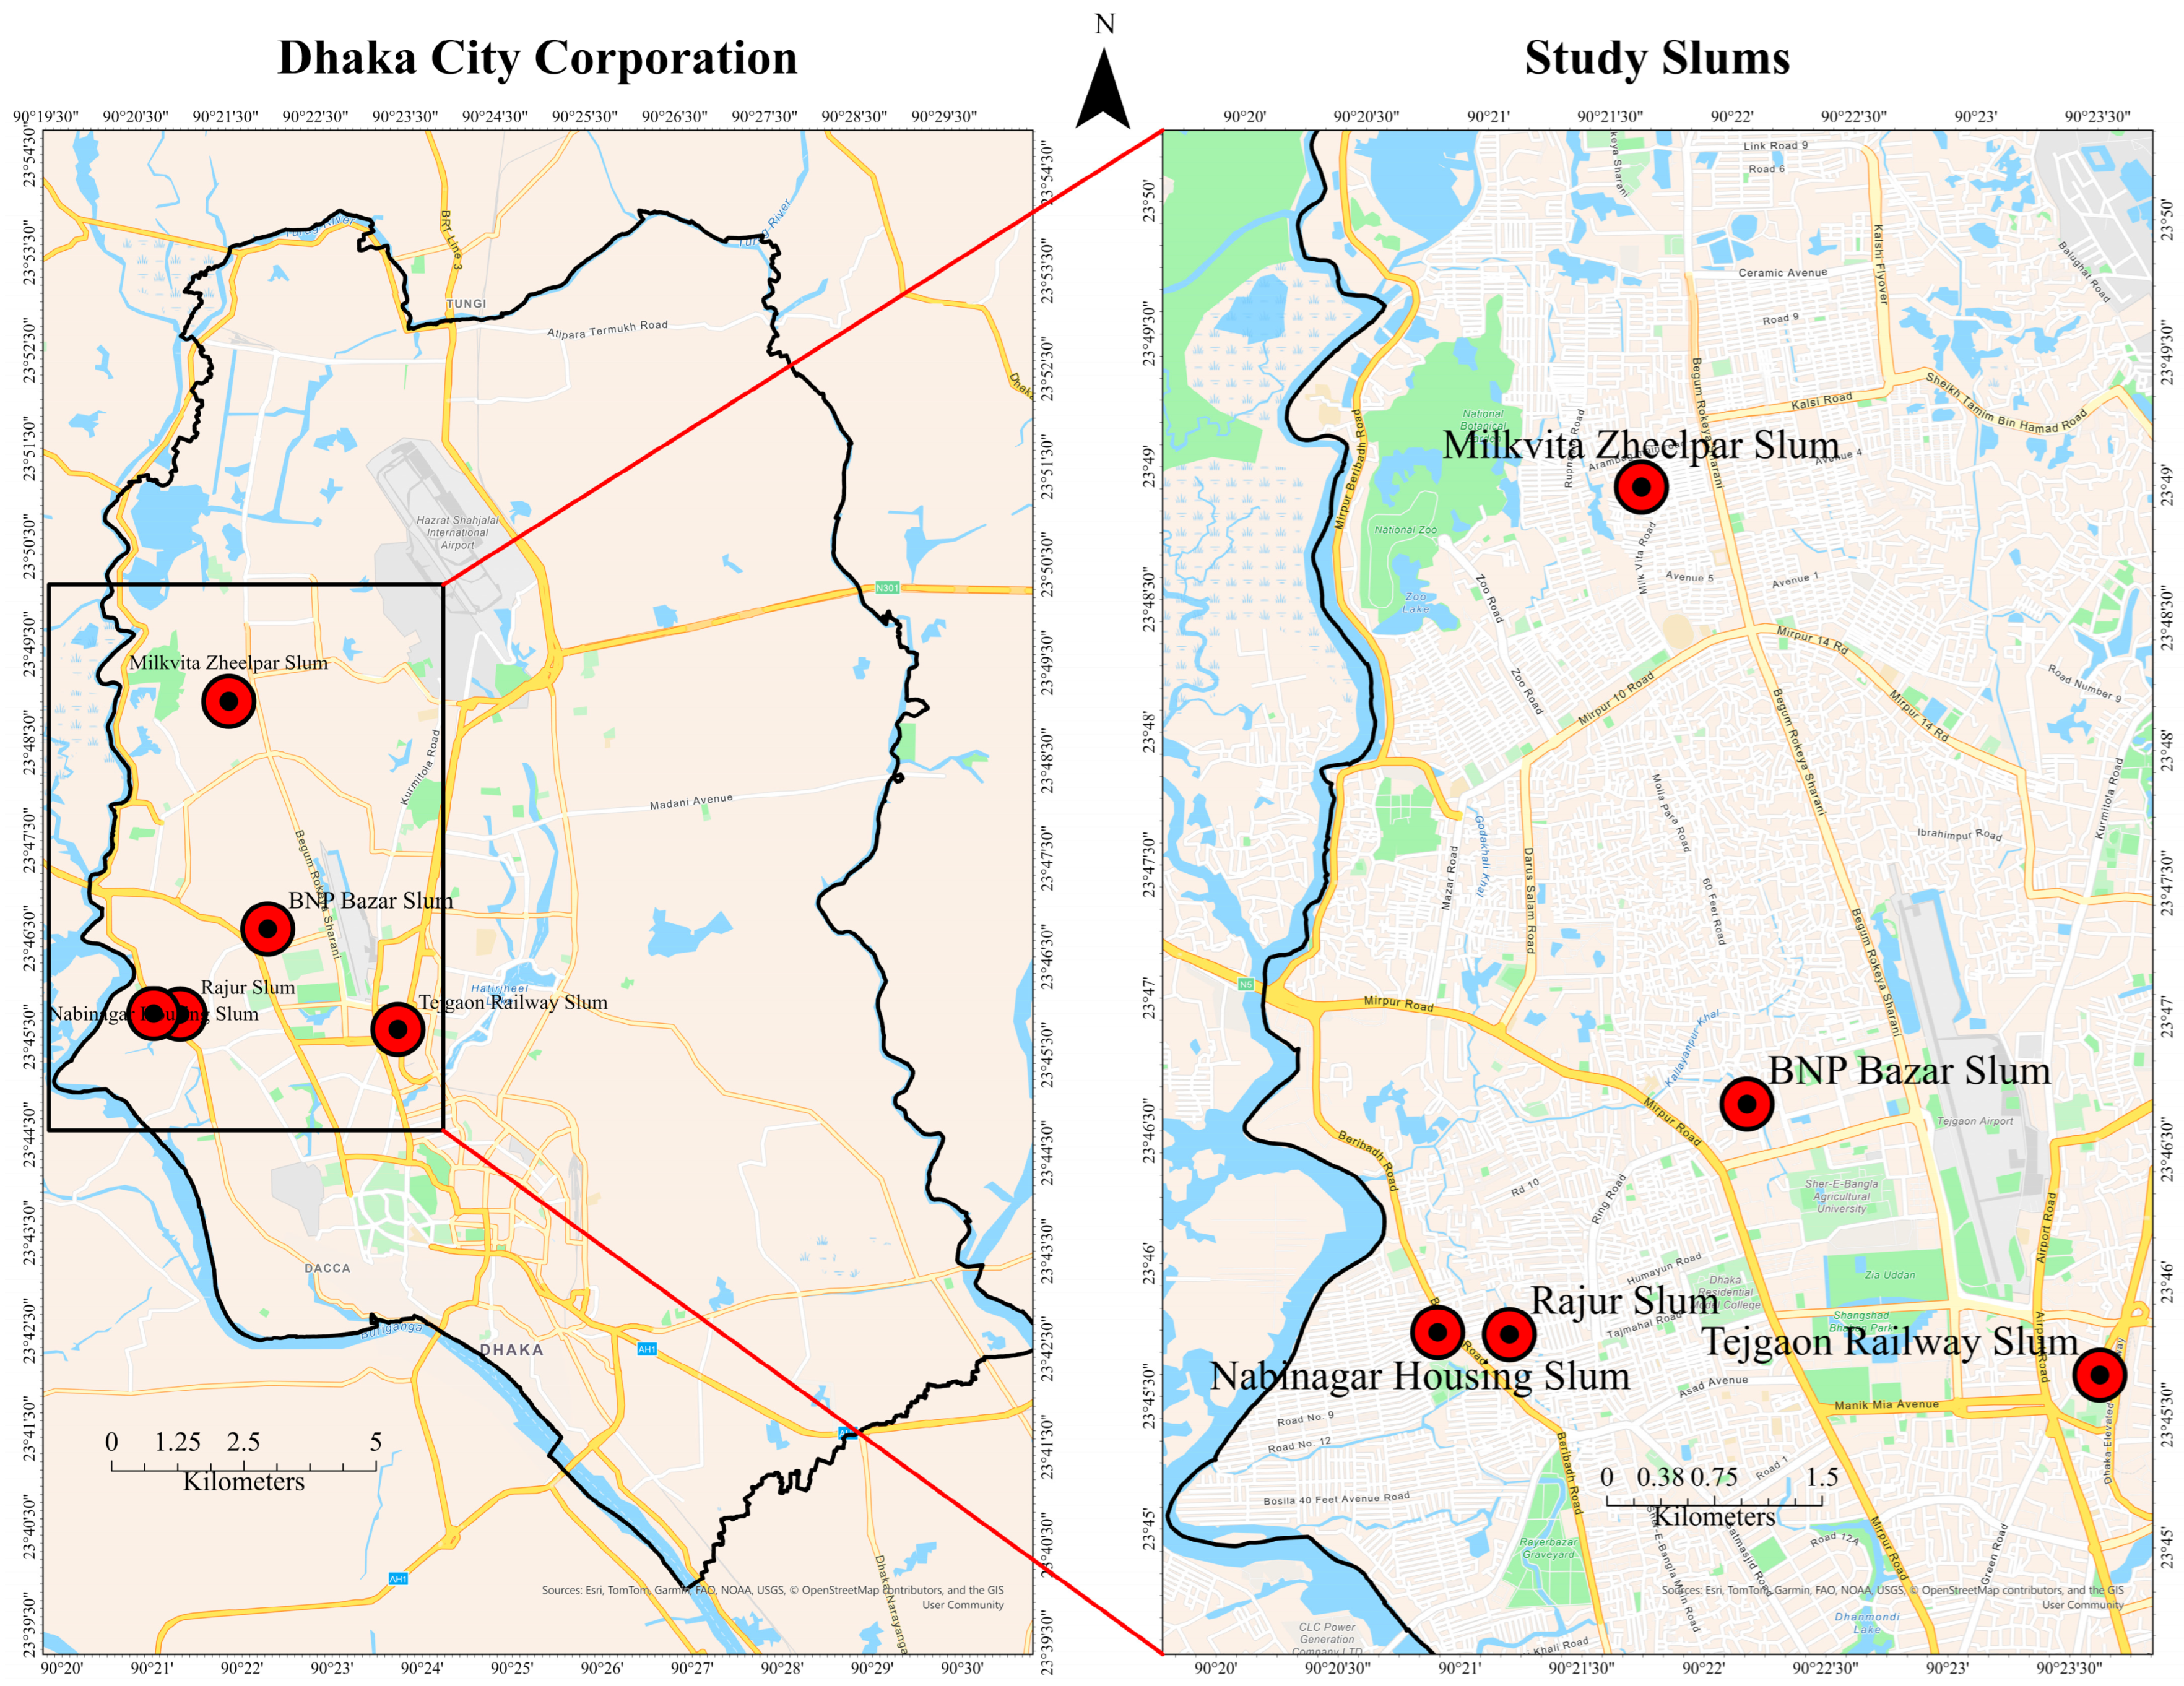
Eleven slums are initially identified from published literature and data [34]. Then reconnaissance field visits are conducted to the slums to see their variations in water sources, land ownership, water, sanitation and hygiene (WASH) infrastructure, and management arrangements. Five slums (BNP Bazar slum, Milkvita Zheelpar slum, Nabinagar Housing slum, Rajur slum, and Tejgaon Railway slum) are finally selected for this study (Figure 1). These slums represent diverse socioeconomic, infrastructural, and institutional contexts, and provide a suitable basis for assessing household-level water security.

2.2. Assessment of Water Security

In this study, water security in slums is assessed using the water security index (WSI). The WSI comprises five dimensions, each dimension consists of a few indicators, and each indicator consists of one or more variables. To select the WSI dimensions, previous studies on water security issues at urban, peri-urban, and city scales are thoroughly reviewed [10,12,16,35]. The selection process also considers the targets set by the United Nations for achieving the goal of securing sustainable water for all [8]. Based on the review outcome, five measurable and interconnected dimensions of water security are selected: (i) water supply, (ii) sanitation and hygiene, (iii) water environment, (iv) water and climatic risks, and (v) water governance.
A set of indicators for each dimension is then selected to capture the specific characteristics of that dimension. The selected indicators are: (i) water availability, accessibility, affordability, and quality for water supply, (ii) access to improved toilet facilities, challenges associated with existing toilet facilities, access to improved bathing facilities, challenges associated with existing bathing facilities, access to safe menstrual hygiene management (MHM) facilities, and awareness of MHM practices for sanitation and hygiene, (iii) presence of improved drainage system, presence of improved sewerage system, presence of primary waste collection system, and condition of nearby surface water bodies for water environment, (iv) waterlogging and heat stress conditions and adaptive capacity for water and climatic risks, and (v) resource, agency, and institutional support for water governance.
For each indicator, one or more variables are selected through a comprehensive review of literature on water security, water poverty, and WASH issues in slums [18,26,27,35,36]. Additionally, variables are identified based on observations of existing WASH conditions during reconnaissance field visits. Moreover, findings from questionnaire pre-testing and focus group discussions (FGDs) help refine the variables.
To calculate WSI from the scores on five dimensions, the following weighted multiplicative aggregation function is used:
W S I = i = 1 5 D i w i D
where D i is the score on the i-th dimension, and w i D is the weight of the dimension. Previous studies show that multiplicative aggregation is more sensitive to poor performance in individual dimensions and is therefore more effective in identifying critical weaknesses or hotspots within a water system [37]. Furthermore, multiplicative aggregation generally produces more conservative estimates while maintaining the relative ranking of observations [38]. The w i ’s are estimated with Principal Component Analysis (PCA) on D i ’s. The suitability of the D i scores for factor analysis is assessed using the Kaiser–Meyer–Olkin (KMO) measure of sampling adequacy and Bartlett’s Test of Sphericity. The minimum acceptable KMO value is set at 0.60 [39], while a significance level of 0.05 is used for Bartlett’s test to confirm the existence of sufficient correlations among the dimensions [40,41]. An orthogonal rotation is applied to maximize the variance of factor loadings and improve the interpretability of the extracted components.
Each D i is calculated from its indicator scores using an additive aggregation technique as below:
D i = i = 1 k w i I I i
where I i is the score on the i-th indicator, w i I is the weight of the indicator, and k is the number of indicators under the dimension. All indicators under a dimension are given equal weights following the previous studies on index-based assessment [10,16]. This means that the four indicators under the water supply dimension receives a weight of 0.25 each.
Each I i is calculated from its variable scores using the following additive aggregation equation:
I i = i = 1 m w i V V i
where V i is the score on the i -th variable, w i V is the weight of the variable, and m is the number of variables under the indicator. Equal weights are assigned for all variables under an indicator.
The resulting WSI values are subsequently classified into different water security categories to facilitate interpretation and comparison among the study slums and the respondent groups. The classification scheme used in this study is given in Table 1.

2.3. Data Collection

The study collects primary data on different variables for calculating the WSIs of the slums. The data is collected through a household questionnaire survey. A two-stage sampling strategy is followed to select the respondent households [42]. At the first stage, each selected slum is divided into spatial units based on available lanes. A few units representing diverse sources of water and/or different levels of water security from each slum are selected at this stage. At the second stage, a house list is prepared for each selected spatial unit of the slum, and the households are selected proportionately to the number of households in the unit. A total of 286 households from the five slums are surveyed in this study, which is about 12.4% of the total households (Table 2).
A structured questionnaire is prepared to collect data on different variables under the five dimensions of water security. For most variables, the data is collected using a five-point ordinal scale, where a score of 1 represents the lowest level of variable value linked to water security and a score of 5 represents the highest level. Data on some variables, such as daily water consumption, monthly water expenditure, and household income, are collected using a ratio scale. The ratio-scale data are divided into five equal-interval classes to use in WSI calculation.
The water quality indicator is assessed by a water quality index (WQI) developed by the Canadian Council of Ministers of the Environment (CCME) [43]. The CCME index allows flexibility in parameter selection and application of national water quality standards [44]. Eight water quality parameters, such as temperature, color, pH, turbidity, electrical conductivity (EC), total dissolved solids (TDS), iron (Fe), and E. coli, are tested to develop the WQI. Temperature is included as water in slums is often stored in open tanks exposed to sunlight, affecting pH, E. coli and other parameters. Color is included as discoloration may indicate presence of organic matter, Fe or other metals. Also, two water quality experts have been consulted to select the parameters. Water samples are collected from three water sources in each slum during both wet and dry seasons. The sampling locations include the main community water point and two household-level water storage points. In total, 30 water samples are collected from the five study sites and analyzed at the laboratory of the Institute of Water and Flood Management following standard procedures. Based on CCMEWQI values, the water quality is divided into five classes [43]: 0–44 (poor), 45–64 (marginal), 65–79 (fair), 80–94 (good), and 95–100 (excellent).
The waterlogging indicator is assessed using a Participatory Geographic Information System (PGIS) mapping technique [45]. The technique collects information on total settlement areas, extent of waterlogged areas, and locations of water bodies and drainage networks. The frequency, depth, and duration of waterlogging are also collected during the mapping. Slum-level intensity of waterlogging is derived from the frequency, depth, duration and extent of waterlogging, and impact of waterlogging from the degree of exposure of houses, household assets, activities and income.
To obtain a deeper understanding of local water security conditions and validate survey findings, several participatory tools, such as FGDs, IDIs and key informant interviews (KIIs), are also used. A total of 12 FGDs are conducted with different groups of people in the study slums. Each FGD includes six to eight participants. In addition, 26 IDIs are conducted with slum dwellers who have lived in slums for a long period and experienced severe water insecurities. Furthermore, 12 KIIs are conducted with representatives from DWASA, non-governmental organizations (NGOs), community leaders, slum managers, academicians, and local health workers. These interviews provide valuable insights into existing water security challenges, institutional arrangements, and potential intervention strategies. FGDs, IDIs, and KIIs are conducted using checklists.

3. Results

3.1. Indicators and Variables of Water Security

The reconnaissance visits made to the study slums and subsequent FGDs conducted indicate a wide range of water security issues and challenges. Some issues and challenges are common to the slums, while others are specific to the individual slums. Based on the findings from the field activities as well as review of the relevant literature [10,12,14,35], a set of indicators is identified to represent the five dimensions of water security. Water availability, accessibility, affordability, and quality are identified as indicators of the water supply dimension. Access to improved toilet facilities, challenges associated with existing toilet facilities, access to improved bathing facilities, challenges associated with existing bathing facilities, access to safe MHM facilities, and awareness about MHM are identified as indicators of the sanitation and hygiene dimension. The water-environment dimension can be represented by the presence of improved drainage systems, sewerage systems, household waste collection systems and by the condition of water bodies around the slums. Waterlogging risk, heat stress risk, and adaptive capacity are identified as the indicators of water and climatic risks. Heat stress is included as it directly affects water supply, use and resources. The capacity of slums for WASH management, participation of slum people in WASH decisions, and institutional support available for WASH facilities and awareness are identified as indicators of water governance dimension. Altogether 20 indicators are identified for the five water security dimensions. To represent these indicators, a total of 53 variables (discussed in next section) are identified.

3.2. Indicator and Variable Scores Under Different Dimensions

3.2.1. Water Supply Dimension

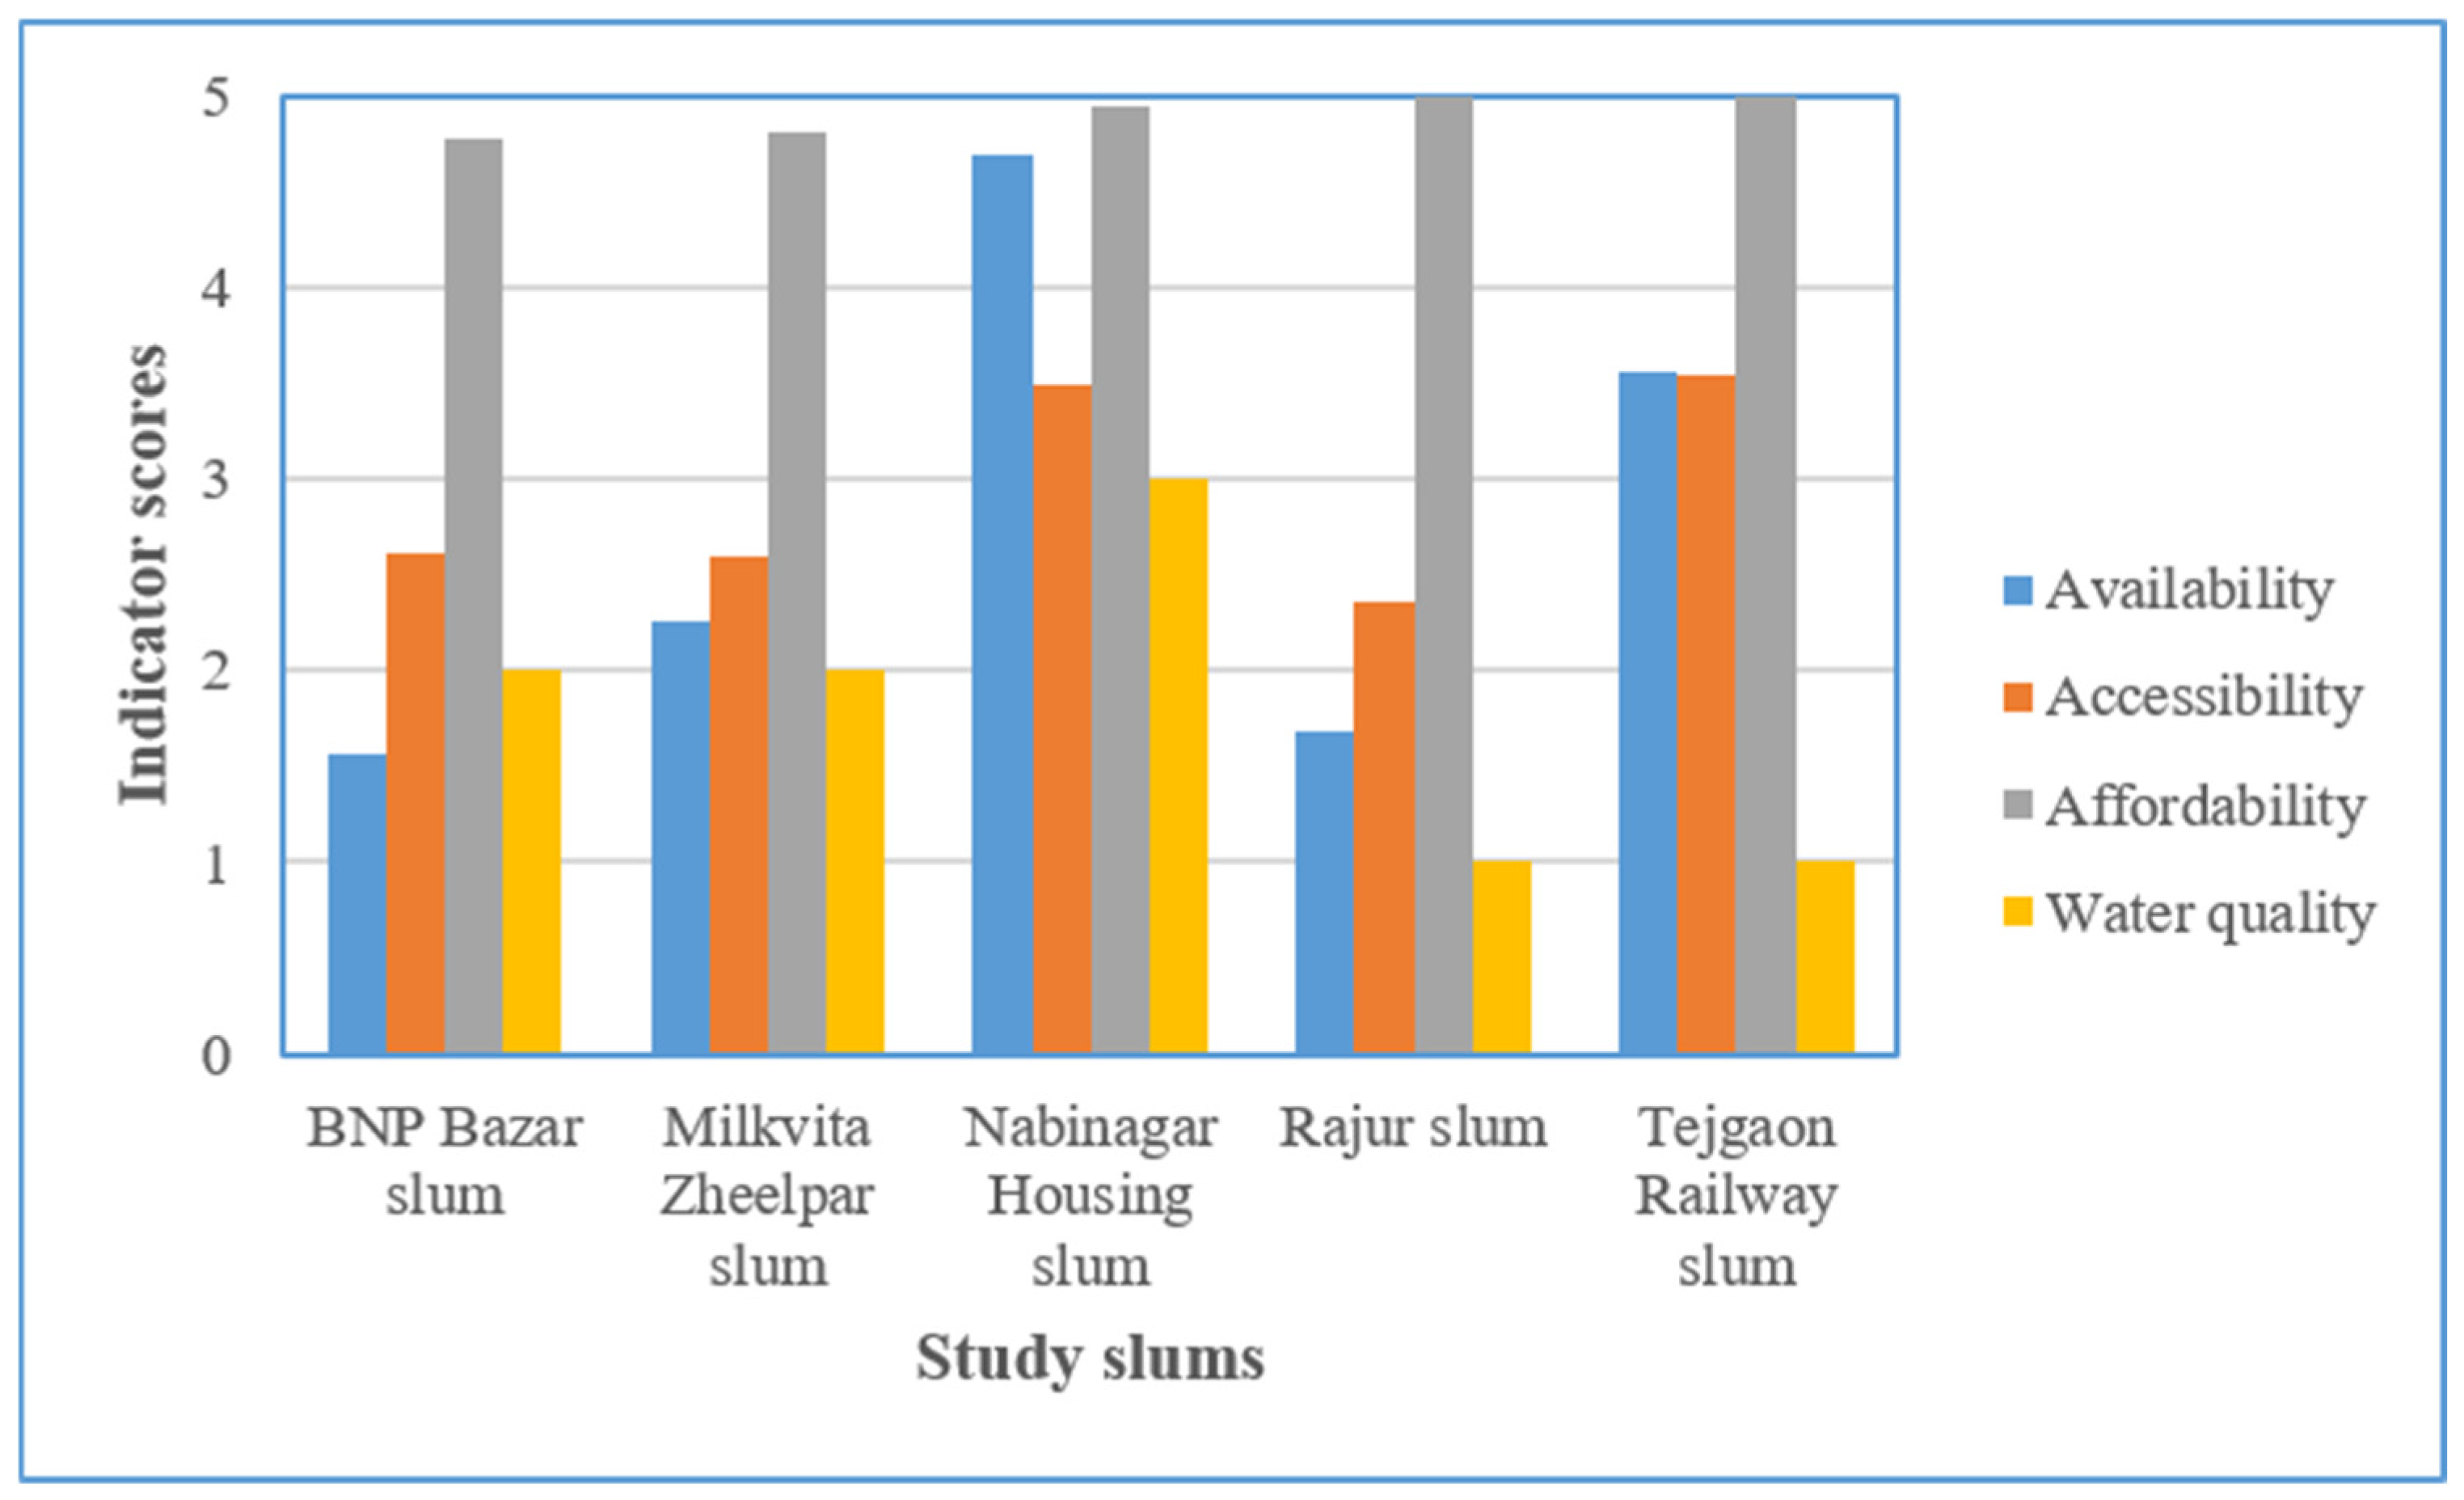
The scores of different indicators under the water supply dimension are given in Figure 2. Among the study slums, the Nabinagar Housing slum scores higher in water availability and quality indicators. In contrast, the Tejgaon Railway and Rajur slums score lower in water quality. Also, BNP Bazar slum and Rajur slum score lower in water availability. Overall, the findings indicate substantial variation in water supply indicators across the study slums.
Water availability is assessed based on the type and ownership of water sources, the duration and reliability of daily water supply, household-to-water-point ratio, and the impacts of supply intermittency on household routines (Table 3). The findings reveal notable differences in water availability variables among the study slums. Nabinagar Housing slum has the highest score on this indicator (4.69), primarily due to its access to legal water connections provided by the relevant authorities. In contrast, the Rajur slum, which relies largely on illegal connections, as well as BNP Bazar and Milkvita Zheelpar slums, which have a combination of legal and illegal connections, have relatively poor scores of 1.69, 1.56 and 2.27, respectively. These slums are characterized by a short duration of supply and an insufficient number of functional water points relative to requirements. Also, in the study slums, except for Nabinagar Housing slum, water supply is intermittent and supply schedules are often poorly communicated or inconsistently maintained, leading to low user knowledge on distribution timings. The respondents report that unpredictable water supply requiring water collection at uncertain times disrupts household activities and disturbs sleeping patterns. Although Tejgaon Railway slum also experiences intermittent supply, it is relatively reliable as the distribution schedule is consistently maintained and better understood by the residents. This consistency contributes to better user satisfaction compared to other slums with similar supply patterns but weaker operational reliability.
Water accessibility is assessed using daily water use, access to safe drinking water, burden for water collection, time spent on water collection, and conflicts faced during water collection (Table 4). The findings indicate that Nabinagar Housing slum scores are better regarding access to safe drinking water (5.00) as the primary water source is a deep tube well owned by the landowner. In Tejgaon Railway slum, the residents primarily collect water from a nearby DWASA Automated Teller Machine at a low cost (BDT 0.80/liter). In addition, some low-income households boil supplied water due to availability of gas connections. In contrast, the remaining three slums—BNP Bazar, Milkvita Zheelpar, and Rajur—depend largely on illegal water connections. In these slums, households either collect drinking water from alternative nearby sources or consume supplied water without boiling. Thus, access to safe drinking water is limited for these slums (score 2.00). Across the study slums, the burden of water collection varies by gender and location. In Tejgaon Railway slum, water collection responsibility is shared among women, adolescent girls, and, to a lesser extent, some men (score 3.14). In contrast, in BNP Bazar, Milkvita Zheelpar, and Nabinagar Housing slums, the responsibility is predominantly borne by women and adolescent girls (scores 2.92, 2.60, and 2.41, respectively). In Rajur slum, water collection is primarily managed by women (score 2.20).
Regarding the time spent on water collection, the respondents from Nabinagar Housing and Tejgaon Railway slums report relatively shorter collection times of approximately 15–30 min, attributing to the availability of adequate water points and more reliable supply systems (scores 3.21 and 3.49, respectively). Conversely, the residents of BNP Bazar, Milkvita Zheelpar, and Rajur slums reported longer collection times of 30–60 min (scores 2.76, 2.75, and 2.54, respectively), largely due to lower user-to-point ratios and limited access efficiency. Overall, the variation in water collection time across the slums is relatively modest, reflecting the high-density settlement pattern in which water points are generally located in close proximity to households, thereby limiting long-distance travel requirements. Incidence of conflict related to water collection tasks varies across the study slums depending on the adequacy of water access points. The respondents from Nabinagar Housing and Tejgaon Railway slums report relatively lower levels of conflict, reflecting more sufficient water point coverage (scores 3.78 and 3.05, respectively). In contrast, the respondents from BNP Bazar, Milkvita Zheelpar, and Rajur slums report comparatively higher occurrences of occasional conflict, which they attribute to inadequate water points and lower user-to-point ratios (scores 2.49 to 2.81).
Water affordability is assessed based on household expenditure on water services and the ability to afford these costs. The affordability scores are found to be 4.78, 4.81, 4.94, 5.00 and 5.00 for BNP Bazar, Milkvita Zheelpar, Nabinagar Housing, Rajur and Tejgaon Railway slums, respectively. The households in the study slums spend between BDT 100 and 500 per month on household water, which most respondents find affordable. Nabinagar Housing slum and Tejgaon Railway slum, both of which have access to legal water connections, generally pay water charges as part of their monthly rent or through formal billing arrangements. In contrast, slums lacking legal water connections incur relatively higher total water-related expenditures. Households in these settlements often bear dual costs: payments for illegal water connections for general household use, and additional expenses for obtaining drinking water from alternative legal sources.
The water quality test results (Table 5) indicate that temperature, pH, TDS and EC are within the Bangladesh and WHO guideline values for all samples. The results also indicate that the water quality in Rajur and Tejgaon Railway slums falls under the ‘poor’ category (WQI: 0–44) with a score of 1.00, and that in BNP Bazar and Milkvita Zheelpar slums falls under ‘marginal’ category (WQI: 45–64) with a score of 2.00. In contrast, Nabinagar Housing slum has a comparatively better water quality in the ‘fair’ category (WQI: 65–79) with a score of 3.00, primarily due to its reliance on a deep tube well.

3.2.2. Sanitation and Hygiene Dimension

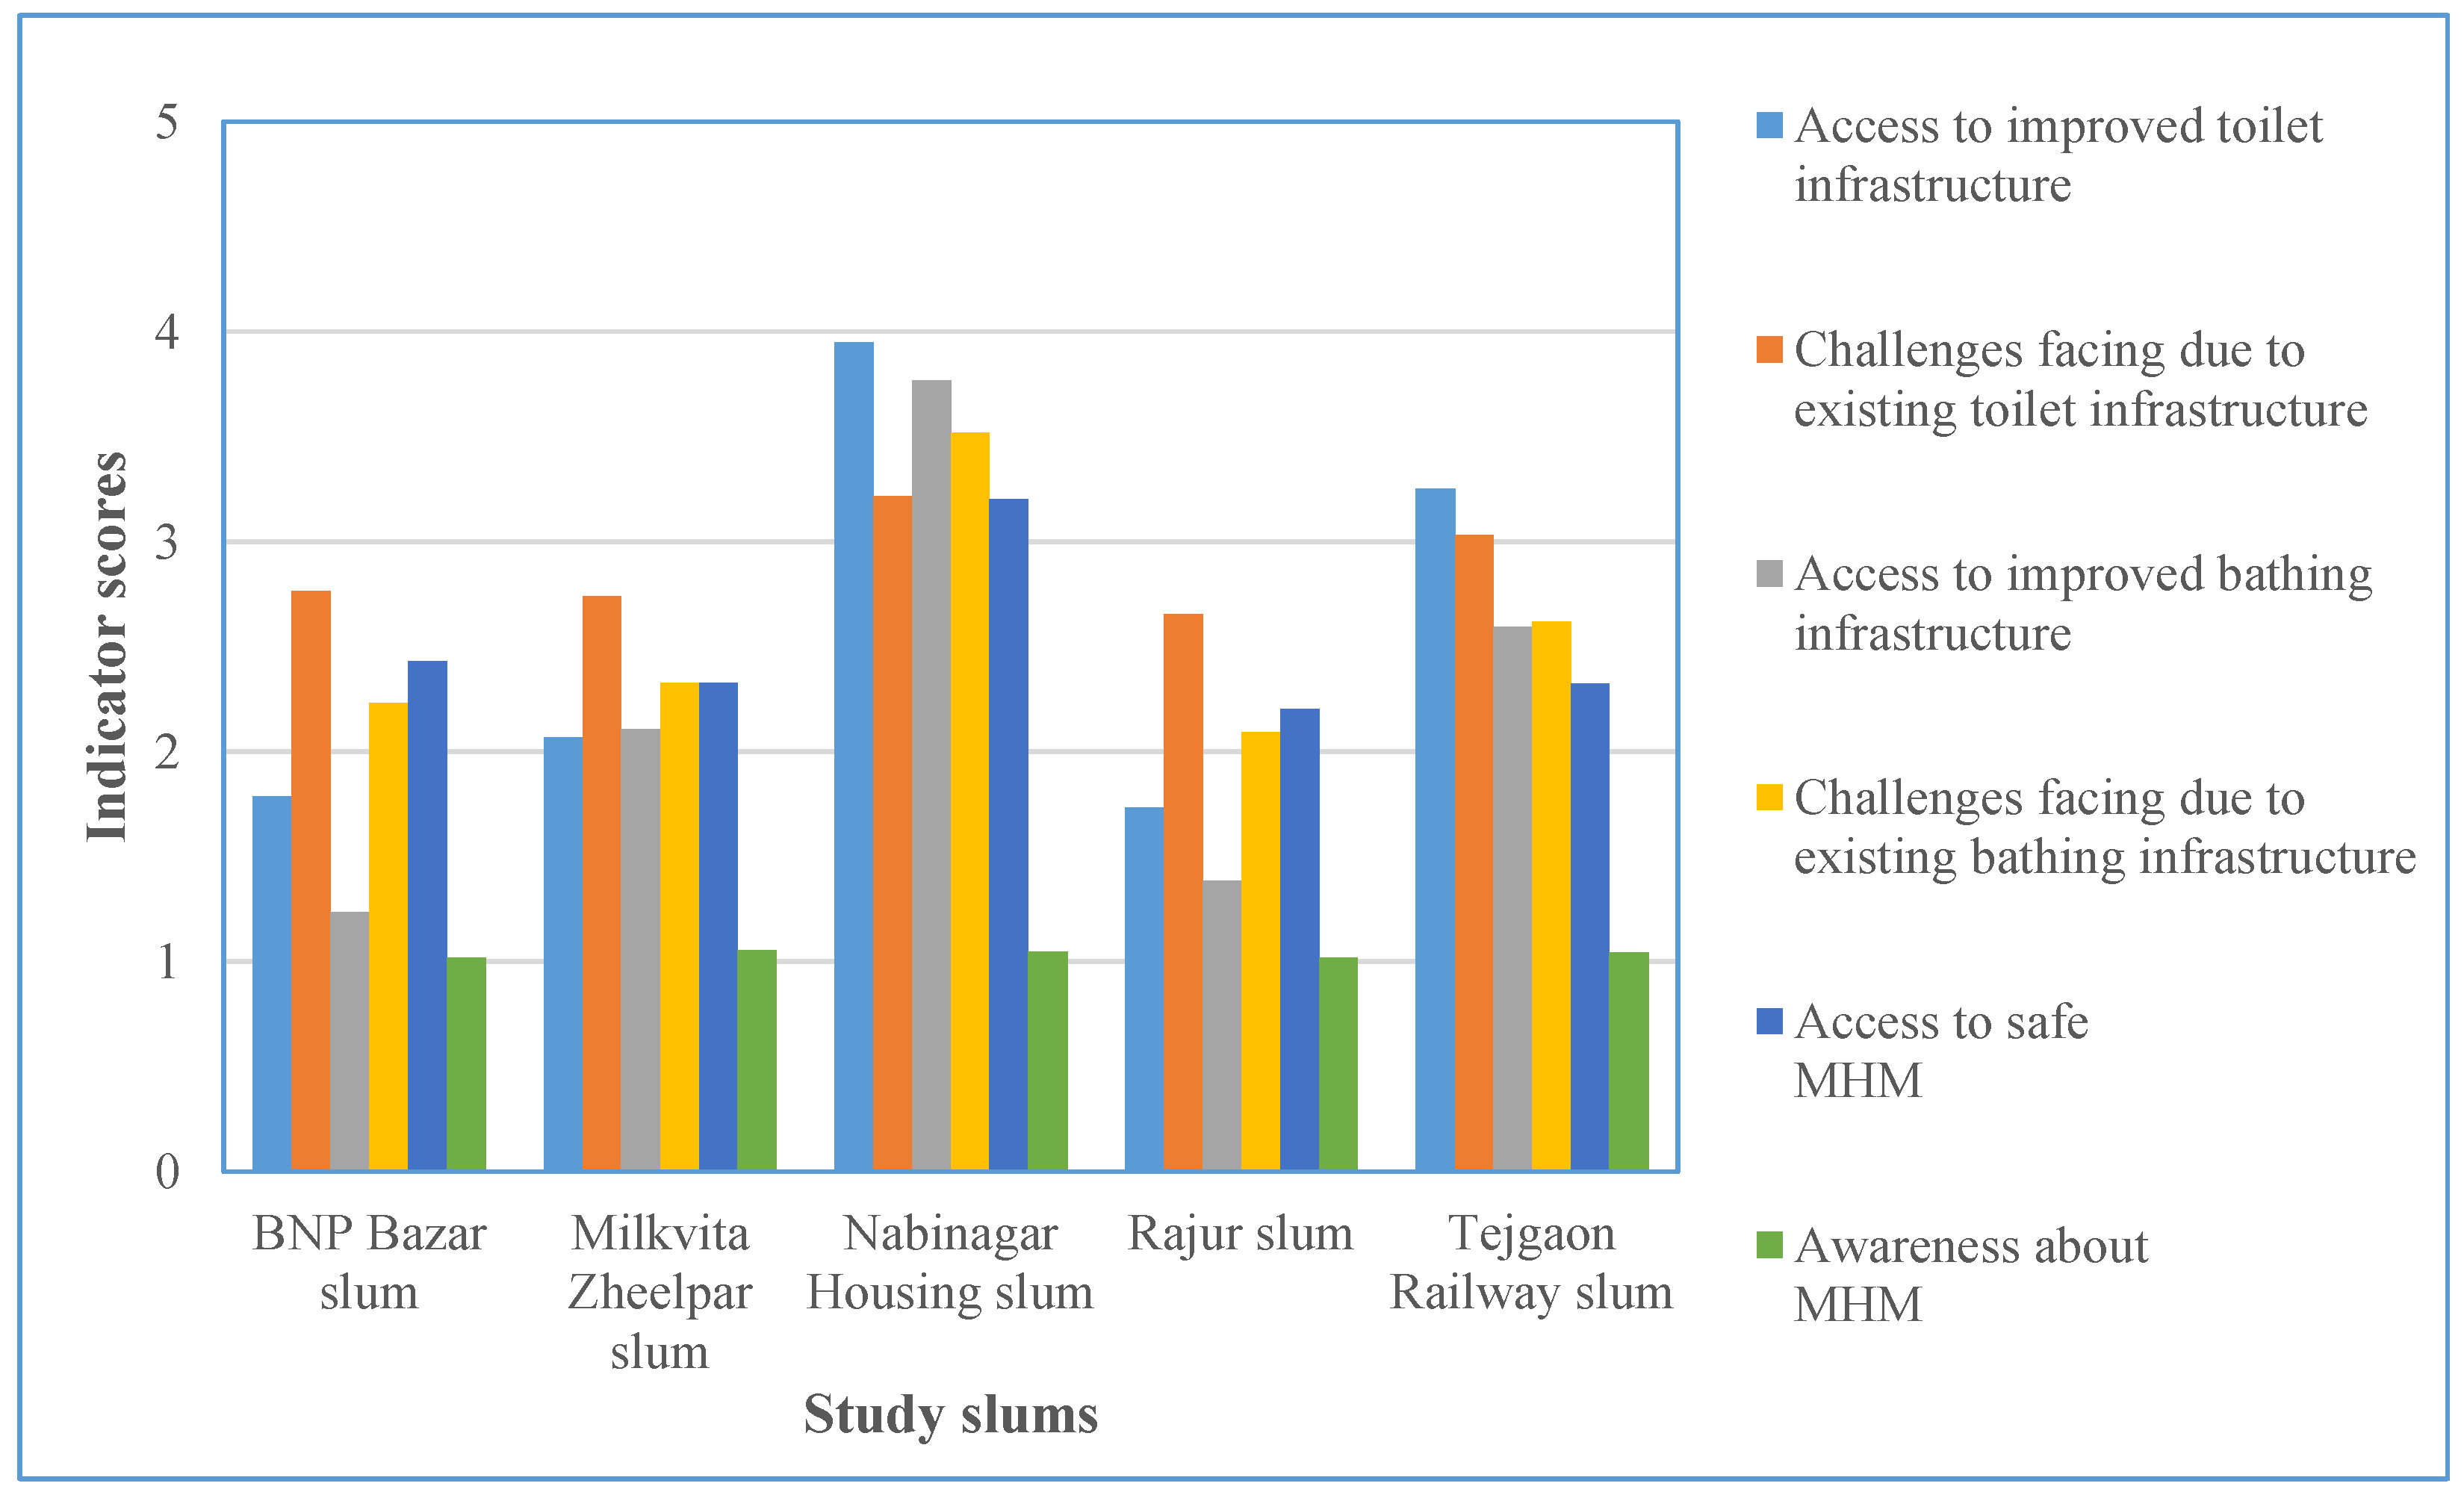
The scores of different indicators under sanitation and hygiene dimension are given in Figure 3. BNP Bazar and Rajur slums score low on access to bathing and toilet infrastructure. Nabinagar Housing slum scores better than the other slums in all indicators.
Access to improved toilet facilities is assessed using several variables including type of toilet, adequacy of toilets, availability of water and lighting in toilets, condition of toilet superstructure, and distance between house and toilet (Table 6). The findings reveal marked disparities in access to toilet facilities across the study slums, largely influenced by land tenure and availability of basic urban services. Slums on large vacant or unplanned land, such as Rajur, BNP Bazar, and Milkvita Zheelpar slums, generally exhibit poorer performance in this indicator. In contrast, slums on privately or government-owned land with relatively better access to basic services have comparatively better conditions. In most study slums, except for Nabinagar Housing slum, water supply facilities within toilets are largely absent. Furthermore, in Rajur, BNP Bazar, and Milkvita Zheelpar slums, which are on illegally occupied land, the absence of lighting facilities in toilets compromises the usability, hygienic conditions and safety during nighttime.
The indicator, challenges faced due to existing toilet facilities, is assessed using variables related to the ability to use toilets independently at night, restricting drinking water intake to avoid frequent toilet use, practicing handwashing, and the reported incidence of waterborne diseases (Table 7). The findings indicate that inadequate sanitation facilities and poor management create significant challenges across the study slums. The insufficient number of shared toilets, combined with limited maintenance, results in unhygienic conditions. Consequently, women and adolescent girls, who spend most of their time within the slums, frequently restrict their water consumption to avoid repeated use of sanitation facilities, particularly in Rajur, BNP Bazar, and Milkvita Zheelpar slums. Such coping behavior can contribute to a higher prevalence of urinary tract infections (UTIs) among women. In Nabinagar Housing and Tejgaon Railway slums, although sanitation facilities are comparatively better organized, shared usage still poses safety and privacy concerns at nights.
The indicator on access to improved bathing facilities is assessed using two variables: the adequacy of bathing facilities and the condition of existing bathing facilities (Table 8). The findings reveal substantial disparities across the study slums in both availability and quality of bathing spaces. BNP Bazar and Rajur slums exhibit particularly poor scores in adequacy, with sharing ratio exceeding 15 households per bathing facility. Also, the physical condition of bathing facilities is generally poor across most slums, except for Nabinagar Housing slum.
In most slums, bathing spaces are either open or only partially enclosed using temporary materials such as cloth or makeshift coverings. Many of these facilities are located along roadsides, raising concerns regarding privacy, dignity, safety, and hygiene.
The indicator on access to safe MHM is assessed using two variables: access to hygiene materials, such as sanitary pads and clean cloths, and access to private spaces for MHM (Table 9). Rajur and Milkvita Zheelpar slums score low on access to hygiene materials for MHM. Tejgaon Railway, BNP Bazar, Milkvita Zheelpar and Rajur slums score low on access to private places for changing and laundering.
The indicator on knowledge and awareness of MHM is assessed using a single variable. The results indicate uniformly low scores of 1.02–1.05 across the slums, suggesting limited understanding and awareness of appropriate MHM practices among women and adolescent girls.

3.2.3. Water Environment Dimension

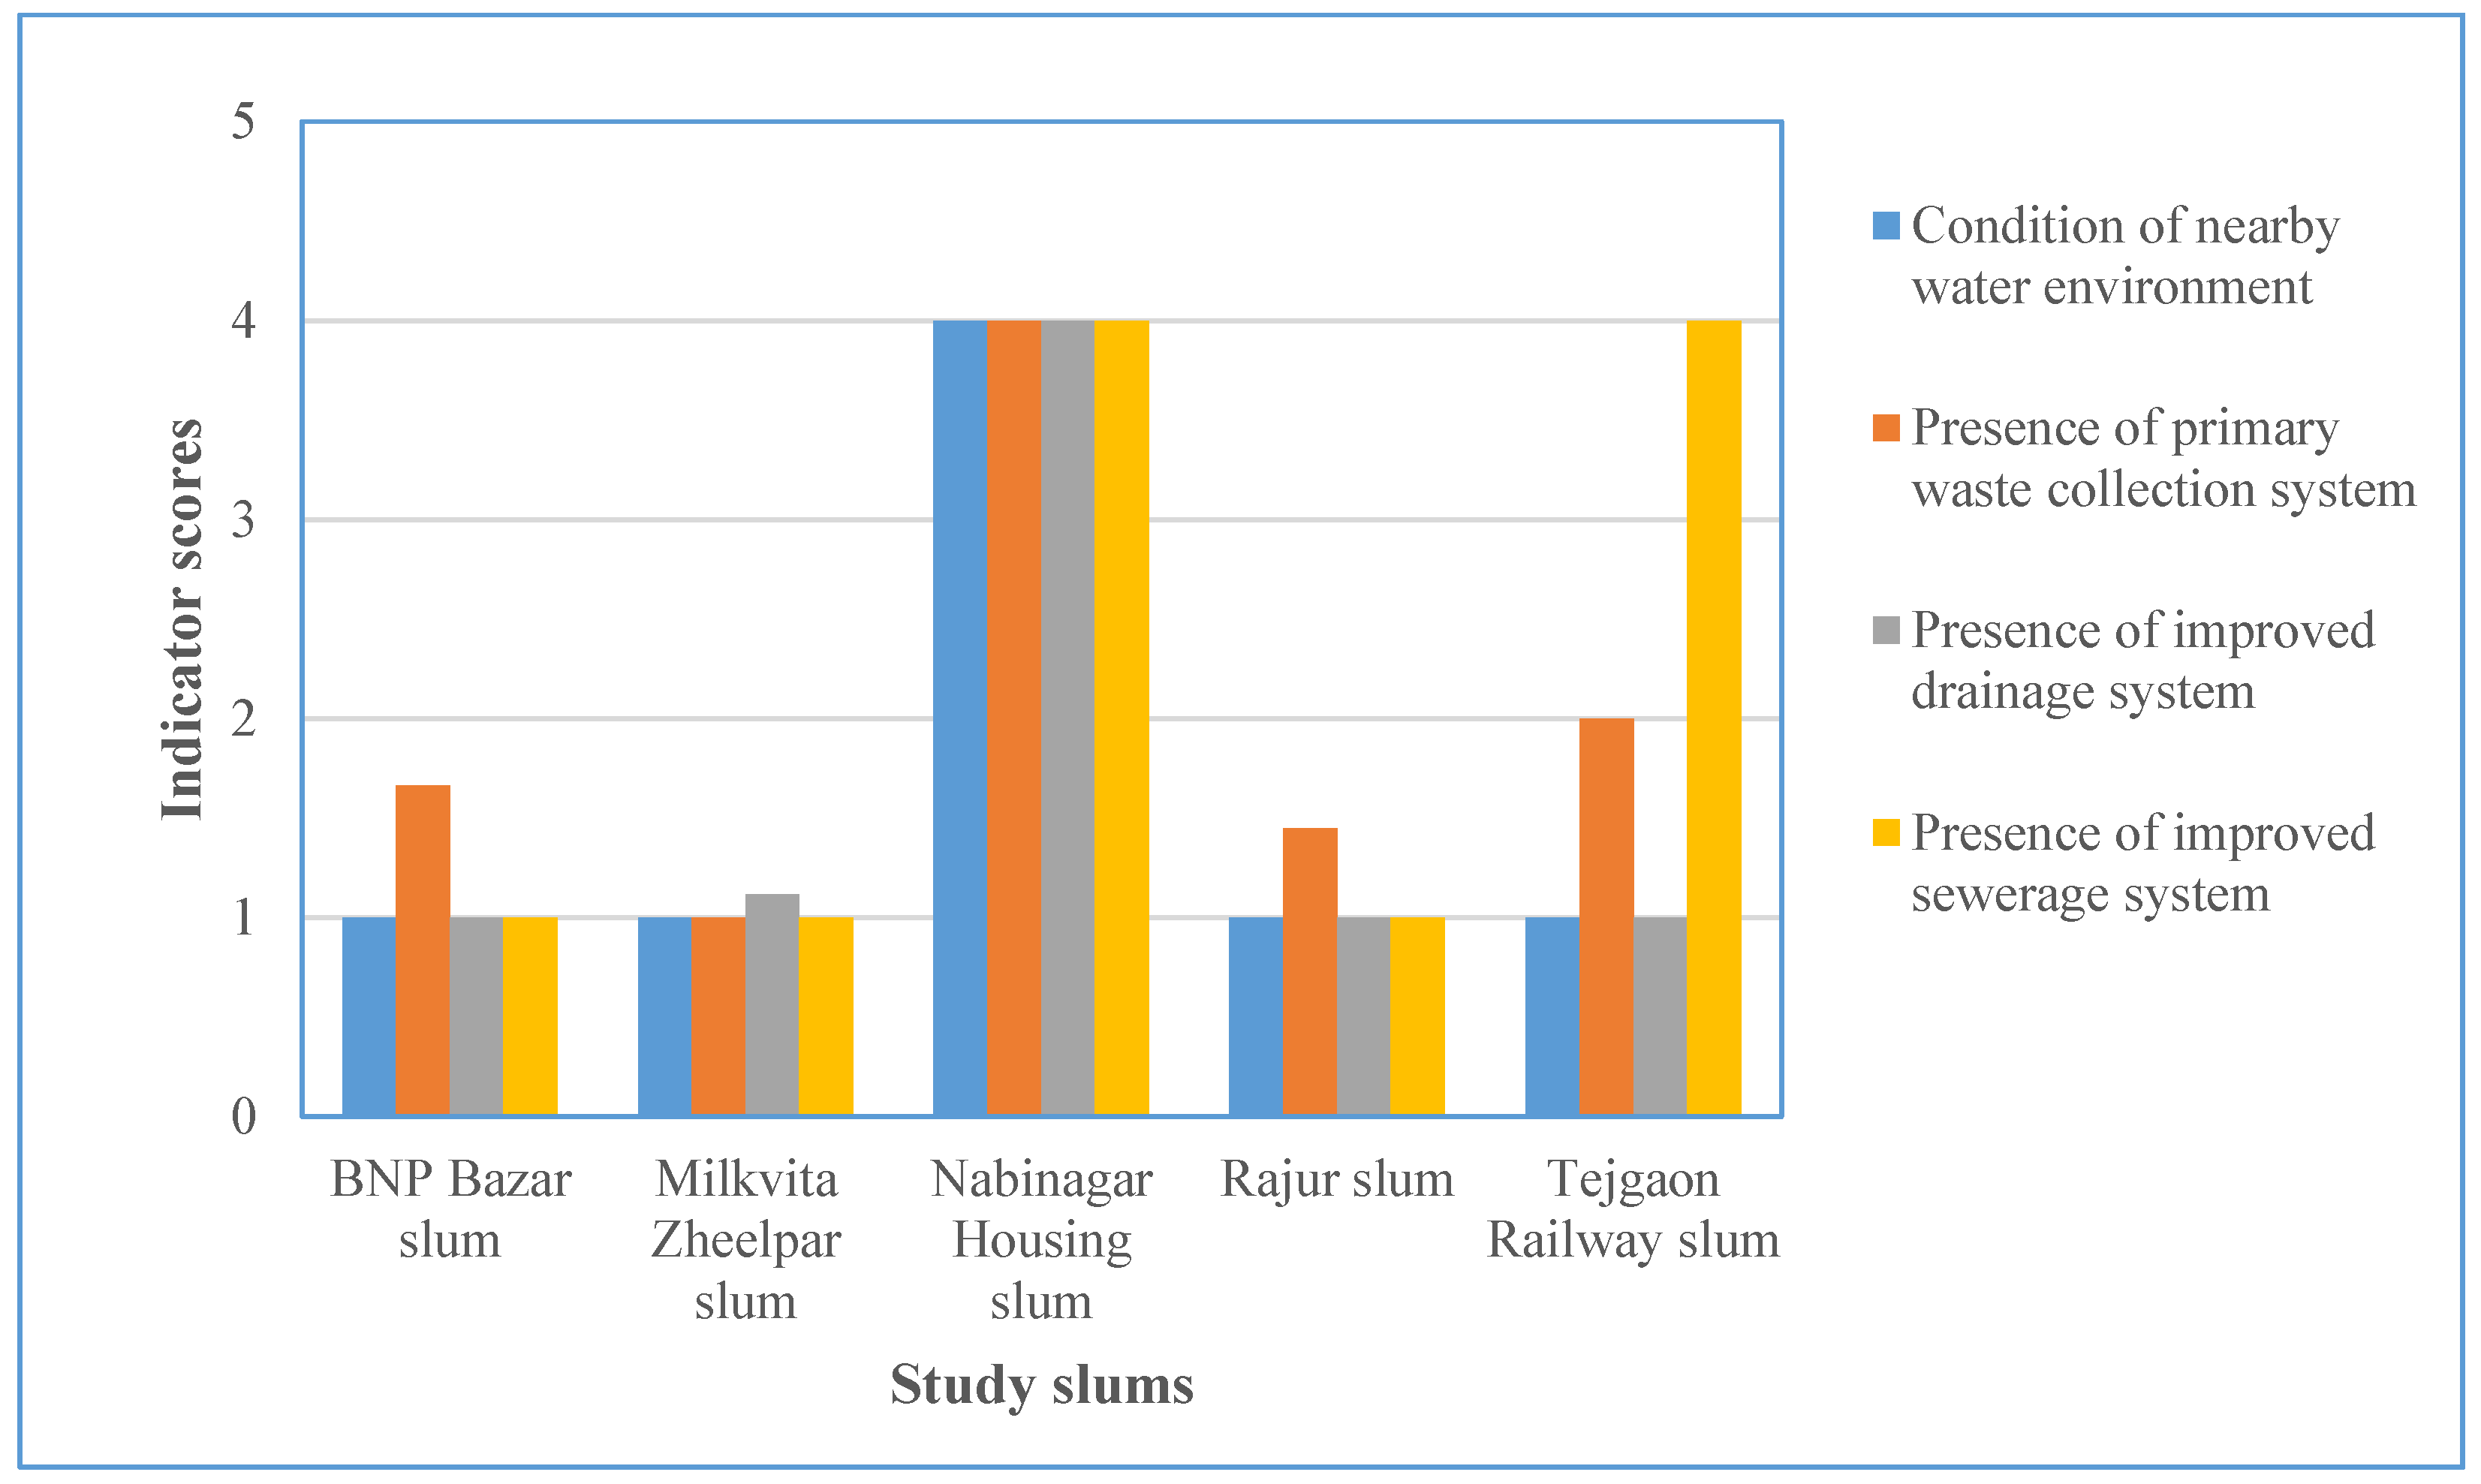
This dimension is assessed by four indicators (Figure 4). Each indicator is assessed by a single variable.
The condition of adjacent surface water bodies is poor in all slums, except for Nabinagar Housing slum, due to the direct disposals of solid waste and untreated toilet sewage into the nearby watercourses by the residents. These practices have significantly deteriorated water quality and contributed to environmental contamination within and around the settlements.
Nabinagar Housing slum has a regular waste collection service. Tejgaon Railway slum has a waste collection service, but the service is irregular. In BNP Bazar and Rajur slums, only a small proportion of families report paying for waste disposal services. In Milkvita Zheelpar slum, no formal primary waste collection system exists. As a result, households that are not covered by waste collection services frequently dispose of solid waste in nearby water bodies or on vacant open spaces.
BNP Bazar, Rajur and Milkvita Zheelpar slums are not connected to the municipal sewerage network. In contrast, Nabinagar Housing and Tejgaon Railway slums are connected to the formal municipal sewerage system. However, in Tejgaon Railway slum, the sewerage infrastructure is integrated with the drainage system, resulting in a narrow and partially open combined drainage–sewerage channel. Although this system exists, it requires regular maintenance, which is not adequately carried out, thereby limiting its overall effectiveness.
Nabinagar Housing and Tejgaon Railway slums have comparatively better drainage conditions due to their connection with the municipal drainage system. In contrast, BNP Bazar, Milkvita Zheelpar, and Rajur slums are not connected to the formal city drainage network and therefore exhibit poor drainage conditions.

3.2.4. Water and Climatic Risks Dimension

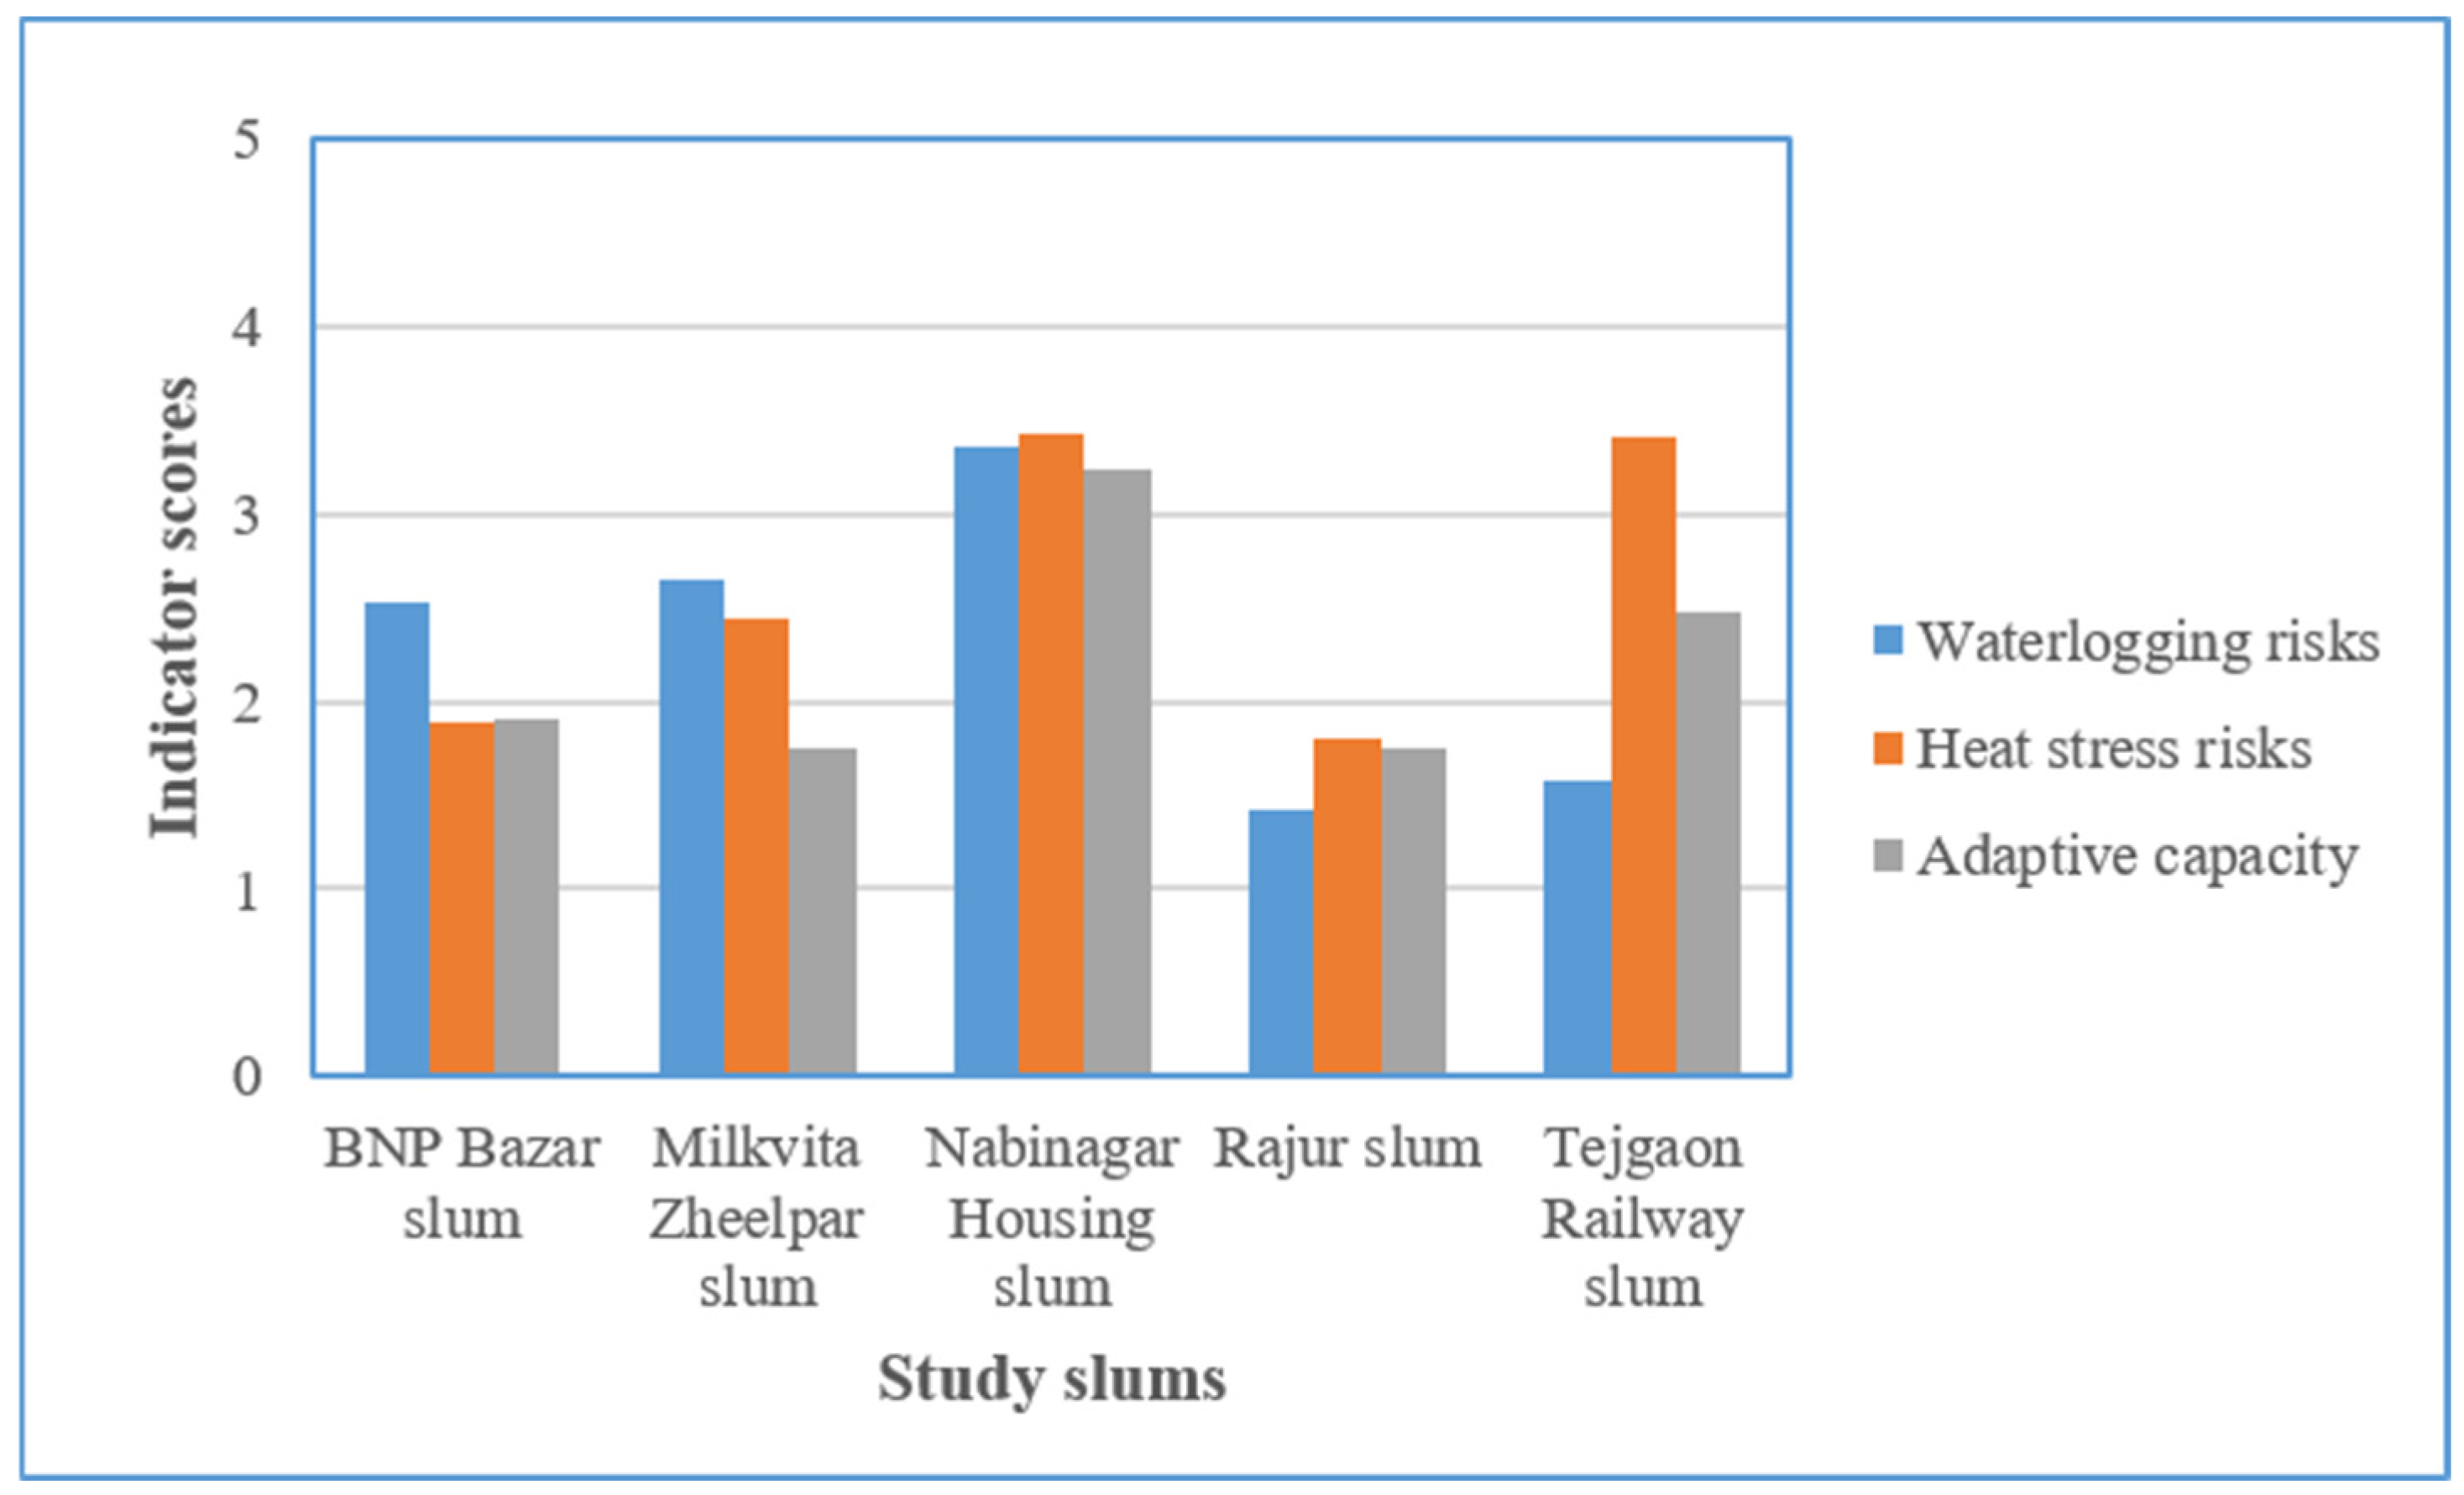
This dimension is assessed by three indicators: waterlogging and heat stress risks, and adaptive capacity (Figure 5). It is to be noted that the risk indicators are reverse-coded with high scores indicating low risks and hence high water security.
The waterlogging risk indicator is assessed using multiple variables, including the intensity of waterlogging and the impacts of waterlogging on household assets, income, and household activities (Table 10). The results indicate wide variation in waterlogging risks across the study slums. The intensity of waterlogging is the highest in Rajur and Tejgaon Railway slums facing higher frequency and duration of inundation, moderate in BNP Bazar and Milkvita Zheelpar slums, and very low in Nabinagar Housing slum. A similar spatial pattern is observed in socioeconomic impacts of waterlogging, with severe impacts in slums with higher intensity of waterlogging.
Heat stress risk is assessed using two variables: housing material and density, and occupational exposure of respondents. Nabinagar Housing slum and Tejgaon Railway slum have better scores (4.00) in housing material and density. In contrast, Rajur (1.00), BNP Bazar (1.00), and Milkvita Zheelpar (2.00) slums have poorer scores, as most dwellings are densely clustered and constructed primarily from corrugated iron sheets for both walls and roofs. Such housing conditions significantly exacerbate indoor heat accumulation, making dwellings uncomfortable and often unsuitable to live during heatwave periods. In occupational exposure to heat stress, the slums have similar scores (2.60–2.90), since most of the respondents work outdoors as day laborers, rickshaw pullers, autorickshaw drivers and street hawkers. This indicates limited variation in occupation-related vulnerability to heat stress among the surveyed population.
Adaptive capacity is assessed using house type and monthly household income. Nabinagar Housing and Tejgaon Railway slums have better housing structures, with scores of 3.84 and 3.35, respectively, due to a predominance of semi-pucca structures along with some kutcha and pucca dwellings. In contrast, the remaining three slums with scores of 2.00 to 2.05 are characterized mainly by kutcha and some semi-pucca house types, reflecting lower structural quality. Households in Nabinagar Housing slum reported relatively higher monthly incomes, typically ranging from BDT 10,000 to 20,000, largely due to diversified livelihood activities including small businesses, with both male and female members engaging in income-generating activities (score 2.62). Conversely, in the other slums, household income generally ranges between BDT 10,000 and 15,000, with respondents primarily engaged in low-paid informal occupations such as day laboring, rickshaw pulling, and domestic work, while some women reporting no formal income-generating activities. Accordingly, these slums exhibit lower adaptive capacity scores (scores 1.50 to 1.76).

3.2.5. Water Governance Dimension

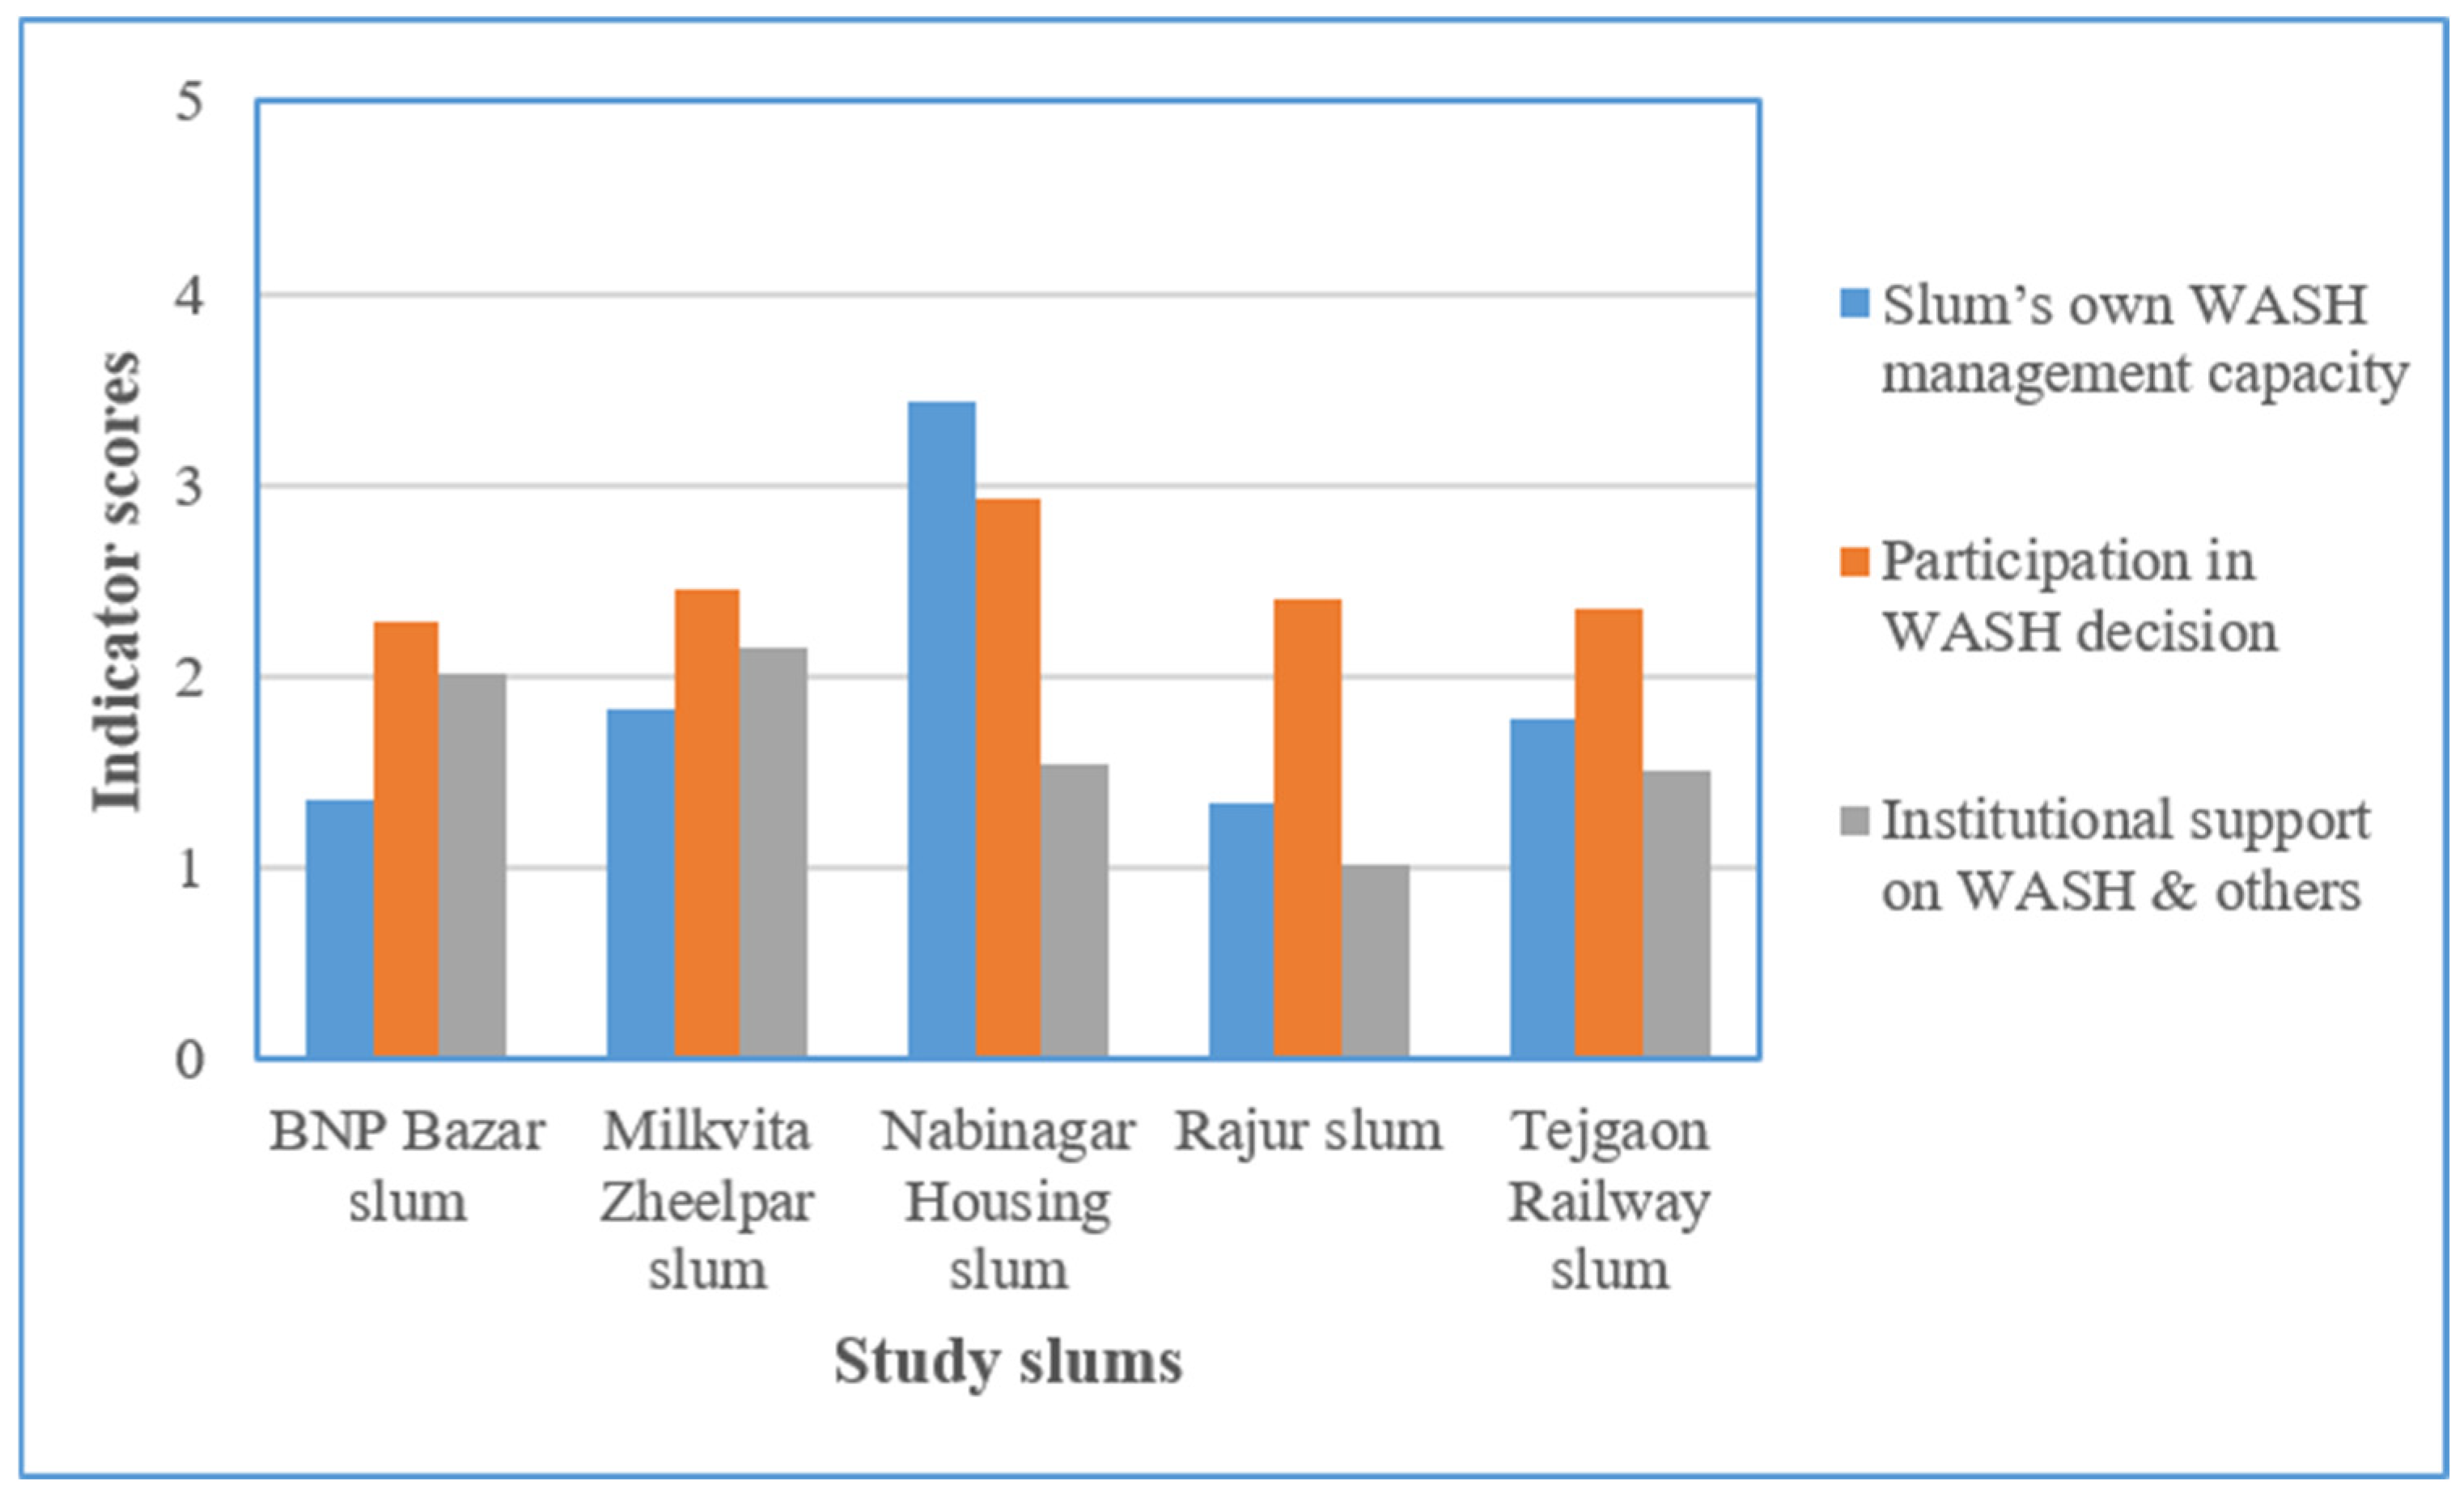
This dimension is assessed by three indicators: resource, agency and institutional support (Figure 6).
The resource indicator is assessed based on the capacity of slum communities and households to address their own water insecurity challenges. The variables considered include the presence and location of the slum manager or slum management authority, and the educational status of the respondents (Table 11). Nabinagar Housing slum has a manager residing in the slum and has comparatively better management (score 5.00). In contrast, Rajur slum has a manager operating from outside the slum and has poorer management (score 1.20). Similarly, BNP Bazar, Tejgaon Railway and Milkvita Zheelpar slums also have poor management (scores 1.07, 2.00 and 2.04). Most of the respondents in the slums are either illiterate or have completed only primary education. As a result, their knowledge on WASH, citizen rights, and related social issues is generally limited, reducing their ability to effectively cope with and address water security challenges (score ranges from 1.48 to 1.88).
The indicator on participation of slum dwellers in decision-making processes related to WASH and other community issues at both household and community levels (Table 11) shows that participation in household decisions is relatively satisfactory in BNP Bazar, Milkvita Zheelpar, Tejgaon Railway, and Rajur slums (scores ranging from 3.13 to 3.31); however, participation in community decisions remains low (score ranges from 1.41 to 1.77). Nabinagar Housing slum has a comparatively higher level of community participation (score 3.00).
Institutional support is assessed based on the presence and activities of government organizations (GOs) and NGOs within the slums, considering both hardware and software interventions (Table 11). Rajur and Nabinagar Housing slums do not receive any WASH-related external support (scores 1.00 and 2.00), although an NGO-operated educational institute operates within Nabinagar Housing slum. In contrast, Milkvita Zheelpar, BNP Bazar, and Tejgaon Railway receive WASH-related hardware support primarily through NGOs, and in some cases through GOs operating via NGOs (score 3.00, 3.00 and 2.00). However, despite the presence of infrastructural support in these settlements, software-based interventions such as awareness programs on WASH and MHM, leadership development, and capacity-building activities remain limited or largely absent across all the study slums (scores 1.00 to 1.29).

3.3. Dimension-Wise and Overall Water Security in Dhaka City Slums

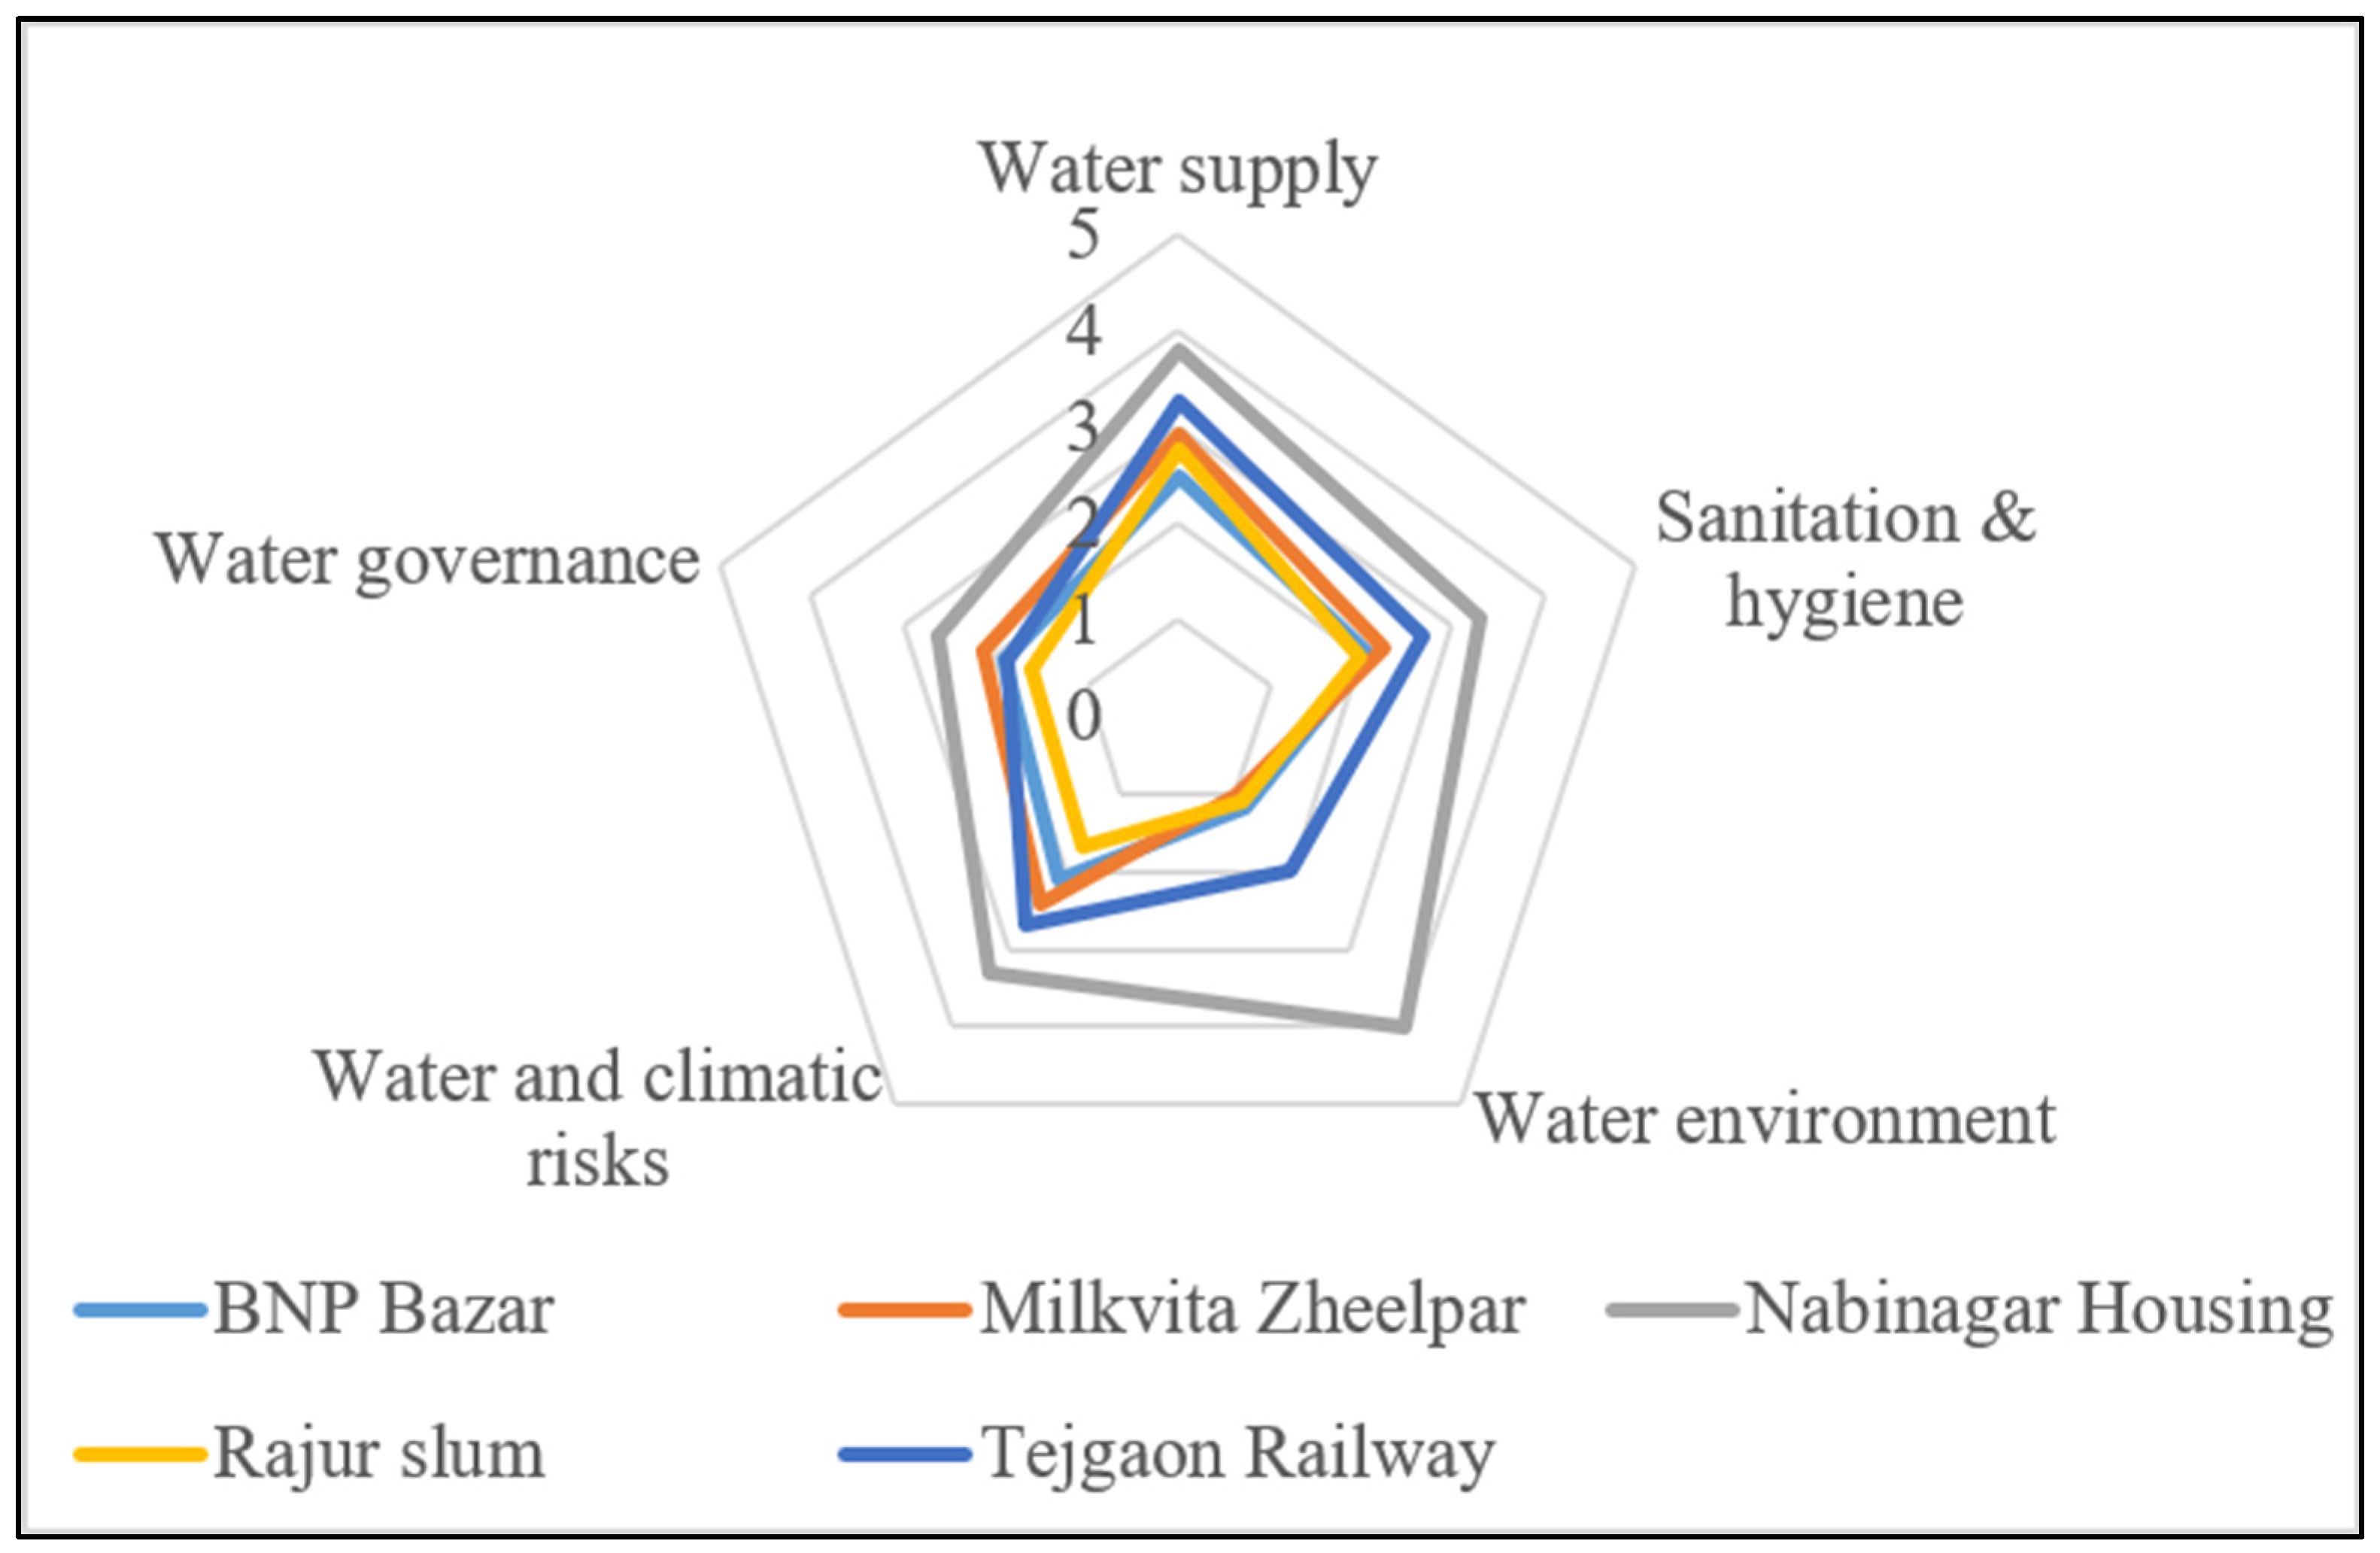
Dimension-wise water security scores, discussed in the preceding section, indicate that the Nabinagar Housing slum scores the highest in all five dimensions of water security (3.78, 3.12, 4.00, 3.34 and 2.63, out of 5.00, for water supply, sanitation and hygiene, water environment, water and climatic risks, and water governance, respectively) (Figure 7). Thus, the highest score for the slum (4.00) is in the water environment dimension and the lowest score (2.63) is in the water governance dimension. Tejgaon Railway slum scores the second highest in the first four dimensions (3.28, 2.48, 2.00 and 2.49, respectively). Its score in water governance (1.88) is similar to BNP Bazar slum’s score (1.89). Rajur slum scores the lowest in three dimensions (sanitation and hygiene, water and climatic risks, and water governance, with scores of 1.85, 1.66 and 1.59, respectively). BNP Bazar slum scores the lowest in the water supply dimension (2.49) and Milkvita Zheelpar slum scores the lowest in the water environment dimension (1.03). Thus, the lowest score in a dimension is found to be 1.03 for water environment for Milkvita Zheelpar slum and the highest score of 4.00 for Nabinagar Housing slum. Thus, there is considerable variation in scores from one dimension in a slum to another dimension to a different slum.
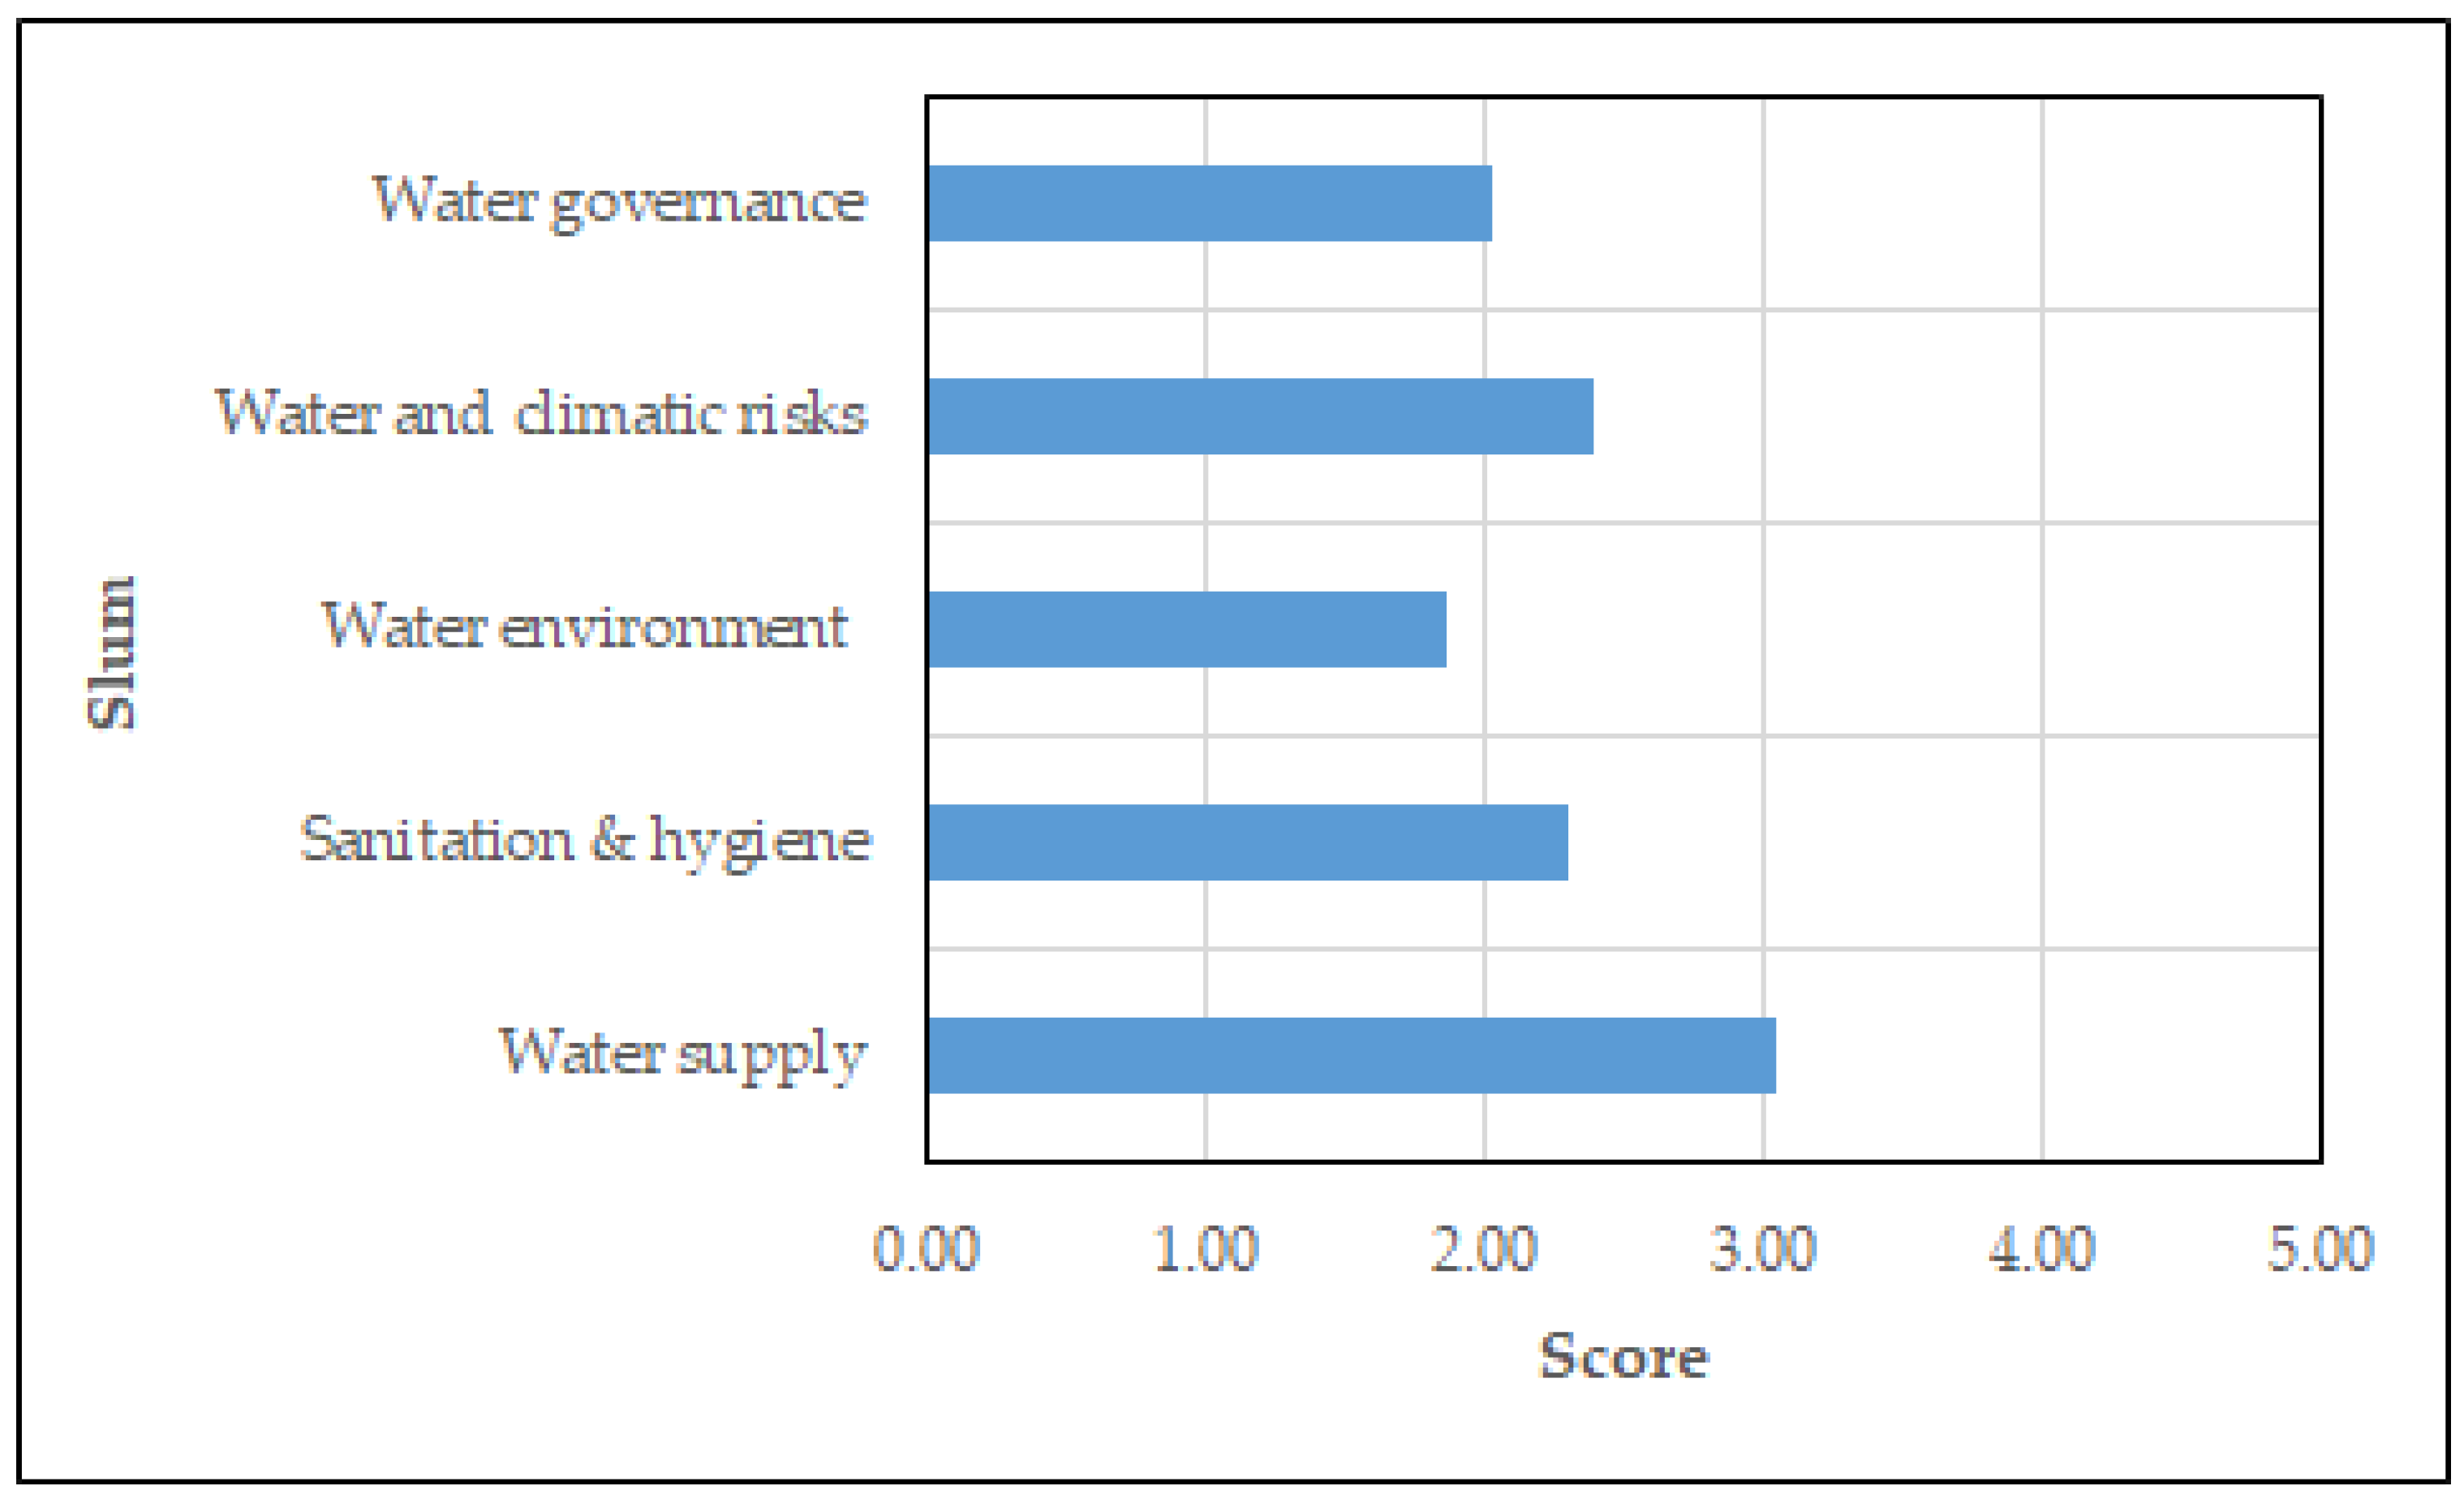
Dimension-wise water security scores are also calculated (Figure 8) by averaging the individual slum scores. The scores are found to be 3.05 for water supply, 2.29 for sanitation and hygiene, 1.86 for water environment, 2.38 for water and climatic risks, and 2.03 for water governance. Thus, the lowest score is found for water environment and the second lowest for water governance.
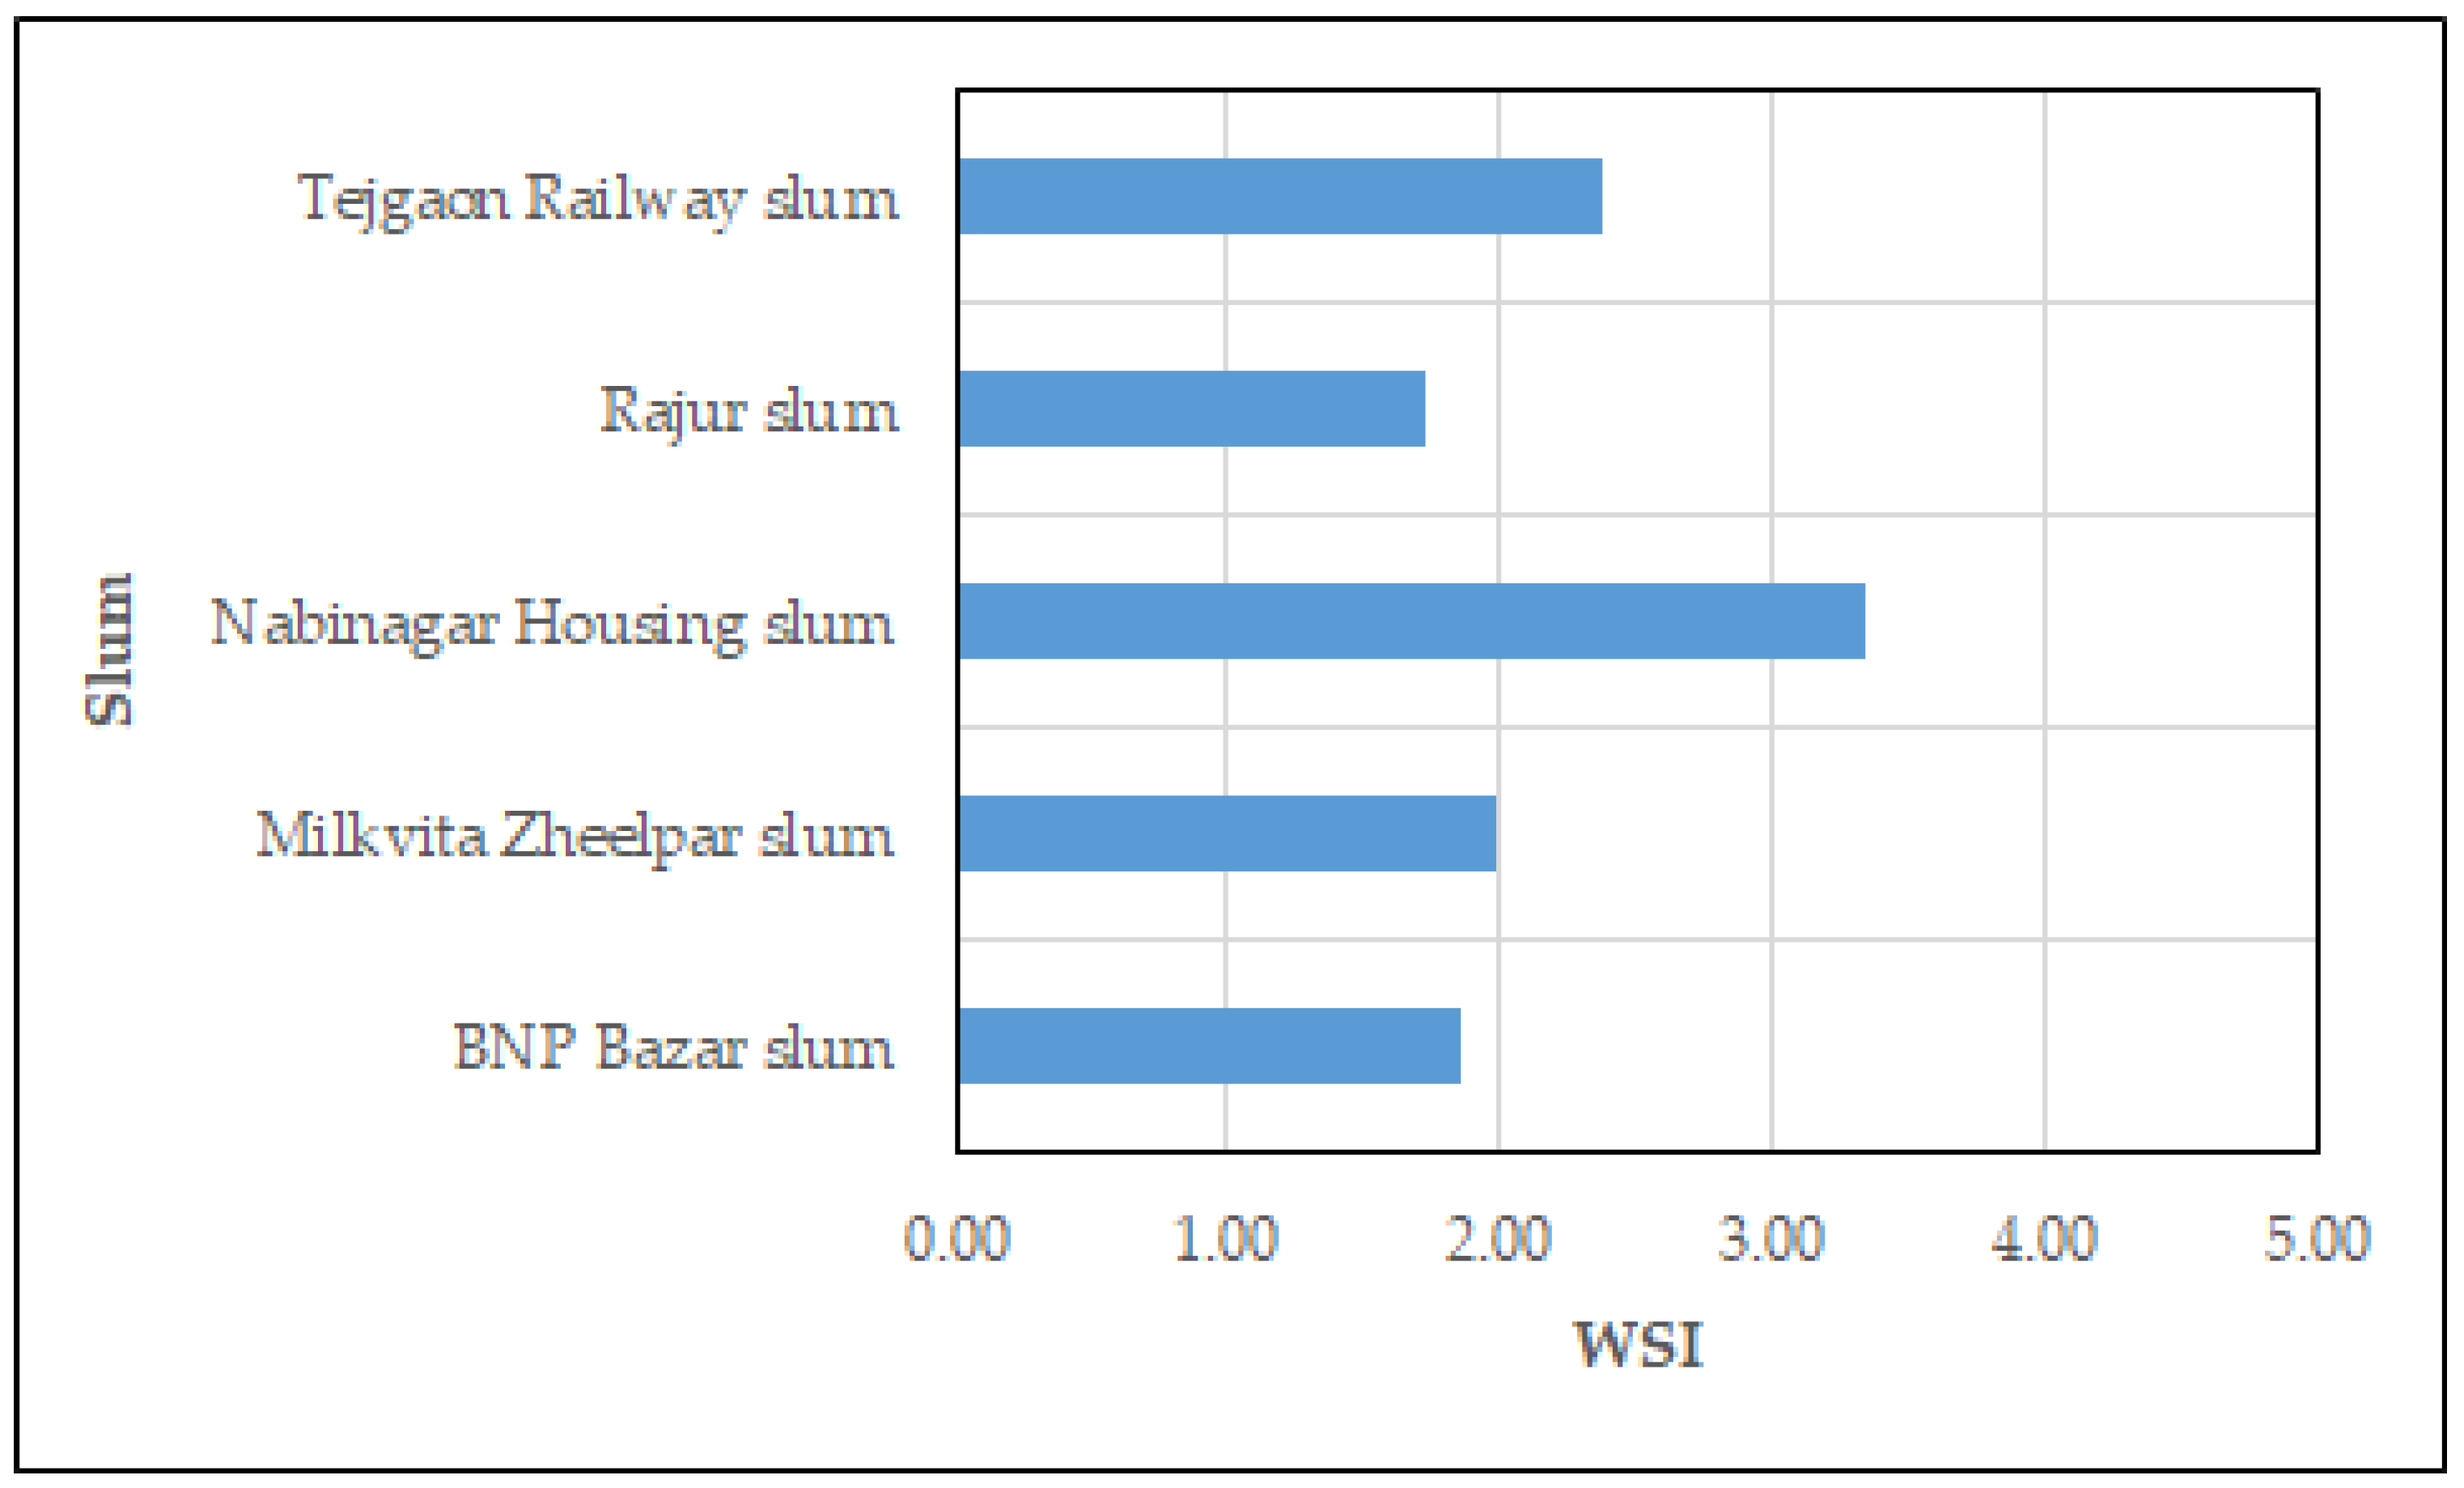
Slum-wise WSIs are given in Figure 9. The PCA on dimension scores of 286 responses extracts one principal component with an Eigen value of 3.54 and explained variance of 71%. The factor loadings are 0.87, 0.83, 0.86, 0.88 and 0.73 for water supply, sanitation and hygiene, water environment, water and climatic risks, and water governance, respectively. Therefore, the loadings of different dimensions do not vary much. Normalizing the loadings, the dimension weights are found to be 0.21, 0.20, 0.21, 0.21 and 0.17, respectively. The WSI values indicate that BNP Bazar, Milkvita Zheelpar, Nabinagar Housing, Rajur, and Tejgaon Railway slums have WSI values of 1.86, 1.99, 3.34, 1.72 and 2.38, respectively. Thus, there are large differences in water security among some of the slums. Nabinagar Housing and Tejgaon Railway slums, both with legal water supply, access to basic urban services, and some NGO interventions on education and health, achieve the highest (3.34) and second highest (2.38) WSI scores, respectively. In contrast, BNP Bazar and Milkvita Zheelpar slums, characterized by mixed legal and illegal water connections, inadequate urban services, and some GO and NGO interventions on education and WASH, exhibit lower water security levels (1.86 and 1.99, respectively). Rajur slum, which relies on illegal water supply, lacks basic urban services, and has no NGO interventions, has the lowest WSI score (1.72), indicating the most severe water insecurity. Thus, four of the five slums have a ‘Fair’ water security level (WSI of 1.5–2.4) and only one slum (Nabinagar Housing slum) has a ‘Satisfactory’ water security level (WSI of 2.5–3.4).
To see the role of dimension weights in WSI, we re-calculate the WSIs for different slums with equal weights. The WSIs are found to be 1.88, 2.02, 3.40, 1.73 and 2.41 for BNP Bazar, Milkvita Zheelpar, Nabinagar Housing, Rajur, and Tejgaon Railway slums, respectively. If we compare these values with earlier WSI values, we find that the indices are very close and the relative ranks of the slums remain the same. Thus, there is not much influence of weighting techniques on WSI values of the study slums.

4. Discussion and Recommendation

This study assesses the water security in five slums of Dhaka City in Bangladesh. The assessment considers five dimensions of water security: water supply; sanitation and hygiene; water environment; water and climatic risks; and water governance. WSI on a scale of 5.00 in Dhaka City slums has an average value of 2.26, varying from 1.72 to 3.34 depending on the slums. The average WSI for Kolkata municipality, India is found to be 7.33 on a scale of 10.00 using four components: water availability, accessibility, quality, and risks [13]. In the study, an index of 5.00 is considered as the threshold between secure and insecure water status. A WSI of 2.80 on a scale of 5.00 is calculated for Islamabad metropolis in Pakistan [10]. However, the hazard and risk dimension is not considered in the study. For the water-scarce Madaba City in Jordan, a score of 2.50 has been obtained [35]. For Bahir Dar City in Ethiopia, the domestic WSI value is found to be 2.80 with three water security dimensions—water supply, sanitation, and hygiene [16]. Therefore, though not directly comparable, the average WSI in Dhaka City slums is poorer than that in the other cities in South Asia, the Middle East, and Africa.
The findings also indicate that Dhaka City slums score relatively better in the water supply dimension, while they score poor in the water environment and water governance dimensions. Lack of drainage and sewage disposal facilities, household waste collection, legal water connection, slum manager presence, and institutional support are among the major factors for poor scores. These findings underscore the need for essential urban services, legal water access, and institutional support from GOs and NGOs in enhancing water security in the informal settlements of Dhaka City.
The dimension-wise analysis identifies key areas requiring intervention across the study slums. Nabinagar Housing slum scores relatively well in all dimensions, though improvements are needed in the sanitation and hygiene, and water governance dimensions. Tejgaon Railway slum shows moderate performance but requires attention to the sanitation and hygiene, water environment, and water governance dimensions. In contrast, BNP Bazar, Milkvita Zheelpar, and Rajur slums exhibit deficiencies across multiple dimensions, particularly in the sanitation and hygiene, water environment, water and climatic risks, and water governance dimensions. Overall, water environment, and water governance emerge as the weakest dimensions across the study slums, with Rajur slum requiring the most urgent intervention due to its consistently low performance in all dimensions.
Improving water security in slums requires context-specific, integrated, and multi-sectoral interventions. Enhancing water supply necessitates the expansion of legal water connections, ensuring well-managed and well-informed intermittent water supply, and improving the protection, operation, and maintenance of community water storage facilities.
The sanitation and hygiene dimension can be improved by increasing the availability of shared toilets and bathing facilities, upgrading WASH infrastructure, and providing awareness programs on sanitation, hygiene, and MHM. Improved and secure WASH facilities may also help reduce social vulnerabilities, as field findings indicate concerns over safety and privacy. Due to limited privacy for laundering the reusable menstrual materials, most adolescent girls prefer to use disposable sanitary pads. The study also finds misconceptions regarding menstrual waste disposal, with many girls disposing of used materials in nearby water bodies, toilets, or drains, rather than disposing of with household waste, highlighting the need for improved MHM awareness and waste management practices. In IDIs with differently able persons, pregnant women, and the elderly, the participants report significant difficulties in using existing toilet facilities. Thus, the installation of handrails in toilets can substantially improve accessibility and make sanitation facilities more user-friendly.
The water environment in slums can be improved through the provision of basic urban services. FGD participants emphasize establishing a regular solid waste collection system to enhance environmental cleanliness and reduce pollution of nearby water bodies. In addition, the installation of drainage facilities and routine maintenance of adjacent drainage canals can improve environmental conditions and mitigate the impacts of waterlogging within the settlements.
The resilience to water and climatic risks can be strengthened by constructing raised WASH facilities and providing emergency relief support including safe drinking water during hazard events.
Water governance in slums can be strengthened through the formation of separate men’s and women’s management committees to ensure inclusive participation in WASH-related decision-making. Representatives selected from these committees could serve as slum managers, acting as intermediaries between residents and slum owners. The field survey reveals an absence of formal accountability mechanisms for the maintenance of shared WASH facilities, resulting in inconsistent cleaning practices and inadequate hygiene standards. Women also report that the concerns regarding the safety and privacy in WASH facilities are often ignored by the slum managers, while residents in settlements without designated managers lack effective channels for reporting grievances. Furthermore, the low educational attainment of many residents contributes to limited awareness of safe water use, personal hygiene, and MHM. Although some NGOs run hygiene awareness programs, these initiatives remain insufficient to address the broader needs of slum communities.
The findings of this study are constrained by the self-reported variable scores by the survey respondents. Though triangulation is done through FGDs, it is possible that the scores provided could be subject to low education level of the respondents, lack of knowledge about other slums, duration of living in the slum and so on. A second limitation is the low number of slums (5) and low number of people (286) surveyed. Although a good number of other tools are used to complement the data collection and triangulate the study findings, the findings could have been more robust if more slums and people had been surveyed. However, this was not possible due to limited available financial and human resources. A third limitation of the study is the single round of measurements of water quality parameters in each season and only from three sources. A fourth limitation can be the use of single-round cross-sectional survey data without capturing the seasonality in water security. The final limitation could be the lack of validation of WSI values with independent outcomes, such as reported illnesses. Given these limitations, the general validity of the study’s findings can be ascertained through further case studies in other geographical areas and socioeconomic conditions.

5. Conclusions

This study assesses the water security of five slums in Dhaka City of Bangladesh by using a multidimensional WSI. The index is derived from five dimensions, each comprising two or more indicators, using PCA. A structured questionnaire survey is administered among 286 slum dwellers. In addition, 12 FGDs, 26 IDIs, and 12 KIIs are conducted using checklists to understand water security issues and challenges, to identify potential indicators and variables, and to suggest potential measures to improve the WSI. Water quality of the slums is tested in the laboratory, and waterlogging hazard is mapped using PGIS.
The findings demonstrate that water security depends not only on WASH infrastructure and services, but also on environmental management, effective governance, and resilience to water and climatic risks. This is clear from the PCA weights of 0.21 for water supply, 0.20 for sanitation and hygiene, 0.21 for water environment, 0.21 for water and climatic risks, and 0.17 for water governance, indicating almost equal importance of all the dimensions in WSI. The results also indicate that Dhaka’s slums score lowest (1.86 out of 5.00) in water environment and second lowest (2.03) in water governance. Among the slums, Rajur slum scores lowest (1.72) and BNP Bazar slum the second lowest (1.86). Of the five slums, four fall under a ‘Fair’ level of WSI, indicating measures are needed to improve water security in Dhaka slums.
Improving stormwater drainage, domestic sewage disposal, household solid waste collection, cleaning water bodies around the slums, maintaining the water distribution and storage systems properly, and raising awareness of MHM are found to be among the major areas for enhancing water security in Dhaka slums. The WSI values derived in this study can work as benchmarks for future water security studies in other slums in Bangladesh and elsewhere. However, the findings are constrained by the limited number of slums selected for data collection.


Author Contributions

Conceptualization, S.R. and M.S.M.; methodology, S.R. and M.S.M.; software, S.R.; validation, S.R.; formal analysis, S.R.; investigation, S.R.; resources, M.S.M.; data curation, S.R.; writing—original draft preparation, S.R.; writing—review and editing, M.S.M.; visualization, S.R.; supervision, M.S.M.; project administration, M.S.M.; funding acquisition, M.S.M. All authors have read and agreed to the published version of the manuscript.

Funding

This research was funded by the International Development Research Center (IDRC), Canada under Gendering Water and Climate Science Research in South-Asia Project.

Institutional Review Board Statement

This study was approved by the Research and Academic Committee (RAC) of the Institute of Water and Flood Management (IWFM) as well as the Committee for Advanced Studies and Research (CASR) of Bangladesh University of Engineering and Technology (BUET). The study tools (survey questionnaire, and checklists for in-depth interviews, key informant interviews and focus group discussions) complied with the guidelines of the Institutional Review Board (IRB), Research and Innovation Center for Science and Engineering, BUET (Reference No.: BUET/RISE/IRB/2026-03-001). The project under which this study is conducted received ethical clearance from the Ethical Review Committee of University of Peradeniya (the project lead), Sri Lanka (Reference No.: ECC/2023/E/068). There was no experiment in the study involving humans and there is no personally identifiable data in the manuscript. Participation in the study was voluntary. Moreover, informed consent was obtained from all subjects involved in the study.

Data Availability Statement

Data can be made available upon request.

Acknowledgments

We thank the two anonymous reviewers for their insightful comments and useful suggestions, which helped improve the quality of this manuscript. We also gratefully acknowledge the guidance and support of Rokeya Khatun, Suchita Jain, and Sreenita Mondal throughout this study.

Conflicts of Interest

The authors declare no conflicts of interest. The funders had no role in the design of the study; in the collection, analyses, or interpretation of data; in the writing of the manuscript; or in the decision to publish the results.

References

  1. Octavianti, T.; Staddon, C. A review of 80 assessment tools measuring water security. WIREs Water 2021, 8, e1516. [Google Scholar] [CrossRef] [Scilit]
  2. Grey, D.; Sadoff, C.W. Sink or swim? Water security for growth and development. Water Policy 2007, 9, 545–571. [Google Scholar] [CrossRef] [Scilit]
  3. UN. Global Water Security 2023 Assessment; UNU-INWEH: Hamilton, ON, Canada, 2023; Available online: http://inweh.unu.edu/publications/ (accessed on 11 June 2026).
  4. ADB. Asian Water Development Outlook 2020: Advancing Water Security Across Asia and the Pacific; Asian Development Bank: Metro Manila, Philippines, 2020. [Google Scholar] [CrossRef] [Scilit]
  5. Beek, E.V.; Arriens, W.L. Water Security: Putting the Concept into Practice; TEC background paper no. 20; GWP: Stockholm, Sweden, 2014; Available online: http://www.gwp.org (accessed on 11 May 2026).
  6. Nkiaka, E. Exploring the socioeconomic determinants of water security in developing regions. Water Policy 2022, 24, 608–625. [Google Scholar] [CrossRef] [Scilit]
  7. Mishra, B.K.; Kumar, P.; Saraswat, C.; Chakrabarty, S.; Gautam, A. Water security in a changing environment: Concepts, challenges and solutions. Water 2021, 13, 490. [Google Scholar] [CrossRef] [Scilit]
  8. UN. UN-Water Annual Report; UN-Water Technical Advisory Unit: Geneva, Switzerland, 2013; Available online: http://www.unwater.org (accessed on 5 July 2026).
  9. Marcal, J.; Antizar-Ladislao, B.; Hofman, J. Addressing water security: An overview. Sustainability 2021, 13, 13702. [Google Scholar] [CrossRef] [Scilit]
  10. Khan, S.; Guan, Y.; Khan, F.; Khan, Z. A comprehensive index for measuring water security in an urbanizing world: The case of Pakistan’s capital. Water 2020, 12, 166. [Google Scholar] [CrossRef] [Scilit]
  11. Yao, J.; Wang, G.; Xue, B.; Xie, G.; Peng, Y. Identification of regional water security issues in China, using a novel water security comprehensive evaluation model. Hydrol. Res. 2020, 51, 854–866. [Google Scholar] [CrossRef] [Scilit]
  12. Babel, M.; Chapagain, K.; Shinde, V.R. How to measure urban water security? An introduction to the water security assessment tool (WATSAT). APN Sci. Bull. 2023, 13, 60–75. [Google Scholar] [CrossRef] [Scilit]
  13. Mukherjee, S.; Sundberg, T.; Sikdar, P.K.; Schutt, B. An integrated quantitative assessment of urban water security of a megacity in the global south. Front. Water 2022, 4, 834239. [Google Scholar] [CrossRef] [Scilit]
  14. Leya, R.S.; Bala, S.K.; Newton, I.H.; Chowdhury, M.A.; Haque, S.M. Water security assessment of a peri-urban area: A study in Singair Upazila of Manikganj district of Bangladesh. Environ. Dev. Sustain. 2022, 24, 14106–14129. [Google Scholar] [CrossRef] [Scilit]
  15. Shrestha, S.; Aihara, Y.; Bhattarai, A.P.; Bista, N.; Kondo, N.; Futaba, F.; Nishida, K.; Shindo, J. Development of an objective water security index and assessment of its association with quality of life in urban areas of developing countries. SSM-Popul. Health 2018, 6, 276–285. [Google Scholar] [CrossRef] [Scilit] [PubMed]
  16. Jumber, M.B.; Assefa, E.; Tilahun, S.A.; Babel, M.S. Developing domestic water security index in urban cities, Bahir Dar city, Ethiopia. In Proceedings of the Advances of Science and Technology: ICAST 2019; Springer: Cham, Switzerland, 2020; pp. 115–124. [Google Scholar] [CrossRef] [Scilit]
  17. Tsai, A.C.; Kakuhikire, B.; Mushavi, R.; Vorechovská, D.; Perkins, J.M.; Mc. Donough, A.Q.; Bangsberg, D.R. Population-based study of intra-household gender differences in water insecurity: Reliability and validity of a survey instrument for use in rural Uganda. J. Water Health 2016, 14, 280–292. [Google Scholar] [CrossRef] [Scilit] [PubMed]
  18. Khan, M.A. Livelihood, WASH related hardships and needs assessment of climate migrants: Evidence from urban slums in Bangladesh. Heliyon 2022, 8, e09355. [Google Scholar] [CrossRef] [Scilit] [PubMed]
  19. International Centre for Diarrheal Disease Research, Bangladesh. Baseline Population and Socioeconomic Census: Slums of Dhaka (North and South) and Gazipur City Corporations, (2015–16); International Centre for Diarrheal Disease Research: Dhaka, Bangladesh, 2016. [Google Scholar]
  20. Wutich, A.; Ragsdale, K. Water insecurity and emotional distress: Coping with supply, access, and seasonal variability of water in a Bolivian squatter settlement. Soc. Sci. Med. 2008, 67, 2116–2125. [Google Scholar] [CrossRef] [Scilit] [PubMed]
  21. Kashem, S.; Tahsin, N.; Subah, Z.; Murshed, S.B.; Nowreen, S.; Mondal, M.S. Assessing the right to water of the urban poor in Dhaka city. GeoJournal 2023, 88, 3183–3204. [Google Scholar] [CrossRef] [Scilit]
  22. Hoque, F.; Khan, M.A.; Preya, I.J. Implications of sanitation environment on women’s health: A case on railway slum of Khulna city in Bangladesh. J. Sci. Technol. Environ. Inform. 2022, 12, 775–785. [Google Scholar] [CrossRef] [Scilit]
  23. Goddard, S.; Sommer, M. Menstrual health and hygiene management and water, sanitation and hygiene (WASH) in urban slums: Gaps in the evidence and recommendations. wH2O J. Gend. Water 2020, 7, 4–9. [Google Scholar]
  24. Chowdhury, M.A.; Nowreen, S.; Tarin, N.J.; Hasan, M.R.; Zaman, R.U.; Amatullah, N.I. WASH and MHM experiences of disabled females living in Dhaka slums of Bangladesh. J. Water Sanit. Hyg. Dev. 2022, 12, 683–697. [Google Scholar] [CrossRef] [Scilit]
  25. Sinharoy, S.S.; Conrad, A.; Patrick, M.; McManus, S.; Caruso, B.A. Protocol for development and validation of instruments to measure women’s empowerment in urban sanitation across countries in South Asia and Sub-Saharan Africa: The agency, resources and institutional structures for sanitation related empowerment (ARISE) scales. BMJ Open 2022, 12, e053104. [Google Scholar] [CrossRef] [Scilit] [PubMed]
  26. Cawood, S.; Rabby, M.F. “People don’t like the ultra-poor like me”: An intersectional approach to gender, participation and urban water, sanitation and hygiene (WASH) in Dhaka’s bostis. Int. Dev. Plan. Rev. 2022, 44, 2. [Google Scholar] [CrossRef] [Scilit]
  27. Kher, J.; Aggarwal, S.; Punhani, G. Vulnerability of poor urban women to climate-linked water insecurities at the household level: A case study of slums in Delhi. Indian J. Gend. Stud. 2015, 22, 15–40. [Google Scholar] [CrossRef] [Scilit]
  28. Subbaraman, R.; Nolan, L.; Sawant, K.; Shitole, S.; Shitole, T.; Nanarkar, M.; Deshmukh, A.P.; Bloom, D.E. Multidimensional measurement of household water poverty in a Mumbai slum: Looking beyond water quality. PLoS ONE 2015, 10, e0133241. [Google Scholar] [CrossRef] [Scilit] [PubMed]
  29. Sultana, F. Embodied intersectionalities of urban citizenship: Water, infrastructure, and gender in the Global South. Ann. Am. Assoc. Geogr. 2020, 110, 1407–1424. [Google Scholar] [CrossRef] [Scilit]
  30. Rahman, M.M.; Ali, M.A.; Choudhury, M.R.; Rahman, M.A.; Ahmed, A.; Soneji, S.V.; Akhter, M.B.; Yafitri, S.S.; Das, S. WASH Challenges in Slum Areas of Dhaka City; Australian Aid, ITN-BUET, OXFAM: Dhaka, Bangladesh, 2014. [Google Scholar]
  31. Asiatic Society of Bangladesh. Banglapedia: National Encyclopedia of Bangladesh; Asiatic Society of Bangladesh: Dhaka, Bangladesh, 2021; Available online: https://en.banglapedia.org/index.php/Dhaka,_Geology (accessed on 1 July 2026).
  32. UN. World Urbanization Prospects 2025: Summary of Results; Department of Economic and Social Affairs, Population Division, United Nations: New York, NY, USA, 2025; Available online: http://population.un.org (accessed on 1 June 2026).
  33. BBS. Population and Housing Census 2022; Bangladesh Bureau of Statistics, Statistics and Informatics Division, Ministry of Planning: Dhaka, Bangladesh, 2023. [Google Scholar]
  34. BBS. Preliminary Report on Census of Slum Areas and Floating Population 2014; Bangladesh Bureau of Statistics, Statistics and Informatics Division, Ministry of Planning: Dhaka, Bangladesh, 2015. [Google Scholar]
  35. Aboelnga, H.T.; El-Naser, H.; Ribbe, L.; Frechen, F. Assessing water security in water-scarce cities: Applying the integrated urban water security index (IUWSI) in Madaba, Jordan. Water 2020, 12, 1299. [Google Scholar] [CrossRef] [Scilit]
  36. Jaren, L.S.; Mondal, M.S. Assessing water poverty of livelihood groups in peri-urban areas around Dhaka under a changing environment. Water 2022, 13, 2674. [Google Scholar] [CrossRef] [Scilit]
  37. Garriga, R.G.; Foguet, A.P. Improved method to calculate a water poverty index at local scale. J. Environ. Eng. 2010, 136, 1287–1298. [Google Scholar] [CrossRef] [Scilit]
  38. Vyver, C.V. Water poverty index calculation: Additive or multiplicative function? J. S. Afr. Bus. Res. 2013, 2013, 615770. [Google Scholar] [CrossRef] [Scilit]
  39. Hair, J.; Anderson, R.; Tatham, R.; Black, W. Multivariate Data Analysis, 6th ed.; Prentice-Hall: Hoboken, NJ, USA, 2006. [Google Scholar]
  40. Bartlett, M.S. A note on the multiplying factors for various χ2 approximations. J. R. Stat. Soc. 1954, 16, 296–298. [Google Scholar] [CrossRef] [Scilit]
  41. Jemmali, H.; Matoussi, M.S. A multidimensional analysis of water poverty at local scale: Application of improved water poverty index for Tunisia. Water Policy 2013, 15, 98–115. [Google Scholar] [CrossRef] [Scilit]
  42. Sufian, A.J.M. Methods and Techniques of Social Research, Revised ed.; University Press Limited: Dhaka, Bangladesh, 2009. [Google Scholar]
  43. CCME. Canadian Water Quality Guidelines for the Protection of Aquatic Life, Water Quality Index User’s Manual 2017 Update; Canadian Council of Ministers of the Environment: Ottawa, ON, Canada, 2017. [Google Scholar]
  44. Chidiac, S.; Najjar, P.E.; Ouaini, N.; Rayess, Y.E.; Azzi, D.E. A comprehensive review of water quality indices (WQIs): History, models, attempts and perspectives. Rev. Environ. Sci. Bio/Technol. 2023, 22, 349–395. [Google Scholar] [CrossRef] [Scilit] [PubMed]
  45. Craig, W.J.; Harris, T.M.; Weiner, D. Community Participation and Geographic Information Systems; Taylor & Francis: London, UK, 2002. [Google Scholar]
Figure 1. Locations of the selected five slums in Dhaka City.
Water 18 01974 g001
Figure 2. Indicator scores for water supply dimension across the study slums in Dhaka City.
Water 18 01974 g002
Figure 3. Indicator scores for the sanitation and hygiene dimension across the study slums in Dhaka City.
Water 18 01974 g003
Figure 4. Indicator scores for the water environment dimension across the study slums in Dhaka City.
Water 18 01974 g004
Figure 5. Indicator scores for the water and climatic risks dimension across the study slums in Dhaka City.
Water 18 01974 g005
Figure 6. Indicator scores for the water governance dimension across the study slums in Dhaka City.
Water 18 01974 g006
Figure 7. Dimension-wise water security scores for the study slums in Dhaka City.
Water 18 01974 g007
Figure 8. Dimension-wise water security scores for all the study slums in Dhaka City.
Water 18 01974 g008
Figure 9. Overall WSIs across the study slums in Dhaka City.
Water 18 01974 g009
Table 1. Score-wise water security levels [10].
WSI ScoreLevel of Water Security
<1.5Poor
1.5–2.4Fair
2.5–3.4Satisfactory
3.5–4.4Good
≥4.5Excellent
Table 2. Distribution of households surveyed in the present study.
SlumTotal HouseholdsSurveyed Households
BNP Bazar54474 (13.6%)
Milkvita Zheelpar52952 (9.8%)
Nabinagar Housing61558 (9.4%)
Rajur26565 (24.5%)
Tejgaon Railway36037 (10.3%)
Total households2313286 (12.4%)
Table 3. Slum-wise water availability variable scores for the study slums in Dhaka City.
Water Availability VariablesVariable Scores
BNP BazarMilkvita ZheelparNabinagar HousingRajurTejgaon Railway
Water source type and ownership1.111.925.002.004.00
Daily duration of supply1.001.545.001.002.08
Reliability of supply1.682.174.482.005.00
HH-to-water-point ratio1.303.213.951.462.86
Impact of supply unreliability2.732.485.001.973.84
Overall score on water availability1.562.274.691.693.56
Table 4. Slum-wise water accessibility variable scores for the study slums in Dhaka City.
Water Accessibility VariablesVariable Scores
BNP BazarMilkvita ZheelparNabinagar HousingRajurTejgaon Railway
Daily water use2.662.813.092.573.00
Access to safe drinking water2.002.005.002.005.00
Burden for water collection2.922.602.412.203.14
Time spent on water collection2.762.753.212.543.49
Rarely facing water conflict2.742.813.782.493.05
Overall score in water accessibility2.622.593.502.363.54
Table 5. Water quality in the study slums of Dhaka City.
Water Quality ParameterSource of WaterBNP Bazar SlumMilkvita Zheelpar SlumNabinagar Housing SlumRajur SlumTejgaon Railway SlumStandard Value (BD/WHO)
Temperature (°C)Main point27.1/29.330.0/29.9027.3/29.6028.10/30.7029.40/29.8020–30/n.a.
Storage 127.0/29.128.60/29.7027.4/30.428.8/30.428.40/29.30
Storage 226.3/29.529.20/29.6027.1/29.828.7/30.628.70/29.30
pHMain point7.10/6.66.60/7.307.1/6.66.6/6.66.60/7.106.5–8.5/n.a.
Storage 16.90/6.806.60/6.807.0/6.96.6/6.76.70/6.90
Storage 26.80/6.506.50/6.907.1/6.66.7/7.06.70/6.90
ColorMain point24/3.0011.00/14.001/729/10139/2015/15
Storage 136/5.0011.00/23.002/566/1537/27
Storage 215.00/98.0012.00/6.005/831/3939/30
Turbidity (NTU)Main point0.95/0.980.30/1.780.20/1.942.28/14.001.94/4.045/5
Storage 11.87/1.090.56/1.240.10/2.646.12/1.792.76/4.20
Storage 20.68/11.500.86/2.650.24/3.272.20/2.872.58/3.51
TDS (mg/L)Main point466/173171/118349/274195/179208/1681000/1000
Storage 1457/173145/118345/247194/181209/168
Storage 2277/172168/129327/241191/183210/167
EC (µS/cm)Main point932/187343/130698/295390/193415/1801500/1200 *
Storage 1914/187289/125689/268388/194418/180
Storage 2555/186335/138654/261381/197421/179
Fe (mg/L)Main point0.05/0.060.13/0.290.04/0.090.52/1.640.54/0.280.3–1.0/n.a.
Storage 10.14/0.050.10/0.450.03/0.060.47/0.020.61/0.56
Storage 20.14/1.210.10/0.230.05/0.040.27/0.600.55/0.51
E. coli (no./100 mL)Main point0/020/00/00/024/00/0
Storage 10/31141/21013/0150/9120/235
Storage 290/8643/54/0240/7220/6
F1 value 25/5012/2512/037/5025/25
F2 value 12/2112/128/025/2525/21
F3 value 79/8489/9038/094/5093/91
WQI 52/4347/4676/10040/5742/44
Notes: The first and second values for each slum indicate the dry and wet season values. BD and n.a. in the last column indicate Bangladesh and not available, respectively. * indicates that the values are the general guideline values rather than the respective standard values. For calculation of F1, F2 and F3, please refer to [43].
Table 6. Slum-wise scores for the variables under access to improved toilet facilities in the study slums in Dhaka City.
Variables on Access to Improved Toilet FacilitiesVariable Scores
BNP BazarMilkvita ZheelparNabinagar HousingRajurTejgaon Railway
Type of toilet2.312.194.001.984.00
Adequacy of toilets2.002.654.021.653.24
Availability of water in toilet1.771.984.881.711.84
Availability of lighting in toilet1.821.983.521.713.30
Condition of toilet superstructure1.181.773.691.913.57
Distance from house to toilet1.651.853.601.453.57
Overall score on access to improved toilet facilities1.792.073.951.743.25
Table 7. Slum-wise scores for challenges associated with existing toilet infrastructure variables for the study slums in Dhaka City.
Challenges Faced due to Existing Toilet FacilitiesVariable Scores
BNP BazarMilkvita ZheelparNabinagar HousingRajurTejgaon Railway
Using toilet alone at night2.892.652.692.522.92
Restricting drinking water2.662.753.022.383.59
Practicing handwashing2.933.003.833.082.57
Frequency of waterborne diseases2.572.563.332.653.05
Overall score on challenges faced due to existing toilet facilities2.762.743.222.663.03
Table 8. Slum-wise scores for the variables on access to improved bathing facilities across the study slums in Dhaka City.
Variables on Access to Bathing FacilitiesVariable Scores
BNP BazarMilkvita ZheelparNabinagar HousingRajurTejgaon Railway
Adequacy of bathing places1.262.153.951.433.19
Condition of bathing facilities1.222.063.591.342.00
Overall score on access to bathing facilities1.242.113.771.392.60
Table 9. Slum-wise scores on access to safe MHM variables across the study slums in Dhaka City.
Variables on Access to Safe MHMVariable Scores
BNP BazarMilkvita ZheelparNabinagar HousingRajurTejgaon Railway
Access to hygiene materials for MHM3.002.683.052.373.00
Access to private spaces for changing and laundering1.861.973.362.041.65
Overall score on access to safe MHM2.432.333.212.212.33
Table 10. Scores for the waterlogging risk variables across the study slums in Dhaka City.
Waterlogging Risk VariablesVariable Scores
BNP BazarMilkvita ZheelparNabinagar HousingRajurTejgaon Railway
Intensity of waterlogging2.362.753.001.001.00
Impact on household assets2.742.544.002.002.38
Impact on income2.972.813.571.952.22
Impact on household activities2.352.293.551.571.86
Overall score on waterlogging risk2.532.653.351.421.58
Table 11. Water governance variable scores across the study slums in Dhaka City.
Water Governance VariablesVariable Scores
BNP BazarMilkvita ZheelparNabinagar HousingRajurTejgaon Railway
Presence of slum manager1.072.045.001.202.00
Education level of respondents1.651.621.881.481.57
Participation in HH decisions3.223.132.843.313.30
Participation in community WASH decisions1.361.773.001.511.41
External hardware support on WASH and others3.003.002.001.002.00
Trainings received on WASH and others1.041.291.071.051.00
Disclaimer/Publisher’s Note: The statements, opinions and data contained in all publications are solely those of the individual author(s) and contributor(s) and not of MDPI and/or the editor(s). MDPI and/or the editor(s) disclaim responsibility for any injury to people or property resulting from any ideas, methods, instructions or products referred to in the content.