Article

Integrating Multi-Temporal Land Use/Land Cover Dynamics into GALDIT-Based Seawater Intrusion Vulnerability Assessment for Sustainable Groundwater Management Along the Indian Coastline


by
Saravanan Subbarayan
1,
Deepack Ezhilarasu
1,
Sivaranjani Sivalingam
1,
Bojan Đurin
2,*,
Kaliraj Seenipandi
3,
Ehab Gomaa
4,
Youssef M. Youssef
5,* and
Mahmoud E. Abd-Elmaboud
6,7
1
Department of Civil Engineering, National Institute of Technology, Tiruchirappalli 620015, India
2
Department of Civil Engineering, University North, 42000 Varaždin, Croatia
3
National Centre for Earth Science Studies (NCESS), Ministry of Earth Sciences, Thiruvananthapuram 695011, India
4
Department of Civil Engineering, College of Engineering, Taif University, Taif 21944, Saudi Arabia
5
Geological and Geophysical Engineering Department, Faculty of Petroleum and Mining Engineering, Suez University, Suez 43518, Egypt
6
Irrigation & Hydraulics Department, Faculty of Engineering, Mansoura University, Mansoura 35516, Egypt
7
National Water and Energy Center, United Arab Emirates University, Al Ain P.O. Box 15551, United Arab Emirates
*
Authors to whom correspondence should be addressed.
Water 2026, 18(15), 1918; https://doi.org/10.3390/w18151918
Submission received: 22 May 2026 / Revised: 28 July 2026 / Accepted: 31 July 2026 / Published: 6 August 2026

Highlights

What are the main findings?
  • A modified GALDIT-LU model integrating hydrogeology and ESA WorldCover LULC dynamics effectively mapped SWI vulnerability along the Indian coast.
  • Very high-SWI-vulnerability zones increased by 188%, expanding from 13,295 km2 (2017) to 38,257 km2 (2024).
  • High-vulnerability zones strongly corresponded with elevated groundwater chloride concentrations, confirming the model’s reliability.
What are the implications of the main findings?
  • Urban expansion and agricultural intensification are major drivers of increasing coastal groundwater salinization.
  • Integrating dynamic LULC data improves the accuracy and realism of SWI vulnerability assessments.
  • The identified hotspots provide critical guidance for sustainable groundwater management and achieving multiple SDGs, particularly those related to clean water security, food production, climate resilience, and poverty alleviation in densely populated coastal regions.

Abstract

Seawater intrusion (SWI) represents an increasingly critical challenge for coastal groundwater systems, with particularly pronounced impacts observed along the Indian coastline. Coastal aquifers constitute a vital freshwater resource supporting domestic, agricultural, and industrial demands. This study evaluates SWI vulnerability along the entire Indian coast, extending from Gujarat to West Bengal, covering approximately 7517 km of shoreline and up to 100 km inland. The assessment applies the GALDIT vulnerability framework that combines several hydrogeological and hydrochemical criteria such as groundwater occurrence, aquifer hydraulic conductivity, depth to groundwater, distance from shoreline, hydrochemical data, and groundwater quality data. We also assessed the intrusion of existing seawater, shoreline location, and aquifer thickness. However, conventional vulnerability assessments are inherently static and often fail to capture anthropogenic influences. To address this limitation, the present study integrates multi-temporal land use and land cover (LULC) datasets derived from ESA WorldCover remote sensing data for the period 2017–2024. Incorporating LULC dynamics enables a more comprehensive evaluation of the impacts of urban expansion and agricultural intensification on coastal susceptibility to SWI. Accordingly, a modified GALDIT-LU framework is developed to assess the spatiotemporal evolution of coastal vulnerability. The outcomes suggest that huge parts of the Indian coastline are vulnerable to moderate or very high classes, with the very high vulnerability class growing from 13,295 km2 in 2017 to 38,257 km2 in 2024, a 188% increase in vulnerability over the course of seven years. Groundwater chloride concentrations from Central Ground Water Board (CGWB) monitoring well locations have been used for validation over the proposed assessment, and show good spatial agreement between areas identified as high vulnerability and the spatial distribution of groundwater salinity for all three assessment periods, lending support to the robustness and predictive power of the proposed groundwater salinity assessment. The findings carry direct implications for the United Nations 2030 Agenda, demonstrating that the identified vulnerability patterns intersect with critical targets related to clean water and sanitation, food security, public health, climate action, and poverty reduction along one of the world’s most densely populated coastlines.

1. Introduction

Seawater intrusion (SWI) is one of the most pervasive and progressively irreversible threats to coastal freshwater resources worldwide, with particularly pronounced consequences for densely populated, agriculturally dependent coastal regions [1,2]. The process occurs when saline water intrudes into freshwater aquifers due to hydraulic pressure imbalances driven by both natural conditions and intensified anthropogenic activities, including excessive groundwater abstraction and accelerated coastal development [3,4]. Along the Indian coastline, extending approximately 7517 km from Gujarat to West Bengal, susceptibility to SWI has escalated markedly over recent decades, primarily attributable to the over-exploitation of groundwater, rapid land use and land cover (LULC) transformations, and climate-induced sea-level rise [5,6,7].
The Indian coastal zone is home to a significant share of the Indian population and plays a critical role in agriculture and industry, as it is highly vulnerable to the degradation of groundwater quality [8,9]. Geological and hydrogeological aspects are marked with great expression. The uniqueness of coastal aquifer systems, from their physical characteristics in terms of unconfined alluvial plains, lateritic aquifers and crystalline basement aquifers, to their interconnections in terms of hydraulics, further increases the inherent susceptibility of these aquifers to saline intrusion [10,11]. Spatial variation in groundwater recharge is observed in the western and eastern coasts of the study area due to the influence of southwest and northeast monsoonal systems, respectively, coupled with the effect of SWI, which is higher in Gujarat and Tamil Nadu because of their semi-arid conditions, resulting in limited replenishment and high evapotranspiration rates, respectively. This leads to the degradation of groundwater quality and lowers its productivity, which in turn causes soil salinization, reduced crop production, and continuous socio-economic issues for coastal communities [12,13]. The need to address SWI is heightened by the simultaneous effects of three major categories of stressors, such as increasing groundwater consumption for agricultural and urban purposes, increasing coastal urbanization and progressive changes in LULC, and sea level rise due to ongoing climate change [2,14,15]. The drivers are also distributed in space and time and the current water management approaches often tackle them separately, hence their limited ability to effectively reduce the compound risks they pose to coastal aquifer systems [16,17]. The GALDIT vulnerability index was introduced by Chachadi [18] and has been extensively used to assess the susceptibility of coastal aquifers to SWI by applying a GIS-based weighted overlay method of six hydrogeological and hydrochemical parameters. Further modifications have added additional parameters and advanced weighting techniques such as entropy-based, fuzzy logic, optimization algorithms, and machine learning to improve objectivity and include site-specific vulnerability controls [19,20,21,22,23]. GALDIT has been utilized at sub-regional levels in Tamil Nadu, Odisha and Kerala in India [12,24,25]. The methodological precedent most directly parallel to the integration of multi-temporal LULC dynamics and the GALDIT framework is provided by Hossain et al. [26], who recently applied the GALDIT framework to coastal Bangladesh. Nevertheless, no unified GALDIT-based assessment covering the full extent of the Indian coastline in a spatiotemporally consistent manner has yet been established.
The recent studies confirm that the problem is intensifying and that the methodological response is still maturing. A global analysis drawing on roughly 480,000 coastal monitoring locations found that 21% of gridded coastal areas recorded groundwater level trends of at least 0.1 m per year between 1990 and 2024, with declining trends becoming more frequent in the most recent decade [27]. A recent review of coastal vulnerability methods reaffirms GALDIT as the dominant screening tool, while calling for hybrid frameworks that combine hydrogeological criteria with anthropogenic and climate-related factors [28]. New applications illustrate both the reach and the limits of current practice. Along the southern Malabar coast of Kerala, a GALDIT assessment classified 35.31% of the study area as highly vulnerable [29], and geophysical surveys at Minjur in Tamil Nadu traced an extensive saline wedge with electrical conductivity reaching about 38,400 µS/cm [30]. In Iran, a fifteen-year comparison of weighting schemes demonstrated that entropy-based and optimization-based weights alter both the intensity and the spatial extent of mapped vulnerability zones [31]. Evidence from index-based modeling further indicates that adding land cover information raises discriminatory power, since the area under the ROC curve improved from 0.733 to 0.789 once LU/LC was incorporated [32]. These recent contributions nonetheless remain confined to individual aquifers or provinces, and none delivers a spatiotemporally consistent assessment at the scale of an entire national coastline.
Despite the expanding body of GALDIT literature both globally and across the Indian subcontinent, critical methodological and spatial limitations persist. Conventional GALDIT assessments remain inherently static, capturing aquifer conditions at a single point in time and failing to represent the temporal evolution of anthropogenic stressors [21,33]. The standard framework excludes the explicit representation of LULC dynamics, thereby overlooking the cumulative impacts of urban expansion, agricultural intensification, and land cover change on groundwater recharge and extraction patterns [26,34,35]. Furthermore, published assessments along the Indian coast have been restricted to localized study areas, precluding a nationally coherent understanding of SWI risk across the full diversity of hydrogeological settings. This insufficient integration of spatial coverage, temporal dynamics, and anthropogenic stressors represents a significant impediment to effective coastal groundwater governance at the regional and national scales [36,37].
To overcome the limitations identified in previous investigations, this study develops a comprehensive spatiotemporal framework for assessing SWI vulnerability along the entire Indian coastline. The proposed framework is intended to support several United Nations Sustainable Development Goals (SDGs), particularly those related to clean water availability, sustainable food production, climate adaptation, and poverty reduction in densely populated coastal environments. The study pursues four primary objectives. First, it applies the GALDIT index at the national scale to delineate the intrinsic hydrogeological susceptibility of coastal aquifers to seawater intrusion. Second, it introduces an enhanced GALDIT-LU framework by incorporating multi-temporal land use/land cover (LULC) information derived from the ESA WorldCover dataset (2017–2024), thereby explicitly accounting for the effects of anthropogenic land use change on aquifer vulnerability. Third, it investigates the spatial and temporal evolution of SWI vulnerability across three representative years (2017, 2020, and 2024) to quantify changes in vulnerability patterns over time. Lastly, the spatial and temporal evolution of SWI vulnerability for three representative years (2017, 2020, and 2024) is explored to quantify changes in vulnerability patterns over time. Finally, the reliability of the vulnerability assessments is evaluated by comparison with observed chloride groundwater concentrations obtained from the CGWB monitoring network. Collectively, these objectives provide a scientifically sound, evidence-based framework to identify areas that need priority for groundwater protection, facilitate sustainable land use planning and support the long-term management of coastal aquifers in the geologically and climatically diverse coastal regions of India.

2. Materials and Methods

2.1. Study Area Description

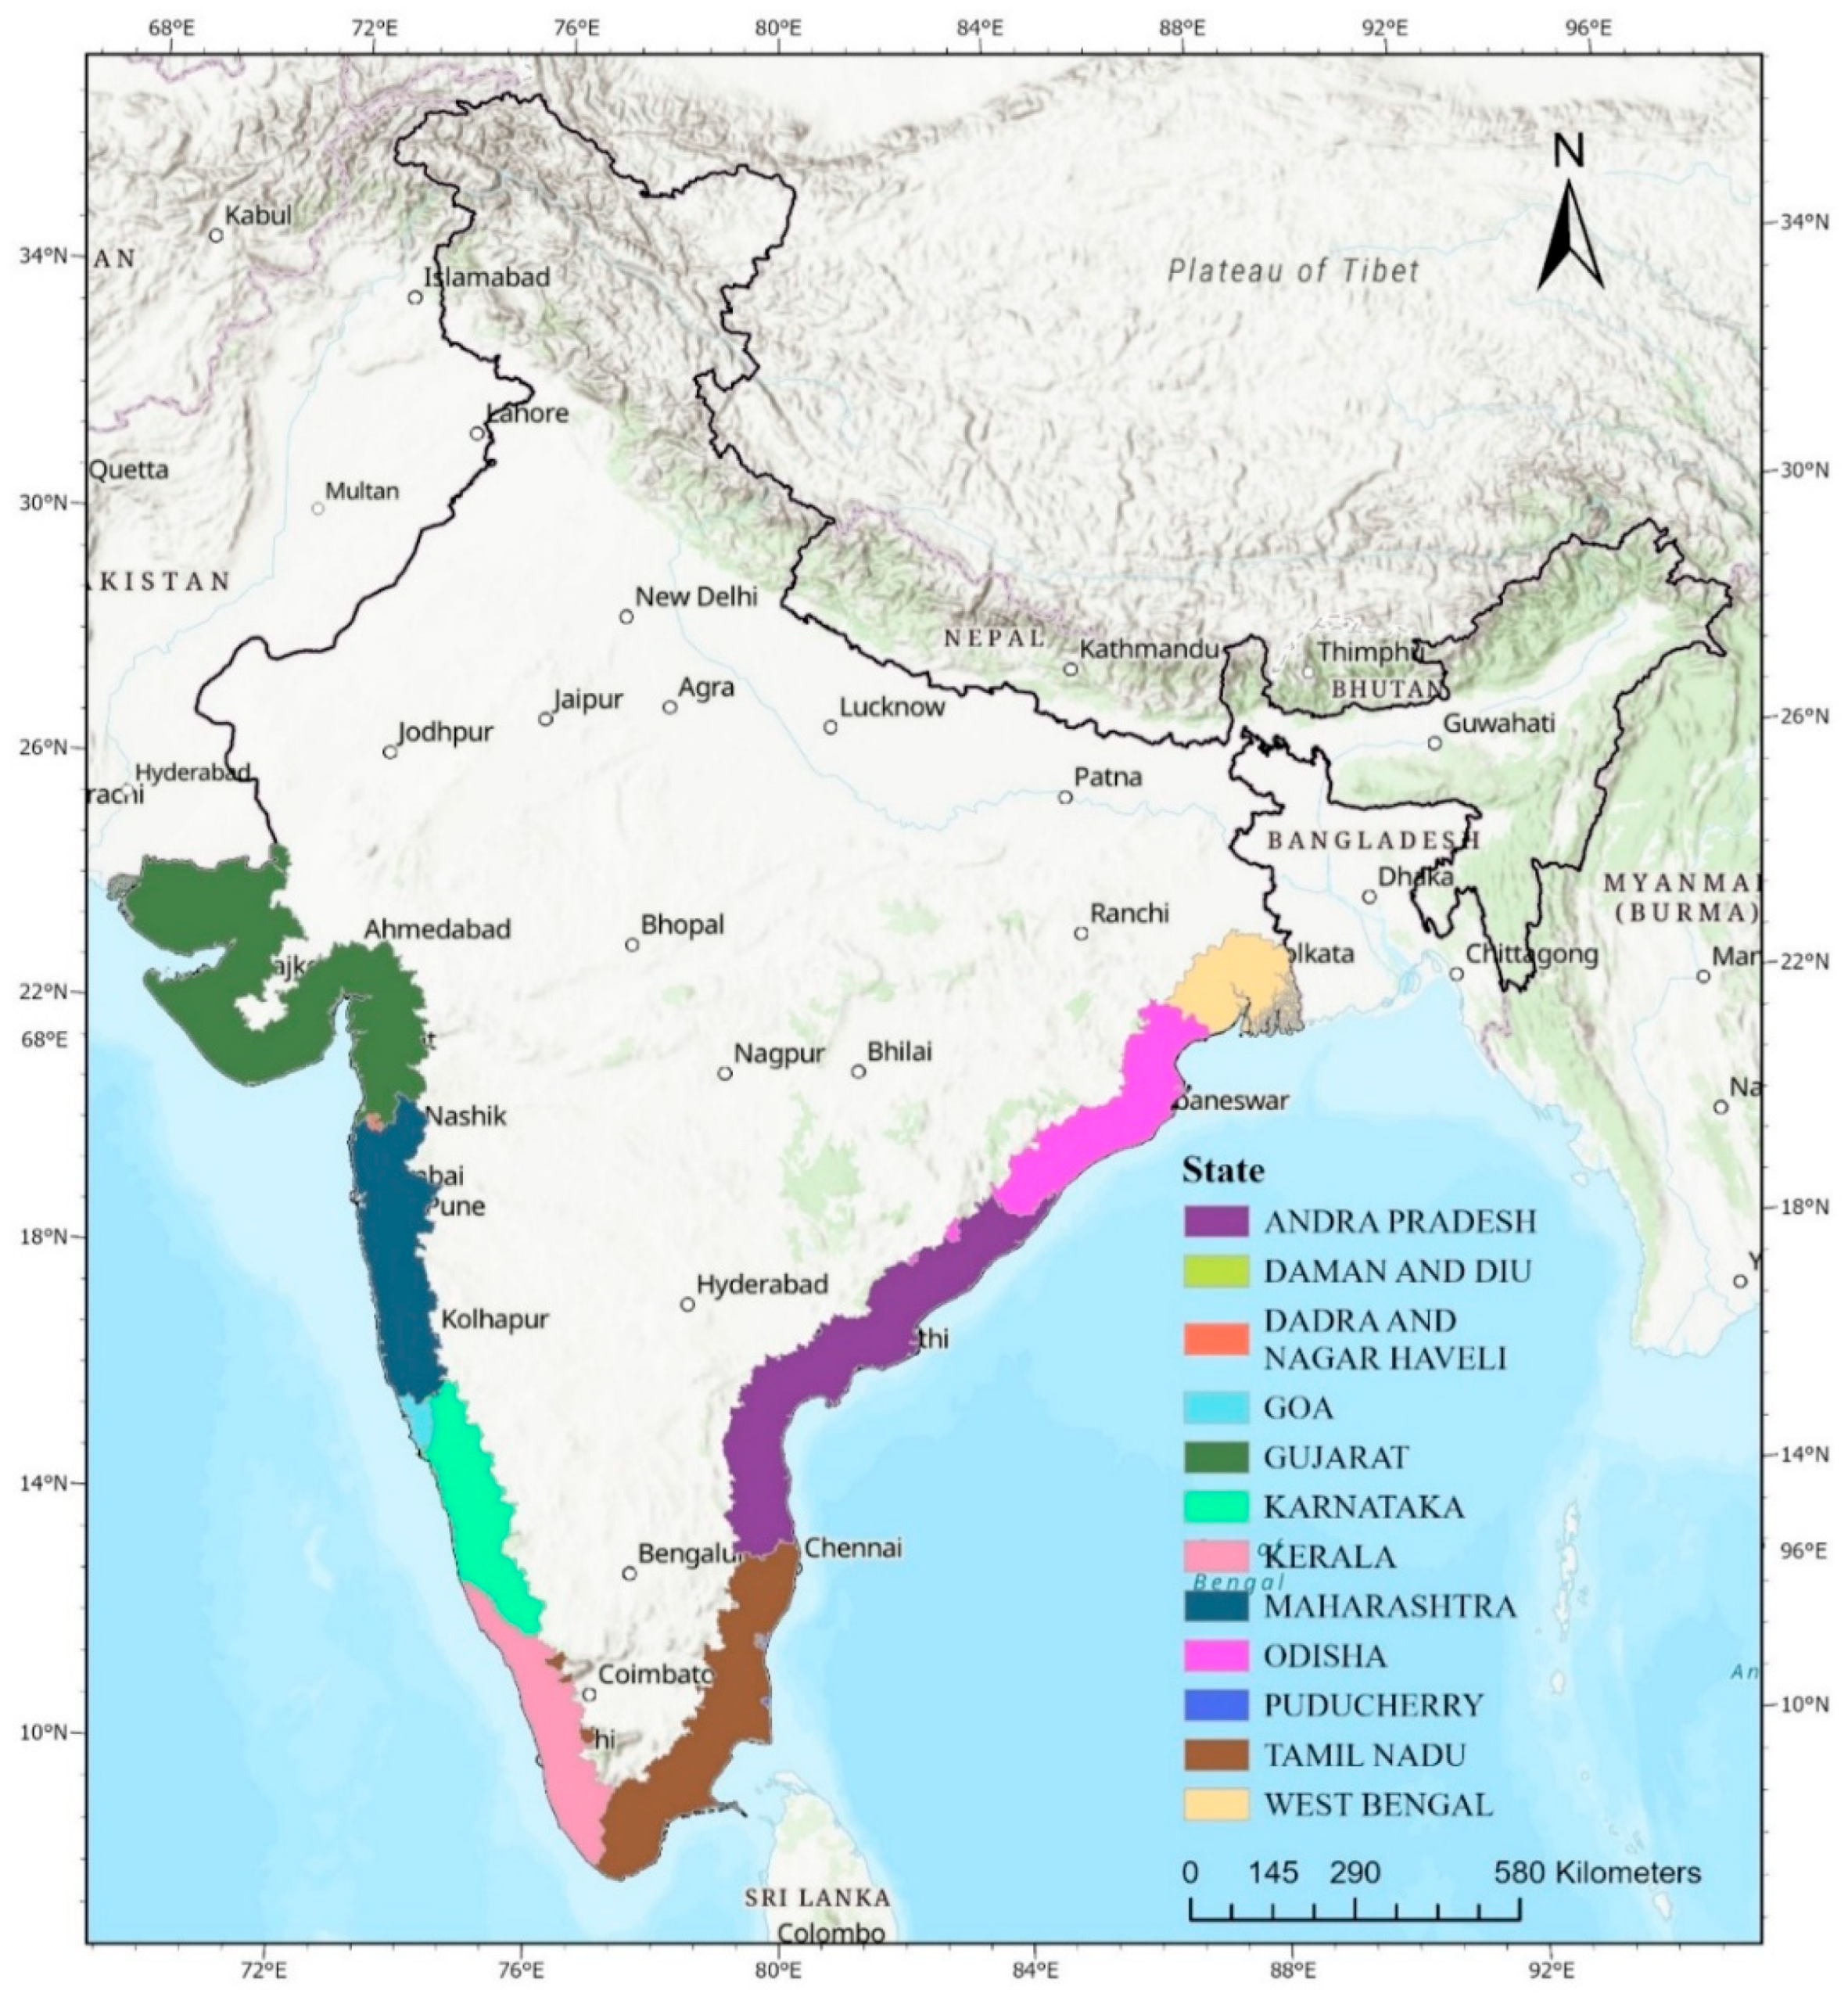
The study encompasses the entire Indian coastal region, extending along both the eastern and western margins of the Indian peninsula. The coastline spans approximately 7516 km, bounded between latitudes 8°04′ N and 23°40′ N and longitudes 68°07′ E and 97°25′ E [3]. The western coast stretches down the Arabian Sea and is shared by Gujarat, Maharashtra, Goa, Karnataka, and Kerala, while the eastern coast stretches down the Bay of Bengal and is shared by Tamil Nadu, Andhra Pradesh, Odisha, West Bengal, and Puducherry (Figure 1). Geologically, the coastal belt is very heterogeneous with alluvial plains, deltaic deposits, lateritic formations, sand dunes, coastal clays and crystalline basement complexes [3]. The major deltaic systems of the eastern coastline occupy most of it, such as the Ganges–Brahmaputra, Godavari–Krishna, Mahanadi and Cauvery deltas, while on the western coastline the coastal plains, which are relatively narrow, are mostly lateritic and rocky. From a stratigraphic point of view, the coastal area is composed of a series of sedimentary rocks of Tertiary and Quaternary age lying on a Precambrian crystalline basement. The deposits along the eastern coast are mainly alluvial and deltaic, and composed of sand and silt (~90%) and clay (~10%) [38]. Unconsolidated sediments are widespread in large deltaic systems, with high porosity and permeability, and are highly mobile for groundwater movement, and thus are sensitive to the intrusion of saline water [3]. The western coastal zone, on the other hand, is made up of lateritic and weathered basaltic rocks of the Deccan Traps, especially in the Konkan. In the south coastal areas, crystalline lithologies are more common, including charnockite, gneiss, and migmatite, indicating the underlying Precambrian basement geology.
Climatically, the region is tropical, with precipitation governed by the southwest monsoon (June–September) and the northeast monsoon (October–December), the latter being particularly influential along the eastern coast [12]. Mean annual temperatures range from 22 °C to 32 °C. India experiences approximately five to six tropical cyclones annually, with the northern Bay of Bengal identified as the most cyclone-prone region in the North Indian Ocean [39]. Low-lying northern coastal zones, characterized by high sedimentation rates, dense populations, and frequent storm surges, are highly vulnerable to coastal hazards. The western coast, encompassing major urban centers such as Mumbai, Kochi, and Mangaluru, receives high annual precipitation exceeding 2500 mm [9]. In contrast, the eastern coast, including Chennai, Visakhapatnam, and Kolkata, experiences comparatively lower and more seasonally distributed rainfall, rendering aquifers more susceptible to overexploitation [12]. Semi-arid conditions prevail in parts of Gujarat and Tamil Nadu, where limited recharge and high evapotranspiration exacerbate freshwater scarcity [3].
Coastal aquifer systems are geologically complex in terms of hydrogeology, with numerous unconfined, semi-confined and confined units, which are laterally and vertically heterogeneous. Shallow, unconfined aquifers formed in coastal sands and silty materials are present on beach ridges and coastal plains. A high hydraulic conductivity and high discharge/recharge dynamics are characteristic of these systems and are especially vulnerable to SWI when conditions of groundwater depletion are observed [10]. Inland, these aquifers switch to semi-confined or confined aquifers, where saline intrusion is sometimes partially restricted by clay layers, lateritic horizons, or crystalline formations. The deltaic multi-layered aquifer systems with alternate sand and clay layers result in complex freshwater–saline interfaces. Groundwater extraction for agriculture and domestic use in big cities like Chennai, Vijayawada, and Kolkata is causing a sharp decline in groundwater levels, thus encouraging an inland migration of saline water [25]. Conversely, hard rock aquifers along the Konkan coast and parts of Karnataka, characterized by steep hydraulic gradients and low primary porosity, exhibit comparatively lower vulnerability due to substantial monsoonal recharge. In the southernmost regions, including Kanyakumari, narrow coastal plains with shallow, highly permeable aquifers over crystalline substrates exhibit limited freshwater storage, rendering them highly susceptible to SWI under continued groundwater abstraction [10]. Overall, the interaction between geological, hydroclimatic, and anthropogenic factors governs groundwater dynamics along the Indian coastline, with increasing human pressures playing a dominant role in driving aquifer vulnerability, particularly in densely populated coastal regions [5,8].
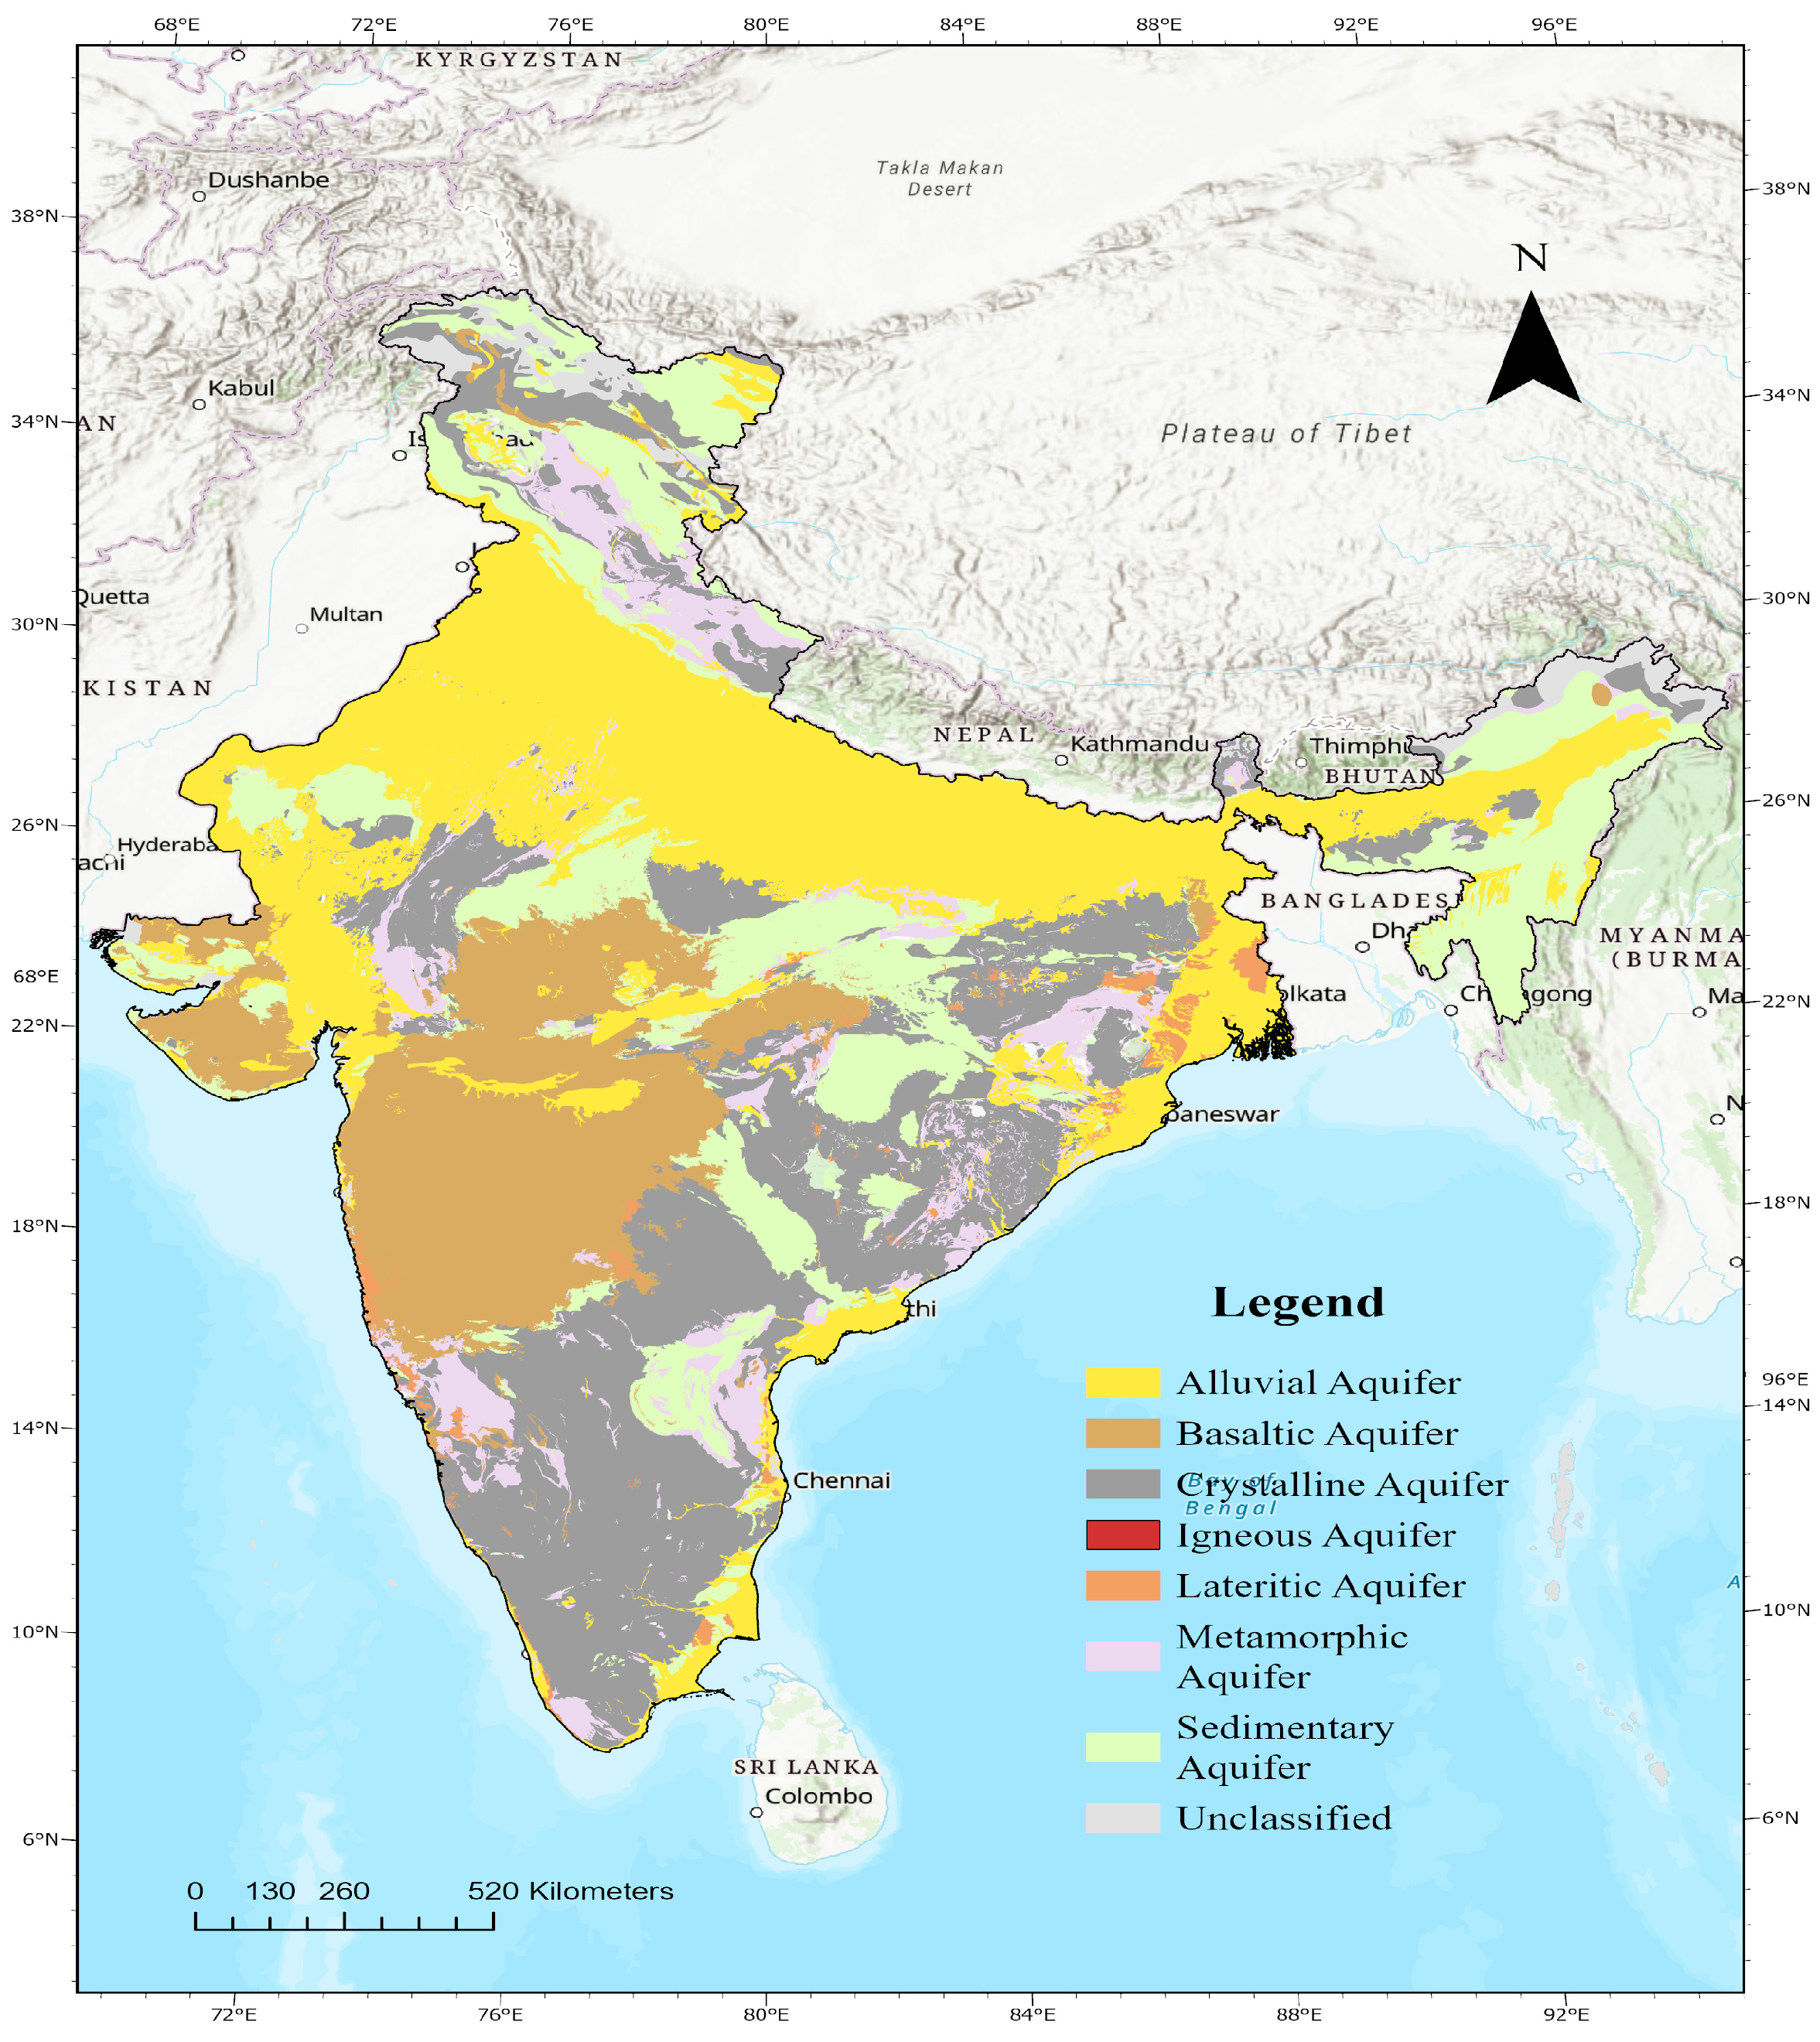
The hydrogeological framework of the Indian coastline is characterized by significant spatial heterogeneity, mainly governed by lithological variation, aquifer characteristics, and depositional history (Figure 2). The distribution of alluvial, sedimentary, crystalline, basaltic, lateritic, metamorphic, and igneous aquifers governs groundwater occurrence, recharge potential, hydraulic conductivity, and consequently the susceptibility of coastal aquifers to seawater intrusion.
The eastern coastline, extending from West Bengal to Tamil Nadu, is predominantly underlain by extensive alluvial and sedimentary aquifer systems associated with the Ganga–Brahmaputra, Mahanadi, Godavari, Krishna, and Cauvery river basins. These aquifers are mainly composed of unconsolidated to semi-consolidated deposits of sand, silt and clay, and have relatively high porosity and permeability. They have large storage capacity and good hydraulic connectivity, which makes them suitable for the considerable development of groundwater for domestic, agricultural and industrial use. However, the great extent of groundwater withdrawal, low-gradient coastal plains, and direct hydraulic connectivity to the Bay of Bengal make them more vulnerable to seawater intrusion. Deltaic aquifers are especially vulnerable, because groundwater depletion can rapidly depress freshwater hydraulic heads and permit saline water to encroach inland in highly permeable sedimentary formations.
The hydrogeological diversity is greater on the western coastline, from Gujarat to Kerala. The coastal plains of Gujarat are characterized by alluvial aquifers, and a large proportion of Maharashtra and Karnataka has basaltic aquifers associated with the Deccan Traps. Southern coastal regions, particularly Kerala, contain extensive lateritic aquifers, while crystalline and metamorphic aquifers occur intermittently along the Konkan coast and the southern peninsular region. Compared with the eastern coast, many western coastal aquifers possess lower primary porosity and hydraulic conductivity because groundwater flow is largely controlled by weathered zones, fractures, and secondary permeability. Consequently, groundwater movement is generally more localized, and the inland migration of seawater is relatively restricted. Nevertheless, localized seawater intrusion has been reported in areas where excessive groundwater abstraction coincides with highly weathered coastal aquifers or narrow coastal plains.
Overall, the contrasting hydrogeological conditions of the two coasts strongly influence regional groundwater vulnerability. The eastern coast is dominated by highly productive alluvial and sedimentary aquifers that are intrinsically more susceptible to seawater intrusion because of their high permeability and extensive hydraulic continuity. In comparison, the western coast contains predominantly hard-rock, basaltic, lateritic, and crystalline aquifers that generally provide greater natural resistance to large-scale saline encroachment, although localized intrusion may occur under intensive groundwater exploitation. These hydrogeological differences form one of the primary controls governing the spatial variability of seawater intrusion vulnerability along the Indian coastline.

2.2. Overview of Methodology

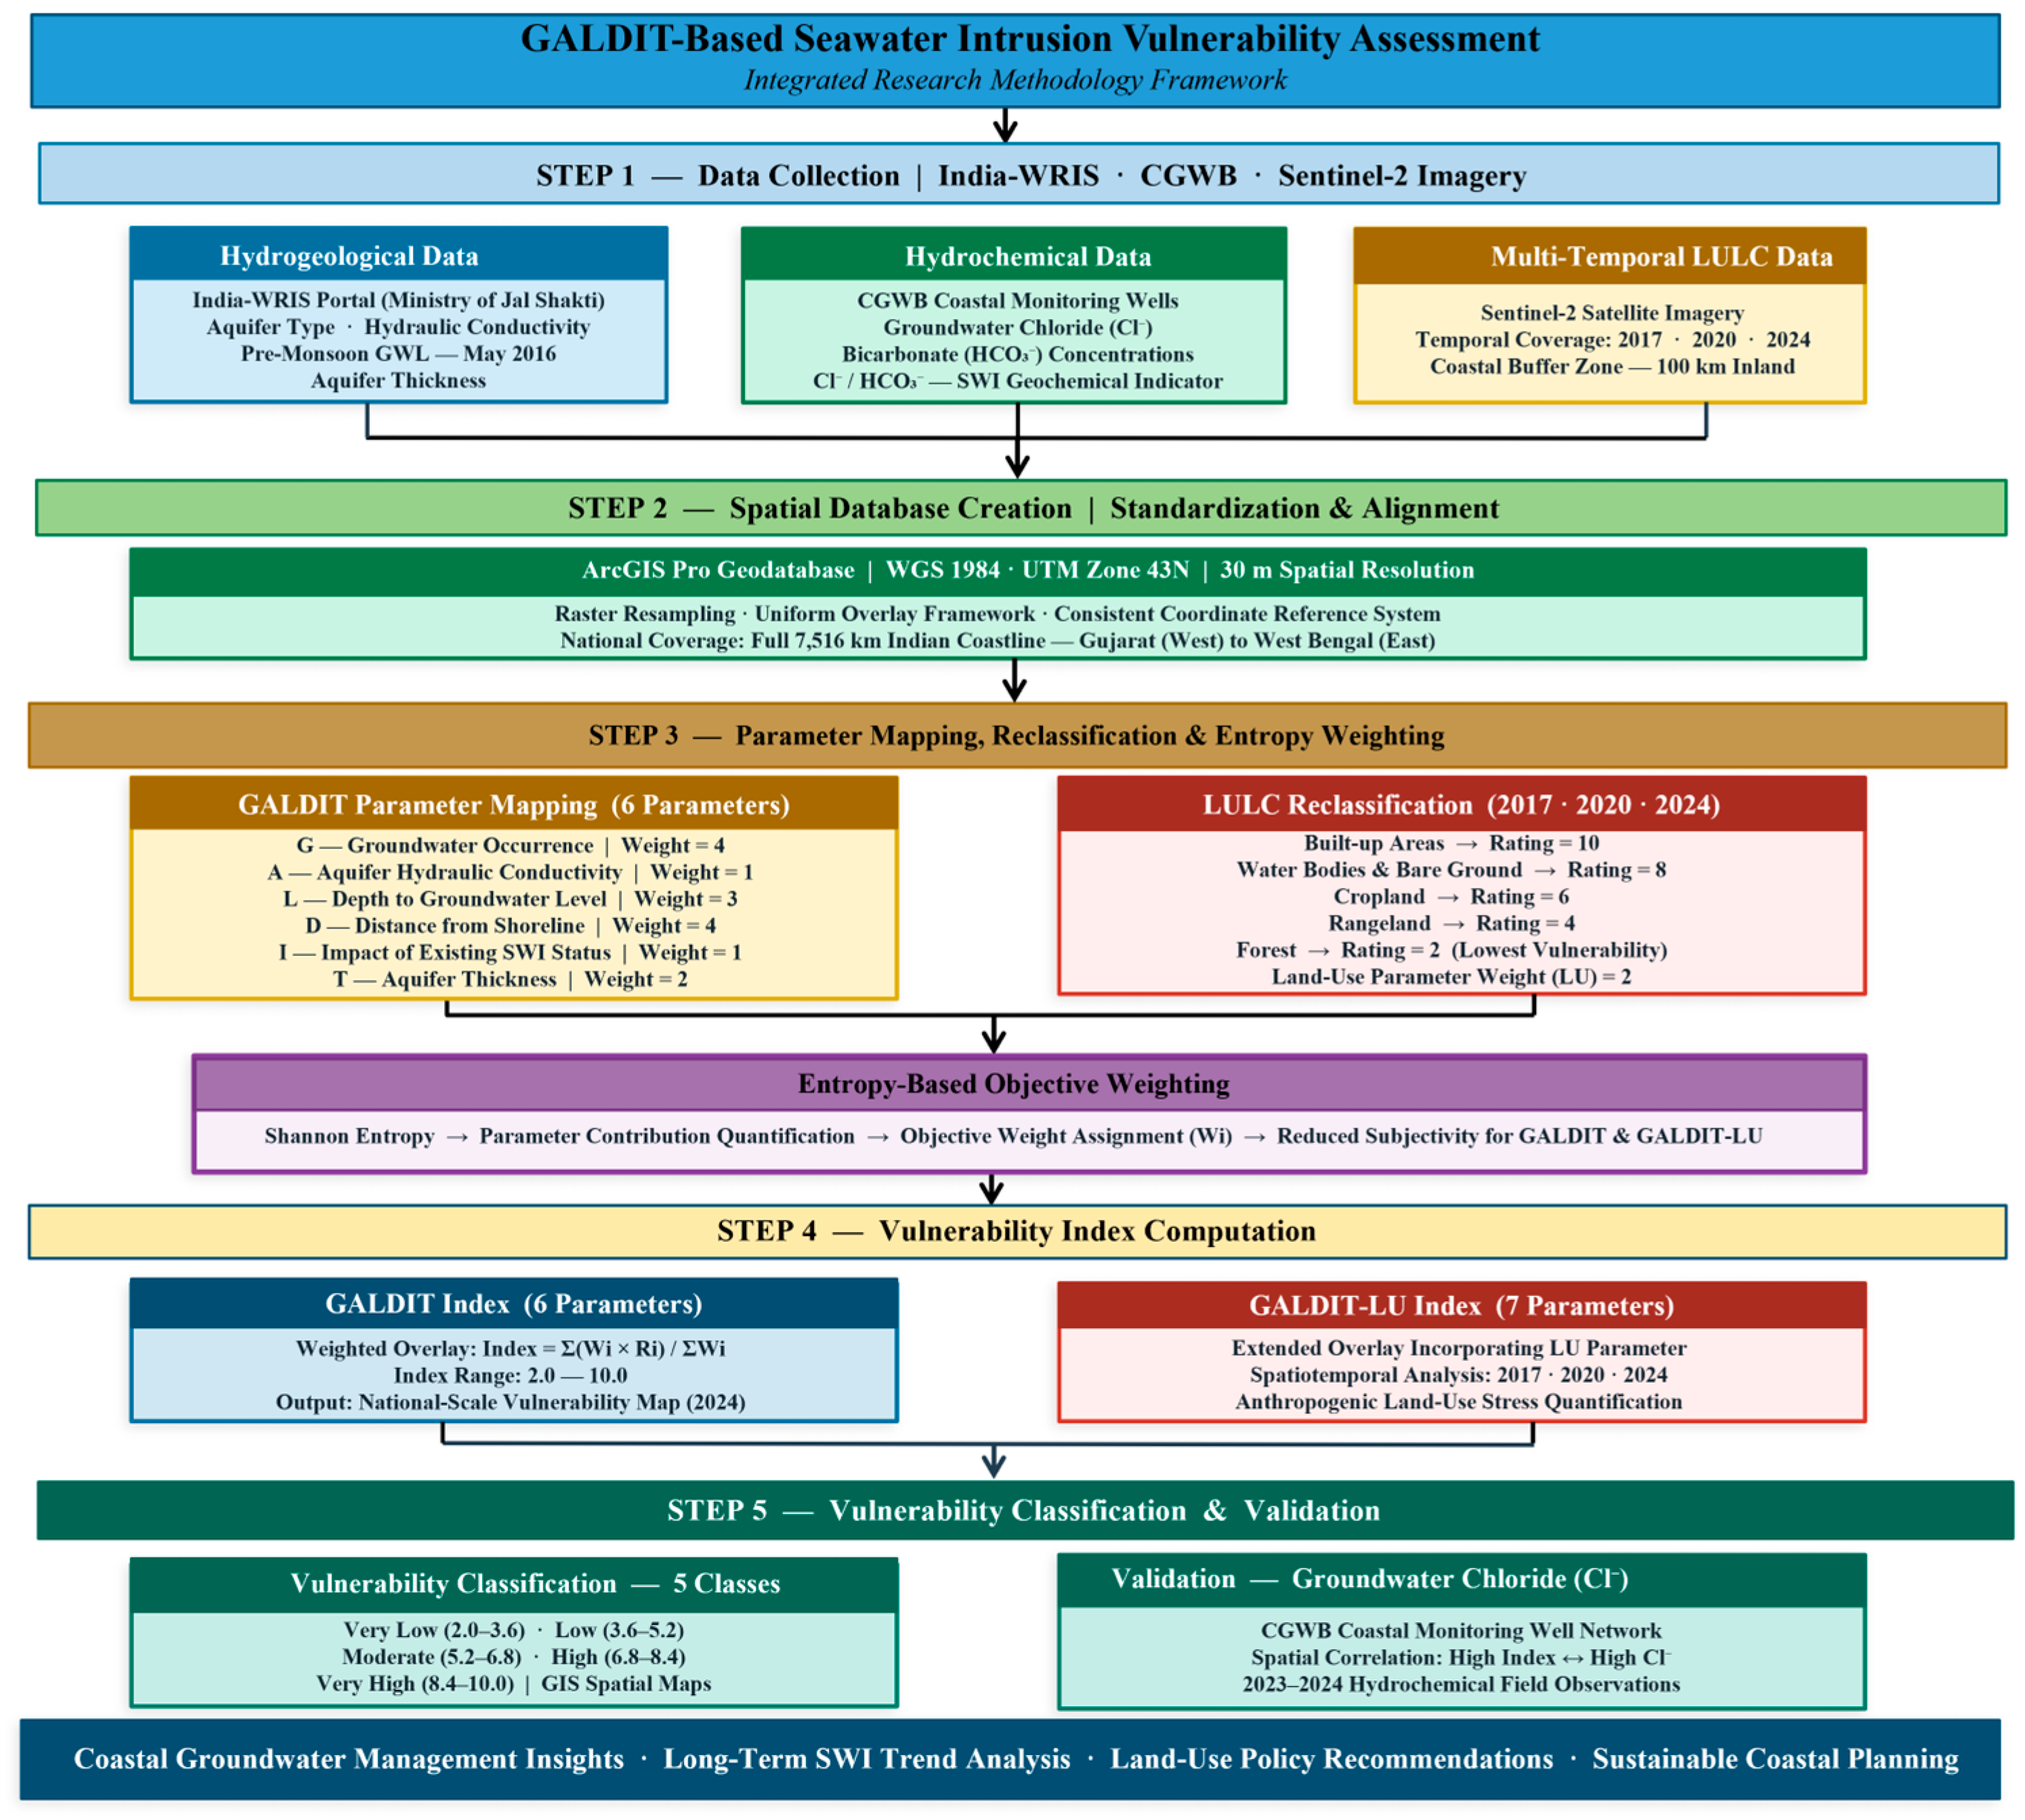
The present study employs an integrated GIS-based multi-criteria framework to evaluate seawater intrusion (SWI) vulnerability along the entire Indian coastline. In the first stage, hydrogeological, hydrochemical, and land use datasets were compiled from India-WRIS (Water Resources Information System), CGWB monitoring networks, and multi-temporal ESA WorldCover (2017, 2020, and 2024), and standardized within a unified geodatabase at 30 m spatial resolution under the WGS 1984 UTM Zone 43N coordinate system. Six thematic layers representing the core GALDIT parameters, groundwater occurrence (G), aquifer hydraulic conductivity (A), depth to groundwater level (L), distance from shoreline (D), impact of existing SWI status (I), and aquifer thickness (T), were independently reclassified. A modified GALDIT-LU framework was subsequently developed by incorporating a seventh parameter representing land use and land cover dynamics, enabling the explicit quantification of anthropogenic stress on coastal aquifer vulnerability across three benchmark periods. Both indices were spatially classified into five vulnerability classes and validated against observed groundwater chloride concentrations from CGWB coastal monitoring wells, confirming the reliability of the assessment framework. The overall methodology is illustrated in Figure 3.
The analytical workflow consisted of six sequential stages. Initially, hydrogeological, hydrochemical, and LULC datasets were collected from their respective sources and standardized within a unified geodatabase. Subsequently, all datasets were projected into a common coordinate reference system, interpolated where necessary, and converted into raster format with identical spatial resolution. Each GALDIT parameter was then reclassified according to established vulnerability ratings. The weighted thematic layers were integrated to produce the conventional GALDIT index and the modified GALDIT-LU index. Finally, the resulting vulnerability maps were classified into five vulnerability categories and validated using groundwater chloride observations obtained from CGWB monitoring wells.

2.3. Data Collection and Sources

Hydrogeological data, including aquifer type, hydraulic conductivity, and aquifer thickness, were obtained from the India-WRIS (Water Resources Information System) portal maintained by the Ministry of Jal Shakti, Government of India. The India-WRIS database consolidates multi-decadal groundwater resource assessments conducted by the Central Ground Water Board (CGWB) in collaboration with state water resource departments, providing a nationally consistent hydrogeological reference framework. Pre-monsoon groundwater level data for May 2016 were also sourced from India-WRIS. The year 2016 was selected as the reference period because it coincided with drought conditions and below-normal monsoon rainfall across large portions of the Indian coastline, representing conservative, worst-case groundwater level conditions most conducive to seawater intrusion [3]. Groundwater quality data, including those regarding chloride (Cl) and bicarbonate (HCO3) concentrations, were obtained from CGWB monitoring records for coastal observation wells. The chloride-to-bicarbonate ratio (Cl/HCO3) was computed and employed as a geochemical proxy for the current status of seawater intrusion [10,24]. Land use and land cover (LULC) data were derived from multi-temporal ESA WorldCover for 2017, 2020, and 2024, providing adequate spatial resolution for coastal-scale analysis and enabling the detection of progressive anthropogenic change within the coastal buffer zone. The ESA WorldCover dataset was selected because it provides a globally consistent land cover product at 10 m spatial resolution with comprehensive validation and frequent updates. The dataset offers improved thematic accuracy compared with many conventional global land cover products, making it suitable for regional and national-scale environmental assessments. As the objective of the present study is to evaluate the influence of land use dynamics on seawater intrusion rather than to develop a new land cover classification methodology, the validated ESA WorldCover product was adopted directly. The GALDIT parameter framework and weighting system adopted in this study are presented in Table 1.
Hydrogeological and hydrochemical variables obtained as point observations, including groundwater level and groundwater quality parameters, were converted into continuous raster surfaces using the Inverse Distance Weighting (IDW) interpolation technique in ArcGIS Pro. IDW was selected because it preserves local spatial variability while assuming that observations closer to each other exhibit greater similarity than those farther apart. Before weighted overlay analysis, interpolated rasters were cropped to the study area, resampled to a common spatial resolution, and reclassified according to the GALDIT rating scheme.
Spatial datasets such as coastlines and administrative boundaries were digitized from official survey sources and high-resolution satellite imagery. All layers were projected to a common coordinate reference system (WGS 1984, UTM Zone 43N) and merged in a single geodatabase in ArcGIS Pro. The raster layers were re-sampled to a uniform 30 m spatial resolution for consistent overlay analysis while balancing. The main working resolution was 30 m, but in some coastal areas needing site-specific detail, coarser resolutions were used. The susceptibility of the Indian coastline to seawater intrusion was assessed using a GIS-based multi-criteria decision framework based on GALDIT methodology and its modified variant with land use and land cover (GALDIT-LU). The assessment combines hydrogeological, hydrochemical, and human factors using a clear rating and weighting system. Seven themes were developed and reclassified based on specific criteria, as follows: groundwater occurrence, aquifer hydraulic conductivity, groundwater level depth, distance from the shoreline, current salinity status, aquifer thickness, and land use and land cover (Table 2).

2.4. Spatial Database Creation

A geodatabase was created in ArcGIS Pro version 3.4.0 to bring together all spatial layers needed to compute the GALDIT vulnerability index. To keep the datasets consistent, all layers were projected to a common coordinate reference system (WGS 1984, UTM Zone 43N) and resampled to a uniform spatial resolution of 30 m. This confirmed that the parameters were aligned correctly throughout the analytical domain. This standardization minimizes edge-matching and interpolation errors in the final vulnerability maps and ensures the integrity of the weighted overlay analysis.

2.4.1. Determination of the GALDIT Vulnerability Index

The GALDIT vulnerability index was computed using a weighted average formulation, expressed as
GALDIT   Index = i = 1 6 ( W i × R i ) i = 1 6 W i
where W i represents the assigned weight of parameter i, and R i indicates its corresponding rating value on a scale from 2 to 10. Each of the six GALDIT parameters was independently categorized into five distinct vulnerability classes, with ratings of 2, 4, 6, 8, and 10, based on established threshold criteria (Table 2). This reclassification turns continuous hydrogeological data into a standardized, dimensionless rating scale that is suitable for spatial overlay analysis.

2.4.2. Weighted Overlay Analysis

Following parameter reclassification, a weighted overlay model was applied in ArcGIS Pro using the Raster Calculator. The GALDIT index was computed explicitly as
GALDIT   Index = G × 1 ) + ( A × 3 ) + ( L × 4 ) + ( D × 4 ) + ( I × 1 ) + ( T × 2 15
where G , A , L , D , I , and T represent the reclassified rating layers for each respective parameter, and the denominator (15) equals the sum of all assigned parameter weights. The resulting index is dimensionless and ranges from 2.0 to 10.0, with higher values indicating greater susceptibility to seawater intrusion.

2.4.3. Vulnerability Classification

The continuous GALDIT index raster was reclassified into five discrete vulnerability categories to facilitate spatial interpretation and regional comparison. The classification scheme and the hydrogeological interpretation of each class are defined as follows:
  • The very low vulnerability class (index range 2.0–3.6) encompasses aquifer systems with minimal hydrogeological exposure to saline intrusion. Under these conditions, the combined influence of confining layers, adequate groundwater depth, and distance from the shoreline effectively limits the landward advance of seawater;
  • The low vulnerability class (3.6–5.2) indicates regions with low exposure to salt- water, and where current hydrogeological conditions provide some resistance to intrusion. Susceptibility may increase over time, however, if groundwater extraction is done at increasing rates or recharge is reduced;
  • The moderate vulnerability class (5.2–6.8) identifies transitional zones subject to compound stresses. These areas are particularly sensitive to changes in groundwater use intensity and are at risk of rapid water quality deterioration under sustained abstraction pressure;
  • The high vulnerability class (6.8–8.4) encompasses aquifer systems where the cumulative effect of shallow water tables, elevated hydraulic conductivity, and coastal proximity creates a pronounced susceptibility to saline encroachment;
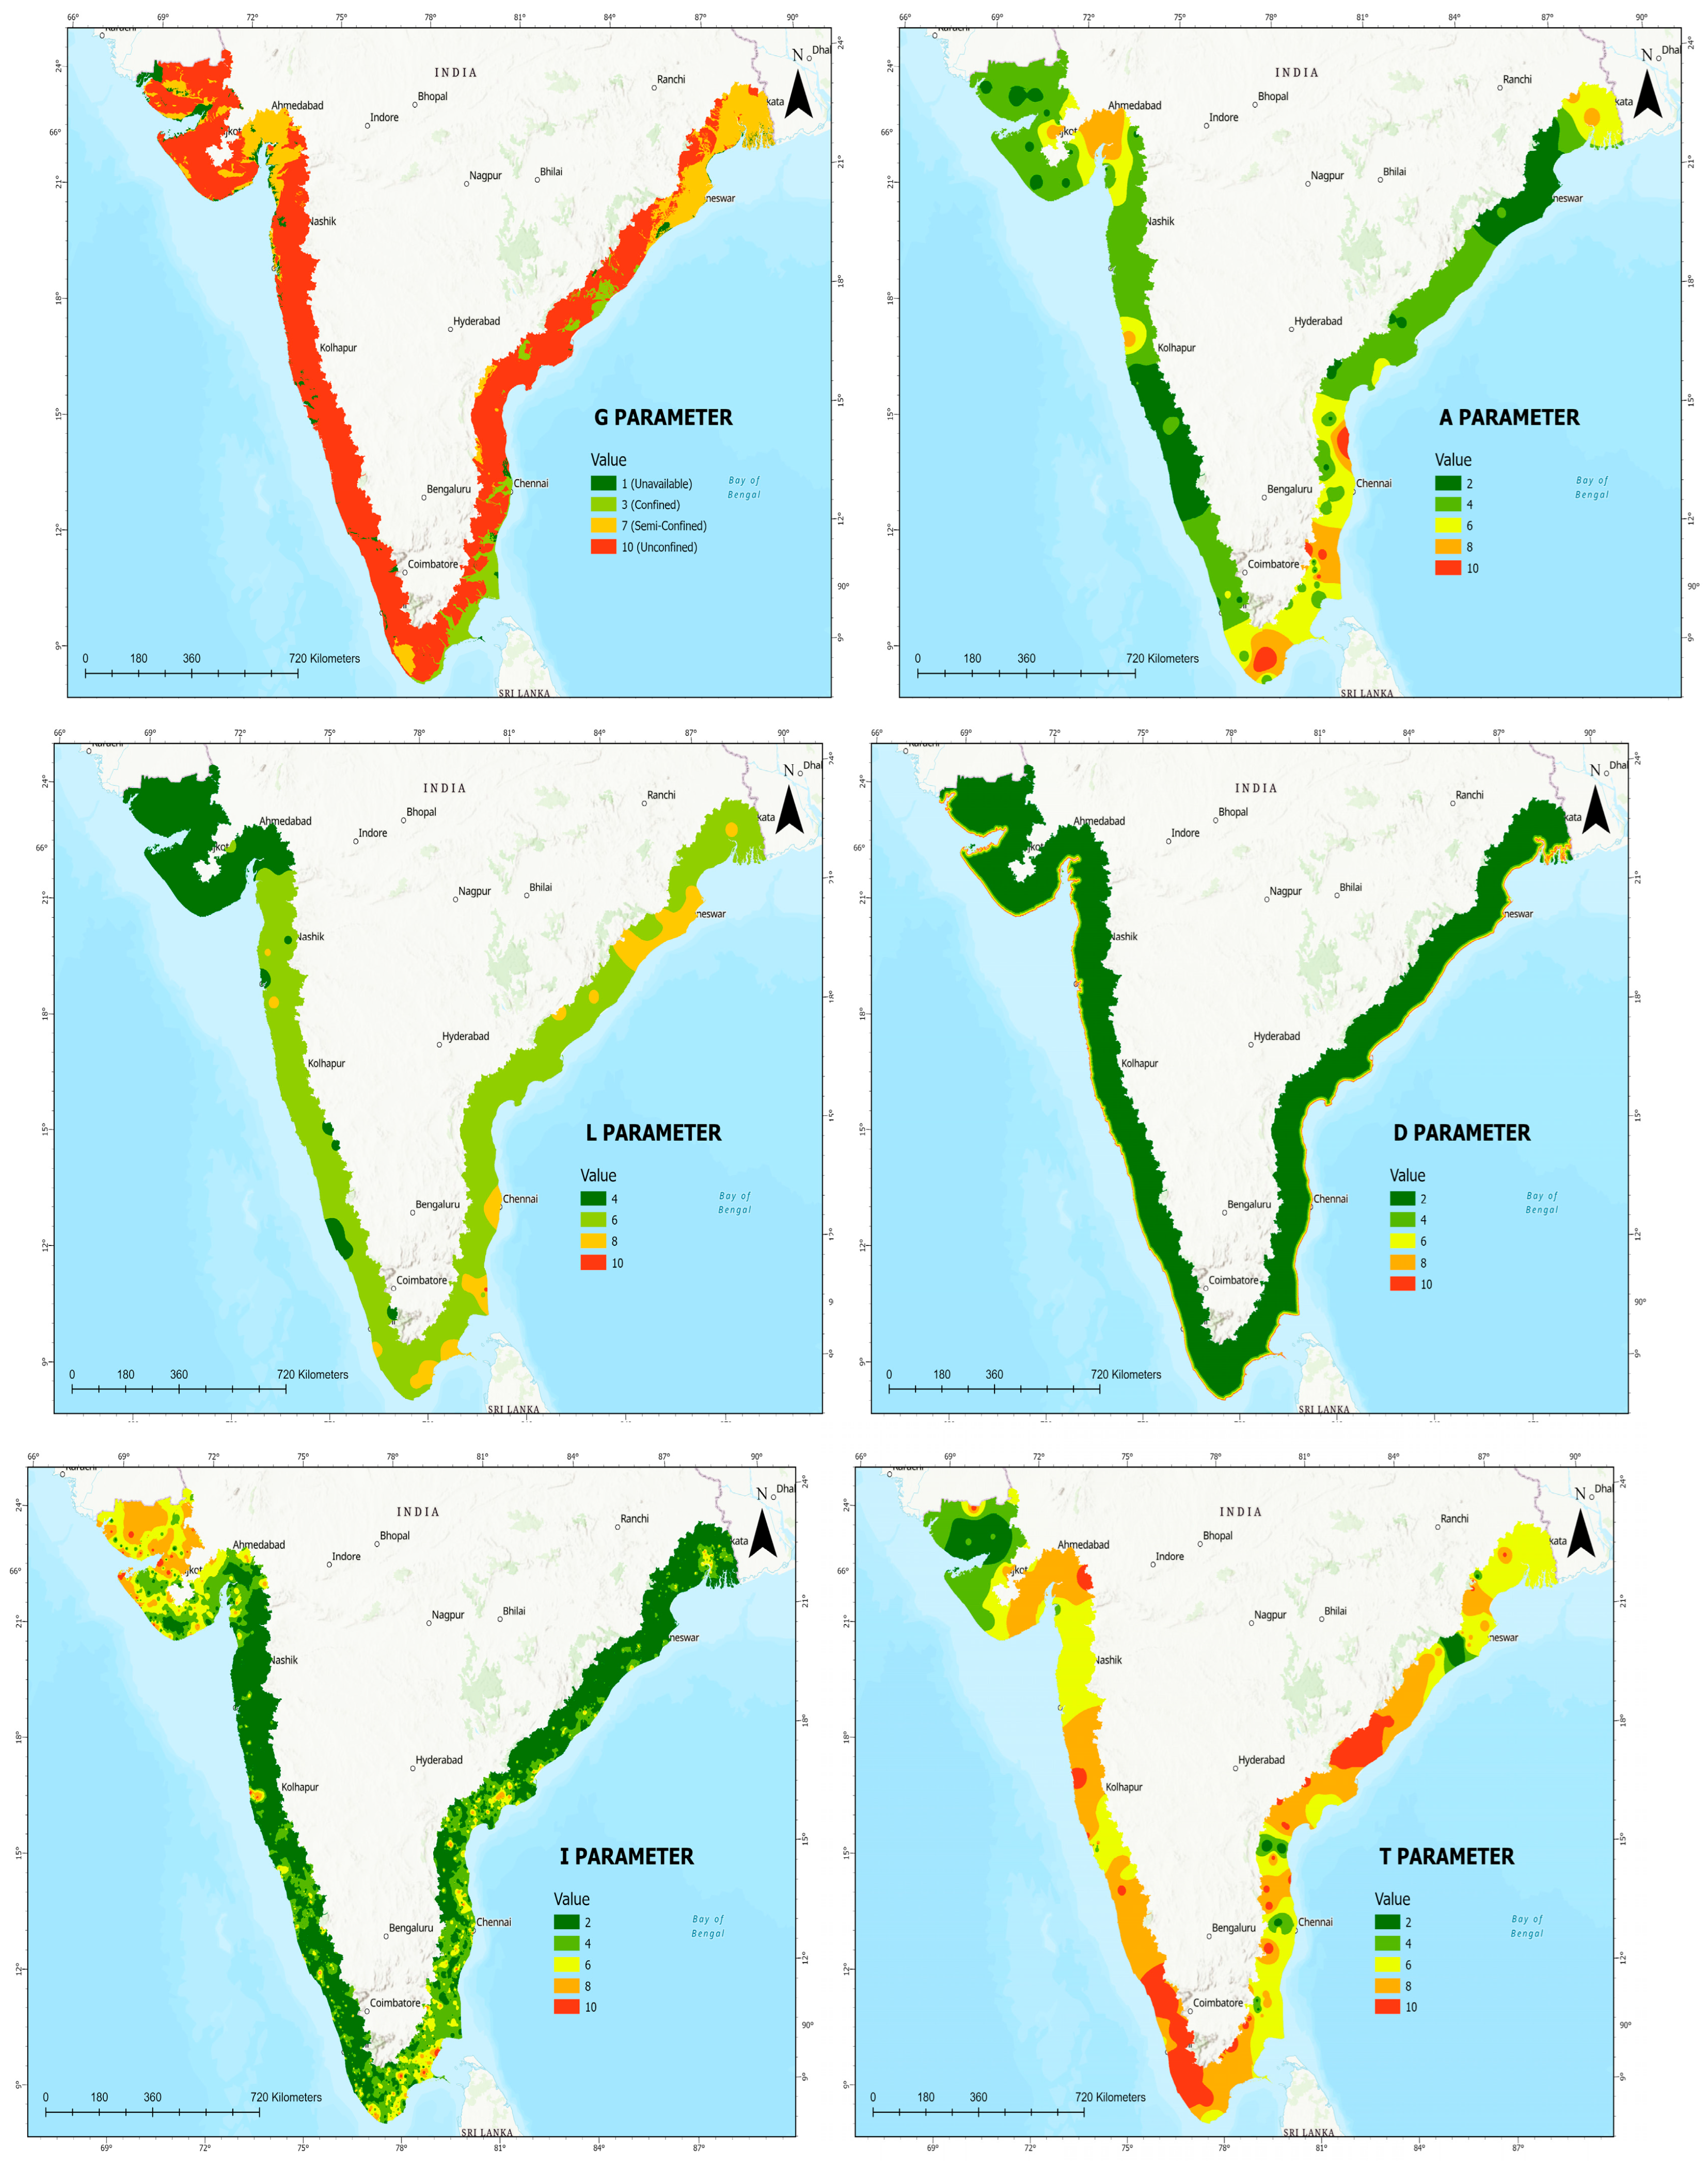
  • The very high vulnerability class (8.4–10.0) denotes aquifer systems at critical risk of seawater intrusion. These zones typically coincide with low-lying coastal plains and deltaic environments characterized by unconfined conditions and intensive groundwater extraction. The spatial distribution of each reclassified parameter layer is presented in Figure 4.

2.4.4. Land Use and Land Cover Integration

Multi-temporal land use and land cover (LULC) information was incorporated into the modified GALDIT framework as an additional parameter representing anthropogenic influence on groundwater vulnerability. LULC datasets for 2017, 2020, and 2024 were obtained from the ESA WorldCover product, which is generated from Sentinel-1 and Sentinel-2 observations at 10 m spatial resolution. Each LULC map was reclassified into vulnerability ratings according to its potential influence on groundwater abstraction, recharge, and surface sealing. The resulting LU parameter was integrated with the six conventional GALDIT parameters through weighted overlay analysis to generate the GALDIT-LU index for each assessment year. This approach enables temporal variations in land use patterns to be explicitly incorporated into the vulnerability assessment while preserving the original GALDIT framework.
Table 2 shows the LULC vulnerability weighting scheme that has been incorporated into the GALDIT-LU framework. The scheme was conceived to systematically study the impacts of various surface land use features on the probability of seawater intrusion, through either rate of groundwater extraction or natural recharge.
The highest vulnerability rating is given to built-up and urban areas where intensive groundwater extraction and widespread impervious surfaces cause a significant loss of natural infiltration and replenishment of the aquifer. High vulnerability ratings are assigned to water bodies, flooded vegetation and bare ground, as they are highly hydro-connected with shallow groundwater systems, and are sensitive to saline ingress during higher hydraulic gradients [26].
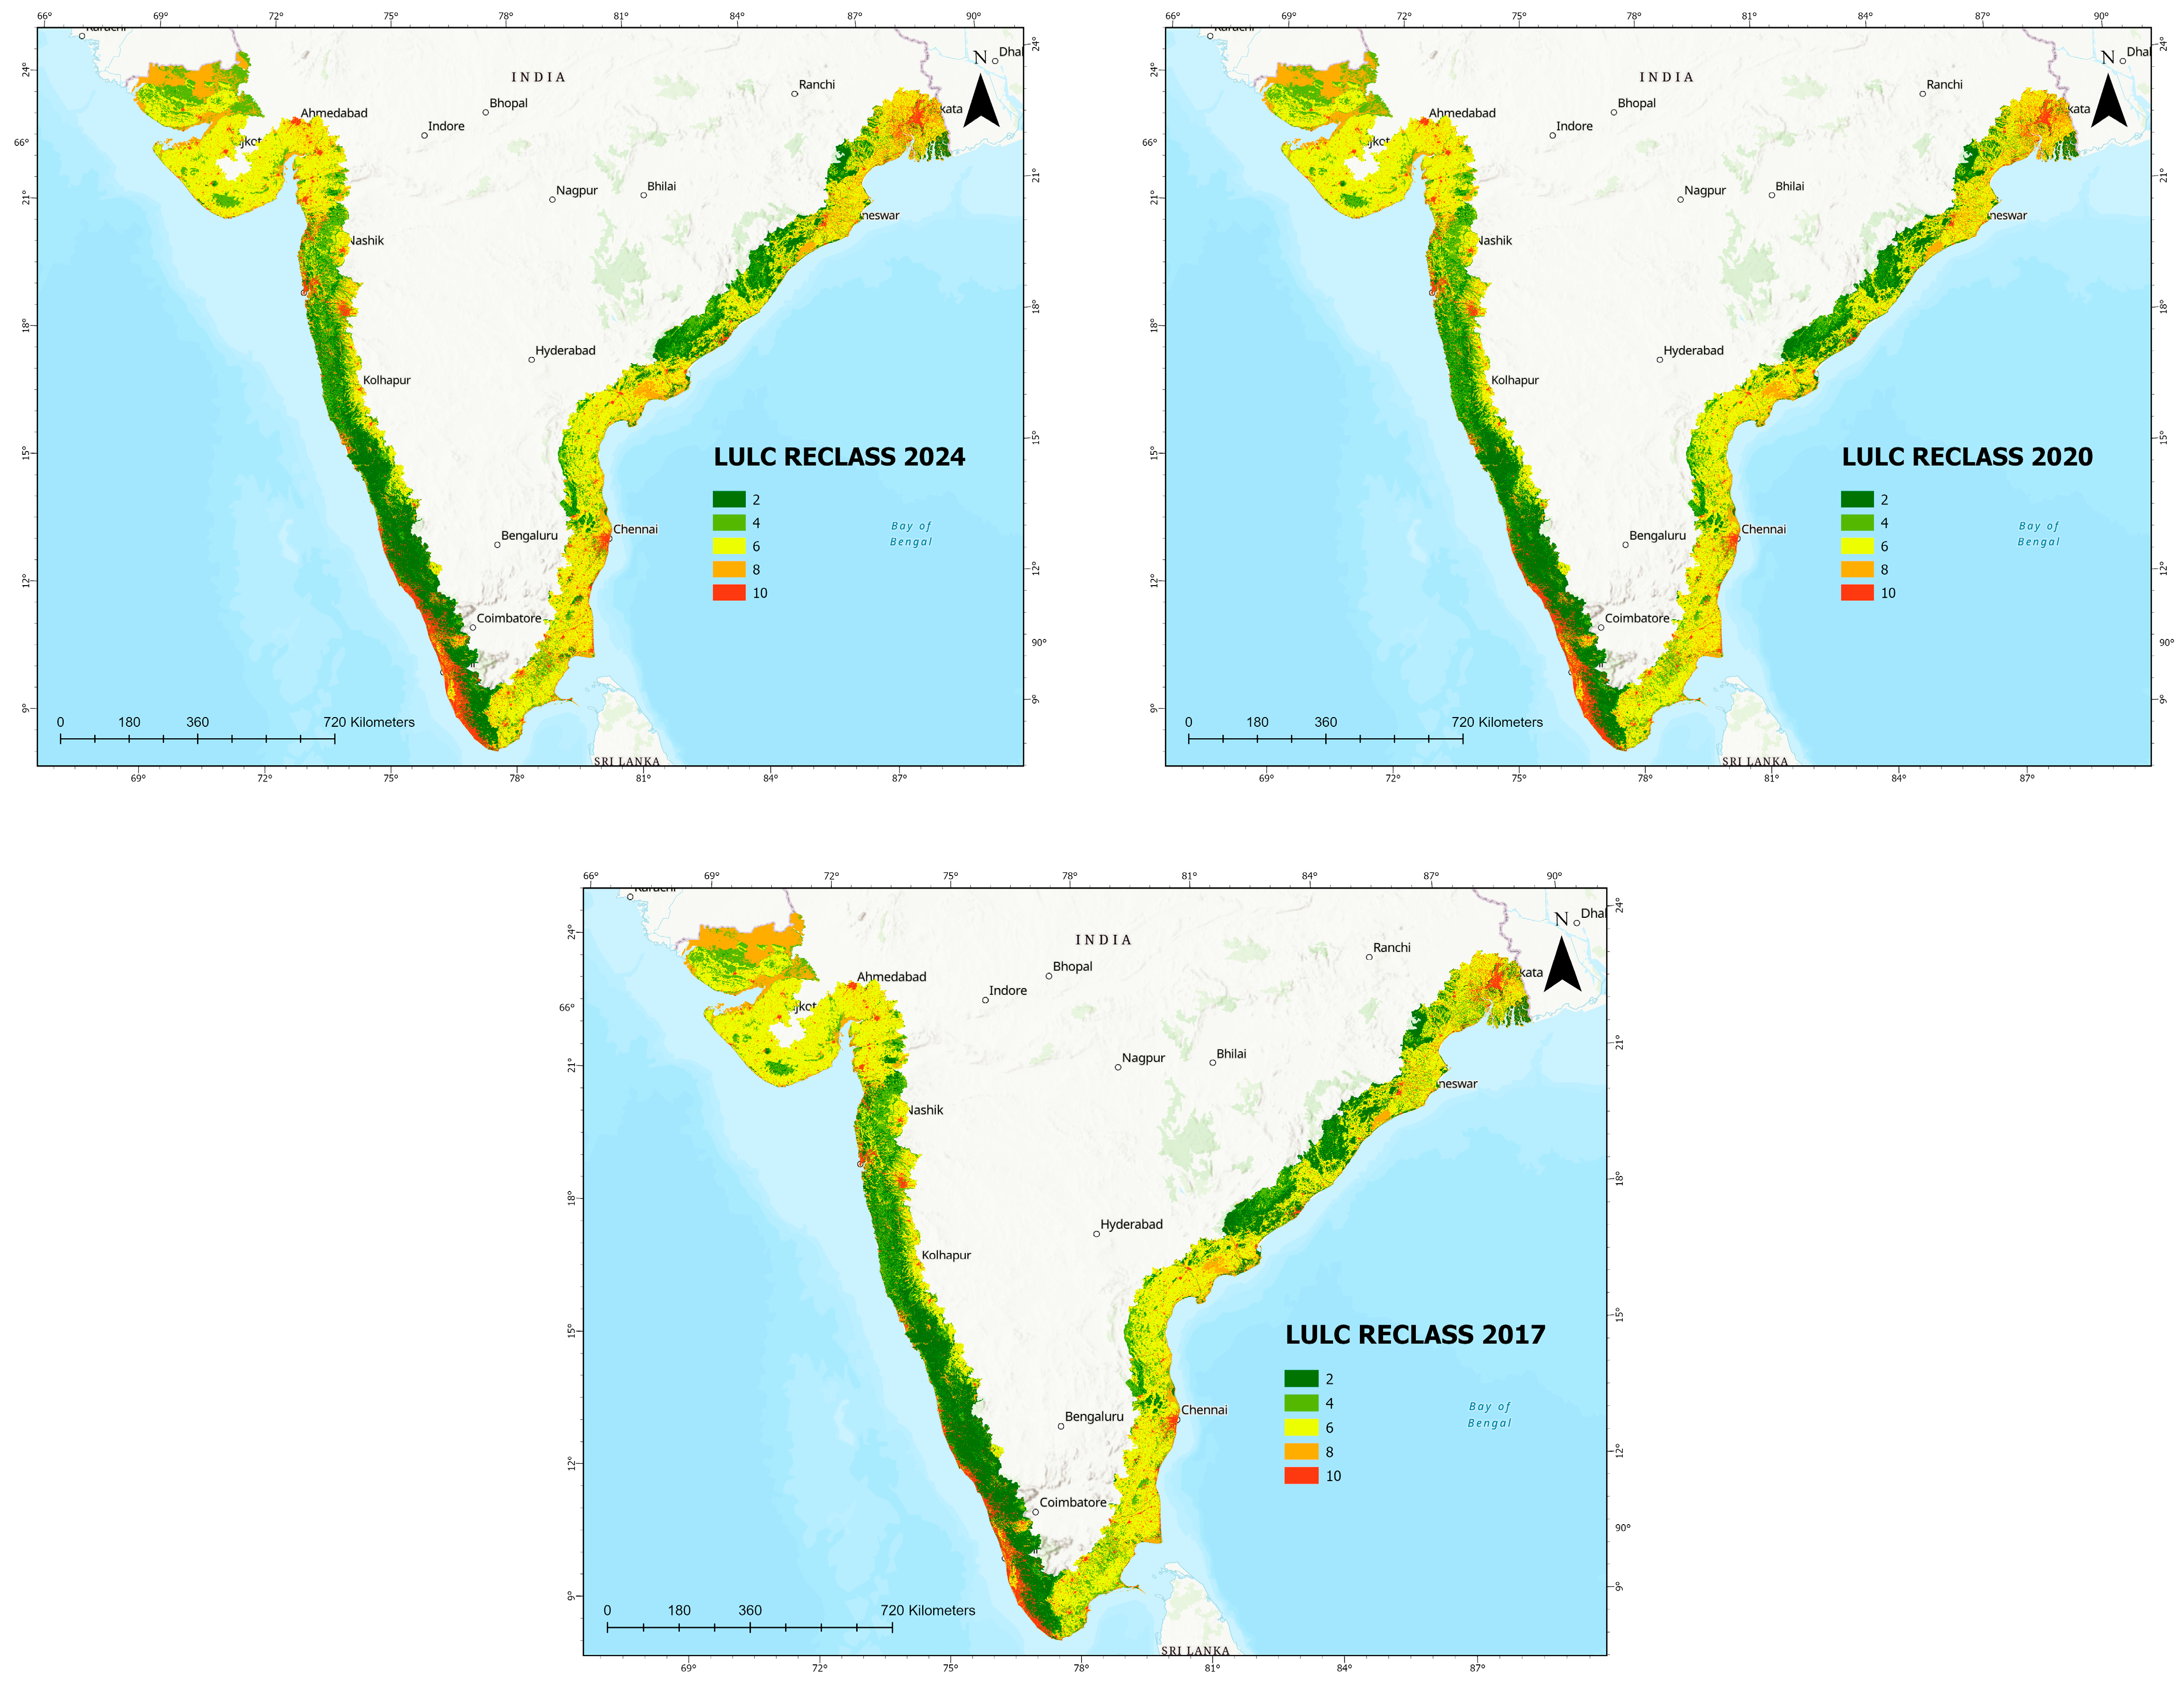
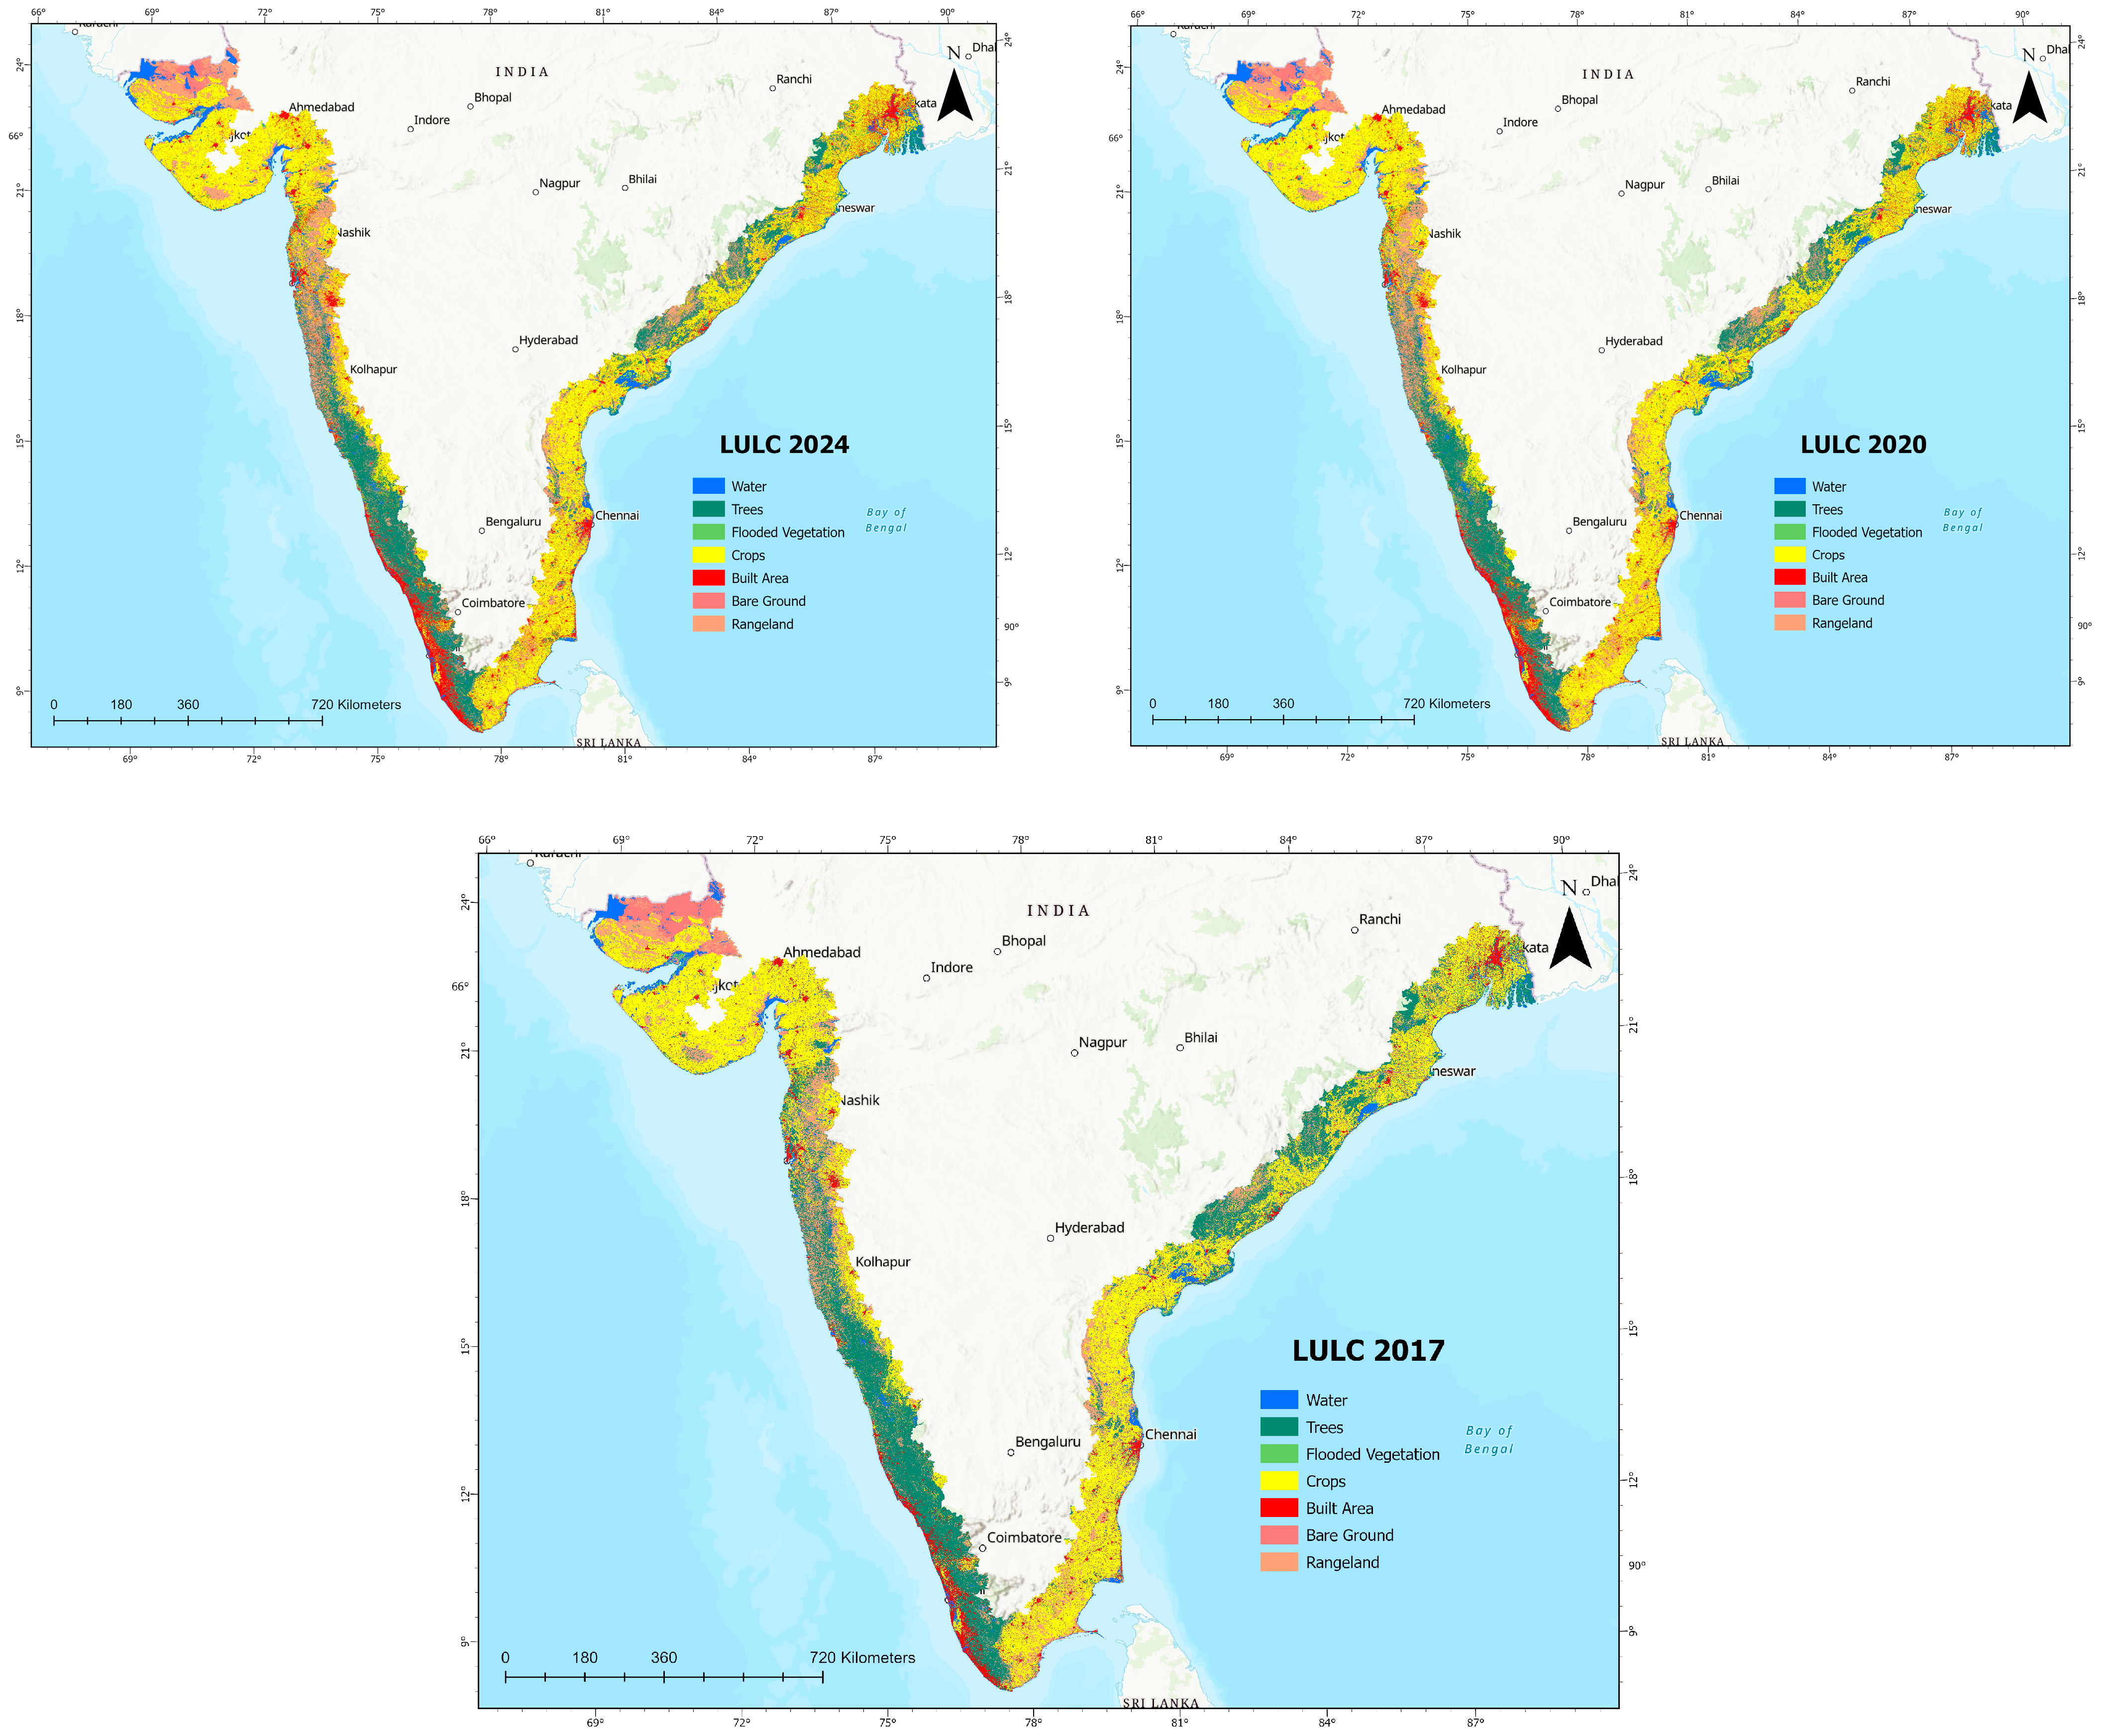
Cropland and cropland–natural vegetation mosaic areas are rated as moderately vulnerable as a result of groundwater abstraction associated with irrigation, and the seasonality of groundwater pumping in dry seasons [34]. Conversely, rangelands and low vegetation areas have low vulnerability, which indicates weak extraction pressure and moderate recharge potential. The land cover types least vulnerable are those that include forest and shrubland, which are beneficial for infiltration and groundwater recharge and cause minimal direct withdrawal of groundwater. Adopting LULC-based weighting in the GALDIT framework enables both anthropogenic (human) and natural (hydrogeological) stresses to be considered together in a composite vulnerability assessment. The multi-temporal LULC maps for 2017, 2020 and 2024 are shown in Figure 5.
The parameter weights derived from the LULC were combined with the GALDIT index using spatial overlay analysis to create a composite vulnerability index in the modified GALDIT-LU framework. The improved model incorporates the combined impact of natural hydrogeological variations and anthropogenic land use pressures on the vulnerability of coastal aquifers, and captures a more complete picture of the risk of seawater intrusion than the six-parameter GALDIT approach alone. The reliability of the resulting GALDIT index was later evaluated by comparing it with observed groundwater quality data, specifically chloride (Cl) concentrations from CGWB coastal monitoring wells, to assess how well the modeled vulnerability zones aligned with actual saline contamination.
It is important to note that LULC was treated as an independent vulnerability factor, not as a modifier of the individual GALDIT parameters. Changes in land use simultaneously affect groundwater recharge, the rate of water extraction, infiltration properties, and surface runoff via intricate interactions that cannot be traced back to a single hydrogeological factor. Thus, its impact is captured via an extra parameter that contributes to the overall composite vulnerability index.

3. Results

The GALDIT was applied along the entire Indian coastline to assess the risk of seawater intrusion. The assessment is based on hydrogeological, hydrochemical, land use, and remote sensing data. The results show that it varies greatly along the coast, depending on aquifer, use, distance, and extraction. Short inland distances can go from low to very high vulnerability. This sensitivity shows how easily coastal aquifers change from stable to stressed when the freshwater levels change.

3.1. GALDIT Parameter Mapping

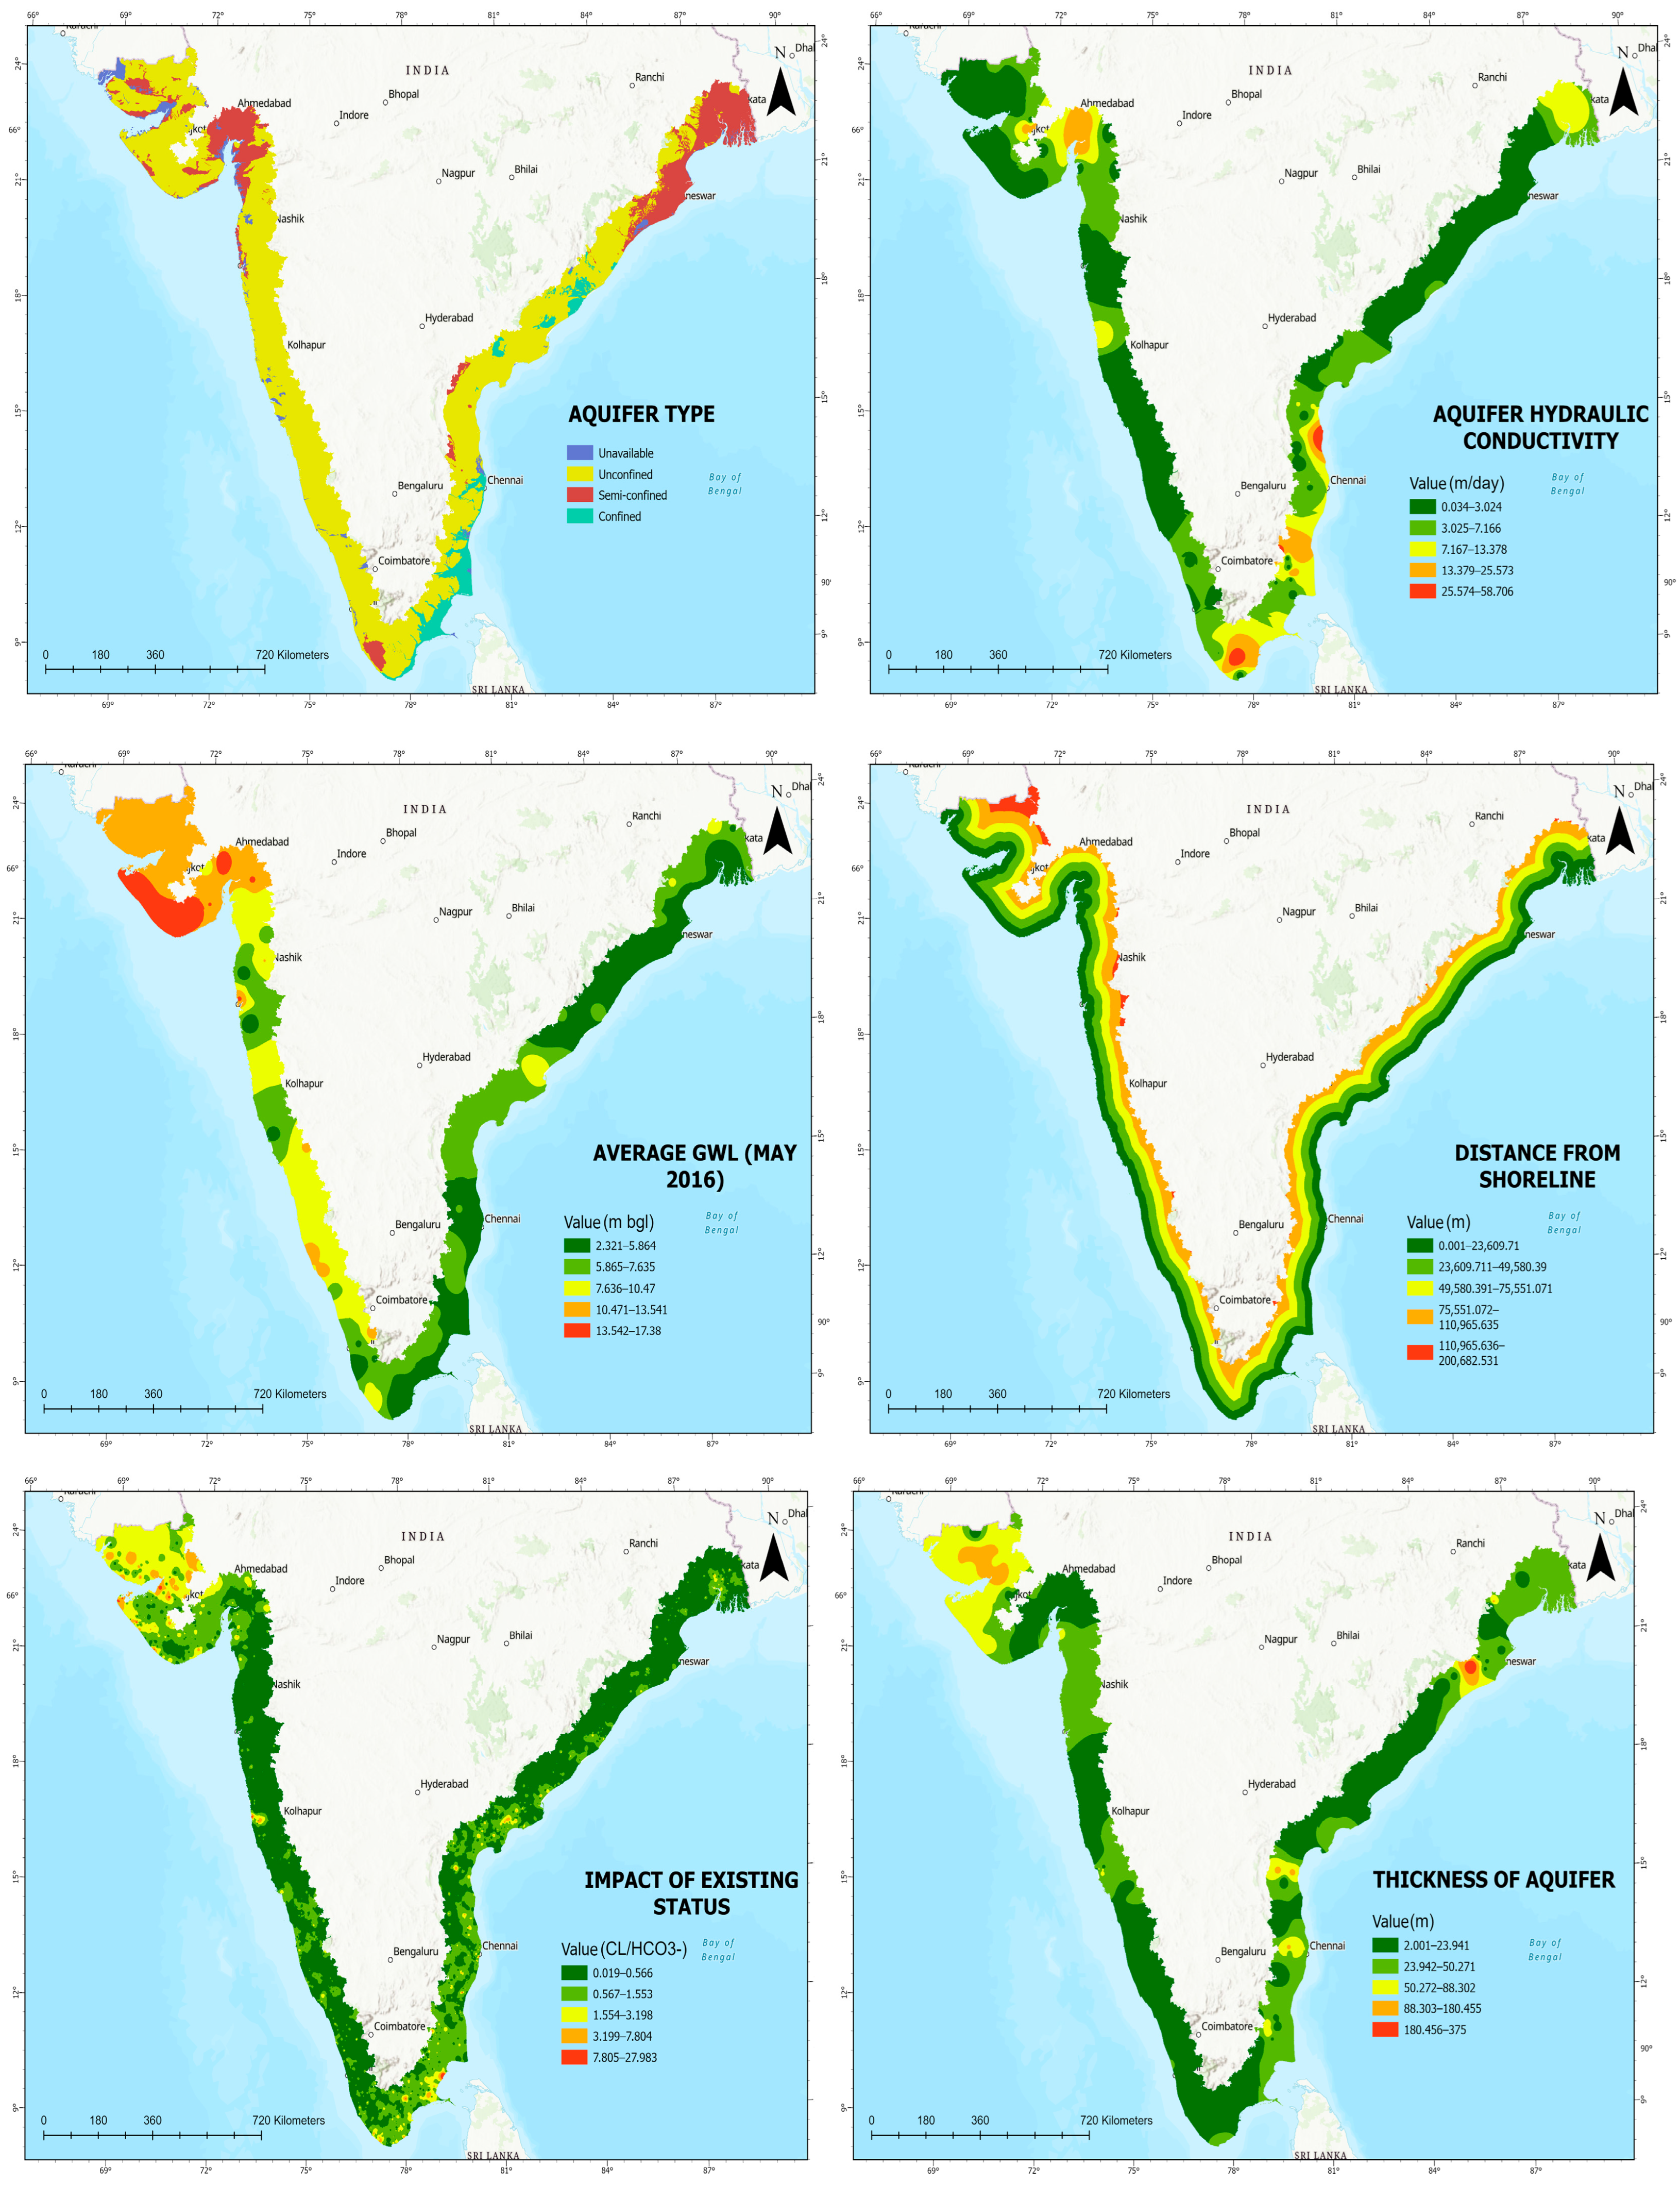
Each of the six GALDIT parameters was mapped separately before being combined into the composite index. The individual maps show the main areas where seawater may enter. Figure 6 shows the original parameter maps for all six variables.

3.1.1. Groundwater Occurrence (G-Parameter)

The G-parameter map shows how aquifer confinement varies along the coastline. Unconfined aquifers are widespread across the major coastal plains of Gujarat, Maharashtra, Tamil Nadu, Andhra Pradesh, Odisha, and West Bengal. These systems have no protective confining layer. As a result, saline water can move upward freely whenever freshwater levels drop. Semi-confined aquifers are found mainly in the deltaic zones of Odisha and West Bengal. Sand and clay layers provide some degree of natural protection in these areas. However, continued groundwater extraction has weakened this protection over time, and saline water has gradually entered freshwater zones. Vulnerability in these regions falls in the moderate to high range. Confined aquifers occupy isolated pockets along the coastlines of Kerala and Gujarat. Confining layers normally restrict vertical saltwater movement in these systems; yet heavy pumping over long periods can cause upward leakage, meaning that even confined aquifers are not fully protected. In summary, the type of aquifer is one of the most direct factors affecting how easily saltwater can penetrate a groundwater system.

3.1.2. Aquifer Hydraulic Conductivity (A-Parameter)

Hydraulic conductivity values differ widely along the coast. High-conductivity zones above 20 m/day correspond to alluvial and deltaic deposits, particularly the Narmada delta in Gujarat, the Krishna–Godavari delta in Andhra Pradesh, and the Ganges–Brahmaputra delta in West Bengal. Loose sands and silts dominate these formations, allowing groundwater to move quickly. When hydraulic gradients favor intrusion, saltwater can travel inland at considerable speed. Along the Tamil Nadu coast, conductivity ranges from 5 to 10 m/day and is associated with semi-consolidated sedimentary aquifers. Low-conductivity zones, with conductivities below 1 m/day, occur in the lateritic areas of Kerala and in the hard rock formations of the Konkan region. Despite high annual rainfall in some of these areas, limited permeability significantly slows the lateral movement of saline water. High hydraulic conductivity does not cause seawater intrusion on its own. What it does is accelerate intrusion once it begins. Where groundwater levels are already declining due to heavy pumping, high conductivity accelerates the spread and allows it to reach farther inland.

3.1.3. Depth to Groundwater Level (L-Parameter)

Pre-monsoon groundwater-level data from May 2016 served as the reference dataset for this parameter. Very shallow water tables, less than 3 m below the surface, are widespread in the Gujarat coastal plains, the Tamil Nadu delta, and the West Bengal delta. Shallow groundwater means that very little freshwater head is available to resist the pressure of saline water. Intermediate depths of 5 to 10 m occur in transitional zones farther inland. Deep water tables over 20 m deep exist in higher places and in hard rocks far from the sea. Where water is shallow along the coast, GALDIT scores are highest. So there we have it; the deeper the water table, the more vulnerable it is. Shallow water tables may sound like a good thing, but they are actually dangerous in coastal areas. A low water table makes the hydraulic gradient less resistant to the inland movement of saltwater.

3.1.4. Distance from Shoreline (D-Parameter)

The distance parameter follows a clear gradient. The highest vulnerability class covers a continuous narrow strip within 500 m of the coastline along all 7517 km of the Indian shore. High vulnerability still goes from 500 m to 2000 m inland, affecting broad coastal plains in Gujarat, Tamil Nadu and West Bengal. Moderate risk is between 2000 and 5000 m. The risk decreases the higher you go. The first 500 m is where the marine influence is strongest. Within two kilometers of the coast, there is a continuous band of risk. Still, the water does not stop at the horizon. Aquifers and pumps can interact with distance to determine how far the salty water goes.

3.1.5. Impact of Existing SWI Status (I-Parameter)

The Cl/HCO3 ratio provides a direct measure of current seawater intrusion. High ratios above 2 confirm active saline contamination. These conditions are recorded in Gujarat at Bhavnagar and Amreli, in Tamil Nadu at Cuddalore, and in West Bengal at North 24 Parganas. Moderate ratios of 1 to 2 occur in transitional zones where intrusion is present but not yet severe. Low ratios below 1 are found in areas far from the coast and in confined aquifer systems. Transitional zones with moderate ratios deserve particular attention for management purposes. If pumping continues in these areas, conditions could shift quickly toward full saline contamination. The I-parameter also serves as a cross-check of the model results, confirming that the high-risk zones identified by GALDIT correspond to actual contamination on the ground.

3.1.6. Aquifer Thickness (T-Parameter)

Thin aquifers, between 0 and 10 m, dominate the narrow coastal strips of Tamil Nadu, Odisha, and West Bengal. Their limited storage capacity leaves very little freshwater to resist saltwater intrusion. Transitional zones farther inland have a moderate thickness of 10 to 50 m. Thick aquifers exceeding 75 m are found in major delta systems and alluvial plains not directly adjacent to the coast. Thicker water storage areas can hold freshwater, but that does not always happen. When people take out a lot of water, and not much new water comes in, even the thick storage areas can be used up. The thickness of the water storage area is only really helpful when it gets new water, and people do not take out too much water from the water storage area.
The six maps that were reclassified show that the Indian coast has some clear patterns. The Indian coast has many areas where the underground water is not confined. These are mostly found on the eastern coast and the southern tip. Areas with soil, like deltas and river plains, have water that can move through the ground very easily, but areas with hard rock on the western coast do not. The coastal areas that are close to sea level have water tables that are very close to the surface, which means that the freshwater in these areas is not very deep. The distance map shows that there is a risk of water getting into the freshwater all along the coast. The salinity map also shows that there are some areas where the water is very salty. The areas with layers of freshwater are found in the narrow strips of land, along the southeastern coast. When you look at all of these patterns together, you get a picture of GALDIT vulnerability.

3.2. GALDIT Vulnerability Index: Regional Spatial Patterns

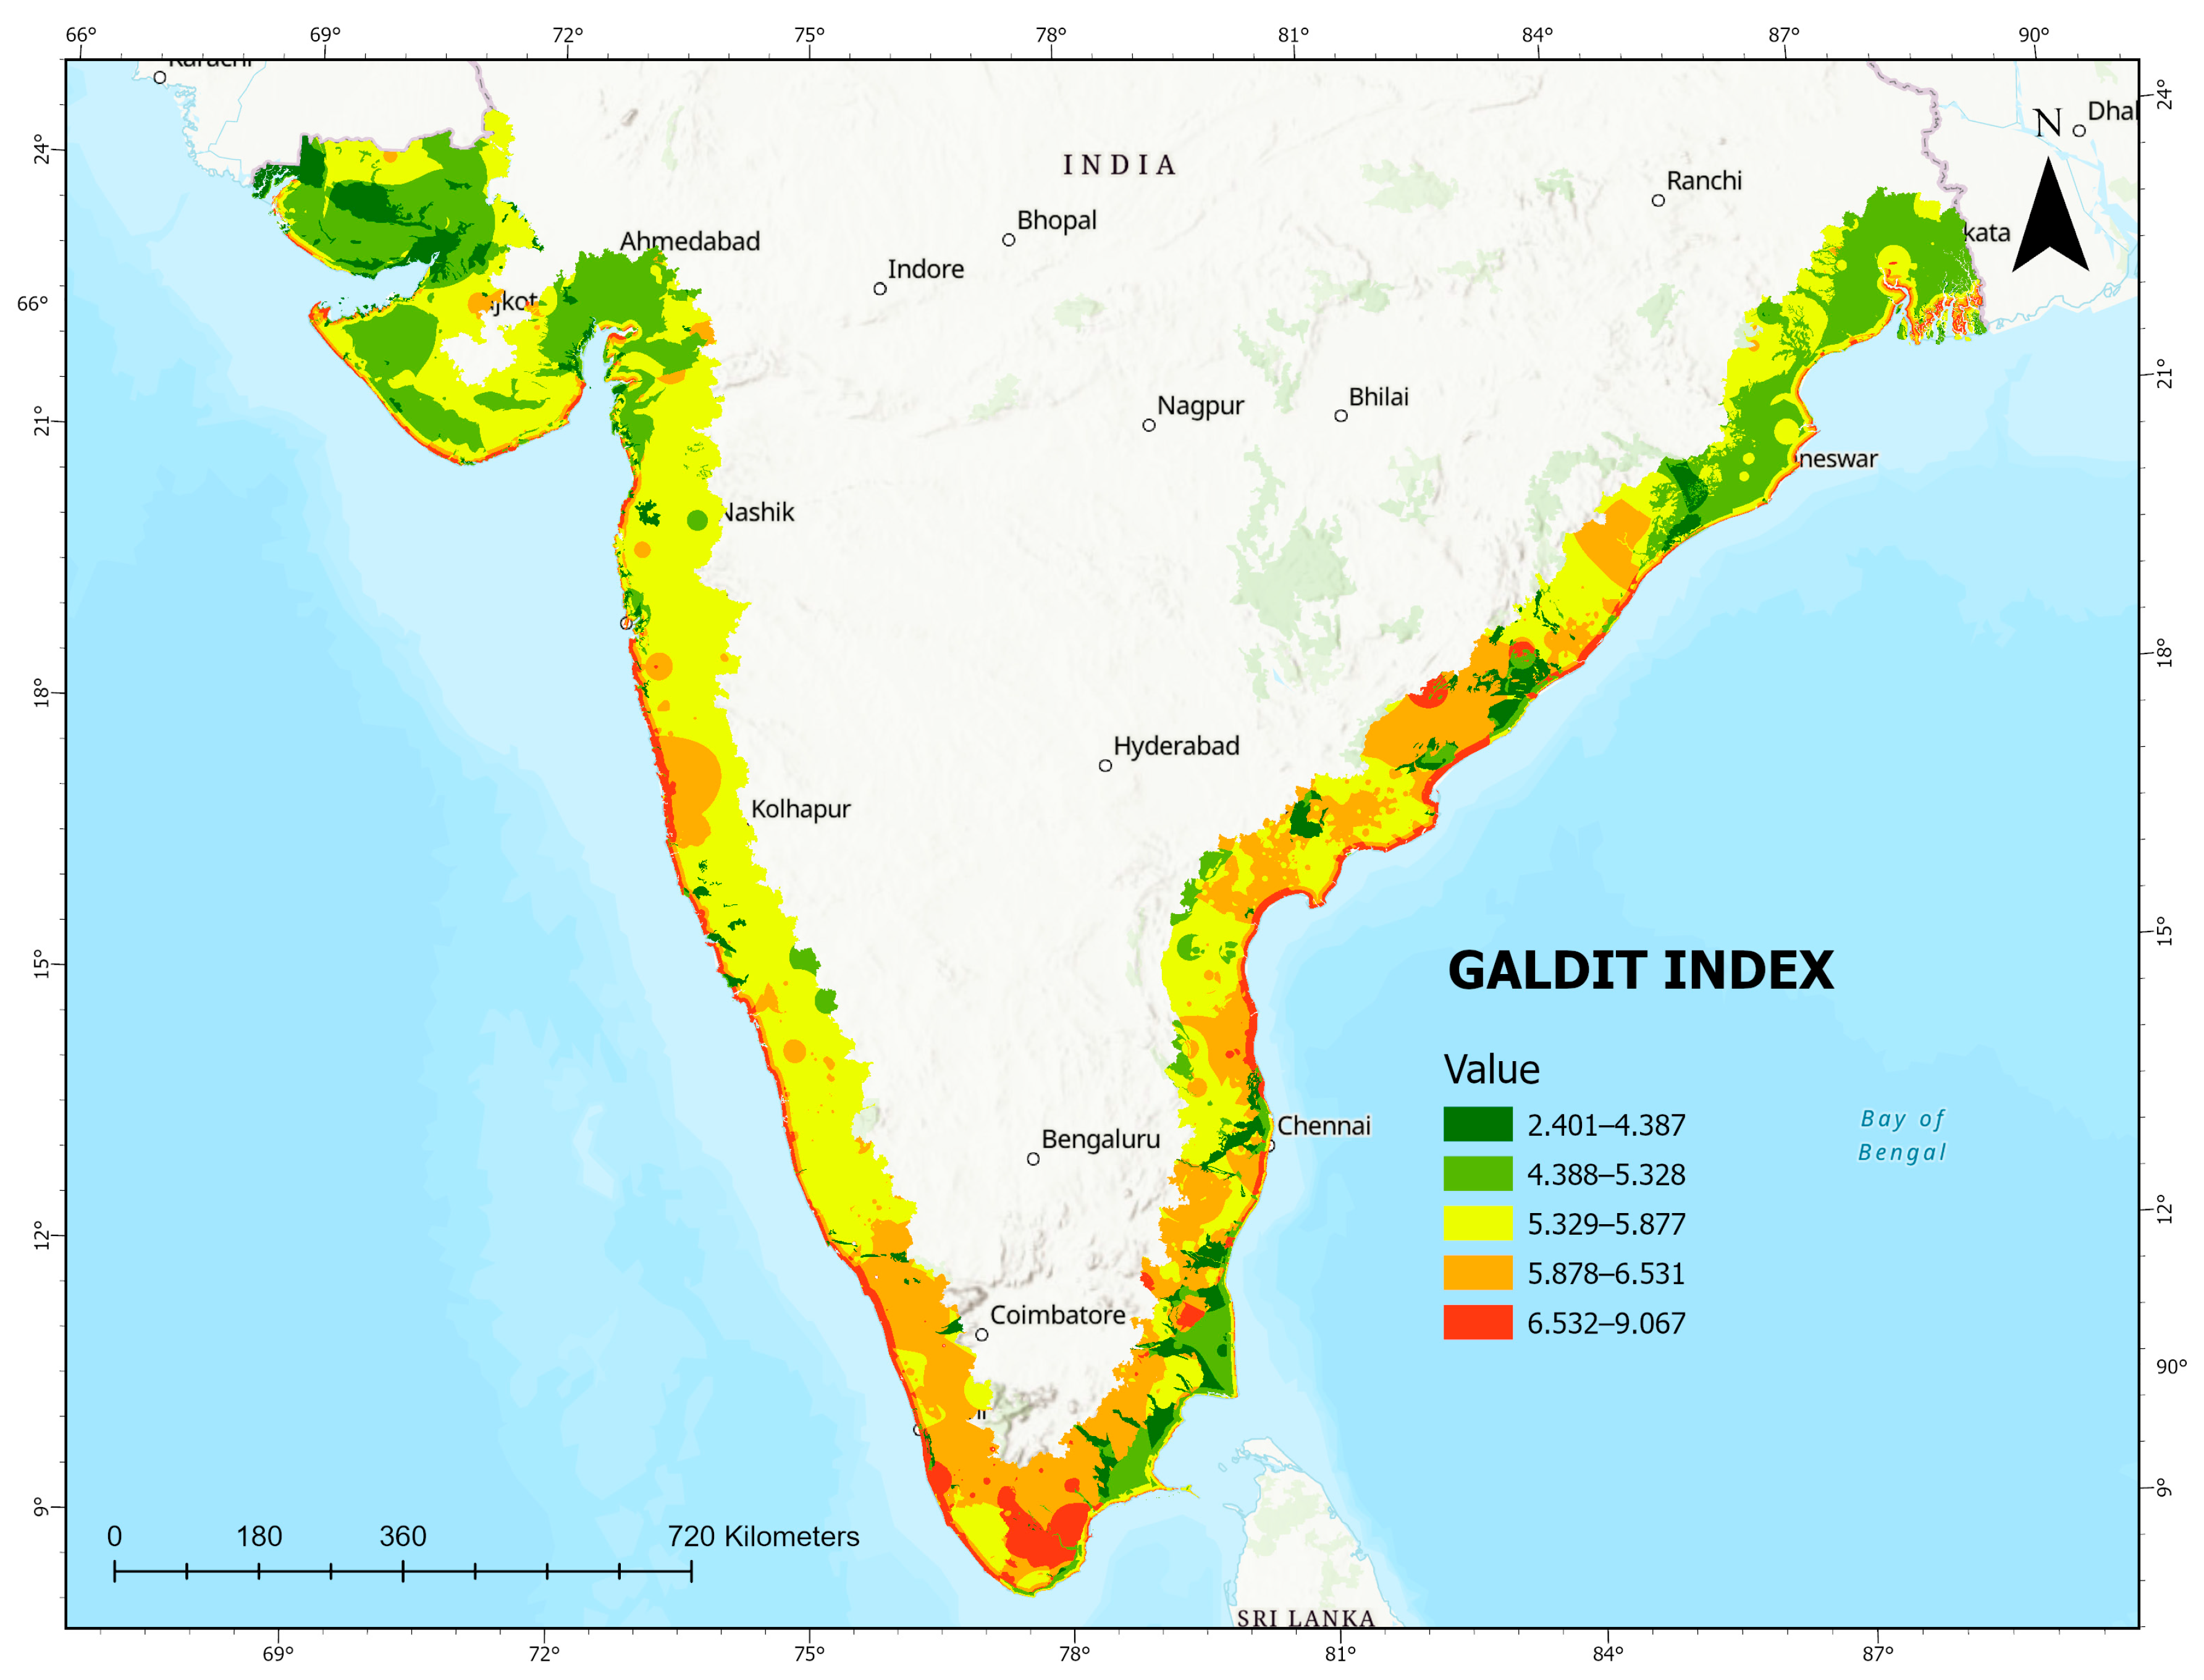
To prepare the GALDIT vulnerability index, the six weighted parameter layers were layered together in ArcGIS Pro. Figure 7 displays the spatial distributions along the Indian coast in 2024. Distinct vulnerabilities are evident along the west coast and the east coast as their geologic conditions, climate, and human use vary drastically.

3.2.1. West Coast (Arabian Sea)

Gujarat Coast
Seawater intrusion risk on the Gujarat coast ranges from moderate to very high. The dry-to-semi-arid climate limits natural groundwater recharge across most of this zone. Agricultural and industrial extraction continues to steadily deplete freshwater reserves. Ancient marine deposits also raise the natural salinity baseline, creating conditions favorable for intrusion from the outset. The flat coastal topography reduces hydraulic gradients, offering less resistance to saltwater moving inland. Although some hard rock aquifers exist here, groundwater overuse outweighs the protection they provide.
Konkan Coast (Maharashtra)
The Konkan coast shows low to moderate vulnerability. Hard rock aquifers formed from the basaltic Deccan Traps underlie most of this stretch. These rocks have very low primary porosity, which effectively restricts saltwater flow. Steep hydraulic gradients push freshwater quickly toward the sea, leaving limited opportunity for saltwater to advance inland. Heavy monsoon rainfall recharges aquifers effectively during the wet season, maintaining high freshwater pressure throughout the season. Groundwater extraction here is also much lower than in heavily irrigated delta areas. These conditions work together to create a natural barrier against seawater intrusion despite the proximity to the coast.
Goa
Goa shows low to moderate overall vulnerability, with only a few localized high-risk areas. High monsoonal rainfall supports effective natural recharge, and large-scale groundwater extraction is limited. Coastal lowlands and estuarine areas are the main exceptions. In these zones, shallow aquifers and tidal fluctuations create localized conditions that allow saltwater to penetrate.
Karnataka
Moderate vulnerability characterizes the Karnataka coast. Aquifer systems here are mixed, combining weathered hard rock formations with localized alluvial deposits. This geological mix creates variability in susceptibility from one area to the next. Groundwater use for agriculture and household supply puts pressure on freshwater levels during dry periods. Near river mouths, sandy coastal sediments allow localized seawater movement. Hydrogeological variability and human pressure together produce the heterogeneous vulnerability pattern seen along this coast.
Kerala
Kerala shows a mixed pattern. Most of the coast falls in the moderate vulnerability range, but some southern districts reach the high category. Lateritic formations with shallow unconfined aquifers are common in affected areas. High population density and steady domestic groundwater use add further pressure. The coastal plain is very narrow, which means even small drops in freshwater levels can push conditions toward greater vulnerability. High annual rainfall provides some natural protection, but it is not sufficient to offset the combined pressure in the most stressed zones.
Maharashtra
The Maharashtra coastline generally shows moderate vulnerability. Certain low-lying coastal plains near urban and semi-urban areas face a higher risk. The Deccan Trap hard rock aquifers exhibit some resistance due to steep hydraulic gradients and moderate recharge. Localized high-risk zones do exist where heavy pumping meets shallow water tables, particularly near estuarine communities. A notable feature of the West Coast as a whole is the abrupt shift from low to high vulnerability over very short inland distances. This reflects the limited capacity of coastal aquifers to absorb pressure, especially during dry seasons when extraction is highest.

3.2.2. East Coast (Bay of Bengal)

Odisha and West Bengal
The coastlines of Odisha and West Bengal show high vulnerability in thick alluvial/deltaic aquifer areas. These formations are highly transmissive and help to push saline water towards the landward side. This movement is opposed by low coastal elevations and the flat topography. The delta structures of Mahanadi and Ganga–Brahmaputra are hydraulically well connected over large areas, and salinity spreads laterally and longitudinally over the delta. During dry seasons, irrigation pumping reduces freshwater heads further and allows saline water to move in more easily.
Andhra Pradesh
The Andhra Pradesh coast has high to very high vulnerability. The Krishna and Godavari river deltas are the primary driver. Their aquifers have high transmissivity and strong hydraulic connectivity across broad areas. Heavy extraction for irrigation has significantly lowered groundwater levels, reducing the freshwater pressure that normally resists saline intrusion. Reduced surface water inflows over the past few decades have also weakened the natural flushing capacity of these systems. Sandy and silty sediments allow saline water to move inland quickly once intrusion begins. This area stands as one of the most significant intrusion hotspots along the entire Indian coast.
Tamil Nadu and Puducherry
Tamil Nadu and Puducherry face consistently high-to-very-high intrusion risk. Overextraction for agriculture, urban supply, and industry has sharply reduced freshwater levels. Irregular rainfall and hard urban surfaces limit recharge. The coastal aquifers here are mainly unconfined alluvial and coastal sand systems, which respond quickly to any loss of freshwater head. During long dry seasons, groundwater levels often fall below mean sea level, and the resulting pressure difference actively draws saltwater inland. Geological susceptibility and heavy human demand together create a persistent and serious risk of intrusion along this coast.
Southern Tip of India
The southern tip of India is among the most vulnerable segments of the coastline. The narrow coastal stretch leaves very little room for freshwater storage. Shallow, highly permeable aquifers respond quickly to changes in hydraulic gradients. Sustained domestic and irrigation pumping has substantially reduced freshwater heads in these systems. Close proximity to the sea strongly influences the distance parameter, and even small declines in sea level can trigger rapid landward saltwater movement. Viewed through the full GALDIT index, the West Coast shows considerable spatial variability in vulnerability, driven by its geologically diverse aquifer settings. The East Coast, by contrast, presents a more continuous band of high vulnerability. Large deltaic aquifers and intensive agricultural pumping are the main factors behind this contrast.

3.3. GALDIT-LU Vulnerability: Impact of LULC Dynamics

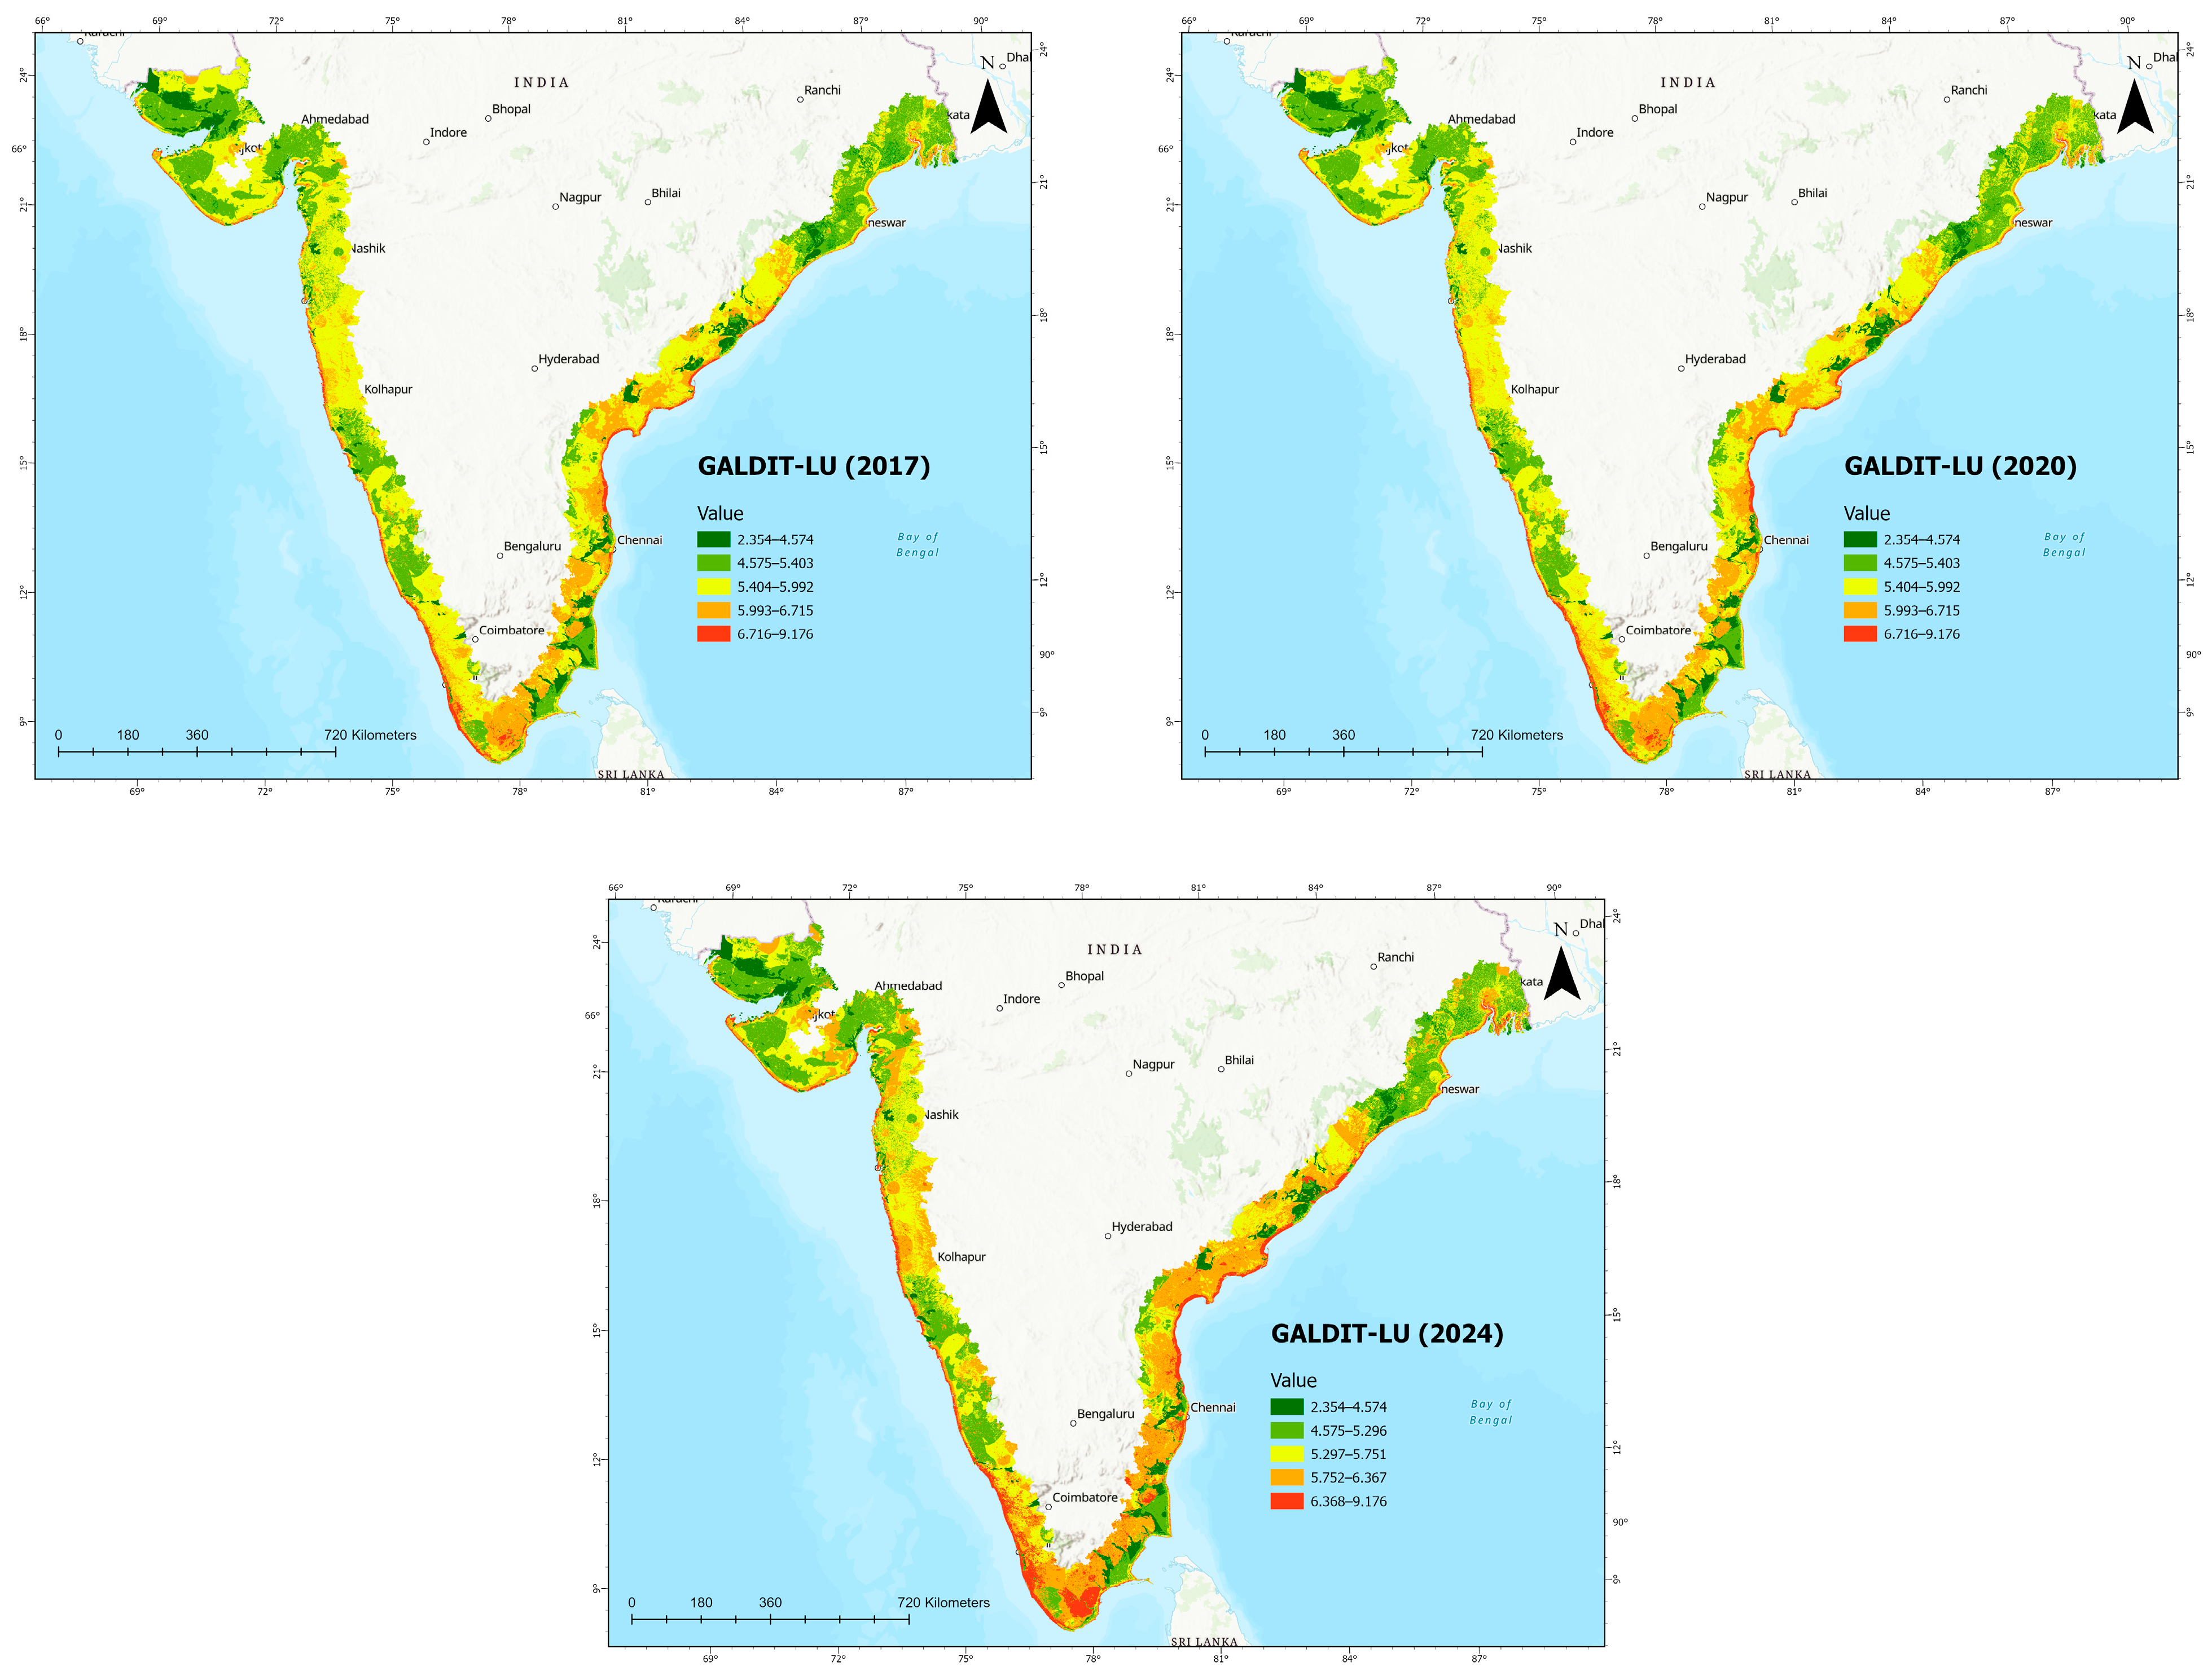
The GALDIT-LU model incorporates land use and land cover as a seventh parameter to capture the influence of human activity on the risk of seawater intrusion. The reclassified LULC maps for 2017, 2020, and 2024 are presented in Figure 8.

3.3.1. Spatio-Temporal Variation in GALDIT-LU Vulnerability (2017–2024)

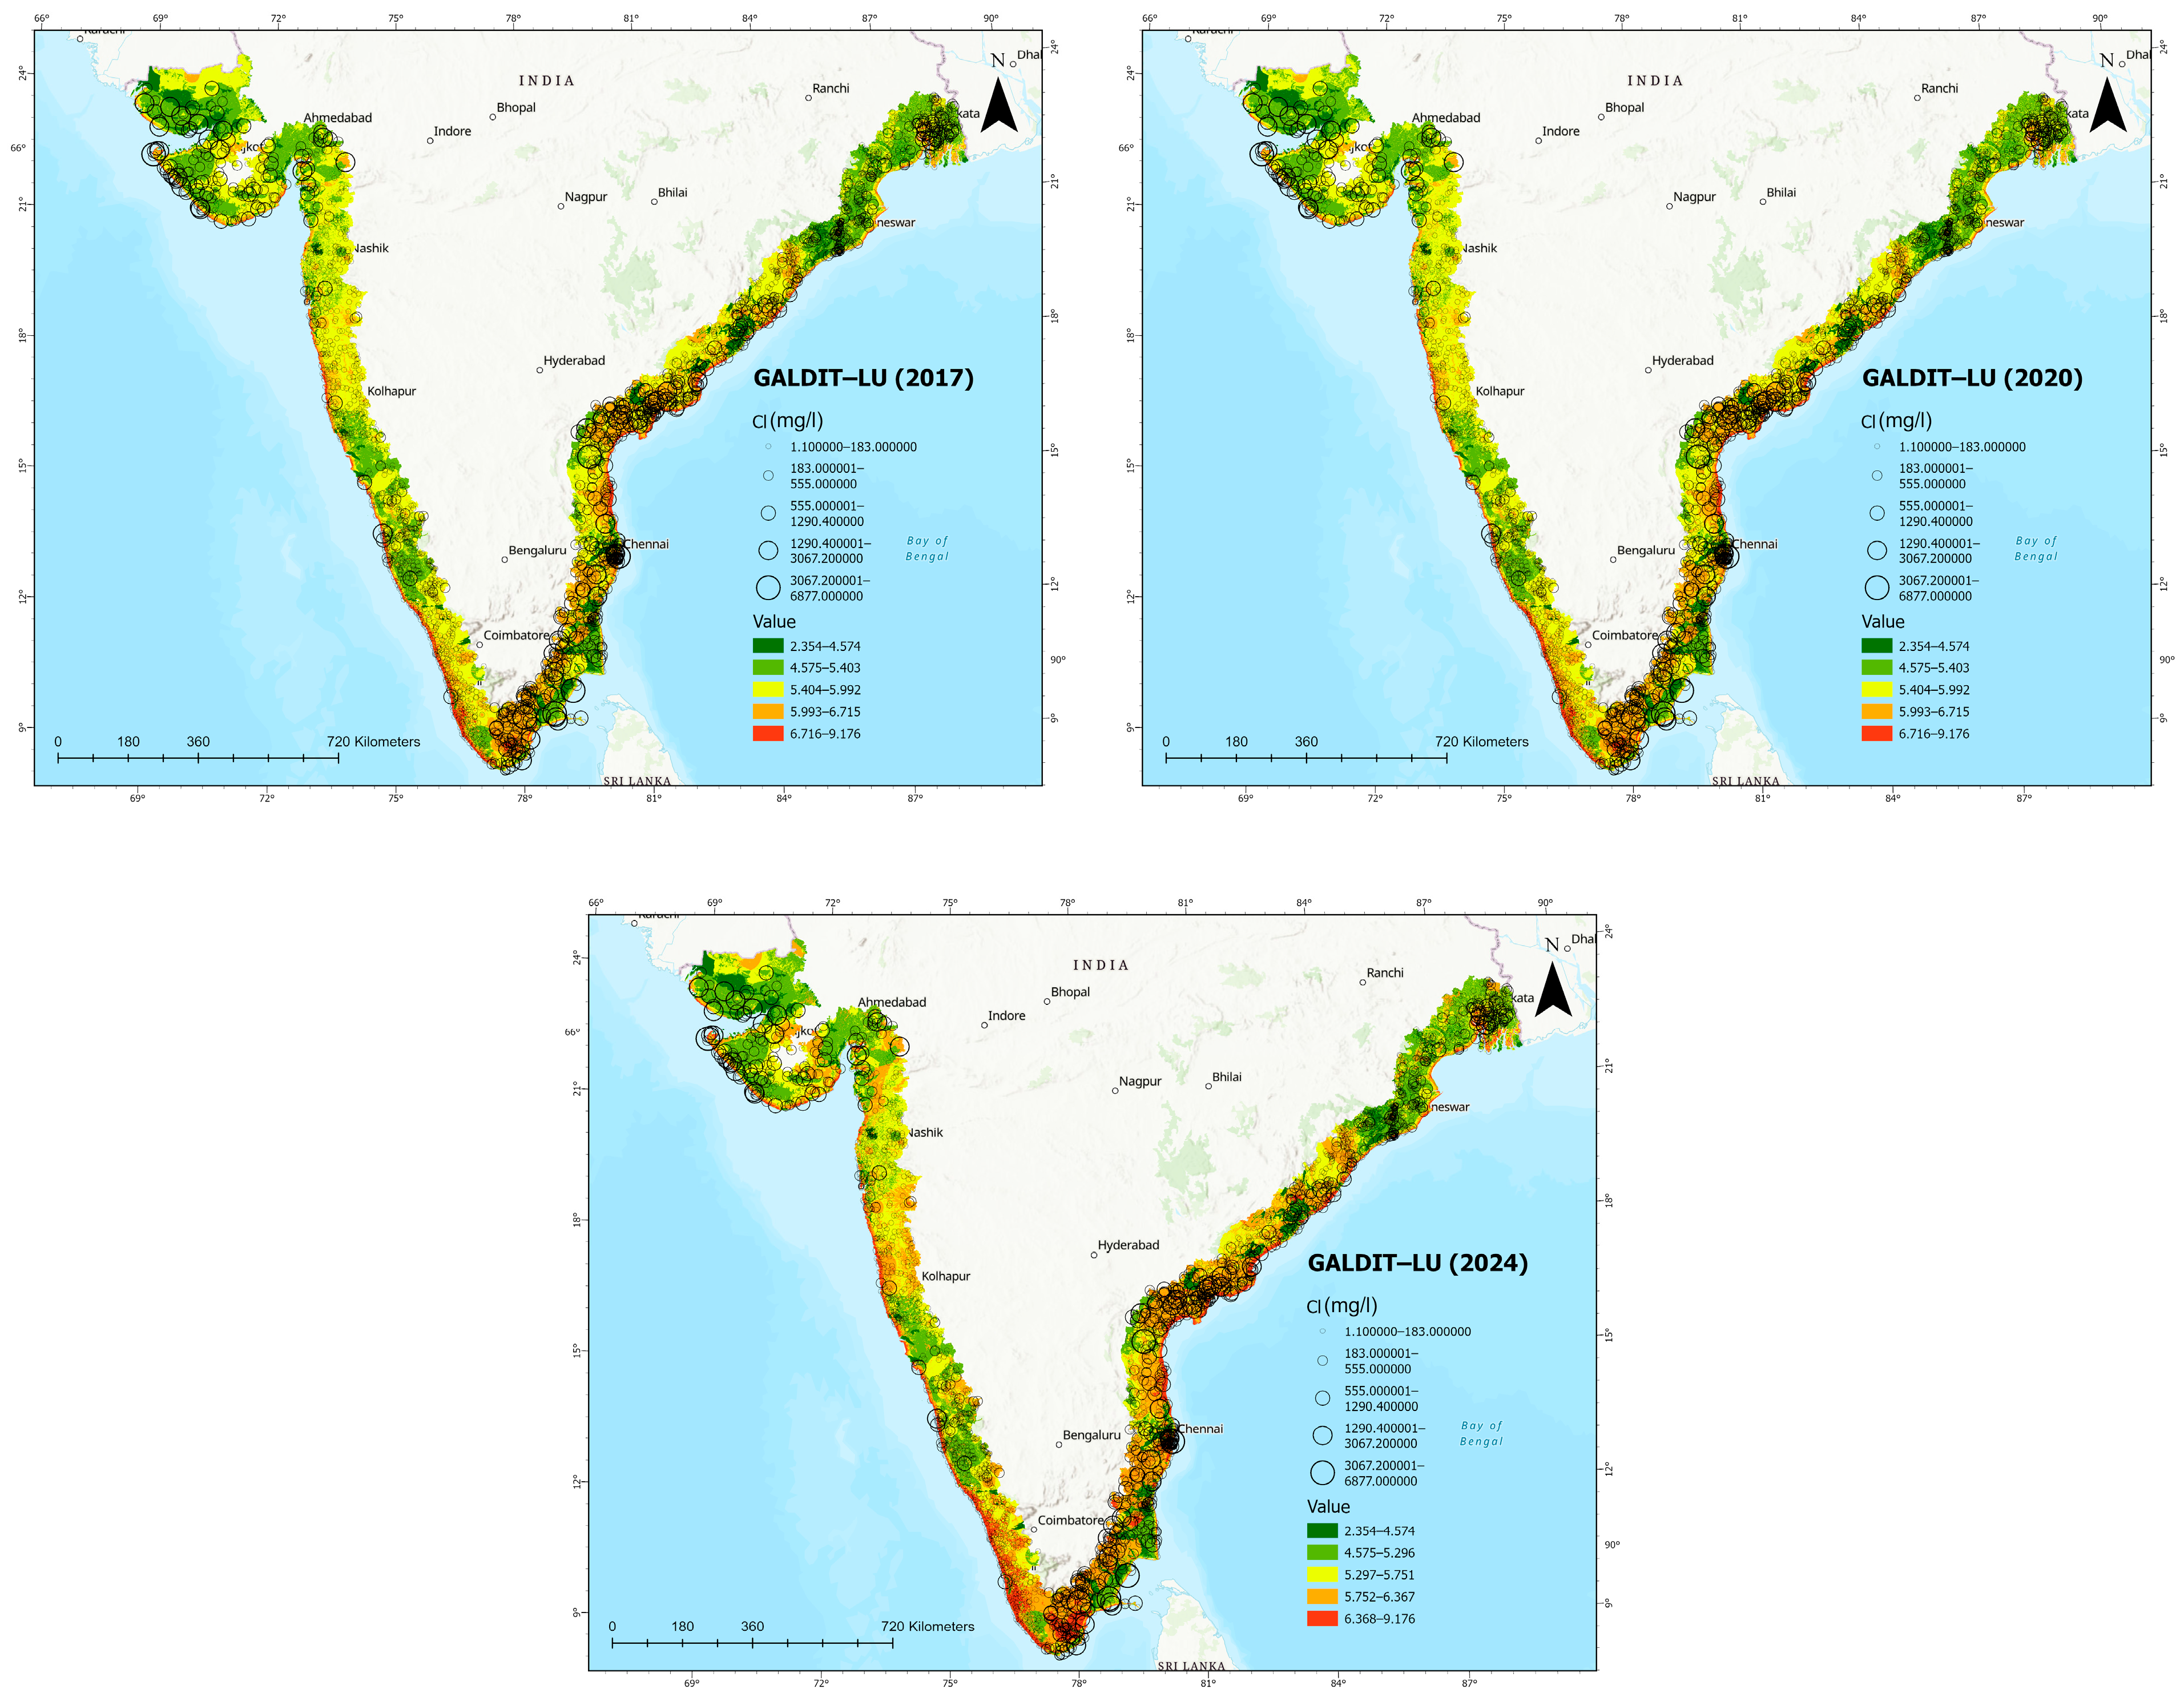
Vulnerability was assessed for three benchmark periods: 2017, 2020, and 2024. Across all three years, the results show a clear increase in the extent and intensity of high-vulnerability zones. Figure 9 presents the spatial distribution of GALDIT-LU vulnerability for each period.
In 2017, low-to-moderate vulnerability dominated much of the western coastline, including Gujarat, Maharashtra, and Karnataka. Urban density in these regions was relatively low at that time, and groundwater use was more stable. On the eastern coast and along the southern Tamil Nadu shore, high to very high vulnerability was already present. These areas were already experiencing saline stress in shallow unconfined aquifer systems. By 2020, measurable growth in the moderate- and high-vulnerability classes was evident on both coasts. The eastern coastal regions of Andhra Pradesh, Tamil Nadu, and Odisha extended their high-vulnerability zones further inland. Such land use change occurred predominantly because of the continued withdrawal of groundwater to feed urban centers and for irrigation. Land was being brought into more intensive uses, particularly on the coastal strips. On the western coast, high-risk regions have clearly appeared next to large urban agglomerations and delta structures. It can be observed from the GALDIT-LU map of 2024 that the most drastic expansion happened in this time interval. The very-high-risk category has been transformed into almost contiguous areas extending along the entire peninsular and eastern coastal plains. The highest GALDIT-LU score ever calculated was observed at the tip of South India during the 2024 analysis, mainly because of shallow aquifer thickness, high hydraulic conductivity, and heavy groundwater extraction, together with land use change. Low-risk-category areas have been reduced to localized patches in the interior and areas with low groundwater abstraction rates. What is apparent from the changes is that conversion from natural land covers to urban uses and intensified land uses have resulted in huge pressure on the groundwater system, thereby steadily increasing the base hydrogeological risk.

3.3.2. Validation of GALDIT Index Against Groundwater Chloride Concentrations

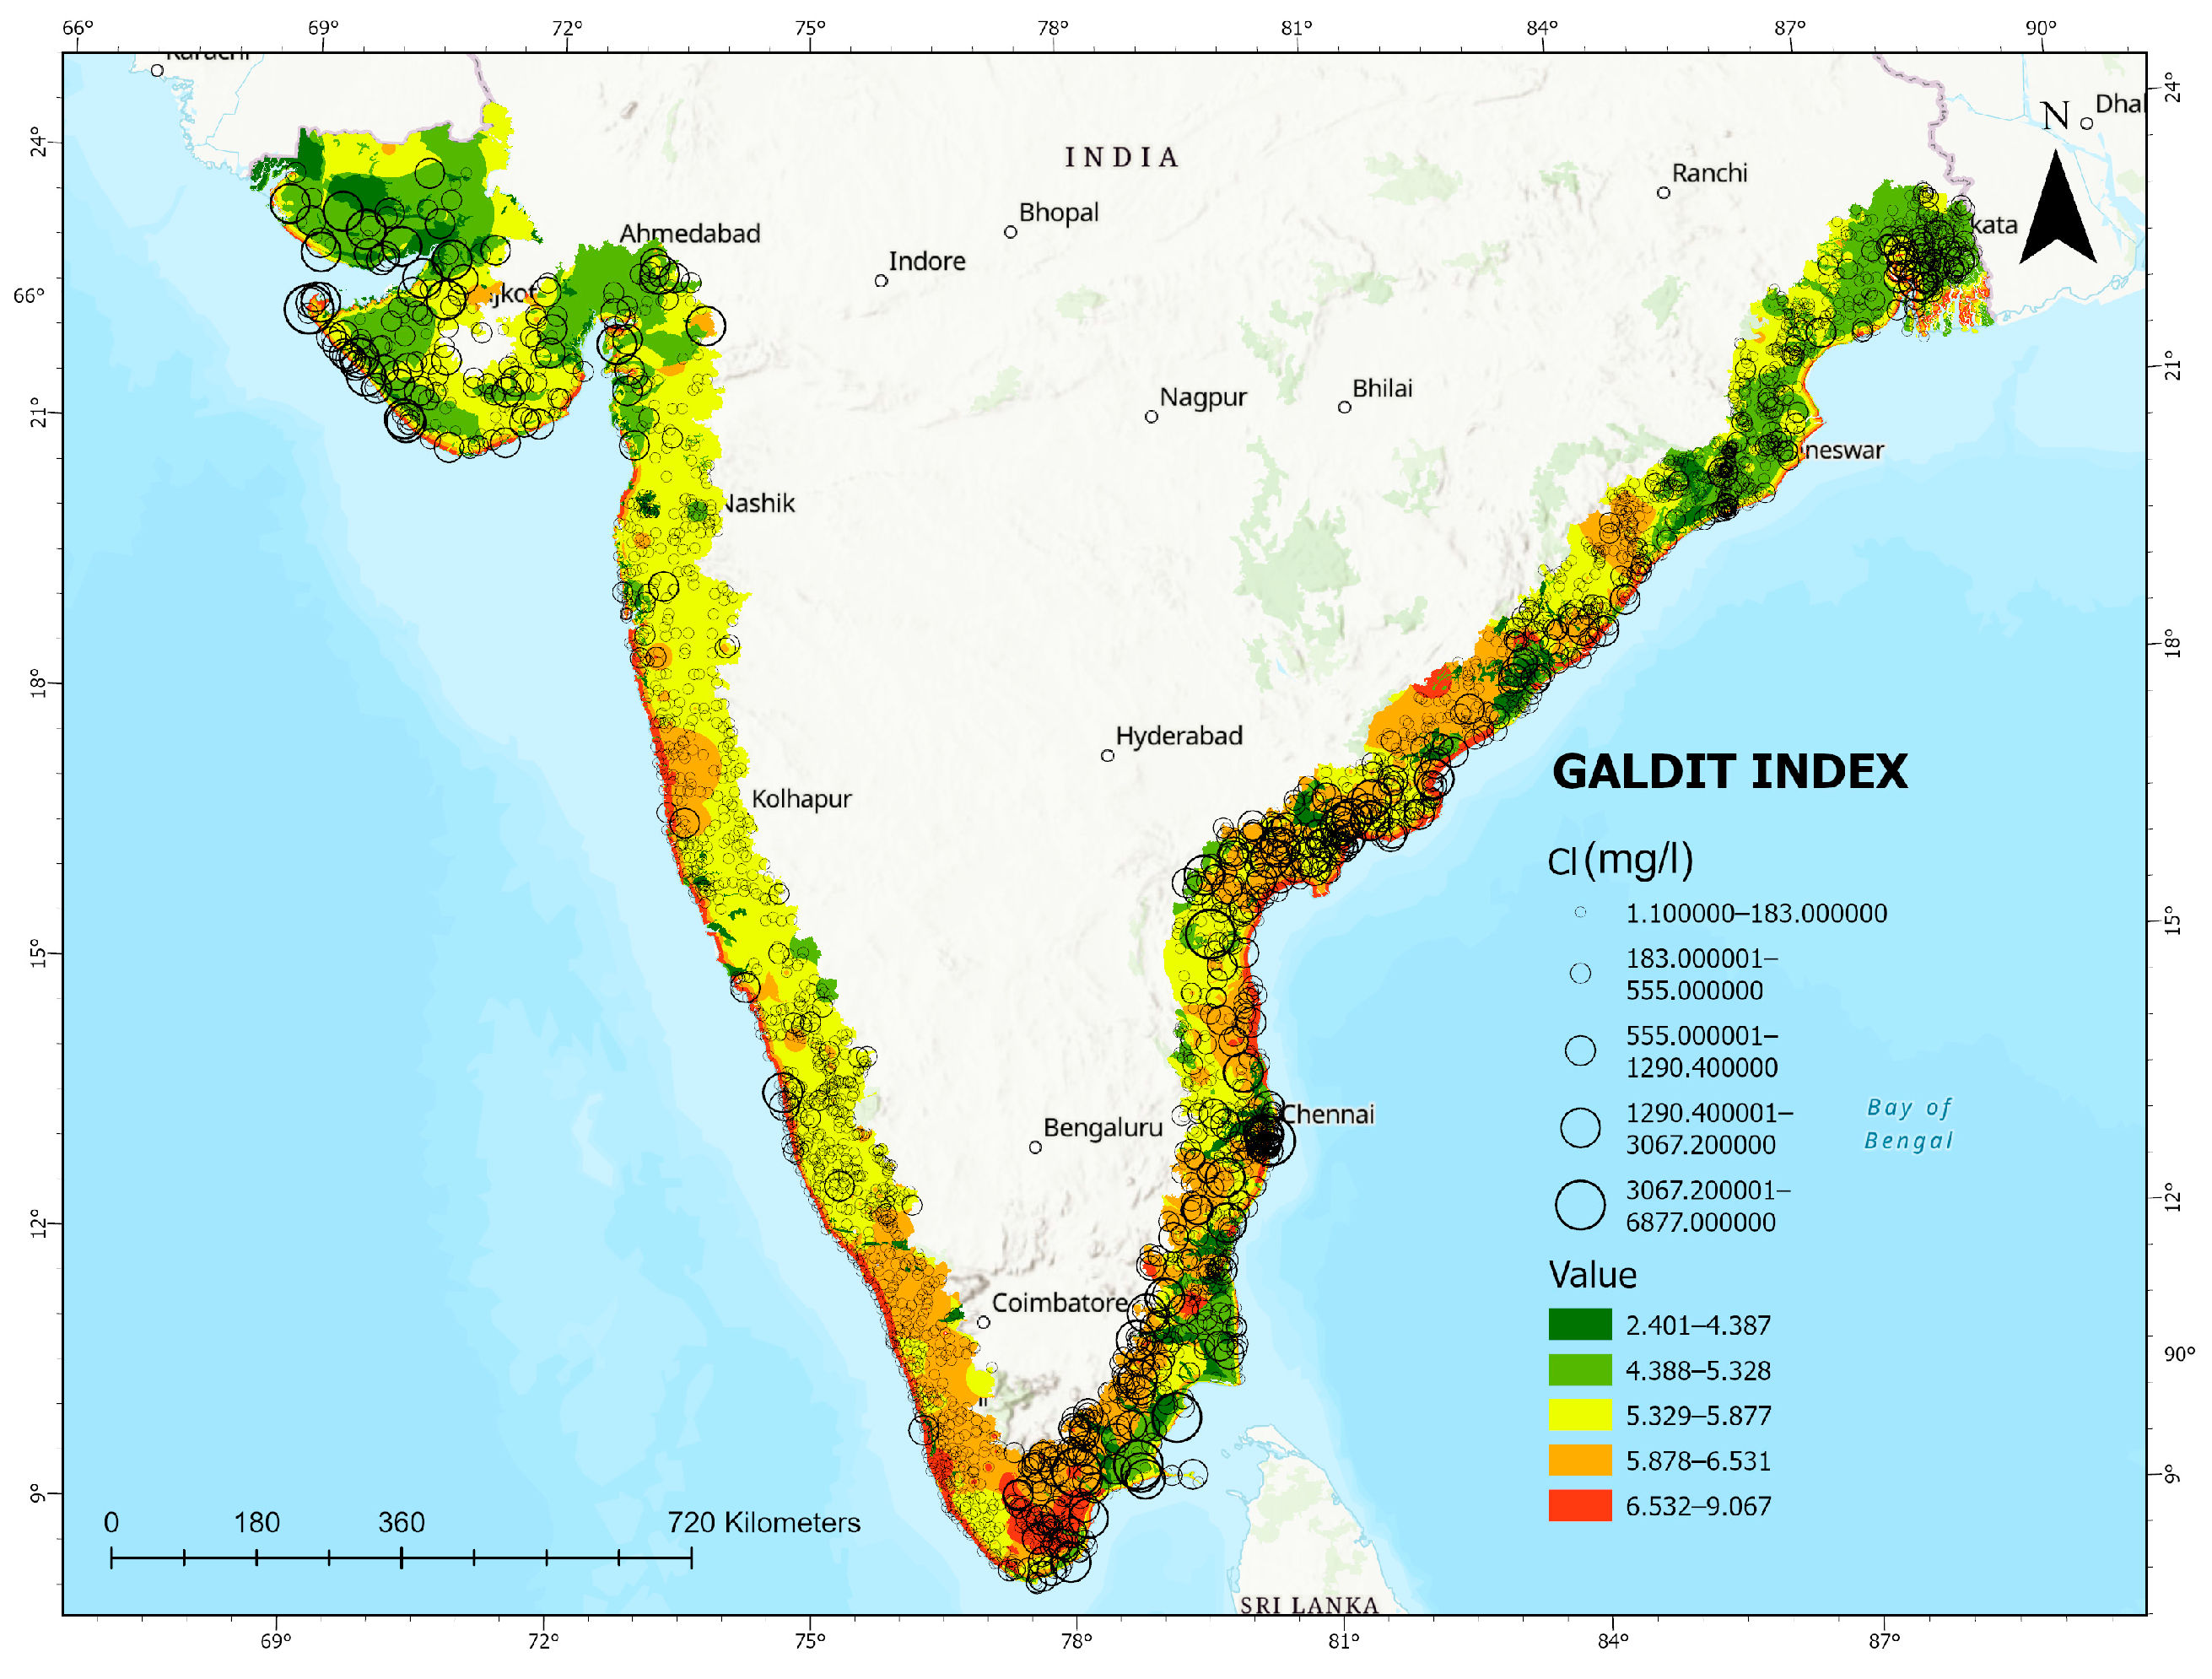
Groundwater chloride (Cl) concentration data from CGWB monitoring wells were used to evaluate the model’s results. Chloride is a reliable field indicator of seawater intrusion in coastal aquifers. The spatial distribution of chloride values was overlaid on the GALDIT vulnerability map, as shown in Figure 10.
The validation map shows strong agreement between high- and very-high-GALDIT-index zones and areas with elevated chloride concentrations. Coastal sectors mapped as highly vulnerable consistently record moderate-to-very-high chloride levels in the field. This confirms that the model correctly identifies the zones most affected by saltwater.
Along the Gujarat coast, GALDIT values are mostly low to moderate. Chloride concentrations are correspondingly low in these areas, suggesting good natural recharge and limited intrusion. Localized exceptions exist along the Saurashtra coast and in the Gulf of Kachchh, where both high GALDIT values and elevated chloride confirm active intrusion driven by intensive pumping, arid conditions, and permeable sediments.
Maharashtra shows mostly moderate index values and limited inland chloride enrichment. Some coastal areas record higher chloride levels where fractured basalt aquifers have been overexploited near urban centers. Goa shows low GALDIT values and low chloride throughout most of the shoreline. Heavy rainfall, well-developed river systems, and limited extraction all contribute to this favorable condition. Moderate risk is confined to tidal and estuarine zones.
Karnataka is generally characterized by low to moderate GALDIT values. Strong monsoon recharge and lateritic formations limit intrusion. River mouths are areas of moderate risk, driven by tidal mixing rather than persistent saline advance. Kerala shows predominantly low index values and limited saltwater contamination. In densely developed coastal areas, however, intensive domestic groundwater use has raised chloride levels even where general recharge is high.
Tamil Nadu shows the clearest match between high GALDIT values and high chloride concentrations. Semi-arid conditions, limited recharge, and prolonged extraction create conditions that the model captures accurately. Andhra Pradesh shows mostly low-to-moderate vulnerability outside the Krishna–Godavari delta. Within the delta itself, high chloride levels align closely with high GALDIT scores, reflecting the permeable aquifer conditions and heavy irrigation demand in that zone.
The Mahanadi watershed in Odisha shows relatively low GALDIT vulnerability, consistent with good freshwater recharge from the large river system. Moderate risk is confined to narrow nearshore areas. West Bengal, particularly the Sundarbans, shows moderate to high GALDIT values matched by elevated chloride concentrations. Tidal forcing, low coastal elevation, and highly permeable deltaic sediments combine to make this one of the most persistently contaminated stretches of the Indian coast.

3.3.3. Validation of GALDIT-LU Index Against Groundwater Chloride Concentrations

The GALDIT-LU index was validated by comparing its vulnerability class patterns with chloride concentration data from 2023 and 2024. Figure 11 presents this comparison. High chloride concentrations are concentrated in zones mapped as high or very high vulnerability by the GALDIT-LU model. This correspondence is clearest along the eastern coast, at the southern tip, and in urban coastal areas. Moderate vulnerability zones correspond to transitional chloride levels, with areas experiencing stress, but not saline conditions. Qualitative information and a reasonable spatial correlations between GALDIT-LU outputs and observed chloride concentrations are observed in the 2024 comparison, encompassing anthropogenic and geological processes accounted for by the model. Direct chloride measurements (reported below) are limited for 2017 and 2020, and spatial patterns in these years are consistent with field measurements. High- to very-high-vulnerability zones from previous zones correspond to zones characterized by chloride pollution, especially along the eastern coast, southern Tamil Nadu, and the southern tip of India.
The recurrence of these spatial patterns across three time periods points to a sustained intensification of seawater intrusion rather than short-term fluctuation. Areas with high GALDIT-LU scores consistently show rising chloride concentrations over time, while low-vulnerability zones retain freshwater characteristics. Moderate zones are the most important for management: they are already under stress and at risk of irreversible salinization if extraction continues at current rates.
Minor discrepancies between model predictions and field observations exist at a few locations. These arise from local contamination sources unrelated to marine intrusion, temporal changes in groundwater chemistry, and uneven monitoring well density along some coastal stretches. Despite these localized differences, the overall spatial agreement between the GALDIT-LU framework and observed chloride data is strong and consistent across all three assessment periods.

3.3.4. Comparison Between GALDIT and GALDIT-LU Frameworks

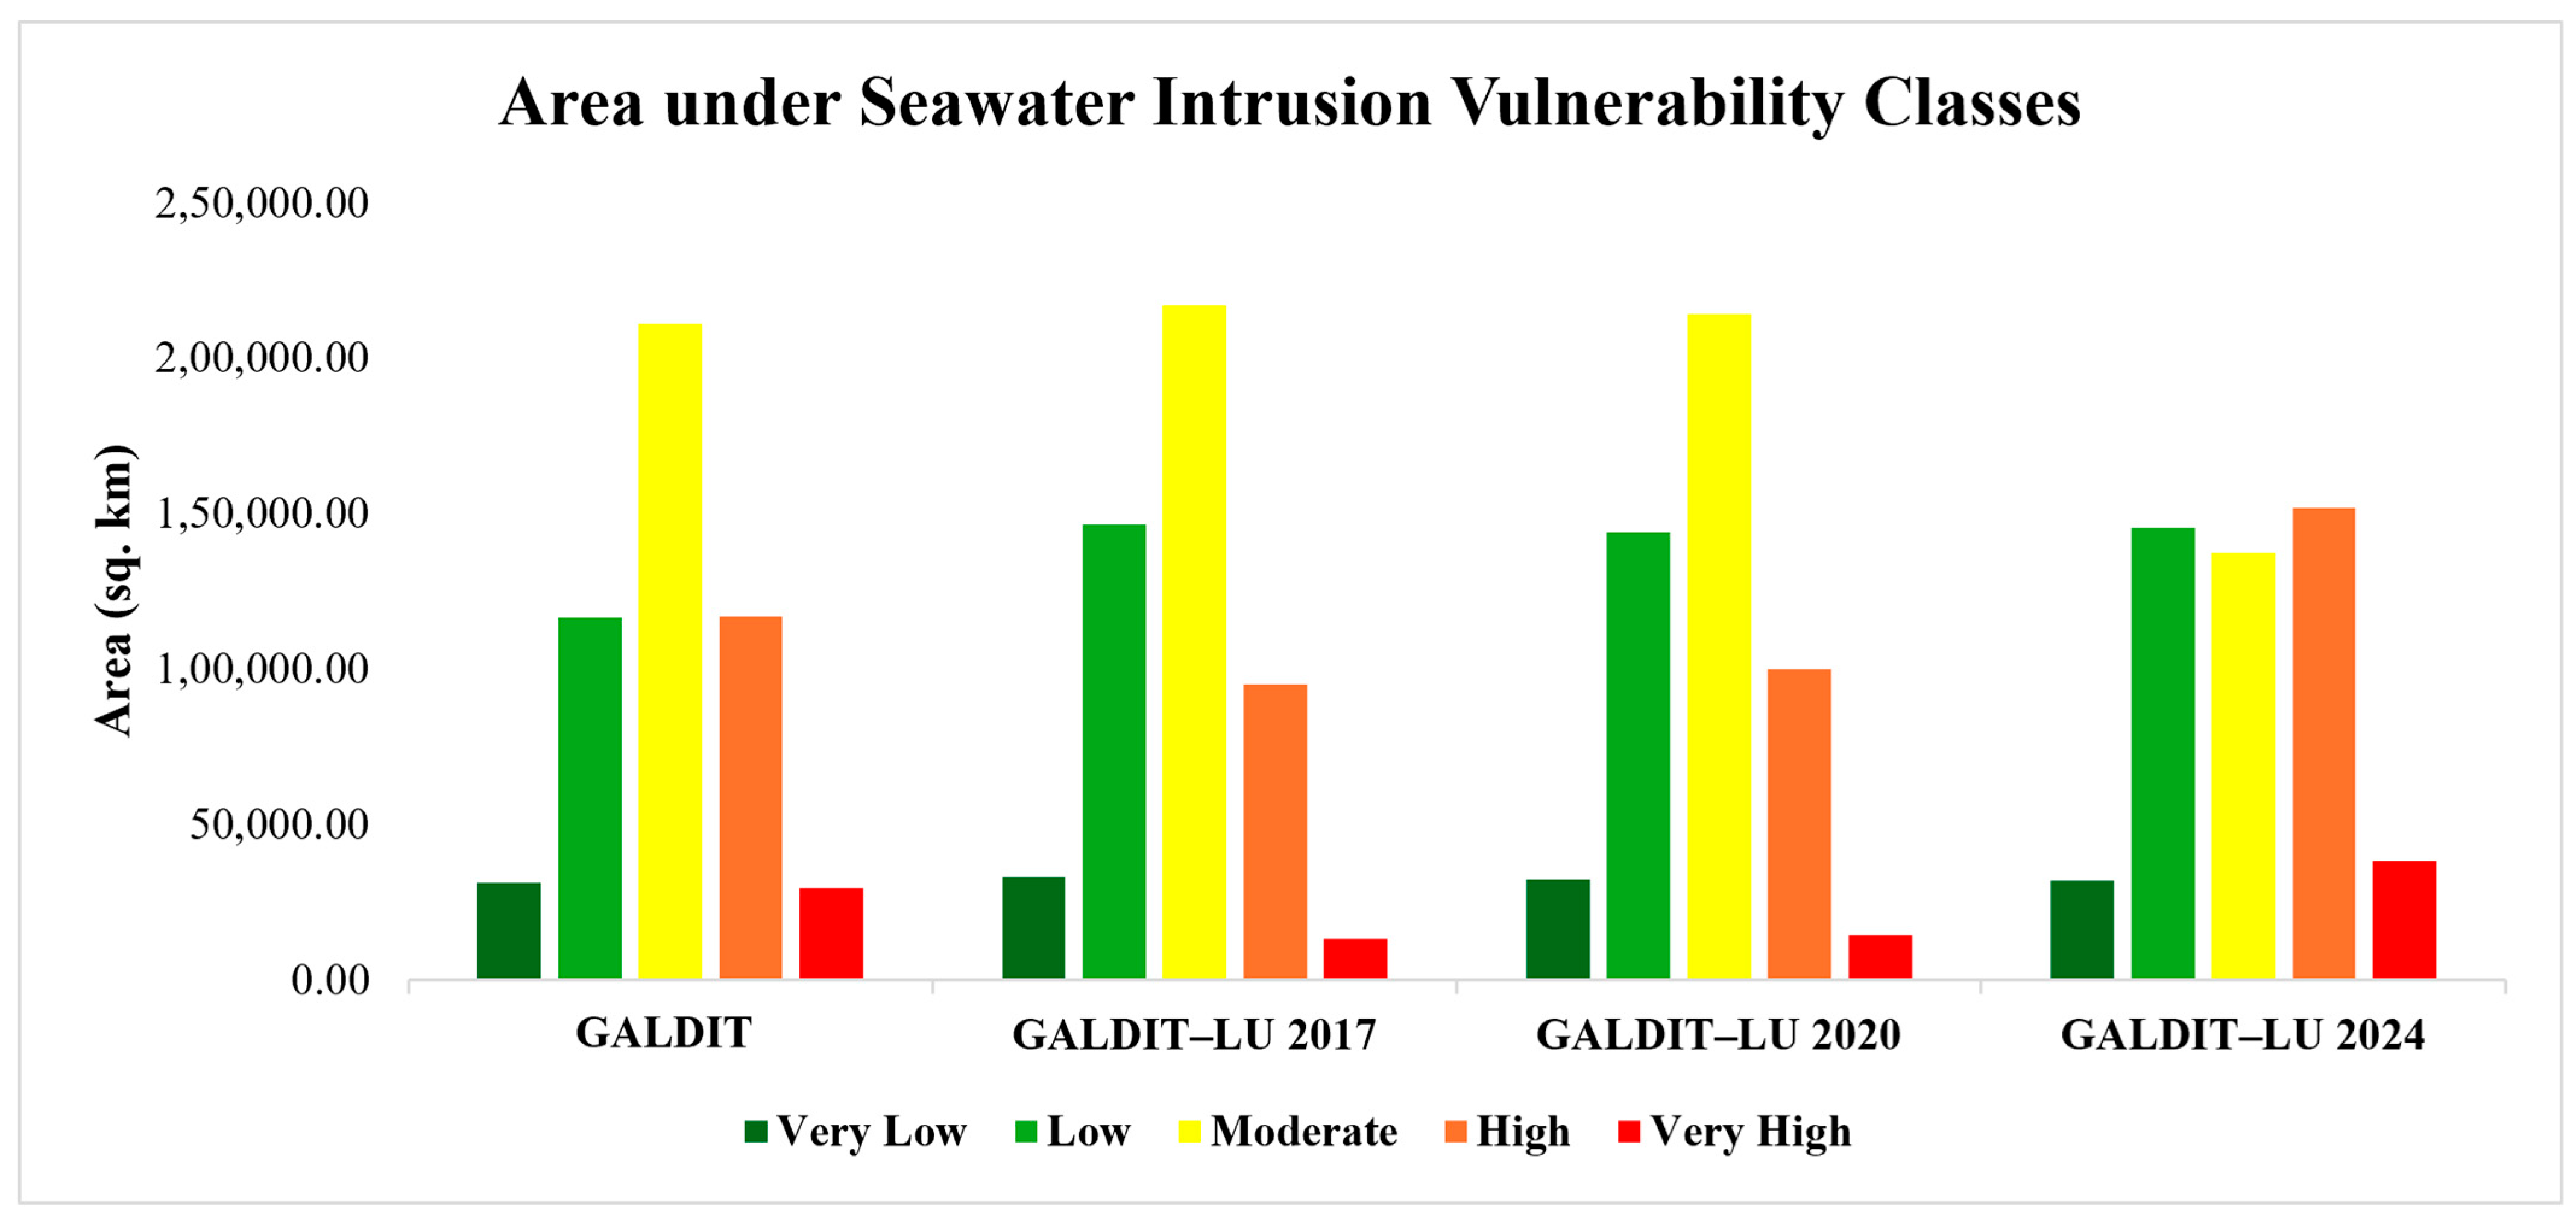
The advantages of using land use data were highlighted by comparing the two models. The index of intrinsic hydrogeological vulnerability (GALDIT) is an index that is very able to reflect the intrinsic hydrogeological vulnerability of coastal aquifers. It represents the conditions of the geological aquifer, including its type, depth, and aquifer transmissivity, as well as distance from the beach. It does not tell us how the baseline has been modified in the past by human land use. The GALDIT-LU framework aims to fill this void. Assigns higher vulnerability scores to areas where groundwater withdrawals have increased, or groundwater recharge has diminished due to urban growth and agricultural intensification. These are urban coastlands and intensively farmed deltaic plains. In GALDIT-LU, the areas of high vulnerability are wider and cover more area than those in the standard model, notably on the east coast and at the southern tip. The most vulnerable areas are reported by both models as being along the major deltaic systems of these rivers: Krishna, Godavari, Mahanadi, and Ganga–Brahmaputra. However, GALDIT-LU explains that these areas are becoming more susceptible to intrusions over time, and it tells us how they are becoming more susceptible. The modified framework is more informative for long-term planning or water resource management because of this temporal signal. Table 3 and Figure 12 summarize the area under each vulnerability class for both models across the three time periods.

4. Discussion

4.1. Consistency with Previous GALDIT-Based Studies

The results of this study are broadly consistent with previous GALDIT assessments of coastal seawater intrusion vulnerability in India and comparable settings globally, while extending them in spatial scope and temporal depth. Earlier applications have consistently identified unconfined aquifer conditions, shallow groundwater levels, high transmissivity, and coastal proximity as the primary controls on intrusion susceptibility [20,40], and these same controls dominate the patterns observed here.
At the sub-regional level, Tamil Nadu studies report very-high-vulnerability zones with chloride concentrations of 1268 to 2347 mg/L and Cl/HCO3 ratios as high as 12.18 [41]. The moderate vulnerability in southeast Tamil Nadu rose from 19.5% in 2001 to 53.88% by 2010, with projections approaching 97% by 2050 at current sea-level rise rates [42]. In Chengalpattu District, over 30% of samples fall in the highly vulnerable zone [12] and dedicated delta assessments in the Thamirabarani region confirm the same high-risk pattern [43]. These findings align well with the national-scale high- and very-high GALDIT classes mapped for Tamil Nadu in the present study. Although direct statistical comparison is constrained by differences in study scale, sampling density, hydrogeological setting, and assessment period, the quantitative trends reported in previous regional investigations are consistent with the present nationwide assessment. For example, previous GALDIT-based studies in Tamil Nadu reported the progressive expansion of high- and very-high-vulnerability zones associated with increasing groundwater salinity and urbanization, while studies from Kerala, Maharashtra, Odisha, and West Bengal similarly identified deltaic and intensively exploited coastal aquifers as the most vulnerable regions. The present study extends these regional observations to the entire Indian coastline and demonstrates a 188% increase in the very-high-vulnerability class between 2017 and 2024, confirming that the regional patterns reported previously are also evident at the national scale.
On the eastern coast, geochemical studies of the Mahanadi delta document seawater fractions in groundwater reaching 72% in lower delta zones [44], while hydrochemical analysis along the Visakhapatnam coast identifies Na/Cl ratios below 0.86 as confirmation of active seawater mixing across both seasons [45]. In the West Bengal Sundarbans, 48.21% of groundwater samples have Seawater Mixing Index values above 1, and 53% are classified in the high-salinity hazard class [46]. All of these field observations correspond directly to the moderate-to-very-high GALDIT values mapped for the same regions here. Along the Gujarat coast, the affected area grew by roughly 88,947 hectares between 1977 and 2008, with a more recent decadal analysis confirming that although the spatial extent of intrusion narrowed between 2012 and 2018, the intensity of contamination increased [38,47], consistent with the heterogeneous moderate-to-very-high GALDIT pattern and localized chloride hotspots mapped in the present study.

4.2. Dominant Controls and Regional Contrasts

Among the six GALDIT parameters, groundwater occurrence, depth to groundwater level, and distance from the shoreline exert the strongest combined influence on vulnerability. Unconfined aquifer systems dominate the major coastal plains and deltaic regions, allowing unrestricted vertical saltwater movement whenever freshwater levels decline. Even in semi-confined systems such as those in Odisha and West Bengal, sustained extraction has progressively eroded the protective function of confining layers, consistent with broader observations that confinement offers diminishing protection under continued pumping [19]. Shallow water tables, prevalent along Gujarat, Tamil Nadu, Andhra Pradesh, and West Bengal in the May 2016 pre-monsoon reference period, reduce the hydraulic head that resists saltwater advance, and declining recharge is projected globally to be a more critical driver of future intrusion severity than sea level rise alone [48].
A clear contrast exists between the west and east coasts. Hard rock aquifers, steep hydraulic gradients, and heavy monsoon recharge in the Konkan region and Karnataka produce low to moderate vulnerability across large stretches of the west coast, while Gujarat and localized areas of Kerala show elevated risks where unconfined conditions and intensive extraction coincide. The east coast, by contrast, presents a near-continuous band of high- to very-high vulnerability, sustained without significant spatial interruption by the thick, transmissive alluvial and deltaic aquifers of the Krishna–Godavari, Mahanadi, and Ganga–Brahmaputra systems. These deltas function as regional vulnerability corridors rather than localized hotspots, with declining surface water inflows further reducing their natural capacity to flush saltwater. At the southern tip, narrow coastal width and shallow crystalline-substrate aquifers produce some of the highest GALDIT scores recorded along the entire coastline.

4.3. LULC-Driven Temporal Amplification

The most unique contribution of the present study is the temporal analysis of the GALDIT-LU framework. The very-high-vulnerability area has now increased by more than 188% (expanding from 13.295 km2 in 2017 to 38.257 km2 in 2024), and we have also seen a reduction of more than 32% in the high-vulnerability class compared to 2017 (−57,686 km2 to 151,800 in 7 years), alongside a 29% contraction in the moderate vulnerability class compared to 2017 (−79,614 km2 to 137,448 km2 over 7 years), resulting in much more red and purple areas across the country. The progressive increase in severity indicates that the vulnerability of the hydrogeological setting does not fully explain the severity of hydrological impacts, and that anthropogenically induced land use change is an important amplifying factor.
Comparable findings at sub-regional scales reinforce this conclusion. The GALDIT-B model applied to South Chennai documented an expansion in very-high-vulnerability areas of 6% between 2000 and 2010, followed by a further 16% between 2010 and 2020, as built-up impervious cover expanded [34]. Along the Kozhikode coast of Kerala, the GALDIT-U model incorporates urban growth mapped as very high vulnerability across 16.84 km2, driven primarily by expanding impervious surfaces [49]. A multi-temporal assessment in Raigad District, Maharashtra, documented a shift from moderate to high vulnerability at four coastal hotspots between 2000 and 2019, confirmed through changes in mangrove species zonation [50]. In southwest coastal Bangladesh, the most comparable South Asian study, GALDIT, combined with multi-decadal LULC, classified 40.84% of the study area as highly vulnerable, attributing the pattern directly to expanding built-up areas and shrimp farming operations [26]. Taken together, these studies and the national-scale GALDIT-LU results presented here confirm that static hydrogeological assessments are insufficient to capture the evolving risk, and that urban expansion and agricultural intensification systematically amplify intrusion vulnerability over time [21,33].

4.4. Validation of GALDIT and GALDIT-LU Frameworks

The chloride-based validation confirms the reliability of both frameworks. High GALDIT and GALDIT-LU index values consistently correlate with elevated chloride concentrations in CGWB field measurements, with the strongest agreement along the eastern coast and at the southern tip. A chloride concentration of 200 mg/L has recently been proposed as a universal onset threshold for seawater intrusion across diverse coastal aquifer settings [51]. In the very-high-vulnerability zones mapped in this study, monitoring well data frequently exceed this threshold by a factor of 5 or more. Moderate vulnerability zones show transitional concentrations consistent with early-stage intrusion rather than full saline contamination. An independent validation study on a Greek coastal aquifer found approximately 80% agreement between GALDIT-I vulnerability classes and measured chloride concentrations [37], lending methodological support to the approach used here. Similar validation strategies have been widely adopted in previous seawater intrusion studies, where groundwater chloride concentration has been used as the primary hydrochemical indicator for evaluating vulnerability models because of its conservative behavior and direct association with marine water mixing [20]. The validation procedure adopted in the present study therefore follows an established and widely accepted methodology for assessing the reliability of seawater intrusion vulnerability mapping.
Localized discrepancies between modeled vulnerability and observed chloride arise from local contamination sources unrelated to marine intrusion, temporal fluctuations in post-monsoon groundwater chemistry, and the uneven spatial density of the monitoring network. These limitations are common to national-scale index-based assessments and do not undermine the framework’s overall spatial validity. The correspondence between GALDIT-LU projections for 2017 and 2020 and chloride enrichment observed in subsequent years further confirms the predictive utility of the modified framework for forward-looking groundwater management.
Two conditions limit the confidence that can be placed in this agreement. The vulnerability surfaces are anchored to a single pre-monsoon reference period, so zones subject to strong seasonal reversal may be represented in their most conservative state rather than their average state. The monitoring network is also unevenly distributed, being denser in the alluvial plains than along the hard rock stretches of the west coast, which means that the apparent strength of the correspondence is partly a function of where observations exist. These considerations qualify the interpretation without altering the direction of the observed trend.

4.5. Implications for the Sustainable Development Goals

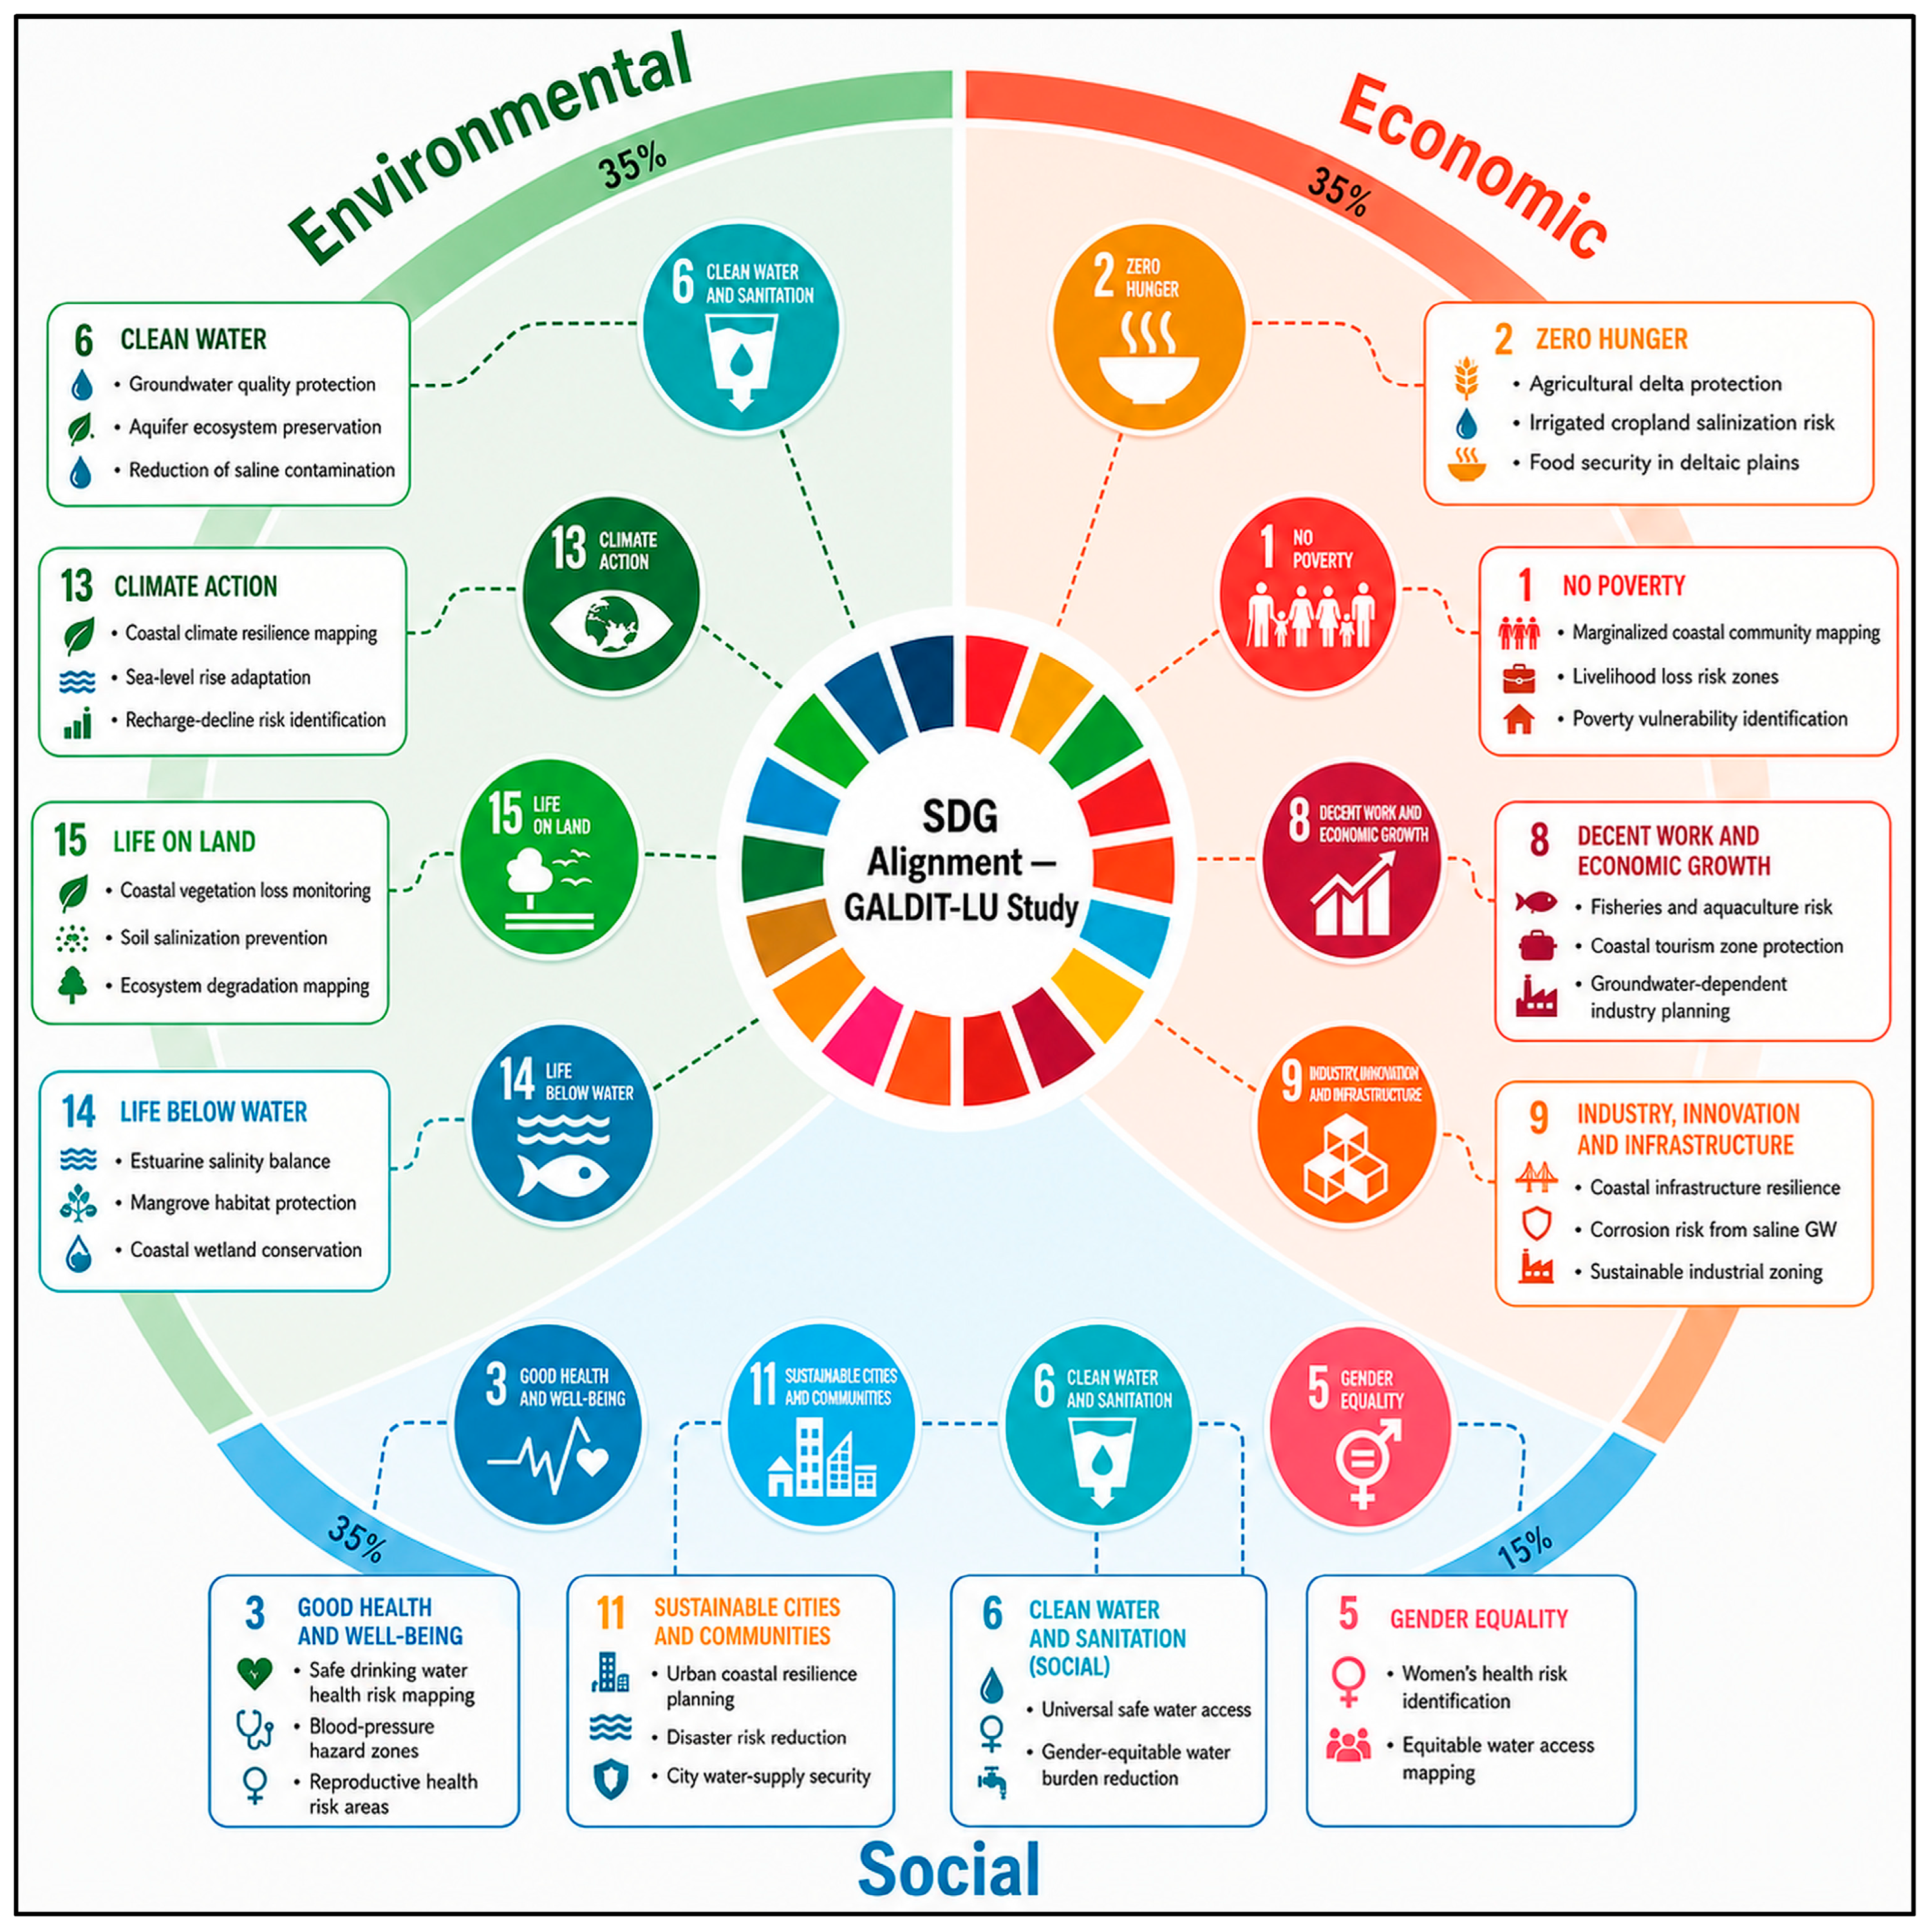
The results of the research are directly applicable to the 2030 Agenda for Sustainable Development [52]. The progressive shift of high- and very-high-vulnerability areas along the Indian coastline between 2017 and 2024 is a serious threat to the environmental, social, and economic pillars of sustainable development. The alignment covers 12 goals over three areas—people, ecosystems, and economies—and represents a wide range of impacts that can result from coastal groundwater degradation.

4.5.1. Environmental Dimension

Freshwater availability and quality are the most immediate environmental consequences. The 38,257 km2 now classified as very high vulnerability represent areas where groundwater is already contaminated or at imminent risk, directly threatening the universal access to safe drinking water called for under the clean water and sanitation goal (Target 6.1), the protection of aquifer ecosystems (Target 6.6), and the reduction in water pollution (Target 6.3). Mueller et al. [2] estimated that between 269.6 and 374.9 km of the Indian coastline already experiences seawater intrusion extending 1 km or more inland. This figure maps directly onto the very-high-vulnerability corridors identified here. Looking further ahead, global modeling projects that 77% of more than 60,000 coastal watersheds worldwide will experience seawater intrusion by 2100, with declining recharge driving severity and sea-level rise driving prevalence [48]. The temporal expansion documented in this study is therefore not an anomaly, but part of a global trajectory that demands integration into national climate adaptation policies and planning, as required under the climate action goal (Targets 13.1, 13.2, and 13.3). The GALDIT-LU maps produced here can serve precisely this purpose by providing spatially explicit, time-resolved vulnerability data for coastal zone management plans. At the same time, the progressive loss of natural coastal vegetation and wetlands, as captured in the multi-temporal LULC analysis, undermines terrestrial ecosystem health and soil stability in coastal belts. Approximately 3 million hectares of coastal land in India are already classified as salt-affected [37], and the multi-temporal LULC data in this study document ongoing vegetation loss in the fastest-expanding vulnerability zones, directly implicating the land degradation and biodiversity targets of the life on land goal (Targets 15.1, 15.3, and 15.5). The Raigad coast provides a concrete example: mangrove species composition has already shifted toward more saline-tolerant species as saltwater intrusion intensifies [50], reducing the ecological diversity and storm-buffering capacity of coastal forests.

4.5.2. Social Dimension

The human health burden of saline groundwater is substantial. Elevated drinking water salinity is associated with increased blood pressure, cardiovascular risk, and adverse reproductive outcomes. Studies across coastal South Asia document significant dose–response relationships between water sodium levels and gestational hypertension, with odds ratios ranging from 3.30 to 5.48 across rising exposure categories [53]. A large-scale study recording 6487 blood pressure measurements in coastal communities found consistent associations between drinking water salinity and elevated systolic and diastolic pressure [54]. Recent research further documents significant associations between exposure to saline water and gynecological conditions affecting women of reproductive age [55]. These health risks are spatially concentrated in the densely populated coastal districts of Tamil Nadu, Andhra Pradesh, Odisha, and West Bengal, where the present study maps the highest GALDIT-LU values, directly implicating targets regarding reducing mortality from environmental contamination (Target 3.9), gender equality and reproductive health (Target 5.6), and universal access to safe water (Target 6.1). When groundwater becomes saline, households and, in many cases, women and girls disproportionately bear the burden of sourcing alternative water at greater cost and distance, undermining the equitable access principles of the sanitation goal (Target 6.2). Urban and peri-urban coastal communities face additional stresses as the collision between rapid urban growth and declining groundwater quality compromises the resilience of coastal settlements and raises the cost of water supply for millions of residents, which is directly relevant to the sustainable cities goal (Targets 11.5 and 11.b).

4.5.3. Economic Dimension

Agricultural productivity is the most immediate economic casualty of seawater intrusion. The very-high-vulnerability zones identified in this study cover significant portions of India’s most productive coastal agricultural deltas, including the Krishna–Godavari, Mahanadi, and Cauvery systems. Rice yields decline by 30 to 50% in salt-affected farmland [56], and yield reductions of 30 to 40% have been documented specifically in the Sundarbans, where 71% of experts surveyed agreed that displacement-driven food insecurity is an emerging reality [57]. Globally, roughly 87 million hectares of cropland are estimated to be vulnerable to seawater intrusion, with South and Southeast Asia identified as the highest-risk zones [58]. This trajectory directly threatens the food security, agricultural productivity, and rural income goals embedded in the zero hunger targets (Targets 2.1, 2.3, and 2.4). For the small-scale and marginal farming households that dominate coastal India, the loss of groundwater quality is not merely an inconvenience, but a pathway into deeper poverty. Survey evidence from North Indian coastal farming communities document that the absence of affordable adaptation options leaves marginal farmers with debt accumulation or land abandonment as their only responses [59], directly implicating the poverty resilience and social protection targets (Targets 1.1 and 1.5). Livelihood analysis in the Sundarbans identified multiple intersecting dimensions of poverty vulnerability linked to coastal salinization, including crop failure, livestock losses, and income collapse [60]. Beyond agriculture, the progressive degradation of coastal groundwater also affects fisheries, aquaculture, and coastal tourism, sectors that collectively support millions of livelihoods and underpin the decent work and economic growth targets (Targets 8.3, 8.5, and 8.9). The infrastructure implications are equally significant, namely, built-up areas in high-vulnerability zones face long-term risks of groundwater salinization, which can affect buried pipelines, foundations, and industrial water supplies, all of which are relevant to the resilient infrastructure and industrial sustainability targets of the industry and innovation goal (Targets 9.1 and 9.4).
Taken together, and as illustrated in Figure 13, the vulnerability maps produced in this study are not merely a scientific output but an actionable planning tool that links hydrogeological assessment directly to the goals of the 2030 Agenda. The progressive expansion of seawater intrusion risk documented between 2017 and 2024 makes coordinated, cross-sectoral responses more urgent with each year of delay.

5. Conclusions

Seawater intrusion vulnerability along the approximately 7517 km of the Indian coastline was assessed using the GALDIT index and a modified GALDIT-LU framework incorporating multi-temporal land use and land cover data from 2017 to 2024. Spatial vulnerability patterns show pronounced regional contrasts, with moderate to very high susceptibility concentrated along the eastern coast and the southern tip of the peninsula, driven by unconfined deltaic aquifer systems, shallow pre-monsoon groundwater levels, high transmissivity, and close coastal proximity, while the western coast exhibits greater heterogeneity with low to moderate vulnerability across hard rock terrains offset by localized high-risk zones in Gujarat and Kerala. The GALDIT-LU temporal analysis reveals a substantial intensification of vulnerability over the study period, with the very-high-vulnerability class expanding from 13,295 km2 to 38,257 km2, a 188% increase over seven years, while moderate vulnerability contracted from 217,052 km2 to 137,448 km2, confirming that anthropogenic land use change systematically amplifies intrinsic hydrogeological susceptibility, and that static assessments are insufficient to capture the full evolving risk. The excellent spatial correspondence between high GALDIT-LU index values and elevations of field salinity concentrations over all three benchmark periods supports the reliability and usefulness of the framework in predicting salinity conditions in the field, and thereby in establishing suitable mitigation measures. The groundwater occurrence, the depth to groundwater, and the distance from a shoreline appear to be the greatest combined influence of the GALDIT parameters, and the LULC parameter introduces the additional dimensions of time and anthropogenic activity, which cannot be represented by the standard model. The recommended groundwater withdrawal zones of ‘Very High’ and ‘High’, as identified in the 2024 GALDIT-LU maps, shall be marked as ‘Priority areas’ of regulated groundwater extraction, prioritized groundwater recharge intervention and managed aquifer recharge programs, directly supporting the clean water and sanitation objectives, especially along the Krishna–Godavari, Mahanadi and Ganga–Brahmaputra delta zones. The provinces, states and national governments need to incorporate GALDIT-LU vulnerability maps into new regulations for coastal development to stop further urban and agricultural growth in the most vulnerable areas, and implement the Sustainable Cities and Climate Action targets in the coming decade. In high-vulnerability areas, agricultural support measures must focus on promoting the production of salt-tolerant varieties and using precision irrigation techniques and alternative water resources for supporting coastal food production, in order to safeguard the livelihoods of vulnerable farming households, consistent with the principles of zero hunger and zero poverty. There is a need to regularly monitor for conditions associated with salinity in the most vulnerable coastal districts, particularly among women of reproductive age, and to promote health and gender equality, such as by reducing cardiovascular disease and adverse pregnancy outcomes.

6. Recommendations and Future Work

Although the proposed framework provides a comprehensive national-scale assessment of seawater intrusion vulnerability, certain limitations should be acknowledged. The analysis did not explicitly incorporate uncertainty or sensitivity analyses because of the extensive spatial coverage and the integration of multiple nationwide datasets. Future investigations may evaluate the influence of input uncertainty, parameter sensitivity, and alternative weighting approaches to further improve the robustness of vulnerability predictions. The present investigation focuses on the Indian coastline; the proposed methodology is sufficiently flexible to be applied to other coastal aquifer systems worldwide. The analytical workflow remains unchanged, whereas parameter values, entropy-derived weights, and vulnerability distributions can be adapted according to local hydrogeological conditions, groundwater characteristics, and land use patterns. Consequently, the framework provides a transferable decision-support tool for regional groundwater management and coastal planning. The GALDIT-LU framework should be updated at regular intervals using newly available ESA World Cover LULC data and refreshed CGWB groundwater level records, and future work should extend the framework to incorporate projected LULC scenarios under SSP climate pathways and sea level rise projections to 2050, enabling proactive rather than reactive groundwater management along India’s increasingly stressed coastline.

Author Contributions

Conceptualization, S.S. (Saravanan Subbarayan), D.E., S.S. (Sivaranjani Sivalingam), B.Đ., K.S., E.G., Y.M.Y. and M.E.A.-E.; methodology, S.S. (Saravanan Subbarayan), D.E., Y.M.Y. and M.E.A.-E.; software, S.S. (Saravanan Subbarayan), D.E., S.S. (Sivaranjani Sivalingam), B.Đ., Kaliraj, Y.M.Y. and M.E.A.-E.; validation, S.S. (Saravanan Subbarayan), D.E., S.S. (Sivaranjani Sivalingam), B.Đ. and K.S.; formal analysis, S.S. (Saravanan Subbarayan), B.Đ., E.G., Y.M.Y. and M.E.A.-E.; investigation, D.E., S.S. (Sivaranjani Sivalingam), K.S. and E.G.; resources, S.S. (Saravanan Subbarayan) and Y.M.Y. and M.E.A.-E.; data curation, D.E., S.S. (Sivaranjani Sivalingam), B.Đ., K.S. and E.G.; writing—original draft preparation, S.S. (Saravanan Subbarayan), D.E., S.S. (Sivaranjani Sivalingam), B.Đ. and Y.M.Y.; writing—review and editing, S.S. (Sivaranjani Sivalingam), B.Đ., E.G., Y.M.Y. and M.E.A.-E.; visualization, S.S. (Saravanan Subbarayan), Y.M.Y. and M.E.A.-E.; supervision, S.S. (Saravanan Subbarayan), B.Đ. and Y.M.Y.; project administration, B.Đ. and Y.M.Y.; funding acquisition, B.Đ. and Y.M.Y. All authors have read and agreed to the published version of the manuscript.

Funding

The research was funded by the scientific project “Hydrological and geodetic analysis of the watercourse-second part”, UNIN-TEH-25-1-3, from 2025, by the University North, Croatia. This research was also funded by the Deanship of Graduate Studies and Scientific Research, Taif University, Taif, Saudi Arabia.

Data Availability Statement

The data used in this study are available from the corresponding author upon reasonable request.

Acknowledgments

The authors acknowledge the scientific project “Hydrological and geodetic analysis of the watercourse-second part”, UNIN-TEH-25-1-3, from 2025, by the University North, Croatia, for funding this research. The authors would like to acknowledge the Deanship of Graduate Studies and Scientific Research, Taif University, for funding this work. The authors only used AI-assisted language editing tools (e.g., Grammarly v.1.178.0.0) to improve grammar, spelling, and readability. These tools were not used to generate, modify, or interpret any scientific content. The authors carefully reviewed and approved all revisions and take full responsibility for the manuscript.

Conflicts of Interest

The authors declare no conflicts of interest.

References

  1. Muzzillo, R.; Canora, F.; Polemio, M.; Sdao, F. Seawater Intrusion Vulnerability Assessment by GALDIT Method in the Metaponto Coastal Aquifer (Basilicata, Italy). Ital. J. Eng. Geol. Environ. 2022, 1, 31–41. [Google Scholar] [CrossRef]
  2. Mueller, W.; Zamrsky, D.; Essink, G.O.; Fleming, L.E.; Deshpande, A.; Makris, K.C.; Wheeler, B.W.; Newton, J.N.; Narayan, K.M.V.; Naser, A.M.; et al. Saltwater Intrusion and Human Health Risks for Coastal Populations under 2050 Climate Scenarios. Sci. Rep. 2024, 14, 15881. [Google Scholar] [CrossRef] [PubMed]
  3. Prusty, P.; Farooq, S.H. Seawater Intrusion in the Coastal Aquifers of India—A Review. HydroResearch 2020, 3, 61–74. [Google Scholar] [CrossRef]
  4. Youssef, Y.M.; Gemail, K.S.; Sugita, M.; AlBarqawy, M.; Teama, M.A.; Koch, M.; Saada, S.A. Natural and Anthropogenic Coastal Environmental Hazards: An Integrated Remote Sensing, GIS, and Geophysical-Based Approach. Surv. Geophys. 2021, 42, 1109–1141. [Google Scholar] [CrossRef]
  5. Manivannan, V.; Elango, L. Seawater Intrusion and Submarine Groundwater Discharge along the Indian Coast. Environ. Sci. Pollut. Res. 2019, 26, 31592–31608. [Google Scholar] [CrossRef] [PubMed]
  6. Debnath, J.; Alamdari, N. Impacts of Climate Change and Sea-Level Rise on Groundwater Levels and Saltwater Intrusion in Coastal Aquifers. SSRN, 2025. [CrossRef]
  7. Xu, D.; Bisht, G.; Feng, D.; Tan, Z.; Li, L.; Qiu, H.; Leung, L.R. Impacts of Sea-Level Rise on Coastal Groundwater Table Simulated by an Earth System Model with a Land-Ocean Coupling Scheme. Earths Future 2024, 12, e2024EF004479. [Google Scholar] [CrossRef]
  8. Kasthala, S.; Devanathan, P.; Krishnan, N.; Inamdar, A.B.; Punyamoorty, V. Assessing Climate Change Vulnerability: A Village Level Analysis of the Indian West Coast. Coast. Stud. Soc. 2024, 3, 159–178. [Google Scholar] [CrossRef]
  9. Subramanian, A.; Sivashanmugam, L.; Aravind Kumar, J. Long-Term Impacts of Climate Change on Coastal and Transitional Eco-Systems in India: An Overview of Its Current Status, Future Projections, Solutions, and Policies. RSC Adv. 2023, 13, 12204–12228. [Google Scholar] [CrossRef] [PubMed]
  10. Saravanan, S.; Parthasarathy, K.S.S.; Sivaranjani, S. Assessing Coastal Aquifer to Seawater Intrusion: Application of the GALDIT Method to the Cuddalore Aquifer, India. In Coastal Zone Management; Ramkumar, M., James, R.A., Menier, D., Kumaraswamy, K., Eds.; Elsevier: Amsterdam, The Netherlands, 2019; pp. 233–250. [Google Scholar]
  11. Sundar, S.S.; Yogesh, R.E. Assessing Aquifer Vulnerability to Seawater Intrusion in the Poombuhar Coast. Int. J. Mod. Sci. Eng. Res. Humanit. 2013, 7, 1636–1641. [Google Scholar]
  12. Ligori, N.; Rajendiran, T.; Prasadh, M.M.; Vijayan, V. Assessment of Groundwater Vulnerability to Seawater Intrusion Using GALDIT Index in Chengalpattu District, Tamil Nadu. Discov. Geosci. 2025, 3, 250. [Google Scholar] [CrossRef]
  13. Chang, S.W.; Chung, I.M.; Kim, M.G.; Tolera, M.; Koh, G.W. Application of GALDIT in Assessing the Seawater Intrusion Vulnerability of Jeju Island, South Korea. Water 2019, 11, 1824. [Google Scholar] [CrossRef]
  14. Ghomsi, F.E.K.; Nyberg, B.; Raj, R.P.; Bonaduce, A.; Abiodun, B.J.; Johannessen, O.M. Sea Level Rise and Coastal Flooding Risks in the Gulf of Guinea. Sci. Rep. 2024, 14, 29551. [Google Scholar] [CrossRef] [PubMed]
  15. Luoma, S.; Okkonen, J.; Korkka-Niemi, K. Comparison of the AVI, Modified SINTACS and GALDIT Vulnerability Methods under Future Climate-Change Scenarios for a Shallow Low-Lying Coastal Aquifer in Southern Finland. Hydrogeol. J. 2017, 25, 203–222. [Google Scholar] [CrossRef]
  16. Faal, F.; Ghafouri, H.; Ashrafi, S.M. Application of Aquifer Surface Recharge in the Modification of GALDIT Method to Assess the Risk of Seawater Intrusion in Qom Aquifer. Water Wastewater 2021, 32, 94–112. [Google Scholar] [CrossRef]
  17. Lyu, P.; Song, J.; Yin, Z.; Wu, J.; Wu, J. Integrated SEAWAT Model and GALDIT Method for Dynamic Vulnerability Assessment of Coastal Aquifer to Seawater Intrusion. Sci. Total Environ. 2024, 925, 171740. [Google Scholar] [CrossRef] [PubMed]
  18. Chachadi, A.G. Sea Water Intrusion Vulnerability Mapping of Aquifers Using the GALDIT Method. Coastin A Coast. Policy Res. Newsl. 2001, 4, 7–9. [Google Scholar]
  19. Bordbar, M.; Neshat, A.; Javadi, S.; Shahdany, S.M.H. A Hybrid Approach Based on Statistical Method and Meta-Heuristic Optimization Algorithm for Coastal Aquifer Vulnerability Assessment. Environ. Model. Assess. 2021, 26, 325–338. [Google Scholar] [CrossRef]
  20. Kazakis, N.; Spiliotis, M.; Voudouris, K.; Pliakas, F.K.; Papadopoulos, B. A Fuzzy Multicriteria Categorization of the GALDIT Method to Assess Seawater Intrusion Vulnerability of Coastal Aquifers. Sci. Total Environ. 2018, 621, 524–534. [Google Scholar] [CrossRef] [PubMed]
  21. Nourani, V.; Khajeh, E.B.; Paknezhad, N.J.; Dąbrowska, D.; Sharghi, E. Temporal Evaluation of Seawater Intrusion Vulnerability in Shabestar Plain Using GALDIT and AI Techniques. Environ. Sci. Pollut. Res. 2025, 32, 10855–10876. [Google Scholar] [CrossRef] [PubMed]
  22. El-Said Salem, Z.; Arafa, N.A.; Abdeldayem, A.L.; Youssef, Y.M. Machine Learning-Enhanced GALDIT Modeling for the Nile Delta Aquifer Vulnerability Assessment in the Mediterranean Region. Groundw. Sustain. Dev. 2025, 28, 101403. [Google Scholar] [CrossRef]
  23. Arafa, N.A.; El-Said Salem, Z.; Abdeldayem, A.L.; Ghorab, M.A.; Moustafa, Y.M.; Soliman, S.A.; Farag, M.H.; Purohit, S.; Elhag, M.; Youssef, Y.M. Advancing Deltaic Aquifer Vulnerability Mapping to Seawater Intrusion and Human Impacts in Eastern Nile Delta: Insights from Machine Learning and Hydrochemical Perspective. Earth Syst. Environ. 2024, 9, 2481–2506. [Google Scholar] [CrossRef]
  24. Stephen Pitchaimani, V.; Seeththa Sankar Narayanan, M.; Richard Abishek, S.; Shyamala, G. Assessment of Coastal Aquifer Vulnerability to Seawater Intrusion: Insights from Kadaladi Region Using the GALDIT Model. Case Stud. Chem. Environ. Eng. 2024, 10, 100772. [Google Scholar] [CrossRef]
  25. Goswami, S.; Rai, A.K. Identifying Intrusion of Seawater in Coastal Aquifers by Modified GALDIT (M-GALDIT) Index. Groundw. Sustain. Dev. 2024, 25, 101173. [Google Scholar] [CrossRef]
  26. Hossain, M.; Mia, A.J.; Hossain, M.J.; Akter, R.; Roy, D.K. Assessing Aquifer Vulnerability to Seawater Intrusion and Impact of Land Use Changes Using GALDIT Model in the Southwest Coastal Region of Bangladesh. Solid Earth Sci. 2025, 10, 100240. [Google Scholar] [CrossRef]
  27. Nolte, A.; Bender, S.; Hartmann, J.; Baltruschat, S.; Moosdorf, N.; Reinecke, R. Coastal Groundwater-Level Trends Reveal Global Susceptibility to Seawater Intrusion. Nat. Water 2026, 4, 673–682. [Google Scholar] [CrossRef]
  28. Papailiopoulou, M.; Zagana, E.; Pouliaris, C.; Kazakis, N. Applications of Vulnerability Assessment and Numerical Modelling for Seawater Intrusion in Coastal Aquifers: An Overview. Water 2026, 18, 19. [Google Scholar] [CrossRef]
  29. Joe, R.J.J.; Pitchaimani, V.S.; Abishek, S.R.; Promilton, A.A.A.; Aswin, S.K.; Karuppannan, S. Geospatial Modelling of Seawater Intrusion Risk in Coastal Aquifer Systems of Southern Malabar Coast, Kerala Using GALDIT Index and Hydrogeochemical Analysis. Sci. Rep. 2026. [Google Scholar] [CrossRef] [PubMed]
  30. Almpanis, A.; McLachlan, P.; Kraghede, R.E.; Griffiths, M.P.; Zamora-Luria, J.C.; Thangavelu, M.; Pedersen, J.B.; Kazmierczak, J. Extent of the Saltwater Intrusion in Coastal Minjur, India and Implications for Groundwater Quality. Environ. Earth Sci. 2026, 85, 180. [Google Scholar] [CrossRef]
  31. Ronchetti, F.; Doveri, M.; Pola, M.; Barzkar, A.; Goodarzi, M.R.; Niazkar, M. Spatio-Temporal Vulnerability Assessment of Coastal Aquifers Using DRASTIC and GALDIT Models with Different Weighting Methods: A Case Study from Iran. Hydrology 2026, 13, 141. [Google Scholar] [CrossRef]
  32. Sifi, S.; Zaghdoudi, S.; Abdo, H.G.; Aydi, A. Sensitivity Analysis of Multiple Groundwater Vulnerability Models for Enhancing Resource Management in the Menzel Bourguiba Aquifer System, Northern Tunisa. Hydrogeol. J. 2026, 34, 1111–1144. [Google Scholar] [CrossRef]
  33. Bordbar, M.; Rezaie, F.; Bateni, S.M.; Valipour, M. Global Review of Modification, Optimization, and Improvement Models for Aquifer Vulnerability Assessment in the Era of Climate Change. Curr. Clim. Change Rep. 2024, 10, 45–67. [Google Scholar] [CrossRef]
  34. Ravi, S.; Sudalaimuthu, K. Assessment of Urbanization Impacts on Coastal Aquifer Vulnerability by Seawater Intrusion Using GIS-Based Modified GALDIT-B Model: A Case Study of South Chennai Coastal Region, Tamil Nadu, India. Res. Sq. 2023. [CrossRef] [PubMed]
  35. Youssef, Y.M.; Gemail, K.S.; Atia, H.M.; Mahdy, M. Insight into Land Cover Dynamics and Water Challenges under Anthropogenic and Climatic Changes in the Eastern Nile Delta: Inference from Remote Sensing and GIS Data. Sci. Total Environ. 2024, 913, 169690. [Google Scholar] [CrossRef] [PubMed]
  36. Fakhri, M.; Moghaddam, A.A.; Nadiri, A.A.; Barzegar, R.; Cloutier, V. Incorporating Hydraulic Gradient and Pumping Rate into GALDIT Framework for Salinity Hazard Assessment in Coastal Aquifers: A Case Study of Urmia Plain, Iran. Res. Sq. 2024. [CrossRef] [PubMed]
  37. Chronidou, D.; Tziritis, E.; Panagopoulos, A.; Oikonomou, E.K.; Loukas, A. A Modified GALDIT Method to Assess Groundwater Vulnerability to Salinization—Application to Rhodope Coastal Aquifer (North Greece). Water 2022, 14, 3689. [Google Scholar] [CrossRef]
  38. Kumar, M.; Panday, D.P.; Bhagat, C.; Herbha, N.; Agarwal, V. Demystifying the Decadal Shift in the Extent of Groundwater in the Coastal Aquifers of Gujarat, India: A Case of Reduced Extent but Increased Magnitude of Seawater Intrusion. Sci. Total Environ. 2023, 898, 165451. [Google Scholar] [CrossRef] [PubMed]
  39. Singh, V.K.; Roxy, M.K. A Review of Ocean-Atmosphere Interactions during Tropical Cyclones in the North Indian Ocean. Earth. Sci. Rev. 2022, 226, 103967. [Google Scholar] [CrossRef]
  40. Trabelsi, N.; Triki, I.; Hentati, I.; Zairi, M. Aquifer Vulnerability and Seawater Intrusion Risk Using GALDIT, GQISWI and GIS: Case of a Coastal Aquifer in Tunisia. Environ. Earth Sci. 2016, 75, 669. [Google Scholar] [CrossRef]
  41. Kaliraj, S.; Chandrasekar, N.; Ramachandran, K.K.; Selvakumar, S. Seawater Intrusion Vulnerability in the Coastal Aquifers of Southern India: An Appraisal of the GALDIT Model, Parameters’ Sensitivity, and Hydrochemical Indicators. Environ. Sci. Pollut. Res. 2019, 26, 9755–9784. [Google Scholar] [CrossRef] [PubMed]
  42. SanthaSophiya, M.; Syed, T.H. Assessment of Vulnerability to Seawater Intrusion and Potential Remediation Measures for Coastal Aquifers: A Case Study from Eastern India. Environ. Earth Sci. 2013, 70, 1197–1209. [Google Scholar] [CrossRef]
  43. Sakthi Priya, R.; Antony Ravindran, A.; Richard Abishek, S. Coastal Vulnerability Assessment Using the GALDIT Model: A Case Study of Mukkani and Palayakayal Regions in the Thamirabarani Delta, Southern Tamil Nadu, India. Model. Earth Syst. Environ. 2024, 10, 5257–5271. [Google Scholar] [CrossRef]
  44. Behera, A.K.; Chakrapani, G.J.; Kumar, S.; Rai, N. Identification of Seawater Intrusion Signatures through Geochemical Evolution of Groundwater: A Case Study Based on Coastal Region of the Mahanadi Delta, Bay of Bengal, India. Nat. Hazards 2019, 97, 1209–1230. [Google Scholar] [CrossRef]
  45. Mythilee Priyanka, V.; Maddamsetty, R.; Yarramalle, S. Hydrochemical Characterisation and Identification of Seawater Intrusion in the Visakhapatnam Coastal Aquifer. J. Water Health 2023, 21, 915–924. [Google Scholar] [CrossRef] [PubMed]
  46. Sarkar, M.; Pal, S.C.; Islam, A.R.M.T. Seawater Intrusion into Groundwater and Its Impact on Irrigation and Agriculture: Evidence from the Coastal Region of West Bengal, India. Reg. Stud. Mar. Sci. 2021, 44, 101751. [Google Scholar] [CrossRef]
  47. Siddha, S.; Sahu, P. Status of Seawater Intrusion in Coastal Aquifer of Gujarat, India: A Review. SN Appl. Sci. 2020, 2, 1796. [Google Scholar] [CrossRef]
  48. Adams, K.H.; Reager, J.T.; Buzzanga, B.A.; David, C.H.; Sawyer, A.H.; Hamlington, B.D. Climate-Induced Saltwater Intrusion in 2100: Recharge-Driven Severity, Sea Level-Driven Prevalence. Geophys. Res. Lett. 2024, 51, e2024GL110359. [Google Scholar] [CrossRef] [PubMed]
  49. Salaj, S.S.; Ramesh, D.; Suresh Babu, D.S.; Seenipandi, K.; Nainarpandian, C. Appraisal of Urban Growth Impacts on Seawater Intrusion Vulnerability Using GIS-Based Modified GALDIT-U Model: A Case Study of Kozhikode Coastal Stretch, Kerala, South India. J. Appl. Remote Sens. 2022, 16, 12014. [Google Scholar] [CrossRef]
  50. Das, B.; Dhorde, A.; Mitra, D. Delineating Saltwater Intrusion Zones and Assessing Its Relation with Mangrove Species along the Coastal Tracts of Raigad District of Maharashtra, India. J. Coast. Conserv. 2022, 26, 78. [Google Scholar] [CrossRef]
  51. Fidelibus, M.D.; Balacco, G.; Alfio, M.R.; Arfaoui, M.; Bassukas, D.; Güler, C.; Hamzaoui-Azaza, F.; Külls, C.; Panagopoulos, A.; Parisi, A.; et al. A Chloride Threshold to Identify the Onset of Seawater/Saltwater Intrusion and a Novel Categorization of Groundwater in Coastal Aquifers. J. Hydrol. 2025, 653, 132775. [Google Scholar] [CrossRef]
  52. Ahmed, N.; Ming, J.; Youssef, Y.M.; Ali, S.; Alarifi, N.; Hussan, W.U.; Nahas, F.; Abd-Elmaboud, M.E. Integrating Water Evaluation and Adaptation Planning with Enhanced Sustainable Development Goals Impact Assessment for Sustainable Irrigation Optimization in Water Stressed Agricultural Basin. Agric. Water Manag. 2026, 325, 110132. [Google Scholar] [CrossRef]
  53. Khan, A.E.; Ireson, A.; Kovats, S.; Mojumder, S.K.; Khusru, A.; Rahman, A.; Vineis, P. Salinity in Drinking Water and the Risk of (Pre)Eclampsia and Gestational Hypertension in Coastal Bangladesh: A Case-Control Study. PLoS ONE 2014, 9, e108715. [Google Scholar] [CrossRef] [PubMed]
  54. Naser, A.M.; Rahman, M.; Unicomb, L.; Doza, S.; Gazi, M.S.; Alam, G.R.; Karim, M.R.; Uddin, M.N.; Khan, G.K.; Ahmed, K.M.; et al. Drinking Water Salinity, Urinary Macro-Mineral Excretions, and Blood Pressure in the Southwest Coastal Population of Bangladesh. J. Am. Heart Assoc. 2019, 8, e012007. [Google Scholar] [CrossRef] [PubMed]
  55. Hossain, M.M.; Pal, I. Reproductive Health Challenges in Coastal Bangladesh: A Silent Threat of Water Salinity. BMC Womens Health 2025, 25, 466. [Google Scholar] [CrossRef] [PubMed]
  56. Kumar, P.; Sharma, P.K. Soil Salinity and Food Security in India. Front. Sustain. Food Syst. 2020, 4, 533781. [Google Scholar] [CrossRef]
  57. Datta, P.; Behera, B.; Rahut, D.B. Climate Change and Water-Related Threats in the Indian Sundarbans: Food Security and Management Implications. Int. J. Water Resour. Dev. 2023, 40, 323–344. [Google Scholar] [CrossRef]
  58. Ghirardelli, A.; Straffelini, E.; Park, E.; D’Agostino, V.; Masin, R.; Tarolli, P. Global Impact of Seawater Intrusion on Coastal Agriculture. Environ. Res. Lett. 2025, 20, 13005. [Google Scholar] [CrossRef]
  59. Aryal, J.P.; Sapkota, T.B.; Rahut, D.B.; Krupnik, T.J.; Shahrin, S.; Jat, M.L.; Stirling, C.M. Farmers’ Perception, Adaptation to Groundwater Salinity, and Climate Change Vulnerability: Insights from North India. Weather Clim. Soc. 2021, 13, 797–814. [Google Scholar] [CrossRef]
  60. Mondal, B.; Saya, A.K.; Roy, A. Evaluating Rural Poverty and Livelihood Diversification in the Context of Climate-Induced Extreme Events in Coastal Area: Insights from Indian Sundarban. Environ. Sustain. Indic. 2023, 67, 103191. [Google Scholar] [CrossRef]
Figure 1. Study area map of the Indian coastal region.
Water 18 01918 g001
Figure 2. Hydrogeological map of the Indian coastal region showing the spatial distribution of major aquifer systems.
Water 18 01918 g002
Figure 3. Overall methodology framework for the integrated GALDIT and GALDIT-LU seawater intrusion vulnerability assessment along the Indian coastline.
Water 18 01918 g003
Figure 4. Map of Groundwater occurrence; Aquifer hydraulic conductivity; Depth to groundwater level (May 2016); Distance from shoreline; Impact of existing status; Thickness of aquifer.
Water 18 01918 g004
Figure 5. Land use/cover classes and their spatio-temporal changes (2017–2024) derived from the ESA WorldCover dataset data.
Water 18 01918 g005
Figure 6. Reclassified and weighted layers of the GALDIT parameters: Groundwater occurrence; Aquifer hydraulic conductivity; Depth to groundwater level; Distance from shoreline; Impact of existing SWI status; Thickness of Aquifer.
Water 18 01918 g006
Figure 7. GALDIT vulnerability index map derived from six parameters for the year 2024.
Water 18 01918 g007
Figure 8. Reclassified LULC maps for the years 2017, 2020, and 2024, derived from the ESA WorldCover dataset.
Water 18 01918 g008
Figure 9. Spatio-temporal variation of GALDIT-LU vulnerability index for 2017, 2020, and 2024.
Water 18 01918 g009
Figure 10. GALDIT vulnerability index validated against groundwater chloride (Cl) concentration data from CGWB coastal monitoring wells.
Water 18 01918 g010
Figure 11. GALDIT-LU vulnerability index validated against groundwater chloride (Cl) concentration data for 2017, 2020, and 2024.
Water 18 01918 g011
Figure 12. Comparison of the areas covered by each seawater intrusion vulnerability class based on GALDIT and GALDIT-LU indices.
Water 18 01918 g012
Figure 13. Alignment of the GALDIT-LU seawater intrusion vulnerability assessment framework with the United Nations Sustainable Development Goals across the environmental, social, and economic dimensions of sustainable coastal groundwater management.
Water 18 01918 g013
Table 1. GALDIT parameter framework, weighting system, and data sources.
ParameterWeightData SourceDescriptionRationale
Groundwater Occurrence4India-WRIS (CGWB)Distinguishes unconfined, semi-confined, and confined aquifer conditionsUnconfined aquifers lack confining layers, permitting unrestricted vertical saline intrusion when freshwater heads decline; the highest weight reflects primary control on SWI susceptibility.
Aquifer Hydraulic Conductivity1India-WRIS (CGWB)Rate of lateral groundwater movement through the aquifer matrix (m/day)Controls the velocity and spatial extent of saline water migration once intrusion is initiated; lower weight reflects an indirect, amplifying rather than causative role.
Depth to Groundwater Level3India-WRIS—Pre-monsoon, May 2016Vertical distance from land surface to the water table (m below ground level)Shallow water tables reduce the freshwater hydraulic head resisting seawater pressure; worst-case pre-monsoon 2016 data capture conservative vulnerability conditions.
Distance from Shoreline4GIS Coastline Delineation (Topographic Survey of India)Horizontal distance from the nearest coastline (m)Coastal proximity increases direct marine influence; the 0–500 m zone represents the highest-SWI-risk corridor along the 7516 km Indian coastline.
Impact of Existing SWI Status1CGWB Coastal Monitoring WellsGeochemical proxy for current or legacy saltwater contamination expressed as Cl/HCO3 ratioElevated ratios confirm active saline contamination, providing empirical evidence of ongoing intrusion and validating model outputs against observed hydrochemistry.
Aquifer Thickness2India-WRIS (CGWB)Vertical extent of the saturated aquifer formation (m)Greater thickness implies larger freshwater storage and buffering capacity; however, resistance remains contingent on adequate recharge and controlled extraction.
Land Use/Land Cover2ESA WorldCover Data (2017 · 2020 · 2024)Multi-temporal surface classification reflecting patterns of groundwater abstraction and recharge modificationUrban and agricultural expansion intensify extraction and reduce infiltration, amplifying SWI risk beyond intrinsic hydrogeological vulnerability; temporal coverage captures progressive anthropogenic stress.
Table 2. Assessment guidelines for GALDIT and GALDIT-LU parameters.
ParameterWeightGALDIT Factor Variables RangeImportance Rating
Groundwater occurrence 1Unconfined10
Semi-confined7
Confined3
Not Classified1
Aquifer hydraulic conductivity [m/day]3>2010
10–208
5–106
1–54
<12
Depth to groundwater Level
[m bgl]
4<310
3–58
5–106
10–204
>202
Distance from the shoreline [m]4<50010
500–20008
2000–50006
5000–10,0004
>10,0002
Impact of existing status of SWI status (Ratio of (Cl/HCO3))1>510
2–58
1–26
0.5–14
<0.52
Thickness of the aquifer [m]2<1010
10–258
25–506
50–754
>752
Land Use Land Cover2Built-up10
Water Bodies, Flooded Vegetation, Bare Ground8
Crops6
Rangeland4
Forest2
Table 3. Area under different seawater intrusion vulnerability classes derived from GALDIT and GALDIT-LU indices (2017–2024).
VulnerabilityGALDIT 2024GALDIT-LU 2017GALDIT-LU 2020GALDIT-LU 2024
(Sq. Km)(Sq. Km)(Sq. Km)(Sq. Km)
Very Low31,306.0233,105.4732,178.1632,053.76
Low116,635.82146,442.63144,244.11145,467.29
Moderate211,204.16217,051.72214,095.18137,447.74
High116,917.1595,117.50100,136.50151,799.63
Very High29,630.7513,295.3714,370.9538,256.81
Disclaimer/Publisher’s Note: The statements, opinions and data contained in all publications are solely those of the individual author(s) and contributor(s) and not of MDPI and/or the editor(s). MDPI and/or the editor(s) disclaim responsibility for any injury to people or property resulting from any ideas, methods, instructions or products referred to in the content.