1. Introduction
Coastal alluvial aquifers are among the world’s most important freshwater resources, supplying domestic, agricultural, and industrial water to densely populated coastal regions [
1]. These systems are inherently vulnerable to seawater intrusion when the natural seaward hydraulic gradient is disrupted by excessive groundwater abstraction, sea-level rise, or reduced recharge under increasingly arid climatic conditions [
2,
3]. When groundwater extraction exceeds natural recharge, the hydraulic gradient may reverse, allowing a buoyancy-driven saline wedge to migrate inland through the highly permeable coastal sediments. This process progressively degrades groundwater quality and threatens long-term freshwater security [
4,
5].
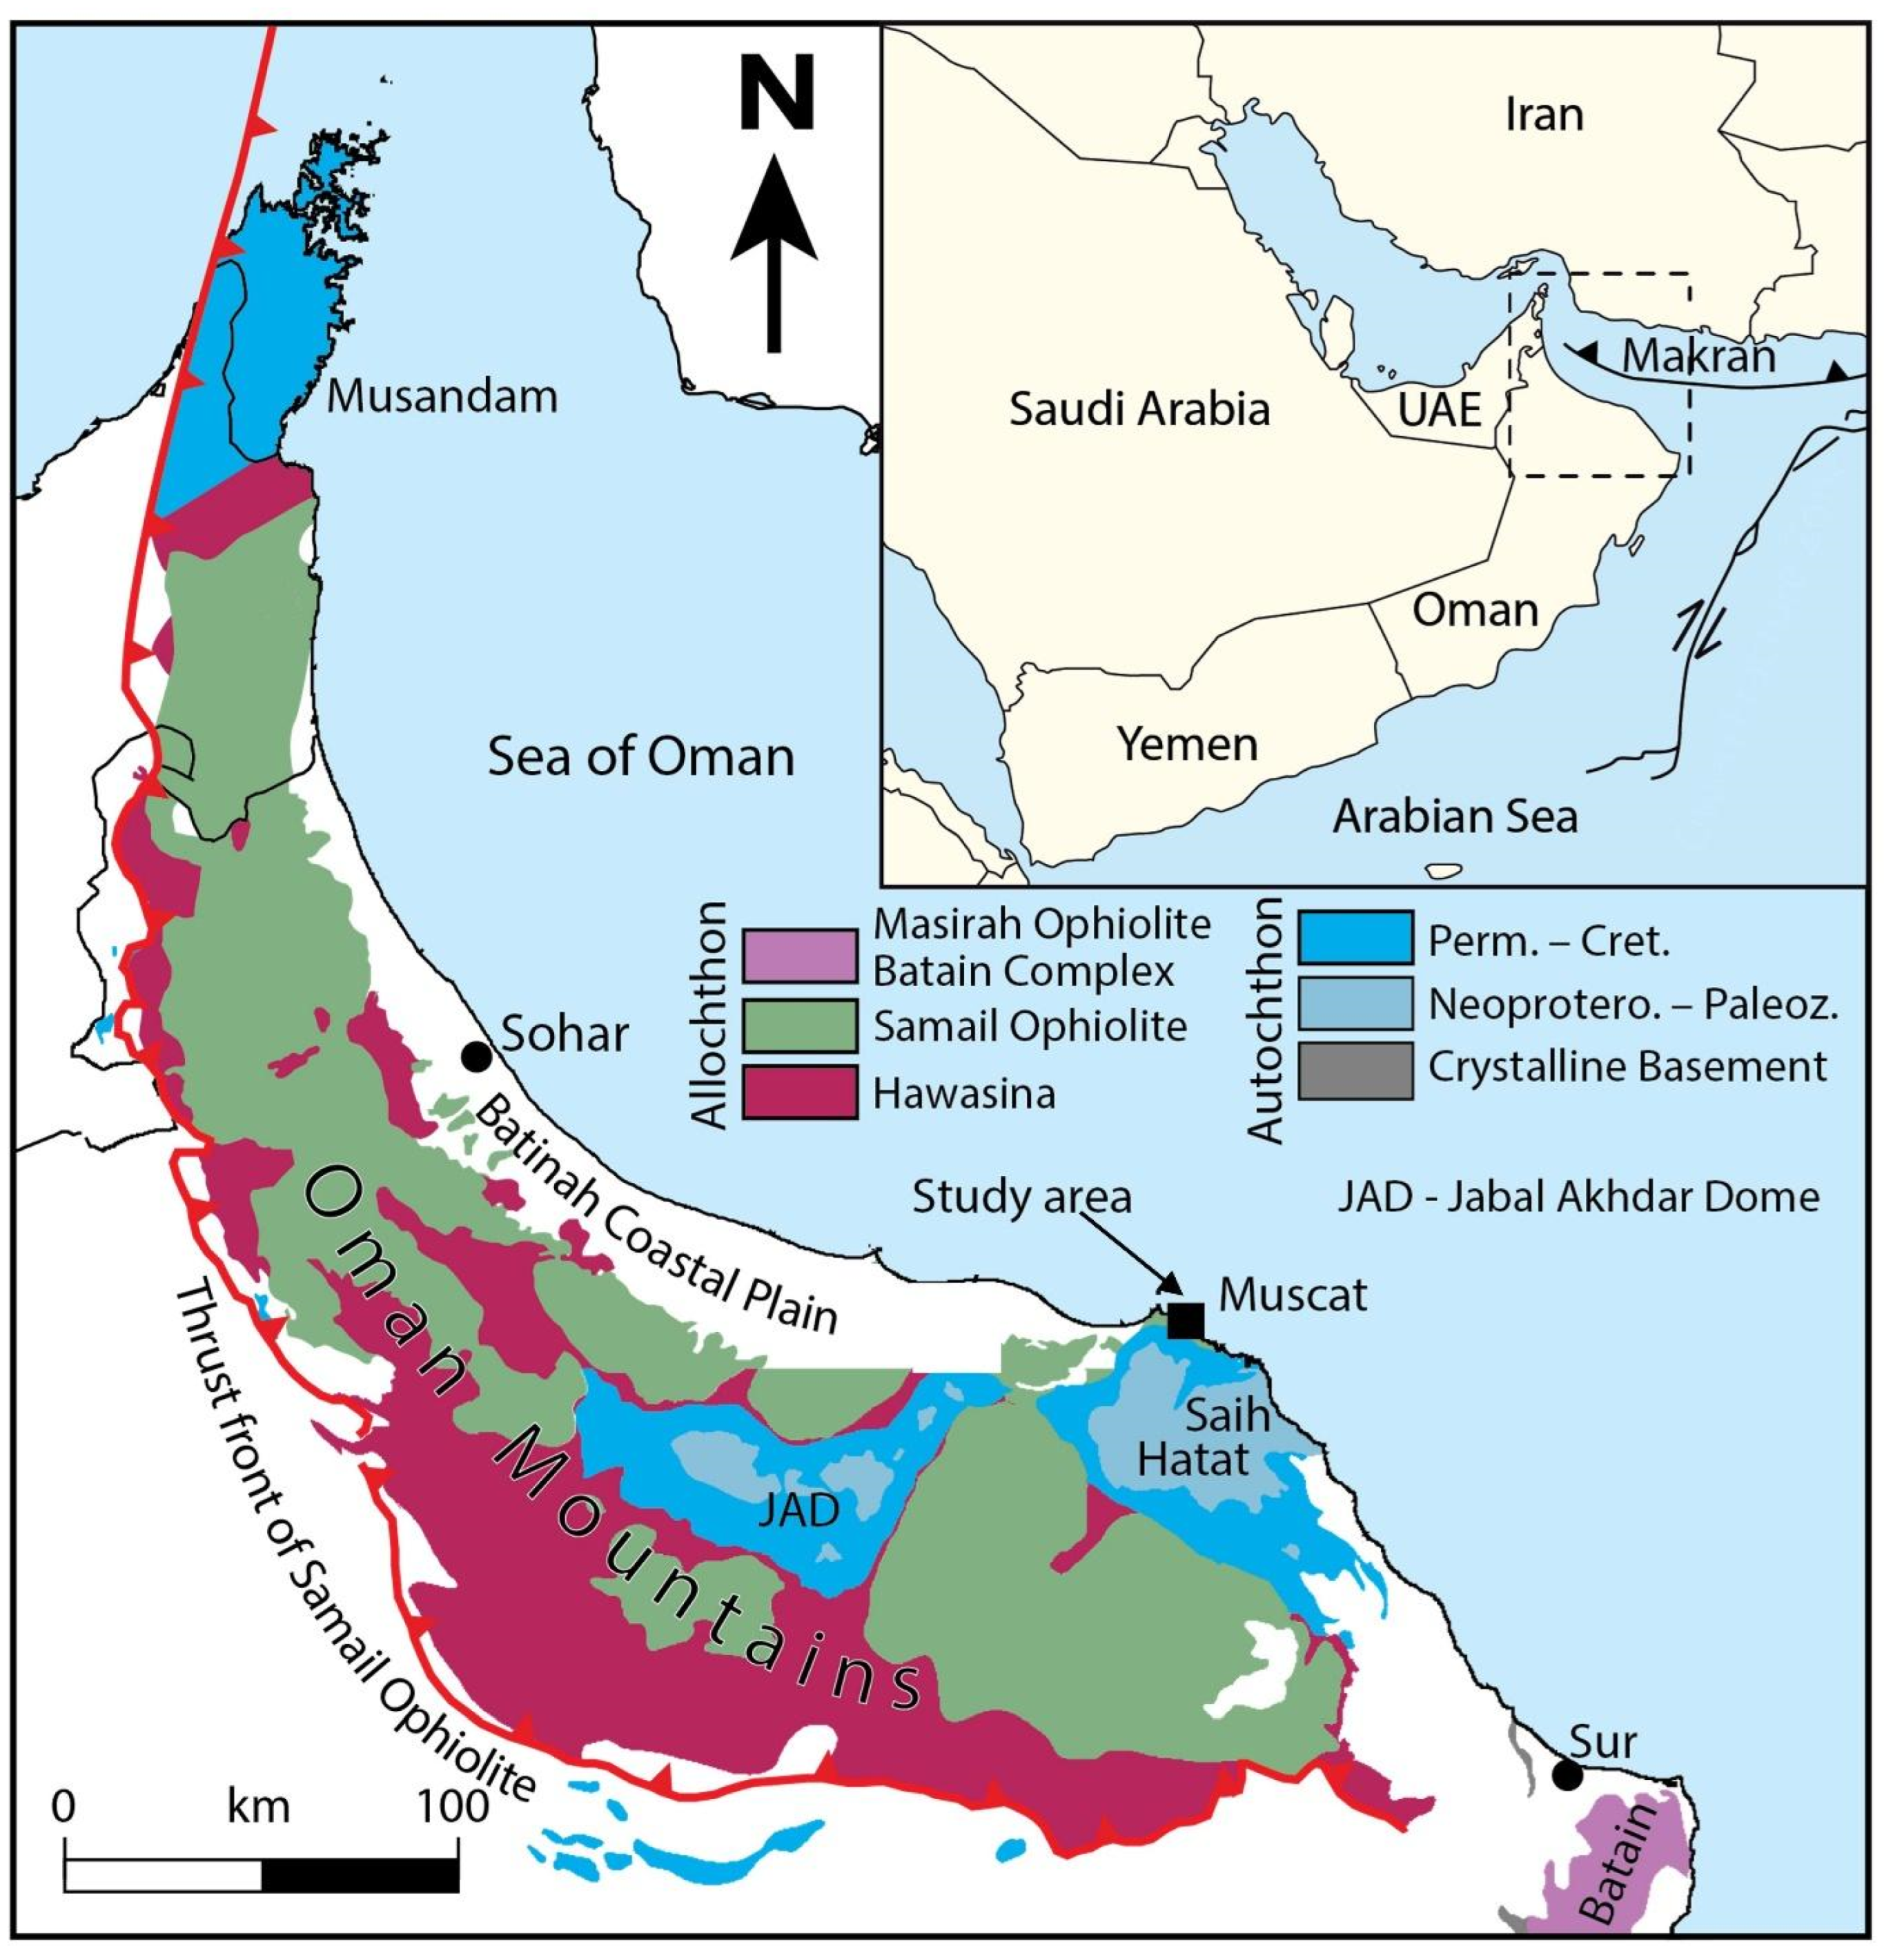
The Al Batinah Coastal Plain in northern Oman extends along the Oman Sea from Muscat northwestward to the United Arab Emirates border (
Figure 1) and provides a clear regional example of this problem [
6,
7]. The plain contains much of Oman’s productive agricultural land and depends almost entirely on groundwater stored in thick, highly permeable Quaternary alluvial-fan deposits to meet irrigation and domestic water demand, as surface freshwater resources are virtually absent. Decades of rapid population growth, together with urban and agricultural expansion, have caused groundwater abstraction to exceed natural recharge. As a result, groundwater levels have declined markedly, the natural hydraulic gradient has reversed, and seawater intrusion has advanced into the coastal aquifer [
8]. The resulting salinization of groundwater and soils has led to the abandonment of many domestic wells, a reduction in arable land, and the deterioration of economically important crops such as date palms [
9]. In response, the Omani government has implemented several measures to improve groundwater management, including restrictions on new well drilling in the coastal strip and the construction of managed aquifer recharge structures [
10]. These measures include Al-Khoud Dam and the recently completed Al-Jifnain Dam, both of which were designed to enhance groundwater recharge by capturing episodic flood flows [
11].
Effective management of coastal aquifers requires accurate delineation of the freshwater–seawater interface [
13]. Geophysical methods, particularly electrical resistivity tomography (ERT) and transient electromagnetic (TEM) surveys, provide non-invasive and cost-effective alternatives to borehole investigations for hydrogeological characterization and seawater intrusion mapping. These methods are sensitive to variations in electrical conductivity associated with changes in pore-water salinity [
14,
15,
16,
17]. However, the performance of ERT often degrades in arid coastal settings because highly conductive near-surface saline or clay-rich layers rapidly attenuate the injected electric current, thereby limiting the depth of investigation. In addition, dry surface sediments can produce high electrode-contact resistance, further reducing data quality [
18]. In contrast, TEM is particularly well suited to such environments because it is based on electromagnetic induction and does not require galvanic contact with the ground. Consequently, TEM can effectively resolve deep conductive structures beneath resistive surface materials, such as saline wedges underlying freshwater-bearing gravels. TEM has been successfully applied for delineating seawater intrusions and identifying freshwater-bearing zones in complex hydrogeological settings in many studies worldwide and in Oman [
8,
17,
19,
20,
21,
22].
Interpretation of TEM data relies on inversion techniques that transform measured electromagnetic responses into subsurface resistivity models [
23]. TEM data can be inverted using one-dimensional (1D), two-dimensional (2D), or three-dimensional (3D) methods depending on the geological complexity and the survey design. However, 2D and 3D inversions, while able to handle complex subsurface heterogeneity, are computationally expensive and not practical for large datasets [
24]. In sedimentary environments characterized by laterally continuous stratified units, a 1D layered-earth representation is generally both geologically appropriate and computationally efficient. Conventional 1D inversion, however, treats each sounding independently and assumes no correlation between adjacent stations. This limitation can lead to unrealistic lateral variations in the resulting resistivity sections [
25]. To overcome this limitation, the laterally constrained inversion (LCI) approach was developed [
26]. The LCI inverts multiple soundings simultaneously, but with the imposition of lateral continuity constraints on the model parameters between adjacent stations, thereby generating more geologically realistic and spatially coherent resistivity sections [
27].
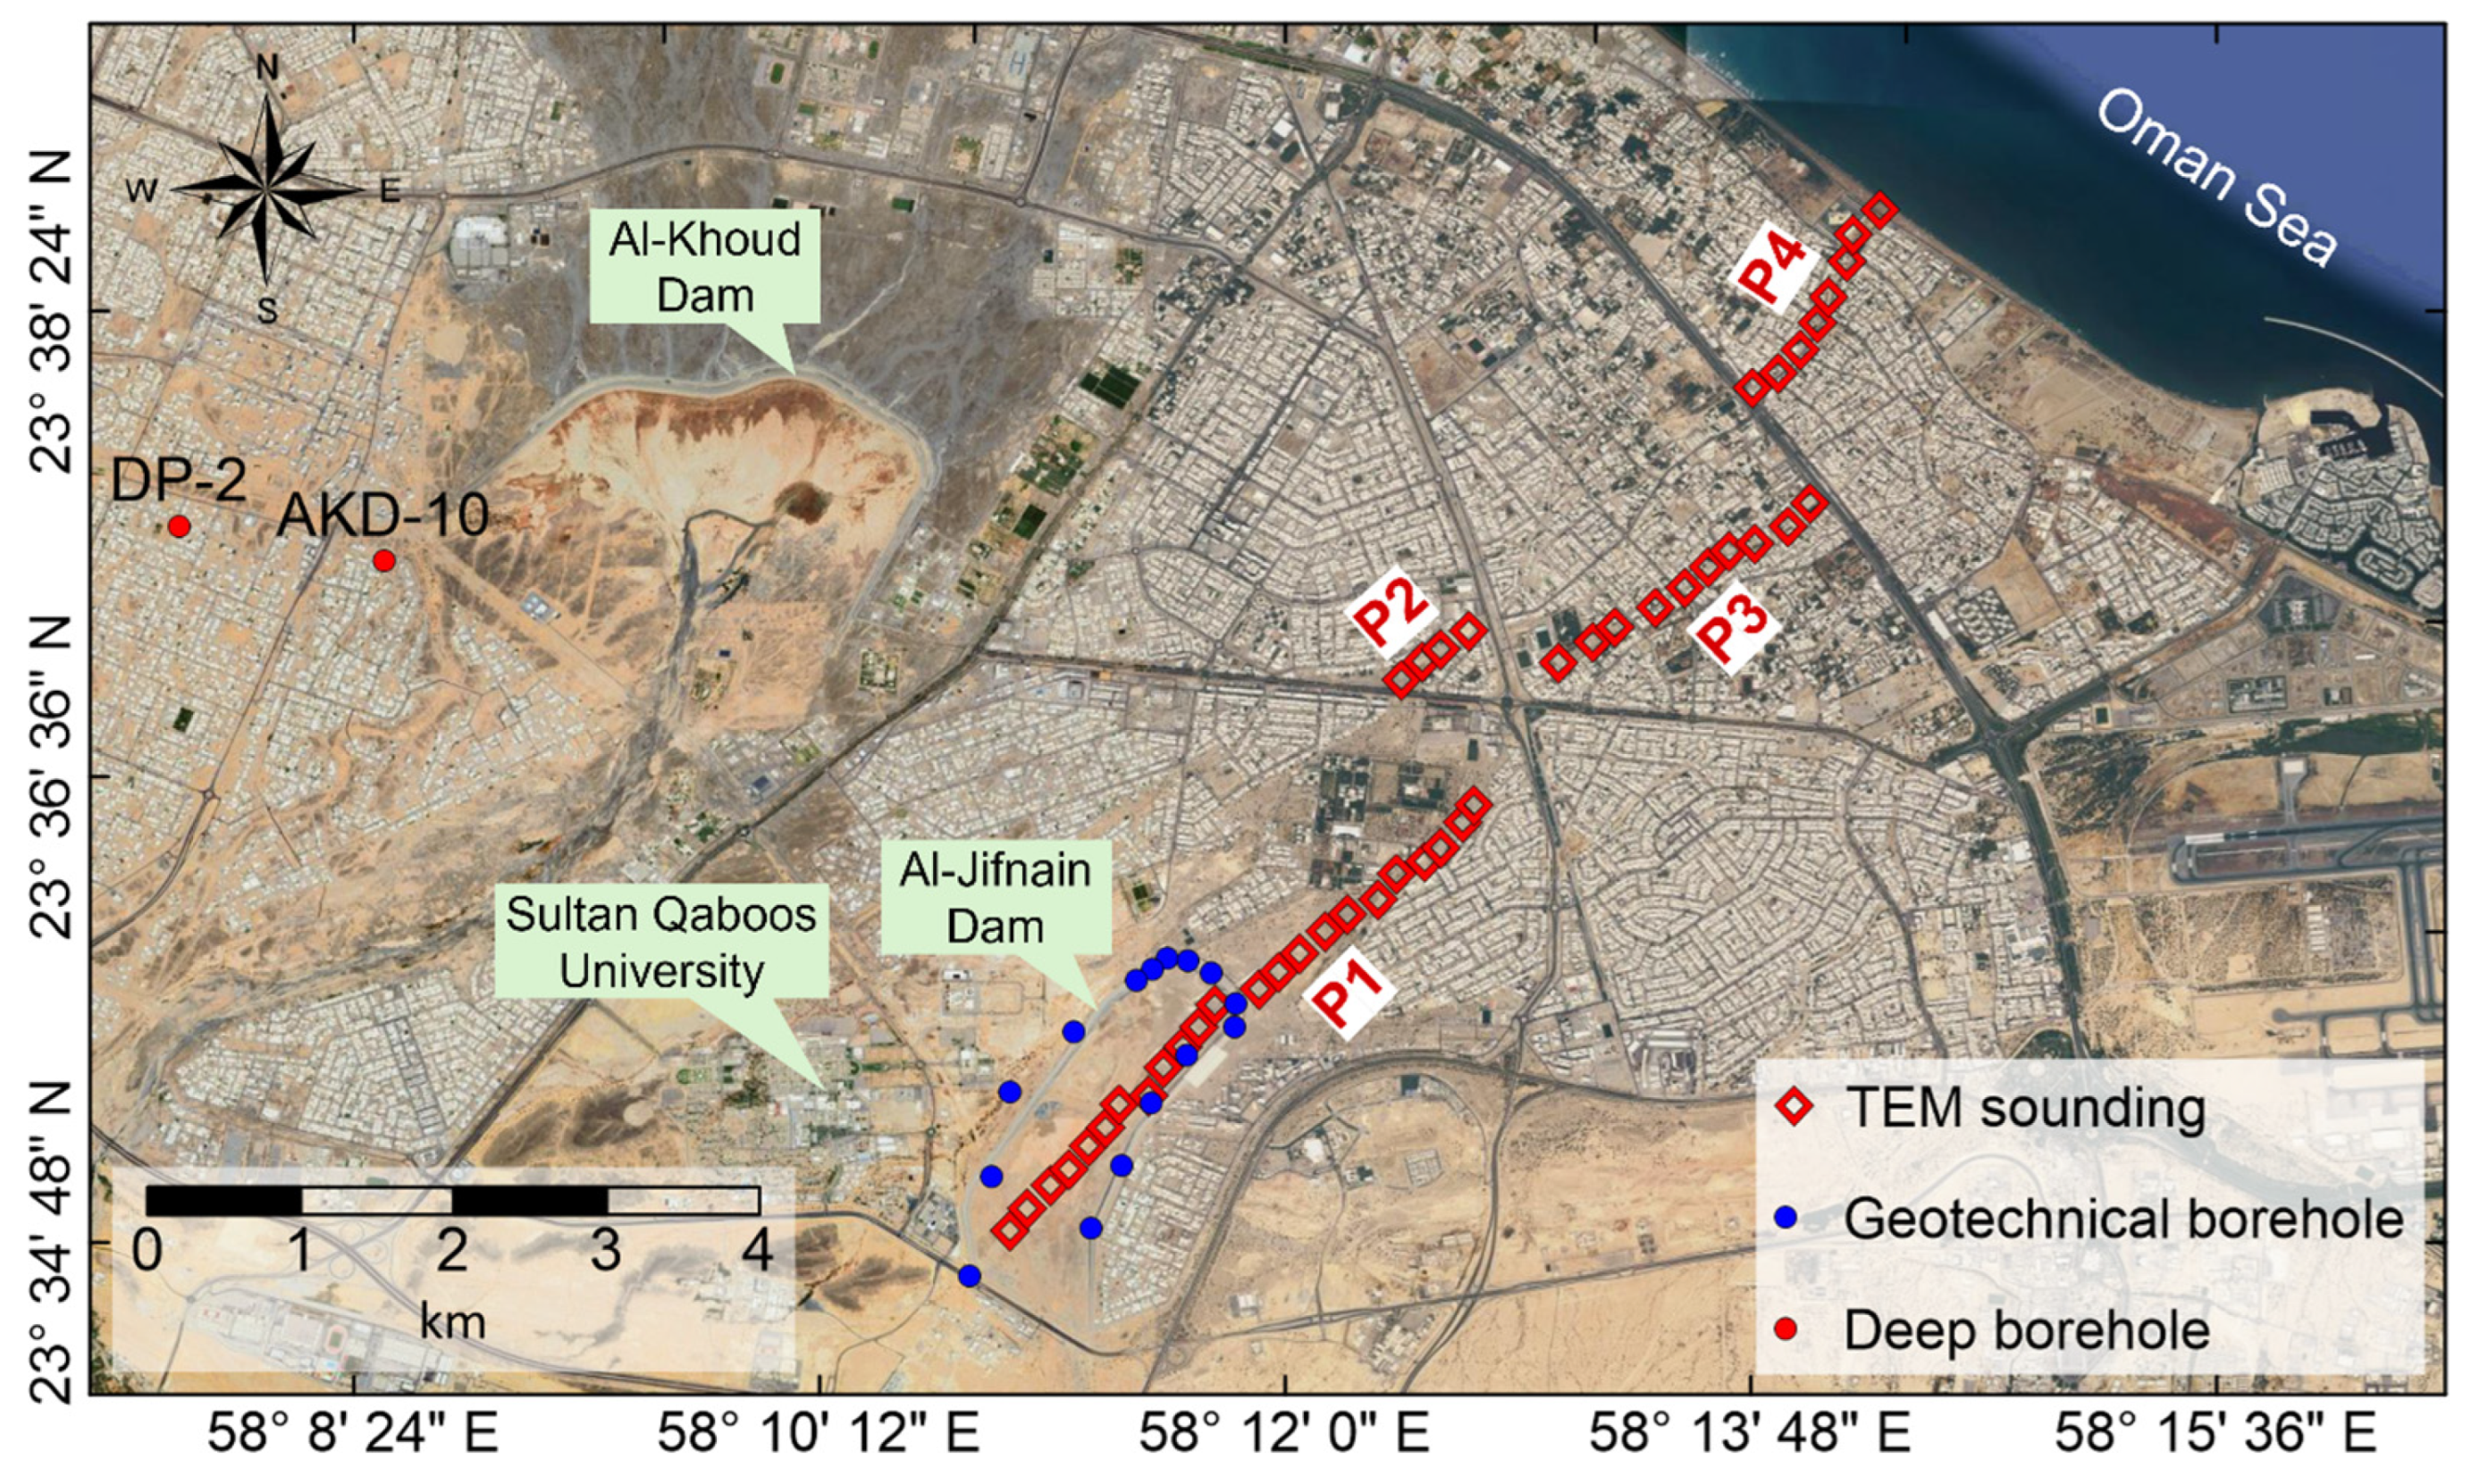
In this study, TEM data were acquired in the eastern part of the Al Batinah Coastal Plain along four profiles extending from Al-Jifnain Dam to the Oman Sea (
Figure 2). The data were inverted using the LCI approach to investigate seawater intrusion in the eastern sector of the Al Batinah coastal aquifer. The main objective was to map the geometry, depth extent, and inland penetration of the saline intrusion front. This information is essential for evaluating the influence of focused recharge from Al-Jifnain Dam on the current hydrogeological conditions of the coastal aquifer system.
2. Materials and Methods
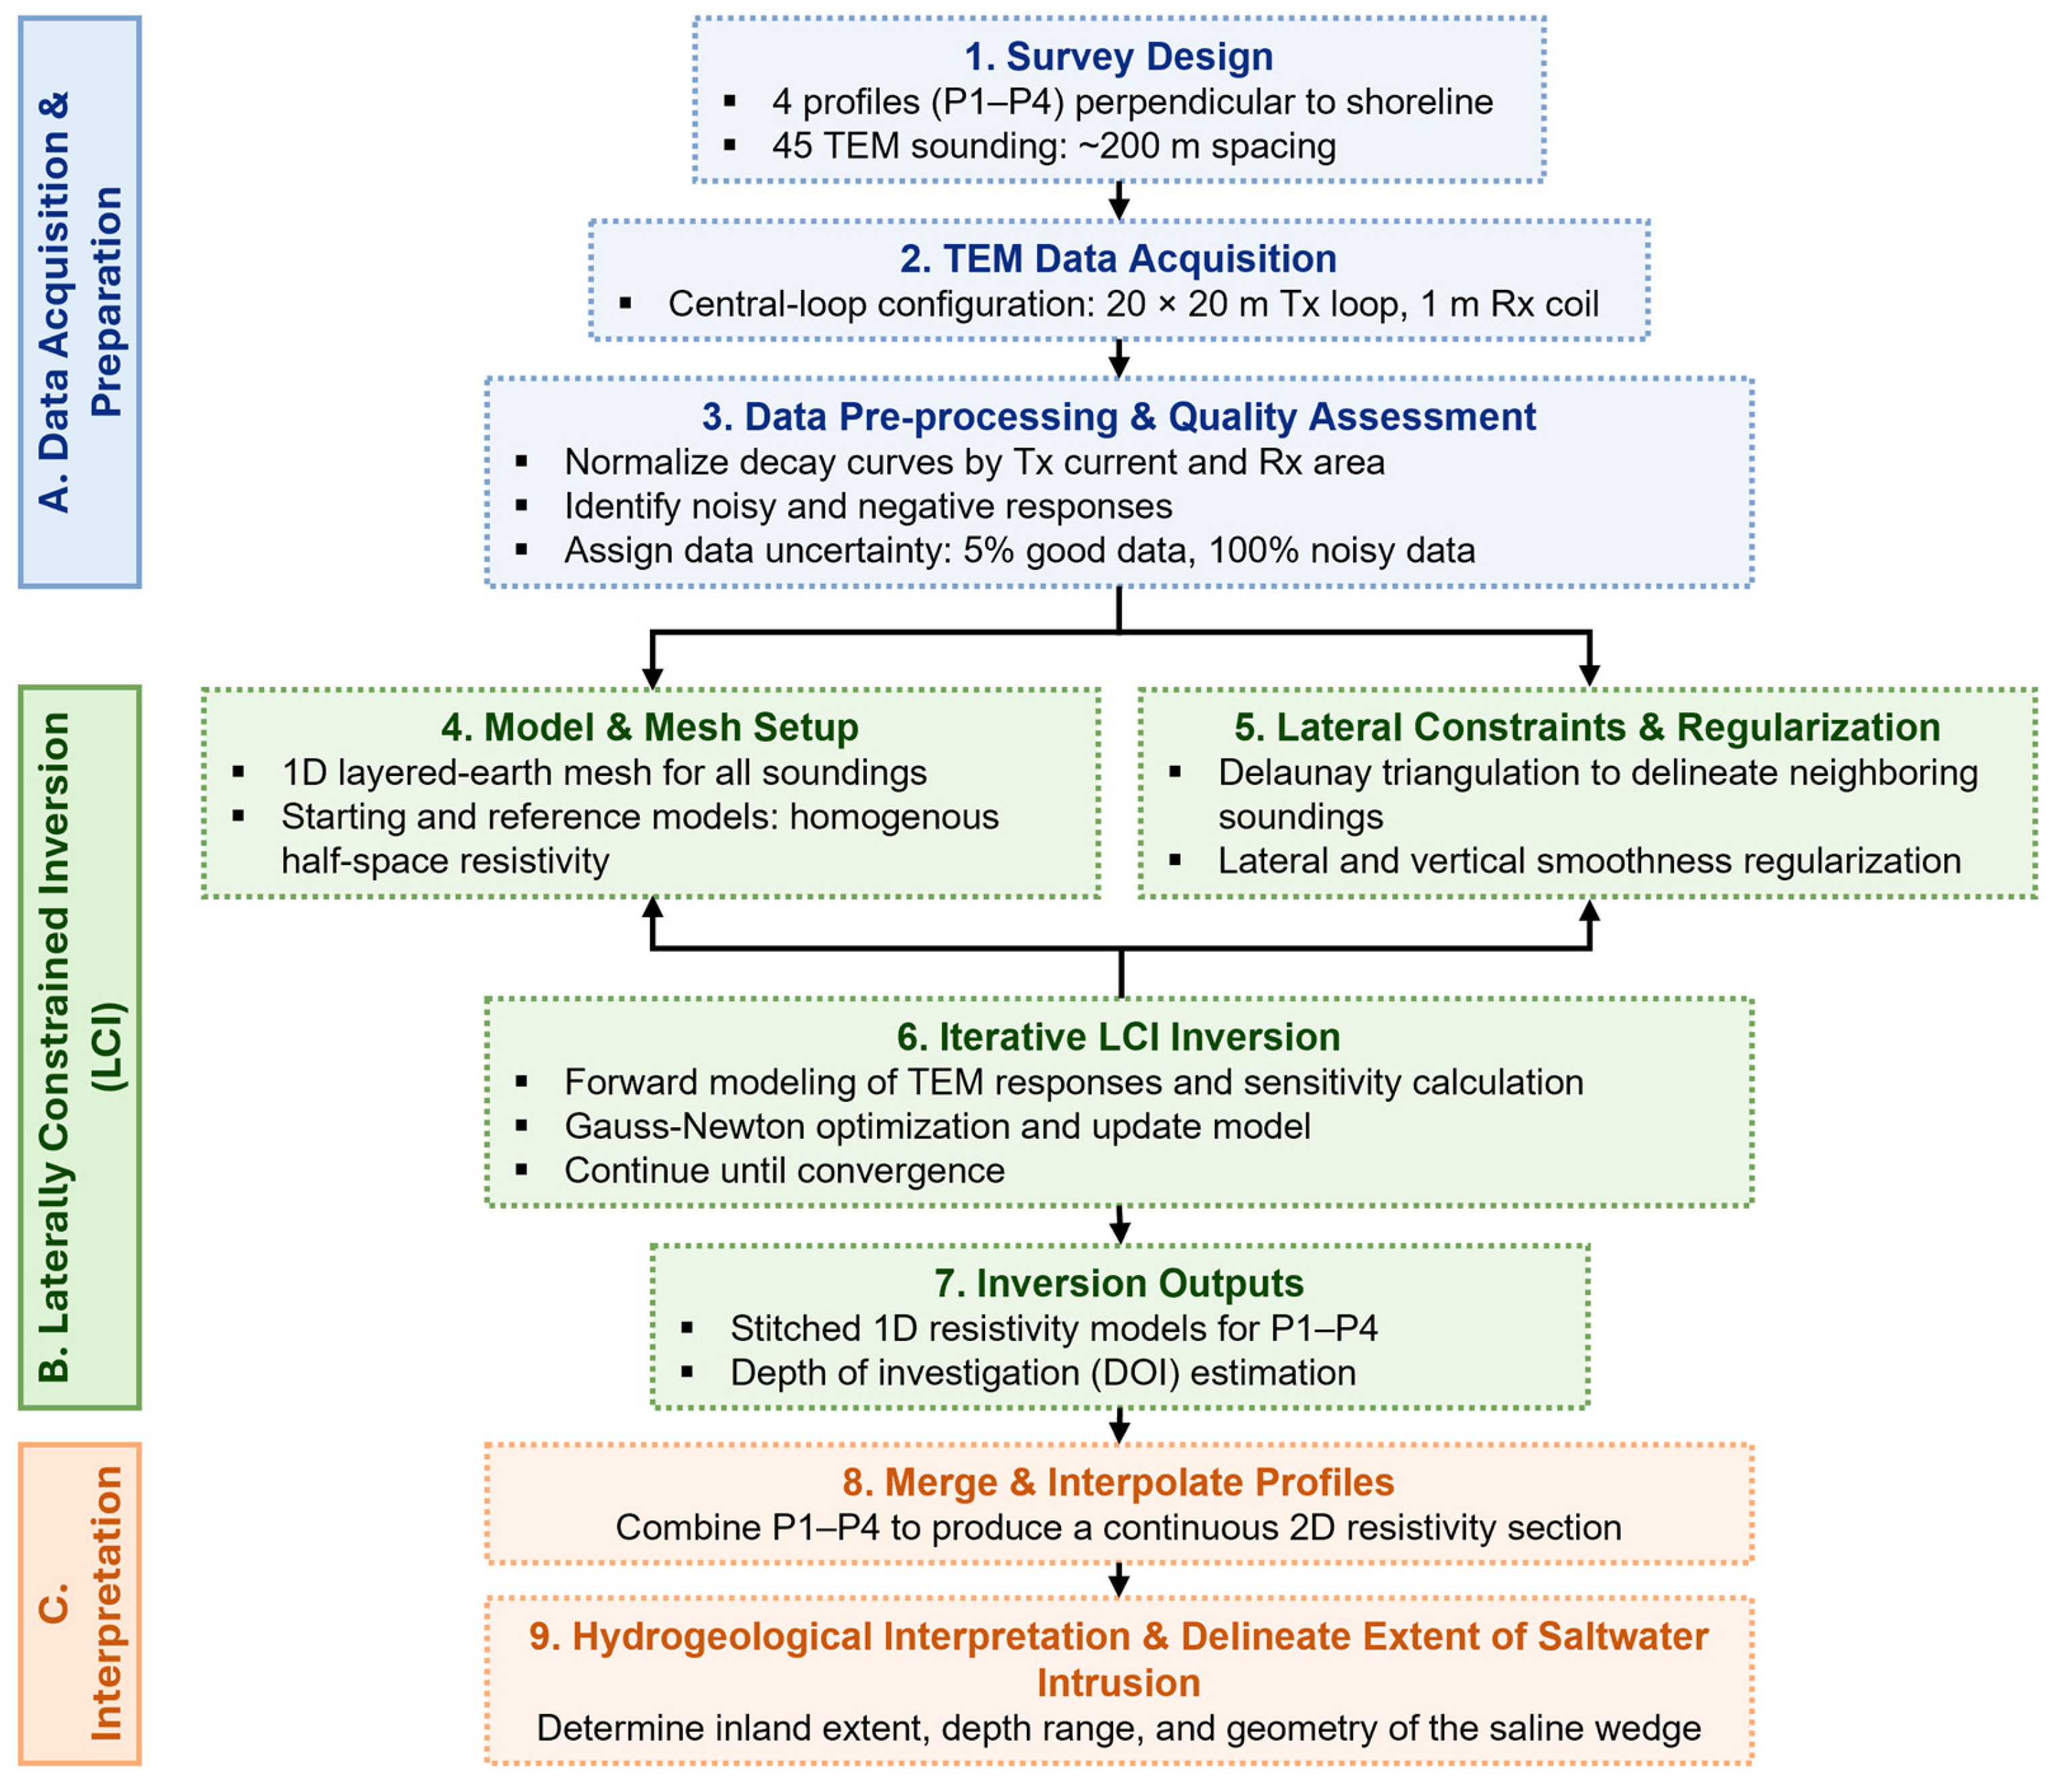
The following sections describe in detail the TEM data acquisition procedure and the LCI scheme adopted to invert the TEM data in this study. An overview of the methodology is presented in the flowchart shown in
Figure 3.
2.1. Hydrogeological Setting
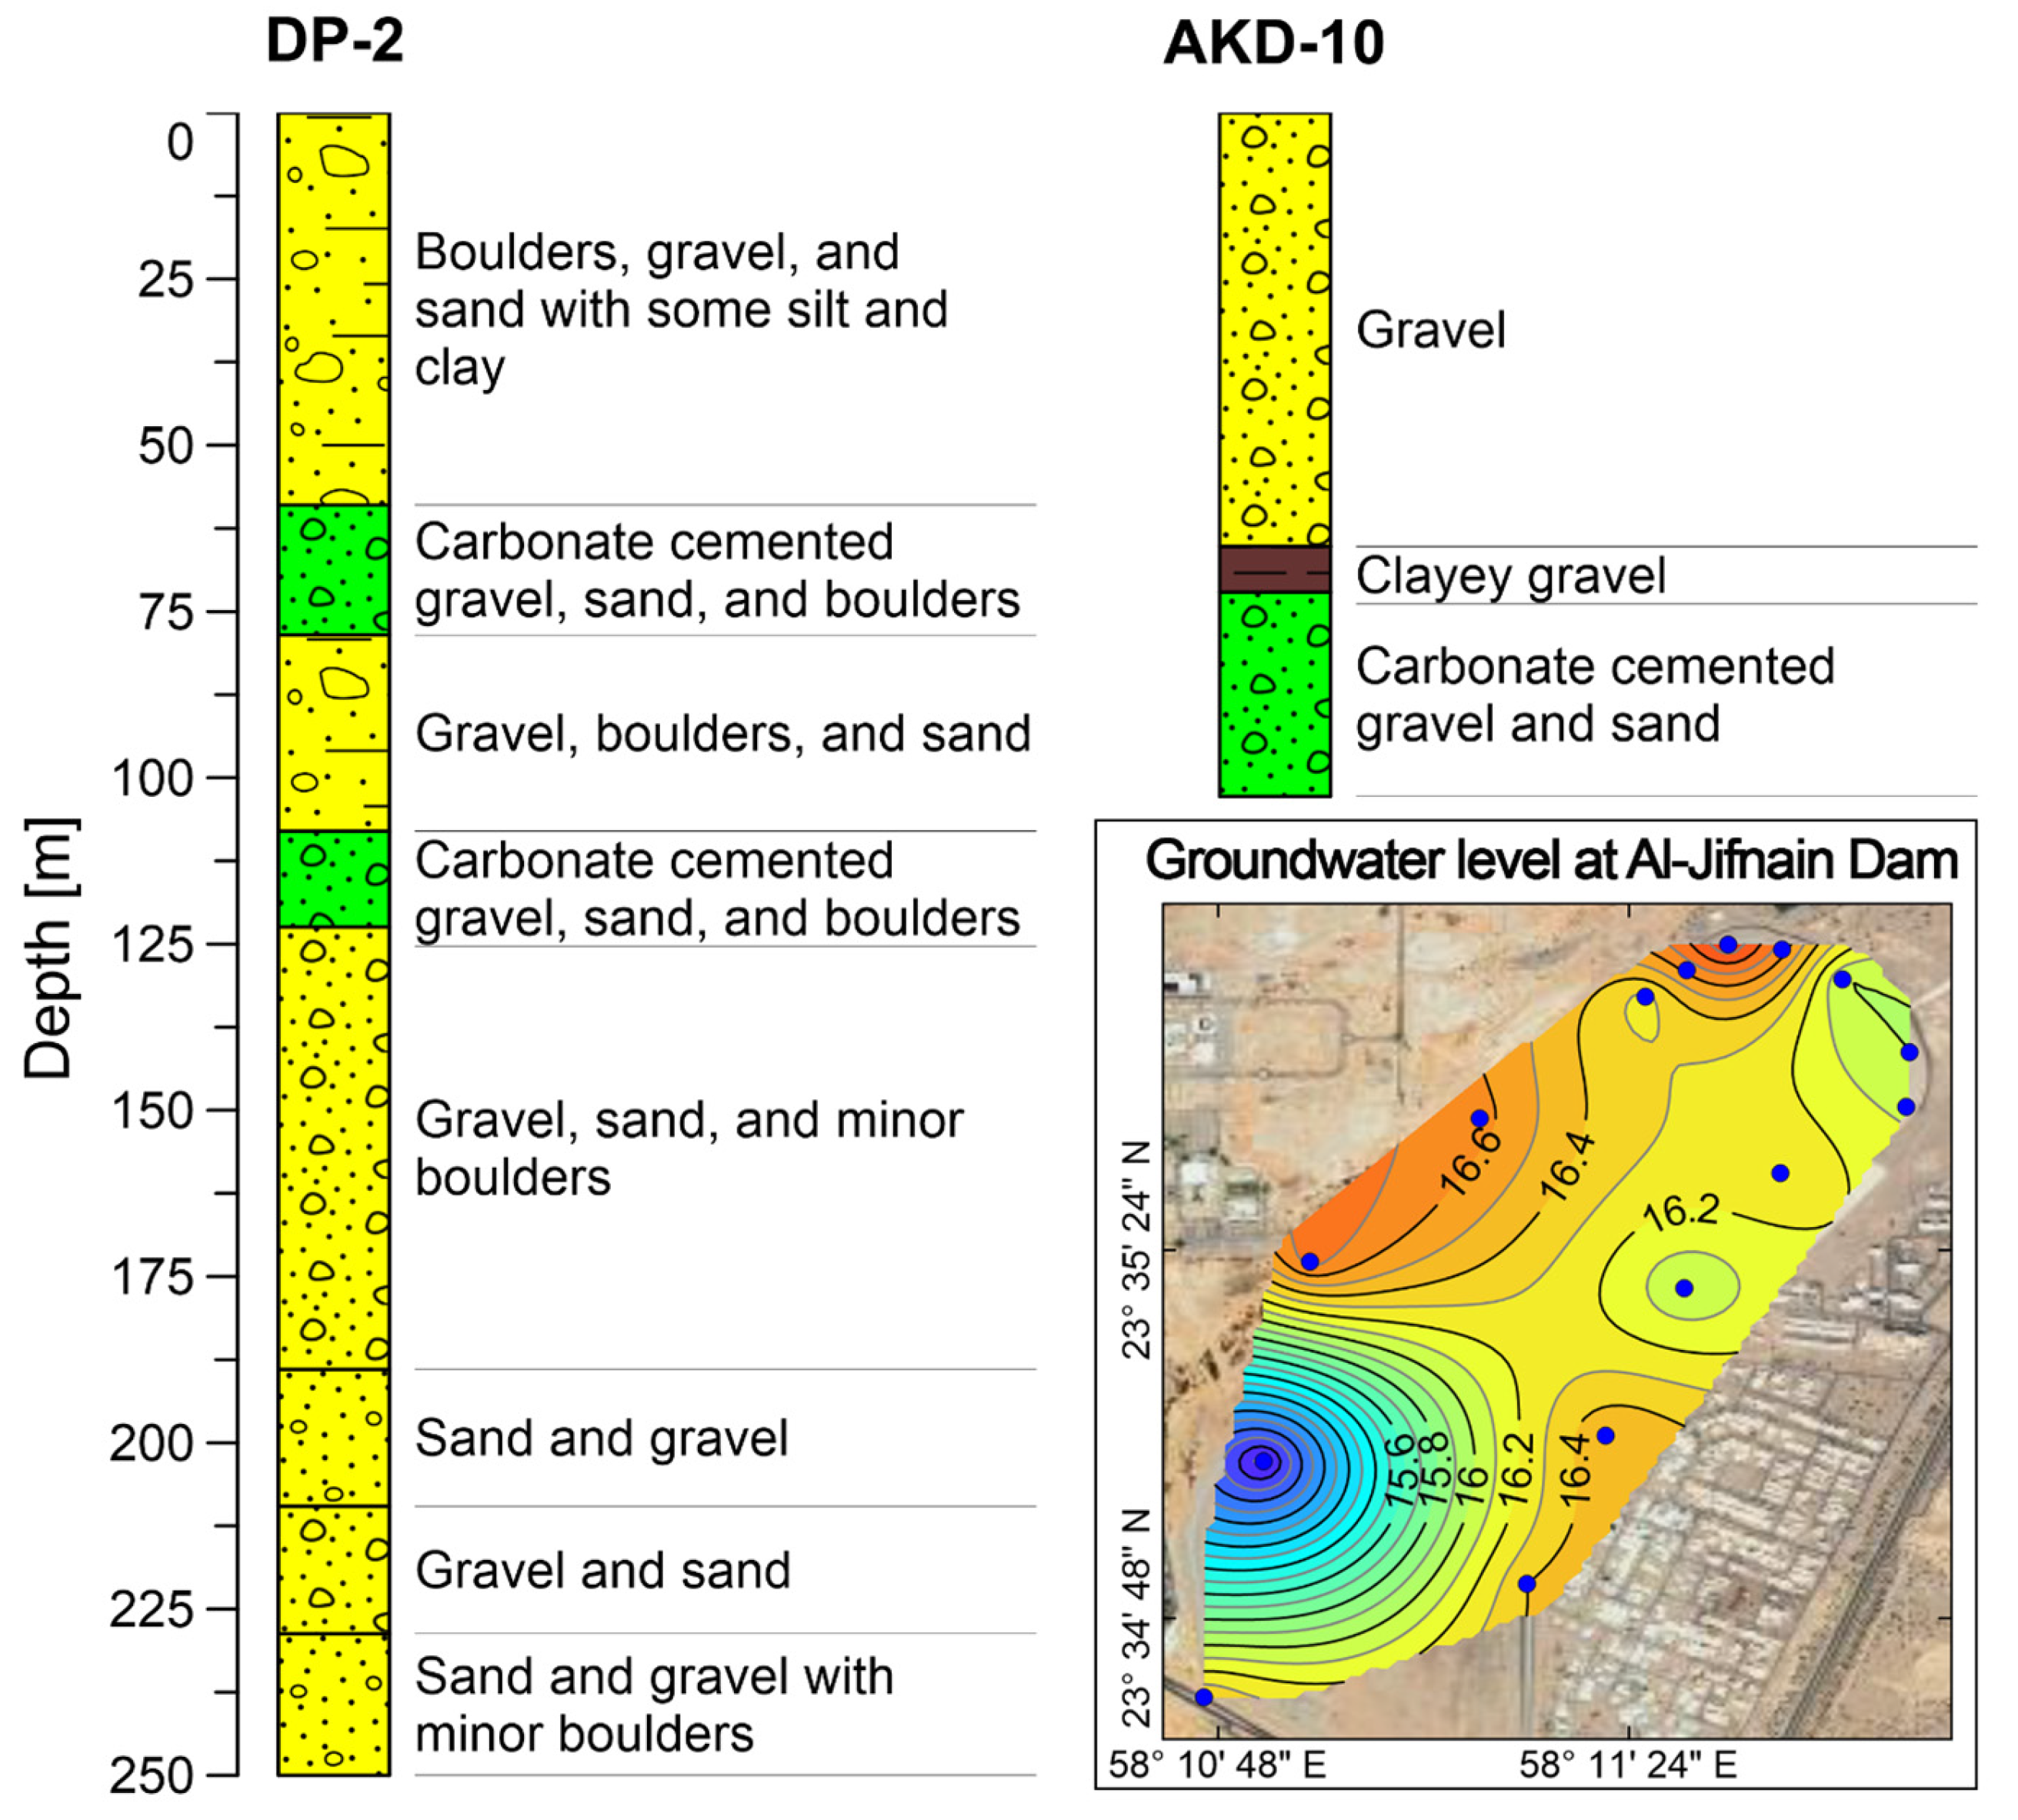
The Al-Batinah Coastal Plain in northern Oman is underlain by a thick sequence of Quaternary alluvial-fan deposits that form a single, deep groundwater basin containing relatively fresh groundwater in the inland areas. Borehole data indicate that these deposits consist predominantly of gravel, sand, and boulders, with interbedded lenses and layers of clayey gravel, silt, and locally cemented gravel (
Figure 4). This alluvial sequence unconformably overlies either Tertiary marine sediments or the Cretaceous ophiolitic basement, depending on the location within the basin [
8].
These alluvial deposits exceed 300 m in thickness across much of the coastal plain and reach a maximum recorded thickness of more than 600 m beneath the alluvial terraces. The aquifer is also characterized by exceptionally high transmissivity, ranging from approximately 3000 to more than 6500 m
2/day [
7]. These hydrogeological properties reflect the dominance of coarse-grained alluvial materials and indicate a strong capacity for groundwater storage and lateral flow. In the vicinity of Al-Jifnain Dam, groundwater-level observations from shallow geotechnical boreholes indicate that the water table lies approximately 14–17 m below ground level (
Figure 4). Despite these favorable aquifer properties, natural groundwater recharge remains limited because of low annual rainfall and recurrent drought. As a result, the aquifer system is highly vulnerable to long-term groundwater depletion caused by intensive abstraction and to seawater intrusion because of its direct hydraulic connection to the Oman Sea [
28,
29].
Figure 4.
Lithological logs from boreholes near the study area [
30]. The inset map (lower right) shows groundwater-level observations from shallow geotechnical boreholes around Al-Jifnain Dam at the southern end of the TEM profiles.
Figure 4.
Lithological logs from boreholes near the study area [
30]. The inset map (lower right) shows groundwater-level observations from shallow geotechnical boreholes around Al-Jifnain Dam at the southern end of the TEM profiles.
Groundwater quality exhibits considerable spatial variability across the Al Batinah Plain. In the mountainous recharge areas, groundwater quality is generally good, with total dissolved solids (TDS) concentrations typically below 1500 mg/L. As groundwater flows toward the coastal plain and lowland areas, water quality progressively deteriorates because of mineral dissolution, particularly from calcium carbonate. Consequently, TDS concentrations increase to approximately 1500–6500 mg/L, especially near major settlements. In the coastal zone, the freshwater aquifer is underlain by a seawater wedge, further increasing the risk of salinization and groundwater-quality degradation [
7].
2.2. Transient Electromagnetic Sounding
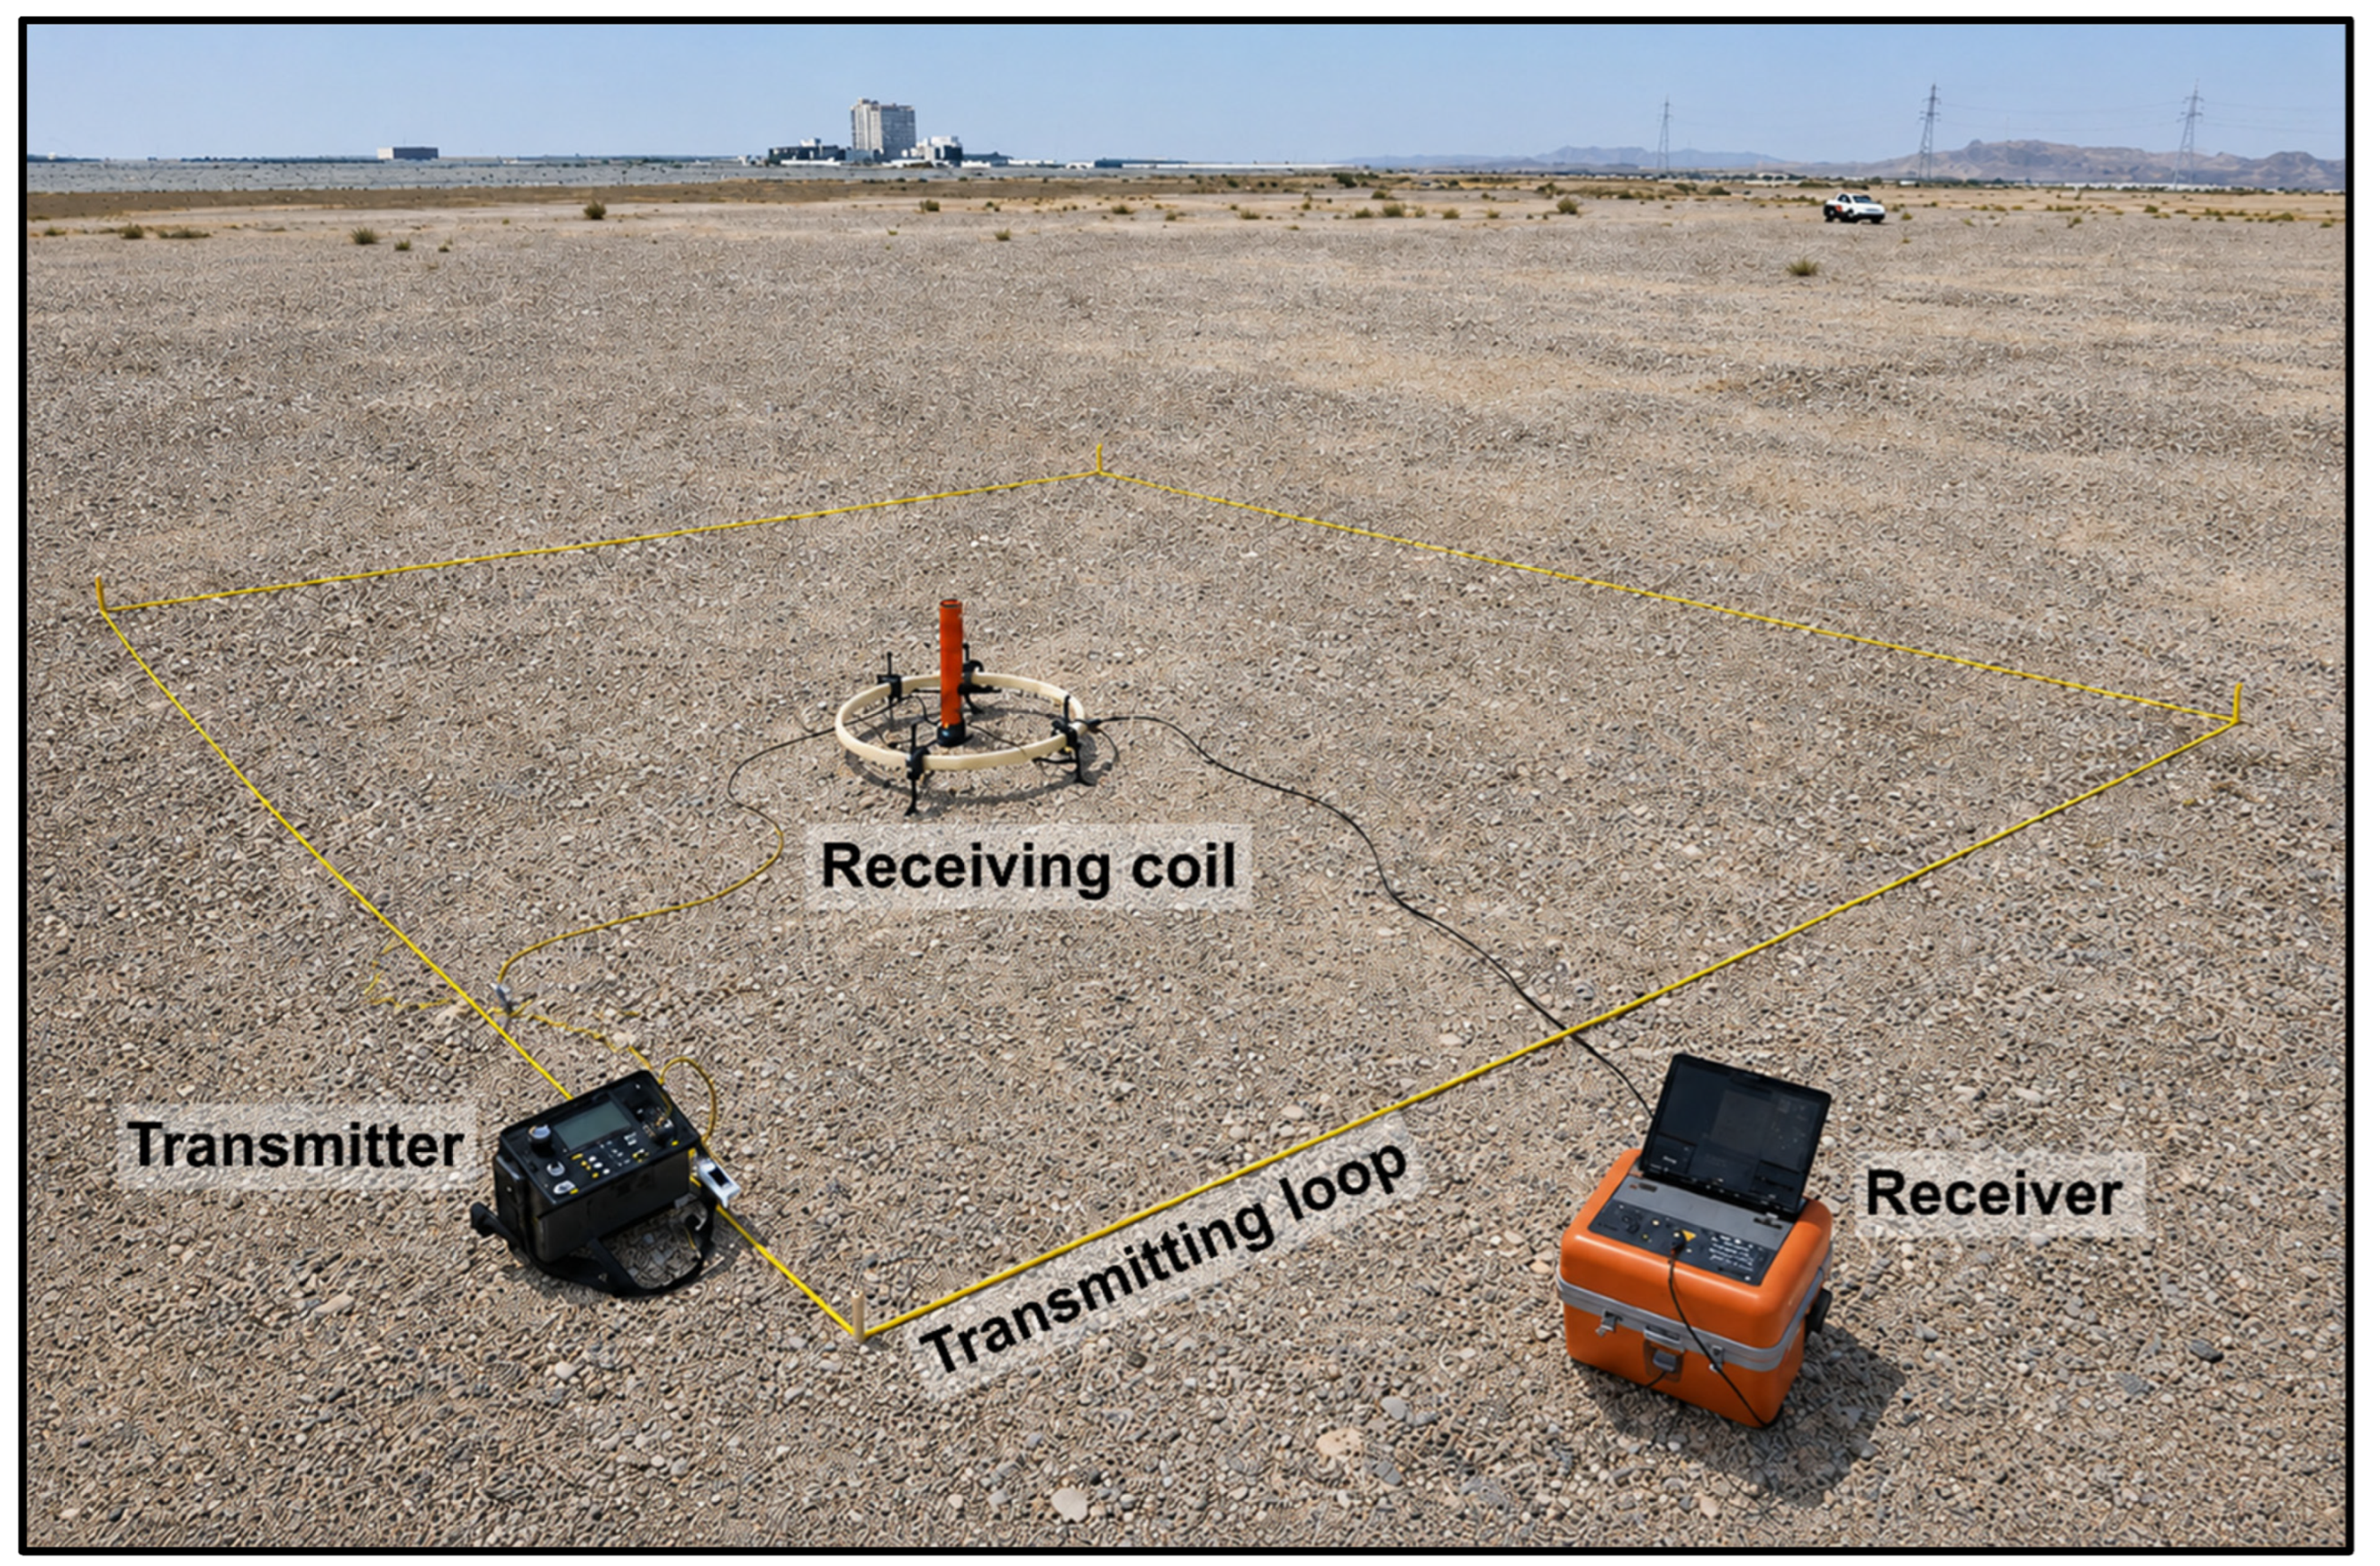
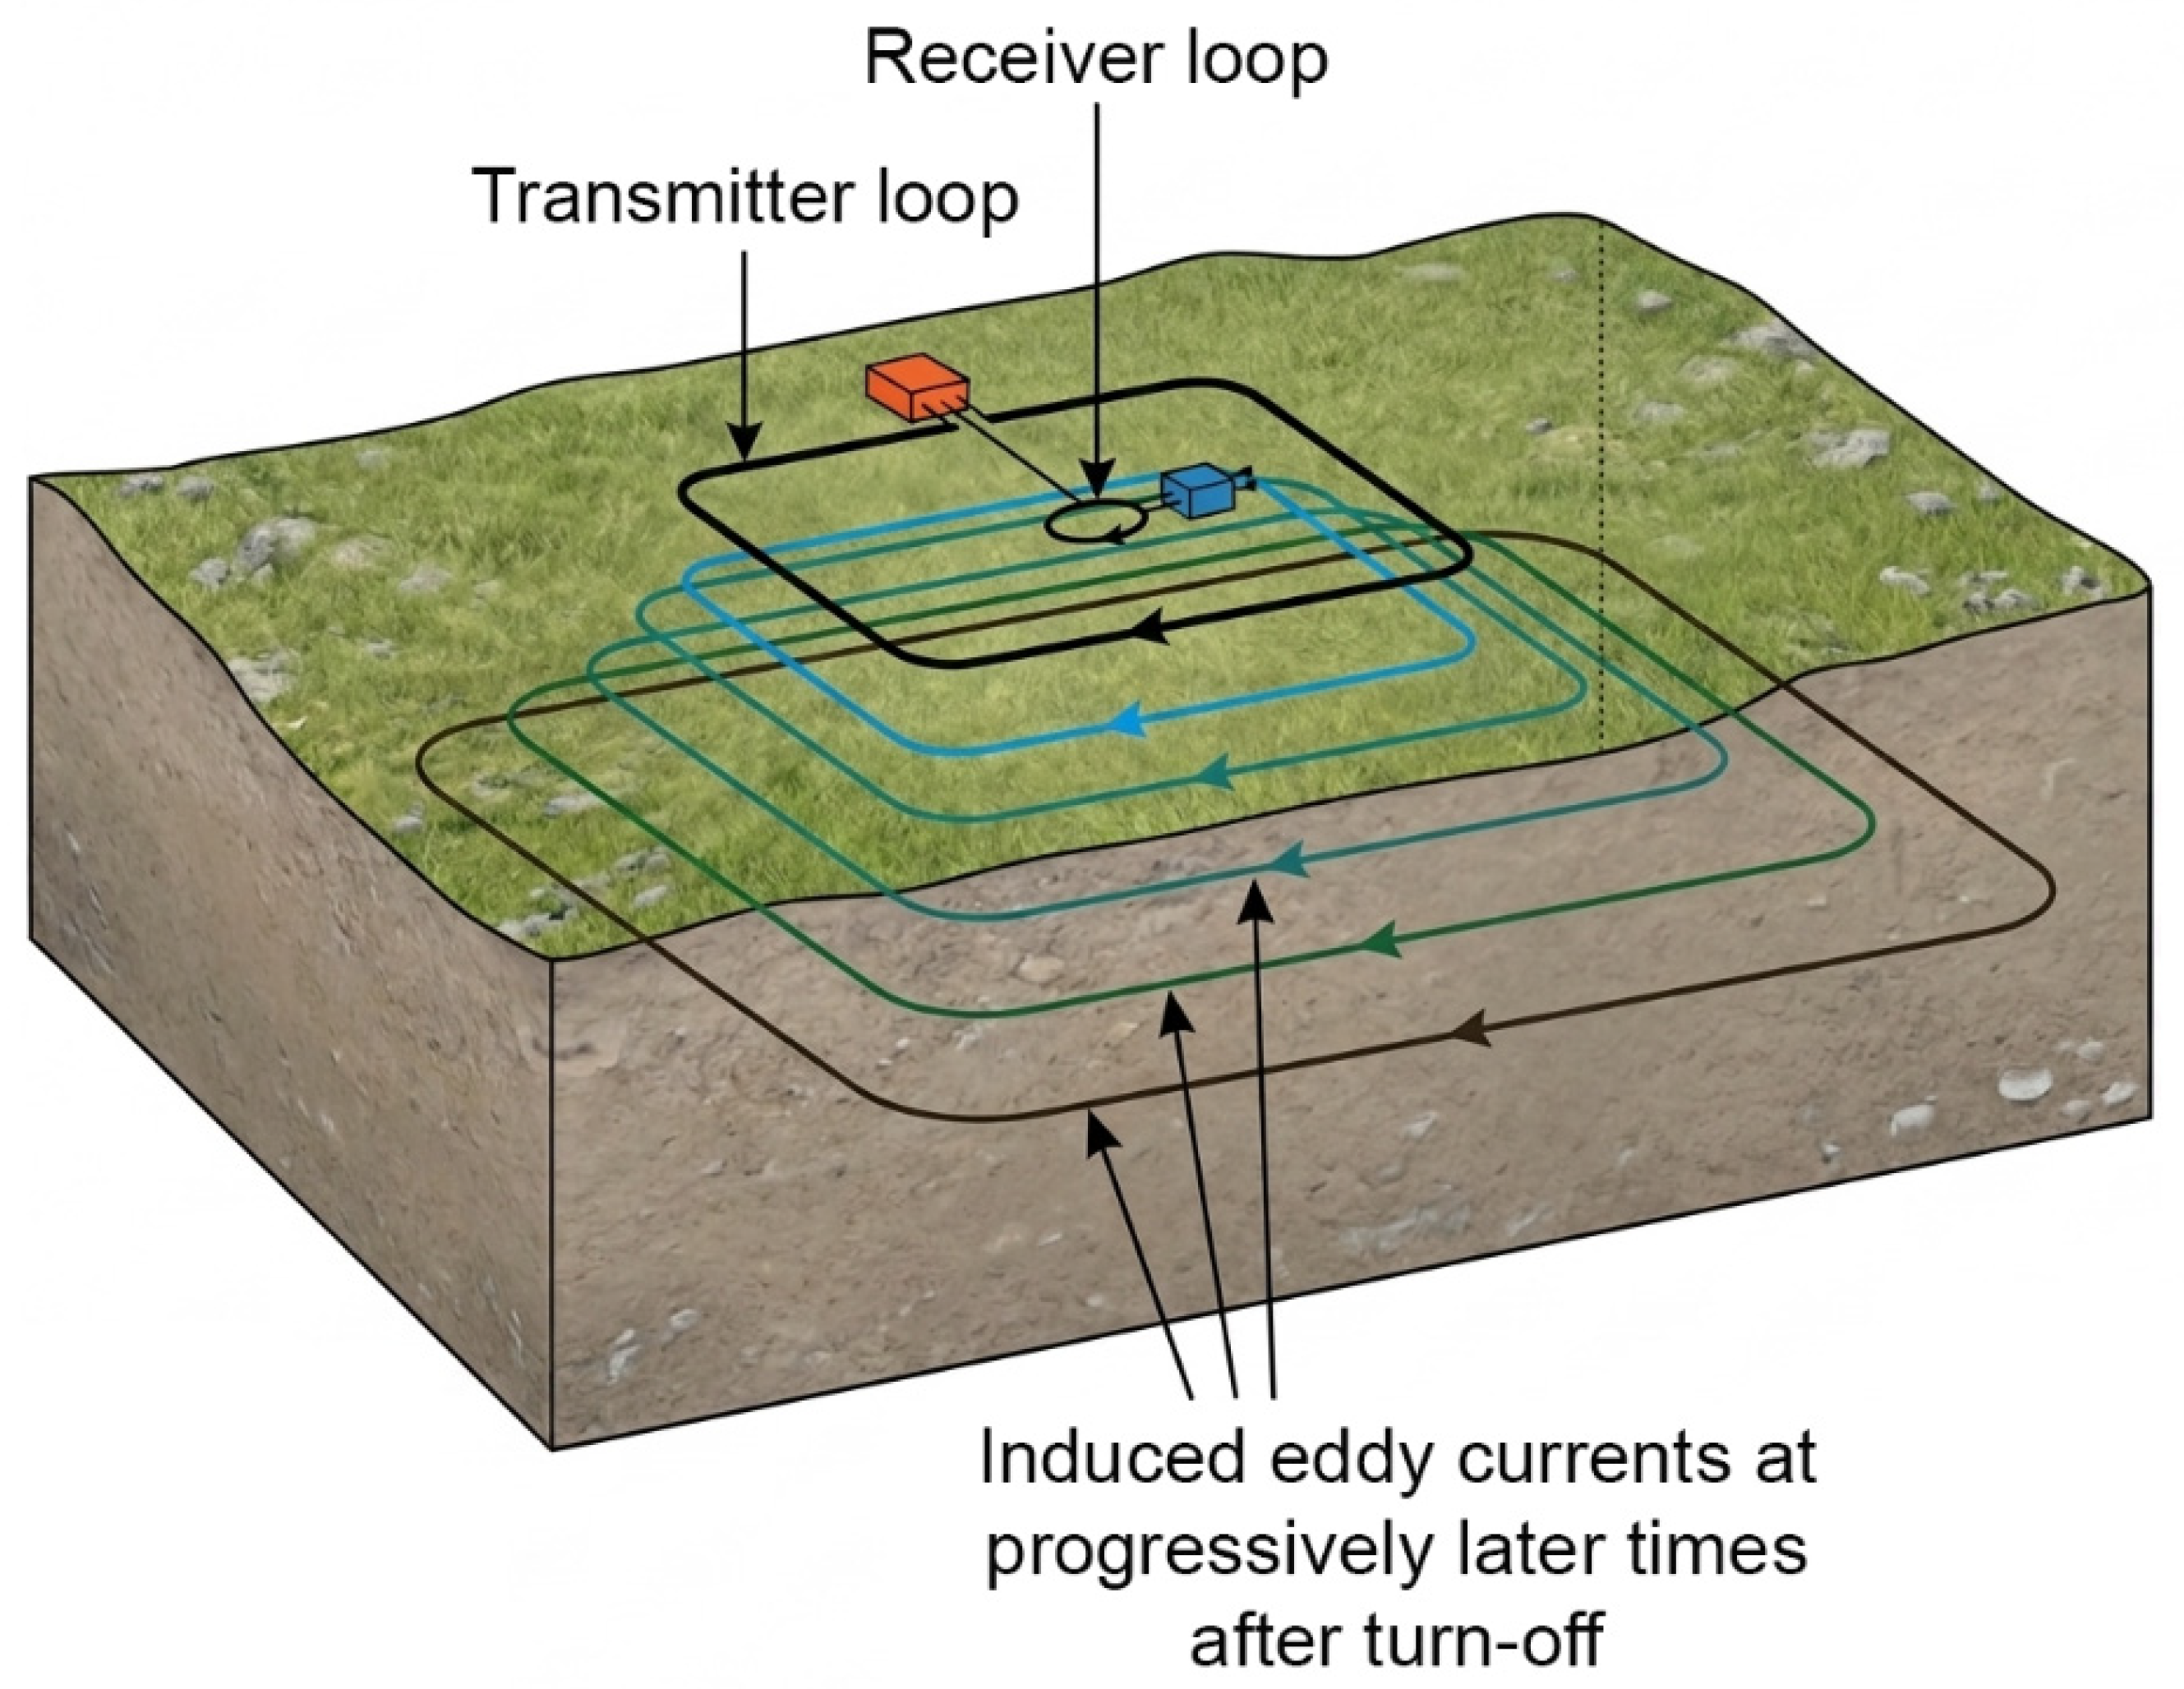
In ground-based TEM soundings, a controlled, time-varying electrical current is transmitted through a square, insulated wire loop placed on Earth’s surface, generating a primary magnetic field that diffuses into the subsurface (
Figure 5). When the transmitter current is abruptly switched off, the rapid collapse of the primary magnetic field induces eddy currents in conductive subsurface materials in accordance with Faraday’s law of electromagnetic induction. These eddy currents propagate outward and downward, with their depth of penetration depending on both the elapsed time since current turn-off and the electrical conductivity of the subsurface. As the induced currents decay, they generate a secondary magnetic field that also decays. A receiver coil is placed either at the center of the transmitter loop (central-loop configuration) or in an off-loop arrangement to measure the transient voltage decay associated with this secondary magnetic field. The analysis of the transient decay response allows estimating subsurface resistivity variations with depth, providing valuable information on geological structures, lithological variations, groundwater occurrence, and salinity distribution [
31,
32].
2.3. TEM Data Acquisition
A total of 45 TEM soundings were acquired at approximately 200 m spacing along four profiles (
Figure 2): P1 (stations 1–23), P2 (stations 24–27), P3 (stations 28–37), and P4 (stations 38–45). Survey locations were selected based on accessibility, logistical considerations, and the need to avoid cultural noise sources such as power lines. Collectively, the four profiles can be projected onto a single transect extending northward from Al-Jifnain Dam in a NE–SW direction approximately perpendicular to the Oman Sea shoreline. This survey geometry was designed to capture lateral resistivity variations associated with saltwater intrusion from the coastal zone toward the dam.
TEM soundings were acquired using a Geonics PROTEM-47 system in a central-loop configuration. The system consisted of a transmitter (Tx) connected to a 20 m × 20 m square loop and a receiver (Rx) equipped with a 1 m multi-turn coil with an effective area of 31.4 m
2, positioned at the center of the Tx loop (
Figure 6). The Tx loop was energized with a current of approximately 3.5 A to generate the primary magnetic field. This primary magnetic field was abruptly terminated using a fast bipolar rectangular waveform with a turn-off time of around 1.4 μs. Following current termination, the decay of the induced secondary magnetic field within the subsurface was recorded. The receiver measured the time derivative of the vertical component of the magnetic flux density (∂
bz/∂t) as an induced voltage in the Rx coil.
To investigate both shallow and deep subsurface resistivity structures, measurements at each sounding were acquired using two base repetition frequencies, 237.5 and 25 Hz. For each frequency, the transient response was sampled over 20 logarithmically spaced time gates, and four repeated measurements were stacked to improve the signal-to-noise ratio. The high-frequency data, which are sensitive to shallow features, correspond to early-time gates ranging from 8.213 × 10
–6 s to 1.346 × 10
–3 s, whereas the low-frequency data, which are sensitive to deeper structures, correspond to late-time gates ranging from 8.950 × 10
–5 s to 7.778 × 10
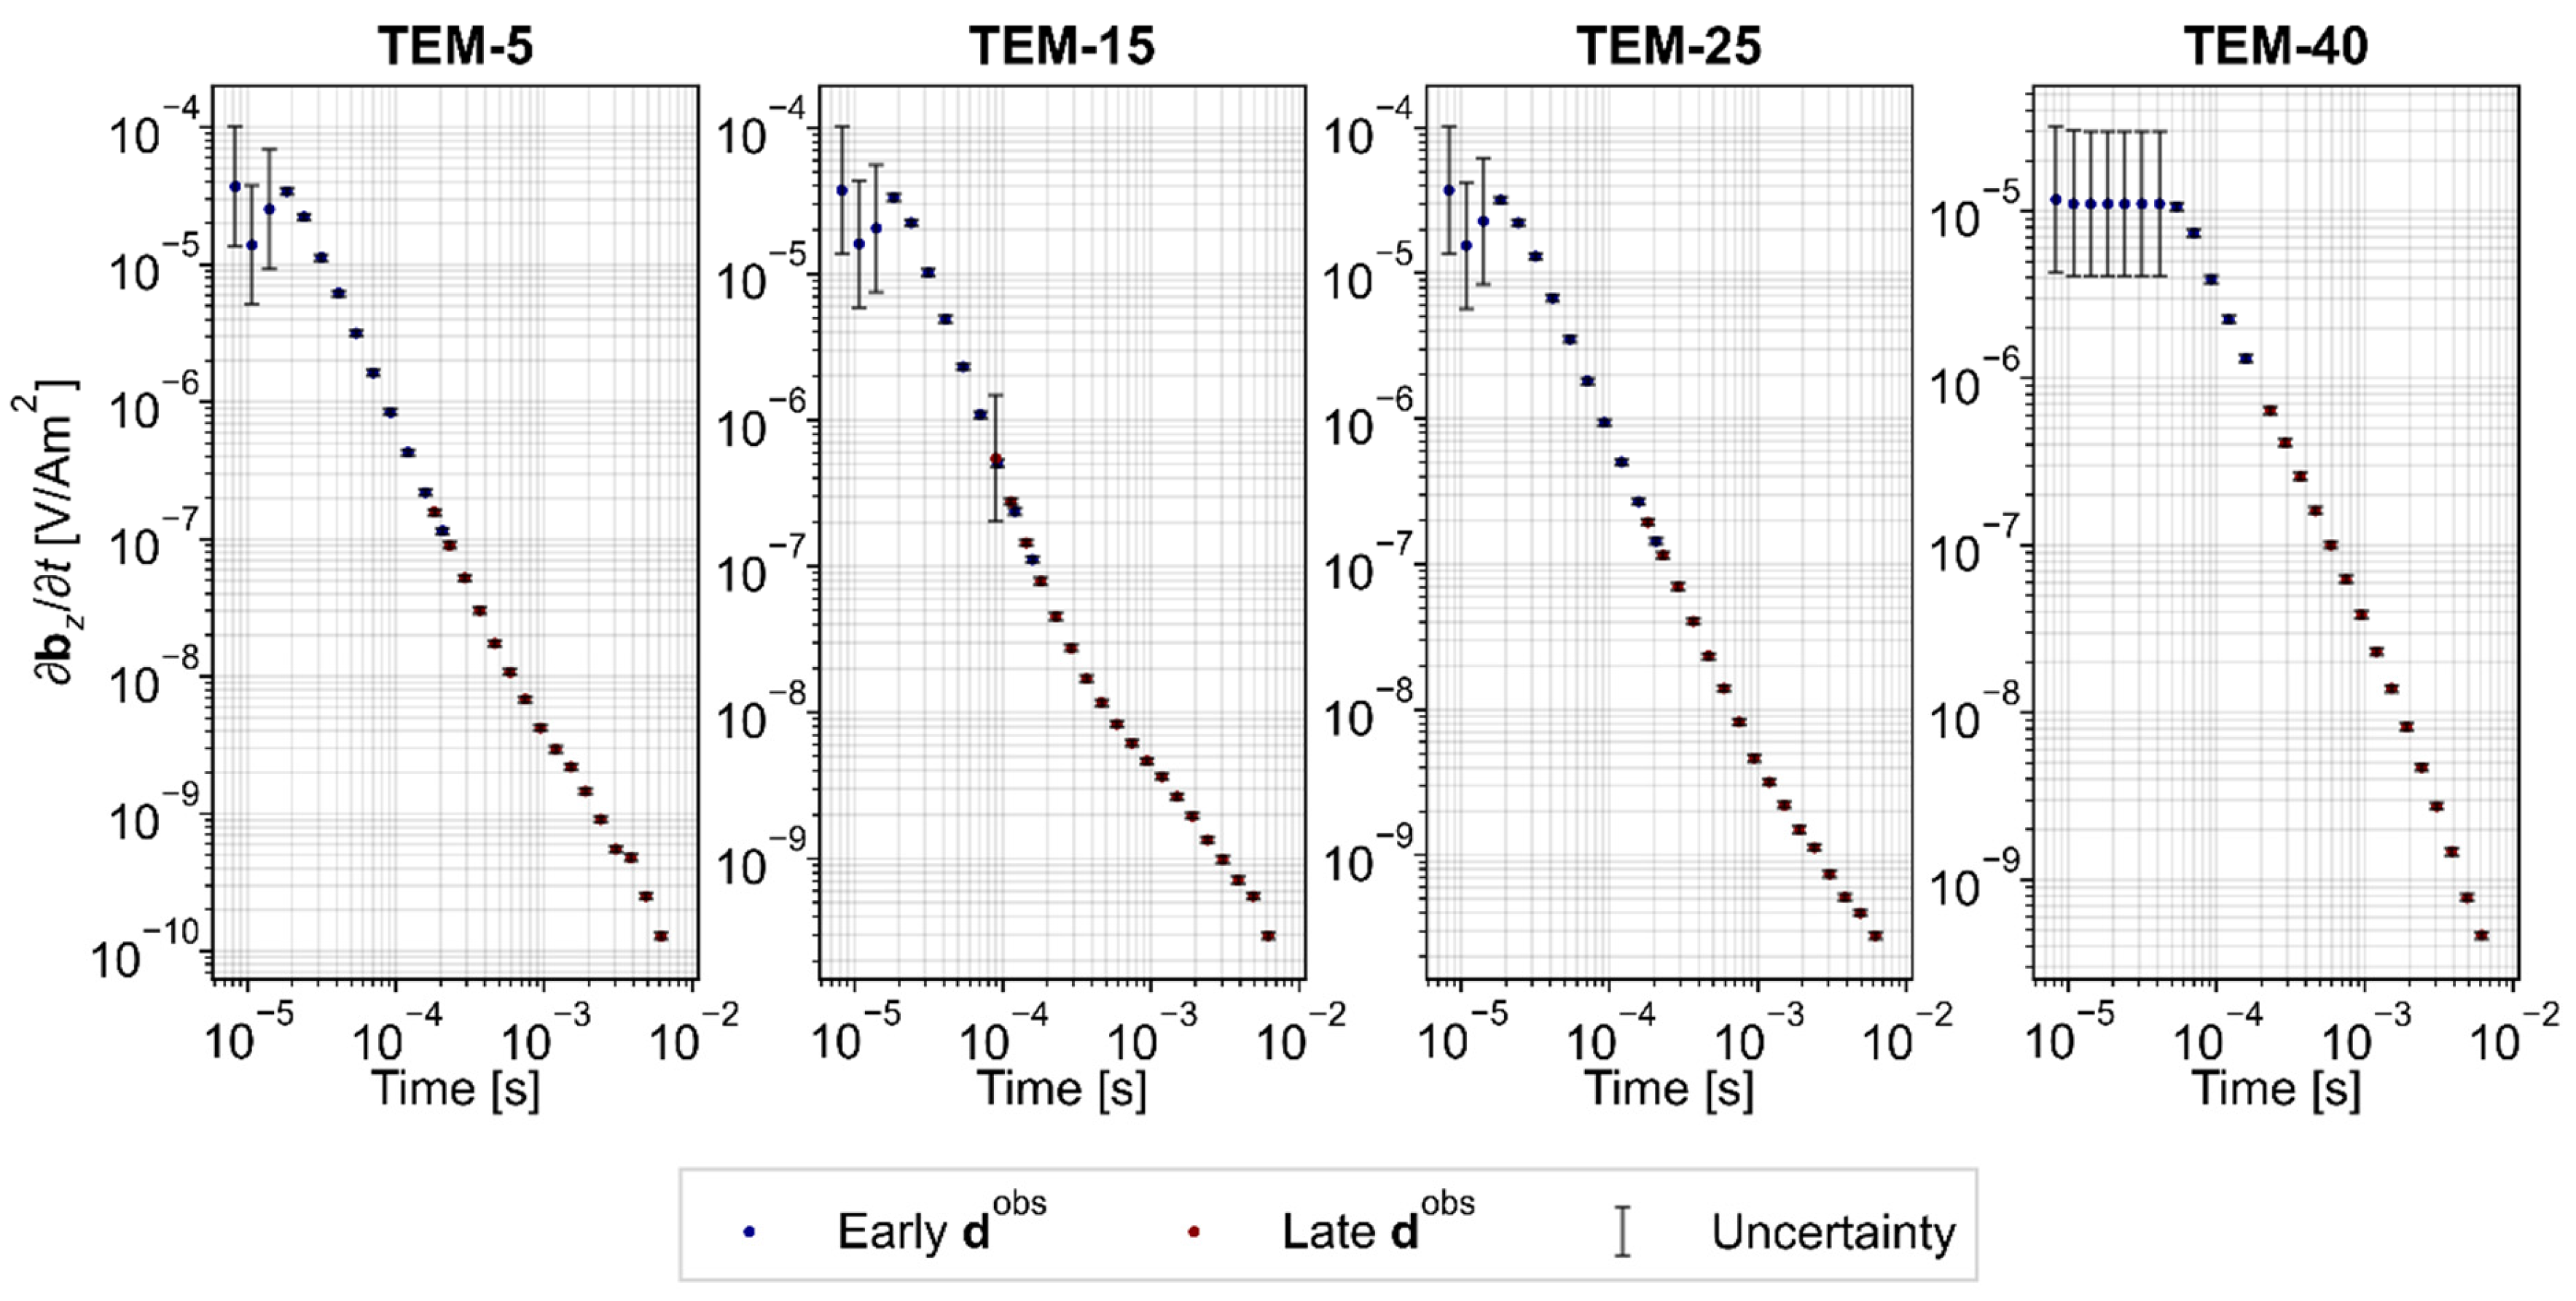
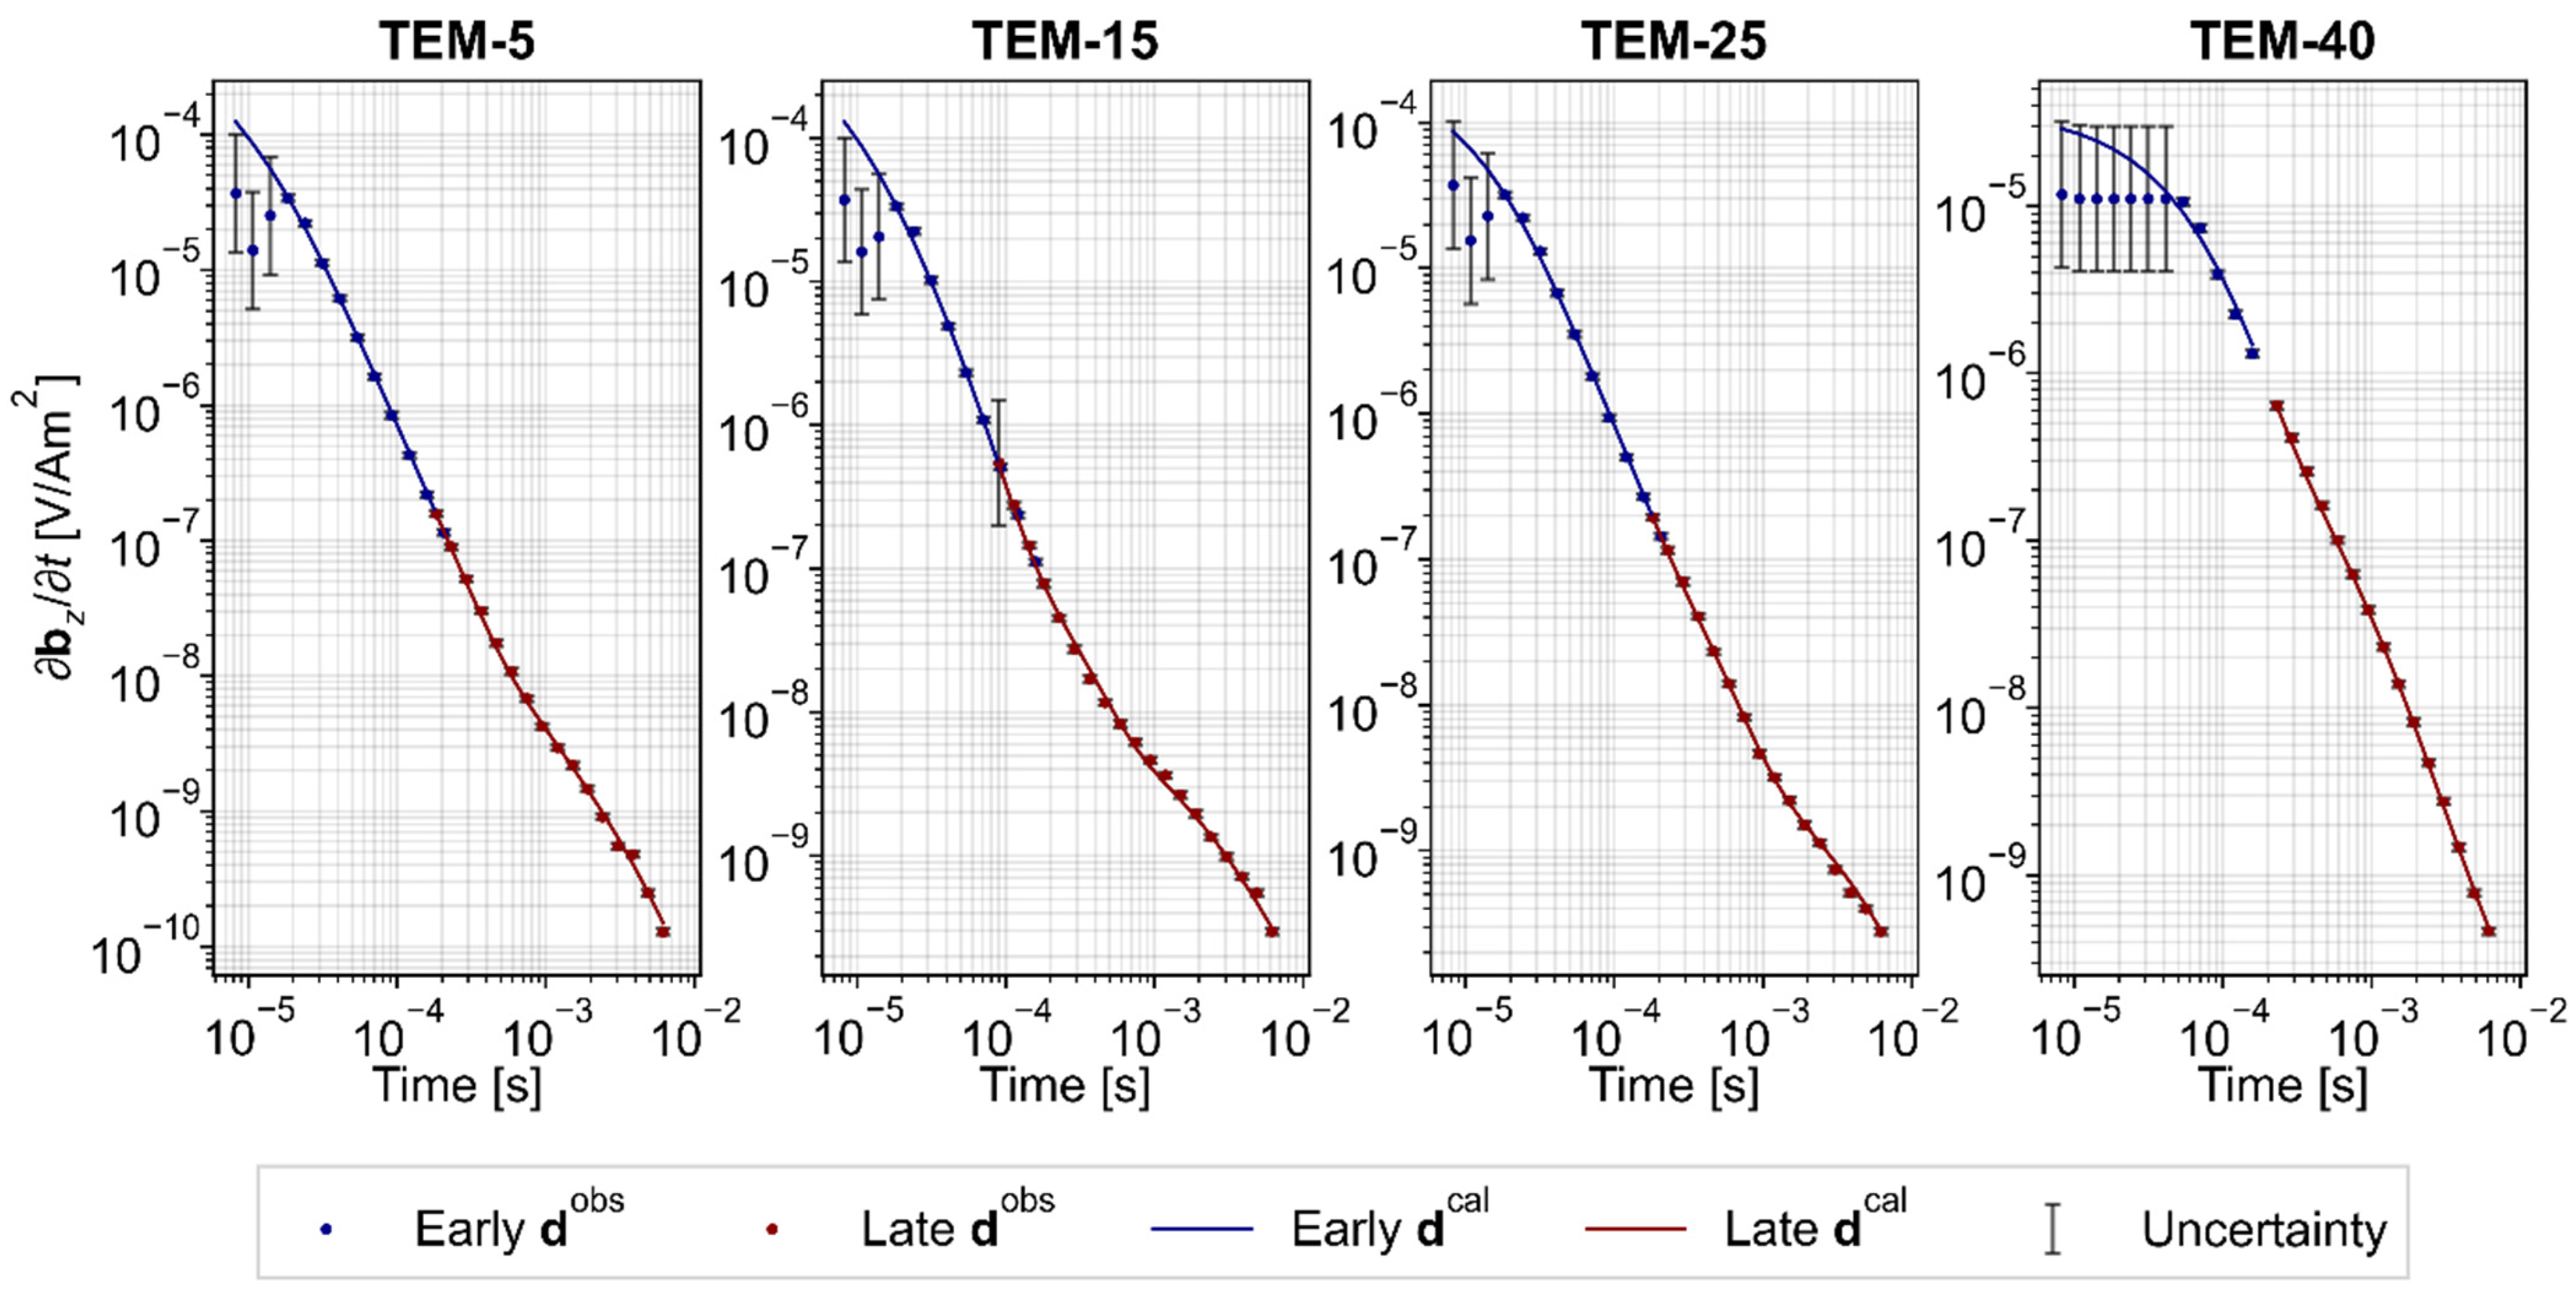
–3 s. At some soundings, the overlapping early- and late-time gates provide redundant measurements that improve the continuity between the shallow and deep depth sensitivities of TEM responses. The resulting TEM decay curves were subsequently normalized with respect to the transmitter current and the effective area of the receiver coil to ensure consistency among soundings during inversion. Examples of normalized TEM decay curves are shown in
Figure 7.
2.4. Laterally Constrained Inversion
The objective of TEM inversion is to reconstruct the subsurface electrical resistivity (or conductivity) distribution from measured TEM responses so that the results can be interpreted in terms of geological structure and hydrogeological conditions [
33,
34]. In this study, an LCI approach was used to invert TEM data acquired along the survey profiles. LCI simultaneously minimizes data misfit while enforcing spatial continuity between neighboring 1D models through regularization, thereby producing laterally coherent and geologically plausible resistivity sections [
26].
The inversion model is obtained by minimizing a total objective function [
35,
36]:
where
is the data misfit term,
is the model objective function, and
is the regularization parameter that controls the balance between data fitting and model regularization.
The data misfit term quantifies the agreement between the observed data and the forward-modeled data, which is defined as follows:
where
is the vector of model parameters (layer resistivities),
is the vector of observed data,
is the forward modeling operator, and
is the data-weighting matrix whose elements are the reciprocals of the estimated standard deviations of the data noise.
The model objective function constrains the inversion through a priori information and regularization terms that control the amount and distribution of structure introduced into the model. In the LCI scheme, it is formulated as the sum of three components [
37]:
The first term, , penalizes deviations of the inverted model parameters from the reference model, , which incorporates a priori information. The second term, , forms the basis of the LCI approach by enforcing lateral smoothness between corresponding layers in neighboring 1D models, thereby suppressing unrealistic abrupt lateral variations. The third term, , imposes vertical smoothness between adjacent layers within each 1D model. The matrices , , and are model-weighting matrices that assign prior confidence to specific parts of the model, whereas and are first-order difference operators defining the lateral and vertical parameter gradients, respectively. The factors , , and control the relative contribution of each term to the model objective function.
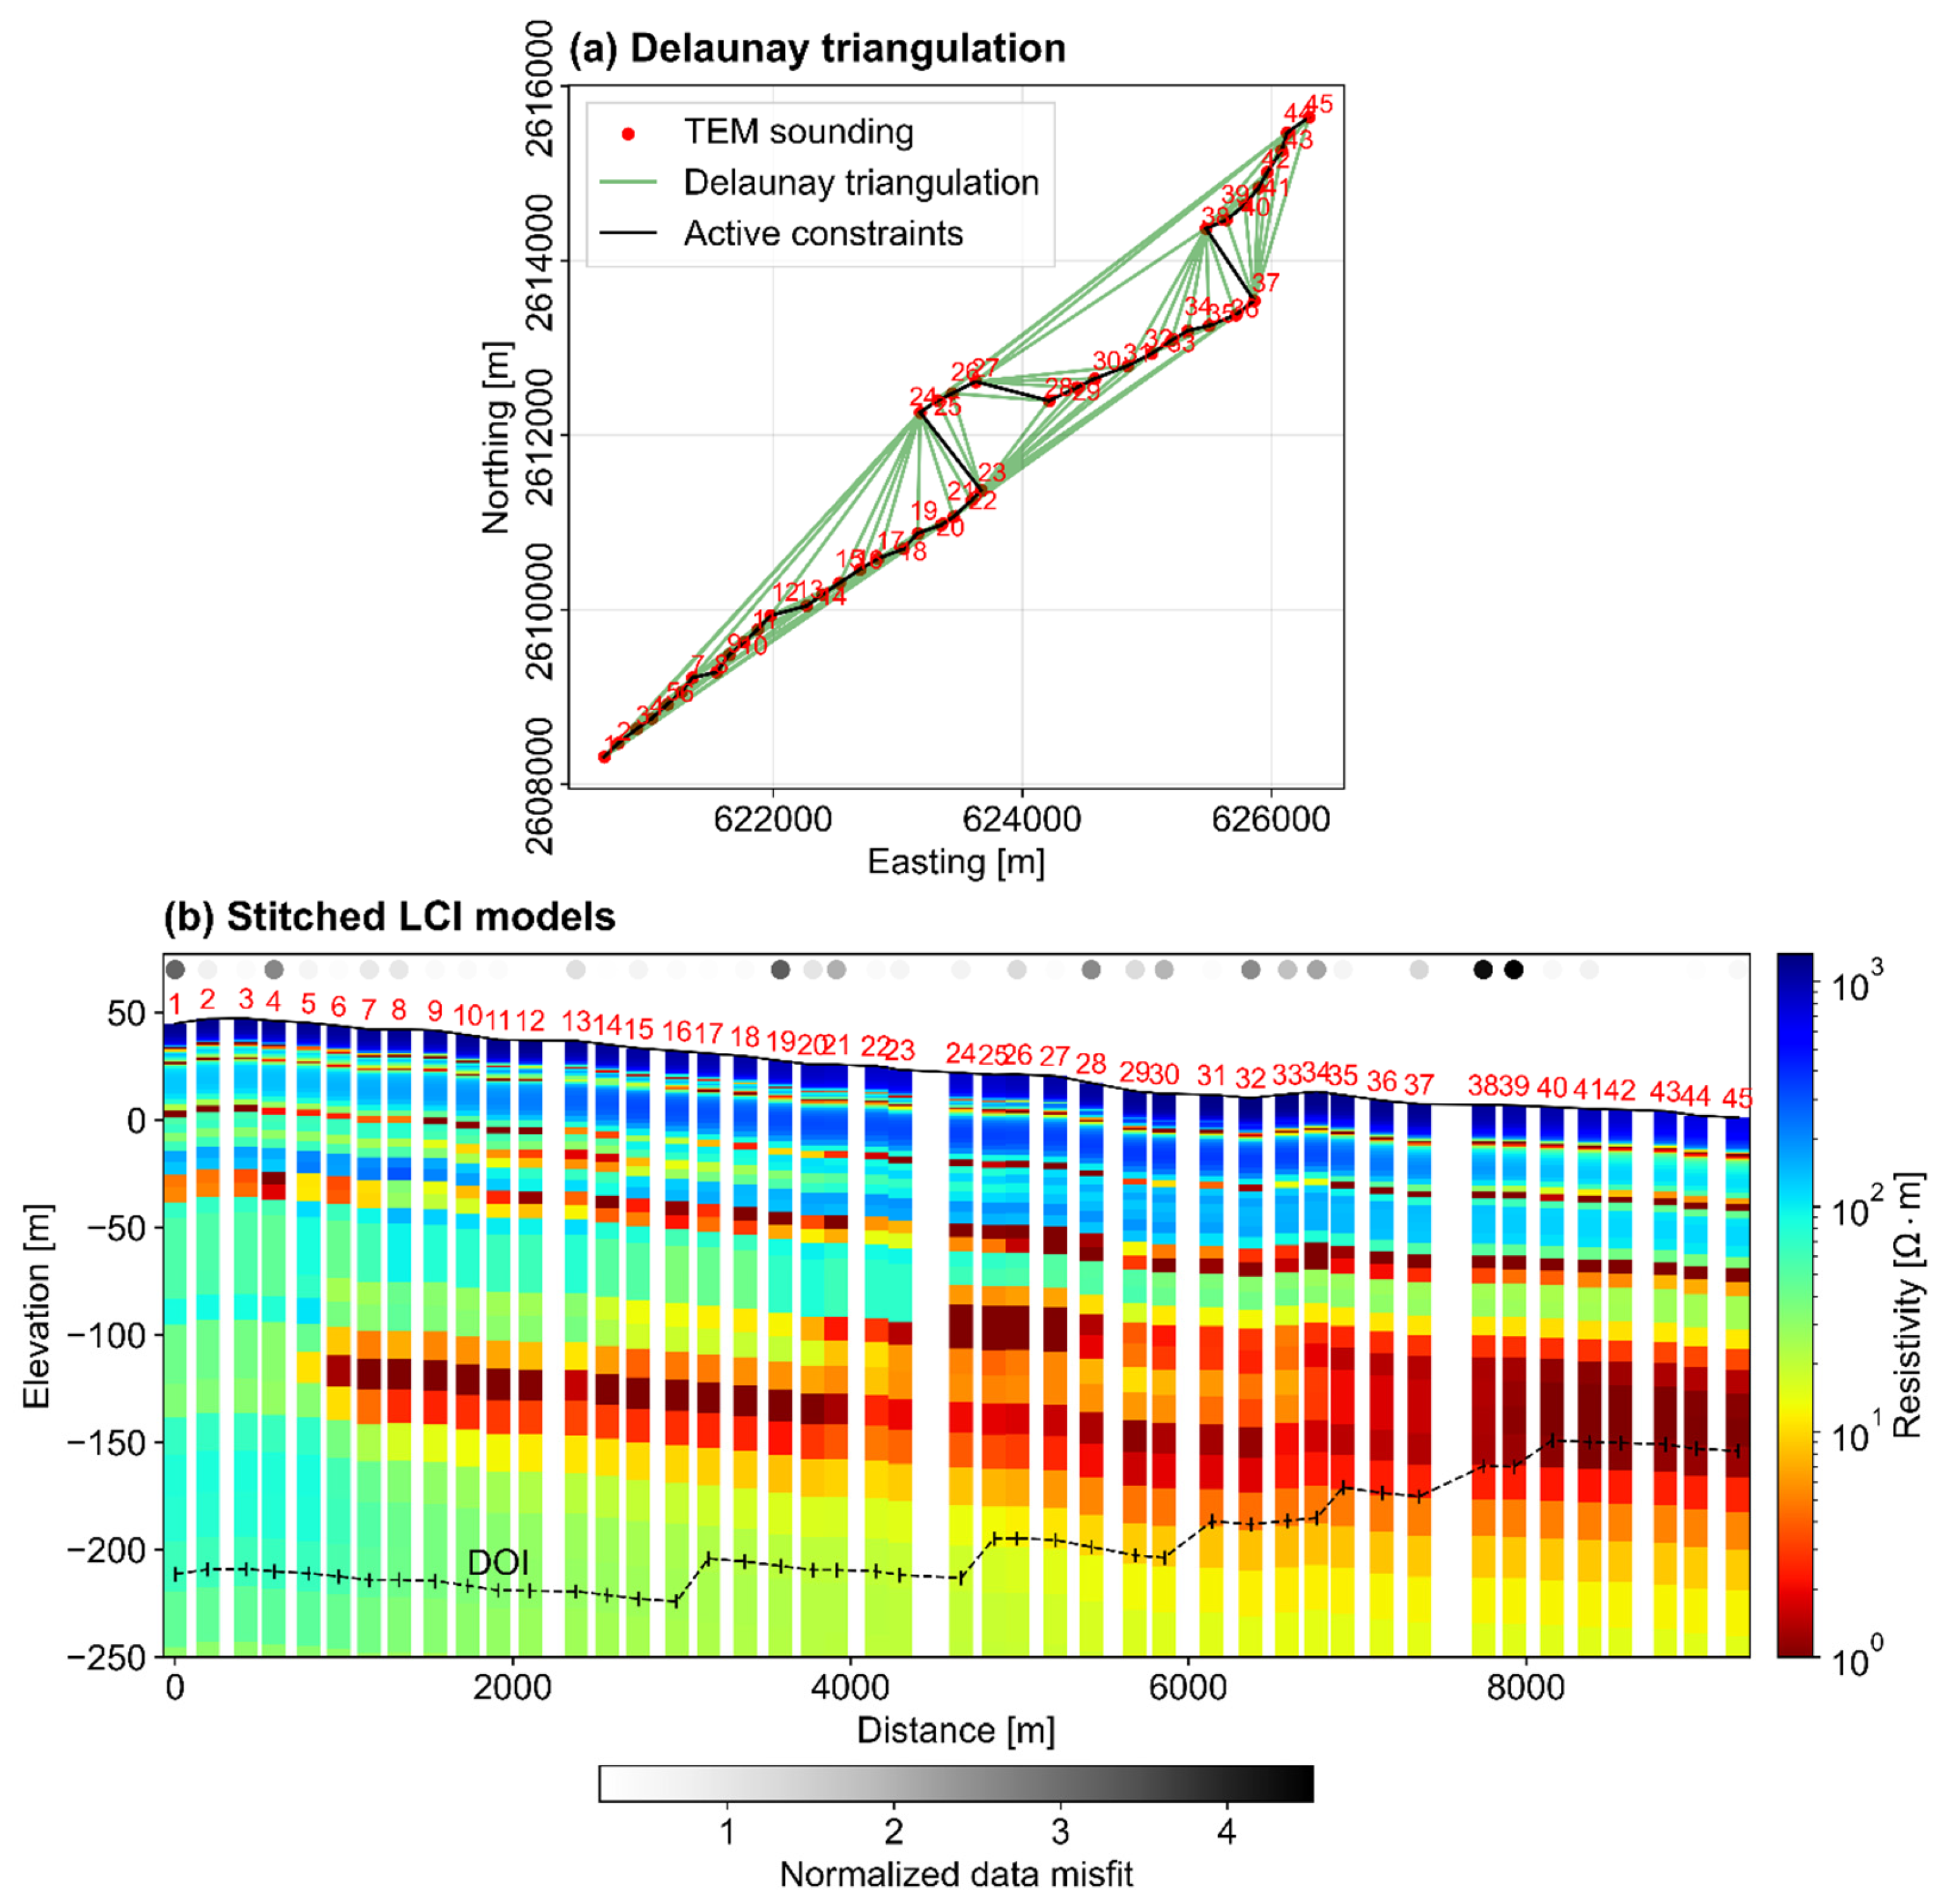
The strength of the lateral smoothness constraint depends on the distance between neighboring 1D models. Delaunay triangulation is used to define these neighboring models by constructing an unstructured nearest-neighbor network based on the spatial distribution of the soundings, thereby enabling the application of lateral smoothness across profiles or between irregularly distributed stations.
Because the relationship between model parameters and observed data is nonlinear, the minimum of the objective function cannot be obtained in a single step. Instead, the solution is computed iteratively using the Gauss–Newton optimization method [
38,
39]. Each iteration consists of forward modeling, sensitivity calculation, and model updating. The inversion continues until a predefined convergence criterion is reached, such as achieving the target data misfit, negligible changes in the objective function, or model parameters between successive iterations, or reaching a predetermined maximum number of iterations.
3. Results
Prior to inversion, all normalized TEM decay curves were carefully examined to identify noisy or unreliable measurements. This involved detecting negative responses and data points exhibiting abnormal slopes, irregular curvature, or significant scatter relative to the expected monotonic decay trend. Rather than removing these poor-quality measurements, they were retained and assigned high uncertainties equal to 100% of their absolute values during inversion. In contrast, high-quality data were assigned uncertainties equal to 5% of their absolute values. The uncertainty assigned to selected soundings is illustrated by the vertical gray error bars in
Figure 7. This strategy allows the inversion to fit the most reliable data preferentially while downweighting noisy measurements without discarding potentially useful information they may contain.
To handle the overlapping measurements, the early- and late-time datasets were treated as two independent TEM datasets corresponding to the same subsurface resistivity model. During the LCI, each dataset was assigned to an independent forward operator, allowing the forward responses for both frequencies to be computed simultaneously. All measurements were then jointly inverted to recover a single resistivity model that satisfies both datasets. This approach preserves all measured information while avoiding any bias that could be introduced through preprocessing steps such as merging, averaging, or removing the overlapping data points.
Before the main LCI run, a preliminary inversion of each sounding was performed independently using a single-layer (homogeneous half-space) parameterization and a maximum of 20 iterations. This preliminary inversion yielded half-space resistivities ranging from approximately 5 to 30 Ω·m, with an average value of 17.76 Ω·m, consistent with the expected low resistivities of an alluvial aquifer influenced by salinity. These values were subsequently used as both the starting and reference models for the main LCI. Using data-derived resistivities rather than arbitrarily chosen values improves inversion stability, accelerates convergence, and reduces the likelihood of inversion artifacts associated with inappropriate initial conditions.
For the main LCI run, the subsurface beneath each sounding was parameterized as a series of stitched 1D layered-earth models using identical vertical meshes. To capture high-resolution near-surface structure, where the electromagnetic field varies rapidly, and TEM sensitivity is greatest, the upper part of the mesh was discretized into 1 m thick layers down to a depth of 20 m. This interval covers the theoretical minimum electromagnetic diffusion depth for the average preliminary half-space resistivity (~15.24 m). Although some soundings exhibited high uncertainties in the early-time data, many others provided reliable shallow information that justified the fine near-surface discretization. Furthermore, the LCI framework exploits lateral continuity between neighboring soundings, allowing shallow structures resolved from soundings with reliable early-time responses to constrain adjacent soundings with poorer data quality. Consequently, the fine mesh preserves the ability to resolve shallow features where supported by the data while maintaining stable and geologically consistent models in areas affected by noisy early-time measurements. Below 20 m depth, layer thickness increased logarithmically using a geometric expansion factor of 1.1 to the base of the mesh at 1076.19 m depth. This maximum depth corresponds to approximately twice the maximum diffusion depth and satisfies boundary-condition requirements in a depth range where TEM resolution naturally decreases. Lateral constraints between neighboring models were defined using Delaunay triangulation based on the distances between adjacent soundings (Figure 10a).
Regularization parameters were selected following a sensitivity analysis involving multiple inversion runs with different combinations of αs, αz, and αr. The selected values αs = 0.1, αz = 0.1, and αr = 20 offered the best trade-off between data fit, model smoothness, and geological plausibility expected in a sedimentary environment. The β-ratio was initially set to a large value of 5 and decreased stepwise by a factor of two every three iterations. This approach stabilizes the inversion by favoring models that respect the regularization constraints and develop robust large-scale structures in the early iterations, while progressively improving the data fit in later iterations. In this way, the inversion avoids both under-regularization and overfitting.
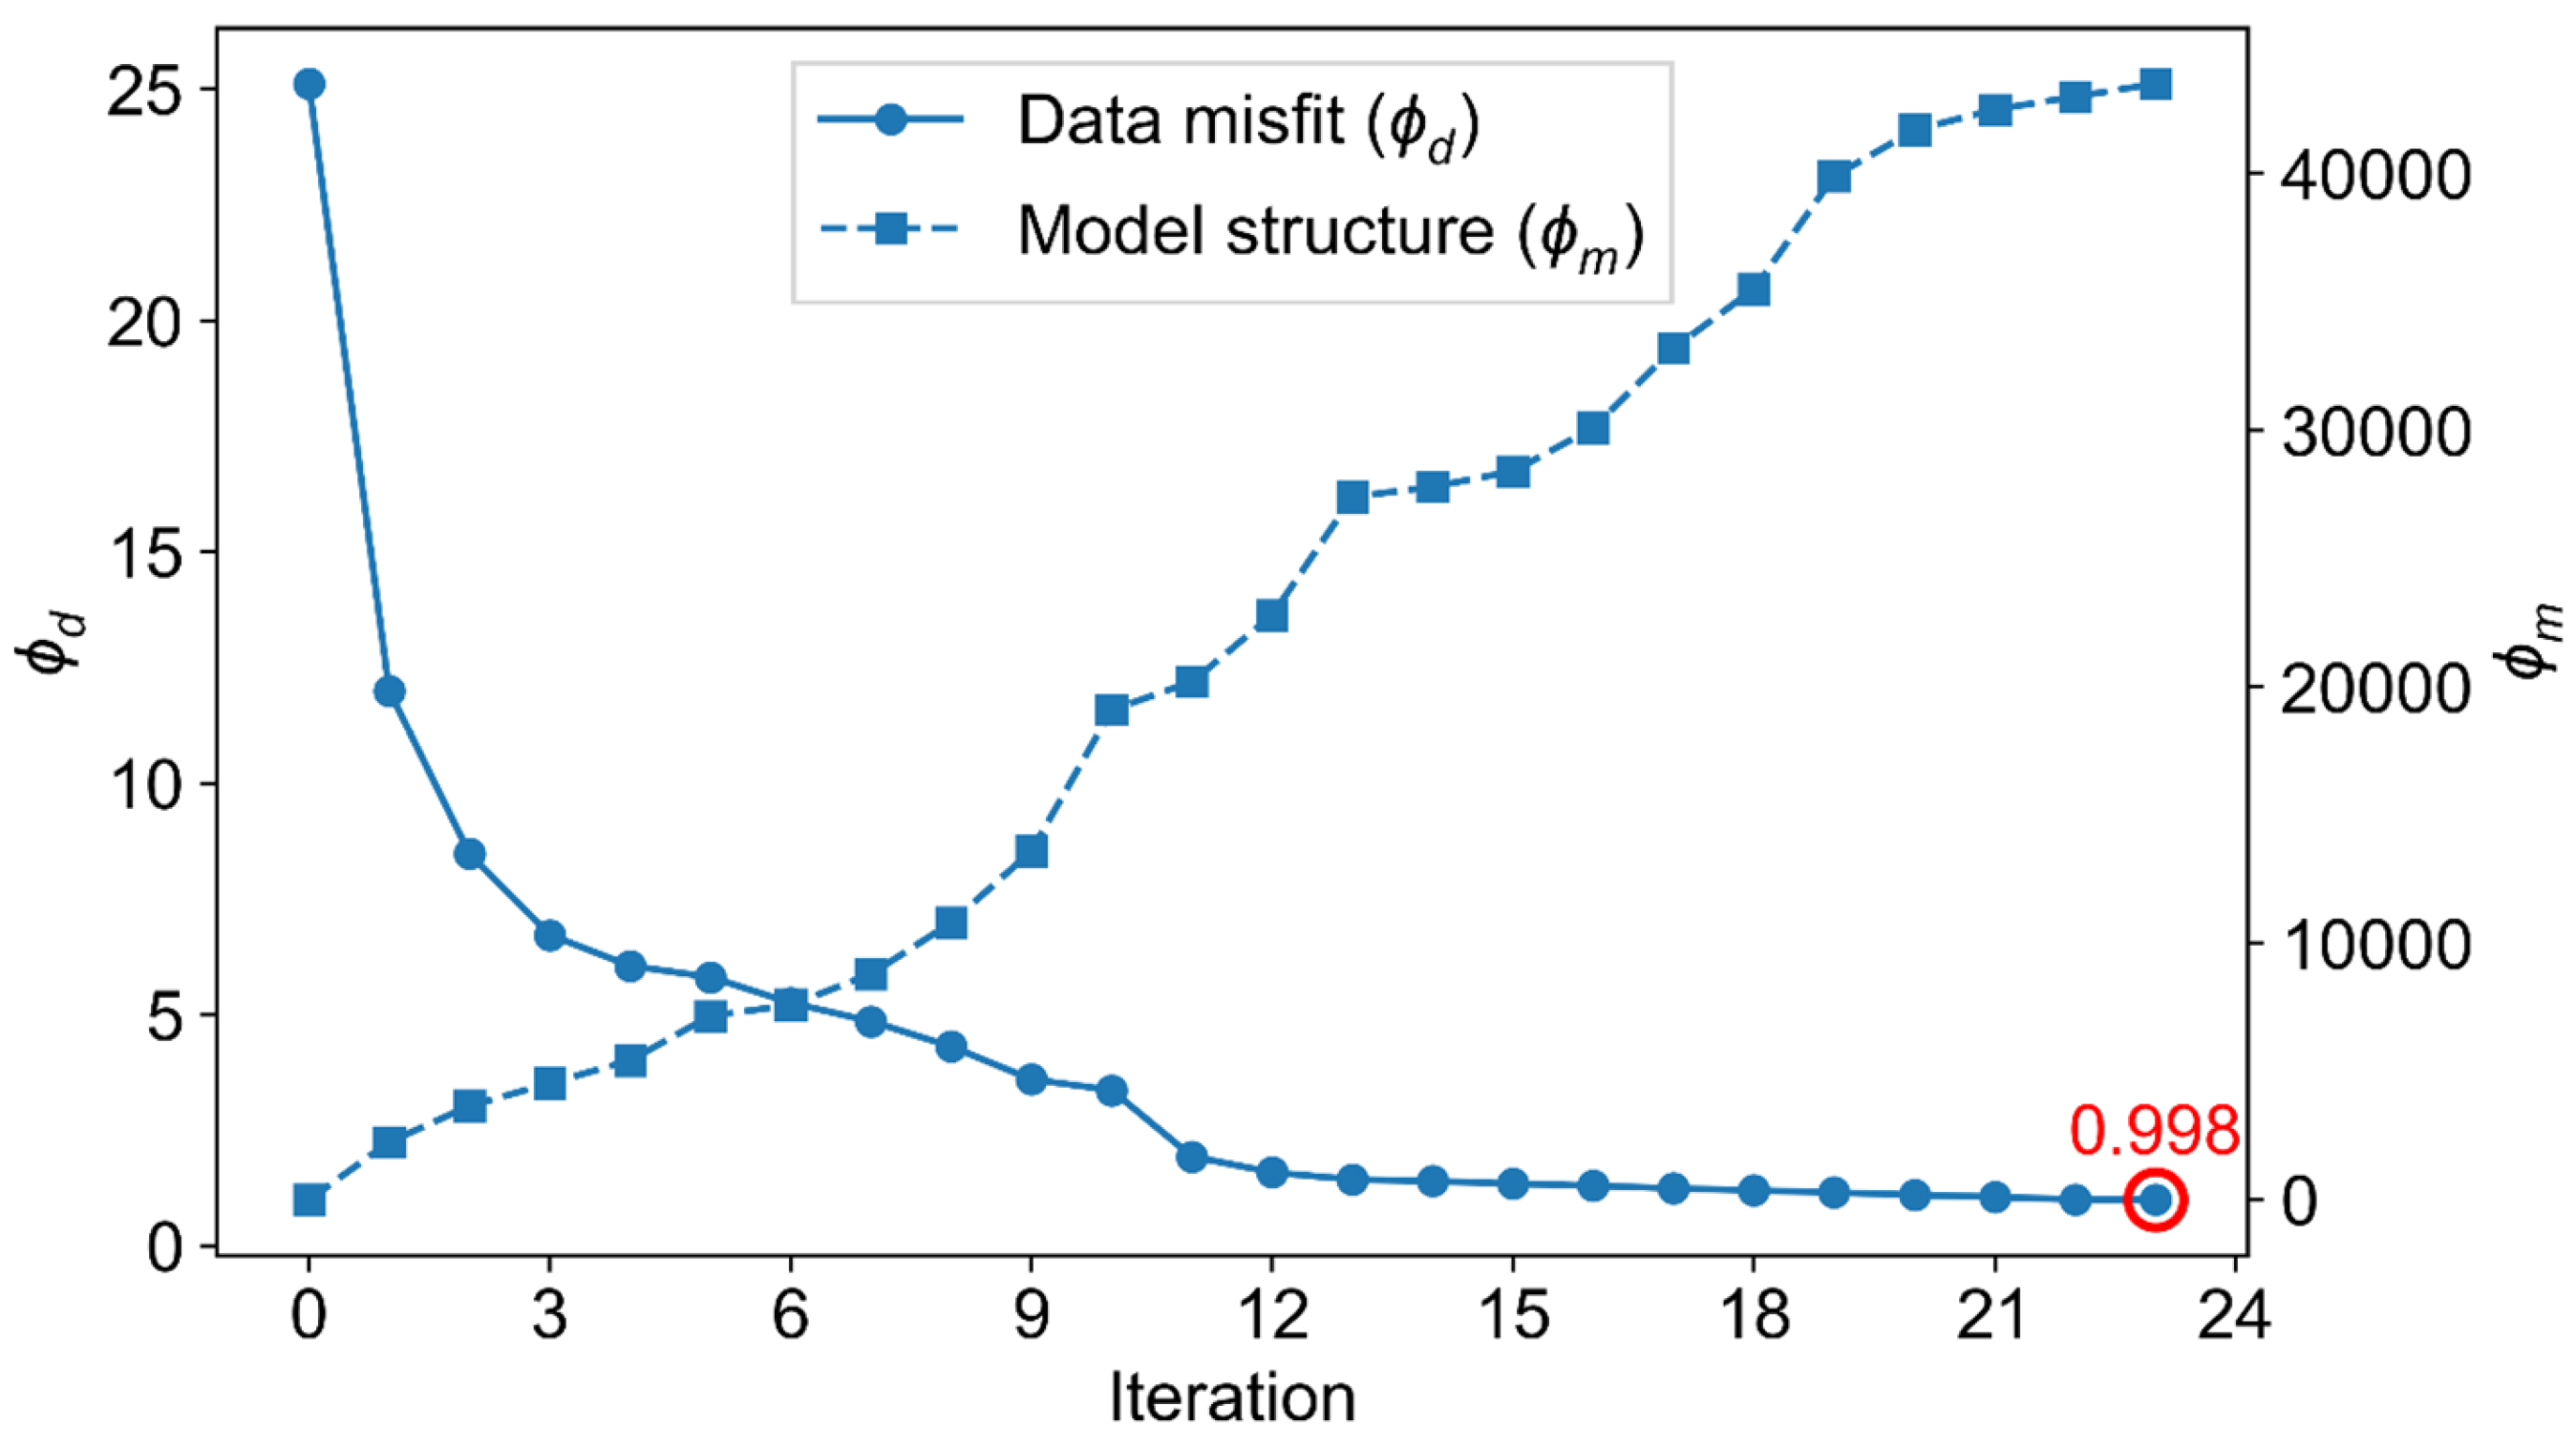
The inversion converged in 23 iterations and resulted in a global normalized data misfit of 0.998 (
Figure 8), indicating that the final models reproduce the observed data within the specified uncertainty levels.
Figure 9 shows good agreement between measured and calculated responses, indicating that the inversion successfully recovered the dominant resistivity structures in the TEM dataset.
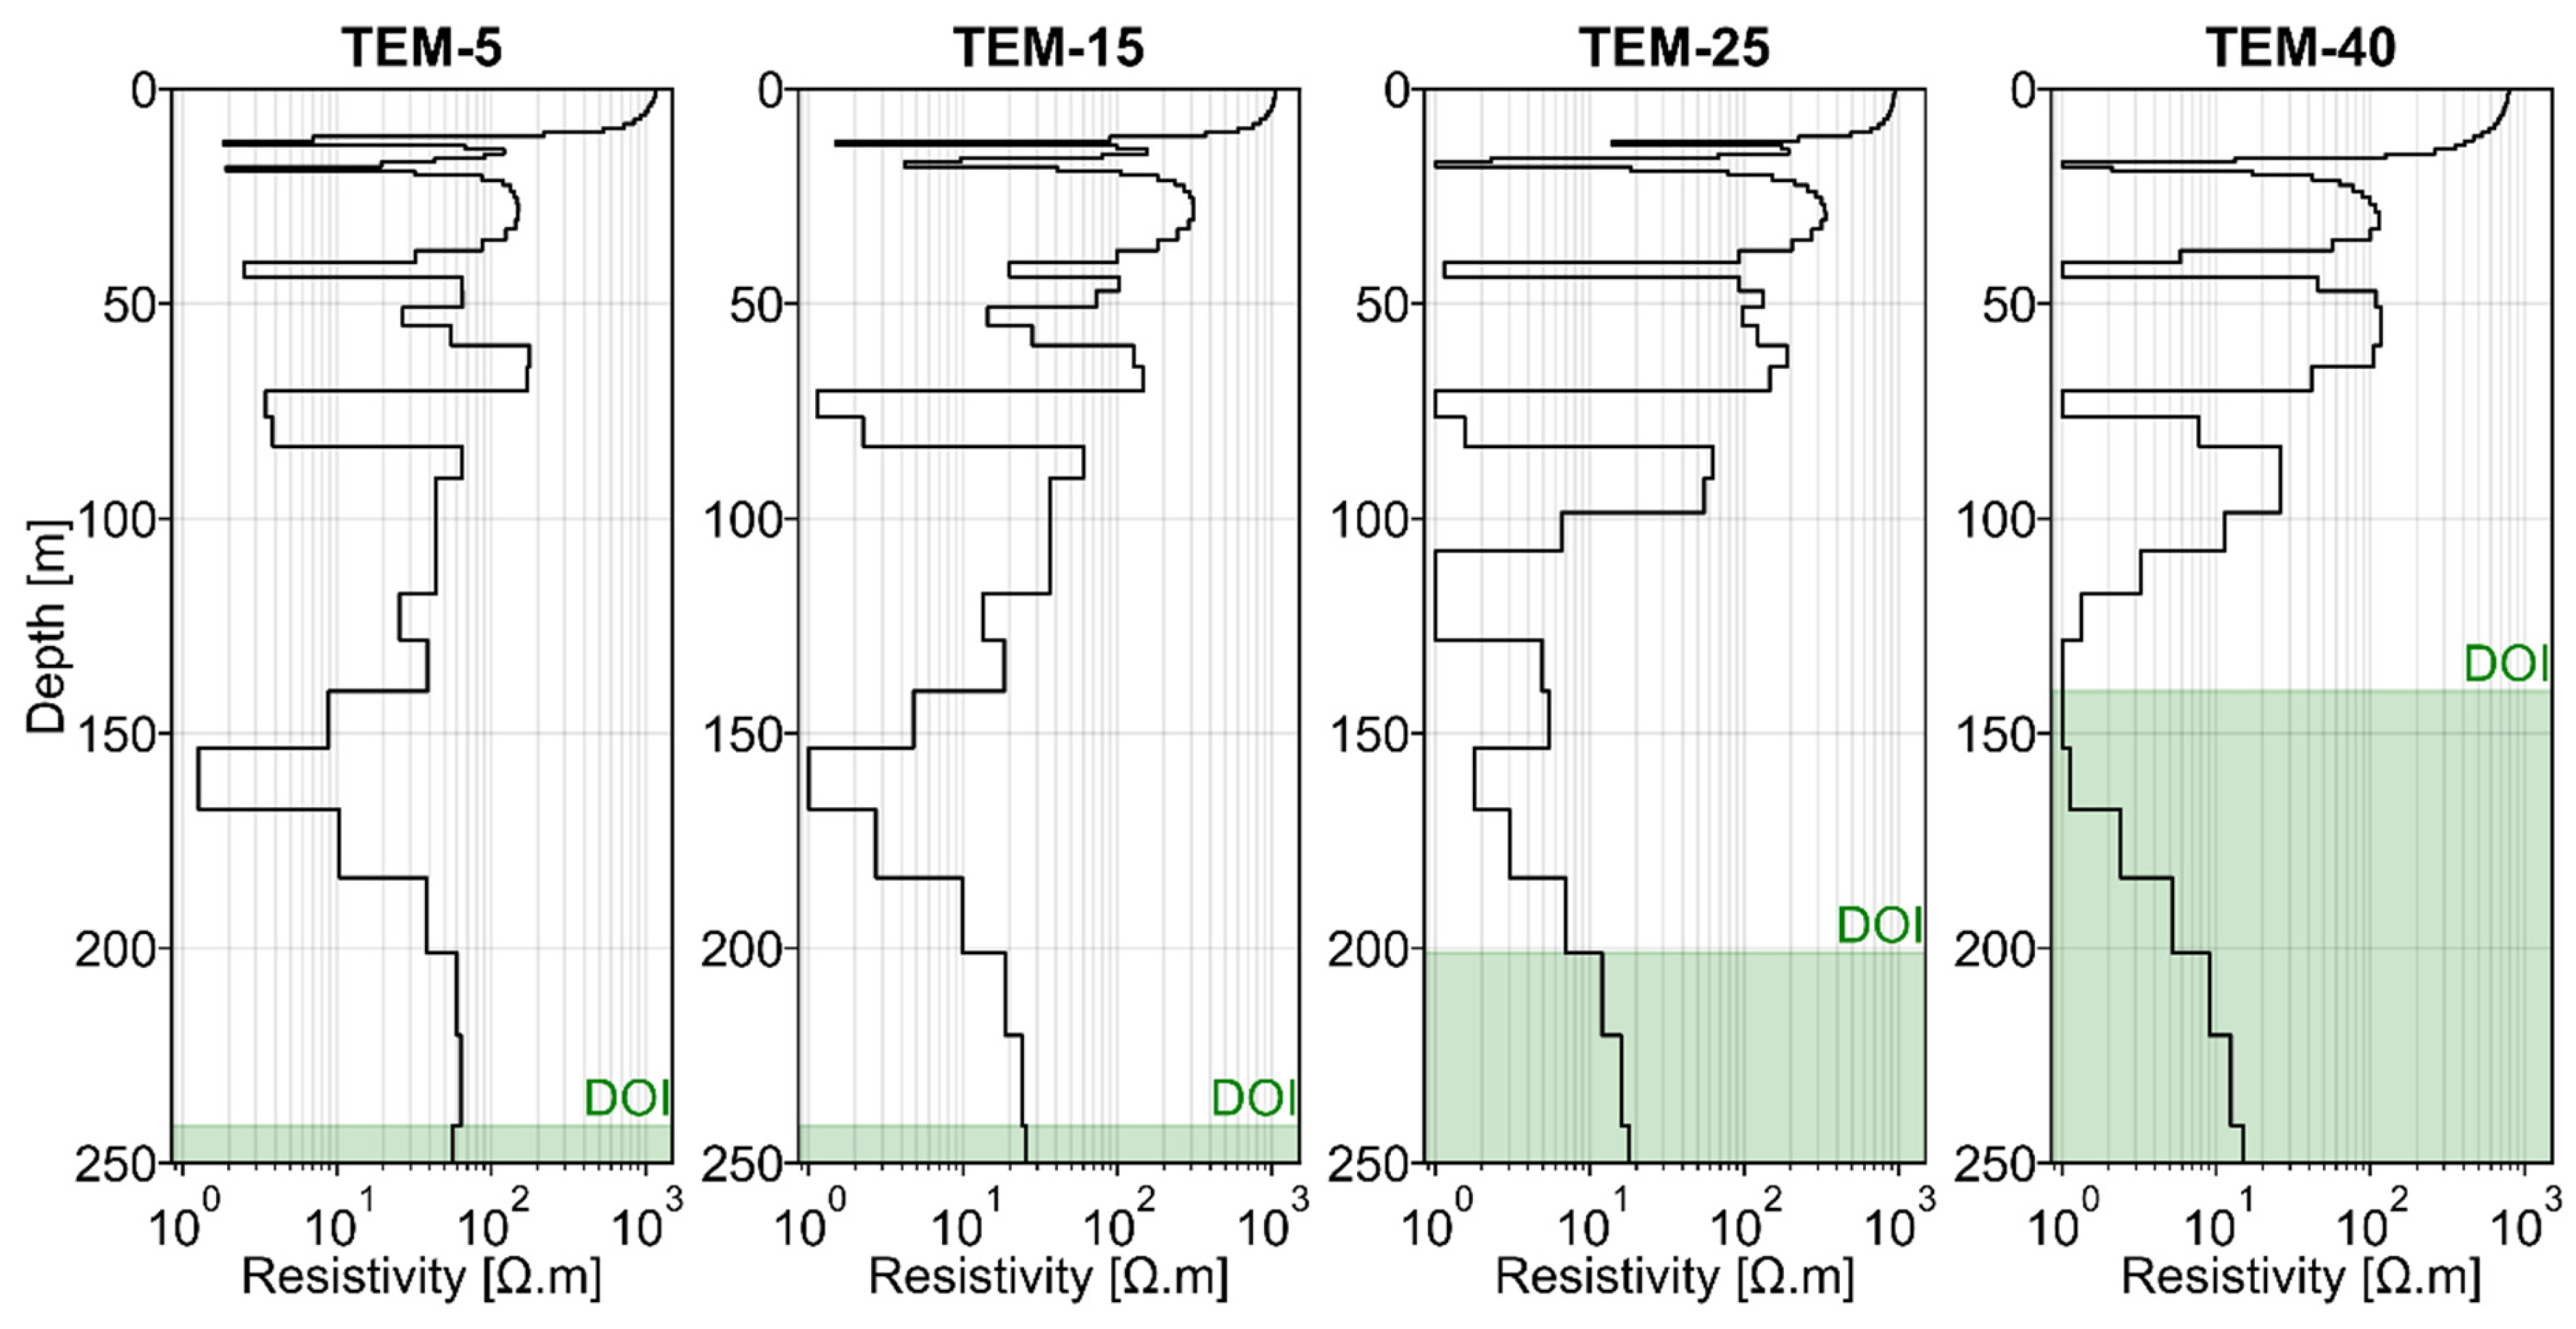
The stitched 1D resistivity models obtained from the LCI for profiles P1–P4 are shown in
Figure 10b, and examples of individual sounding models are presented in
Figure 11. Overall, the models appear laterally smooth and coherent, and the absence of obvious lateral artifacts indicates the effectiveness of the lateral constraints applied during inversion. The recovered resistivity values range from approximately 1 Ω·m to more than 1000 Ω·m, consistent with the lithological and hydrogeological variability expected in the study area.
The depth of investigation (DOI) for each sounding was estimated using the cumulative sensitivity method of Christiansen and Auken [
40]. In this approach, the DOI is defined as the depth at which a specified fraction of the cumulative model sensitivity is reached; an 80% threshold was adopted here. The results indicate that the DOI decreases northward toward the coastline, from approximately 200 m to about 120 m below sea level (
Figure 10b). This trend reflects the increase in electrical conductivity associated with more saline pore water in the coastal zone, which attenuates the electromagnetic signal and limits its penetration depth. In addition, late-time TEM responses, which contain information from greater depths, are generally more susceptible to noise, further reducing effective depth penetration. Despite this reduction in DOI, the LCI framework improves spatial continuity by allowing deep structures resolved at soundings with greater sensitivity to be shared with neighboring soundings with shallower sensitivity and poorer resolution.
4. Discussion
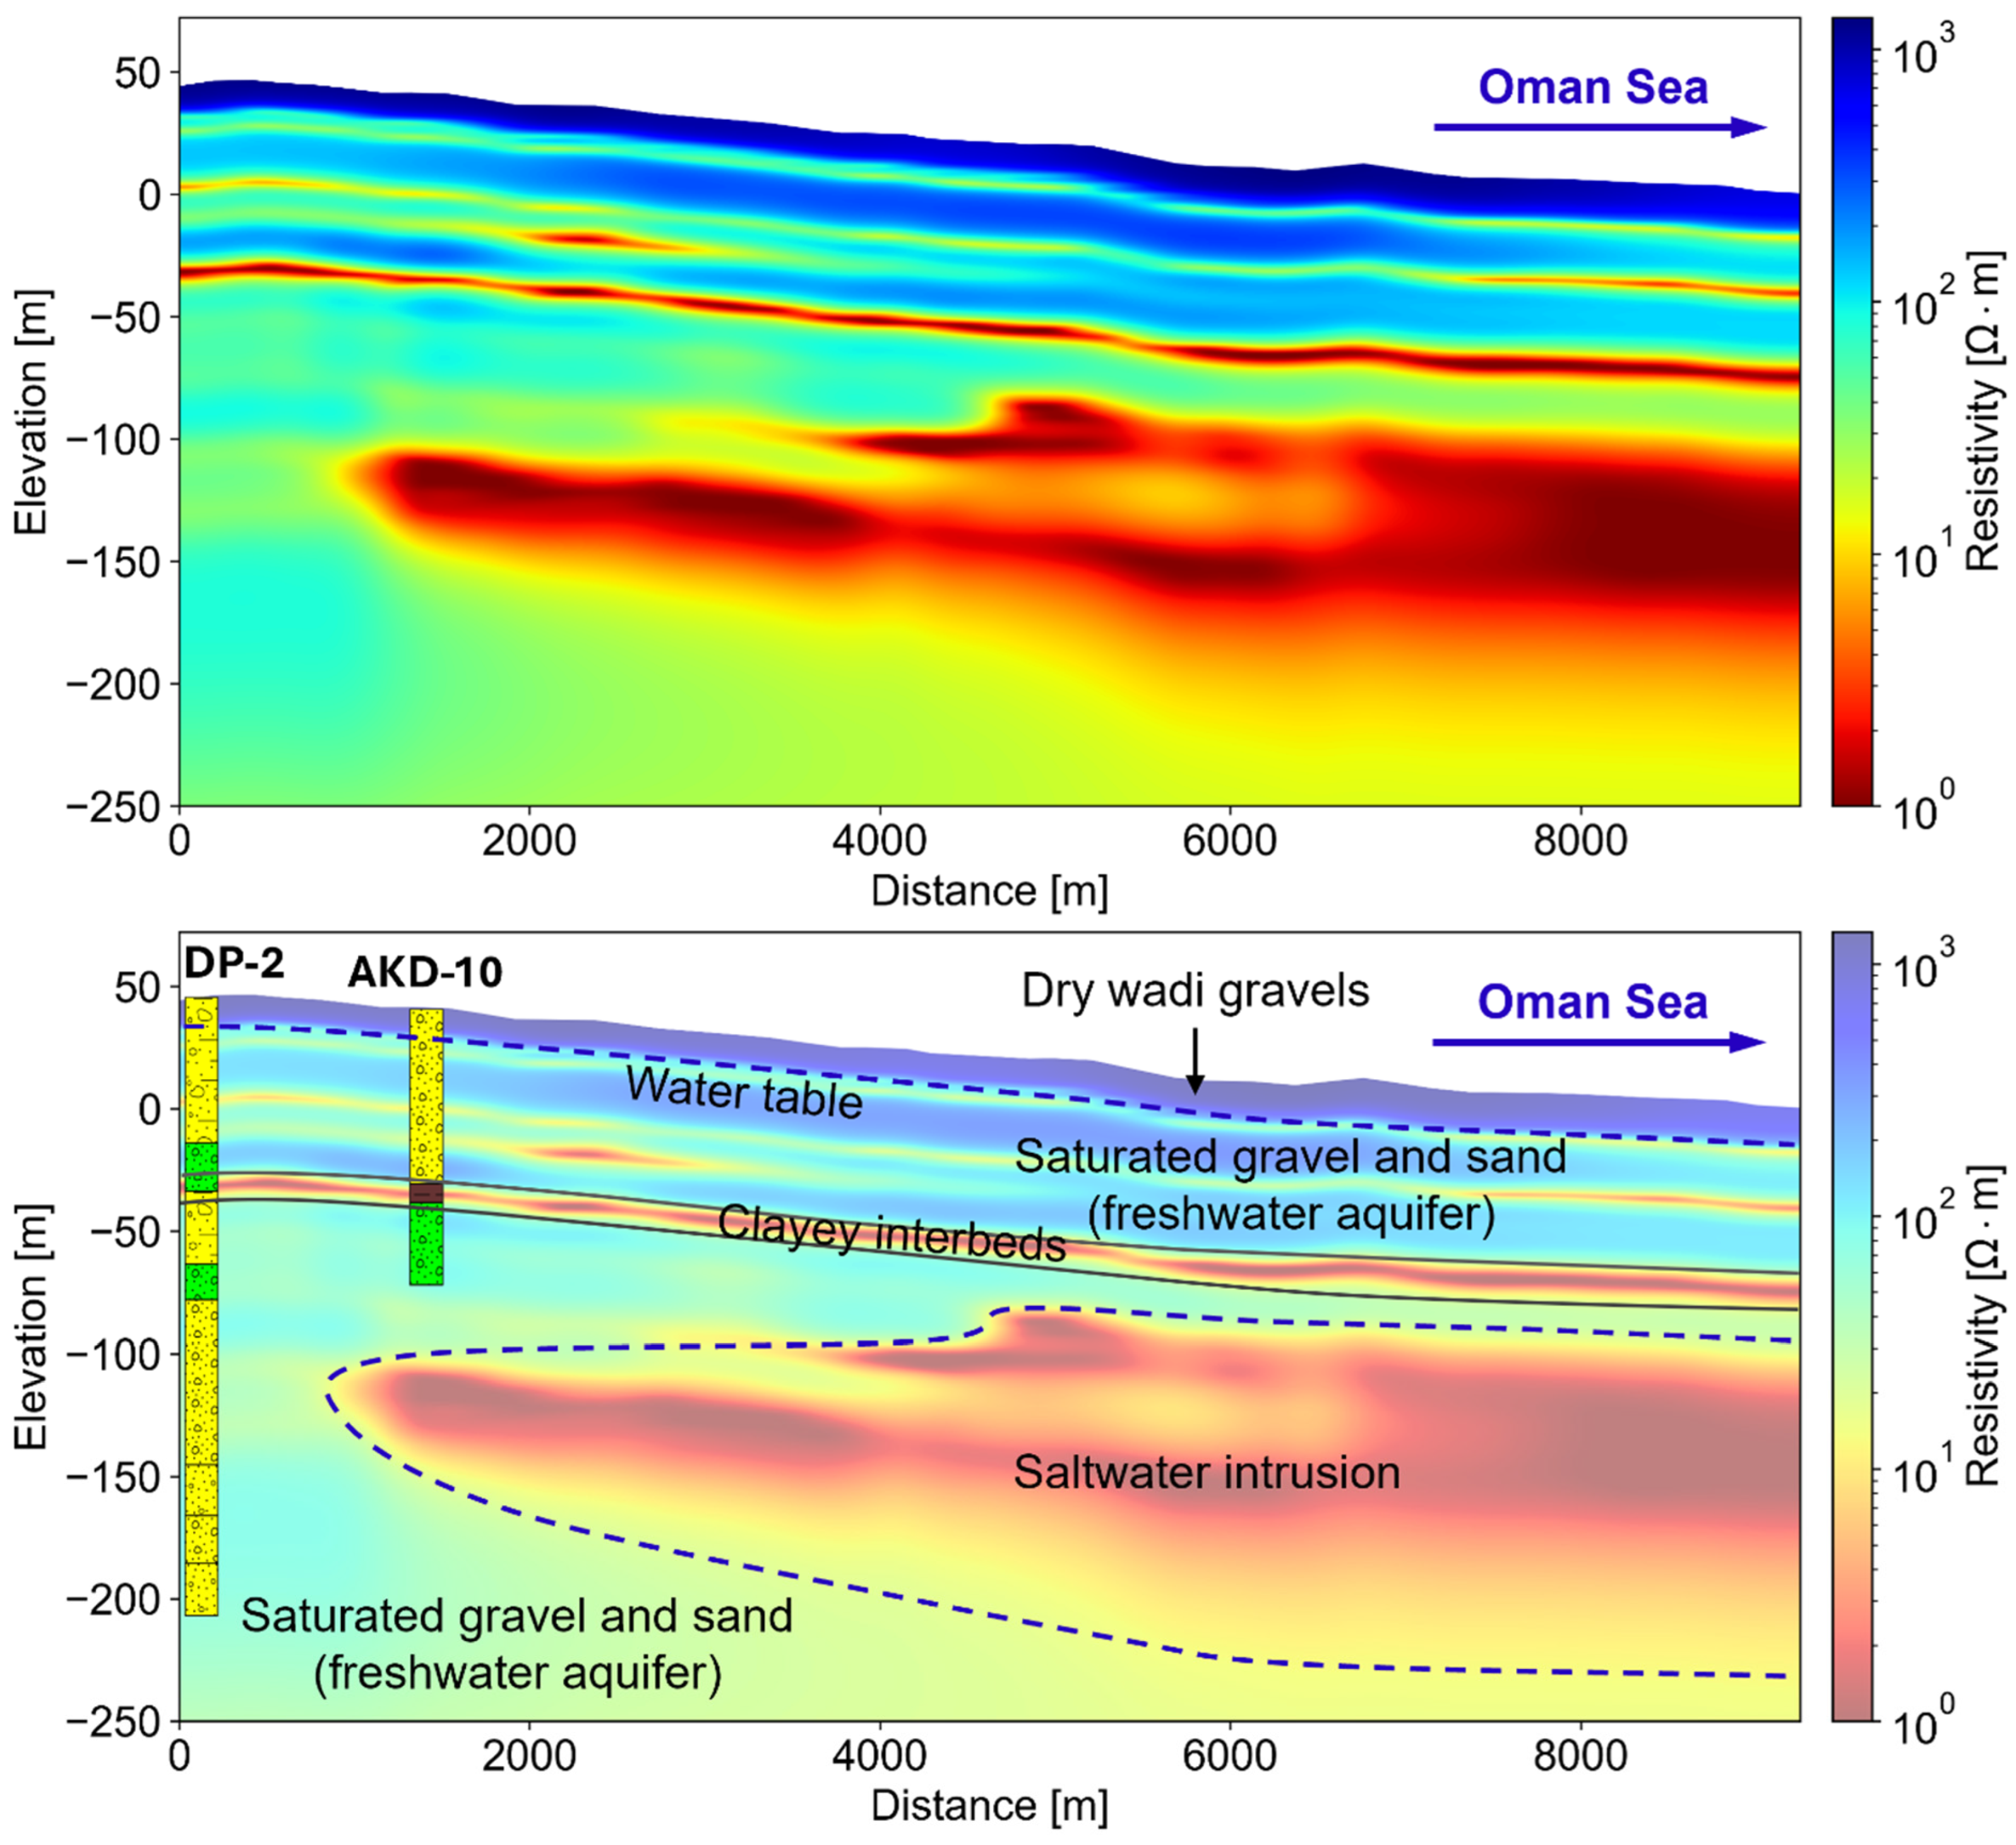
To facilitate geological and hydrogeological interpretation, the four individual profiles were merged and interpolated into a single, continuous resistivity section extending approximately 9 km from Al-Jifnain Dam in the south to the Oman Sea coastline in the north (
Figure 12).
Interpretation of the resulting resistivity section was guided by available lithological logs from nearby deep boreholes, while groundwater-level observations from geotechnical boreholes located along the TEM profiles were used to constrain the shallow water-table position (
Figure 4). Although the lithological control is not located directly on the survey profiles, previous studies have demonstrated that the eastern Al-Batinah Coastal Plain is characterized by a broadly consistent alluvial stratigraphic framework. Therefore, the nearby deep boreholes were used to constrain the regional hydrostratigraphic interpretation rather than to establish a direct layer-by-layer correlation with the TEM profiles.
The uppermost 20 m of the section is characterized by very high resistivities, exceeding 1000 Ω·m. These values are interpreted as unsaturated coarse gravels and conglomerates forming the near-surface wadi alluvial cover. Such high resistivity values are expected in dry, coarse-grained sediments because of their low water content and limited electrical conduction pathways. Below this layer, resistivities decrease to about 80–100 Ω·m, corresponding to freshwater-saturated gravel deposits that constitute the principal alluvial aquifer. The top of this saturated zone is marked by a relatively thin horizon with resistivities of about 30 Ω·m at depths of about 14–20 m, corresponding closely to groundwater levels reported in nearby boreholes. Several conductive horizons and lenses with resistivities of approximately 1–10 Ω·m are observed within the freshwater aquifer, particularly at an elevation of about −30 m. Correlation with borehole information suggests that these features represent clay-rich gravel interbeds. Their relatively low resistivity is most likely attributable to elevated clay content and the associated surface-conduction effects.
The most significant feature identified in the resistivity section is a pronounced wedge-shaped conductive body with resistivities close to 1 Ω·m, located between approximately −70 and −220 m elevation. This anomaly extends inland from the coastline for roughly 8 km beneath the freshwater aquifer and reaches its maximum thickness near the coast, progressively thinning landward. The shape and resistivity of this body are very similar to the classic hydrogeological description of a seawater intrusion wedge in a coastal aquifer system [
4]. Its extremely low resistivity indicates highly saline pore fluids resulting from seawater encroachment, whereas the landward decrease in thickness and extent reflects the gradual transition from saline to freshwater conditions and a diminishing hydraulic gradient. Although the Ghyben–Herzberg model predicts that the freshwater–seawater interface in homogeneous, unconfined coastal aquifers under hydrostatic equilibrium should occur at relatively shallow depth near the coastline, the interpreted saline wedge deviates from this simplified conceptual model. This deviation may be attributed to the hydrostratigraphic heterogeneity of the Al-Batinah aquifer. In particular, the laterally continuous conductive horizon, interpreted as a clay-rich gravel interbed, overlies the saline wedge and may act as a confining layer that impedes the upward migration of saline groundwater [
41], thereby preserving the relatively high-resistivity freshwater-bearing deposits observed near the shoreline.
The present interpretation agrees well with previous hydrogeophysical investigations conducted in the Al-Batinah coastal plain. Comparable conductive seawater intrusion features, with similar resistivity ranges, depths, and geometries, have been mapped extending up to 3–6 km inland within the Al-Khoud coastal aquifer, located a few kilometers west of the study area [
8,
42]. This similarity strengthens the current interpretation and suggests that coastal aquifer systems in the region are influenced by broadly similar hydrogeological processes. Beyond Oman, similar applications of TEM in coastal aquifers have been reported in Kuwait [
43], where conductive saline wedges were successfully distinguished from freshwater aquifers based on their characteristic low resistivity. These findings further confirm the capability of TEM to image deep saline intrusion in highly permeable coastal aquifers.
Although direct groundwater salinity measurements (EC/TDS) were not available at the TEM sounding locations for calibration or validation, the interpreted saline wedge is consistent with previously reported regional groundwater quality. Al Barwani and Helmi [
7] showed that groundwater electrical conductivity increases from less than approximately 2000 µS/cm in the southern inland part of the study area to more than 16,000 µS/cm near the coast, which they attributed to seawater intrusion. This regional hydrochemical trend closely agrees with the landward decrease in resistivity observed in the present TEM models, providing independent support for the interpretation of the conductive body as a seawater intrusion wedge.
Despite these encouraging results, several limitations should be acknowledged. This interpretation relies primarily on TEM data supported by available borehole information, while direct groundwater salinity measurements were not available for calibration or validation of the interpreted saline wedge. Furthermore, the investigation represents a single survey conducted under existing hydrogeological conditions and therefore cannot capture temporal variations in the freshwater–seawater interface. Future research should integrate repeated TEM surveys with groundwater-level monitoring, hydrochemical analyses, and numerical groundwater flow and solute transport modeling to quantify the evolution of seawater intrusion and evaluate the long-term effectiveness of managed aquifer recharge from Al-Jifnain Dam.
5. Conclusions
This study represents the first geophysical investigation using TEM soundings and LCI to delineate the geometry and inland extent of seawater intrusion in the eastern sector of the Al Batinah coastal aquifer, between Al-Jifnain Dam and the Oman Sea. The LCI-derived resistivity models successfully resolved the main hydrostratigraphic units of the study area, including highly resistive near-surface unsaturated wadi gravels overlying a moderately resistive freshwater-bearing gravel aquifer that contains conductive clay-rich gravel interbeds. The most prominent feature is a wedge-shaped conductive body, with resistivities close to 1 Ω·m, extending inland from the coastline beneath the freshwater aquifer and interpreted as a seawater-intrusion wedge. This saline wedge extends about 8 km inland from the coast, between approximately −70 and −220 m elevation, with maximum thickness near the shoreline and progressive thinning landward. Its geometry is consistent with the conceptual model of seawater intrusion in highly transmissive coastal aquifers, in which saline water advances landward beneath freshwater in response to long-term groundwater abstraction and reversal of the natural hydraulic gradient. The interpreted clay-rich interbed, overlying this saline wedge, may act as a confining layer that impedes the upward migration of saline groundwater.
From a methodological perspective, this study demonstrates that TEM, when interpreted using LCI, is an effective tool for mapping deep seawater intrusion in arid coastal aquifers. The method provided sufficient depth of investigation to image the saline wedge and to distinguish it from the overlying freshwater aquifer and internal clay-rich layers. The lateral constraints imposed during inversion improved the continuity and geological plausibility of the resistivity sections and reduced the unrealistic lateral variability that commonly arises from independent 1D inversions.
Hydrogeologically, the results confirm that the eastern Al-Batinah coastal aquifer in the Al-Jifnain area is significantly affected by seawater intrusion. Although the present study does not permit direct quantification of the influence of recharge from Al-Jifnain Dam on the position of the saline front, it establishes the current extent and geometry of salinization within the aquifer and points out the necessity of continued hydrogeological and geophysical monitoring. These findings contribute directly to United Nations Sustainable Development Goal 6 (Clean Water and Sanitation) by improving the understanding of groundwater salinization processes and providing essential information for the sustainable management of coastal groundwater resources.
6. Recommendations
Based on the results of this study, the following recommendations are proposed:
Establish a long-term groundwater monitoring program combining repeat TEM surveys, groundwater-level measurements, and groundwater salinity observations to monitor temporal changes in the freshwater–seawater interface.
Combine geophysical observations with numerical modeling of groundwater flow and solute transport to assess the long-term effectiveness of managed aquifer recharge from Al-Jifnain Dam.
Conduct high-density electromagnetic surveys, such as airborne electromagnetic (AEM) surveys, to improve the 3D characterization of the coastal aquifer and better delineate the spatial distribution of saline groundwater.
Use the results of this study to support groundwater management strategies and decision-making aimed at mitigating seawater intrusion and protecting freshwater resources in the Al Batinah Coastal Plain.
Author Contributions
Conceptualization, M.Y.K., T.A.-H. and O.A.; data collection, M.Y.K. and B.A.-S.; methodology, M.Y.K., T.A.-H. and A.M.B.; software, M.Y.K. and A.M.B.; validation, T.A.-H., O.A. and B.A.-S.; formal analysis, M.Y.K. and A.M.B.; investigation, M.Y.K. and H.L.; resources, T.A.-H. and O.A.; writing—original draft preparation, M.Y.K. and A.M.B.; writing—review and editing, M.Y.K., T.A.-H., A.M.B. and H.L.; visualization, A.M.B., M.Y.K. and H.L.; supervision, M.Y.K., T.A.-H. and O.A.; project administration, M.Y.K. and T.A.-H.; funding acquisition, M.Y.K. and T.A.-H. All authors have read and agreed to the published version of the manuscript.
Funding
This work was supported by Sultan Qaboos University under Grant RF/--/SCI/ES/25/279.
Data Availability Statement
The data supporting the findings of this study are available from the corresponding author upon request.
Acknowledgments
The authors would like to acknowledge Sultan Qaboos University for providing transient electromagnetic (TEM) equipment and logistics support during field data acquisition.
Conflicts of Interest
The authors declare no conflicts of interest.
References
- Werner, A.D.; Bakker, M.; Post, V.E.A.; Vandenbohede, A.; Lu, C.; Ataie-Ashtiani, B.; Simmons, C.T.; Barry, D.A. Seawater Intrusion Processes, Investigation and Management: Recent Advances and Future Challenges. Adv. Water Resour. 2013, 51, 3–26. [Google Scholar] [CrossRef] [Scilit]
- Debnath, M.; Alamdari, N. Seasonal Groundwater–Salinity Dynamics and Climate-Driven Saltwater Intrusion in Coastal South Florida. J. Hydrol. Reg. Stud. 2026, 64, 103117. [Google Scholar] [CrossRef] [Scilit]
- Ferguson, G.; Gleeson, T. Vulnerability of Coastal Aquifers to Groundwater Use and Climate Change. Nat. Clim. Change 2012, 2, 342–345. [Google Scholar] [CrossRef] [Scilit]
- Ketabchi, H.; Mahmoodzadeh, D.; Ataie-Ashtiani, B.; Simmons, C.T. Sea-Level Rise Impacts on Seawater Intrusion in Coastal Aquifers: Review and Integration. J. Hydrol. 2016, 535, 235–255. [Google Scholar] [CrossRef] [Scilit]
- Zheng, T.; Guo, B.; Chang, Q.; Sun, Q.; Chen, X.; Zheng, X.; Wu, J.; Zheng, Z.; Gao, S.; Zheng, C.; et al. Paleo–Salt Water Dominates Coastal Aquifer Salinization: A Continental-Scale Study in China. Sci. Adv. 2026, 12, eady2322. [Google Scholar] [CrossRef] [Scilit] [PubMed]
- Ahmed, A.T.; Askri, B. Seawater Intrusion Impacts on the Water Quality of the Groundwater on theNorthwest Coast of Oman. Water Environ. Res. 2016, 88, 732–740. [Google Scholar] [CrossRef] [Scilit] [PubMed]
- Al Barwani, A.; Helmi, T. Sea Water Intrusion in a Coastal Aquifer: A Case Study for the Area Between Seeb and Suwaiq, Sultanate of Oman. J. Agric. Mar. Sci. 2006, 11, 55. [Google Scholar] [CrossRef] [Scilit]
- El-Kaliouby, H.; Abdalla, O. Application of Time-Domain Electromagnetic Method in Mapping Saltwater Intrusion of a Coastal Alluvial Aquifer, North Oman. J. Appl. Geophys. 2015, 115, 59–64. [Google Scholar] [CrossRef] [Scilit]
- Al-Aufi, K.; Al-Wardy, M.; Choudri, B.S.; Ahmed, M. Analysis of Crops Cultivation Trend: A Shifting Scenario in a Coastal Wilayat, Oman. Environ. Dev. Sustain. 2020, 22, 2685–2698. [Google Scholar] [CrossRef] [Scilit]
- Zekri, S. Using Economic Incentives and Regulations to Reduce Seawater Intrusion in the Batinah Coastal Area of Oman. Agric. Water Manag. 2008, 95, 243–252. [Google Scholar] [CrossRef] [Scilit]
- Hussain, M.S.; Abd-Elhamid, H.F.; Javadi, A.A.; Sherif, M.M. Management of Seawater Intrusion in Coastal Aquifers: A Review. Water 2019, 11, 2467. [Google Scholar] [CrossRef] [Scilit]
- Scharf, A.; Mattern, F.; Bolhar, R.; Callegari, I.; Mattern, P.; Ring, U. Oligocene/Early Miocene E/W-Shortening in the Oman Mountains Related to Oblique Arabia-India Convergence. Tectonics 2022, 41, e2022TC007271. [Google Scholar] [CrossRef] [Scilit]
- Halder, S. Development and Management of Coastal Aquifer System Through Seawater Intrusion Modelling. In Groundwater Development and Management; Sikdar, P.K., Ed.; Springer International Publishing: Cham, Switzerland, 2019; pp. 209–225. [Google Scholar]
- Gaber, A.; Mohamed, A.K.; ElGalladi, A.; Abdelkareem, M.; Beshr, A.M.; Koch, M. Mapping the Groundwater Potentiality of West Qena Area, Egypt, Using Integrated Remote Sensing and Hydro-Geophysical Techniques. Remote Sens. 2020, 12, 1559. [Google Scholar] [CrossRef] [Scilit]
- Niculescu, B.M.; Andrei, G. Application of Electrical Resistivity Tomography for Imaging Seawater Intrusion in a Coastal Aquifer. Acta Geophys. 2021, 69, 613–630. [Google Scholar] [CrossRef] [Scilit]
- Othman, A.A.; Beshr, A.M.; Abd El-Gawad, A.M.S.; Ibraheem, I.M. Hydrogeophysical Investigation Using Remote Sensing and Geoelectrical Data in Southeast Hiw, Qena, Egypt. Geocarto Int. 2022, 37, 14241–14260. [Google Scholar] [CrossRef] [Scilit]
- Rajab, J.A.; Yogeshwar, P.; Tezkan, B.; Al-Halbouni, D. Transient Electromagnetic Imaging of Saltwater Intrusion at the Shrinking Dead Sea. Sci. Rep. 2025, 15, 30250. [Google Scholar] [CrossRef] [Scilit] [PubMed]
- Costall, A.; Harris, B.; Pigois, J.P. Electrical Resistivity Imaging and the Saline Water Interface in High-Quality Coastal Aquifers. Surv. Geophys. 2018, 39, 753–816. [Google Scholar] [CrossRef] [Scilit]
- Danielsen, J.E.; Auken, E.; Jørgensen, F.; Søndergaard, V.; Sørensen, K.I. The Application of the Transient Electromagnetic Method in Hydrogeophysical Surveys. J. Appl. Geophys. 2003, 53, 181–198. [Google Scholar] [CrossRef] [Scilit]
- Ez-zaouy, Y.; Bouchaou, L.; Schreiber, H.; Montcoudiol, N.; Kalberkamp, U.; Danni, S.O.; Touab, A.; Abourrig, F.; Hssaisoune, M. Combined Geophysical Methods to Investigate Seawater Intrusion in the Souss-Massa Coastal Area, Morocco. Groundw. Sustain. Dev. 2023, 21, 100915. [Google Scholar] [CrossRef] [Scilit]
- Khan, M.Y.; Xue, G.-Q.; Chen, W.-Y.; Boateng, C.D. Investigation of Groundwater In-Rush Zone Using Petrophysical Logs and Short-Offset Transient Electromagnetic (SOTEM) Data. J. Environ. Eng. Geophys. 2020, 25, 433–437. [Google Scholar] [CrossRef] [Scilit]
- Zhu, Z.; Shan, Z.; Pang, Y.; Wang, W.; Chen, M.; Li, G.; Sun, H.; Revil, A. The Transient Electromagnetic (TEM) Method Reveals the Role of Tectonic Faults in Seawater Intrusion at Zhoushan Islands (Hangzhou Bay, China). Eng. Geol. 2024, 330, 107425. [Google Scholar] [CrossRef] [Scilit]
- Beshr, A.M.; Li, H.; Hussain, M.; Memon, F.A. Inversion of Magnetic and Transient Electromagnetic Data for the Characterization of Skarn Polymetallic Mineralization in the Qimantagh Metallogenic Belt, China. Ore Geol. Rev. 2025, 186, 106902. [Google Scholar] [CrossRef] [Scilit]
- Li, Z.; Li, H.; Li, K.; Beshr, A.M. TorchTEM3D: PyTorch-Driven Forward Modeling Platform for Fast 3D Transient Electromagnetic Modeling and Efficient Sensitivity Matrix Calculation. Comput. Geosci. 2026, 207, 106063. [Google Scholar] [CrossRef] [Scilit]
- Wisén, R.; Christiansen, A.V. Laterally and Mutually Constrained Inversion of Surface Wave Seismic Data and Resistivity Data. J. Environ. Eng. Geophys. 2005, 10, 251–262. [Google Scholar] [CrossRef] [Scilit]
- Auken, E.; Christiansen, A.V. Layered and Laterally Constrained 2D Inversion of Resistivity Data. Geophysics 2004, 69, 752–761. [Google Scholar] [CrossRef] [Scilit]
- Ali Memon, F.; Li, H.; Hussain, M.; Yuan, P.; Beshr, A.M. Technical Advancements of Laterally Constrained Inversion for Geophysical Datasets. IEEE Access 2025, 13, 160602–160618. [Google Scholar] [CrossRef] [Scilit]
- Chitrakar, P.; Sana, A. Groundwater Flow and Solute Transport Simulation in Eastern Al Batinah Coastal Plain, Oman: Case Study. J. Hydrol. Eng. 2016, 21, 05015020. [Google Scholar] [CrossRef] [Scilit]
- Clark, I.D.; Ravencroft, P.; Fritz, P. Origin and Age of Coastal Groundwaters in Northern Oman. Natuurwet. Tijdschr. 1989, 70, 75–84. [Google Scholar]
- Macumber, P. Al Khawd Fan Groundwater Investigation; Ministry of Water Resources, Sultanate of Oman: Muscat, Oman, 1997; p. 96. [Google Scholar]
- Nabighian, M.N.; Macnae, J.C. Time Domain Electromagnetic Prospecting Methods. In Electromagnetic Methods in Applied Geophysics: Volume 2, Application, Parts A and B; Investigations in Geophysics; Nabighian, M.N., Corbett, J.D., Eds.; Society of Exploration Geophysicists: Houston, TX, USA, 1991; pp. 427–514. [Google Scholar]
- Ward, S.H.; Hohmann, G.W. Electromagnetic Theory for Geophysical Applications. In Electromagnetic Methods in Applied Geophysics: Volume 1, Theory; Investigations in Geophysics; Nabighian, M.N., Corbett, J.D., Eds.; Society of Exploration Geophysicists: Houston, TX, USA, 1987; pp. 131–311. [Google Scholar]
- Cockett, R.; Kang, S.; Heagy, L.J.; Pidlisecky, A.; Oldenburg, D.W. SimPEG: An Open Source Framework for Simulation and Gradient Based Parameter Estimation in Geophysical Applications. Comput. Geosci. 2015, 85, 142–154. [Google Scholar] [CrossRef] [Scilit]
- Heagy, L.J.; Cockett, R.; Kang, S.; Rosenkjaer, G.K.; Oldenburg, D.W. A Framework for Simulation and Inversion in Electromagnetics. Comput. Geosci. 2017, 107, 1–19. [Google Scholar] [CrossRef] [Scilit]
- Oldenburg, D.W.; Li, Y. Inversion for Applied Geophysics: A Tutorial. In Near-Surface Geophysics; Investigations in Geophysics; Butler, D.K., Ed.; Society of Exploration Geophysicists: Houston, TX, USA, 2005; pp. 89–150. [Google Scholar]
- Tikhonov, A.N.; Arsenin, V. Solutions of Ill-Posed Problems. Math. Comput. 1978, 32, 1320–1322. [Google Scholar] [CrossRef] [Scilit]
- Kang, S.; Knight, R.; Greene, T.; Buck, C.; Fogg, G. Exploring the Model Space of Airborne Electromagnetic Data to Delineate Large-Scale Structure and Heterogeneity Within an Aquifer System. Water Resour. Res. 2021, 57, e2021WR029699. [Google Scholar] [CrossRef] [Scilit]
- Greenhalgh, S.A.; Bing, Z.; Green, A. Solutions, Algorithms and Inter-Relations for Local Minimization Search Geophysical Inversion. J. Geophys. Eng. 2006, 3, 101–113. [Google Scholar] [CrossRef] [Scilit]
- Nocedal, J.; Wright, S.J. Numerical Optimization, 2nd ed.; Springer: Berlin/Heidelberg, Germany, 2006. [Google Scholar]
- Vest Christiansen, A.; Auken, E. A Global Measure for Depth of Investigation. Geophysics 2012, 77, WB171–WB177. [Google Scholar] [CrossRef] [Scilit]
- Wen, T.; Song, Z.; Chen, Z. Hydro-Thermal Behavior of Biochar-Amended and Saline Granite Residual Soils under High Compaction. Acta Geotech. 2026. [Google Scholar] [CrossRef] [Scilit]
- El-Kaliouby, H. Mapping Sea Water Intrusion in Coastal Area Using Time-Domain Electromagnetic Method with Different Loop Dimensions. J. Appl. Geophys. 2020, 175, 103963. [Google Scholar] [CrossRef] [Scilit]
- Bou-Rabee, F.; Yogeshwar, P.; Burberg, S.; Tezkan, B.; Duane, M.; Ibraheem, I.M. Imaging of Groundwater Salinity and Seawater Intrusion in Subiya Peninsula, Northern Kuwait, Using Transient Electromagnetics. Water 2025, 17, 652. [Google Scholar] [CrossRef] [Scilit]
| Disclaimer/Publisher’s Note: The statements, opinions and data contained in all publications are solely those of the individual author(s) and contributor(s) and not of MDPI and/or the editor(s). MDPI and/or the editor(s) disclaim responsibility for any injury to people or property resulting from any ideas, methods, instructions or products referred to in the content. |




 ,
,