Article

Competitive Removal of Per- and Poly-Fluoroalkyl Substances (PFAS) in Multi-PFAS Component Systems by Ion Exchange Resins: Effects of Resin Matrix, PFAS Property, and Sulfate


1
Department of Civil, Environmental, and Biomedical Engineering, Sangmyung University, Cheonan 31066, Republic of Korea
2
Department of Civil, Construction and Environmental Engineering, San Diego State University, San Diego, CA 92182, USA
3
Water Quality Institute, Busan Water Authority, Busan Metropolitan City 50804, Republic of Korea
4
Department of Civil Engineering, Sangmyung University, Cheonan 31066, Republic of Korea
*
Author to whom correspondence should be addressed.
Water 2026, 18(15), 1869; https://doi.org/10.3390/w18151869
Submission received: 30 June 2026 / Revised: 26 July 2026 / Accepted: 30 July 2026 / Published: 1 August 2026
(This article belongs to the Section Water Quality and Contamination)

Abstract

To meet the mounting regulations on per- and poly-fluoroalkyl substances (PFAS) in drinking water, ion exchange (IX) has become one of the most widely used technologies. However, the effects of resin characteristics and effects of common water matrix ions (sulfate) on the competitive uptake of PFAS of varying chain lengths and functionalities in multicomponent systems are not well understood. In this study, two commercial strong-base IX resins were tested for competitive removal of 10 PFAS. This study demonstrates that polystyrene matrix (IRA900) IX significantly outperforms polyacrylic matrix (A860) IX in the removal of PFAS due to both electrostatic and hydrophobic interactions. More effective removal in IX was found in longer-chain PFAS and perfluoroalkyl sulfonic acids (PFSAs) than in perfluoroalkyl carboxylic acids (PFCAs). PFAS removal was effective over a broad pH range of 4–8.5 except for short-chain PFCAs, which were competed with hydroxide ions. The uptake of IRA900 decreased with the increase in sulfate concentration and the decrease was profoundly in shorter-chain PFAS. In kinetic tests, the PFAS removal for IRA900 was ~85% without sulfate and ~80% with sulfate within 48 h. Moreover, it was confirmed that the presence of sulfate suppressed shorter-chain PFAS and PFCA homologues. IRA900 was regenerated using NaCl, methanol (CH3OH), and a combination. A decrease by 10.7–12.6% after first regeneration was attributed to PFCA.

1. Introduction

Per- and poly-fluoroalkyl substances (PFAS) (also known as forever chemicals) have been widely used in products such as surfactants, medicines, plastics, textiles, and firefighting foams because of their thermal and chemical stability, repellency, and low surface-free energy [1,2,3]. PFAS are also known for bioaccumulation and resistance to common natural or engineered degradation processes [4]. Consequently, PFAS have been widely detected in humans, aquatic creatures, water, soil, and air [5,6], which has triggered growing health concerns in recent years. The toxicity of PFAS in humans is largely attributed to their ability to interact with blood plasma proteins—most notably human serum albumin—resulting in protein binding and tissue accumulation, which may contribute to various systemic toxicities and potential carcinogenic risks [7,8].
PFAS are classified as polymers or non-polymers. Polymeric PFAS are generally considered less harmful and more biodegradable than non-polymeric PFAS [7,8,9]. Currently, most PFAS used in industrial applications are perfluoroalkyl acids (PFAAs) such as perfluoroalkyl carboxylic acids (PFCAs) and perfluoroalkyl sulfonic acids (PFSAs), which mainly differ in their terminal functional groups. PFAS can also be classified as short- or long-chain PFAS based on the length of their carbon chain. In general, long-chain PFAS such as perfluorooctane sulfonic acid (PFOS) and perfluorooctanoic acid (PFOA) have a much higher removal efficiency via standard activated carbon (AC) adsorption because of their higher hydrophobicity compared with short-chain PFAS [10]. However, with increasing regulations on long-chain PFAS, the use of short-chain PFAS in lieu of long-chain PFAS has been growing rapidly in recent years [11]. For removal of short-chain PFAS, and even ultra-short-chain PFAS (<number of carbon, 4), IX resins are generally more effective than AC [12].
Meanwhile, individual states in the USA as well as some countries in the European Union (EU) has proposed or promulgated stricter regulations. For example, New Jersey set a limit of 13 ng/L for perfluoronoanoic acid (PFNA) and California set limits of 5.1 ng/L for PFOA and 6.5 ng/L for PFOS [13]. Germany, Sweden, and Denmark set limits of 20, 4, and 2 ng/L, respectively, for PFOA, PFOS, PFNA, and PFHxS [14]. These stringent regulations have triggered urgent demand for more advanced techniques to remove PFAS from water.
As standard oxidation and biological treatment processes are not effective for degrading PFAS in water because of their strong C–F bond and very low concentrations [10,15], adsorption based on AC and IX resins has been widely employed to remove PFAS for its decent efficiency and cost-effectiveness [16,17,18,19,20]. In particular, regenerable IX resins have been gaining attention for their effectiveness at removing PFAS and regenerability, especially short-chain PFAS, and their simple regeneration process [19,20,21].
In general, the removal capacity of IX resins is governed by their functional groups, resin matrix, and physically by the degree of crosslinking, which controls the pore size and specific surface area. In addition, PFAS adsorption on IX is generally governed by multiple mechanisms including electrostatic attraction, hydrophobic partitioning, fluorophilic interactions, pore diffusion, and resin swelling effects. There are two types of resin matrices, polystyrene (PS) and polyacrylic (PA), with the former being more hydrophobic [22]. For more hydrophobic PFAS, PS matrix could offer more favorable removal than PA due to additional hydrophobic interaction [23,24]. In terms of functionality, anion exchange resins (AERs) are classified as strong-base and weak-base AERs. While both types of AERs have been shown as effective in removing PFAS, strong-base AERs are often preferred due to their applicability to a broader pH range.
It has been well noted that water matrix can affect the performance of IX resins. For example, sulfate as co-ion sharply reduces the target anion capacity because of its higher affinity than other anions [25]. In addition, the concentration of sulfate ranges from several to several tens of mg/L in surface water, and even exceeding 250 mg/L in groundwater [26]. Moreover, even in drinking water, sulfate has been detected at levels of several tens of mg/L [27].
Although studies have shown the effectiveness of IX resins for removing short- and long-chain PFAS, information has been limited on the interactions between IX resins and PFAS of various chain lengths and how common water matrix anions such as sulfate impact such interactions. This study advances the existing understanding of PFAS removal by investigating competitive interactions across different functional groups of IX, the effect of PFAS chain length and head/tail functional groups of PFAS, the role of sulfate in the adsorption of PFAS species, and the practical implications for real-water treatment.
The overall goal of this study was to test two prototype IX resins for removing 10 representative long- and short-chain PFAS and to gauge the effects of sulfate on the PFAS removal efficiency. The specific objectives were to (1) investigate the surface characteristics of AERs, (2) evaluate the effect of solution pH, (3) determine the removal efficiency and capacity using isotherms in multicomponent systems, (4) compare the affinity of each PFAS species without and with sulfate, and (5) explore the regeneration effect using three different regenerants.

2. Materials and Methods

2.1. Chemicals

Ten PFAS were purchased from Sigma-Aldrich (Saint Louis, MO, USA) and labeled according to their type, PFCA (CA) or PFSA (SA), and the number of carbon atoms in the carbon chain, including perfluorobutanoic acid (PFBA, CA4), perfluoropentanoic acid (PFPeA, CA5), perfluorohexanoic acid (PFHxA, CA6), perfluoroheptanoic acid (PFHpA, CA7), PFOA (CA8), perfluorobutane sulfonic acid (PFBS, SA4), perfluoropentane sulfonic acid (PFPeS, SA5), PFHxS (SA6), perfluoroheptane sulfonic acid (PFHpS, SA7), and PFOS (SA8). Properties such as pKa and LogKow are summarized in Table S1. Two commercial anion exchange resins were tested, IRA900 (AmberLite) and A860 (Purolite) [28,29]; Table S2 in the Supplementary Materials (SM) gives salient properties of the AERs. Both resins are strong base and macroporous type but differ in matrices, i.e., PS for IRA900 and PA for A860. A commercial GAC was obtained from Green Activated Carbon (Hwaseong, Republic of Korea) to compare the PFAS adsorption behavior. Before use, each IX resin was washed with deionized (DI) water and dried in air. Methanol (99.8%) was obtained from J.T. Baker (Phillipsburg, NJ, USA). Na2SO4, NaCl, and HCl were purchased from Duksan Company (Ansan, Republic of Korea), Daejung Chemicals (Siheung, Republic of Korea) and Sigma-Aldrich (Saint Louis, MO, USA), respectively. All chemicals were of American Chemical Society grade or higher.

2.2. Characterization of the Ion Exchange Resins

Field emission scanning electron microscopy (FE-SEM) combined with energy-dispersive X-ray spectroscopy (EDS) was performed using the Inspect F (FEI Company, Hillsboro, OR, USA) to analyze the elemental composition of the IX resins. The pH at the point of zero charge (pHpzc) was measured by using the salt addition method with a 0.01 M NaCl solution [30].

2.3. Batch Experiments

Batch experiments were conducted to test the removal efficiency, pH effect, isotherm, sulfate effect (removal efficiency and kinetics), and regeneration of the IX resins. Commercial GAC was also tested when testing sulfate effects. All tests were conducted using a mixed solution containing all the 10 PFAS, which were prepared from individual stock solutions. All tests were carried out with a total volume of 50 mL except for kinetic tests, which used a volume of 500 mL, and with a resin dosage of 0.01 g except for the isotherm tests (0.0–0.1 g), and the kinetic tests, which used a mass of 0.1 g. The initial pH was set to 6.8–7.2, except for the pH effect tests, where the initial pH was varied at 4.0, 5.0, 6.0, 7.0, and 8.5, and the pH was adjusted at predetermined time intervals. To test the effect of sulfate, the experiments were carried out in the presence of 0, 20, and 40 mg/L of sulfate. The initial total PFAS concentration was set to 79.5–194 ng/L in the removal efficiency tests, 223–392 ng/L in the pH effect tests, 392–816 ng/L in the isotherm tests, 3174–6460 ng/L in the kinetic tests, and 218–373 ng/L in the sulfate effect on removal efficiency tests. Each experiment condition is summarized in Table S3. Resin regeneration was carried out using a 4% NaCl solution, 70% methanol, and a mixture thereof as regenerants. All experiments were conducted in duplicate.

2.4. Chemical Analysis

The PFAS concentrations were measured using an ultra-performance liquid chromatography tandem mass spectrometer (Agilent, 6495C, Singapore) equipped with an Atlantis Premier BEH C18 AX column (100 mm × 2.1 mm, 1.7 µm). An Atlantis Premier BEH C18 AX column (50 mm × 2.1 mm, 5 µm) was used as a delay column. A calibration curve of targets was prepared at 0.05 to 20 μg/L. The calibration quantification report for PFAS is in Table S4. The sulfate concentration was measured using a 7900 ICP-MS (inductively coupled plasma mass spectrometer, Agilent, Santa Clara, CA, USA).

3. Results and Discussion

3.1. Characterization

SEM-EDS was used to measure the weight percent (wt.%) of each element on the surface of IRA900 and A860. The value of (O + N)/C determines the polarity, and a lower value for O indicates a higher hydrophobicity [17,31]. The value of (O + N)/C for IRA900 was 0.150, which is much less than the value of 0.385 reported for A860 [24]. The difference can be attributed to their matrices, a more hydrophobic PS matrix for IRA900 and less hydrophobic PA matrix for A860 (Table S2) [22].
The surface charge can be characterized by the pHpzc. Figure S1 shows that IRA900 displayed a ΔpH of zero at initial pH < 6, indicating a net-zero surface charge under acidic conditions. At pH > 6, the surface turned increasingly more negative (ΔpH became more negative). In contrast, A860 showed a nearly zero next charge at pH < 5, but the surface turned increasingly more negative at pH > 5. Between the two resins, A860 exhibited a notably more negative potential at pH > 5 than IRA900. As such, IRA900 is expected to be more favorable for taking up anions such as PFAS as well as competing anions such as sulfate and NOM.

3.2. Equilibrium Uptake of PFAS: Effects of Resin Matrix and PFAS Chain Length

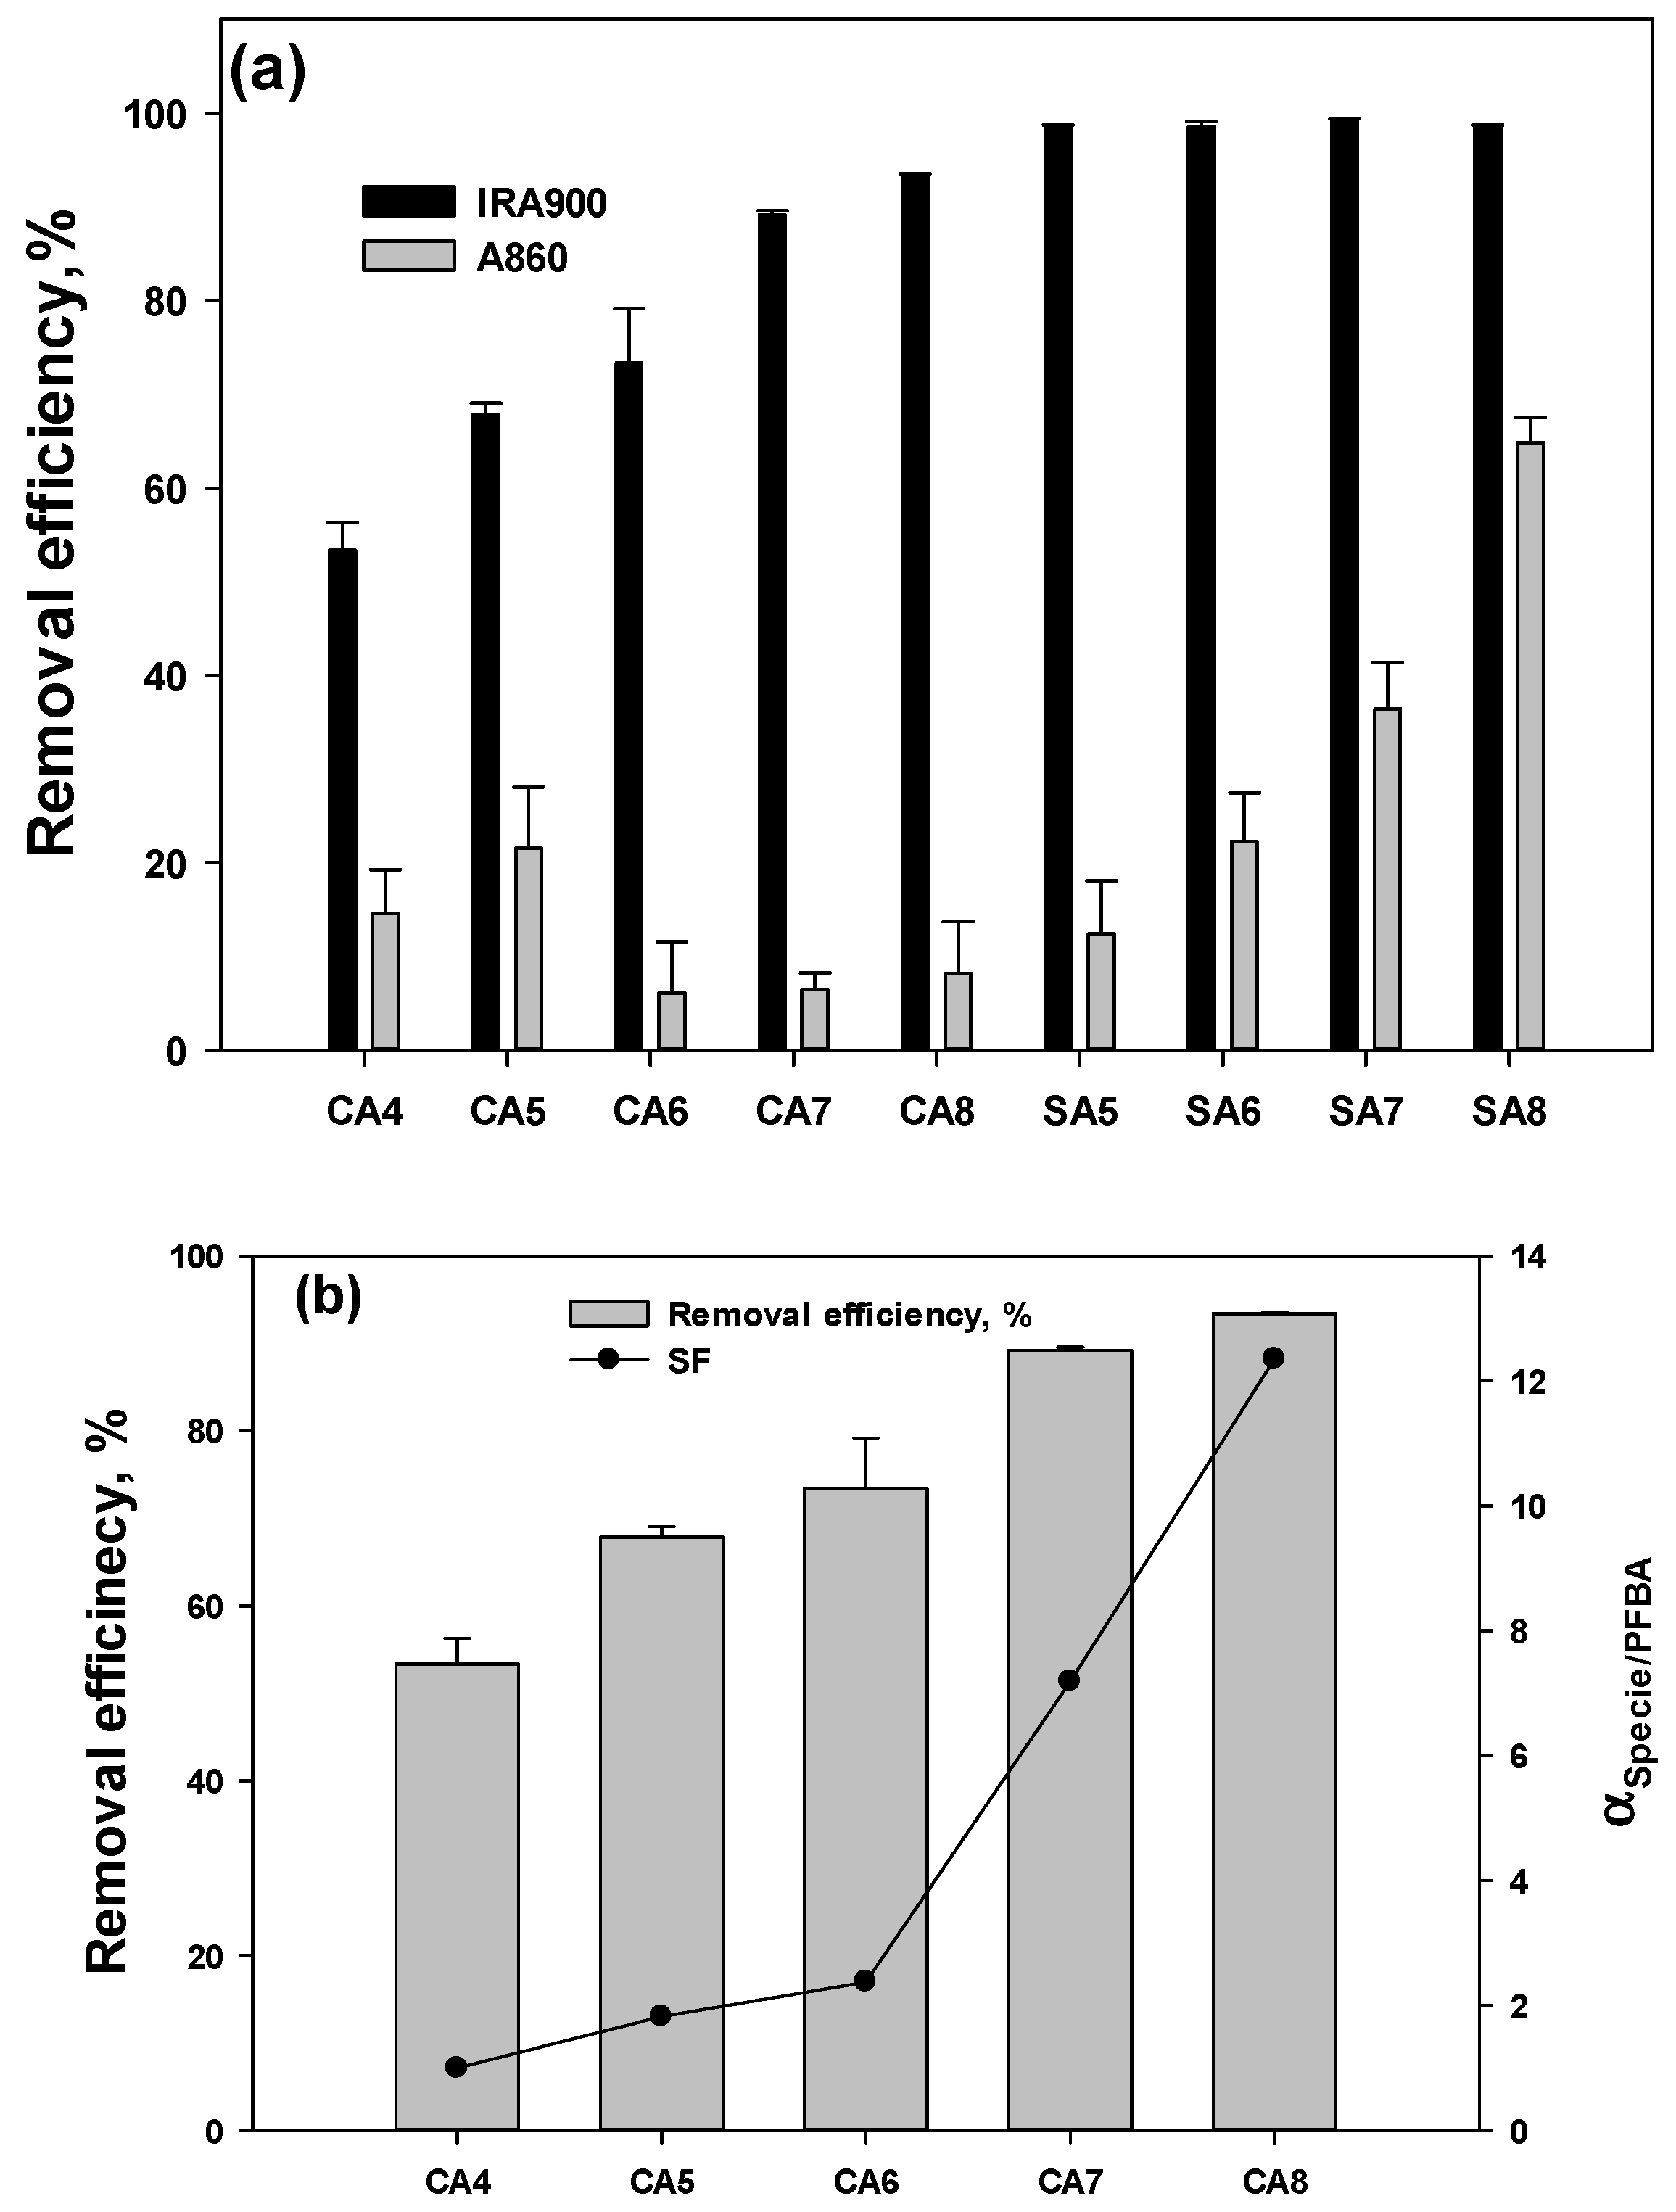
Figure 1a shows the equilibrium removal efficiencies of 10 PFAS by IRA900 and A860 in multicomponent systems. IRA900 achieved a much higher removal efficiency than A860 for all the PFAS. For the PFCA homologues, the removal efficiency increased with the chain length or hydrophobicity of the PFAS (Figure 1b), which is in accord with findings by Son et al. [10,32]. A correlation coefficient (CC) of 0.974 was obtained between the carbon chain length and the removal efficiency for the PFCAs. These results confirmed that the polystyrene matrix resulted in a greater removal capacity than the polyacrylic matrix [33], and the hydrophobic interactions played a dominant role in the uptake of PFAS. Between the PFCAs and PFSAs, the latter showed more efficient removal efficiencies, with 100% removal for all three PFSAs, suggesting the PFSAs’ sulfonic groups interact more strongly with the resin’s quaternary amine groups than the PFCAs’ carboxylic groups [34].
The binary separation factor (SF, α) is used to indicate the relative selectivity of the resins for each PFAS in a multicomponent system:
α A / B = q A · C B q B · C A
where q and C represent the PFAS uptake in the solid phase (ng/g) and the PFAS concentration in the solution phase (ng/L), respectively. The subscripts A and B denote individual PFAS. Figure 1b gives the resulting α values for each PFCA in reference to PFBA. In general, a value of αA/B > 1 indicates that the resin is more selective for species A than B. All PFCA species had a value of α > 1, confirming that longer-chain PFCAs are more favorably adsorbed by IRA900. Moreover, α increased with the carbon chain length, though much more obviously from CA6 to CA8 than from CA4 to CA6.

3.3. pH Effect

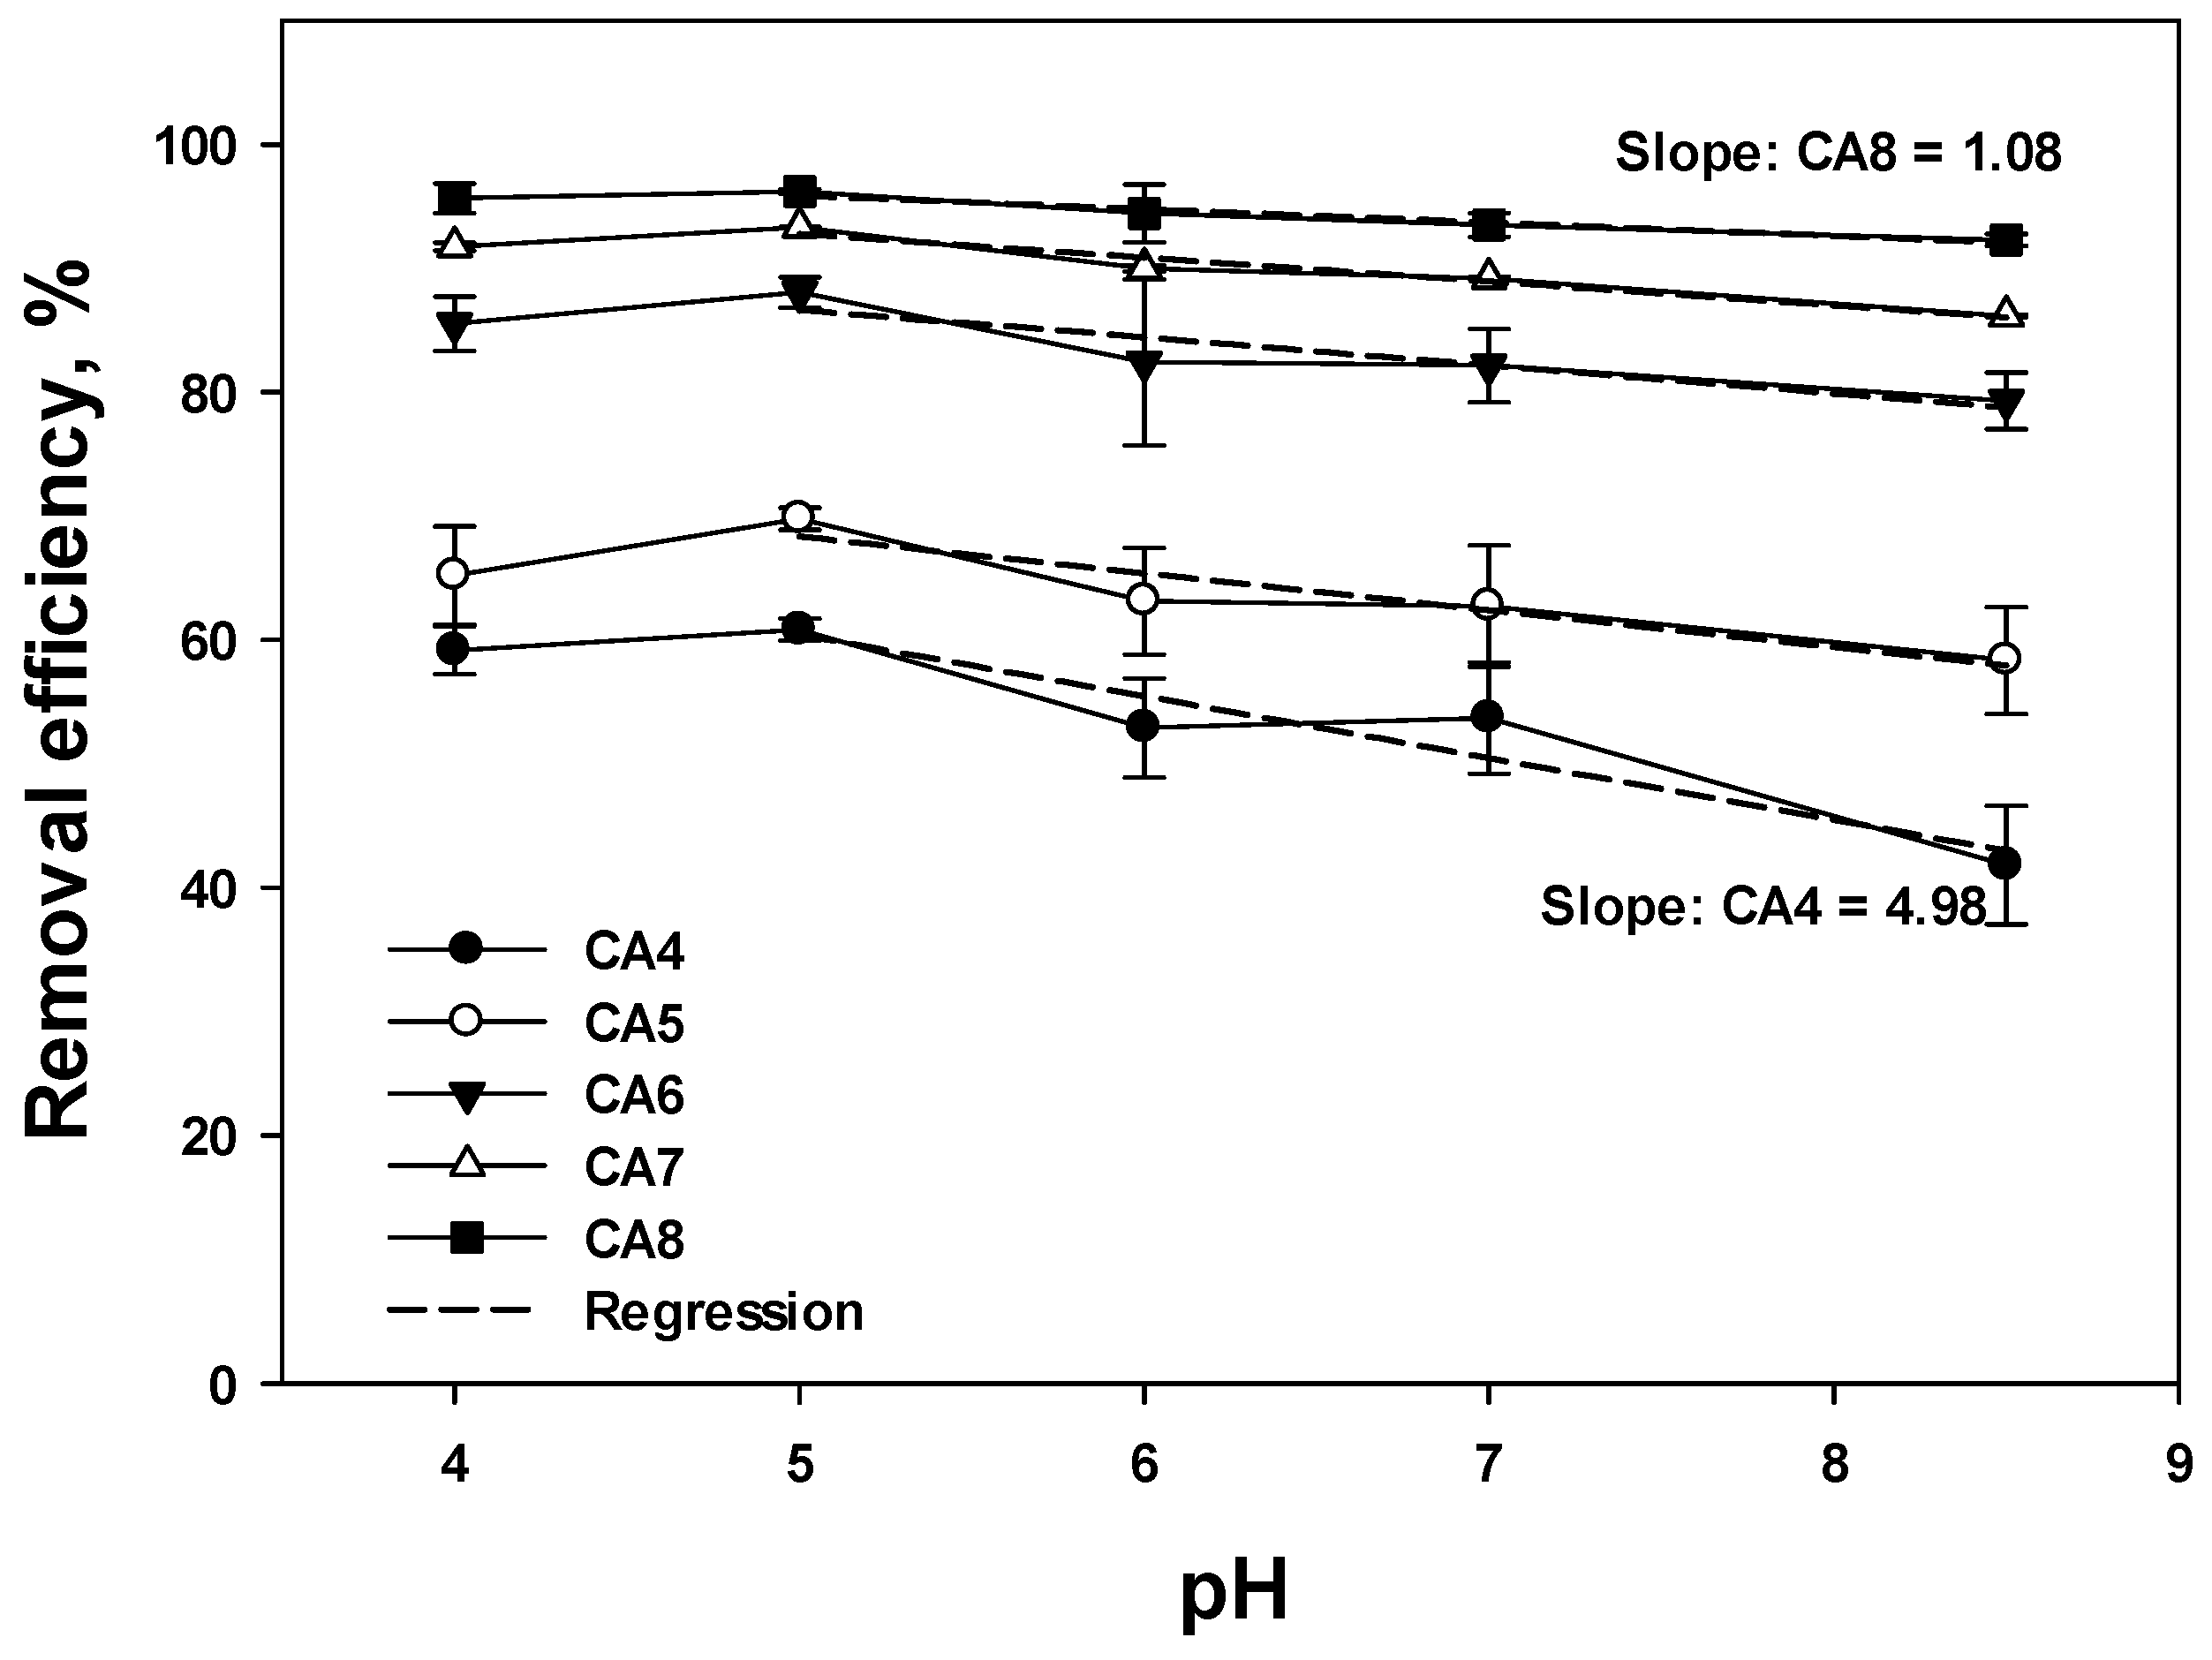
The solution pH plays a critical role in the removal of a contaminant because of its effects on the surface charge of the sorbent and on the speciation of the target contaminant. In addition, hydrogen (H+) and hydroxide (OH) ions can act as competing ions at extreme pH levels. Figure 2 shows the equilibrium removal efficiencies for the five PFCAs using IRA900 as a function of pH. The results for the PFSA species are not shown because a removal efficiency of almost 100% was obtained regardless of the pH. In accord with the nature of strong-base AERs, the resin showed decent removal for all PFCAs over the broad pH range of 4–9, though it appeared that at pH > 6, the uptake dropped slightly, which appeared more notable for the shorter PFCAs (CA4), corresponding with Shahrokhi et al. (2025) [35]. The degree of the uptake decline with elevated pH may be quantified by the slope of a regression line, which increased from −1.08 for CA8 to −4.98 for CA4. A comparison of the two slopes obtained a t-statistic of −3.07 with a corresponding p-value of 0.02 (<0.05). Based on the pHpzc results (Figure S1), a higher pH would result in a more negative surface charge and thus would not favor the PFAS uptake. In addition, the competition of hydroxide ions increases with increasing pH (e.g., pH 8.5), especially for the short-chain PFSAs. Note that the effect of ionic strength can be ignored due to the calculated ionic strength remaining virtually constant through the tested pH range, listed in Table S5, indicating that ionic strength variation was not a contributing factor.

3.4. Isotherms

Figure S2 shows the isotherm model for the 10 PFAS using IRA900. The classical Langmuir and Freundlich isotherm models were employed to interpret the experimental isotherm data, and Table S6 gives the best-fitted model parameters. The p-value derived from a two-sample t-test assuming equal variance is 0.0562 for the 10 PFAS and 0.00469 if SA8, which had an R2 of only 0.790, is excluded. The better fitting to the Langmuir isotherm model supports the notion that the IX resin removes PFAS following the monolayer adsorption mechanism [36]. The value of b (Table S6) indicates the affinity for each species [37] and demonstrates that the PFSAs displayed a clearly higher affinity than the PFCA counterparts. Among the PFCA homologues, the order of b values followed that of the carbon chain length. Excluding SA8, the PFSAs had a similar trend to the PFCAs.
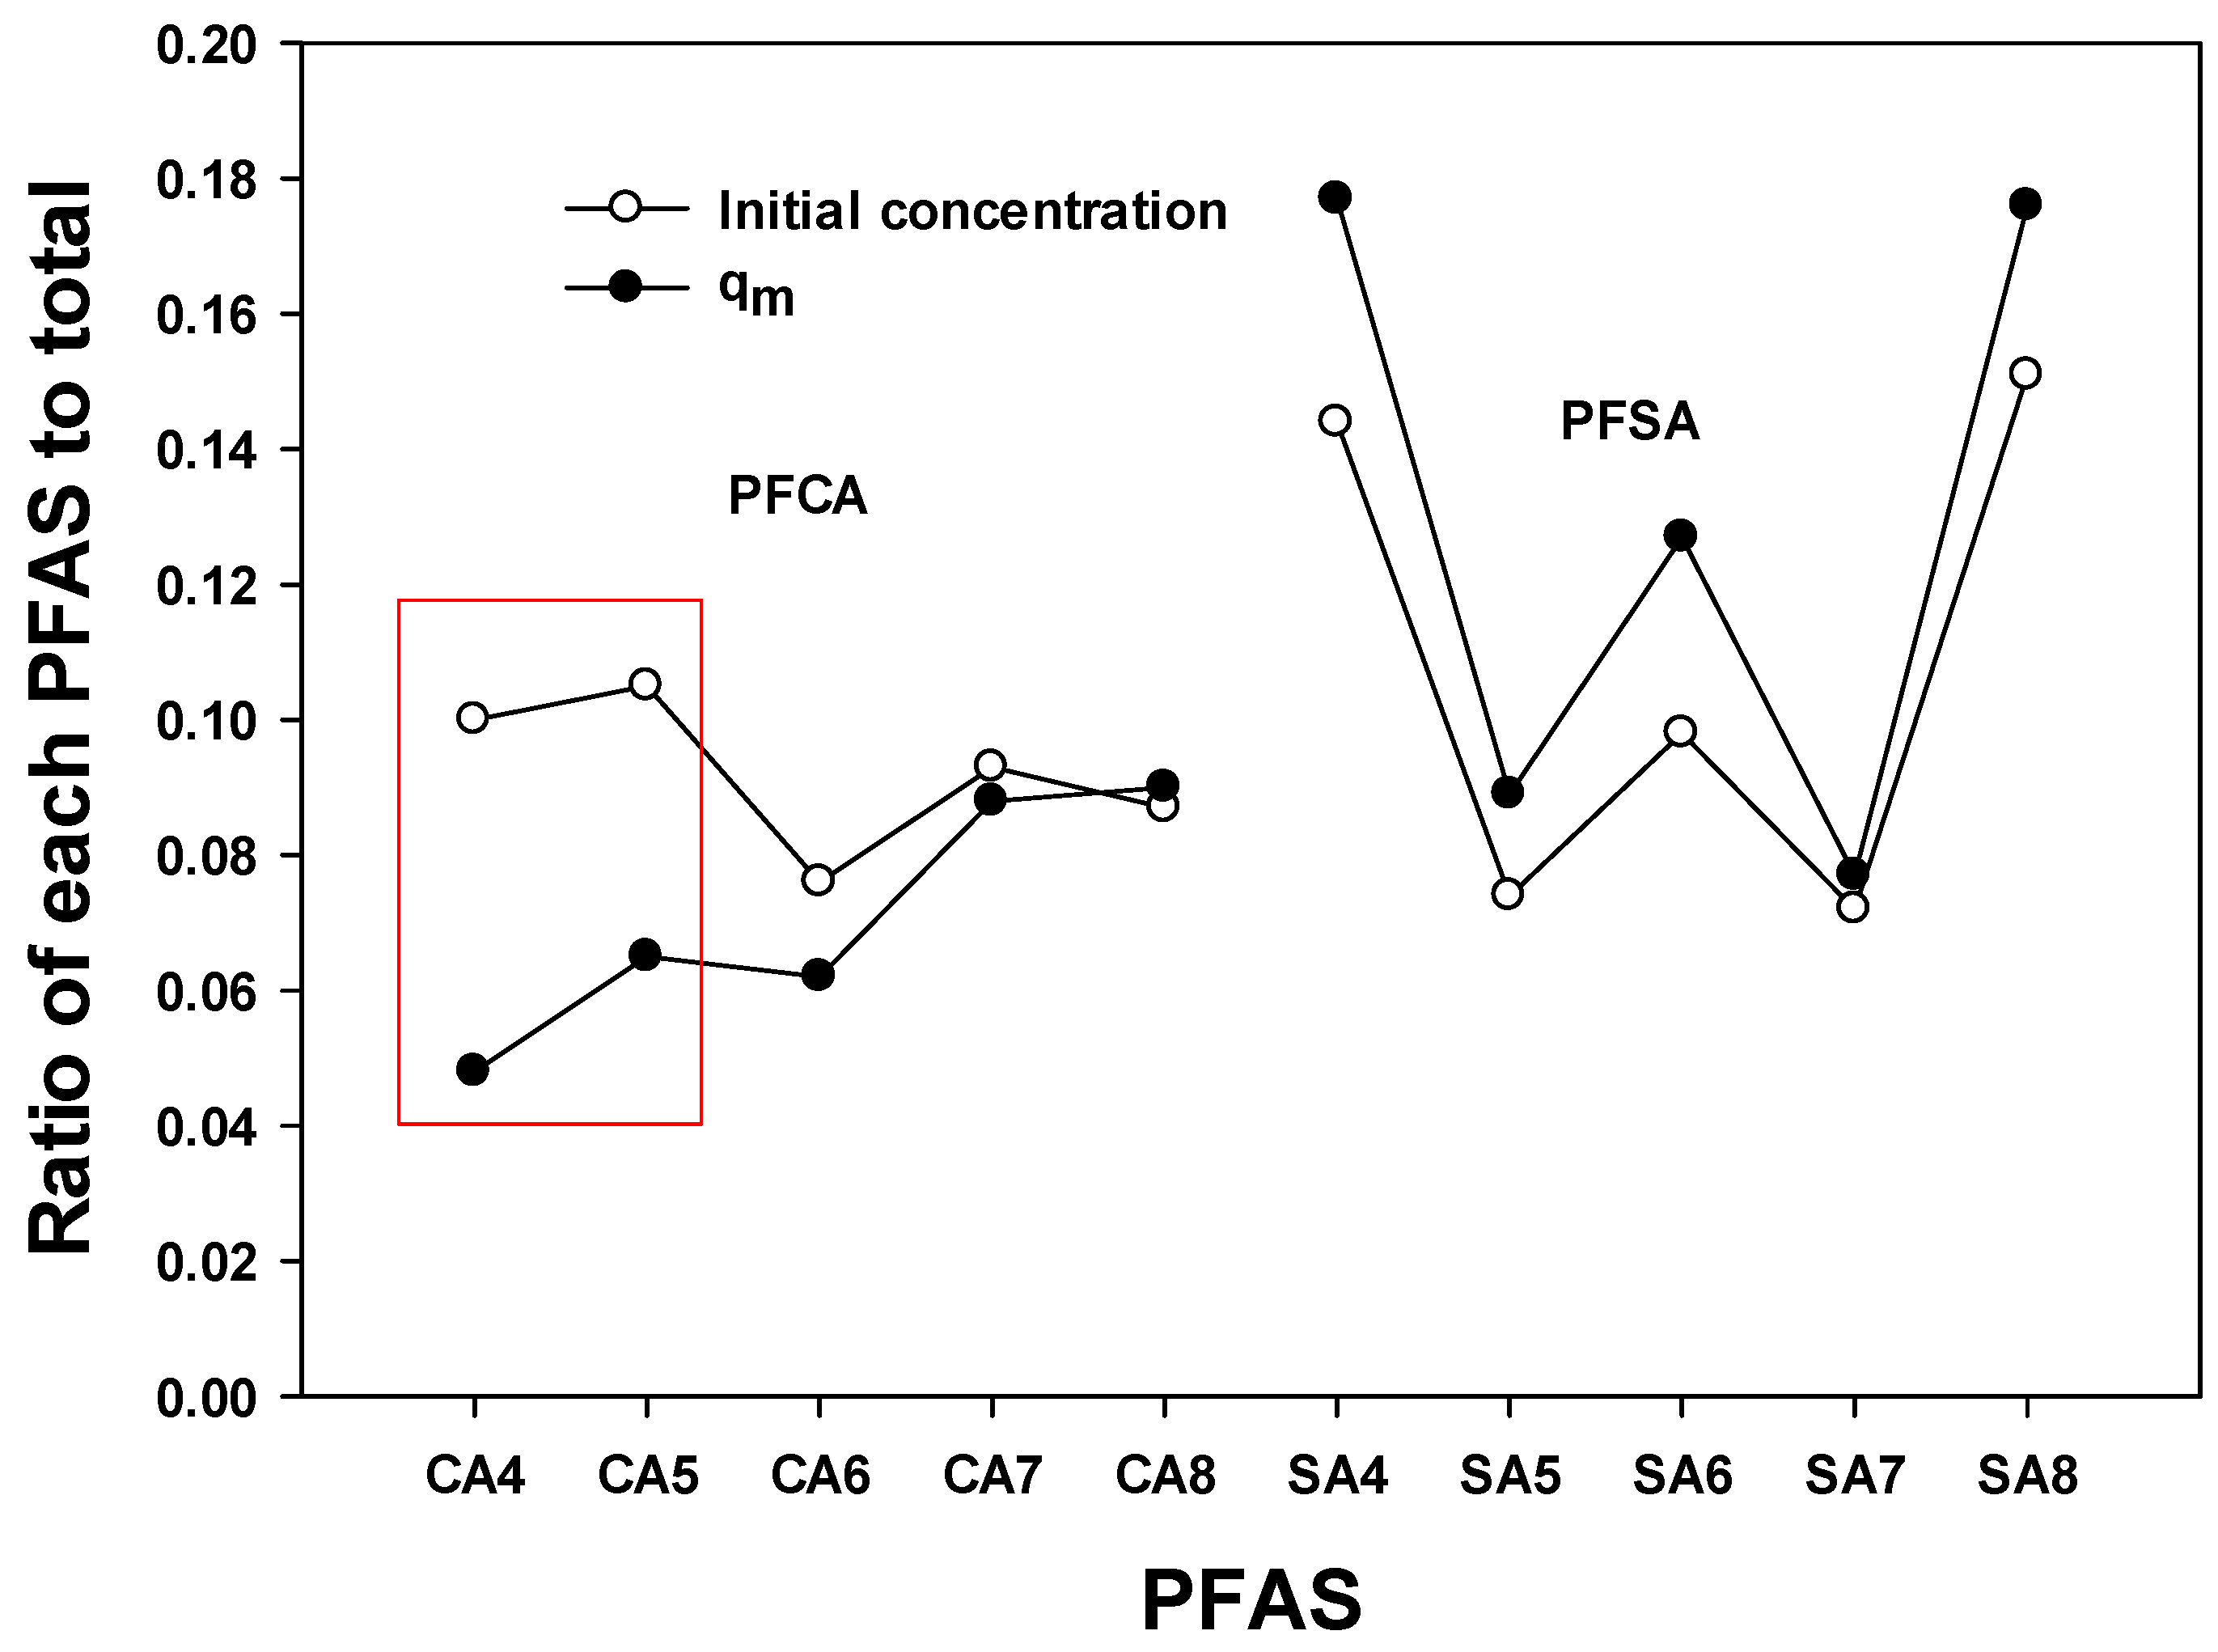
As noted in the Materials and Methods section, the initial concentration of each PFAS in the multicomponent system was not uniform, which would influence their uptake capacity. To account for this, Table 1 and Figure 3 present the ratio of the initial concentration and the maximum Langmuir uptake capacity (qm) for each PFAS relative to total values, which can be used to evaluate their removal characteristics in multicomponent systems.
As shown in Figure 3, qm (closed symbols) had a positive correlation with the initial concentration (open symbols) for all PFAS except for CA4 and CA5 (red box). A correction of coefficient (CC) value of 0.80 was obtained for all 10 species and 0.96 if CA4 and CA5 were excluded. Consequently, a higher initial concentration results in a higher qm except for CA4 and CA5. This suggests the relatively low qm (1664 ng/g and 2274 ng/g) was not a result of initial concentration effect.
In Table 1, the initial concentration ratios of PFCA and PFSA relative to total PFSA were 0.461 and 0.539, respectively, while their respective qm ratios were 0.352 and 0.647, indicating a 23.6% decrease for PFCA and a 16.7% increase for PFSA. Similarly, the relative contributions of PFBA and PFPeA decreased from 0.100 and 0.105 (initial concentration ratio) to 0.048 and 0.065 (qm ratio), showing significant decreases of 52% and 38%, respectively. These results demonstrate that the capacity of IX in competitive multicomponent PFAS systems of PFSAs is significantly diminished by a carboxylic acid group and a shorter carbon chain.

3.5. Effect of Sulfate

3.5.1. Effect on Equilibrium Removal Efficiency

The removal capacity or order of the IX process is determined by the relative selectivity [38]. For standard AERs, sulfate has been known to have a higher selectivity than most common anions in water (e.g., chloride, bicarbonate, nitrate, and phosphate) [38].
As given in Table 2, the total PFAS uptakes of IRA900 and GAC were 6379 ng/L and 6045 ng/L, respectively, i.e., with a difference of 6% (in Table 2: ratio of IRA900 to GAC: 1.06). In the presence of 20 mg/L sulfate, the PFAS uptakes of IRA900 and GAC decreased by 16.2% and 18.0%, respectively, resulting in a difference of 8% of total PFAS uptake (in Table 2: ratio of IRA900 to GAC: 1.06). Increasing the sulfate concentration to 40 mg/L did not further affect the PFAS uptake of GAC, but it suppressed the uptake of IRA900 to 29.5%, which is 15% lower than GAC. This can be explained by comparing the sulfate uptakes. When the sulfate concentration was increased from 20 mg/L to 40 mg/L, the sulfate removal efficiency by GAC remained below 15%. In contrast, the ratio of sulfate uptake by IRA900 and GAC was 11.2 at a sulfate concentration of 20 mg/L and 10.5 at a sulfate concentration of 40 mg/L, which indicates that IRA900 had a much higher uptake capacity for sulfate. Therefore, the lower PFAS uptake for IX at a higher sulfate concentration can be attributed to both the low adsorption of sulfate by GAC and high uptake of sulfate by IRA900. The comparison also reveals that GAC offers stronger hydrophobic interactions than the PS matrix of IRA900, while IRA900’s functional groups provide additional electrostatic interactions, which can enhance the uptake of target PFAS but are more vulnerable to competitive effects from competing anions.
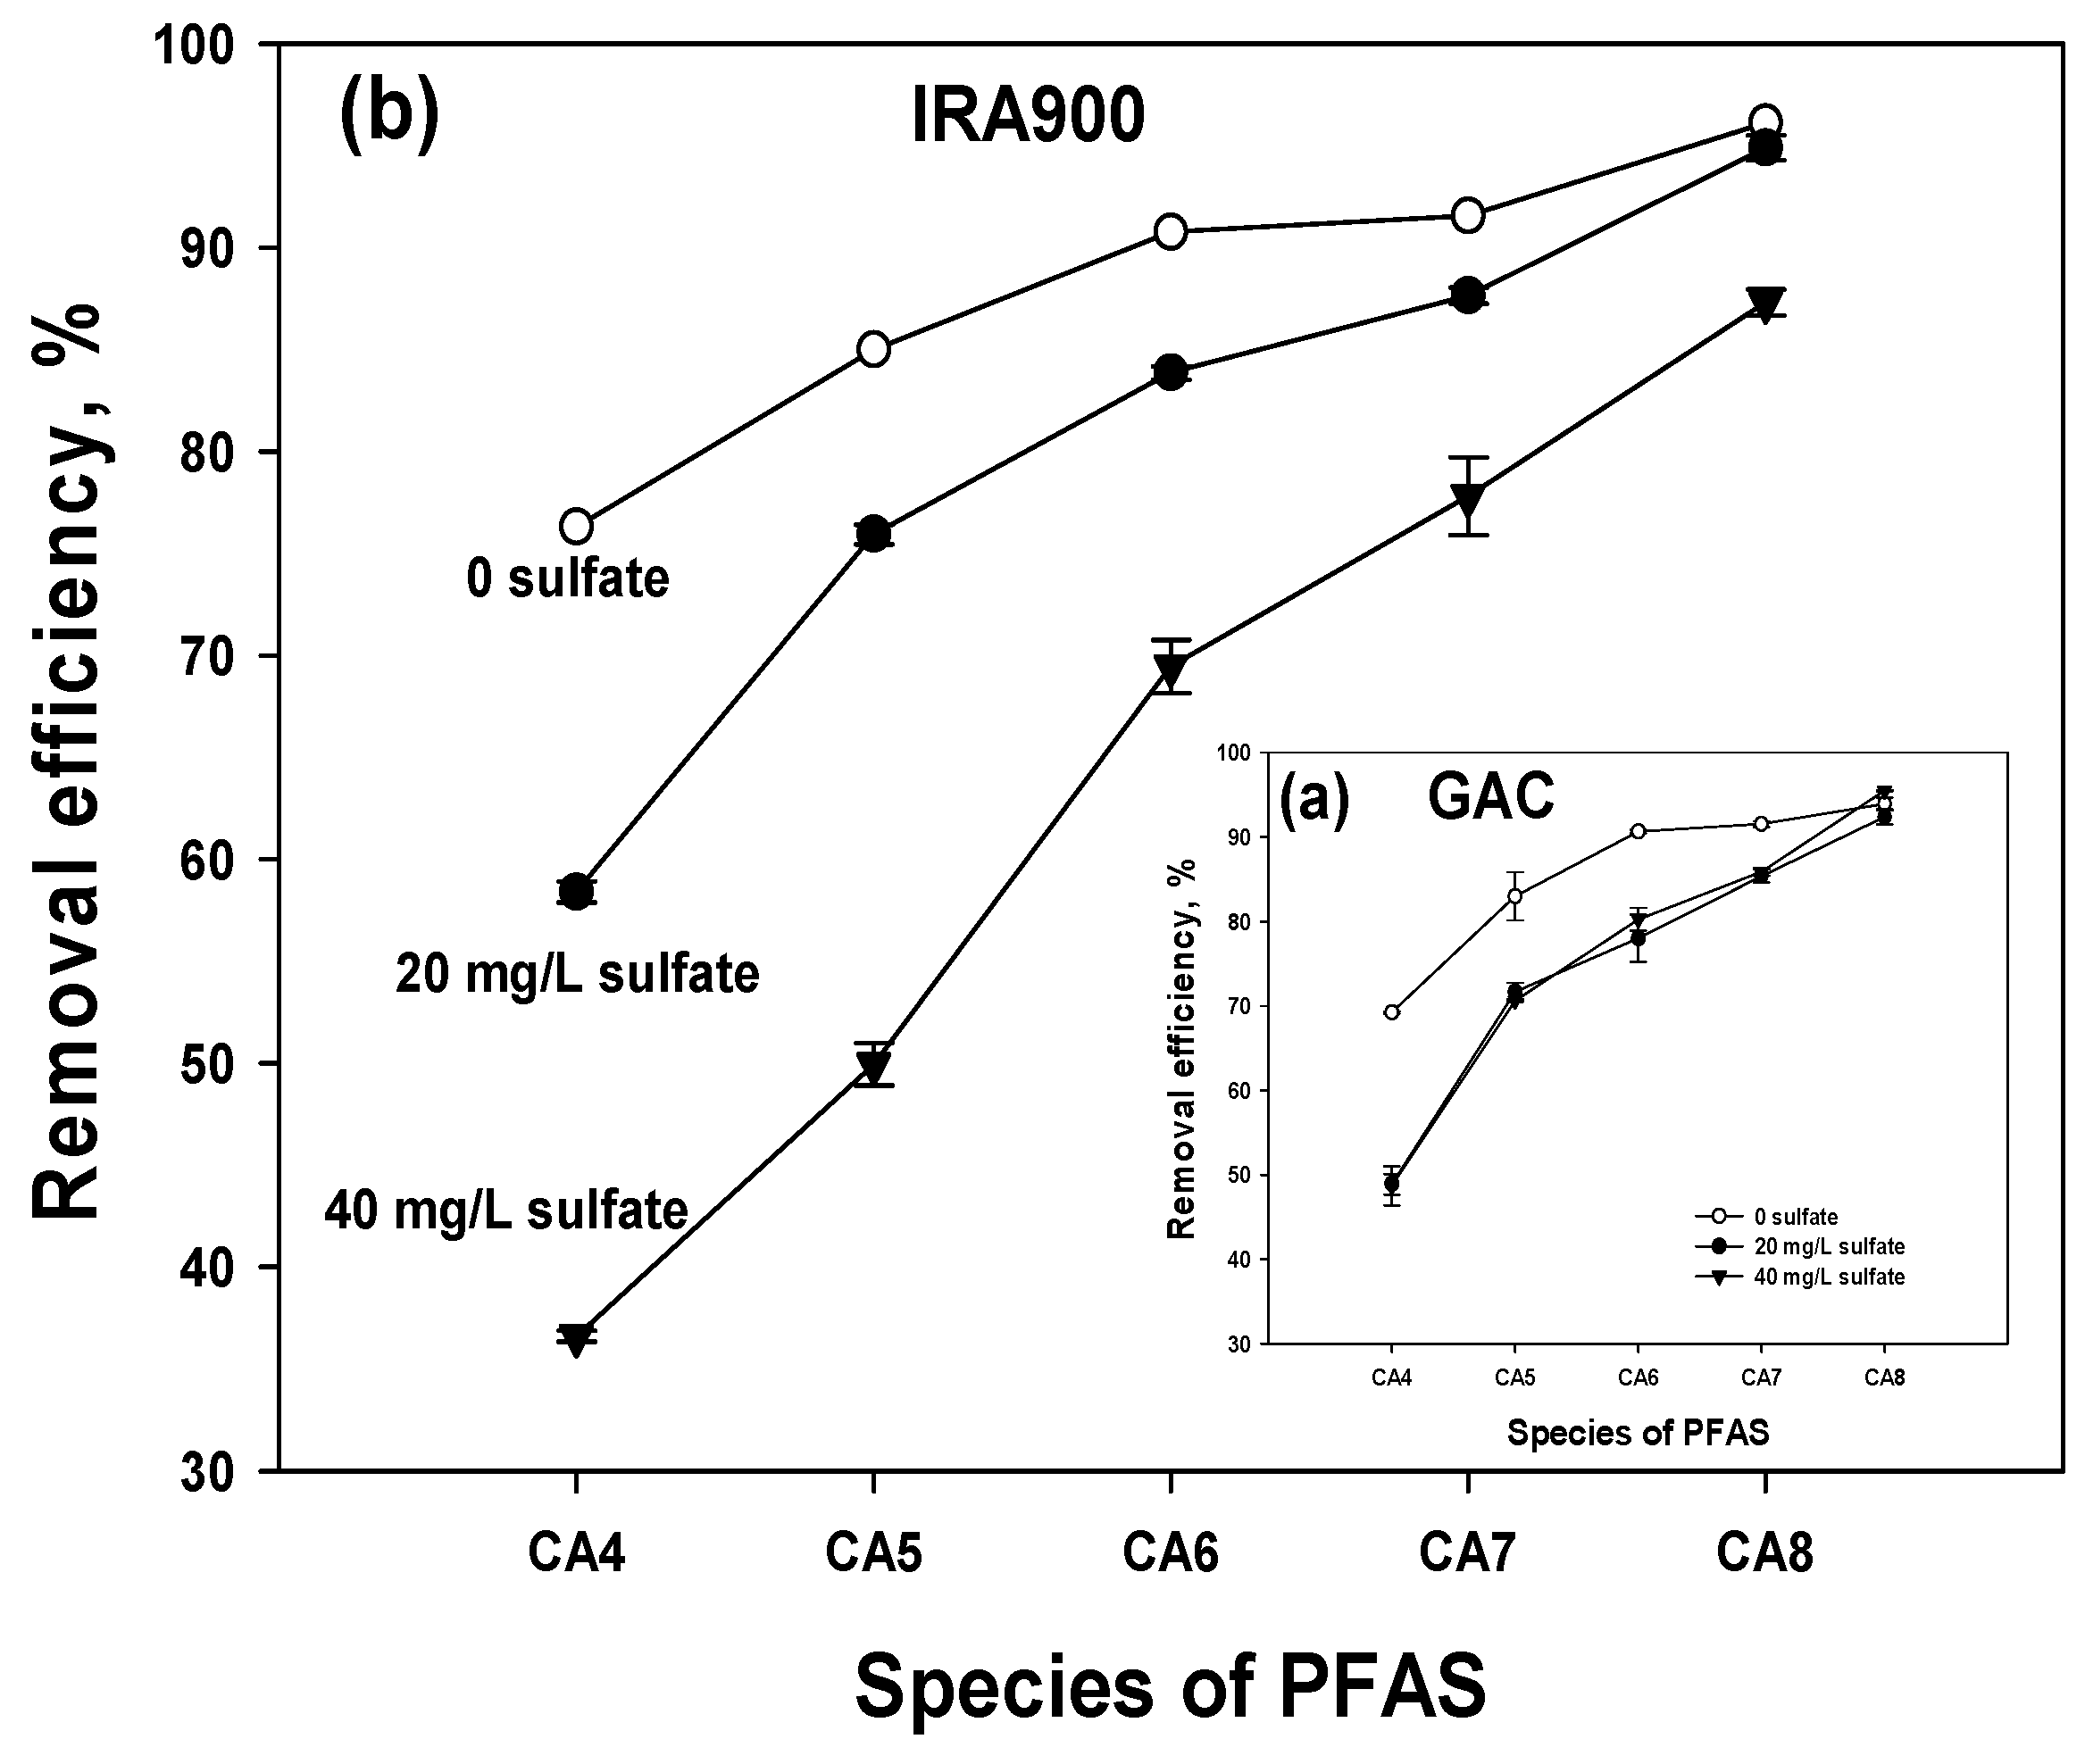
Figure 4 and Table 3 compare the removal efficiencies of each species according to the sulfate concentration. Increasing the sulfate concentration from 0 to 20 mg/L decreased the removal efficiencies for all species except for CA8 for both IRA900 and GAC. Increasing the sulfate concentration further to 40 mg/L of sulfate decreased the removal efficiencies for all species for IRA900 but had no effect for GAC. The rate of decrease (i.e., slope) was greater for shorter carbon chains. In practical applications, while GAC has been considered more effective for long-chain PFAS and AERs are for suitable for short-chain PFAS, the level of competing water matrix components such as sulfate may also affect the choice of the most effective sorbent materials.

3.5.2. Effect on Removal Rates

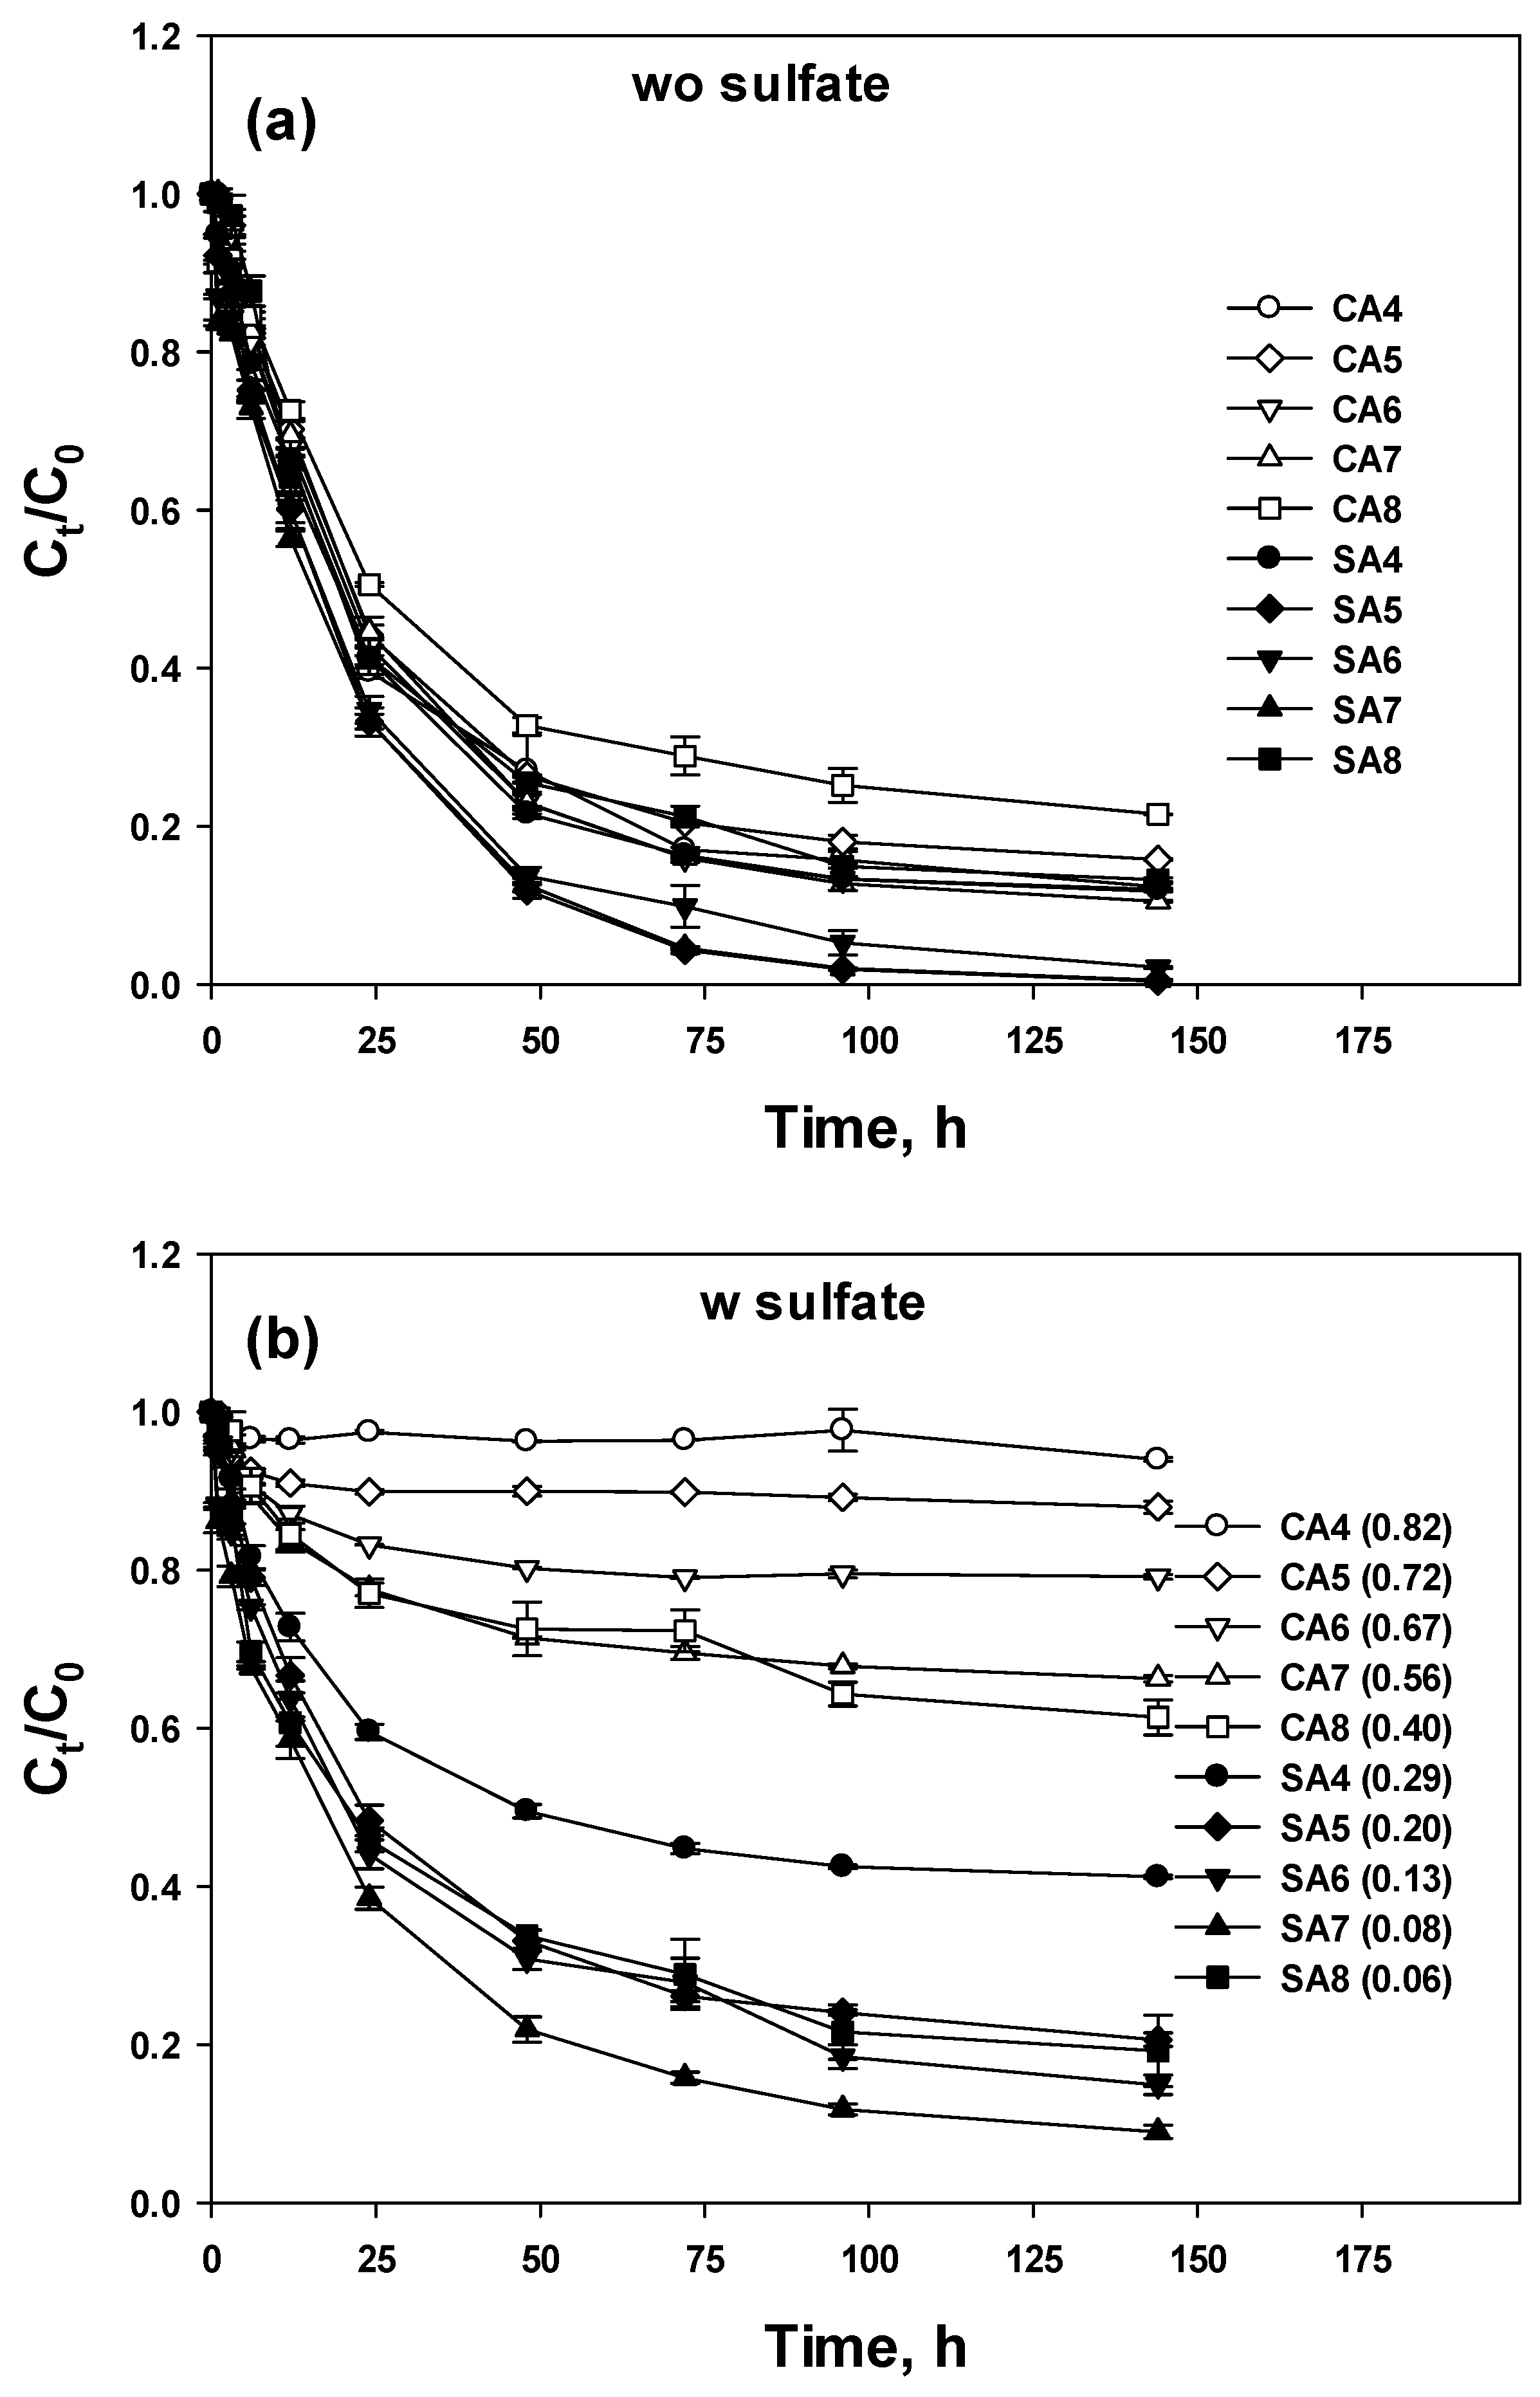
Figure 5 plots the kinetic data during adsorption of the 10 PFAS by IRA900 with or without sulfate (50 mg/L) as a function of time (h). Figure 5a shows that IRA900 was able to effectively remove all 10 PFAS, with a removal efficiency ranging from 80 to 100%, and Figure 5b shows that the presence of sulfate dramatically altered the kinetic profiles, including the value of reduction rate. First, the final removal for all PFAS was lowered, ranging from 8% for CS8 to 82% for CA4. Second, when comparing the value of reduction rate, the effect on different PFAS varied dramatically, with much greater effect on the PFCAs than the PFSAs. Moreover, shorter-chain PFAS suffered from greater competitive effect from sulfate.
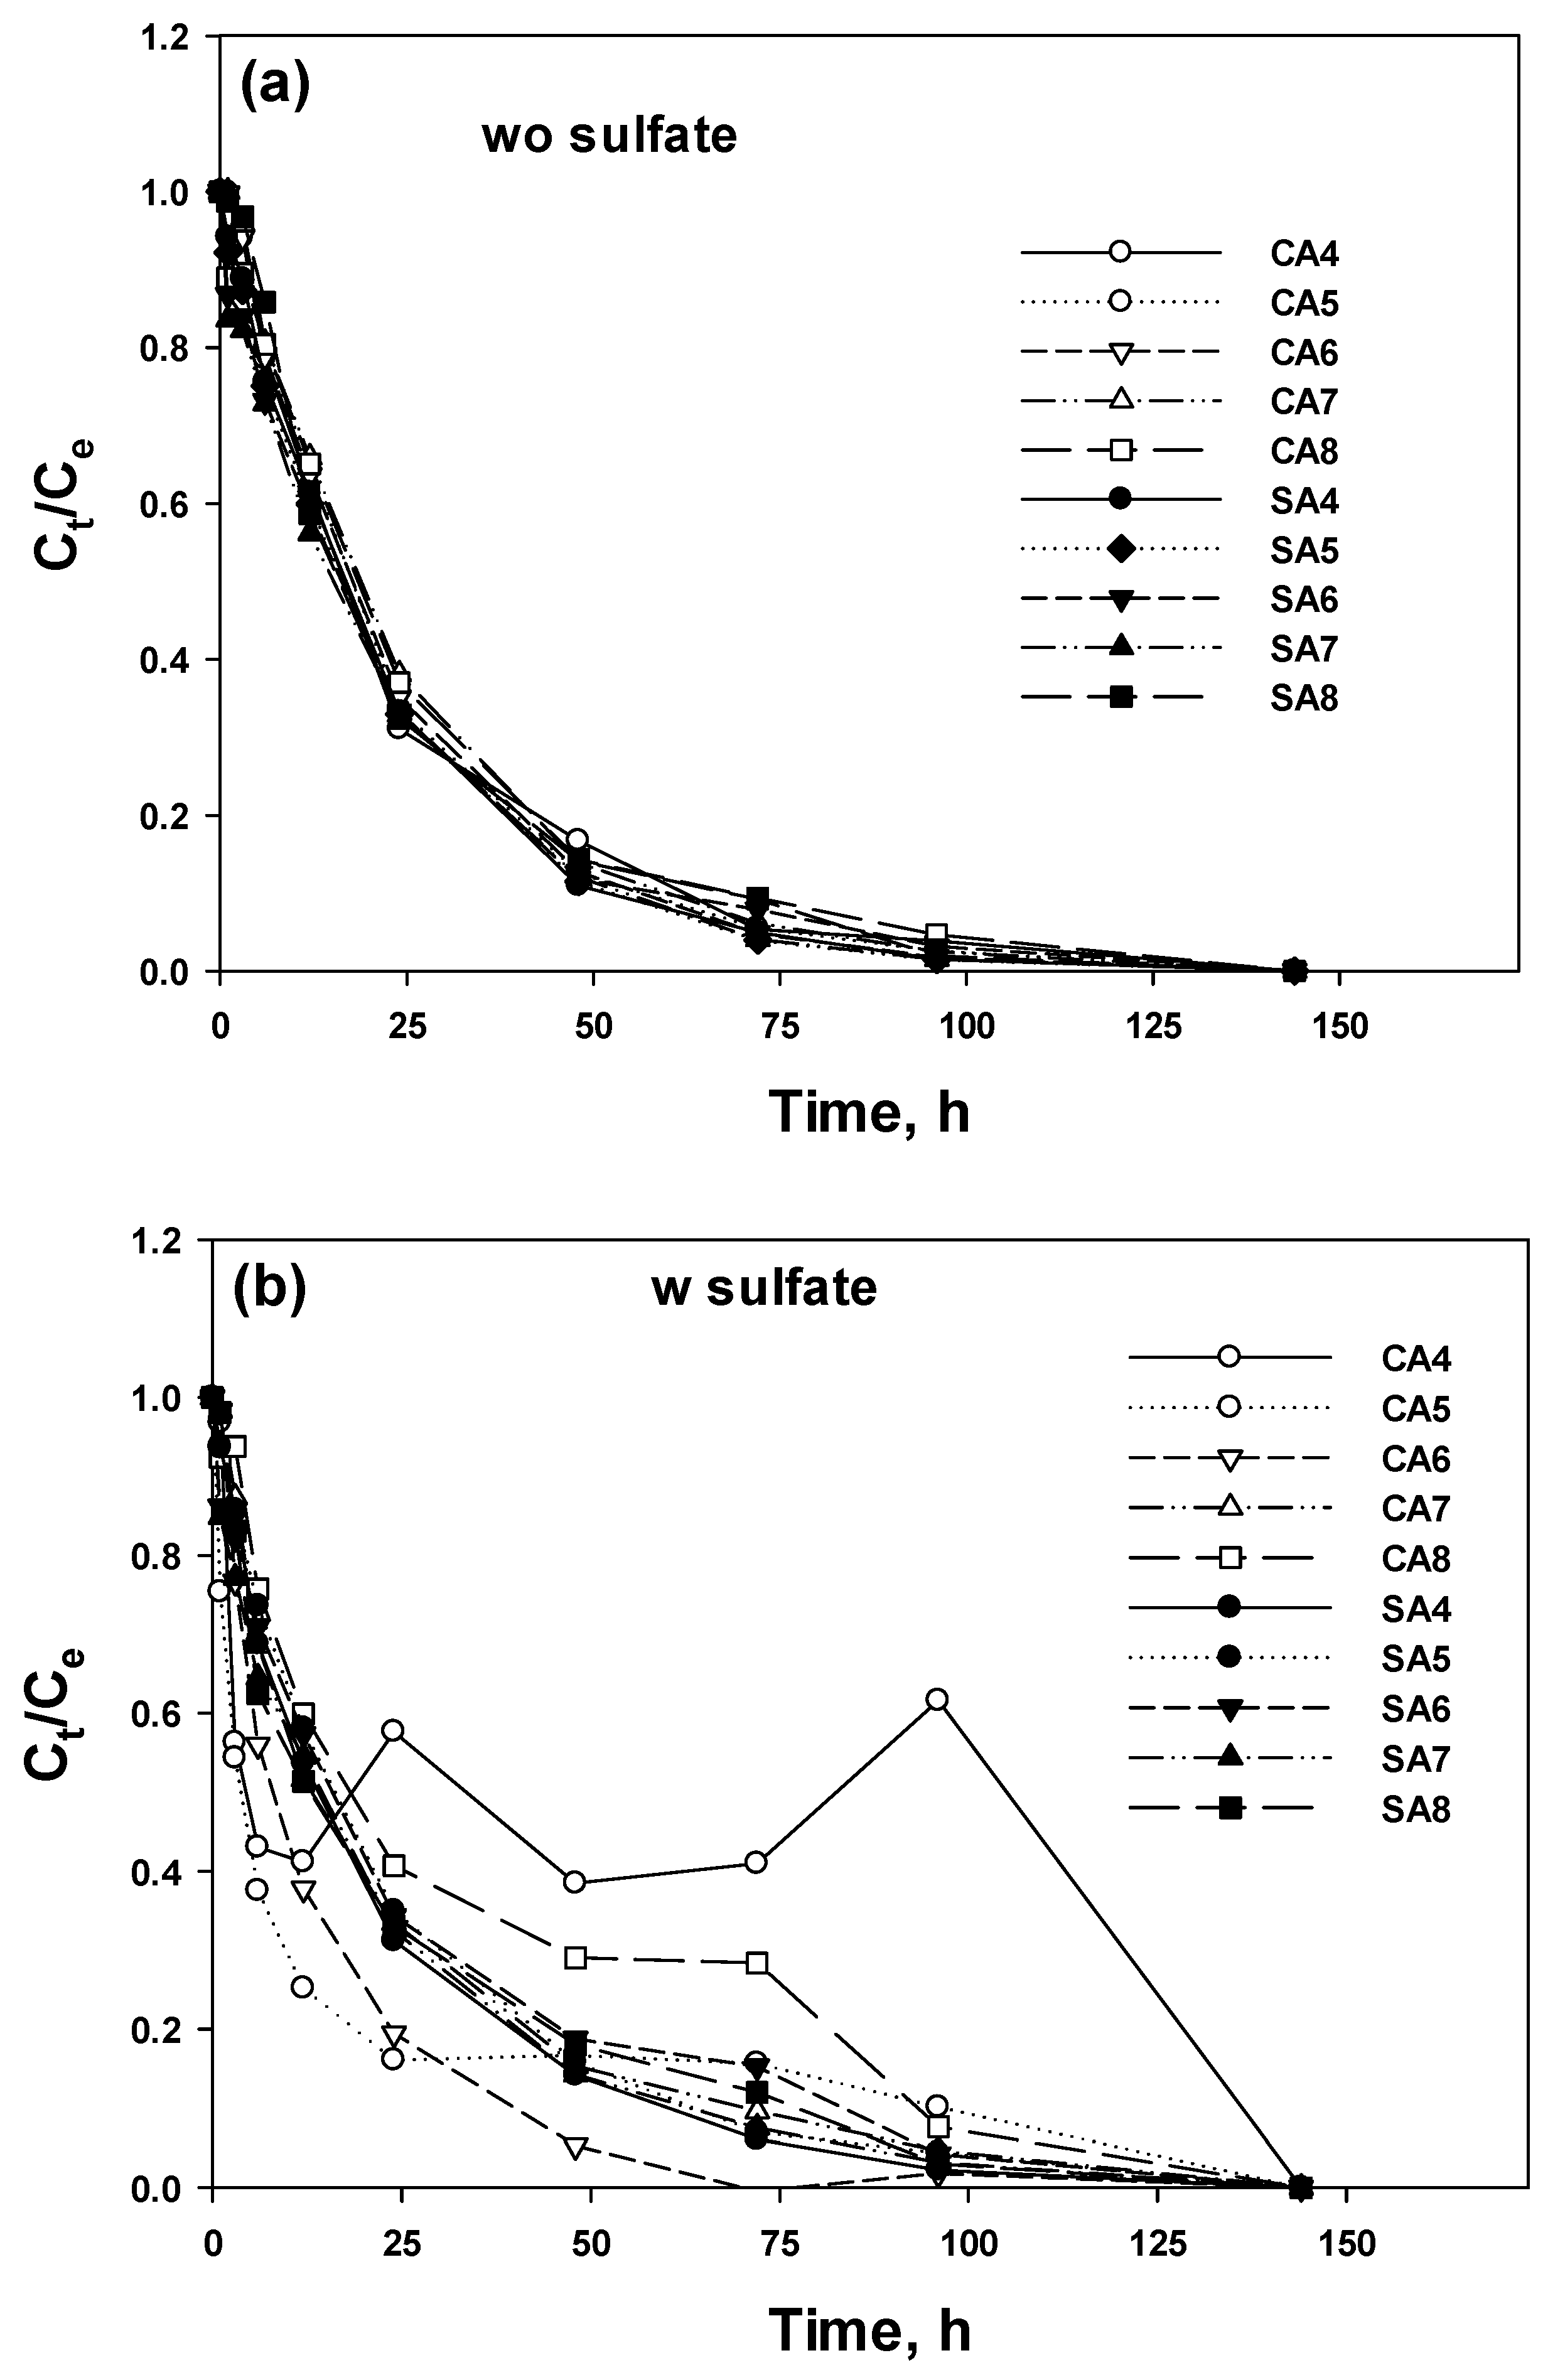
Figure 6 plots the Ct/Ce from the kinetic tests with or without sulfate to better reveal the effect of sulfate on the IX kinetics. Without sulfate, the Ct/Ce kinetic curves nearly overlapped for all 10 PFAS including both PFCAs and PFSAs.
The pseudo-first-order (PFO) [39] and pseudo-second-order (PSO) kinetic models [40,41] were employed to fit the experimental data:
q t = q e ( 1 e k t )
q t = k 2 q e t 1 + k 2 q e 2 t
where qe and qt are the uptakes of adsorbates at equilibrium (ng/g) and at time t (h), respectively. k1 (h−1) and k2 (g/ng·h) are the rate constants for the PFO and PSO models, respectively. Table S7 gives the best-fitted model parameters and the sum of R2 values for the various PFAS. Based on the sum of R2 values, both models were able to adequately fit the experimental kinetic data, though the PFO model gave a higher sum of R2 values than the PSO model. Next, an analysis of variance was performed. The p-value for R2 values between the two model fittings was 0.0506 without sulfate and 0.411 with sulfate. Consequently, the PFO model was used in the following discussion.
Table 4 gives the k1 values for all PFAS. The mean k1 value is 0.040 ± 0.0056 (SD) if all PFAS are considered, 0.0408 ± 0.0048 for PFCAs, and 0.0473 ± 0.0045 for PFSAs. The overlapping kinetic profiles indicate that all the PFAS share similar kinetics and removal rates when sulfate is absent (Figure 6a). However, the presence of sulfate remarkably altered the kinetic profiles, in particular, the short-chain PFCAs (CA4, CA5, and CA6), which clearly deviated from the main pool of the kinetic curves (Figure 6b). The mean k1 value was 0.177 ± 0.273 for all PFAS, 0.291 ± 0.350 for PFCAs, and 0.0628 ± 0.00855 for PFSAs only. Namely, the SD values increased by 302.3%, 613.2%, and 32.8% for the three cases, respectively, compared to those without sulfate, indicating that sulfate affected the different PFAS differently. The largest increases in k1 were observed for CA4, CA5, and CA6, which exhibited a clearly faster initial (<10 h) uptake rate (Figure 6b) than the other PFAS. Taken together with the data in both Figure 5 and Figure 6, the faster removal rates for the shorter-chain PFAS are associated with the much-reduced final uptake level in the presence of sulfate.

3.6. Regeneration and Reusability of IRA900

Three regenerants were tested to regenerate PFAS-laden IRA900, including a 4% NaCl solution, a 70% methanol solution, and a combination thereof. NaCl has been widely used for regeneration of exhausted resins because of its low cost and minimal toxic effect on humans [42]. Methanol has been known to be effective for extracting organic pollutants from various adsorbents, including PFAS from IX resins [43]. Researchers have also reported that a mixture of an inorganic salt and an organic solvent resulted in more efficient regeneration of PFAS due to the associated synergistic effect [44,45].
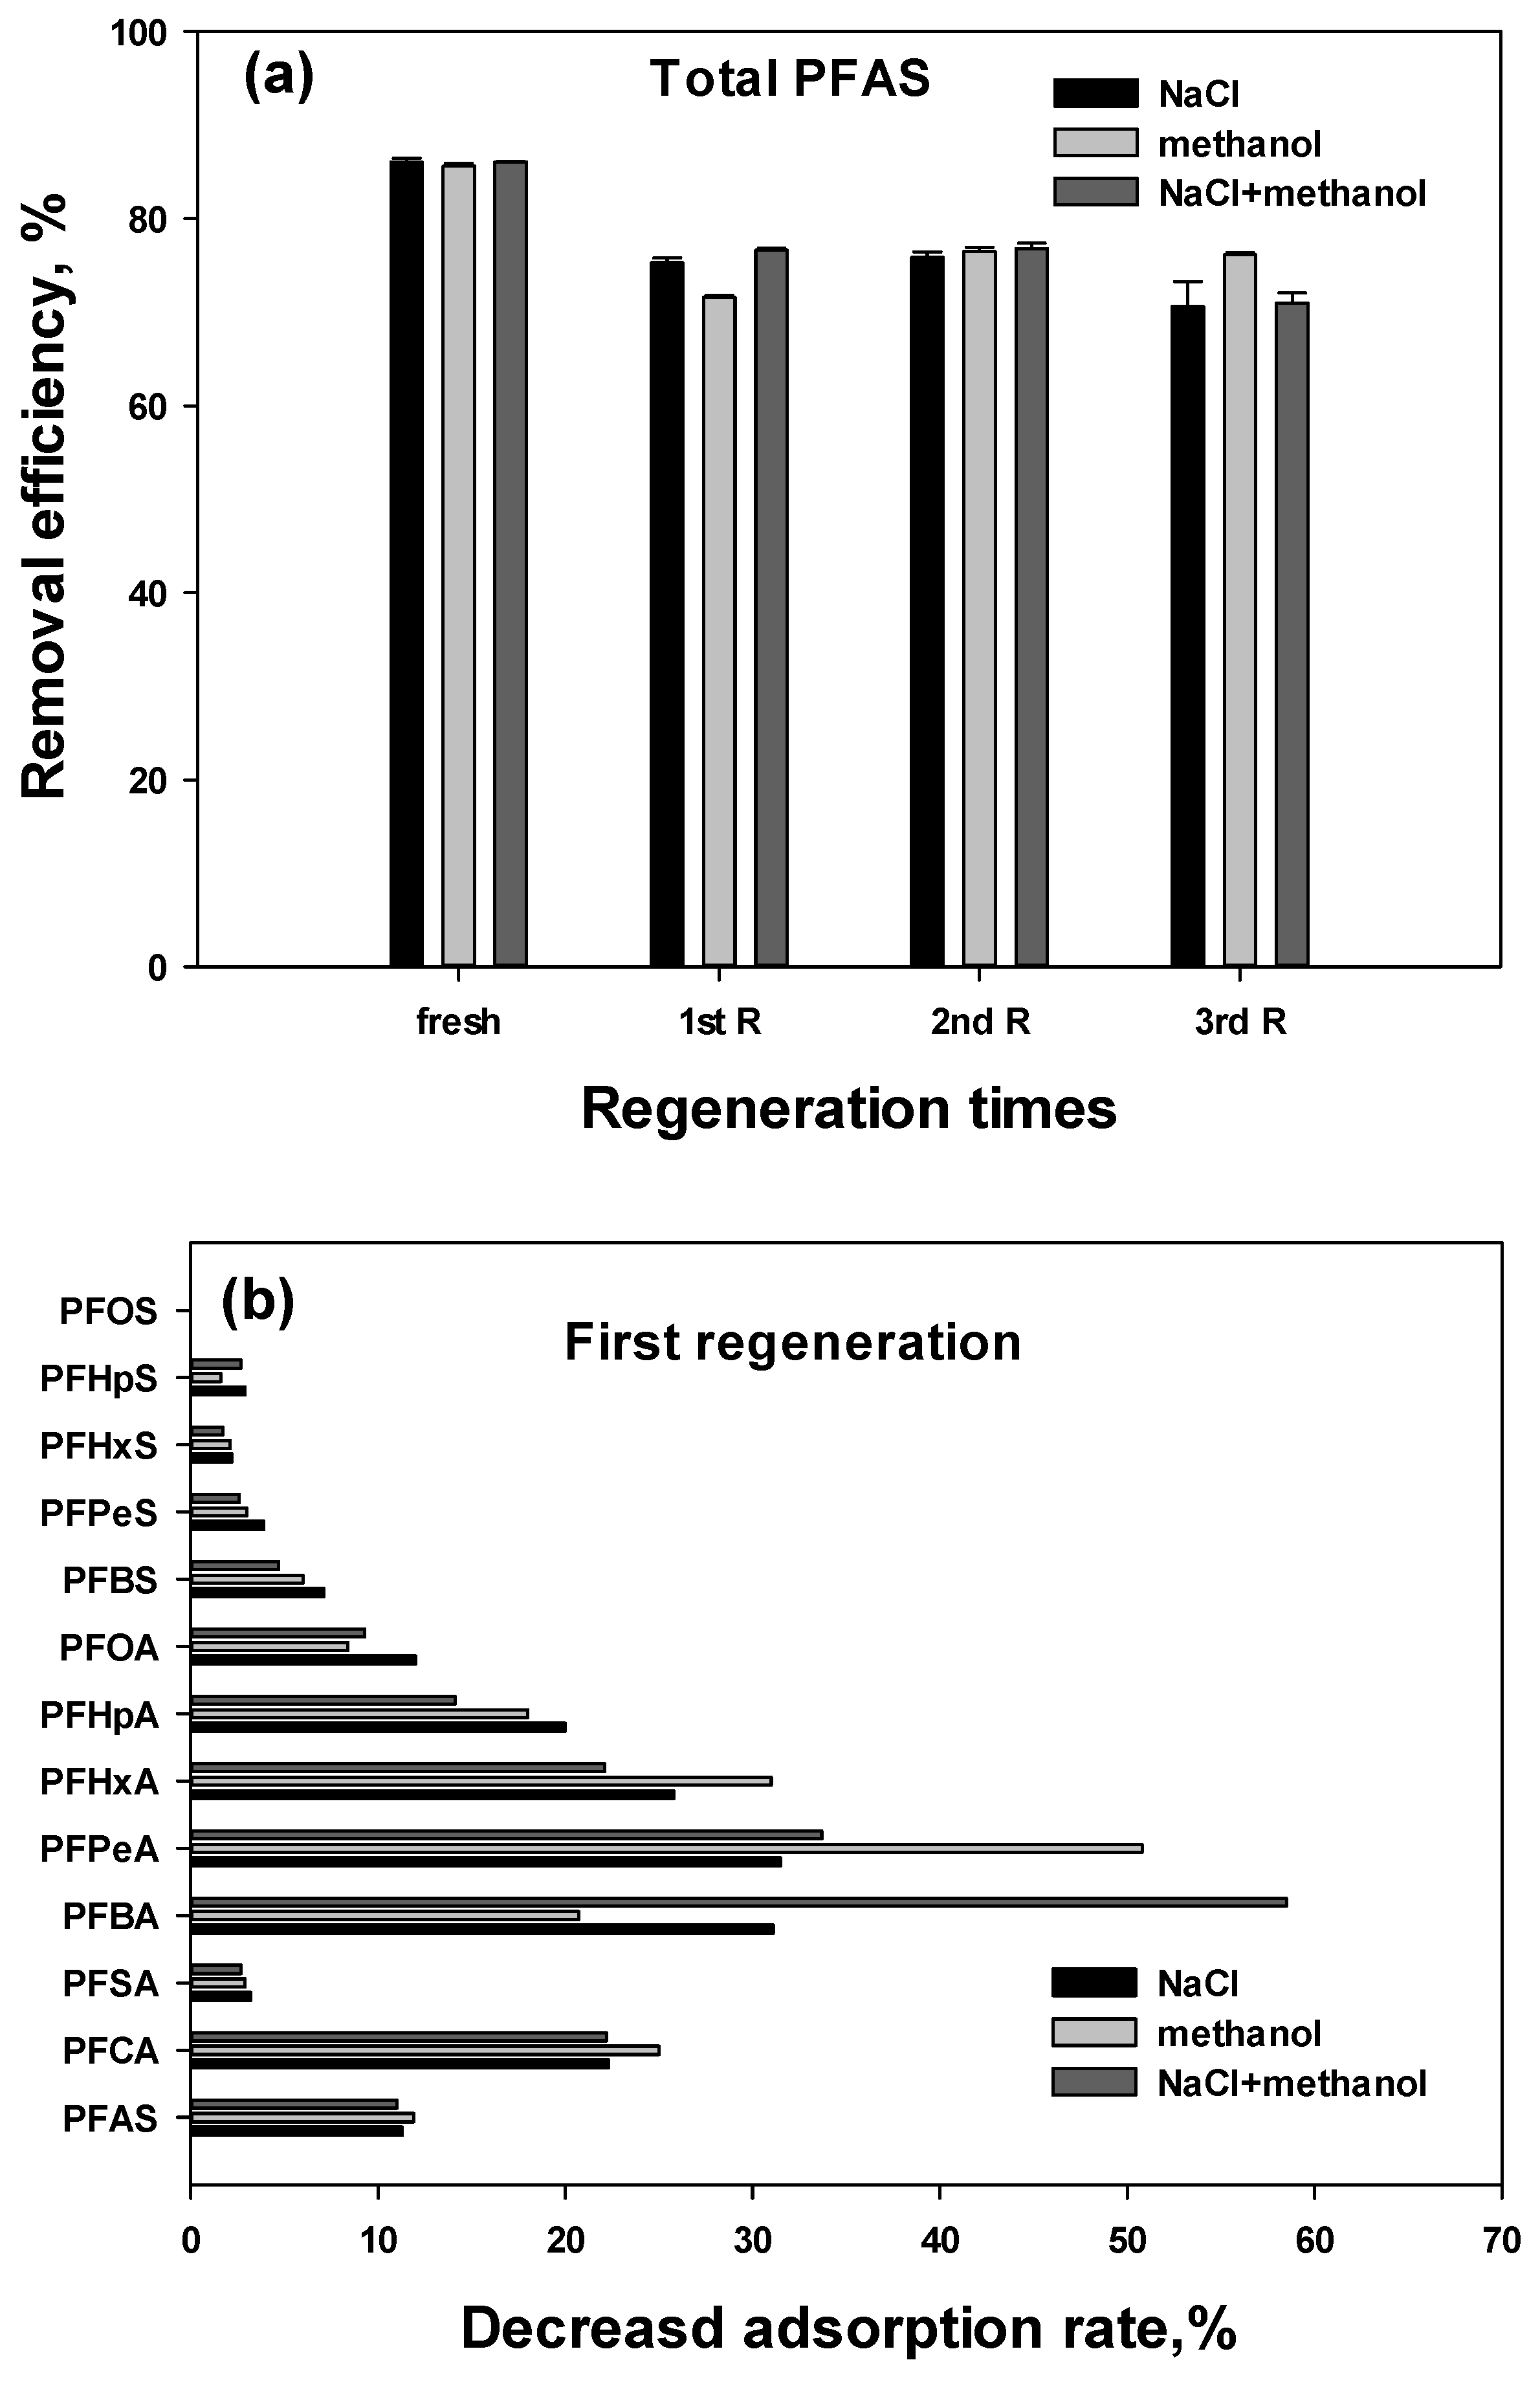
Figure 7a shows the total PFAS removal efficiency in four consecutive adsorption–regeneration cycles. After the first cycle, the average removal efficiency decreased by approximately 11.8% (±1.6%), or by 12.6%, 10.7%, and 12.1% for the cases of NaCl, methanol, and mixed NaCl + methanol, respectively. The removal efficiency remained stable thereafter, and the type of regenerant had no significant effect (p-value: 0.455). Figure 7b shows the decrease in removal efficiency after the first regeneration cycle for individual PFAS compared with fresh IRA900 (Table S8). Similar results were observed after the second and third cycles (not shown because of insignificant changes). Table S8 and Figure 7b indicate that the removal efficiencies for the PFCAs and PFSAs decreased by 23.1% and 2.9%, respectively. In other words, 85–90% of the decrease in removal efficiency was due to PFCAs. Again shorter-chain PFCAs suffered from greater capacity loss for the relatively lower affinity, which is associated with lower hydrophobicity. Specifically, we now note that during extended real-world application, potential issues such as resin degradation and irreversible fouling—which ultimately lead to a loss of exchange capacity—must be carefully considered.

4. Conclusions

This work studied competitive IX removal of 10 PFAS using two strong-base AERs and investigated the effects of resin matrix, PFAS chain length and functionality, and sulfate. Major conclusions are summarized as follows.
  • While IRA900 and A860 shared similar maximum IX capacity and functionality, IRA900 far outperformed A860 due to its polystyrene matrix, which enabled concurrent electrostatic and hydrophobic interactions with anionic PFAS.
  • The IX resins were more effective at removing PFSAs than their PFCA counterparts. The IX resins showed higher uptakes for longer-chain PFAS, and the chain length effect was more profound for PFCA homologues than PFSAs.
  • IRA900 can perform well over a broad pH range of 4–8.5, though a notable capacity drop was observed at high alkaline pH for short-chain PFCAs (CA4 and CA5), which can be attributed to competition from hydroxide ions.
  • Increasing the sulfate concentration decreased the PFAS uptake by IRA900 and the shorter-chain PFAS were more vulnerable to the sulfate effect. In contrast, the adsorption capacity of GAC was not influenced beyond a threshold sulfate concentration of 20 mg/L. Therefore, determining the specific sulfate concentration thresholds via fixed-bed column testing—while accounting for complex real-water matrices containing DOC, nitrate, and phosphate—is essential when selecting between IX resins and GAC.
  • Kinetic data showed that IRA900 achieved a final total PFAS removal efficiency of ~85% without sulfate and ~80% with 50 mg/L sulfate within 48 h. Without sulfate, all PFAS showed comparable removal rates, while being in the presence of sulfate remarkably suppressed the final uptakes of shorter-chain PFAS, especially CA4 (PFBA), CA5 (PFPeA), and CA6 (PFHxA), which in turn resulted in faster removal rates. The sulfate effects were much less profound for PFSAs.
  • IRA900 was amenable to regeneration using NaCl, methanol, or a combination thereof, which gave comparable regeneration efficiencies. After the first regeneration cycle, the PFAS removal efficiency decreased by 10.7–12.6% with different regenerants, which was mainly attributed to PFCAs. No further notable capacity drop was observed after the first cycle.
The findings may facilitate our understanding of the IX process in multicomponent competitive systems involving multiple (=10) PFAS. The results can also guide the selection of the most suitable resins or adsorbents for complex systems including PFAS of varying chain length and terminal functional groups and complex water matrices containing competitive co-solutes such as sulfate. While these trends provide valuable insights, there are certain limitations in our study, such as the relatively high concentration of PFAS used and the lack of evaluation regarding other competing background ions (e.g., natural organic matter, chloride, and bicarbonate). Therefore, further spectroscopic investigation is necessary in further work.

Supplementary Materials

The following supporting information can be downloaded at https://www.mdpi.com/article/10.3390/w18151869/s1. References [10,46] are cited in Supplementary Materials.

Author Contributions

Conceptualization, B.A.; methodology, B.A.; validation, J.S., H.-S.Y. and H.S.; formal analysis, J.S., H.-S.Y. and H.S.; investigation, J.S.; resources, D.Z.; data curation, J.S.; writing—original draft, B.A.; writing—review and editing, D.Z. and B.A. All authors have read and agreed to the published version of the manuscript.

Funding

This work was supported by the National Research Foundation of Korea (NRF) grant funded by the Korean government (MSIT) (RS-2022-NR070001).

Data Availability Statement

The original contributions presented in this study are included in the article and Supplementary Materials. Further inquiries can be directed to the corresponding author.

Conflicts of Interest

The authors declare no conflicts of interest.

References

  1. Key, B.D.; Howell, R.D.; Criddle, C.S. Fluorinated organics in the biosphere. Environ. Sci. Technol. 1997, 31, 2445–2454. [Google Scholar] [CrossRef] [Scilit]
  2. Prevedouros, K.; Cousins, I.T.; Buck, R.C.; Korzeniowski, S.H. Sources, fate and transport of perfluorocarboxylates. Environ. Sci. Technol. 2005, 40, 32–44. [Google Scholar] [CrossRef] [Scilit] [PubMed]
  3. Shivakoti, B.R.; Fujii, S.; Nozoe, M.; Tanaka, S.; Kunacheva, C. Perfluorinated chemicals (PFCs) in water purification plants (WPPs) with advanced treatment processes. Water Supply 2010, 10, 87–95. [Google Scholar] [CrossRef] [Scilit]
  4. Wee, S.Y.; Aris, A.Z. Revisiting the forever chemicals, PFOA and PFOS exposure in drinking water. npj Clean Water 2023, 6, 57. [Google Scholar] [CrossRef] [Scilit]
  5. Houde, M.; De Silva, A.O.; Muir, D.C.G.; Letcher, R.J. Monitoring of perfluorinated compounds in aquatic biota: An updated review: PFCs in aquatic biota. Environ. Sci. Technol. 2011, 45, 7962–7973. [Google Scholar] [CrossRef] [Scilit] [PubMed]
  6. Yong, Z.Y.; Kim, K.Y.; Oh, J.E. The occurrence and distributions of per- and polyfluoroalkyl substances (PFAS) in groundwater after a PFAS leakage incident in 2018. Environ. Pollut. 2021, 268, 115395. [Google Scholar] [CrossRef] [Scilit] [PubMed]
  7. Danilova, S.N.; Meng, S.D.; Chen, F.; Zhang, Z.Z.; Liu, B.F.; Kolodeznikov, V.E.; Petrova, N.N.; Li, Y.F.; Zhang, Z.F. Seasonal fate and removal of per-and polyfluoroalkyl substances in a wastewater treatment plant with a Bacillus bio-reactor. J. Water Process Eng. 2026, 86, 109911. [Google Scholar] [CrossRef] [Scilit]
  8. Min, X.Z.; Ma, L.; Chen, F.; Hu, Y.H.; Jiang, C.; Li, Y.F.; Han, Y.; Zhang, Z.F.; Kannan, K. Per-and poly-fluoroalkyl substances in lung tissues and their association with lung cancer. J. Hazard. Mater. 2026, 507, 141788. [Google Scholar] [CrossRef] [Scilit] [PubMed]
  9. European Environment Agency. Impacts of PFAS Polymers. 2025. Available online: https://www.eea.europa.eu/en/newsroom/news/impacts-of-pfas-polymers (accessed on 5 January 2026).
  10. Son, H.; Kim, T.; Yoom, H.-S.; Zhao, D.; An, B. The adsorption selectivity of short and long per- and polyfluoroalkyl substances (PFASs) from surface water using powder-activated carbon. Water 2020, 12, 3287. [Google Scholar] [CrossRef] [Scilit]
  11. Brendel, S.; Fetter, É.; Staude, C.; Vierke, L.; Biegel-Engler, A. Short-chain perfluoroalkyl acids: Environmental concerns and a regulatory strategy under reach. Environ. Sci. Eur. 2018, 30, 9. [Google Scholar] [CrossRef] [Scilit] [PubMed]
  12. Smith, S.M.; Wu, A.X.; Smrz, T.; Xiong, L. Adsorption of ultrashort-, short-, and long-cain per- and polyfluoroalkyl substances (PFAS): Impacts of adsorbent, PFAS type, and competitive ions. Chemosphere 2026, 395, 144836. [Google Scholar] [CrossRef] [Scilit] [PubMed]
  13. Shin, J.; An, B. Effect of ligand interactions within modified granular activated carbon (GAC) on mixed perfluorooctanoic acid (PFOA) and perfluorooctanesulfonic acid (PFOS) adsorption. Chemosphere 2024, 357, 142025. [Google Scholar] [CrossRef] [Scilit] [PubMed]
  14. European Environmental Bureau. Toxic Tide Rising: Time to Tackle PFAS. 2023. Available online: https://eeb.org/wp-content/uploads/2023/10/PFAS-in-drinking-water-briefing-final-1.pdf (accessed on 5 January 2026).
  15. Rahman, M.F.; Peldszus, S.; Anderson, W.B. Behavior and fate of perfluoroalkyl and polyfluoroalkyl substances (PFASs) in drinking water treatment: A review. Water Res. 2014, 50, 318–340. [Google Scholar] [CrossRef] [Scilit] [PubMed]
  16. Lei, X.; Yao, L.; Lian, Q.; Zhang, X.; Wang, T.; Holmes, W.; Ding, G.; Gang, D.D.; Zappi, M.E. Enhanced adsorption of perfluorooctanoate (PFOA) onto low oxygen content ordered mesoporous carbon (OMC): Adsorption behaviors and mechanisms. J. Hazard. Mater. 2022, 421, 126810. [Google Scholar] [CrossRef] [Scilit] [PubMed]
  17. Lei, X.; Lian, Q.; Zhang, X.; Karsili, T.K.; Holmes, W.; Chen, Y.; Zappi, M.E.; Gang, D.D. A review of PFAS adsorption from aqueous solutions: Current approaches, engineering applications, challenges, and opportunities. Environ. Pollut. 2023, 321, 121138. [Google Scholar] [CrossRef] [Scilit] [PubMed]
  18. Pannu, M.W.; Chang, J.; Medina, R.; Grieco, S.A.; Hwang, M.; Plumlee, M.H. Comparing PFAS removal across multiple groundwaters for eight GACs and alternative adsorbent. AWWA Water Sci. 2023, 5, e1345. [Google Scholar] [CrossRef] [Scilit]
  19. Dixit, F.; Barbeau, B.; Mostafavi, S.G.; Mohseni, M. Efficient removal of GenX (HFPO-DA) and other perfluorinated ether acids from drinking and recycled waters using anion exchange resins. J. Hazard. Mater. 2020, 384, 121261. [Google Scholar] [CrossRef] [Scilit] [PubMed]
  20. United States Environmental Protection Agency (USEPA). PFAS National Primary Drinking Water Regulation Rulemaking. 2023. Available online: https://www.epa.gov/system/files/documents/2023-03/Pre-Publication%20Federal%20Register%20Notice_PFAS%20NPDWR_NPRM_Final_3.13.23.pdf (accessed on 5 January 2026).
  21. Zeidabadi, F.A.; Esfahani, E.B.; McBeath, S.T.; Mohseni, M. Managing PFAS exhausted ion-exchange resins through effective regeneration/electrochemical process. Water Res. 2024, 255, 121529. [Google Scholar] [CrossRef] [Scilit] [PubMed]
  22. An, B.; Fu, Z.; Xiong, Z.; Zhao, D.; SenGupta, A.K. Synthesis and characterization of a new class of polymeric ligand exchangers for selective removal of arsenate from drinking water. React. Funct. Polym. 2010, 70, 497–507. [Google Scholar] [CrossRef] [Scilit]
  23. Maimaiti, A.; Deng, S.; Meng, P.; Wang, W.; Wang, B.; Huang, J.; Wang, Y.; Yu, G. Competitive adsorption of perfluoroalkyl substances on anion exchange resins in simulated AFFF-impacted groundwater. Chem. Eng. J. 2018, 348, 494–502. [Google Scholar] [CrossRef] [Scilit]
  24. Son, H.; An, B.; Shin, J. Removal characteristics for nine species of per-and poly-fluoroalkyl substances using different types of anion exchange. J. Korean Soc. Environ. Eng. 2024, 46, 783–791. [Google Scholar] [CrossRef] [Scilit]
  25. An, B.; Steinwinder, T.R.; Zhao, D. Selective removal of arsenate from drinking water using a polymeric ligand exchanger. Water Res. 2005, 39, 4993–5004. [Google Scholar] [CrossRef] [Scilit] [PubMed]
  26. Xiao, C.; Qu, S.; Ren, Z.J.; Chen, Y.; Zou, X.; Chen, G.; Zhang, Z. Understanding the global distribution of groundwater sulfate and assessing population at risk. Environ. Sci. Technol. 2024, 58, 21002–21014. [Google Scholar] [CrossRef] [Scilit] [PubMed]
  27. World Health Organization (WHO). Sulfate in Drinking Water. 2004. Available online: https://cdn.who.int/media/docs/default-source/wash-documents/wash-chemicals/sulfate.pdf?sfvrsn=b944d584_4 (accessed on 5 January 2026).
  28. DuPont. DuPont™ AmberLite™ IRA900 Cl Ion Exchange Resin Product Data Sheet. 2023. Available online: https://www.dupont.com/content/dam/water/amer/us/en/water/public/documents/en/IER-AmberLite-IRA900-Cl-PDS-45-D01254-en.pdf (accessed on 25 April 2025).
  29. Purolite. A860 Product Data Sheet. n.d. Available online: https://www.purolite.com/product-pdf/A860.pdf (accessed on 25 April 2025).
  30. Mahmood, T.; Saddique, M.T.; Naeem, A.; Westerhoff, P.; Mustafa, S.; Alum, A. Comparison of different methods for the point of zero charge determination of NiO. Ind. Eng. Chem. Res. 2011, 50, 10017–10023. [Google Scholar] [CrossRef] [Scilit]
  31. Chen, T.; Zhang, Y.; Wang, H.; Lu, W.; Zhou, Z.; Zhang, Y.; Ren, L. Influence of pyrolysis temperature on characteristics and heavy metal adsorptive performance of biochar derived from municipal sewage sludge. Bioresour. Technol. 2014, 164, 47–54. [Google Scholar] [CrossRef] [Scilit] [PubMed]
  32. Chen, L.; Meng, P.; Knappe, D.R.U. Removal of Per-and Polyfluoroalkyl Substances (PFAS) 32 in fixed bed anion exchange reactors: Factors determining PFAS uptake capacity and models predicting PFAS. Water Res. 2025, 268, 122629. [Google Scholar] [CrossRef] [Scilit] [PubMed]
  33. Kassar, C.; Boyer, T.H. Removal of PFAS from groundwater using weak-base anion exchange resins. AWWA Wat. Sci. 2023, 5, e1325. [Google Scholar] [CrossRef] [Scilit]
  34. Ahmadi, M.J.; Meservery, A.; Abriola, L.M.; Pennel, K.D. Competitive adsorption of per- and polyfluoroalkyl substances (PFAS) on a gel-type anion-exchange resin: Experiments and modeling. Water Res. 2026, 301, 126044. [Google Scholar] [CrossRef] [Scilit] [PubMed]
  35. Shahrokhi, R.; Hubbe, M.A.; Park, J. Comparative assessment of activated carbon and anion exchange resin for short-and long-chain per-and poly-fluoroalkyl substances sorption: Insight into performance and mechanism. J. Water Process Eng. 2024, 64, 105703. [Google Scholar] [CrossRef] [Scilit]
  36. Ho, Y.S.; Porter, J.F.; McKay, G. Equilibrium isotherm studies for the sorption of divalent metal ions onto peat: Copper, nickel and lead single component systems. Water Air Soil Pollut. 2002, 141, 1–33. [Google Scholar] [CrossRef] [Scilit]
  37. Na, C.; Han, M.; Park, H. Applicability of theoretical adsorption models for studies on adsorption properties of adsorbents (1). J. Korean Soc. Environ. Eng. 2011, 33, 606–616. [Google Scholar] [CrossRef] [Scilit]
  38. Clifford, D.A. Ion exchange and inorganic adsorption. In Water Quality and Treatment: A Handbook of Community Water Supplies, 5th ed.; McGraw-Hill: New York, NY, USA, 1999. [Google Scholar] [CrossRef] [Scilit]
  39. Lagergren, S. About the theory of so-called adsorption of soluble substances. Sven. Vetenskapsakad Handl. 1898, 24, 1–39. [Google Scholar]
  40. Blanchard, G.; Maunaye, M.; Martin, G. Removal of heavy metals from waters by means of natural zeolites. Water Res. 1984, 18, 1501–1507. [Google Scholar] [CrossRef] [Scilit]
  41. Ho, Y.S. Adsorption of Heavy Metals from Waste Streams by Peat. Doctoral Dissertation, University of Birmingham, Birmingham, UK, 1995. [Google Scholar]
  42. Dixit, F.; Dutta, R.; Barbeau, B.; Berube, P.; Mohseni, M. PFAS removal by ion exchange resins: A review. Chemosphere 2021, 272, 129777. [Google Scholar] [CrossRef] [Scilit] [PubMed]
  43. Chen, Y.; Georgi, A.; Zhang, W.; Kopinke, F.D.; Yan, J.; Saeidi, N.; Li, J.; Gu, M.; Chen, M. Mechanistic insights into fast adsorption of perfluoroalkyl substances on carbonate-layered double hydroxides. J. Hazard. Mater. 2021, 408, 124815. [Google Scholar] [CrossRef] [Scilit] [PubMed]
  44. Zaggia, A.; Conte, L.; Falletti, L.; Fant, M.; Chiorboli, A. Use of strong anion exchange resins for the removal of perfluoroalkylated substances from contaminated drinking water in batch and continuous pilot plants. Water Res. 2016, 91, 137–146. [Google Scholar] [CrossRef] [Scilit] [PubMed]
  45. Chularueangaksorn, P.; Tanaka, S.; Fujii, S.; Kunacheva, C. Regeneration and reusability of anion exchange resin used in perfluorooctane sulfonate removal by batch experiments. J. Appl. Polym. Sci. 2013, 130, 884–890. [Google Scholar] [CrossRef] [Scilit]
  46. Li, F.; Duan, J.; Tian, S.; Ji, H.; Zhu, Y.; Wei, Z.; Zhao, D. Short-chain per- and polyfluoroalkyl substances in aquatic systems: Occurrence, impacts and treatment. Chem. Eng. J. 2020, 380, 122506. [Google Scholar] [CrossRef] [Scilit]
Figure 1. (a) Equilibrium uptake of various PFAS by IRA900 and A860 and (b) binary separation factors (α) for different PFCAs using IRA900. Experimental conditions: multicomponent system.
Water 18 01869 g001
Figure 2. Effects of pH on PFCA removal efficiency.
Water 18 01869 g002
Figure 3. Ratio of individual PFAS to the total initial PFAS concentration and the maximum Langmuir capacity (qm) and the separation factor.
Water 18 01869 g003
Figure 4. Sulfate effects on the PFCA removal efficiency for (a) GAC and (b) IRA900.
Water 18 01869 g004
Figure 5. Change in Ct/C0 as a function of time during batch kinetic tests: (a) without and (b) with sulfate.
Water 18 01869 g005
Figure 6. Ct/Ce as a function of time (a) without and (b) with sulfate.
Water 18 01869 g006
Figure 7. (a) PFAS removal efficiency after regeneration with different regenerants and (b) decreased removal rate (%) for different PFAS species.
Water 18 01869 g007
Table 1. Parameters and ratios of each species to initial concentration and qm.
SpeciesCo, ng/Lqm, ng/gEach/Total CoEach/Total qmΔ (1), %
PFAS Conc. ng/L541434,783
PFCA Conc. ng/L249712,2860.4610.352−23.6
PFSA Conc. ng/L291722,4970.5390.64716.7
P
F
S
A
P
F
C
A
PFBA (CA4)54416640.1000.048−52
PFPeA (CA5)56722740.1050.065−38
PFHxA (CA6)41121470.0760.062−18
PFHpA (CA7)50630650.0930.088−5.4
PFOA (CA8)47031370.0870.093.4
P
F
S
A
PFBS (CS4)78061680.1440.17723
PFPeS (CS5)40030910.0740.08920
PFHxS (CS6)52844250.0980.12730
PFHpS (CS7)39226810.0720.0776.9
PFOS (CS8)81761320.1510.17617
Note(s): (1) The percentage change from each/total Co to each/total qm.
Table 2. Effect of sulfate on the PFAS removal of IRA900 and GAC.
Sulfate Conc.
mg/L
Total PFCA Uptake, ng/gSulfate Uptake, mg/g
IRA900GACRatio (1)IRA900GACRatio (1)
0637960451.06---
205347
(16.2%) (2)
4958
(18.0%) (2)
1.0898.9
(91.6%) (3)
8.8
(8.1%) (3)
11.2
404499
(29.5%) (2)
5294
(12.4%) (2)
0.85157
(68.0%) (3)
14.9
(6.4%) (3)
10.5
Note(s): (1) Ratio of IRA900 to GAC. (2) Decrease rate (%) from 0 sulfate concentration. (3) Removal efficiency (%).
Table 3. Variation in IA900 and GAC derived from regression analysis.
AdsorbentParametersPFBA
(CA4)
PFPeA
(CA5)
PFHxA
(CA6)
PFHpA
(CA7)
PFOA
(CA8)
IRA900Slope−0.992−1.25−0.533−0.343−0.220
R20.9971.000.9610.9410.853
GACSlope−0.513−0.309−0.260−0.1410.133
R20.7560.8130.3210.6810.973
Table 4. Comparison of pseudo-first-order rate constant (k1) without and with sulfate.
Speciesk1
wo Sulfatew SulfateΔ (3), %
PFSA0.0440 (1)
(0.00564) (2)
0.177 (1)
(0.273) (2)
PFCA0.0408 (1)
(0.00484) (2)
0.291 (1)
(0.350) (2)
PFBA (CA4)0.04960.9754−1866.5
PFPeA (CA5)0.03950.2608−560.3
PFHxA (CA6)0.03870.0911−135.4
PFHpA (CA7)0.0350.061−74.3
PFOA (CA8)0.0410.0657−60.2
PFSA0.0473 (1)
(0.00448) (2)
0.0628 (1)
(0.00855) (2)
PFBS (SA4)0.04410.0582−32
PFPeS (SA5)0.04540.0502−10.6
PFHxS (SA6)0.0520.0646−24.2
PFHpS (SA7)0.05290.0679−28.4
PFOS (SA8)0.04220.0733−73.7
Note(s): (1) Mean of all PFAS. (2) Standard deviation. (3) The percentage change = w   s u l f a t e w o   s u l f a t e w o   s u l f a t e × 100 .
Disclaimer/Publisher’s Note: The statements, opinions and data contained in all publications are solely those of the individual author(s) and contributor(s) and not of MDPI and/or the editor(s). MDPI and/or the editor(s) disclaim responsibility for any injury to people or property resulting from any ideas, methods, instructions or products referred to in the content.