Article

Monitoring Metal Concentrations in the Laspias and Lissos Rivers and Their Coastal Zones, NE Greece


by
Konstantinos Azis
1,
Anastasia Makri
1,
Katerina A. Bakalakou
2,
Vassiliki Papaevangelou
2,
Dionissis Latinopoulos
2,
Ifigenia Kagalou
2,
Spyridon Ntougias
1,
Christos Akratos
2 and
Paraschos Melidis
1,*
1
Department of Environmental Engineering, Democritus University of Thrace, Vas. Sofias 12, 67100 Xanthi, Greece
2
Department of Civil Engineering, Democritus University of Thrace, Kimmeria Campus, 67100 Xanthi, Greece
*
Author to whom correspondence should be addressed.
Water 2026, 18(15), 1800; https://doi.org/10.3390/w18151800 (registering DOI)
Submission received: 8 June 2026 / Revised: 20 July 2026 / Accepted: 22 July 2026 / Published: 25 July 2026
(This article belongs to the Section Water Quality and Contamination)

Abstract

The Laspias River and Lissos River sustain the hydrological and ecological functioning of the Vistonida Lake wetland complex, a protected Natura 2000 site and Ramsar Convention Wetland of International Importance, by regulating nutrient transport and supporting aquatic biodiversity. Thus, the water quality of the rivers Laspias and Lissos and their adjacent coastal zones located in the prefectures of Xanthi and Rhodope (NE Greece) respectively was monitored regarding key metal concentrations for a period of two years. The monitoring of these watersheds and coastal zones was based on seven sampling stations in the Laspias River, twelve stations in the Lissos River and four stations in each river’s coastal zone. During water monitoring of both rivers, a wide range of chemical elements was analyzed to assess water quality. In the present work, the heavy metal pollution index (HPI) and the heavy metal evaluation index (HEI) were assessed in both rivers and their coastal area for four successive seasons. The mean HPI and HEI values for the Laspias River were 54.66 ± 10.82 and 1.45 ± 0.22, whereas the respective indices in the Lissos River were 14.43 ± 4.14 and 0.39 ± 0.14. The mean HPI and HEI values for the adjacent coastal zones of the Laspias and Lissos Rivers were 7.42 ± 1.52 and 0.14 ± 0.05, as well as 10.39 ± 0.83 and 0.23 ± 0.02, respectively. Therefore, the average HPI values for both rivers and their coastal zones were below the proposed threshold (<100), while the HEI of the Laspias River classified the water quality in the second category (slightly affected, HEI from 1.0 to 2.0 due to the effect of Mn) and the Lissos River in the first category (very pure/pure, HEI < 1), respectively, considering drinking water thresholds. The HEI indices of their coastal zones characterized the water quality as very pure/pure.

1. Introduction

Water remains the foundation of life on our planet, and it has a paramount role in human health and ecological stability [1]. However, in the last few decades, water quality has deteriorated mainly due to overpopulation and industrialization [2]. This is further exacerbated by the dispersion of hazardous substances into water bodies, with heavy metals standing out as one of the most critical pollutants [1]. These metals, which are released into waters on a daily basis from different sources, have the potential to cause various harmful effects. Not only do they pose a direct threat to human health, but they also pose a serious risk to the environment as a whole [3]. On the other hand, agricultural activities may adversely affect river water quality.
Health risk assessment should be conducted by identifying sources of contamination by potentially toxic elements (PTEs) [4]. PTEs are not biodegradable; thus, they tend to bioaccumulate and have adverse effects on organisms [5]. These contaminants can originate from both natural and anthropogenic sources. Natural sources are interactions with naturally occurring metal-bearing rocks in the environment. Examples of human causes include industry, and agro-industry activities [6].
Human activities have affected the environment, often to a greater extent than natural processes [7]. The use of chemical fertilizers and pesticides, mining, manufacturing, household or industrial waste disposal, as well as coal burning, can all lead to an increase in metal concentrations in the environment [8]. Accumulation of PTEs in aquatic environments can be toxic and have adverse effects on living organisms [9]. These facts make PTE pollution a global problem. It is worth noting that PTEs are of particular concern because of their tendency to bioaccumulate and biomagnify in water bodies, as well as their toxic effects that often manifest far from pollution sources [10]. Rivers and lakes can act both as sinks for the adjacent coastal ecosystems and as secondary sources of metals, while their fluvial inputs represent the main pathway for metal transportation from land to the sea [11]. Anthropogenic contaminants, including PTEs, place significant stress on coastal ecosystems, a pressure that is further exacerbated by climate change, disrupting the hydrologic cycle and intensifying environmental risks [12]. For these reasons, there is a need for the consistent monitoring of coastal water bodies [13].
According to the Water Framework Directive (WFD) 2000/60/EC [14], each member state must set up national monitoring programs and assess the biological, hydromorphological, and physicochemical components of water quality to ascertain the “ecological status” of the water body. In order to safeguard the aquatic environment from the detrimental impacts of certain pollutants, including heavy metals, environmental quality criteria have been set under WFD 2013/39/EC [15]. In addition, Greek authorities have set maximum permissible limits of heavy metal concentration in water [16].
Since different components are present in varying amounts in each water sample, water quality assessment is difficult [17]. For this reason, heavy metal contamination indices have been developed [18,19]. However, classification is challenging since water quality is dependent on both the concentration and toxicity of its components. A variety of methods for developing water quality indices has been conducted in previous years and are generally accepted [19]. The maximum allowable limit and the permissible concentration are taken into consideration when formulating these techniques. The quality of the water bodies has been assessed in recent decades using the most widely applied heavy metal pollution index (HPI) [20,21,22,23,24] and heavy metal evaluation index (HEI) [25,26,27,28,29,30].
In the past few decades, there has been an increase in the analysis of dissolved heavy metals in freshwater bodies, with a focus on particular river catchments [31]. However, studies investigating PTEs in Greek surface water bodies remain limited [16]. To address this knowledge gap, the present study is the first to provide a thorough analysis of the current state of water quality through heavy metal monitoring in the Laspias and Lissos River basins and along their coastal zone, covering a broad area of eastern Macedonia and Thrace, northern Greece. Specifically, the study aims (i) to monitor potentially toxic element concentrations in the surface waters of the Laspias and Lissos Rivers and their adjacent coastal zones during four successive seasons; (ii) to calculate the HPI and HEI indices for both rivers and their coastal zones in order to assess the water quality; (iii) to determine the main potentially toxic elements in these water bodies; and (iv) to provide a core dataset to support water quality management in eastern Macedonia and Thrace, NE Greece, and the northern Aegean Sea.

2. Materials and Methods

2.1. Study Area

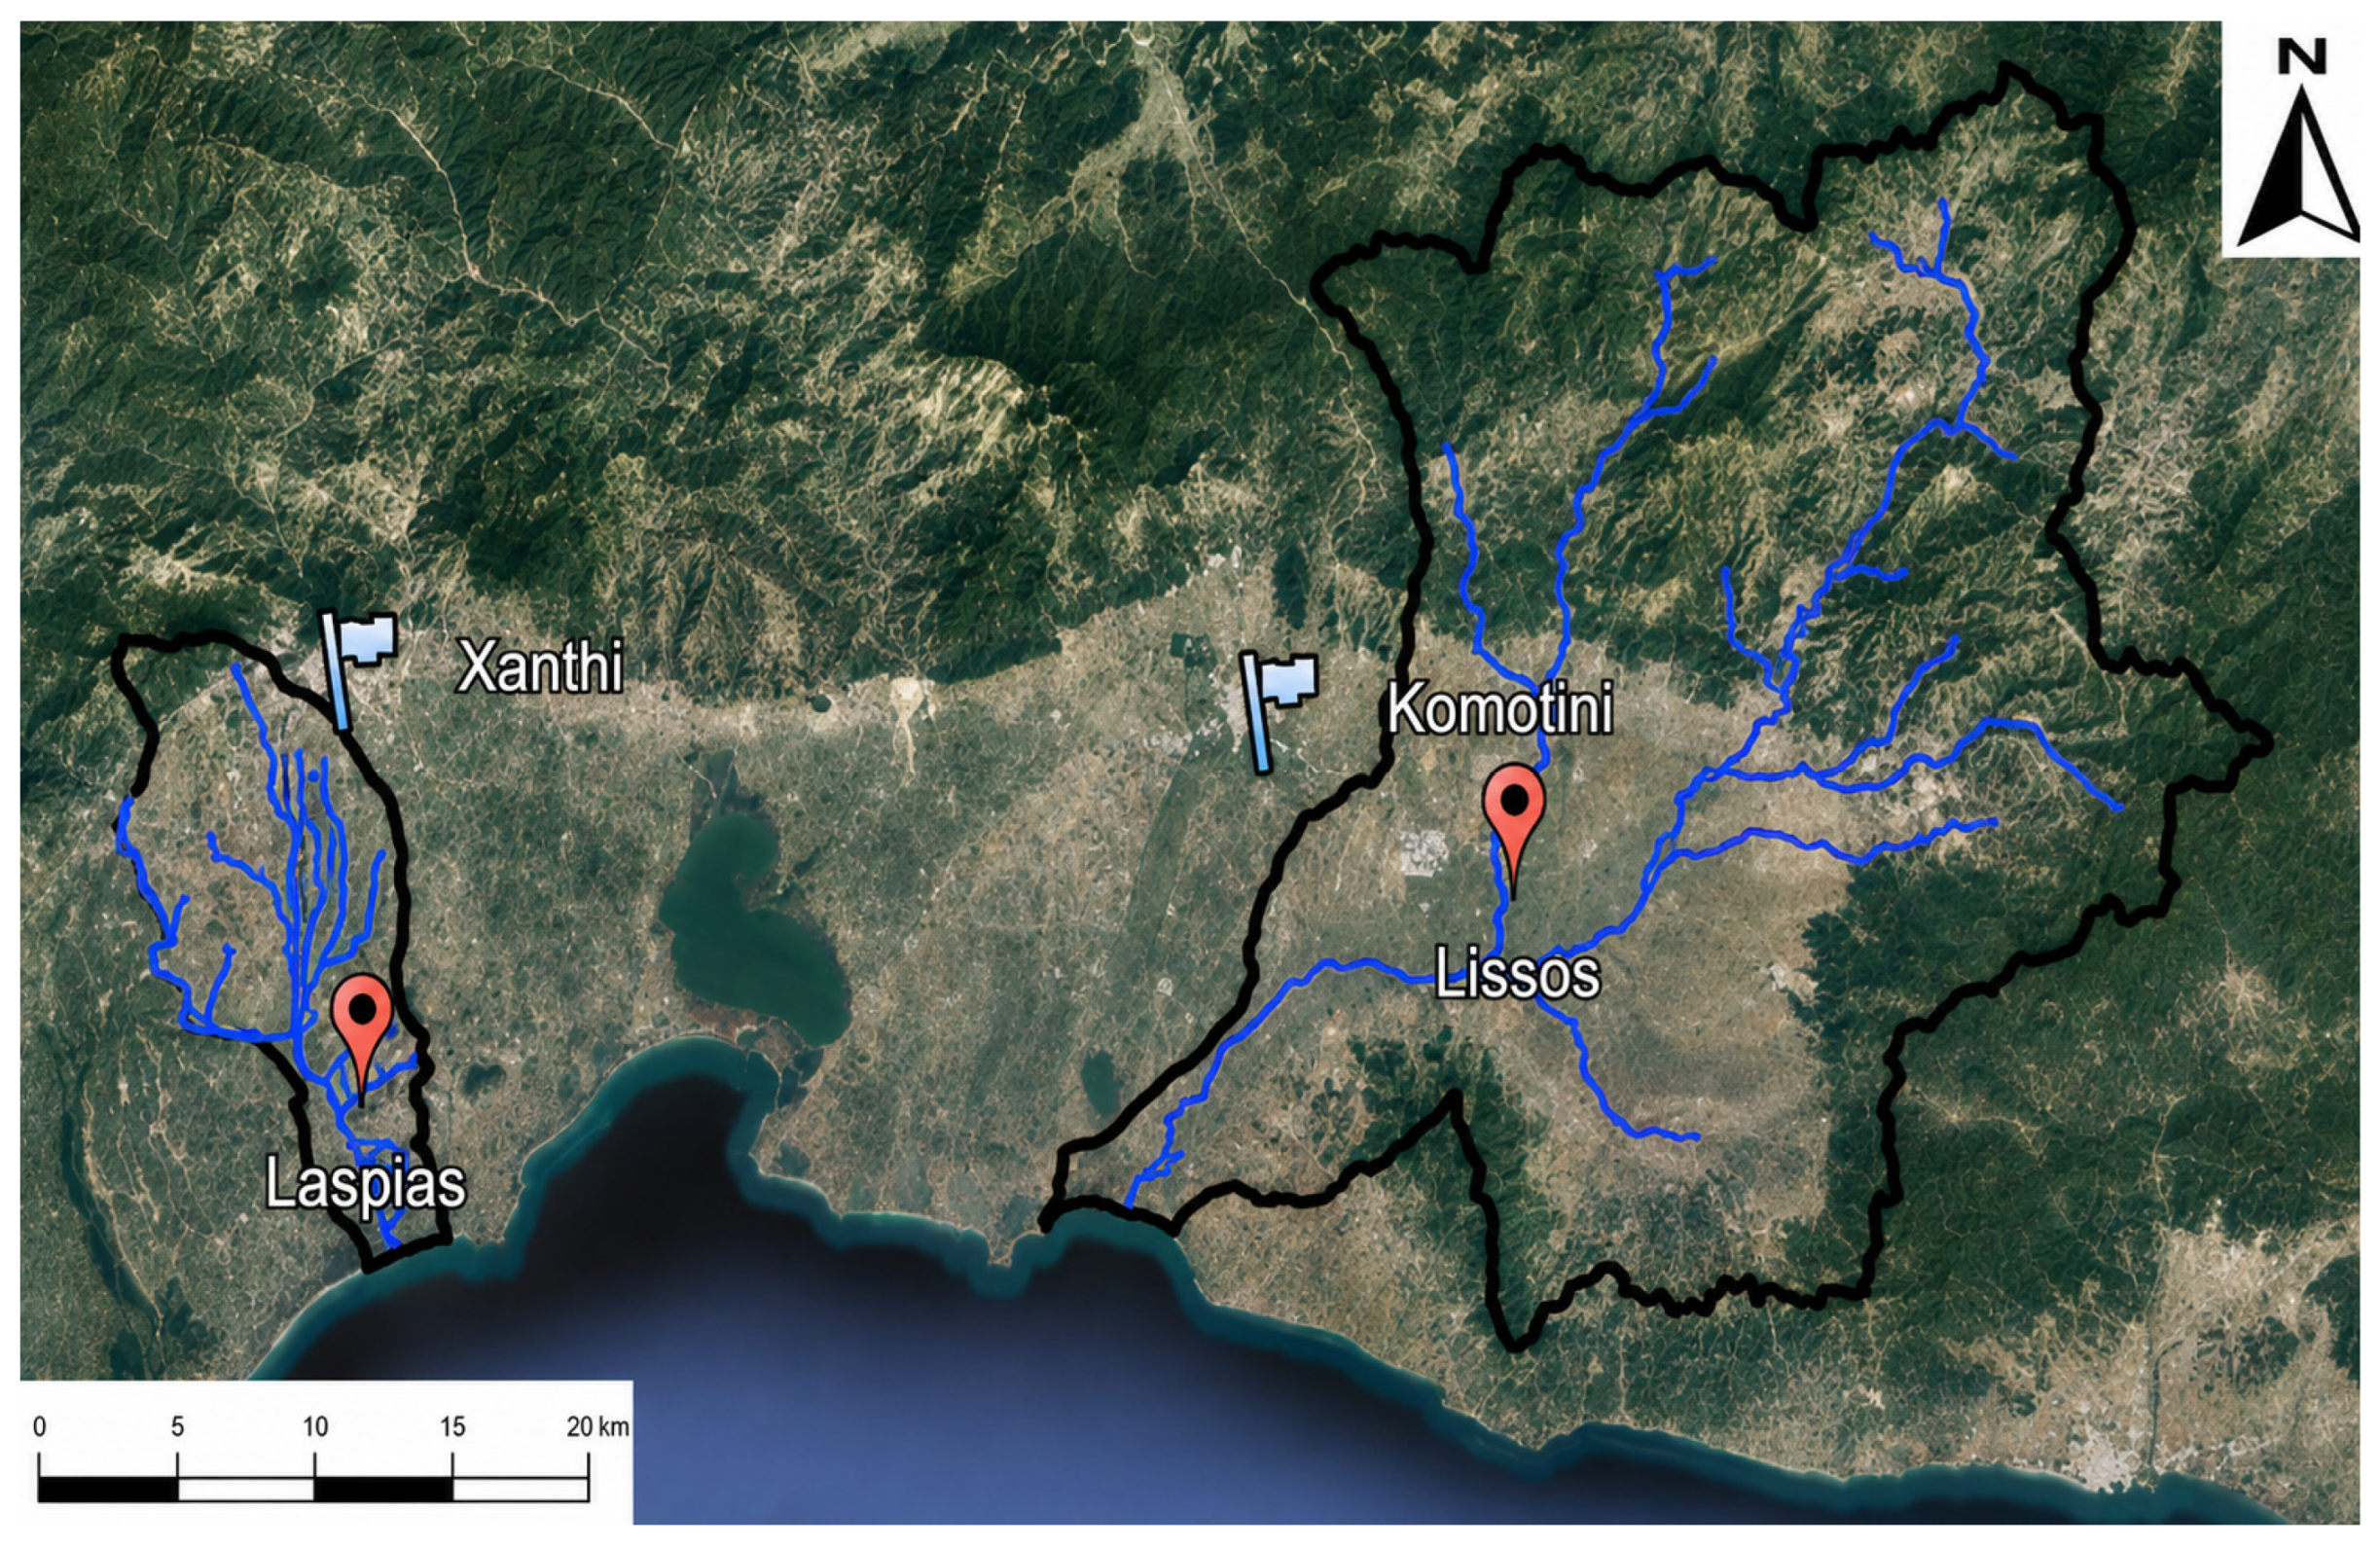
The Laspias River (approximately 30 km in length) drains a relatively small catchment within Xanthi prefecture, Thrace, northeastern Greece (24°53′ E, 40°59′ N), whereas the Lissos River (approximately 45 km in length) drains a larger catchment in Rhodope prefecture, Thrace (25°31′ E, 41°01′ N) (Figure 1). The estuaries of both rivers and their coastal zones are protected under the Ramsar Convention on Wetlands of International Importance. The lowlands of the Laspias River are also included in the NATURA 2000 network (GR1150001 and GR1150014). In both watersheds, agricultural activities are the main input sources [32,33]. The two watersheds differ in terms of catchment size, geology, land use patterns, and hydrological conditions, rather than representing systematic differences between the rivers themselves.
Meteorological data were obtained from the Imeros and Xanthi meteorological stations, Thrace, Greece. Physicochemical and hydrochemical parameters of the studied rivers and their adjacent coastal zones during the same time period are reported by Papaevangelou et al. [34]. Papaevangelou et al. [34] also assessed river water quality according to the five ecological status classes (high, good, moderate, poor, and bad) defined by the Water Framework Directive (WFD) 2000/60/EC [14].

2.2. Sampling Strategy and PTEs Monitoring

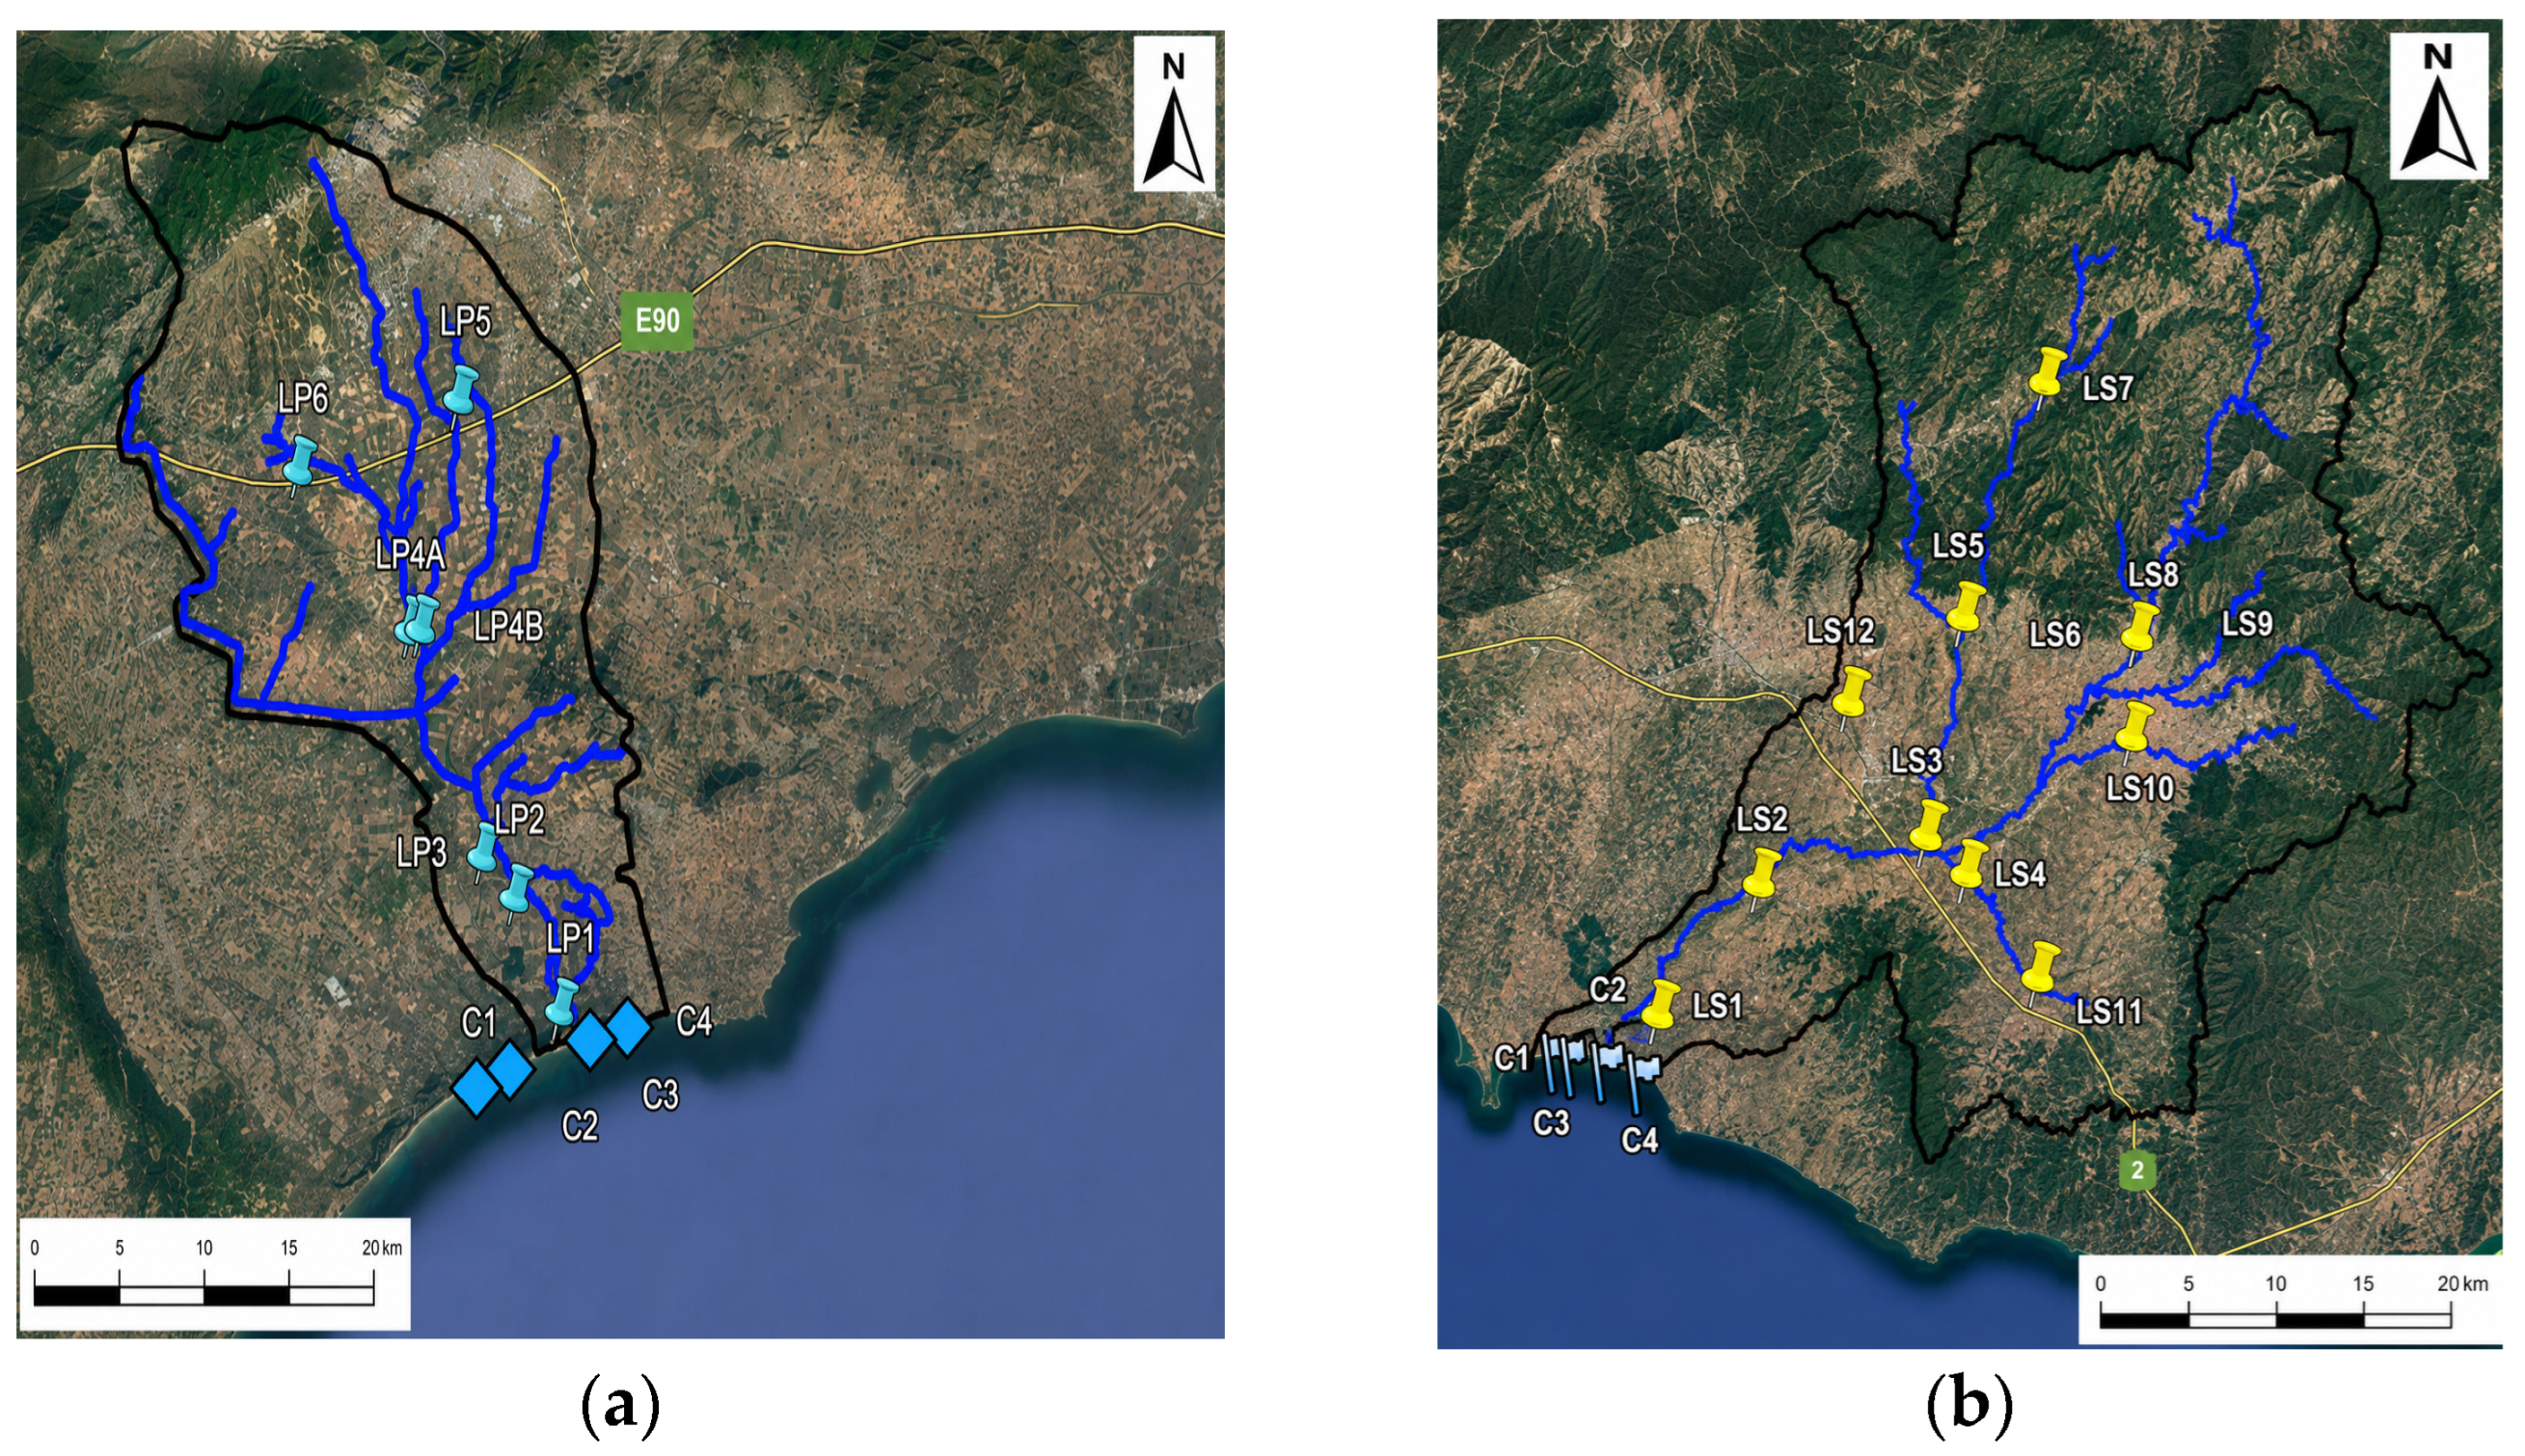
A sampling network of 27 stations was set up, with 7 sites in the Laspias River, 12 sites along the main route of the Lissos River and its tributaries, and 8 sites along the coastal zone for both rivers. These sampling stations in the coastal zone were located along the coastline of the Thracian Sea (northern Aegean Sea), which is an established microtidal environment with a tidal range of less than 10 cm [35]. Under such conditions, the hydrodynamics of the area are dominated by wave action and river inflow rather than tidal influence [36]. Consequently, the tidal phase is considered negligible. Figure 2a,b show the sampling locations in the Laspias and Lissos River basins and the selected four coastal stations in each river. The sampling points were selected in order to cover the whole area of the estuaries of the two rivers and the coastal zone. Monitoring campaigns were conducted from July 2021 to January 2023, during summer (July), autumn (September), and winter (December) in 2021, spring (March), summer (June), autumn (September) in 2022, and in January 2023 (winter 2023). Fourteen PTEs, i.e., As, Ba, Be, Cd, Co, Cr, Cu, Mo, Ni, V, Zn, Mn, Se and Al, were analyzed in this study. Several of these elements, including Co, Cr, Cu, Mn, Mo, Se, and Zn, are essential trace elements for living organisms in aquatic environments but may become toxic at elevated concentrations.

Sampling Preparation and ICP-OES Analysis

To evaluate metal concentrations in both rivers, water samples were collected in every season over the year using acid-washed high-density polyethylene (HDPE) bottles, transported to the laboratory using an electric portable field chiller, and stored at 4 °C in accordance with ISO 5667-3:2024 [37]. Upon arrival at the laboratory, the water samples were filtered through a 0.45 μm membrane filter, subsequently acidified with ultrapure nitric acid to pH < 2, and stored at 4 °C until ICP-OES analysis, in accordance with Standard Method 3120 B of the Standard Methods for the Examination of Water and Wastewater [38]. Metals analysis conducted in the Laboratory of Sanitary Engineering-Water and Wastewater Quality at Democritus University of Thrace was carried out through inductively coupled plasma optical emission spectrometry (ICP-OES, Agilent 5800, Agilent Technologies, Inc., Santa Clara, CA, USA), which consisted of a cyclonic spray chamber, a glass concentric nebulizer, and a peristaltic pump operated at: RF power: 1400 W; plasma gas flow: 12.0 L/min; auxiliary gas flow: 1.0 L/min; Ar nebulizer gas flow: 0.70 L/min; and sample flow rate: 1.0 mL/min. Operating parameters were adjusted to improve sensitivity and plasma stability within the specified nebulizer (0.65–0.90 L/min) range. All water samples were collected and analyzed in triplicate. Instrument calibration was performed using a certified multi-element standard solution (1000 mg/L, Agilent Technologies, Santa Clara, CA, USA). A seven-point calibration curve consisting of standards at 0, 10, 50, 100, 250, 500, and 1000 μg/L was prepared by serial dilution. The calibration blank was prepared according to Standard Method 3120 B [38] and consisted of 2% (v/v) nitric acid in reagent water. The concentrations measured in the river water samples were within the established linear calibration range for all analyzed elements. Calibration curves for all analyzed elements exhibited excellent linearity, with correlation coefficients (R2) greater than 0.999. The accuracy of the analytical method was proven using the Agilent IntelliQuant feature, which is a built-in software capability of the Agilent ICP-OES 5800 model. The limits of detection (LODs, μg/L) were as follows: As, 0.3; Ba, 0.01; Be, 0.01; Cd, 0.06; Co, 0.19; Cr, 0.16; Cu, 0.18; Mo, 0.3; Ni, 0.36; V, 0.07; Zn, 0.08; Mn, 0.03; Se, 3.3; and Al, 0.09. The limits of quantification (LOQs, μg/L) were: As, 1.0; Ba, 0.03; Be, 0.03; Cd, 0.20; Co, 0.63; Cr, 0.53; Cu, 0.60; Mo, 1.0; Ni, 1.2; V, 0.23; Zn, 0.27; Mn, 0.10; Se, 11.0; and Al, 0.30.

2.3. Surface Water Pollution Index

2.3.1. Heavy Metal Pollution Index (HPI)

Heavy metal pollution index is a widely known index used around the scientific community to assess the overall water quality by the influence of individual metals [21]. The HPI, first proposed by Mohan et al. [18], gives the effect of individual PTEs on surface water quality [20] calculated with the following Equation (1).
HPI = i = 1 i = n ( Q i × w i ) i = 1 i = n w i
where wi is the weighting factor of the ith PTE calculated as 1/Si; Qi is the sub-index of the ith PTE; ith corresponds to each PTE analyzed; and n is the number of PTEs detected. The sub-index (Qi) calculation was based on Equation (2).
Q i = M i S i × 100
where Si is the maximum permissible value for the ith PTE, for drinking water, according to World Health Organization (WHO) [39] and Mi represents the measured value for each metal ion. It is worth noting that there are no defined limits for all the examined metals in surface waters, and therefore, the U.S. EPA aquatic life criteria [40] for freshwater and saltwater, WFD Environmental Quality Standards (EQS) for surface water [14,15] and the World Health Organization standards for drinking water were used for evaluation and discussion purposes [39]. As shown in Table 1, an HPI value below 100 indicates low metal presence and that the water is safe for drinking, while a value greater than 100 indicates water unsuitable for consumption. A threshold HPI value of near 100 indicates a marginal-quality potable water that is safe to be used by healthy individuals. This value has also been used in the literature to assess surface water quality related to PTEs [9,22,23].

2.3.2. Heavy Metal Evaluation Index (HEI)

A commonly used index that was first proposed by Edet and Offiong [25] is the heavy metal evaluation index (HEI). HEI assesses the surface water quality based on PTE concentrations in rivers and adjacent coastal waters and is calculated using Equation (3), applying the maximum allowable concentration (MAC) values recommended by WHO [39].
HEI = i = 1 n H i H m a c
where Hi and Hmac represent the average monitored value and the maximum admissible concentration of ith PTE, respectively, whereas n is the number of PTEs detected. The value of HEI is divided into five strictest classes according to several researchers, while some others divided it into three less strict categories, as shown in Table 2. However, the classification commonly adopted in recent water quality studies is HEI < 10 as low pollution, HEI 10–20 as medium pollution, and HEI > 20 as high pollution.

3. Results

3.1. Metal Concentrations in Surface Water Bodies

Potentially toxic elements (PTEs) can have harmful effects on both human health and the environment. Therefore, the adverse effects of PTEs can be mitigated through regular monitoring. In this section, the results for monitoring of fourteen PTEs are presented to assess the levels of these elements in the two examined rivers and their adjacent coastal waters, and to compare them with those reported for other water bodies (Table 3). Changes in weather patterns are among the factors affecting metal concentrations [45]. Their presence varied among the four sampling seasons (spring, summer, autumn, and winter) in both rivers. Seasonally, in the Laspias River, the highest number of detected PTEs (eight PTEs in total; As, Ba, Co, Cr, Ni, V, Zn and Mn) was observed during the winter sampling period, whereas the lowest number (four PTEs in total; Ba, Cu, Zn and Mn) was recorded in autumn. During winter, increased precipitation leads to greater runoff and enhanced leaching of elements from the soil into nearby water sources [45]. On the contrary, most of the metals were found in the Lissos River during the harvesting period (summer), which appeared to accumulate due to increased agricultural runoff from the use of fertilizers and pesticides [46], while the least metals appeared in spring. Therefore, examining the seasonal trend, it was found that the presence of PTEs varied as winter (eight PTEs in total; As, Ba, Co, Cr, V, Zn, Ni, and Mn) > summer (six PTEs; As, Ba, Cu, Zn, Ni, and Mn) > spring (five PTEs; Ba, Mo, Zn, Ni, and Mn) > autumn (four PTEs; Ba, Cu, Zn and Mn) in the Laspias River, and summer (10 PTEs; As, Ba, Co, Cr, Cu, Mo, Ni, V, Zn and Mn) > winter (5 PTEs; Ba, Cr, Mo, Zn and Mn) > autumn (four PTEs; As, Ba, Zn and Mn) > spring (two PTEs; Ba and Mn) in the Lissos River. Seasonal variations in metal concentrations were consistent with the observed meteorological conditions. Meteorological data from the Imeros and Xanthi meteorological stations showed higher precipitation during the winter sampling periods, reaching 301–375 mm in the Imeros area and 307–361 mm in Xanthi, compared to only 0.2–24.1 mm and 0.3–26.3 mm, respectively, during the dry summer and early autumn sampling periods. Moreover, the number of detected metals increased during winter, but not their concentrations. In addition, phosphates and nitrates were determined during the same sampling periods in the frame of the project “Eye4Water” (MIS 5047246) [34], supporting agricultural runoff.

3.1.1. Metal Concentrations Along the Laspias River and at the Adjacent Coastal Zone

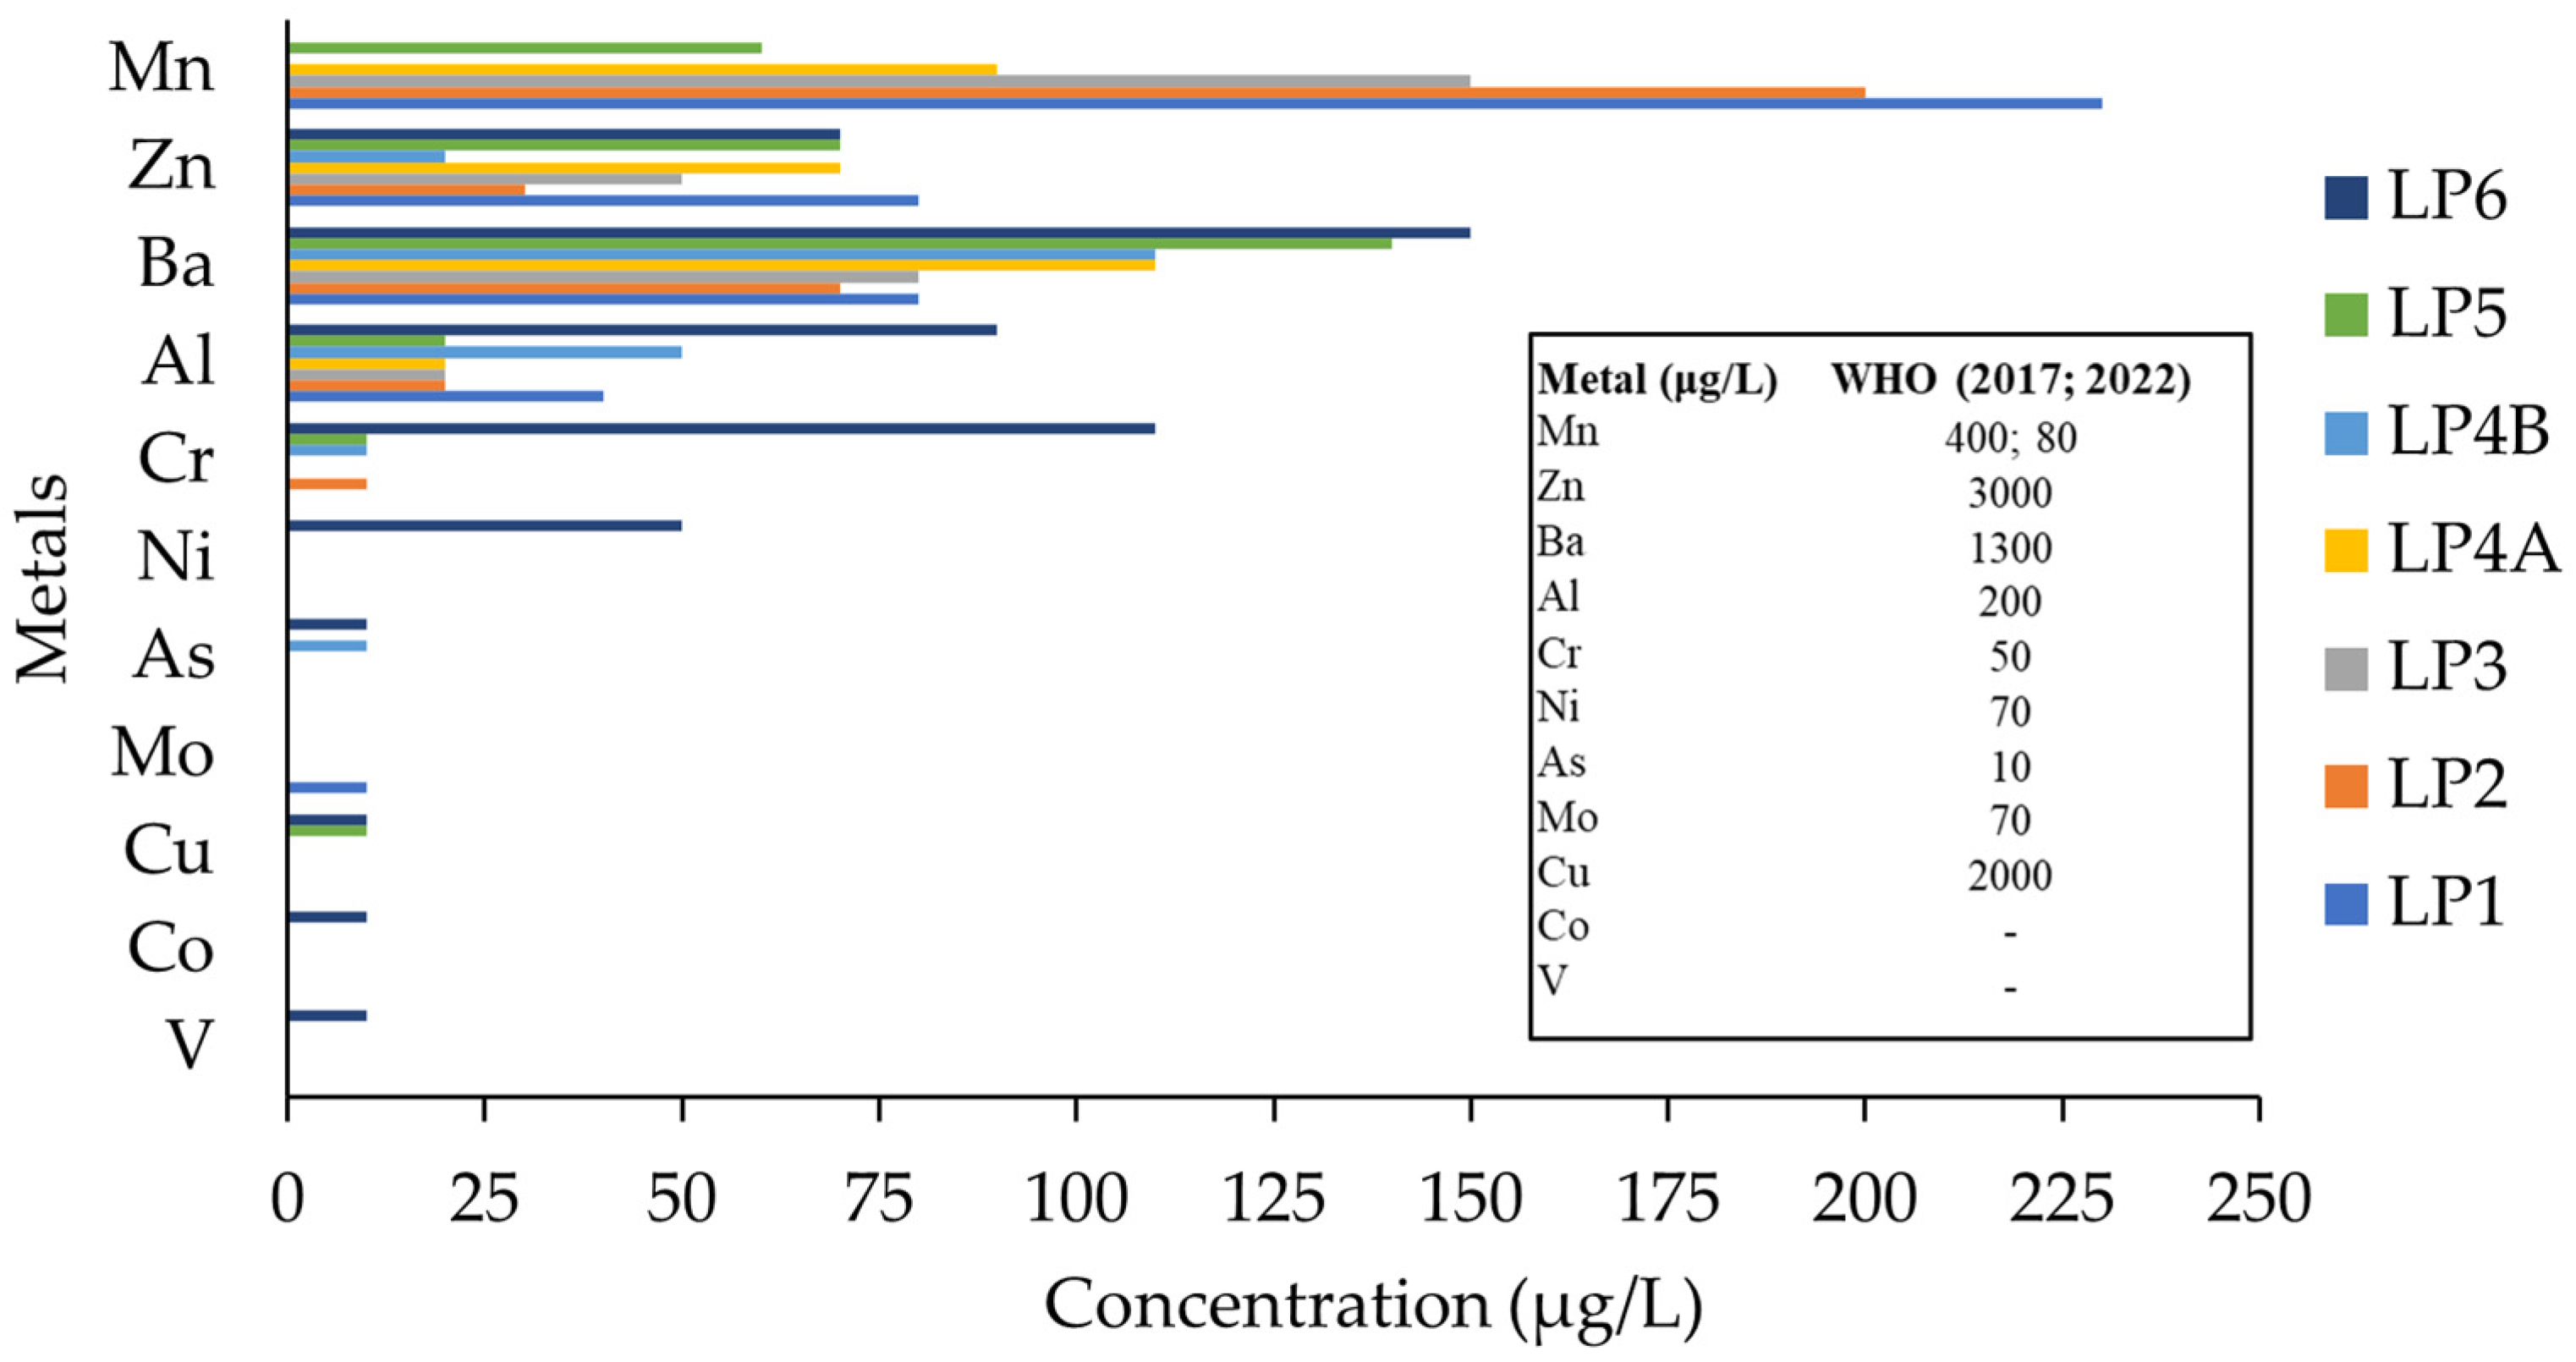
In the Laspias River, most of the water samples collected may be affected by many factors, such as agricultural and industrial activities, the effluent from the municipal wastewater treatment plant of the city of Xanthi, a municipal solid waste landfill and the livestock units located in the area [62]. The concentrations of the detected metals were within the WHO guideline limits for drinking water, while several metals were not detected. Specifically, the elements Be, Cd and Se were not detected throughout the whole experimental period at any monitoring station in the Laspias River. Co (10 μg/L), Ni (50 μg/L) and V (10 μg/L) appeared once during the winter sampling of year 2021, while Mo (10 μg/L) appeared only once during spring (March) 2022. As (10 μg/L) was detected during July and December of 2021, while Cu (10 μg/L) was detected during July and September of 2021. Cr was detected at only three sampling stations during the winter sampling period (January 2023), at concentrations of 10 μg/L (LP2, LP5) and 110 μg/L (LP6). The latter exceeded the WHO guideline value for drinking water (50 μg/L) [39] and was close to the U.S. EPA threshold of 100 μg/L [40,63]. Ni, As, Cu and Cr concentrations reported for European rivers and lakes were 137, 18.5, 14.6 and 13.6 μg/L, respectively [63]. Similar concentrations, i.e., 121, 28.2, 15.7, and 17.3 μg/L, respectively, were detected in the Evros River, which is located in the vicinity of this case study area [64]. The concentrations of all the examined metals in almost all sampling periods were below WHO set limits as stated above and displayed in Supplementary Table S1. Al was detected in all sampling points of the Laspias River during the whole experimental period, with a mean concentration of 9.76 ± 2.39 μg/L. It should be noted that Al is released through the dissolution of natural silicate minerals and can therefore occur as soluble salts or colloidal compounds [65]. In addition, this element is connected with the geochemical matrix of sediments. Station LP6 located near a landfill site showed the maximum Al concentration (90 μg/L) during the winter season. Ba appeared in all the sampling stations at all seasons, with the highest concentrations detected in stations LP5 (140 μg/L) and LP6 (150 μg/L). The mean Ba concentration in the Laspias River was 46.4 ± 6.34 μg/L across all sampling points and seasons, approximately twofold higher than that measured in the Lissos River. Zinc was 19.8 ± 3.26 μg/L considering all sampling stations and seasons, which is below the admissible limit for drinking water. Zn can find application in the plastics, cosmetics, steel processing, printing ink, and rubber manufacturing industries [66,67]. Elmaci et al. [68] observed Zn and Cu concentrations of 130 ± 50 μg/L and 141 ± 50 μg/L, respectively, in the water of Lake Uluabat, in the vicinity of Bursa, Turkey. Tokatli [64] also detected Zn concentration of 260 μg/L in the Evros River. Manganese is another metal found in the Laspias River in all sampling stations and seasons at 93.7 ± 10.0 μg/L, excluding all measurements of station LP6 and the Mn concentration detected in September 2021 at the station LP4B. Mn is abundant in nature in dissolved, colloidal, and complex forms [69]. Mn is used in fertilizer production, dry cell battery production, and metallurgical operations, and it is also connected with the geochemical processes of sediments [66]. The maximum Mn concentrations of 870 and 960 μg/L occurred only in the winter season at stations LP4B and LP6, which may be attributed either to natural or anthropogenic factors, like agricultural runoffs in the area. In station LP6, Mn concentration was equal to 194 ± 67.0 μg/L, which was below the WHO standard set in 2017 [70], but above the WHO standard set in 2022 [39] for drinking water. According to the literature, there are geogenic sources in the surrounding area [71]. The Laspias basin overlies volcanosedimentary formations naturally enriched in minerals composed of Mn [72]. Weathering and dissolution of these lithologies represent a continuous background Mn source. This confirms the maximum values of 870–960 µg/L at sampling stations LP4B and LP6 in the Laspias River at low-flow periods during winter. Regarding the remaining examined metals, Cr and Ni were equal to 4.05 ± 2.67 µg/L and 1.67 ± 1.21 µg/L, respectively, and As and Cu concentration was 0.48 ± 0.33 µg/L, whereas Co, Mo and V concentration was 0.238 ± 0.235 µg/L. The maximum concentrations of the metals detected in each sampling point of the Laspias River are illustrated in Figure 3.
The mean metal concentrations decreased in the following order: Mn > Ba > Zn > Al > Cr > Ni > As; Cu (As = Cu) > Co; Mo; V (Co = Mo = V). All measured concentrations were below the WHO guideline values [39,70], except for Mn (93.7 ± 10.0 μg/L) according to WHO [39] standards set in 2022. These low average concentrations confirmed that PTEs did not affect water quality along both the length of the river and the coastal area.
In the coastal zone of the Laspias River, Al, Ba, Zn and Mo were detected at all four sampling stations (LP1–LP4), whereas Mn was detected only at LP2 and LP4 (Supplementary Table S1). The maximum concentrations measured were 90 μg/L for Al at LP2 and LP4, 20 μg/L for Ba at LP2, 20 μg/L for Zn at LP4, 80 μg/L for Mn at LP2 and 10 μg/L for Mo at all sampling stations. The mean concentrations followed the decreasing order Al > Mo > Zn > Ba at LP1 and LP3, Al > Mn > Ba = Zn > Mo at LP2, and Al > Zn > Mo > Ba > Mn at LP4.
Based on the U.S. EPA chronic aquatic life criteria for freshwater [40], the recommended concentrations of Cr (total), As, Ni and Zn are 85, 150, 52, and 120 μg/L, respectively, while for saltwater the values for Cr(VI), As, Cd, Cu, Ni, and Zn are 50, 36, 7.9, 3.1, 8.2, and 81 μg/L, respectively. In the Laspias River and its adjacent coastal zone, the concentrations of these metals at all sampling stations were below the above-reported thresholds. Based on the WFD Environmental Quality Standards (EQS), Ni and Cd should not exceed 34 and 1.5 µg/L. In the Laspias River and its adjacent coastal zone, Ni and Cd concentrations were below the above-reported thresholds.

3.1.2. Metal Concentrations Along the Lissos River and at the Adjacent Coastal Zone

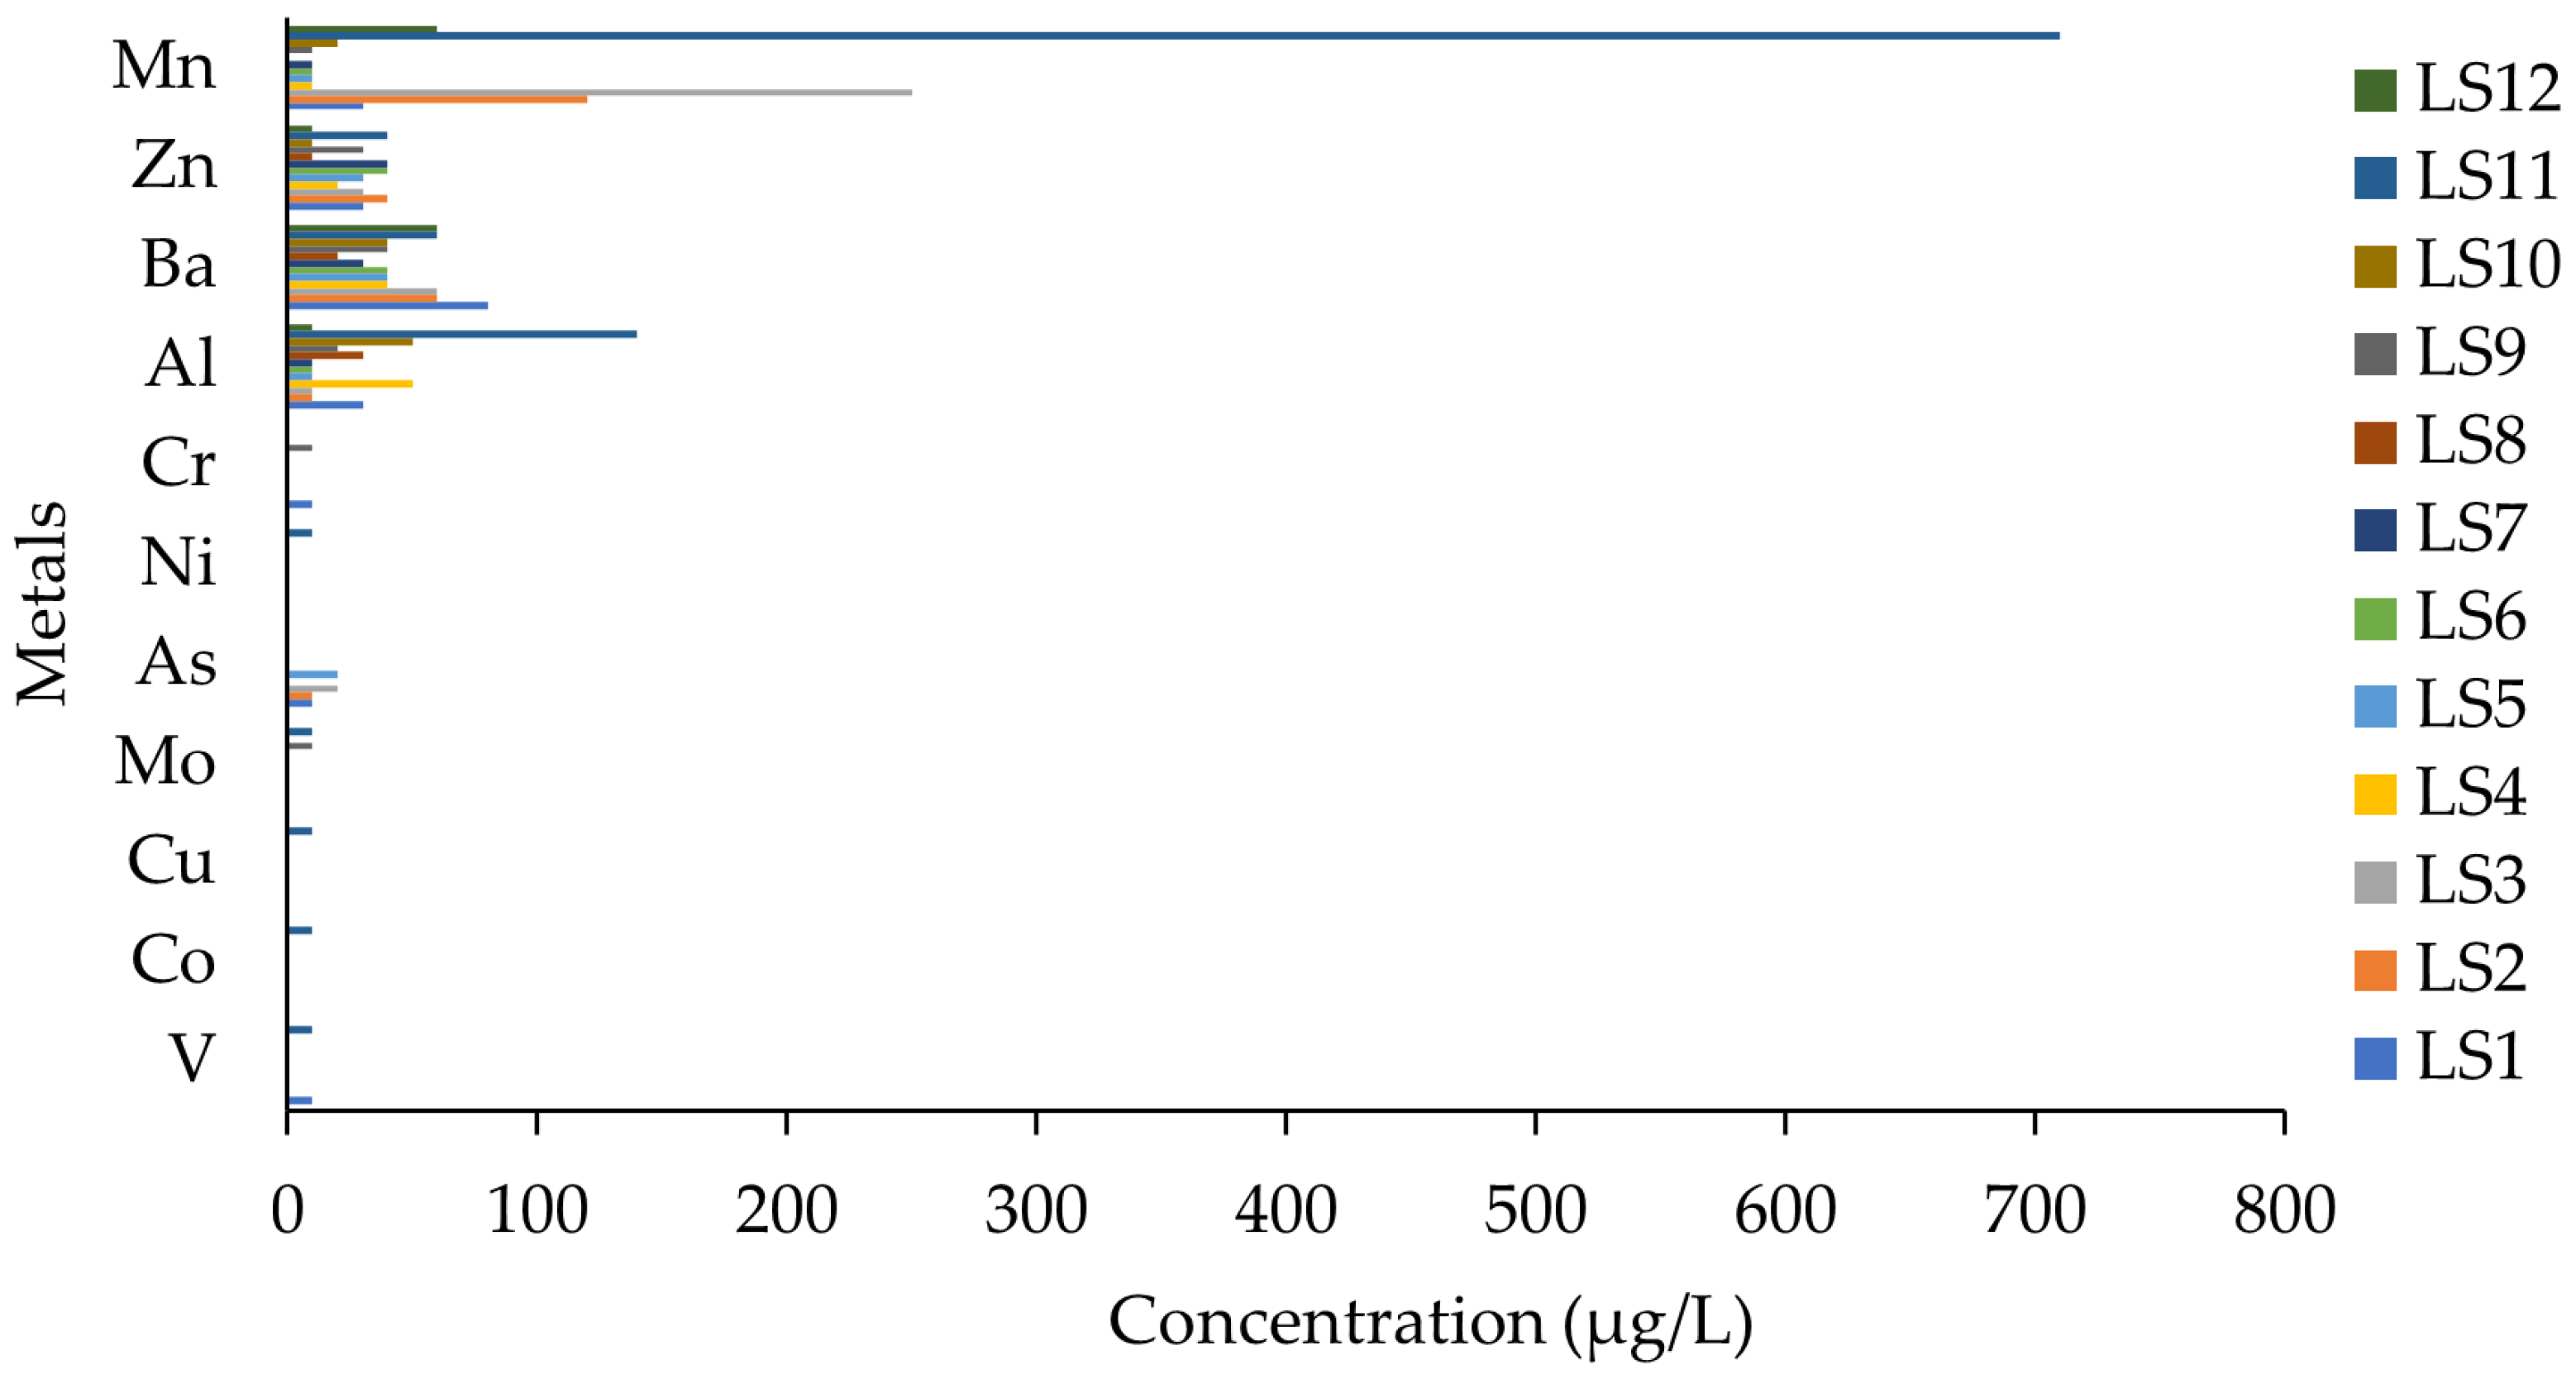
The Lissos River is receiving the discharge of the WWTP of the industrial area of the city of Komotini and agricultural runoffs [62]. In the Lissos River, four elements were detected at all sampling points (LS1–LS12) and seasons. Among the other monitored metals, Be, Cd, Se were not detected, and Co (10 μg/L), Cu (10 μg/L), Ni (10 μg/L) and V (10 μg/L) were detected once during the summer period (July 2021) at station LS11, which can be attributed to anthropogenic pressures, such as agricultural practices and outputs (e.g., fertilization). Mo (10 μg/L) was detected at two stations in two sampling periods, namely LS9 and LS11. Cr (10 μg/L) was determined twice at stations LS1 (at the delta of the river associated with agricultural runoffs) and LS9, while As (10 μg/L) was detected in two sampling periods at sampling points LS1, LS2, LS3 and LS5, where these pressures may be connected with agricultural runoffs. The concentrations of Al, Ba, Zn, Mn, As, Cr, Mo or V, and Co, Cu or Ni were 6.07 ± 1.90, 21.8 ± 2.27, 6.51 ± 1.24, 22.7 ± 9.06 μg/L, 0.71 ± 0.37 μg/L, 0.36 ± 0.20 μg/L, 0.238 ± 0.166 μg/L and 0.119 ± 0.118 μg/L, respectively. Therefore, the mean concentrations of the examined metals were found in the decreasing order of Mn > Ba > Zn > Al > As > Cr > V; Mo (V = Mo) > Co; Cu; Ni (Co = Cu = Ni), all of which were below the limits set by WHO [39,70]. For instance, the highest Al concentration (140 μg/L) was observed only once at sampling point LS11 during the winter season, which may be attributed to agricultural runoff pressure, and remained 30% below the WHO guideline limit. It is noteworthy that the average Al concentration in river and lake water bodies in Europe was 570 ± 409 μg/L from data collected over a five-decade period [63]. Metal concentration also varied from point to point along the river, as illustrated in Supplementary Table S2. Barium, which is an element found in many rocks and minerals, including those found beneath the Earth’s crust [73,74], ranged within 0–80 μg/L and 0–40 μg/L in the Lissos River and the adjacent coastal area, respectively. Mn was detected at least once in all sampling points of the Lissos River except for LS8, which is connected with tributaries and dry fields. The highest Mn concentration, observed once in July, was equal to 710 μg/L at point LS11, exceeding the value set by WHO [39,70] for drinking water. The geochemistry and mineralogy of clay formations contain Mn deposits [75]. This finding is confirmed by the elevated Al concentration (140 μg/L at LS11) in Lissos during winter, where Mn concentration was relatively high (70 μg/L), indicating a geogenic origin. Furthermore, Mn is highly sensitive to redox. Under oxidizing (aerobic) conditions, it precipitates as insoluble Mn(III/IV) oxyhydroxides on sediment surfaces [69]. The lower DO level and the limited flow during the summer create anoxic conditions in the sediment. Under anoxic conditions, Mn dissolves reductively into soluble Mn(II), and its concentration is higher when DO levels are lower [69]. Low summer discharges and elevated temperatures led to oxygen depletion in bottom sediments, which is consistent with the maximum Mn concentration of 710 µg/L at sampling station LS11 in the Lissos River (July 2021). Figure 4 shows the maximum concentration of the metals detected in each sampling point along the Lissos River.
As shown in Figure 4, Zn was low and much below WHO [39,70] limits in all sampling points and seasons, showing a maximum concentration of 40 μg/L at stations LS2 and LS11 during the summer of the first year (July 2021), LS6 during the autumn of the second year (September 2022) and LS7 during the winter of the last year (January 2023).
In the coastal zone of the Lissos River, Al, Ba, Zn, Mn and Mo were detected at all four sampling stations (LS1–LS4) (Supplementary Table S2). The maximum concentrations measured were 180 μg/L for Al and 40 μg/L for Ba at LS1, 50 μg/L for Zn and 60 μg/L for Mn at LS4, and 10 μg/L for Mo at all sampling stations. The mean concentrations followed the decreasing order Al > Ba = Zn > Mo > Mn at LS1, Al > Ba > Mn > Zn > Mo at LS2, Al > Ba > Mn > Zn > Mo at LS3, and Zn > Mn > Al > Ba > Mo at LS4. All measured values were below the thresholds established by international organizations.
According to the U.S. EPA chronic aquatic life criteria [40], the recommended concentrations for Cr (total), As, Ni, and Zn in freshwater are 85, 150, 52, and 120 μg/L, respectively, while the corresponding saltwater criteria for Cr(VI), As, Cd, Cu, Ni, and Zn are 50, 36, 7.9, 3.1, 8.2, and 81 μg/L, respectively. All measured concentrations in the Lissos River and its adjacent coastal zone were below these thresholds. Similarly, according to the WFD Environmental Quality Standards (EQS), Ni and Cd should not exceed 34 and 1.5 μg/L, respectively, and all measured concentrations were below these limits.

3.2. Assessment of the Heavy Metal Pollution Index (HPI)

The HPI of all sampling stations in the Laspias River was below the critical value of 100 [9,23], except marginally for station LP3 (HPI, 105) due to the high contribution of Mn (91.4 ± 18.0 μg/L), although the measured values were compared with drinking water limits [39]. The HPI was calculated separately for each sampling station (Table 4), yielding an average HPI value of 54.7 ± 10.8. Co and V were excluded from the HPI calculation because no guideline or standard values are available in the WFD [14,15], U.S. EPA [40], or WHO [39,70], or the relevant Greek Joint Ministerial Decrees 3525/23 and 438/85.
The HPI values in all stations of Lissos were below the critical value of 100, highlighting no metal pollution. As shown in Table 5, the HPI was calculated at each sampling point in the Lissos River. The results showed that the HPI ranged from 0.05 to 46.9, with a mean value of 14.4 ± 4.14. In the case of the Lissos River, the maximum HPI, but still half of the threshold value of 100, was found at station LS11.
Similarly, HPI values were calculated for the coastal area of each river, and the results are given in Table 6. The HPI was below the critical value of 100 in both coastal areas, indicating no pollution of PTEs, with an average HPI value of 7.42 ± 1.52 and 10.4 ± 0.83 for the four stations in the adjacent coastal zone of the Laspias and Lissos River, respectively, confirming no pollution.

3.3. Assessment of the Heavy Metal Evaluation Index (HEI)

HEI values were classified into five categories based on the relative literature [23,41]. The HEI values in water samples of the Laspias River ranged from 0.61 to 2.49, with a mean of 1.45 ± 0.22. The mean HEI in the whole study area classified the water quality in the second category (slightly affected, HEI from 1.0 to 2.0) [23,41] due to the high contribution of Mn. The maximum HEI value was observed in LP6 (HEI, 2.49), where its water quality is placed in the third category (moderately affected, HEI from 2.0 to 3.0 or 4.0), attributed to the high Mn concentration. The HEI values calculated at each sampling point for the Laspias River are given in Table 7. Co and V were excluded from the HEI calculation because no guideline or standard values are available in the WFD [14,15], U.S. EPA [40], or WHO [39,70], or the relevant Greek Joint Ministerial Decrees 3525/23 and 438/85.
The HEI for stations LS1–LS10 and LS12 in the Lissos River was much below the threshold value of 1, indicating no pollution (very pure/pure, HEI < 1), as given in Table 8. The HEI mean value was 0.39 ± 0.14 for all surface water samples in the Lissos River. The maximum HEI value was measured at station LS11 (1.61) due to the high contribution of Mn. The results showed that the HEI values, except for the one at station LS11 that was classified in the second category (slightly affected, HEI from 1.0 to 2.0), were below the HEI threshold limit of the first category, indicating excellent status for this freshwater ecosystem [16,22,25,26,28,29,42].
Regarding the sampling stations of the coastal area of each river, HEI values were given in Table 9. The HEI values varied from 0.03 to 0.28 and 0.20 to 0.29, with a mean of 0.14 ± 0.05 and 0.23 ± 0.02 for the four stations in the coastal zones of the Laspias and Lissos River, respectively, indicating good environmental status in both coastal zones. Thus, considering the above HEI values, the water quality in the coastal zones of the Laspias and the Lissos River was classified in the first category (very pure/pure, HEI < 1).
The mid-to-upstream Laspias reaches (LP4-LP6) and the Lissos station LS11, classified as “poor” to “bad” by Papaevangelou et al. [34], coincided with the highest metal loads of the present study (Mn up to 870–960 μg/L and Ba up to 150 μg/L in the Laspias; Mn up to 710 μg/L at LS11). The severe dissolved oxygen depletion reported at these stations [34] (down to 1.97 mg/L, with near-anoxic summer conditions) further explains the Mn maxima that drive the HEI classification, as low-oxygen conditions promote the reductive dissolution of Mn oxides to soluble Mn(II), particularly during the peak at LS11 in July.

4. Conclusions

In the Lissos and Laspias River, As, Ba, Be, Cd, Co, Cr, Cu, Mo, Ni, Se, V, Zn, Mn and Al were monitored via ICP-OES analysis to assess possible impact from anthropogenic and agricultural activities. Despite the limitation that no water was available at some sampling stations during the sampling campaign due to no-flow/dry conditions, the current study provides a detailed assessment of the water quality status of the studied water bodies. Metal concentrations were higher in the Laspias than in the Lissos River, although their average values within this two-year survey were below the legislative limits set by WHO [39,70], except for Mn based on WHO [39] standards for drinking water. Calculation of HPI in the Laspias and Lissos River and their adjacent coastal zones resulted in values below 100 for any station and season examined, except for station LP3 (HPI of 105). HEI was, on average, 1.45 in the Laspias River, classifying the water quality in the second category (slightly affected, HEI from 1.0 to 2.0) due to the high contribution of Mn that is attributed to the dissolution of naturally occurring Mn, and 0.39 in the Lissos River, classifying the water quality in the first category (very pure/pure, HEI < 1). The coastal zones of the Laspias and Lissos River showed average HEI values of 0.23 and 0.14, respectively, which characterized the water quality as very pure/pure. Since the water quality in these rivers is significantly influenced by PTE release due to anthropogenic (e.g., urban, agricultural, and industrial activities) and/or natural factors (e.g., metal content, interactions in the soil), proper management tools and practices, and even interventions (if needed), are necessary in order to improve and preserve good water quality. These practices and interventions may be applied at the local and regional scale, with the active engagement and participation of several stakeholders and authorities. These propositions include (1) a continuous monitoring scheme in order to create a complete image of the point and non-point pressures and their significance, (2) the enhancement of regional and governmental funding tools to support and educate local stakeholders (e.g., farmers, citizens, authorities), (3) provision of incentives and funding to the local industries for the installation of private wastewater treatment facilities, (4) measures and information systems in order to support the implementation of environmental legislation, and (5) the implementation of sustainable nature-based solutions, like vegetated buffer strips and constructed wetlands in order to mitigate agricultural runoff pollution.

Supplementary Materials

The following supporting information can be downloaded at: https://www.mdpi.com/article/10.3390/w18151800/s1, Table S1: Monitoring of targeted elements (mean values ± standard errors) in each sampling station of Laspias River and the adjacent coastal zone during the whole sampling period; Table S2: Monitoring of targeted elements (mean values ± standard errors) in each sampling station of Lissos River and the adjacent coastal zone during the whole sampling period.

Author Contributions

Conceptualization, K.A., I.K., S.N., C.A. and P.M.; methodology, K.A., A.M., K.A.B., V.P., D.L., I.K., S.N., C.A. and P.M.; software, K.A., A.M. and V.P.; formal analysis, K.A., A.M., S.N., C.A. and P.M.; investigation, K.A., A.M., K.A.B., V.P., C.A. and P.M.; data curation, K.A., A.M., S.N. and C.A.; writing—original draft preparation, K.A., A.M., S.N. and P.M.; writing—review and editing, K.A., I.K., S.N., C.A. and P.M.; supervision, K.A., I.K., S.N., C.A. and P.M. All authors have read and agreed to the published version of the manuscript.

Funding

This research was funded by the European Regional Development Fund of the European Union and Greek national funds, MIS 5047246.

Data Availability Statement

Data supporting the reported results, including those provided in the Supplementary Tables, are available within the article and its Supplementary Materials.

Acknowledgments

This work was carried out within the framework of the research project entitled “Strengthening the water management practices (in EMT-R) through the development of innovative ICT methodologies and improvement of research infrastructures, acronym Eye4Water, which was implemented under the action “Support for Research Infrastructure and Innovation”, through the Operational Program “Competitiveness, Entrepreneurship and Innovation”.

Conflicts of Interest

The authors declare no conflicts of interest.

References

  1. Azimi, A.; Azari, A.; Rezakazemi, M.; Ansarpour, M. Removal of heavy metals from industrial wastewaters: A review. ChemBioEng Rev. 2017, 4, 37–59. [Google Scholar] [CrossRef]
  2. Zamora-Ledezma, C.; Negrete-Bolagay, D.; Figueroa, F.; Zamora-Ledezma, E.; Ni, M.; Alexis, F.; Guerrero, V.H. Heavy metal water pollution: A fresh look about hazards, novel and conventional remediation methods. Environ. Technol. Innov. 2021, 22, 101504. [Google Scholar] [CrossRef]
  3. Madjar, R.M.; Vasile Scăețeanu, G. An Overview of Heavy Metal Contamination in Water from Agriculture: Origins, Monitoring, Risks, and Control Measures. Sustainability 2025, 17, 7368. [Google Scholar] [CrossRef]
  4. Zhang, Y.; Wang, S.; Gao, Z.; Zhang, H.; Zhu, Z.; Jiang, B.; Liu, J.; Dong, H. Contamination characteristics, source analysis and health risk assessment of heavy metals in the soil in Shi River Basin in China based on high density sampling. Ecotoxicol. Environ. Saf. 2021, 227, 112926. [Google Scholar] [CrossRef] [PubMed]
  5. Cabral Pinto, M.M.S.; Silva, M.M.V.; Ferreira da Silva, E.A.; Marinho-Reis, A.P. The cancer and non-cancer risk of santiago island (cape verde) population due to potential toxic elements exposure from soils. Geosciences 2017, 7, 78. [Google Scholar] [CrossRef]
  6. Gautam, R.K.; Sharma, S.K.; Mahiya, S.; Chattopadhyaya, M.C. Contamination of heavy metals in aquatic media: Transport, toxicity and technologies for remediation. In Heavy Metals in Water: Presence, Removal and Safety; Sharma, S., Ed.; Royal Society of Chemistry: London, UK, 2014; pp. 1–24. [Google Scholar]
  7. Cendrero, A.; Forte, L.M.; Remondo, J.; Cuesta-Albertos, J.A. Anthropocene geomorphic change. Climate or human activities? Earth’s Future 2020, 8, e2019EF001305. [Google Scholar] [CrossRef]
  8. Li, Y.; Zhou, Q.; Ren, B.; Luo, J.; Yuan, J.; Ding, X.; Bian, H.; Yao, X. Trends and health risks of dissolved heavy metal pollution in global river and lake water from 1970 to 2017. Rev. Environ. Contam. Toxicol. 2020, 251, 1–24. [Google Scholar] [CrossRef] [PubMed]
  9. Kumar, V.; Daman Parihar, R.; Sharma, A.; Bakshi, P.; Preet Singh Sidhu, G.; Shreeya Bali, S.; Karaouzas, I.; Bhardwaj, R.; Kumar Thukral, A.; Gyasi-Agyei, Y.; et al. Global evaluation of heavy metal content in surface water bodies: A meta-analysis using heavy metal pollution indices and multivariate statistical analyses. Chemosphere 2019, 236, 124364. [Google Scholar] [CrossRef] [PubMed]
  10. Weber, P.; Behr, E.R.; De Lellis Knorr, C.; Secretti Vendruscolo, D.; Flores, E.M.M.; Dressler, V.L.; Baldisserotto, B. Metals in the water, sediment, and tissues of two fish species from different trophic levels in a subtropical Brazilian river. Microchem. J. 2013, 106, 61–66. [Google Scholar] [CrossRef]
  11. Botsou, F.; Karageorgis, A.P.; Dassenakis, E.; Scoullos, M. Assessment of heavy metal contamination and mineral magnetic characterization of the Asopos river sediments (Central Greece). Mar. Pollut. Bull. 2011, 62, 547–563. [Google Scholar] [CrossRef] [PubMed]
  12. Cloern, J.E.; Abreu, P.C.; Carstensen, J.; Chauvaud, L.; Elmgren, R.; Grall, J.; Greening, H.; Johansson, J.O.R.; Kahru, M.; Sherwood, E.T.; et al. Human activities and climate variability drive fast-paced change across the world’s estuarine-coastal ecosystems. Glob. Change Biol. 2016, 22, 513–529. [Google Scholar] [CrossRef] [PubMed]
  13. Andricevic, R. Ecological quality assessment under uncertainty for transitional and coastal waters: Central Eastern Adriatic Sea study. Ecol. Indic. 2022, 138, 108850. [Google Scholar] [CrossRef]
  14. European Parliament; Council of the European Union. Directive 2000/60/EC of the European Parliament and the Council of 23 October 2000 establishing a framework for Community action in the field of water policy. Off. J. Eur. Communities 2000, L327, 1–73. Available online: https://eur-lex.europa.eu/legal-content/EN/TXT/?uri=CELEX%3A32000L0060 (accessed on 21 July 2026).
  15. European Parliament; Council of the European Union. Directive 2013/39/EU of the European Parliament and the Council of the European Union amending Directives 2000/60/EC and 2008/105/EC as regards priority substances in the field of water policy. Off. J. Eur. Union 2013, L226, 1–17. Available online: https://eur-lex.europa.eu/legal-content/EN/TXT/?uri=CELEX%3A32013L0039&qid=1773356408814 (accessed on 21 July 2026).
  16. Karaouzas, I.; Kapetanaki, N.; Mentzafou, A.; Kanellopoulos, T.D.; Skoulikidis, N. Heavy metal contamination status in Greek surface waters: A review with application and evaluation of pollution indices. Chemosphere 2021, 263, 127936. [Google Scholar] [CrossRef]
  17. Hama Aziz, K.H.; Mustafa, F.S.; Omer, K.M.; Hama, S.; Hamarawf, R.F.; Rahman, K.O. Heavy metal pollution in the aquatic environment: Efficient and low-cost removal approaches to eliminate their toxicity: A review. RSC Adv. 2023, 13, 17595–17610. [Google Scholar] [CrossRef] [PubMed]
  18. Mohan, S.V.; Nithila, P.; Reddy, J. Toxic/hazardous substances and environmental engineering estimation of heavy metals in drinking water and development of heavy metal pollution index. J. Environ. Sci. Health Environ. Sci. Eng. Tox. 1996, 31, 283–289. [Google Scholar] [CrossRef]
  19. Tamasi, G.; Cini, R. Heavy Metals in Drinking Waters from Mount Amiata. Possible Risks from Arsenic for Public Health in the Province of Siena. Sci. Total Environ. 2004, 327, 41–51. [Google Scholar] [CrossRef] [PubMed]
  20. Sheykhi, V.; Moore, F. Geochemical characterization of Kor River water quality, Fars Province, Southwest Iran. Water Qual. Expo. Health 2012, 4, 25–38. [Google Scholar] [CrossRef]
  21. Chiamsathit, C.; Auttamana, S.; Thammarakcharoen, S. Heavy metal pollution index for assessment of seasonal groundwater supply quality in hillside area, Kalasin, Thailand. Appl. Water Sci. 2020, 10, 142. [Google Scholar] [CrossRef]
  22. Kabir, M.H.; Islam, M.S.; Tusher, T.R.; Hoq, M.E.; Muliadi Mamun, S.A. Changes of heavy metal concentrations in shitalakhya river water of Bangladesh with seasons. Indones. J. Sci. Technol. 2020, 5, 395–409. [Google Scholar] [CrossRef]
  23. Gad, M.; El-Safa, M.M.A.; Farouk, M.; Hussein, H.; Alnemari, A.M.; Elsayed, S.; Khalifa, M.M.; Moghanm, F.S.; Eid, E.M.; Saleh, A.H. Integration of water quality indices and multivariate modeling for assessing surface water quality in qaroun lake, Egypt. Water 2021, 13, 2258. [Google Scholar] [CrossRef]
  24. Kumar, N.; Tiwari, M.K.; Singh, R.; Singha, S.; Singha, S.S.; Babu, K.P. Indexical methods assessing PTEs distribution in Mahan river command area, central India’s coal mining zone. Geochem. Trans. 2025, 26, 2. [Google Scholar] [CrossRef] [PubMed]
  25. Edet, A.E.; Offiong, O.E. Evaluation of water quality pollution indices for heavy metal contamination monitoring. A study case from Akpabuyo-Odukpani area, Lower Cross River Basin (southeastern Nigeria). GeoJournal 2002, 57, 295–304. [Google Scholar] [CrossRef]
  26. Bhuiyan, M.A.H.; Islam, M.A.; Dampare, S.B.; Parvez, L.; Suzuki, S. Evaluation of hazardous metal pollution in irrigation and drinking water systems in the vicinity of a coal mine area of northwestern Bangladesh. J. Hazard Mater. 2010, 179, 1065–1077. [Google Scholar] [CrossRef] [PubMed]
  27. Hoaghia, M.A.; Roman, C.; Ristoiu, D.; Popita, G.; Tanaselia, C. Assessing of water quality pollution indices for heavy metal contamination. A study case from medias city groundwaters. Agricultura 2013, 87, 25–31. [Google Scholar]
  28. Biswas, P.K.; Uddin, N.; Alam, S.; Us-Sakib, T.; Sultana, S.; Ahmed, T. Evaluation of heavy metal pollution indices in irrigation and drinking water systems of Barapukuria Coal Mine Area, Bangladesh. Am. J. Water Resour. 2017, 5, 146–151. [Google Scholar]
  29. Ustaoğlu, F.; Taş, B.; Tepe, Y.; Topaldemir, H. Comprehensive assessment of water quality and associated health risk by using physicochemical quality indices and multivariate analysis in Terme River, Turkey. Environ. Sci. Pollut. Res. 2021, 28, 62736–62754. [Google Scholar] [CrossRef]
  30. Jiang, B.; Tang, Y.; Zhang, Y.; Ju, W.; Lin, A. Assessments of Water Quality in Tibetan Plateau Require Focus on Heavy-Metal Indicators: Evidence from the Lhasa River. Water Air Soil Pollut. 2025, 236, 557. [Google Scholar] [CrossRef]
  31. Skoulikidis, N.; Kaberi, H.; Sakellariou, D.; Wantzen, K.M.R.K.O.; Mortl, M.; Cantonati, M.; Toth, L.G.; Netherlanfds Fischer, P. Patterns, origin and possible effects of sediment pollution in a Mediterranean lake. In Ecological Effects of Water-Level Fluctuations in Lakes; Springer: Dordrecht, The Netherlands, 2008; pp. 613–640. [Google Scholar]
  32. Gikas, G.D. Water quantity and hydrochemical quality monitoring of Laspias River, North Greece. J. Environ. Sci. Health Part A 2017, 52, 1312–1321. [Google Scholar] [CrossRef]
  33. Gikas, G.D.; Dimou, D.; Tsihrintzis, V.A. River water quantity and quality monitoring in an agricultural basin in north Greece. Fresenius Environ. Bull. 2013, 22, 2006–2016. [Google Scholar]
  34. Papaevangelou, V.; Bakalakou, K.A.; Ntislidou, C.; Latinopoulos, D.; Kokkos, N.; Zachopoulos, K.; Zoidou, M.; Makri, A.; Azis, K.; Ioannidou, N.; et al. The Spring to Coast Approach in Small-Scale Catchments and Adjacent Coastal Zone. Water 2024, 16, 259. [Google Scholar] [CrossRef]
  35. Karditsa, A.; Poulos, S.E. Sedimentological investigations in a river-influenced tideless coastal embayment: The case of the inner continental shelf of the northeastern Aegean Sea. Cont. Shelf Res. 2013, 55, 86–96. [Google Scholar] [CrossRef]
  36. Poulos, S.E. Mediterranean Sea: An overview of the spatial distribution of surficial sediment in relation to their origin, seabed relief and water circulation patterns. Cont. Shelf Res. 2025, 290, 105449. [Google Scholar] [CrossRef]
  37. ISO 5667-3:2024; Water Quality-Sampling-Part 3: Preservation and Handling of Water Samples. International Organization for Standardization: Geneva, Switzerland, 2024.
  38. American Public Health Association; American Water Works Association; World Economic Forum. Standard Methods for the Examination of Water and Wastewater, 23rd ed.; American Public Health Association: Washington, DC, USA, 2017. [Google Scholar]
  39. WHO. Guidelines for Drinking-Water Quality: Fourth Edition Incorporating the First and Second Addenda; World Health Organization: Geneva, Switzerland, 2022; Available online: https://www.who.int/publications/i/item/9789240045064 (accessed on 21 July 2026).
  40. U.S. Environmental Protection Agency (U.S. EPA). National Recommended Water Quality Criteria-Aquatic Life Criteria Table; EPA 822-R-02-047; Office of Water: Washington, DC, USA, 2002. Available online: https://www.epa.gov/wqc/national-recommended-water-quality-criteria-aquatic-life-criteria-table (accessed on 21 July 2026).
  41. Balakrishnan, A.; Ramu, A. Evaluation of Heavy Metal Pollution Index (HPI) of Ground Water in and around the Coastal Area of Gulf of Mannar Biosphere and Palk Strait. J. Adv. Chem. Sci. 2016, 2, 331–333. [Google Scholar] [CrossRef]
  42. Saleh, H.N.; Panahande, M.; Yousefi, M.; Asghari, F.B.; Oliveri Conti, G.; Talaee, E.; Mohammadi, A.A. Carcinogenic and noncarcinogenic risk assessment of heavy metals in groundwater wells in Neyshabur Plain. Iran. Biol. Trace Elem. Res. 2018, 190, 251–261. [Google Scholar] [CrossRef] [PubMed]
  43. Mokarram, M.; Saber, A.; Sheykhi, V. Effects of heavy metal contamination on river water quality due to release of industrial effluents. J. Clean. Prod. 2020, 277, 123380. [Google Scholar] [CrossRef]
  44. Prasad, B.; Bose, J.M. Evaluation of heavy metal pollution index for surface and spring water near a limestone mining area of the lower Himalayas. Environ. Geol. 2001, 41, 183–188. [Google Scholar] [CrossRef]
  45. Kumar, R.N.; Solanki, R.; Kumar, J.I.N. Seasonal variation in heavy metal contamination in water and sediments of river Sabarmati and Kharicut canal at Ahmedabad, Gujarat. Environ. Monit. Assess. 2013, 185, 359–368. [Google Scholar] [CrossRef] [PubMed]
  46. Zhang, P.; Yang, M.; Lan, J.; Huang, Y.; Zhang, J.; Huang, S.; Yang, Y.; Ru, J. Water Quality Degradation Due to Heavy Metal Contamination: Health Impacts and Eco-Friendly Approaches for Heavy Metal Remediation. Toxics 2023, 11, 828. [Google Scholar] [CrossRef] [PubMed]
  47. Scoullos, M.; Botsou, F. Geochemical processes of trace metals in fresh–saline water interfaces: The cases of Louros and Acheloos estuaries. In The Rivers of Greece; The Handbook of Environmental Chemistry; Springer: Berlin/Heidelberg, Germany, 2018; Volume 59, pp. 241–277. [Google Scholar] [CrossRef]
  48. Karamanis, D.; Stamoulis, K.; Ioannides, K.; Patiris, D. Spatial and seasonal trends of natural radioactivity and heavy metals in river waters of Epirus, Macedonia and Thessalia. Desalination 2008, 224, 250–260. [Google Scholar] [CrossRef]
  49. Aytaş, S.; Erenturk, S.; Aslani, M.A.A.; Yusan, S.; Türközü, D.A.; Gök, C.; Karalı, T.; Gökçe, M.; Oğuz, K.F. Determination and evaluation of natural radioactivity and heavy metal levels in the aquatic environment of trans-boundary rivers: Maritza, Tundja and Arda. J. Radioanal. Nucl. Chem. 2014, 300, 933–945. [Google Scholar] [CrossRef]
  50. Karageorgis, A.P.; Nikolaidis, N.P.; Karamanos, H.; Skoulikidis, N. Water and sediment quality assessment of the Axios River and its coastal environment. Cont. Shelf Res. 2003, 23, 1929–1944. [Google Scholar] [CrossRef]
  51. Levkov, Z.; Krstić, S. Use of algae for monitoring of heavy metals in the River Vardar, Macedonia. Mediterr. Mar. Sci. 2002, 3, 99–112. [Google Scholar] [CrossRef]
  52. Dimitriou, E.; Mentzafou, A.; Zogaris, S.; Tzortziou, M.; Gritzalis, K.; Karaouzas, I.; Nikolaidis, C. Assessing the environmental status and identifying the dominant pressures of a trans-boundary river catchment to facilitate efficient management and mitigation practices. Environ. Earth Sci. 2012, 66, 1839–1852. [Google Scholar] [CrossRef]
  53. Pisinaras, V.; Petalas, C.; Gemitzi, A.; Tsihrintzis, V.A. Water quantity and quality monitoring of Kosynthos River, North-Eastern Greece. Glob. Nest J. 2007, 9, 259–268. [Google Scholar]
  54. Boskidis, I.; Gikas, G.D.; Sylaios, G.; Tsihrintzis, V.A. Water quantity and quality assessment of the lower Nestos River, Greece. J. Environ. Sci. Health A 2011, 46, 1050–1067. [Google Scholar] [CrossRef]
  55. Fytianos, K.; Siumka, A.; Zachariadis, G.A.; Beltsios, S. Assessment of the quality characteristics of Pinios River, Greece. Water Air Soil Pollut. 2002, 136, 317–329. [Google Scholar] [CrossRef]
  56. Loukas, A. Surface water quantity and quality assessment in Pinios River, Thessaly, Greece. Desalination 2010, 250, 266–273. [Google Scholar] [CrossRef]
  57. Radeva, K.; Seymenov, K. Surface water pollution with nutrient components, trace metals and metalloids in agricultural- and mining-affected river catchments (a case study for three tributaries of the Maritsa River, Southern Bulgaria). Geogr. Pannonica 2021, 25, 214–225. [Google Scholar] [CrossRef]
  58. Akbulut, N.E.; Tuncer, A.M. Accumulation of heavy metals with water quality parameters in Kızılırmak River Basin (Delice River) in Turkey. Environ. Monit. Assess. 2011, 173, 387–395. [Google Scholar] [CrossRef] [PubMed]
  59. Dündar, M.S.; Altundağ, H. Investigation of heavy metal contaminations in the lower Sakarya River water and sediments. Environ. Monit. Assess. 2007, 128, 177–181. [Google Scholar] [CrossRef] [PubMed]
  60. Varol, M.; Şen, B. Assessment of nutrient and heavy metal contamination in surface water and sediments of the upper Tigris River, Turkey. Catena 2012, 92, 1–10. [Google Scholar] [CrossRef]
  61. Tzempelikou, E.; Zeri, C.; Iliakis, S.; Paraskevopoulou, V. Cd, Co, Cu, Ni, Pb, Zn in coastal and transitional waters of Greece and assessment of background concentrations: Results from 6 years of implementation of the Water Framework Directive. Sci. Total Environ. 2021, 774, 145177. [Google Scholar] [CrossRef]
  62. Gikas, G.D.; Lergios, D.; Tsihrintzis, V.A. Comparative Assessment of the Application of Four Water Quality Indices (WQIs) in Three Ephemeral Rivers in Greece. Water 2023, 15, 1443. [Google Scholar] [CrossRef]
  63. Zhou, Q.; Yang, N.; Li, Y.; Ren, B.; Ding, X.; Bian, H.; Yao, X. Total concentrations and sources of heavy metal pollution in global river and lake water bodies from 1972 to 2017. Glob. Ecol. Conserv. 2020, 22, e00918. [Google Scholar] [CrossRef]
  64. Tokatli, C. Water and sediment quality assessment of the lifeblood of thrace region (Turkey): Meric River Basin. Fresenius Environ. Bull. 2019, 28, 4131–4140. [Google Scholar]
  65. Senze, M.; Kowalska-Góralska, M.; Czyż, K. Availability of aluminum in river water supplying dam reservoirs in Lower Silesia considering the hydrochemical conditions. Environ. Nanotechnol. Monit. Manag. 2021, 16, 100535. [Google Scholar] [CrossRef]
  66. Brraich, O.S.; Jangu, S. Evaluation of water quality pollution indices for heavy metal contamination monitoring in the water of Harike Wetland (Ramsar Site), India. Int. J. Sci. Res. Publ. 2015, 5, 1–6. [Google Scholar]
  67. Andarani, P.; Alimuddin, H.; Suzuki, R.; Yokota, K.; Inoue, T. Zinc contamination in surface water of the Umeda River, Japan. In IOP Conference Series: Earth and Environmental Science; IOP Publishing: Bristol, UK, 2021; Volume 623, p. 012064. [Google Scholar]
  68. Elmaci, A.; Teksoy, A.; Topaç, F.O.; Özengin, N.; Kurtoǧlu, S.; Başkaya, H.S. Assessment of heavy metals in Lake Uluabat, Turkey. Afr. J. Biotechnol. 2007, 6, 2236–2244. [Google Scholar] [CrossRef]
  69. Kousa, A.; Komulainen, H.; Hatakka, T.; Backman, B.; Hartikainen, S. Variation in groundwater manganese in Finland. Environ. Geochem. Health 2021, 43, 1193–1211. [Google Scholar] [CrossRef] [PubMed]
  70. WHO. Guidelines for Drinking-Water Quality: Fourth Edition Incorporating the First Addendum; World Health Organization: Geneva, Switzerland, 2017; Available online: https://www.who.int/publications/i/item/9789241549950 (accessed on 21 July 2026).
  71. Soulamidis, G.; Stouraiti, C.; Voudouris, P.; Tsikos, H. New Ag-rich Mn-Zn ± Pb vein mineralization at the Mavro Xylo manganese oxide deposit, Drama, Greece. Minerals 2024, 14, 955. [Google Scholar] [CrossRef]
  72. Petalas, C.; Lambrakis, N.; Zaggana, E. Hydrochemistry of waters of volcanic rocks: The case of the volcanosedimentary rocks of Thrace, Greece. Water Air Soil Pollut. 2006, 169, 375–394. [Google Scholar] [CrossRef]
  73. Tudorache, A.; Marin, C.; Badea, I.A.; Vlădescu, L. Barium concentrations and speciation in mineral natural waters of central Romania. Environ. Monit. Assess. 2010, 165, 113–123. [Google Scholar] [PubMed]
  74. Lu, Q.; Xu, X.; Xu, Z.; Liang, L.; Shang, L.; Xiao, D.; Zhang, S.; Jiang, Y.; Qiu, G. Barium concentrations and speciation in surface waters collected from an active barium mining area in Guizhou Province, southwestern China. Environ. Sci. Pollut. Res. 2018, 25, 7608–7617. [Google Scholar] [CrossRef] [PubMed]
  75. Öztürk, H.; Cansu, Z.; Hacılar, F.; Bolton, B. Geochemistry of the Oligocene-hosted manganese ores and the host sediments in the Thrace Basin, Türkiye: Implications for genesis and exploration of the Paratethyan Mn deposits. J. Geochem. Explor. 2025, 272, 107707. [Google Scholar] [CrossRef] [PubMed]
Figure 1. Study area of the Laspias and Lissos River.
Water 18 01800 g001
Figure 2. (a) Sampling stations in the Laspias river basin and the sampling points along the shore; (b) sampling stations in the Lissos river basin and the sampling points along the shore.
Water 18 01800 g002
Figure 3. Maximum level of metals detected along the Laspias River.
Water 18 01800 g003
Figure 4. Maximum level of metals detected along the Lissos River.
Water 18 01800 g004
Table 1. Evaluation of PTE pollution via HPI value.
Pollution DegreeHPI Value
Low presence of PTEs<100
Threshold for PTE pollution=100
PTE pollution>100
Table 2. Characterization of the HEI.
ClassWater QualificationHEI by Gad et al. [23]; Balakrishnan and Ramu [41]HEI by Karaouzas et al. [16]; Ustaoğlu et al. [29]; Jiang et al. [30]; Saleh et al. [42]; Mokarram et al. [43]HEI by Bhuiyan et al. [26]; Biswas et al. [28]HEI by Kabir et al. [22]; Edet and Offiong [25]; Hoaghia et al. [27]; Prasad and Bose [44]
IVery pure/Pure<1.0<10<150<400
IISlightly affected1.0–2.0
IIIModerately affected2.0–3.0 or 4.010–20150–300400–800
IVStrongly affected3.0 or 4.0–6.0
VSeriously affected>6.0>20>300>800
Table 3. Comparison of PTE concentrations in the freshwater and coastal waters of the present study and regional aquatic systems.
Part I.
Name of Water BodyMn (µg/L)Cu (µg/L)Ni (µg/L)Zn (µg/L)Cd (µg/L)References
minmaxmeanminmaxmeanminmaxmeanminmaxmeanminmaxmean
River water
Achelloos0.002.800.500.015.400.800.455.201.600.2821.75.90 Scoullos and Botsou [47]
Aliakmonas0.2029.64.400.9015.13.401.1022.25.001.1022516.1 Karamanis et al. [48]
Arda74.030919612.014014.0 42.095.066.0 Aytaş et al. [49]
Axios 13.7 8.20 56.2 1.10 Karageorgis et al. [50]
Axios 249 98.0 473 36.0 Levkov and Krstić [51]
Evros 0.701.901.2044.01172608 BDLDimitriou et al. [52]
Evros56.05862117.0016026.0 16.093.043.0BDL Aytaş et al. [49]
Kosynthos0.0017443.23.5052.811.90.009.800.8047.56381761.505.303.10Pisinaras et al. [53]
Nestos0.0014911.90.0076.615.20.0010713.30.0019941.40.009.403.30Boskidis et al. [54]
Pinios0.2015.14.000.9010.83.700.9012.44.301.8057.912.0 Karamanis et al. [48]
Pinios 5.206.906.1012.016.714.1 0.500.700.60Fytianos et al. [55]
Pinios 0.200.400.20Loukas [56]
Chepelare56.013,24012111.8012.25.20BDL16.6~1.2032.01160227 Radeva and Seymenov [57]
Kizilirmak1.36234 0.4542.5 0.0631.48 Akbulut and Tuncer [58]
Luda Yana42.09502549.9027576.7 BDL43.2~4.703.6012028.0 Radeva and Seymenov [57]
Sakarya 4362 4977 1360 1271 Dündar and Altundağ [59]
Terme0.984.732.251.193.682.231.383.542.224.0411520.10.660.980.70Ustaoğlu et al. [29]
Tigris <1.00467 <1.20165 <5.8072.0 <1.6037.0 <0.0091.37 Varol and Şen [60]
Topolnitsa41.026114051.8046256.3BDL21.8~5.208.6021362.8 Radeva and Seymenov [57]
Tundzha70.05212052.0024.010.0 7.0033667.0 Aytaş et al. [49]
Laspias 10.0230109BDL10.00.93BDL50.02.50BDL80.022.7BDLBDLBDLPresent study
Lissos0.0071022.8BDL10.00.70BDL10.01.40BDL40.06.65BDLBDLBDLPresent Study
Sea water
Northeastern Aegean Sea 0.152.890.280.301.260.560.425.421.780.0040.150.014Tzempelikou et al. [61]
Central Aegean Sea 0.070.240.340.295.260.640.429.431.890.0010.0390.012Tzempelikou et al. [61]
Laspias coastal zoneBDL804.50BDLBDLBDLBDLBDLBDLBDL207.73BDLBDLBDLPresent study
Lissos coastal zoneBDL6011.5BDLBDLBDLBDLBDLBDLBDL509.75BDLBDLBDLPresent study
Part II.
Name of Water BodyCr (µg/L)As (µg/L)Co (µg/L)Al (μg/L)Mo (µg/L)References
minmaxmeanminmaxmeanminmaxmeanminmaxmeanminmaxmean
River water
Achelloos Scoullos and Botsou [47]
AliakmonasBDL9.401.90 BDL7.792.50Karamanis et al. [48]
Arda 63.0449333 Aytaş et al. [49]
Axios 4.20 10.9 Karageorgis et al. [50]
Axios Levkov and Krstić [51]
Evros0.002.801.10 Dimitriou et al. [52]
Evros 180494985 Aytaş et al. [49]
Kosynthos0.0024.23.60 Pisinaras et al. [53]
Nestos Boskidis et al. [54]
PiniosBDL7.901.40 BDL26.53.30Karamanis et al. [48]
Pinios14.121.817.3 Fytianos et al. [55]
Pinios Loukas [56]
Chepelare BDL14.0~3.90 4.5086.020.8 Radeva and Seymen [57]
Kizilirmak 0.5216.2 39.3629 Akbulut and Tuncer [58]
Luda Yana BDL12.8~4.60 52.01108369 Radeva and Seymenov [57]
Sakarya 228 Dündar and Altundağ [59]
Terme0.841.271.010.281.020.491.191.321.252.1133849.7 Ustaoğlu et al. [29]
Tigris <5.00<5.00<0.222.35 <5.00111 Varol and Şen [60]
Topolnitsa BDL4.10~2.10 24.0386187 Radeva and Seymenov [57]
Tundzha 1002237542 Aytaş et al. [49]
Laspias BDL1103.46BDL10.01.40BDL10.00.72BDL90.010.2BDL10.01.40Present study
Lissos BDL10.00.61BDL20.01.72BDL10.00.70BDL1406.18BDL10.01.40Present Study
Sea water
Northeastern Aegean Sea 0.0120.0910.043 Tzempelikou et al. [61]
Central Aegean Sea 0.0120.150.048 Tzempelikou et al. [61]
Laspias coastal zoneBDLBDLBDLBDLBDLBDLBDLBDLBDLBDL90.021.5BDL10.06.68Present study
Lissos coastal zoneBDLBDLBDLBDLBDLBDLBDLBDLBDLBDL18033.3BDL10.05.38Present study
Table 4. HPI calculation at each sampling station (LP1–LP6) in the Laspias River based on nine potentially toxic elements (PTEs), i.e., Ba, Zn, Mn, As, Cd, Cr, Cu, Mo and Ni. BDL indicates that the tested PTEs were below the limit of detection.
PTEsLP1LP2LP3LP4ALP4BLP5LP6
Q i × w i Σ w i
Ba0.0760.0700.1620.2550.0260.0890.022
Zn0.0100.0050.0150.0330.0010.010.002
Mn60.8350.49105.082.0517.1519.6414.74
AsBDLBDLBDLBDL10.69BDL9.627
CdBDLBDLBDLBDLBDLBDLBDL
CrBDL1.701BDLBDL0.4281.6765.391
CuBDLBDLBDLBDLBDL0.0010.001
Mo1.045BDLBDLBDLBDLBDLBDL
Ni BDLBDLBDLBDLBDLBDL1.375
HPI = i = 1 i = n ( Q i × w i ) i = 1 i = n w i 61.9652.26105.282.3428.3021.4131.16
Table 5. HPI calculation at each sampling station (LS1–LS12) in the Lissos River based on nine potentially toxic elements (PTEs), i.e., Ba, Zn, Mn, As, Cd, Cr, Cu, Mo and Ni. BDL indicates that the tested PTEs were below the limit of detection.
PTEsLS1LS2LS3LS4LS5LS6LS7LS8LS9LS10LS11LS12
Q i × w i Σ w i
Ba0.0170.01640.01710.09940.01120.08080.06840.04350.01590.06840.02970.0932
Zn0.0010.0010.0010.0060.0010.0090.0060.0010.0020.0030.0020.001
Mn1.6717.2706.6818.2050.3933.2821.641BDL0.9323.82945.5114.77
As 10.6912.5827.15BDL27.15BDLBDLBDLBDLBDLBDLBDL
CdBDLBDLBDLBDLBDLBDLBDLBDLBDLBDLBDLBDL
Cr0.428BDLBDLBDLBDLBDLBDLBDL2.387BDLBDLBDL
CuBDLBDLBDLBDLBDLBDLBDLBDLBDLBDL0.001BDL
MoBDLBDLBDLBDLBDLBDLBDLBDL0.609BDL0.683BDL
NiBDLBDLBDLBDLBDLBDLBDLBDLBDLBDL0.683BDL
HPI = i = 1 i = n ( Q i × w i ) i = 1 i = n w i 12.8119.8631.858.31025.563.3721.7150.0453.9463.90046.9114.86
Table 6. HPI calculation at the sampling stations of the adjacent coastal zones of the Laspias (LP1–LP4) and Lissos (LS1–LS4) Rivers based on nine potentially toxic elements (PTEs), i.e., Ba, Zn, Mn, As, Cd, Cr, Cu, Mo and Ni. BDL indicates that the tested PTEs were below the limit of detection.
PTEsLP1LP2LP3LP4LS1LS2LS3LS4
Q i × w i Σ w i
Ba0.0060.0140.0090.0120.0210.0240.0300.015
Zn0.0030.0030.0030.0040.0040.0030.0040.007
MnBDL8.964BDL1.1213.3625.6037.8448.964
AsBDLBDLBDLBDLBDLBDLBDLBDL
CdBDLBDLBDLBDLBDLBDLBDLBDL
CrBDLBDLBDLBDLBDLBDLBDLBDL
CuBDLBDLBDLBDLBDLBDLBDLBDL
Mo6.2723.6595.2274.3916.2723.1362.0914.182
NiBDLBDLBDLBDLBDLBDLBDLBDL
HPI = i = 1 i = n ( Q i × w i ) i = 1 i = n w i 6.28112.645.2395.5279.6598.7669.96913.17
Table 7. HEI values at each sampling station (LP1–LP6) in the Laspias River based on nine potentially toxic elements (PTEs), i.e., Ba, Zn, Mn, As, Cd, Cr, Cu, Mo and Ni. BDL indicates that the tested PTEs were below the limit of detection.
PTEsLP1LP2LP3LP4ALP4BLP5LP6
H i H m a c
Ba0.0280.0310.0290.0450.0450.0400.043
Zn0.0090.0050.0060.0130.0030.0100.007
Mn1.3571.3571.1430.8931.8330.5361.750
As BDLBDLBDLBDL0.143BDL0.143
CdBDLBDLBDLBDLBDLBDLBDL
CrBDL0.029BDLBDL0.0290.0290.400
CuBDLBDLBDLBDLBDL0.0010.001
Mo0.020BDLBDLBDLBDLBDLBDL
NiBDLBDLBDLBDLBDLBDL0.143
HEI = i = 1 n H i H m a c 1.4141.4211.1780.9512.0530.6152.486
Table 8. HEI values at each sampling station (LS1–LS12) in the Lissos River based on nine potentially toxic elements (PTEs), i.e., Ba, Zn, Mn, As, Cd, Cr, Cu, Mo and Ni. BDL indicates that the tested PTEs were below the limit of detection.
PTEsLS1LS2LS3LS4LS5LS6LS7LS8LS9LS10LS11LS12
H i H m a c
Ba0.0290.0240.0250.0180.0170.0140.0120.0080.0090.0120.0170.017
Zn0.0020.0040.0020.0020.0020.0040.0020.0010.0030.0010.0020.001
Mn0.1790.6610.6070.0890.0360.0360.018BDL0.0360.0421.5540.161
As 0.1430.1430.286BDL0.286BDLBDLBDLBDLBDLBDLBDL
CdBDLBDLBDLBDLBDLBDLBDLBDLBDLBDLBDLBDL
Cr0.029BDLBDLBDLBDLBDLBDLBDL0.057BDLBDLBDL
CuBDLBDLBDLBDLBDLBDLBDLBDLBDLBDL0.001BDL
MoBDLBDLBDLBDLBDLBDLBDLBDL0.020BDL0.020BDL
NiBDLBDLBDLBDLBDLBDLBDLBDLBDLBDL0.020BDL
HEI = i = 1 n H i H m a c 0.3810.8320.9200.1090.3400.0540.0320.0080.1260.0551.6140.178
Table 9. HEI values in the coastal zones of the Laspias (stations LP1–LP4) and Lissos (stations LS1–LS4) Rivers based on nine potentially toxic elements (PTEs), i.e., Ba, Zn, Mn, As, Cd, Cr, Cu, Mo and Ni. BDL: It indicates that the tested PTEs were below the limit of detection.
PTEsLP1LP2LP3LP4LS1LS2LS3LS4
H i H m a c
Ba0.0020.0050.0030.0040.0080.0090.0110.006
Zn0.0030.0020.0020.0030.0030.0030.0030.006
MnBDL0.200BDL0.0250.0750.1250.1750.200
As BDLBDLBDLBDLBDLBDLBDLBDL
CdBDLBDLBDLBDLBDLBDLBDLBDL
CrBDLBDLBDLBDLBDLBDLBDLBDL
CuBDLBDLBDLBDLBDLBDLBDLBDL
Mo0.1220.0710.1020.0860.1220.0610.0410.082
NiBDLBDLBDLBDLBDLBDLBDLBDL
HEI = i = 1 n H i H m a c 0.1270.2790.1080.0330.2080.1980.2300.293
Disclaimer/Publisher’s Note: The statements, opinions and data contained in all publications are solely those of the individual author(s) and contributor(s) and not of MDPI and/or the editor(s). MDPI and/or the editor(s) disclaim responsibility for any injury to people or property resulting from any ideas, methods, instructions or products referred to in the content.