1. Introduction
Water pollution is of concern due to its impact on the availability of safe drinking water, the spread of waterborne diseases associated with contaminated water supplies, and the degradation of aquatic ecosystems. With growing awareness of these environmental challenges, various approaches to environmental remediation have been developed [
1,
2]. Conventional water-treatment methods, including adsorption, coagulation, sedimentation, filtration, and membrane technologies, often exhibit limited efficiency in the complete removal of contaminants, since pollutants are commonly transferred between phases rather than fully degraded. Furthermore, such processes may involve high operating costs and generate secondary toxic by-products, highlighting the need for more efficient and environmentally sustainable water remediation technologies. Over the past decades, Advanced Oxidation Processes (AOPs) have become recognized as some of the most effective and practical approaches for wastewater treatment. Their efficiency is based on the in situ generation of highly reactive species, such as hydroxyl and superoxide radicals, capable of degrading persistent organic pollutants into potentially less harmful or fully mineralized products. Among the various AOPs, heterogeneous photocatalysis has attracted considerable attention due to its ability to degrade a broad range of refractory contaminants under relatively mild conditions. Semiconductor-based photocatalysts, particularly TiO
2, ZnO, and CeO
2, have been extensively investigated due to their high chemical stability, low toxicity, and favourable redox and photocatalytic properties [
1,
3,
4].
In semiconductor photocatalysis, irradiation with photons possessing energy equal to or greater than the band gap promotes electrons from the valence band to the conduction band, generating electron–hole pairs responsible for photocatalytic reactions. However, the rapid recombination of these charge carriers significantly limits photocatalytic efficiency. To suppress electron–hole recombination and improve charge separation, the formation of heterojunctions between different semiconductors has become one of the most widely investigated strategies in photocatalysis [
2]. Heterojunctions are formed at the interface between two semiconducting materials with different electronic structures, enabling more efficient separation and transfer of photogenerated charge carriers. Heterojunctions are classified based on their interfacial band alignments, charge transfer mechanisms, and component materials. Based on relative positions of their conduction and valence band edges, and consequent charge-transfer mechanisms, heterojunctions are divided into [
5]: Type-I (straddling gap) in which the bandgap of one semiconductor is entirely nested within the bandgap of the other. Both photogenerated electrons and holes migrate toward the narrower bandgap semiconductor, leading to charge accumulation and reduced redox potentials. Type-II (staggered gap) in which the valence band of one material is higher than another, same as with a conducting band. Internal electric field drives electrons to one material and holes to the other, significantly improving spatial charge separation. Type-III (broken gap) where the top of the valence band of one semiconductor is higher than the bottom of the conducting band of the other, allowing tunnelling effects in electronic devices and rapid charge transfer. To address charge-accumulation limitations of Type-II heterojunction, Z-scheme and S-scheme transfer mechanisms are introduced. Heterojunctions are also distinguished by the types of materials and their doping profiles into p-n, isotype and Schottky junctions, with p-n heterojunctions being particularly attractive because of their efficient charge separation. At the interface, the diffusion of electrons and holes generates a space-charge region and an internal electric field that promotes the migration of charge carriers in opposite directions, thereby reducing electron–hole recombination. Usually, a p-type semiconductor with a small energy bandgap is combined with a wide-gap n-type semiconductor [
2,
6].
One such potential heterojunction may be formed between cerium (IV) oxide (CeO
2), which is considered an n-type semiconductor with a band gap ranging from approximately 2.6 to 3.4 eV depending on the preparation method, and sodium birnessite (Na
0.55Mn
2O
4·1.5H
2O), regarded as a p-type semiconductor with a band gap in the range of approximately 1.8 to 2.3 eV, also depending on the synthesis route [
3,
7]. Cerium (IV) oxide, commonly known as ceria, generally crystallizes in a stable cubic fluorite structure (space group Fm3m), in which cerium ions form a face-centred cubic lattice while oxygen ions occupy a cubic sublattice. Such a structure enables the formation of oxygen vacancies associated with the reversible Ce
3+/Ce
4+ redox transition without significant changes in crystal structure. Ceria is characterized by high thermal stability, favourable mechanical properties, a high refractive index, optical transparency in the visible region, and a pronounced oxygen storage and release capacity [
8]. These properties make ceria a promising material for a wide range of applications, particularly in catalysis and photocatalysis. Furthermore, its relatively wide band gap can be tuned to enable photocatalytic activity under solar irradiation through changes in morphology, doping, and coupling with other semiconductors [
3,
9,
10,
11]. Sodium birnessite is a layered manganese oxide belonging to the δ-MnO
2 structural family, composed of edge-sharing [MnO
6] octahedra arranged into two-dimensional sheets. The negative charge of the MnO
2 layers, arising from Mn vacancies and/or mixed Mn oxidation states, is compensated by interlayer Na
+ ions; water molecules are also found in the interlayer. This open lamellar structure provides accessible interlayer space for ion exchange, adsorption, and charge-transfer processes, while the coexistence of Mn
3+/Mn
4+ redox centres and structural defects contributes to its catalytic and photocatalytic potential [
12]. Owing to its layered morphology, redox activity, and ability to host hydrated cations, Na-birnessite is considered a promising material for environmental and energy-related applications [
7].
The synergistic interaction between cerium and manganese oxides has attracted considerable attention due to its beneficial influence on the redox properties, oxygen mobility, and catalytic activity of manganese-based materials. In particular, the incorporation of cerium into layered manganese oxides such as birnessite has been investigated as an effective strategy for enhancing the concentration of oxygen vacancies, surface-active oxygen species, and defect-related catalytic sites. Zhu et al. [
13] investigated cerium-modified birnessite-type MnO
2 for low-temperature formaldehyde oxidation. The authors prepared Ce-doped birnessite materials with different Ce/Mn ratios and demonstrated that cerium incorporation significantly improved catalytic performance compared to undoped birnessite. They attributed this enhancement to increased specific surface area, inhibited MnO
2 crystal growth, and the formation of oxygen vacancies and surface-adsorbed oxygen species. Moreover, TEM analysis revealed the coexistence of CeO
2 nanoclusters and birnessite, suggesting the formation of interfacial grain boundaries between CeO
2 and MnO
2, which additionally promoted oxygen activation and catalytic activity. More recently, Abdallah et al. [
14] studied cerium-modified birnessite-like MnO
2 prepared by a simple redox route and examined the influence of calcination temperature on catalytic performance toward formaldehyde oxidation. Their results showed that calcination at 400 °C promoted stronger Ce-O-Mn interactions, improved dispersion of Ce species, and increased the concentration of Mn
3+ defect sites associated with triple-corner configurations. The authors also observed structural changes related to dehydration and interlayer contraction of the birnessite structure upon calcination, while maintaining the beneficial synergistic interaction between cerium and manganese species. These modifications resulted in enhanced catalytic activity and stability, even under humid conditions. Similarly, Guan et al. [
15] investigated MnO
2(
x)-CeO
2 mixed oxides with different Mn/Ce ratios and emphasized the importance of the synergistic effect between manganese and cerium oxides in formaldehyde oxidation. Their study demonstrated that partial mutual substitution between Mn and Ce species decreased crystallite size and increased the concentration of oxygen vacancies, Mn
3+ species, and surface-adsorbed oxygen. The authors proposed that lattice oxygen from CeO
2 could readily migrate toward oxygen vacancies, facilitating oxygen activation and improving catalytic efficiency at relatively low temperatures. Also, layered structures such as layered double hydroxides and graphitic carbon nitride gained increased attention in photocatalysis due to adjustable bandgap and reaction sites [
16].
Motivated by the synergistic effects observed in Ce-Mn oxide systems, our previous study [
17] focused on hydrothermally synthesized manganese-doped ceria and the unexpected formation of sodium birnessite during synthesis. Structural analyses revealed the coexistence of fluorite-type CeO
2 and layered Na-birnessite, while electron microscopy showed lamellar birnessite formations surrounded by ceria nanoparticles. In addition, the progressive decrease in the ceria lattice parameter with increasing Mn content confirmed partial incorporation of manganese into the ceria lattice, suggesting concurrent crystallization of Mn-doped ceria and birnessite phases.
Although Ce-modified birnessite and MnO2-CeO2 systems have previously been investigated, most studies have focused on low-temperature gas-phase oxidation of formaldehyde or volatile organic compounds rather than on photocatalytic water treatment. Furthermore, reports on hydrothermally synthesized CeO2/Na-birnessite materials remain scarce and systematic studies addressing the influence of the Ce:Mn ratio on their structural, surface, optical, and photocatalytic properties are lacking. Therefore, the aim of this work is to synthesize a series of CeO2/Na-birnessite materials with different Ce:Mn ratios by hydrothermal synthesis in an alkaline medium and to investigate the relationship between composition, physicochemical properties, and photocatalytic performance toward Rhodamine B degradation.
2. Materials and Methods
The study included the preparation of two pure oxides, CeO2 and MnOx, as well as three heterogeneous samples with different Ce:Mn molar ratios (75:25, 50:50, and 25:75). All samples were synthesized hydrothermally using 8 M NaOH solution (NaOH, p.a., Gram-mol, Zagreb, Croatia) as the reaction medium. Cerium(IV) sulfate tetrahydrate (Ce(SO4)2·4H2O, p.a., Merck, Darmstadt, Germany) and manganese(II) sulfate monohydrate (MnSO4·H2O, p.a., Merck, Darmstadt, Germany) were used as precursor salts. The syntheses were carried out in 100 mL Teflon-lined stainless-steel autoclaves, while the volume of the reaction mixture was maintained at approximately 80% of the total reactor capacity. The hydrothermal treatment was performed at 120 °C for 16 h. The total amount of precursor salts used for each synthesis was 0.8 mmol. After synthesis, the obtained precipitates were washed three times with distilled water assisted by ultrasonication and separated by centrifugation. The samples were subsequently dried at 60 °C for 24 h. The synthesized Mn-containing samples exhibited a brown coloration due to the presence of manganese species, while pure CeO2 showed its characteristic pale-yellow colour, indicating successful synthesis.
Phase composition of the synthesized samples was analyzed by X-ray powder diffraction (XRD) using a Rigaku MiniFlex 600 diffractometer (Rigaku, Tokyo, Japan) with CuKα radiation. Diffraction data were collected in the 2θ range from 10° to 105° using a step size of 0.01° and a scanning rate of 10° min−1. Whole-powder-pattern fitting (WPPF) analysis of XRD patterns of heterogeneous samples was performed using SmartLab Studio II x64 software (version 4.3.287.0, Rigaku, Tokyo, Japan) supplied with the diffractometer. The analysis was used to estimate the relative phase fractions and lattice parameters of the crystalline phases identified in the mixed Ce-Mn samples.
Fourier-transform infrared (FTIR) spectra were recorded on a Bruker Vertex 70 spectrometer (Bruker Optics, Karlsruhe, Germany) operating in attenuated total reflectance (ATR) mode. The samples were pressed onto a diamond crystal, and the spectra were collected in the range of 400–5000 cm−1 with a spectral resolution of 2 cm−1 as an average of 32 scans.
Morphological characterization was performed using a Tescan Vega 3 scanning electron microscope (SEM) (Tescan, Brno, Czech Republic) operated at an accelerating voltage of 10 kV. Powder samples were mounted on specimen holders using double-sided conductive carbon tape and coated with a thin Au/Pd conductive layer using a Quorum SC 7620 sputter coater (Quorum Technologies, Laughton, UK). Elemental composition was examined by energy-dispersive X-ray spectroscopy (EDS) using a Bruker Quantax Compact detector (Bruker, Billerica, MA, USA) coupled with the SEM instrument. Additional morphological and microstructural characterization was carried out by Cs-corrected transmission electron microscopy (TEM) using a JEOL JEM-ARM200CF microscope (JEOL Ltd., Tokyo, Japan) operated at an accelerating voltage of 80 kV.
Textural properties were evaluated by N
2 adsorption–desorption measurements at 77 K using a Micromeritics ASAP-2000 instrument (Micromeritics, Norcross, GA, USA). Prior to analysis, the samples were degassed at 100 °C under dynamic vacuum (7 mPa). Specific surface area (SSA) values were calculated using the Brunauer–Emmett–Teller (BET) method, while pore size distribution was determined according to the Barrett–Joyner–Halenda (BJH) model [
18,
19].
UV–Vis diffuse reflectance spectroscopy (DRS) measurements were carried out using an Ocean Insight QE Pro High-Performance spectrometer (Ocean Optics, Orlando, FL, USA) equipped with an integrating sphere, while BaSO
4 was used as the reflectance standard. The obtained reflectance spectra were transformed using the Kubelka–Munk function according to the equation F(R
∞) = (1 − R
∞)
2/2R
∞, where F(R
∞) is proportional to the absorption coefficient (α), and R
∞ represents the reflectance of an infinitely thick sample calculated as R
sample/R
standard. The band gap energy (Eg) was determined using Tauc plots constructed from the dependence of [F(R)
hν]
n on photon energy (
hν), where n = 2 corresponds to direct and n = 1/2 to indirect electronic transitions. Here,
h is Planck’s constant and
ν is the frequency of the incident radiation. The band gap values were estimated by extrapolating the linear portion of the obtained curves to the photon energy axis [
20].
The point of zero charge (pH
pzc) was determined by the pH drift method according to Khan and Sarwar [
21], with minor modifications. Briefly, 15 mg of sample was dispersed in 15 mL of 0.1 M NaCl solution. The initial pH was adjusted in the range 2–10 using HCl and NaOH solutions. The suspensions were then stirred for 24 h at room temperature to reach equilibrium. After equilibration, the final pH values were measured and the pH
pzc value was determined from the intersection of the pH
initial and pH
final curves.
The photocatalytic activity of the synthesized samples was evaluated through the degradation of Rhodamine B dye under UV irradiation. The experiments were performed at room temperature using a Pen Ray UV lamp with a wavelength of 254 nm and an irradiation intensity of 2 mW cm−2 as the UV light source. For each experiment, 50 mg of photocatalyst was dispersed in 100 mL of Rhodamine B (p.a., Kemika, Zagreb, Croatia) aqueous solution with an initial concentration of 10 mg L−1 in a 150 mL glass beaker. The suspension was continuously stirred using a magnetic stirrer at 300 rpm. The UV lamp was placed inside a quartz tube immersed in the reaction mixture, while the entire reactor was covered with aluminum foil in order to minimize the influence of external light and enhance radiation reflection within the system. Prior to irradiation, the suspension was stirred in the dark for 30 min to establish adsorption–desorption equilibrium between the dye molecules and the photocatalyst surface. Aliquots were collected every 10 min during the dark period and analyzed using a Varian Cary 1E UV–Vis (Varian, Palo Alto, CA, USA) spectrophotometer. After reaching equilibrium, the UV lamp was switched on and the photocatalytic degradation experiment was continued under continuous stirring. The degradation process was monitored by collecting aliquots at 10 min intervals and recording the decrease in the characteristic absorption band of Rhodamine B at 554 nm. The solution temperature was monitored during the photocatalytic experiments and an increase in only a few degrees above room temperature was noted at the end of the photocatalytic experiment. Therefore, the maximum temperature remained well below 50 °C, excluding significant thermal decomposition of Rhodamine B. Furthermore, heat transfer was reduced because the UV lamp was placed inside a quartz tube and not in direct contact with the solution. The same experimental procedure was also applied to Rhodamine B solutions with the initial pH adjusted to 7.5 using 0.1 M NaOH in order to investigate the influence of solution pH on the photocatalytic activity of the prepared samples.
3. Results and Discussion
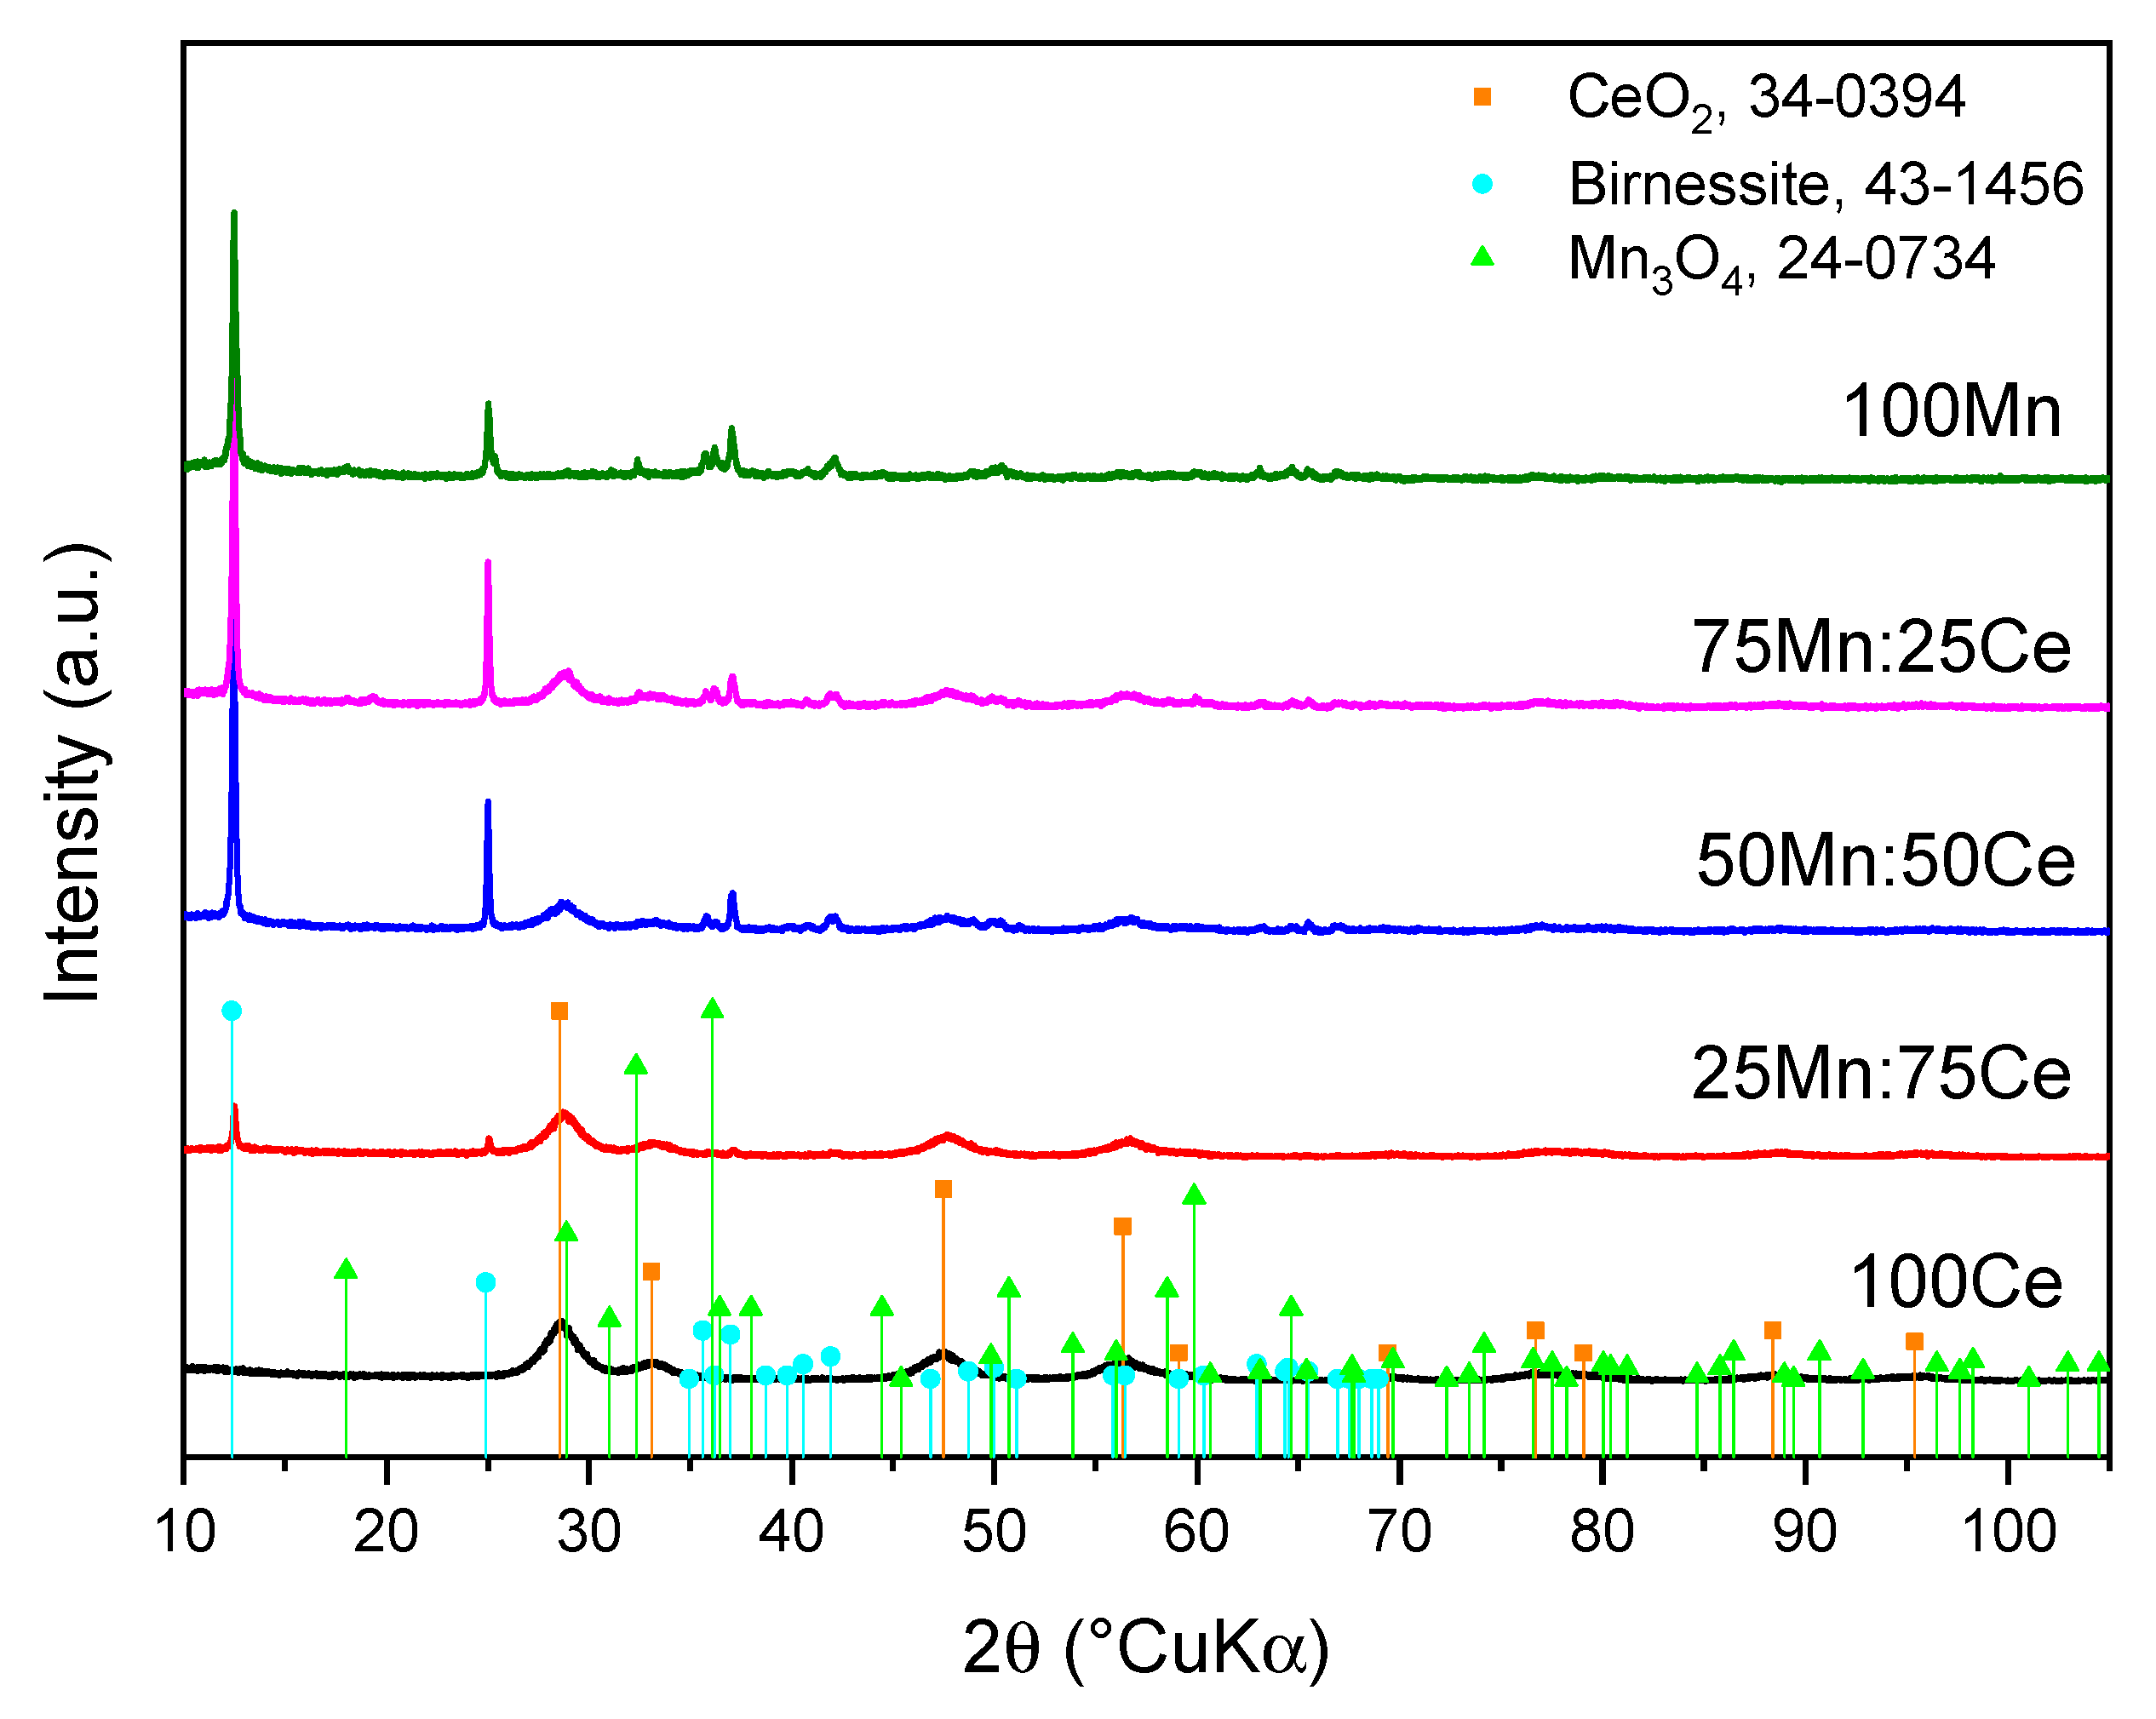
XRD patterns of the synthesized samples are presented in
Figure 1. The diffraction pattern of the 100Ce sample shows characteristic diffraction maxima corresponding to fluorite-type CeO
2 with a cubic crystal structure (space group Fm3m), in agreement with the ICDD PDF card No. 34-0394. In contrast, the 100Mn sample exhibits diffraction maxima characteristic of manganese oxides, with the dominant phase identified as sodium birnessite, Na
0.55Mn
2O
4·1.5H
2O (ICDD PDF No. 43-1456), accompanied by a less pronounced hausmannite phase, Mn
3O
4 (ICDD PDF No. 24-0734). For the mixed Ce-Mn samples (75Mn:25Ce, 50Mn:50Ce, and 25Mn:75Ce), reflections corresponding to both ceria and manganese oxide phases can be simultaneously observed, indicating the coexistence of individual crystalline phases within the synthesized materials. With increasing Mn content, the diffraction maxima characteristic of the birnessite phase become more pronounced and sharper, indicating an increasing fraction and improved crystallinity of the layered manganese oxide phase. At the same time, the diffraction maxima of CeO
2 gradually decrease in intensity and become broader, which may be associated with the lower relative amount of ceria, reduced crystallite size, and partial incorporation of manganese into the ceria lattice [
13,
14,
17]. Such behaviour is consistent with the expected variation in phase composition as a function of the Ce:Mn ratio.
A slight shift in the CeO
2 diffraction maxima toward higher 2θ values can also be observed with increasing manganese content, suggesting limited incorporation of manganese ions into the fluorite ceria lattice. Considering the smaller ionic radii of Mn
2+, Mn
3+ and Mn
4+ compared to Ce
4+ [
22], partial substitution within the fluorite lattice may lead to lattice contraction and consequently to the observed peak shift. The formation of oxygen vacancies could lead to contraction, but the formation of oxygen vacancies is always associated with the reduction of Ce
4+ to Ce
3+; since Ce
3+ has an atomic radius of 114 pm and Ce
4+ 97 pm, and a net lattice expansion would occur. Nevertheless, the clearly visible diffraction maxima of both CeO
2 and sodium birnessite indicate that the majority of manganese remains present within a separate manganese oxide phase rather than being fully incorporated into the ceria structure. The obtained results could be an indication of the formation of a heterostructured CeO
2/Na-birnessite system composed of distinct yet interconnected crystalline phases, without the formation of a new mixed crystalline structure.
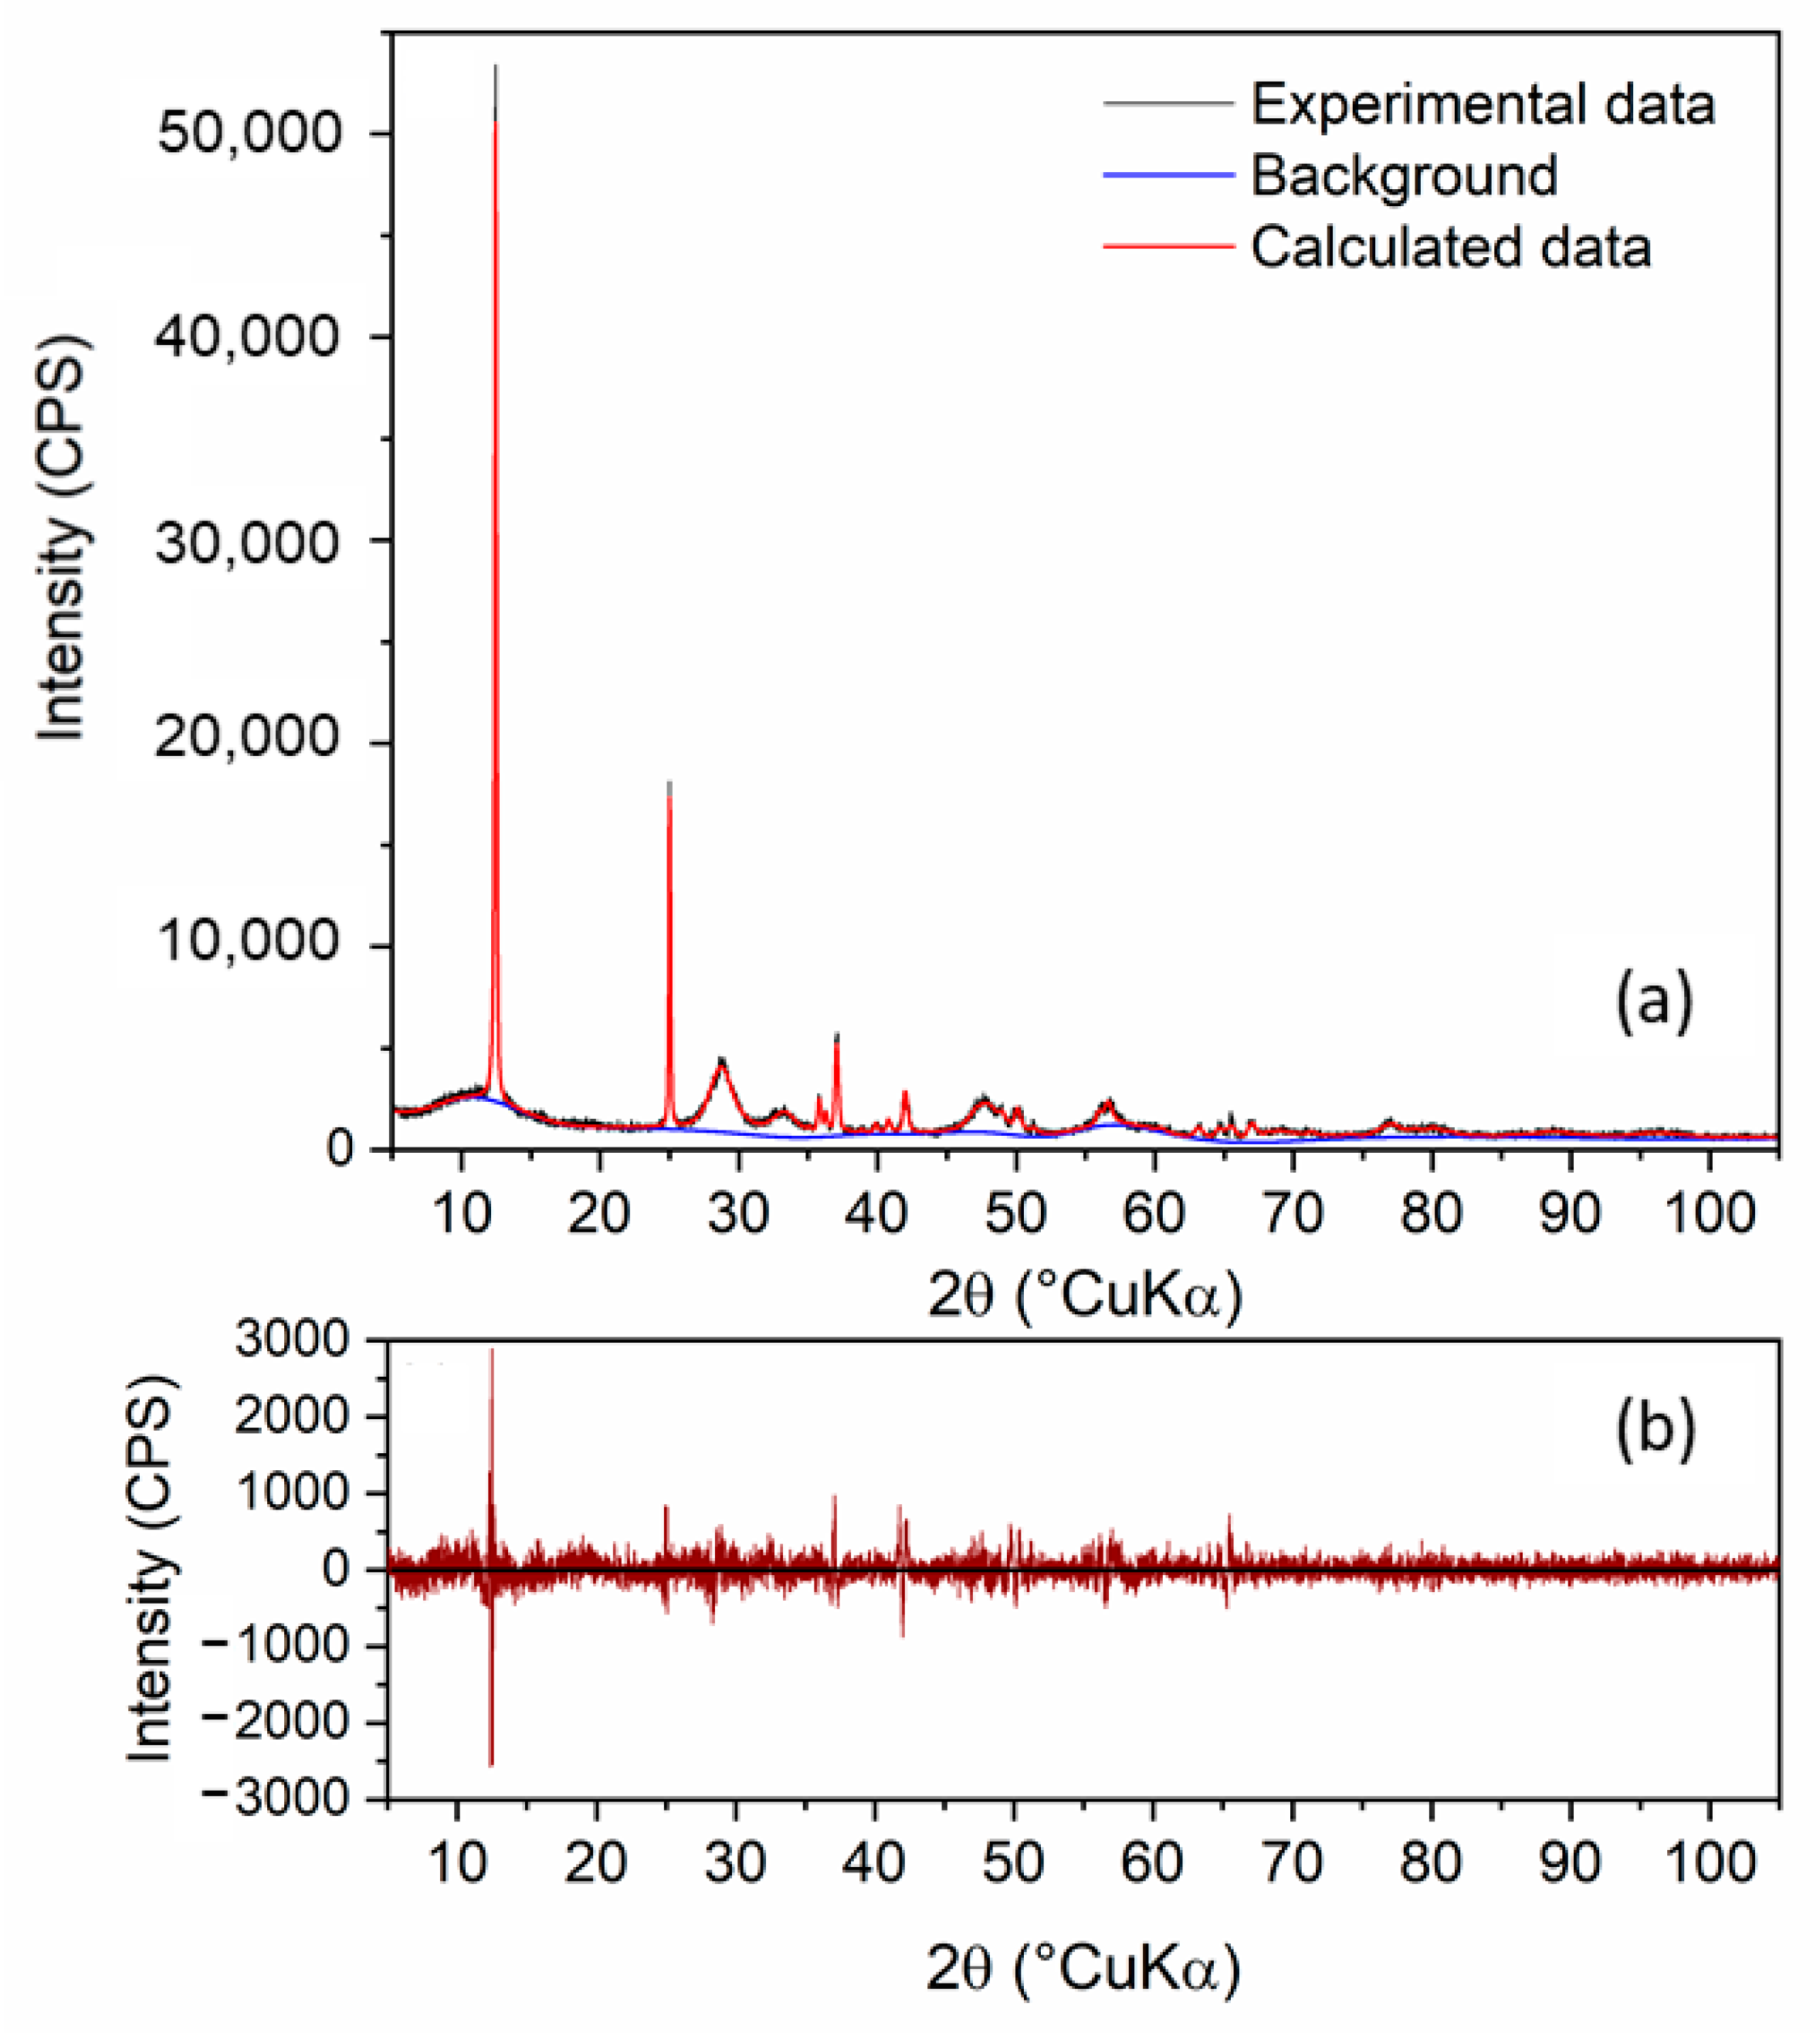
To obtain a more detailed insight into the phase composition and structural parameters of the prepared samples, whole-powder-pattern fitting (WPPF) analysis was performed. A representative refinement for the 50Mn:50Ce sample is shown in
Figure 2, while the refined phase fractions, lattice parameters, and unit-cell volumes are summarized in
Table 1. The obtained phase fractions are generally consistent with the nominal sample compositions and confirm the coexistence of CeO
2 and Na-birnessite as the predominant crystalline phases. As expected, the relative amount of the CeO
2 phase decreased, while the Na-birnessite fraction increased with increasing manganese content. In the Mn-rich samples, a minor amount of hausmannite was also identified. The refined lattice parameter and lattice volume of pure CeO
2 were slightly higher than the reference values reported for pure ceria (a = 5.4113 Å, V = 158.46 Å
3, ICDD PDF No. 34-0394). This may be attributed to the aforementioned formation of oxygen vacancies due to the reduction of Ce
4+ to Ce
3+, which has a larger ionic radius. In the mixed samples, compared with the pure CeO
2 sample, the lattice parameter and unit-cell volume of the ceria phase gradually decrease with increasing manganese content. This may indicate limited incorporation of manganese ions into the fluorite lattice of ceria. The refined lattice parameters of Na-birnessite showed only minor variations compared with those of the pure phase and remained close to the reference values reported for ICDD PDF No. 43-1456, indicating that the layered manganese oxide structure was largely preserved. Similarly, the lattice parameters of hausmannite were nearly identical to the reference values reported for ICDD PDF No. 24-0734.
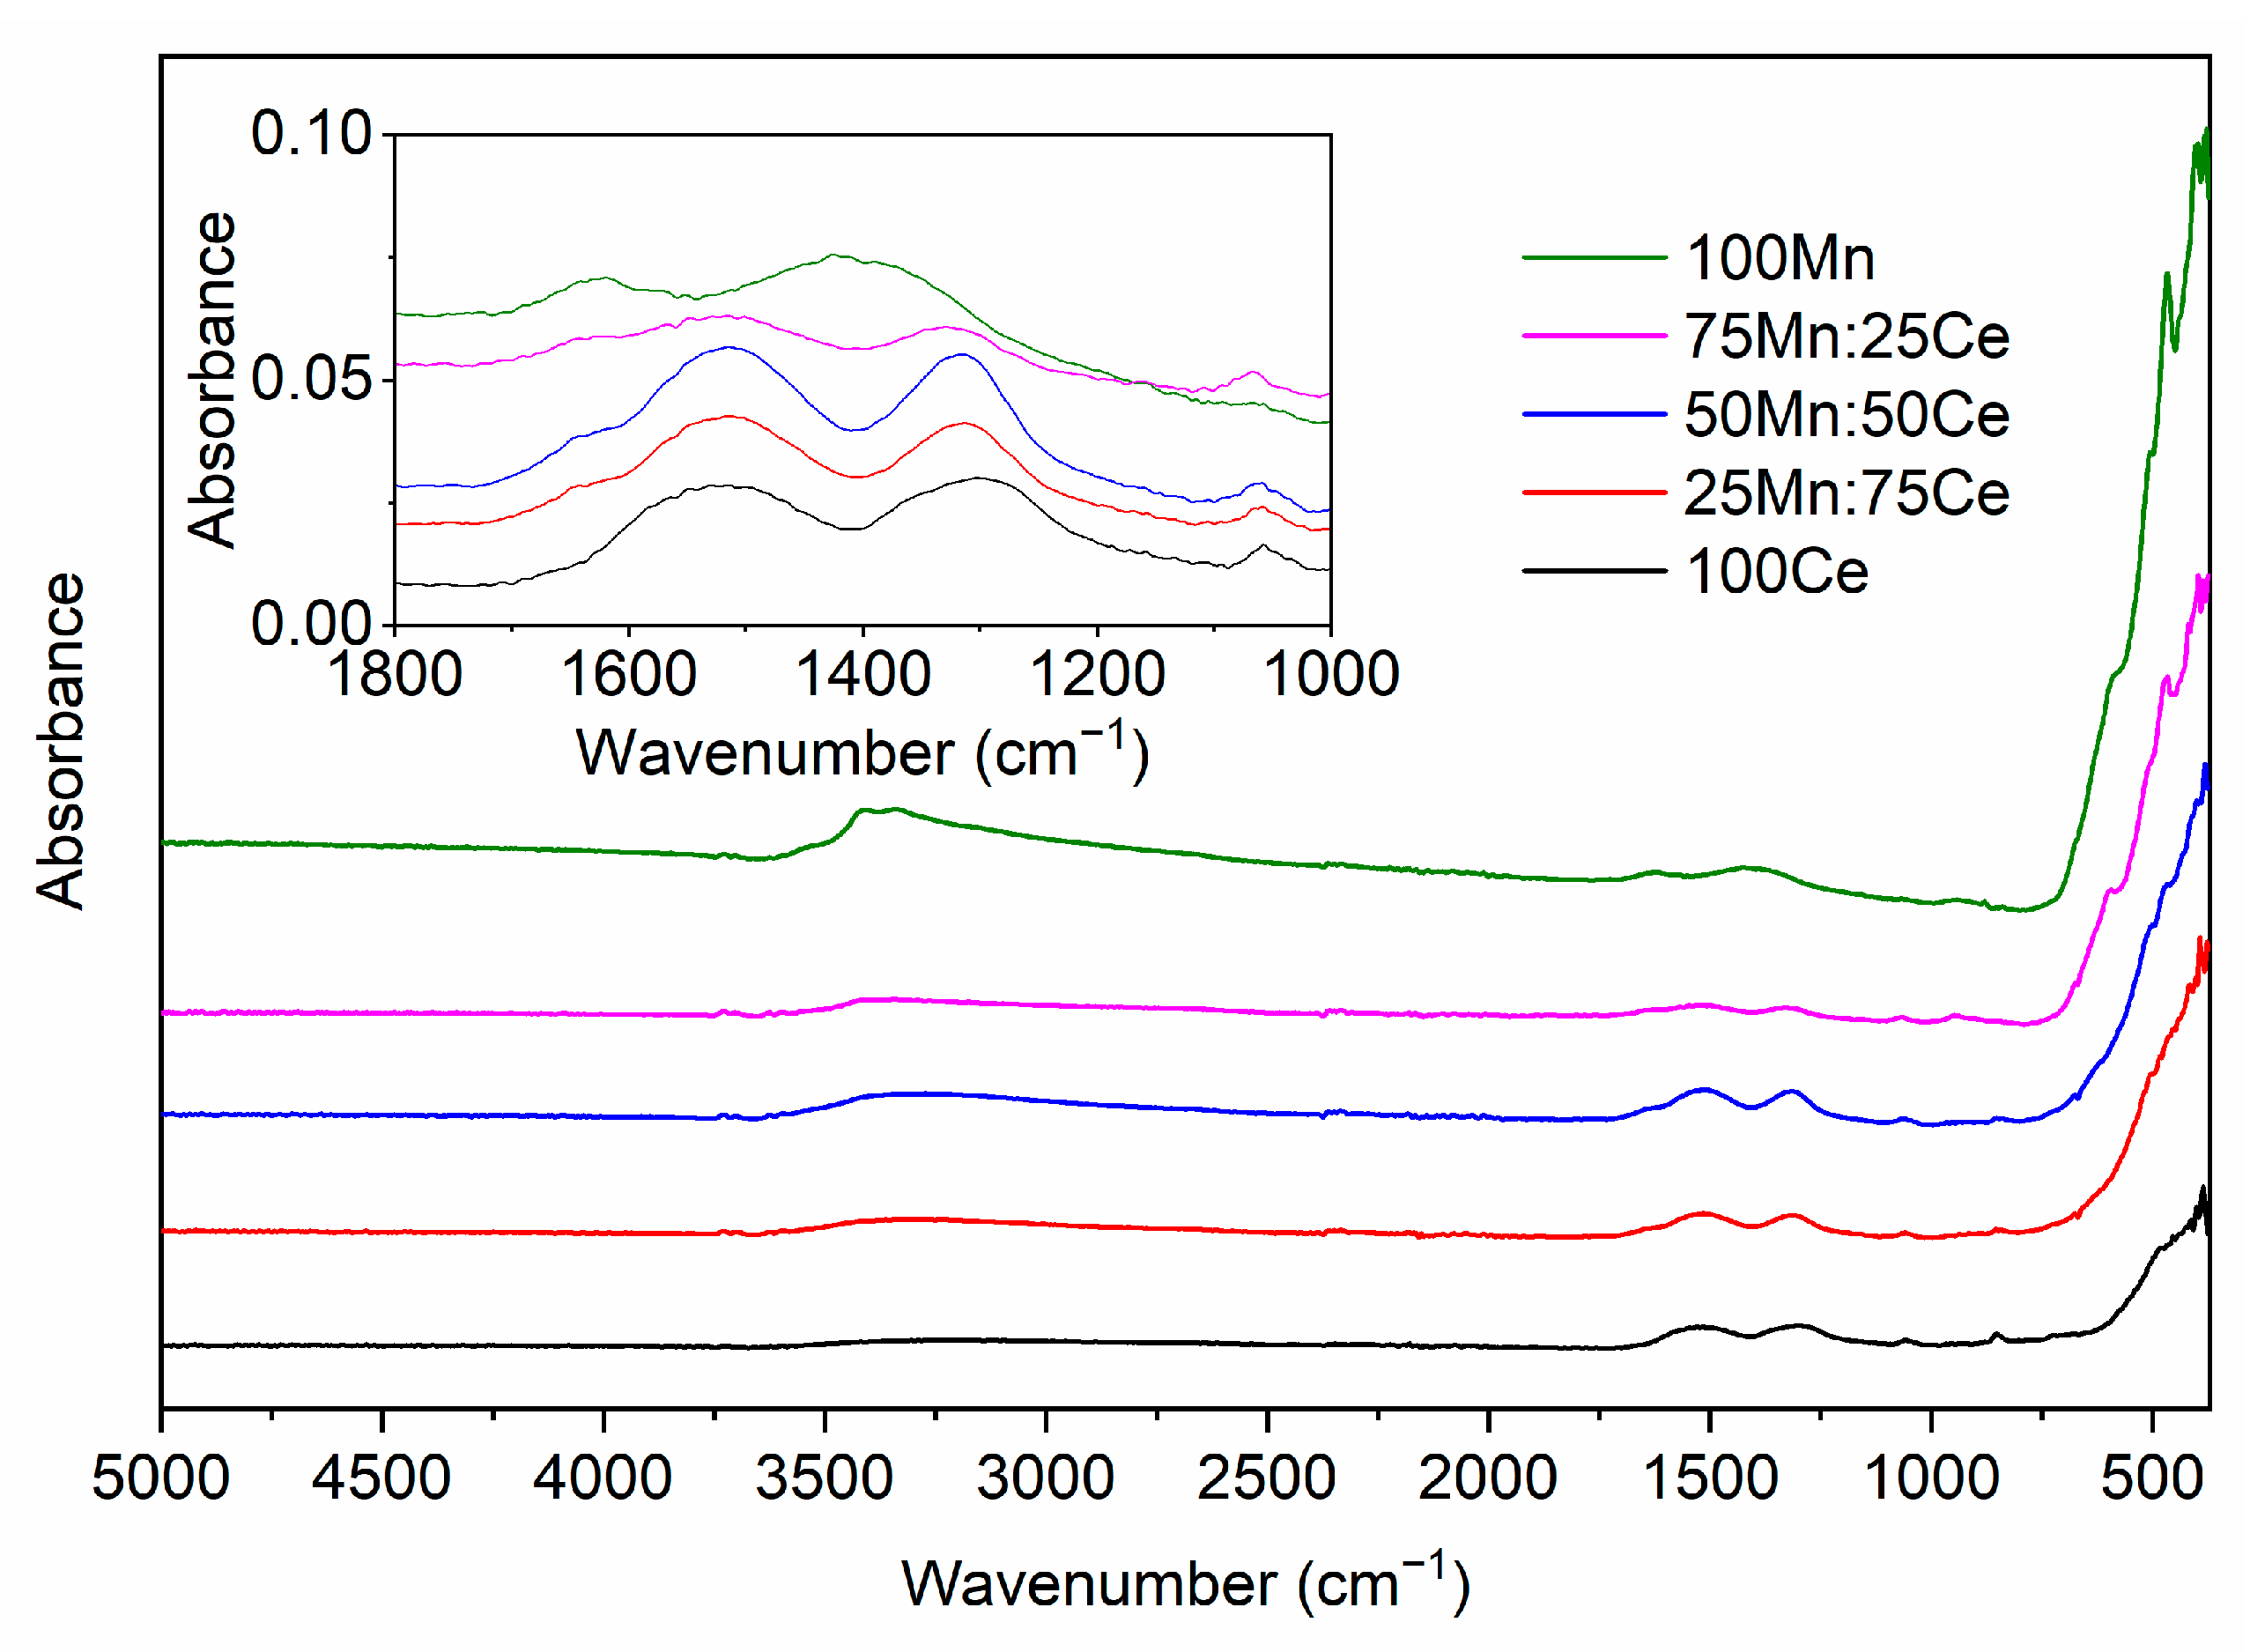
FTIR spectra of the synthesized samples are presented in
Figure 3. All samples exhibit a broad absorption band in the region between approximately 3200 and 3600 cm
−1, which can be attributed to the stretching vibrations of hydroxyl groups and the presence of physically adsorbed and structural water. The intensity of this band increases with increasing manganese content, which is consistent with the layered structure of sodium birnessite containing interlayer water molecules (
Figure 3, inset). Similar broad OH absorption bands have previously been reported for hydrated layered manganese oxides and other hydrated oxide systems. A weak absorption band observed at 1630 cm
−1 is associated with the interlayer water bending vibrations [
23]. The presence of these bands additionally confirms the existence of bound and interlayer water characteristic of birnessite structures [
24,
25]. Accordingly, the intensity of this band is strongest for the sample with the most birnessite. Two, also weak, absorption bands at ~1500 and 1300 cm
−1 can be attributed to asymmetric and symmetric carbon–oxygen stretching in monodentate surface carbonate. The splitting gap of approximately 200 cm
−1 is typical for monodentate arrangement [
26]. A weak band at 1065 cm
−1 is also attributed to monodentate carbonate [
27].
In the low-wavenumber region below 1000 cm
−1, absorption bands associated with Mn-O and Ce-O vibrations can be observed. Bands at ~470 and 510 cm
−1 are characteristic of internal vibrations of MnO
6 octahedra characteristic of layered manganese oxides and birnessite-type structures [
17,
24]. Ceria shows a broad absorption band around 450–700 cm
−1 characteristic for Ce-O stretching in fluorite-type CeO
2 [
28]. In the synthesized samples, these bands largely overlap, which makes them difficult to distinguish, especially for samples with a low Mn content having just a single broad and intense absorption band in the low-wavenumber region. Overall, the gradual changes in spectral features with varying Ce:Mn ratio indicate the coexistence of ceria and manganese oxide phases within the synthesized materials.
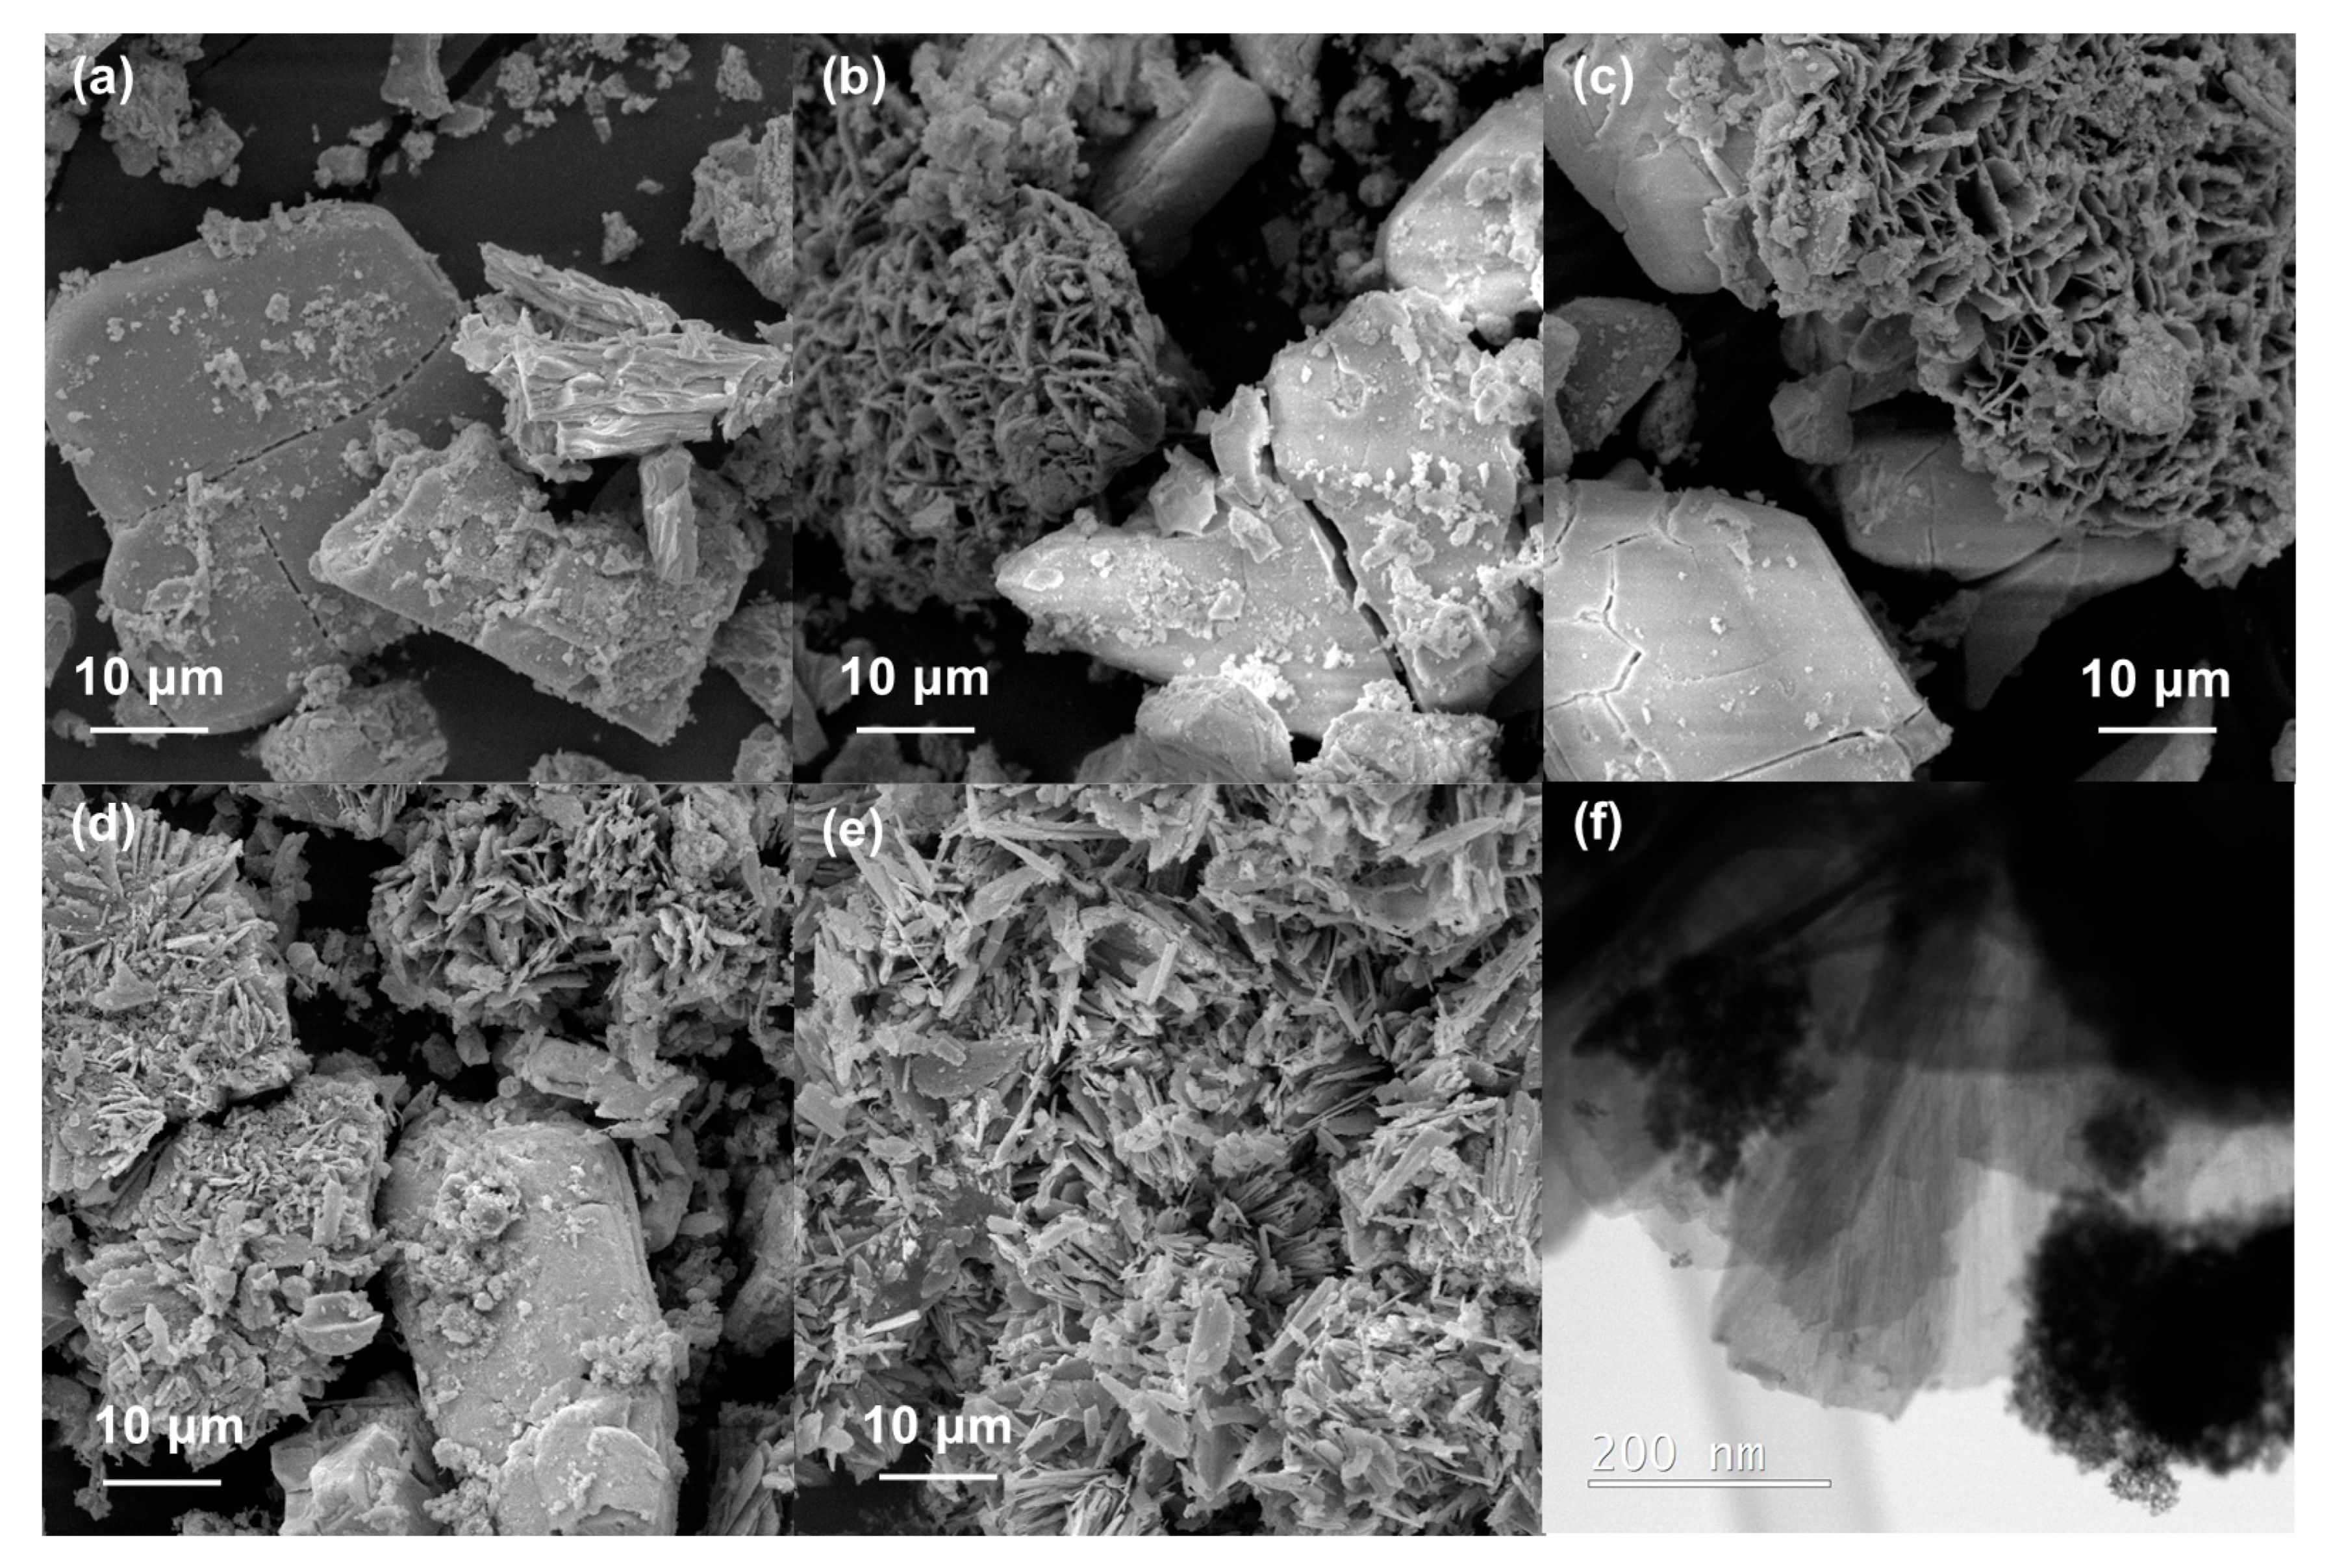
SEM micrographs of the prepared samples are shown in
Figure 4. Pure CeO
2 consists predominantly of relatively large, compact and irregularly shaped agglomerates with comparatively smooth surfaces. In contrast, pure Na-birnessite exhibits a characteristic layered morphology composed of lamellar or plate-like particles assembled into carnation flower-like agglomerates, which is consistent with morphologies commonly reported for birnessite-type manganese oxides [
17,
29]. TEM micrograph of sample 25Mn:75Ce shows a layered birnessite particle in contact with ceria nanoparticles. The birnessite particle in the centre of the micrograph can be distinguished by its characteristic sheet-like morphology. The particle is composed of multiple sheets stacked on top of each other. At the edges, there are fewer sheets and electrons can easily transmit through them, while in the middle the particle is somewhat thicker. The ceria particles form dense agglomerates, which appear darker due to their greater thickness as well as the higher atomic number contrast, Z(Ce) = 58 and Z(Mn) = 25. Ceria clusters are attached to the outer edges of the birnessite sheets, indicating close interfacial contact and suggesting the possible presence of interfacial interactions between the two phases.
In the mixed Mn-Ce samples (25Mn:75Ce, 50Mn:50Ce and 75Mn:25Ce), both morphologies are simultaneously observed. Larger and more compact particles are attributed to the CeO
2-rich phase, while the finer wrinkled and lamellar flower-like structures correspond to the birnessite phase. With increasing manganese content, the fraction of lamellar birnessite-like structures gradually increases, whereas the relative abundance of compact CeO
2 agglomerates decreases. Particularly interesting morphology is observed for the 50Mn:50Ce sample, where the lamellar birnessite structures appear in close contact with the surfaces of CeO
2 agglomerates, partially covering them. Such interfacial contact between the two phases may indicate the formation of a heterogeneous Mn-Ce oxide system with a high degree of phase interaction. Such close contact between the two phases may facilitate MnO
2/CeO
2 interactions, which have previously been associated with synergistic effects in mixed Mn-Ce oxide systems [
15].
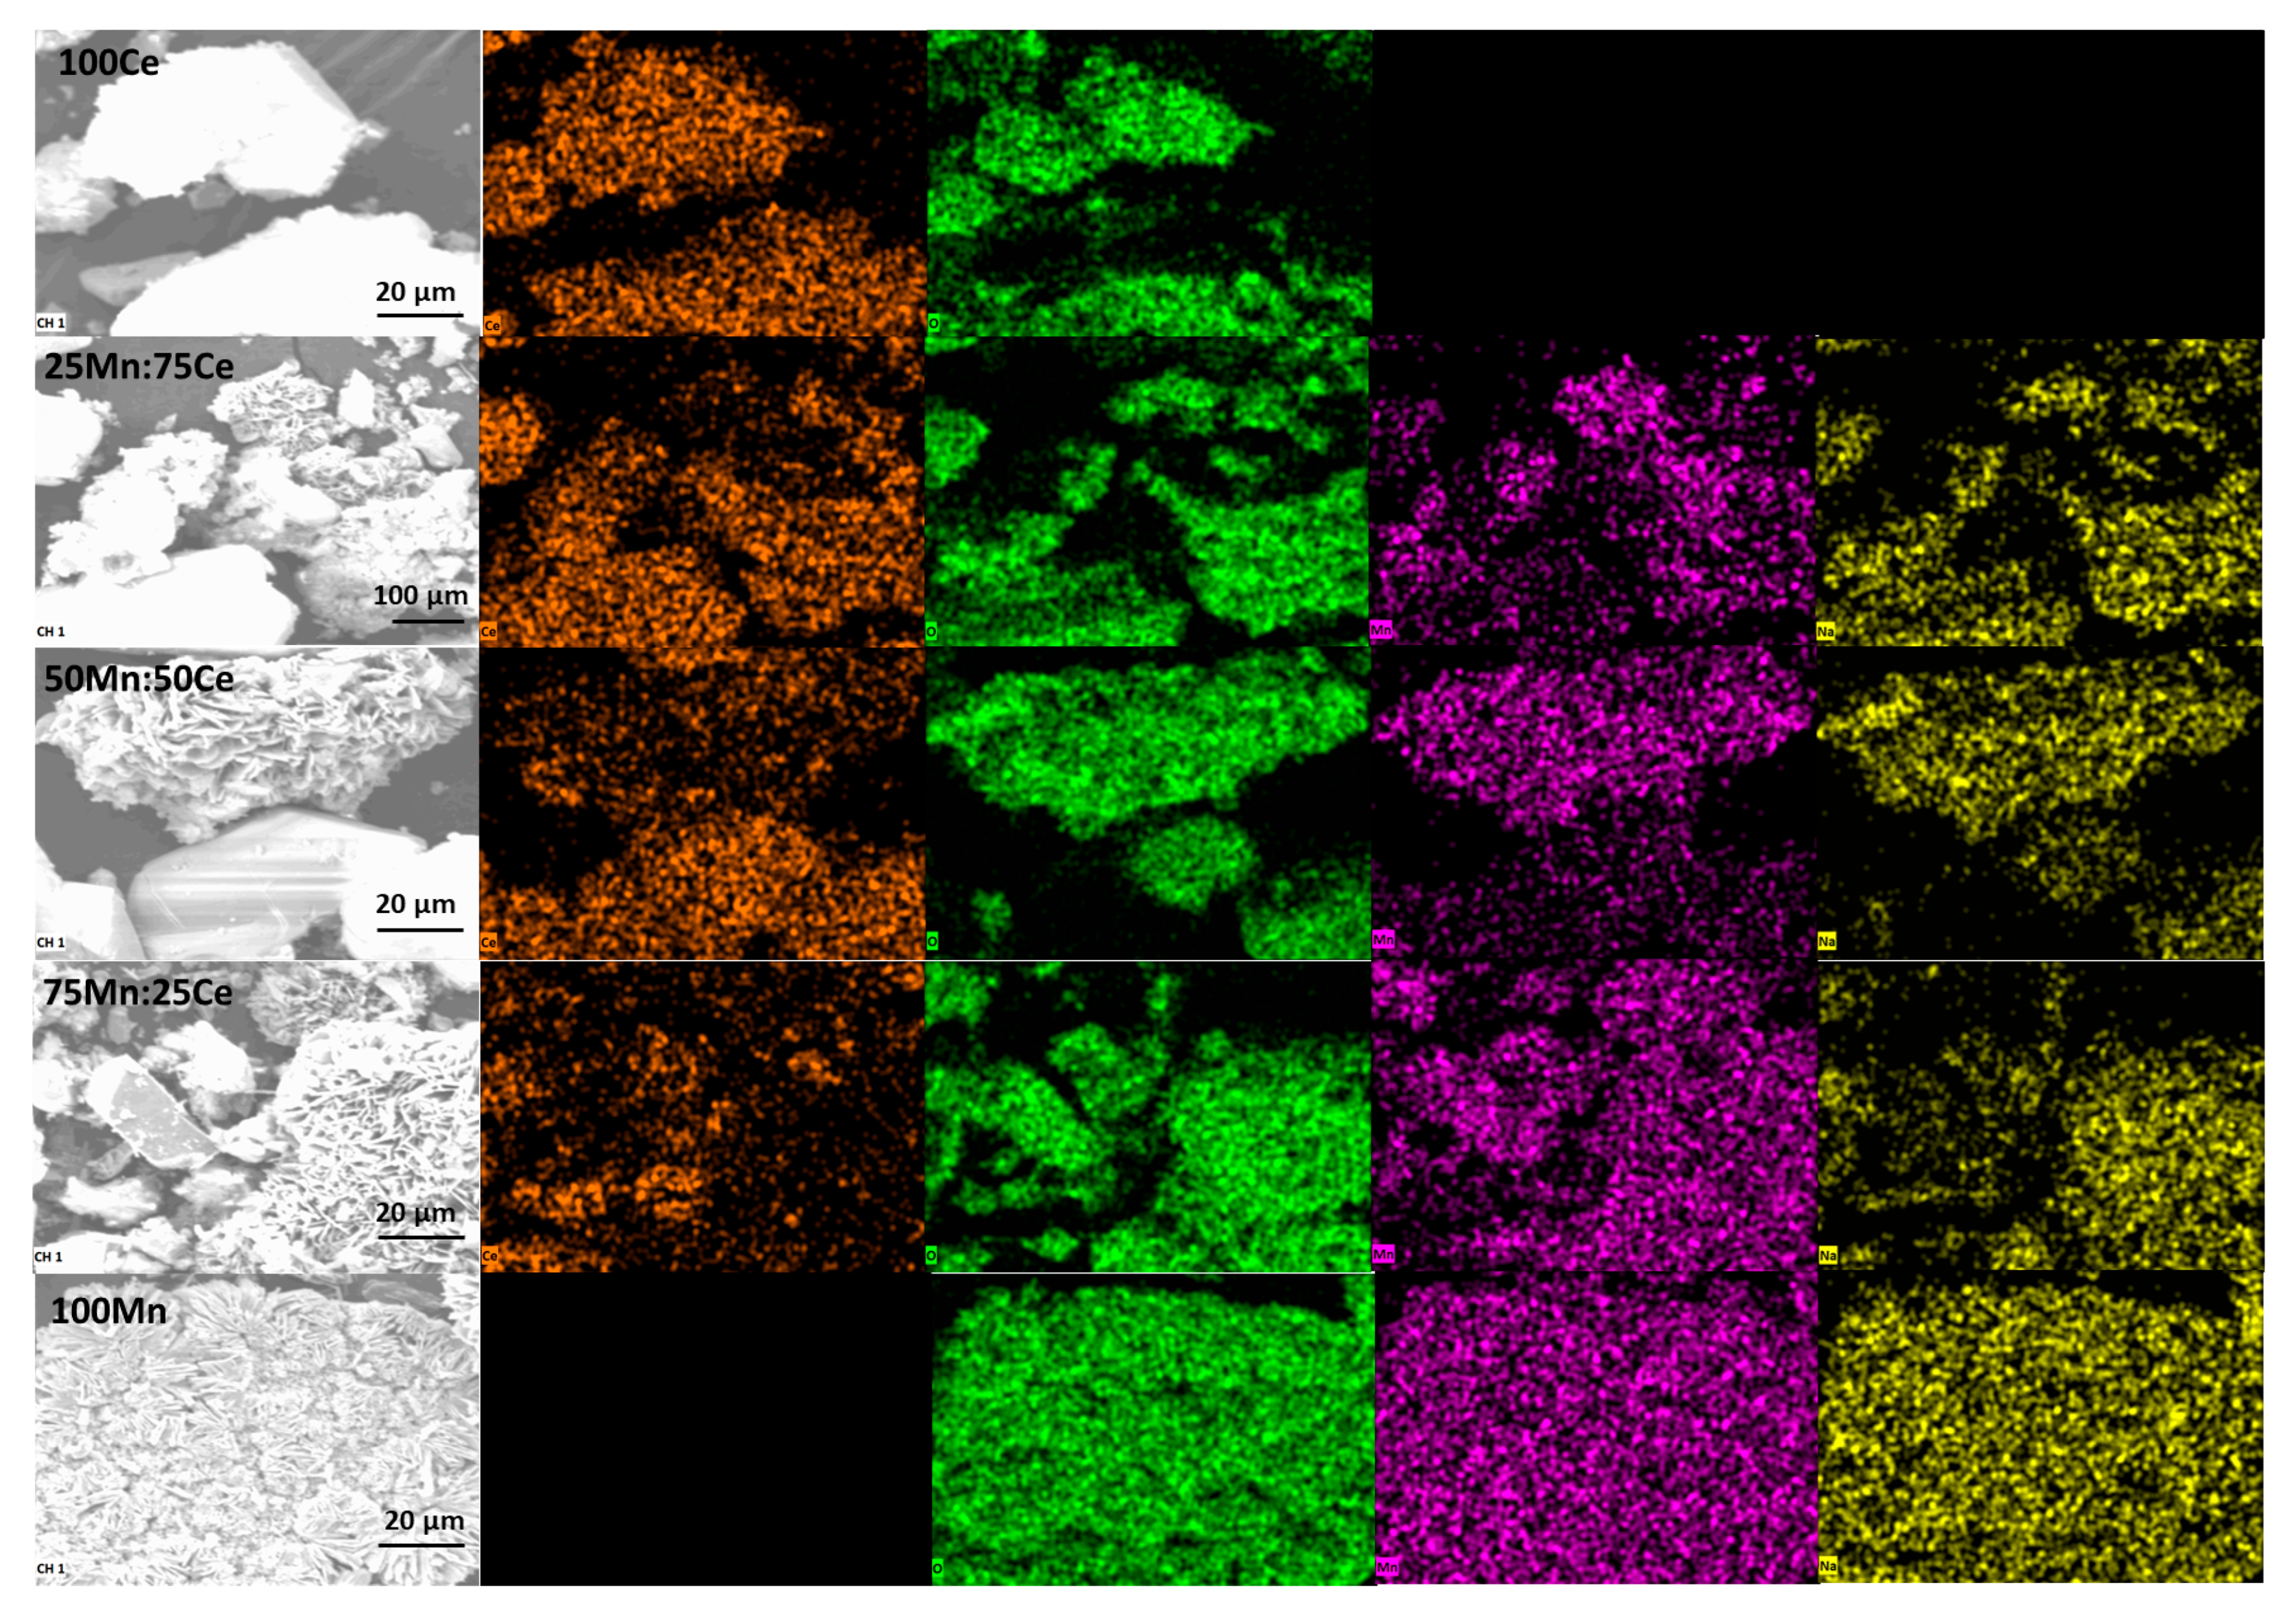
EDS elemental mapping, shown in
Figure 5, additionally confirmed the coexistence and spatial distribution of Ce, Mn, Na, and O within the synthesized materials. Cerium was predominantly associated with the larger compact agglomerates attributed to the CeO
2-rich phase, whereas manganese and sodium were mainly concentrated within the lamellar flower-like structures characteristic of sodium birnessite. Oxygen was uniformly distributed throughout all investigated regions, consistent with the oxide nature of both phases.
Although Ce- and Mn-rich regions can still be distinguished, the elemental maps indicate that the two phases are not completely separated, but remain in close spatial contact. Such distribution may suggest the existence of interfacial regions between ceria and birnessite particles, which could be beneficial for interphase interactions within the system [
15]. The presence of sodium within the lamellar structures additionally supports the formation of Na-birnessite, in agreement with the XRD and FTIR analyses.
EDS analysis additionally confirmed the presence of Ce, Mn, O, and Na in the synthesized samples (
Table 2). EDS analysis is a semi-quantitative technique and therefore the measured Ce:Mn ratios should be interpreted only as indicating the expected trend rather than the exact nominal composition. In addition, the measured oxygen content is underestimated due to the limited accuracy of EDS for light elements. Thus, with increasing manganese content, the relative Mn atomic percentage increases, while the Ce atomic percentage gradually decreases, although their ratio differs from the nominal composition. Sodium was detected exclusively in Mn-containing samples, and its content increased with increasing birnessite fraction, further supporting the formation of Na-birnessite. The oxygen content remained relatively similar for all investigated samples, consistent with the oxide nature of the prepared materials.
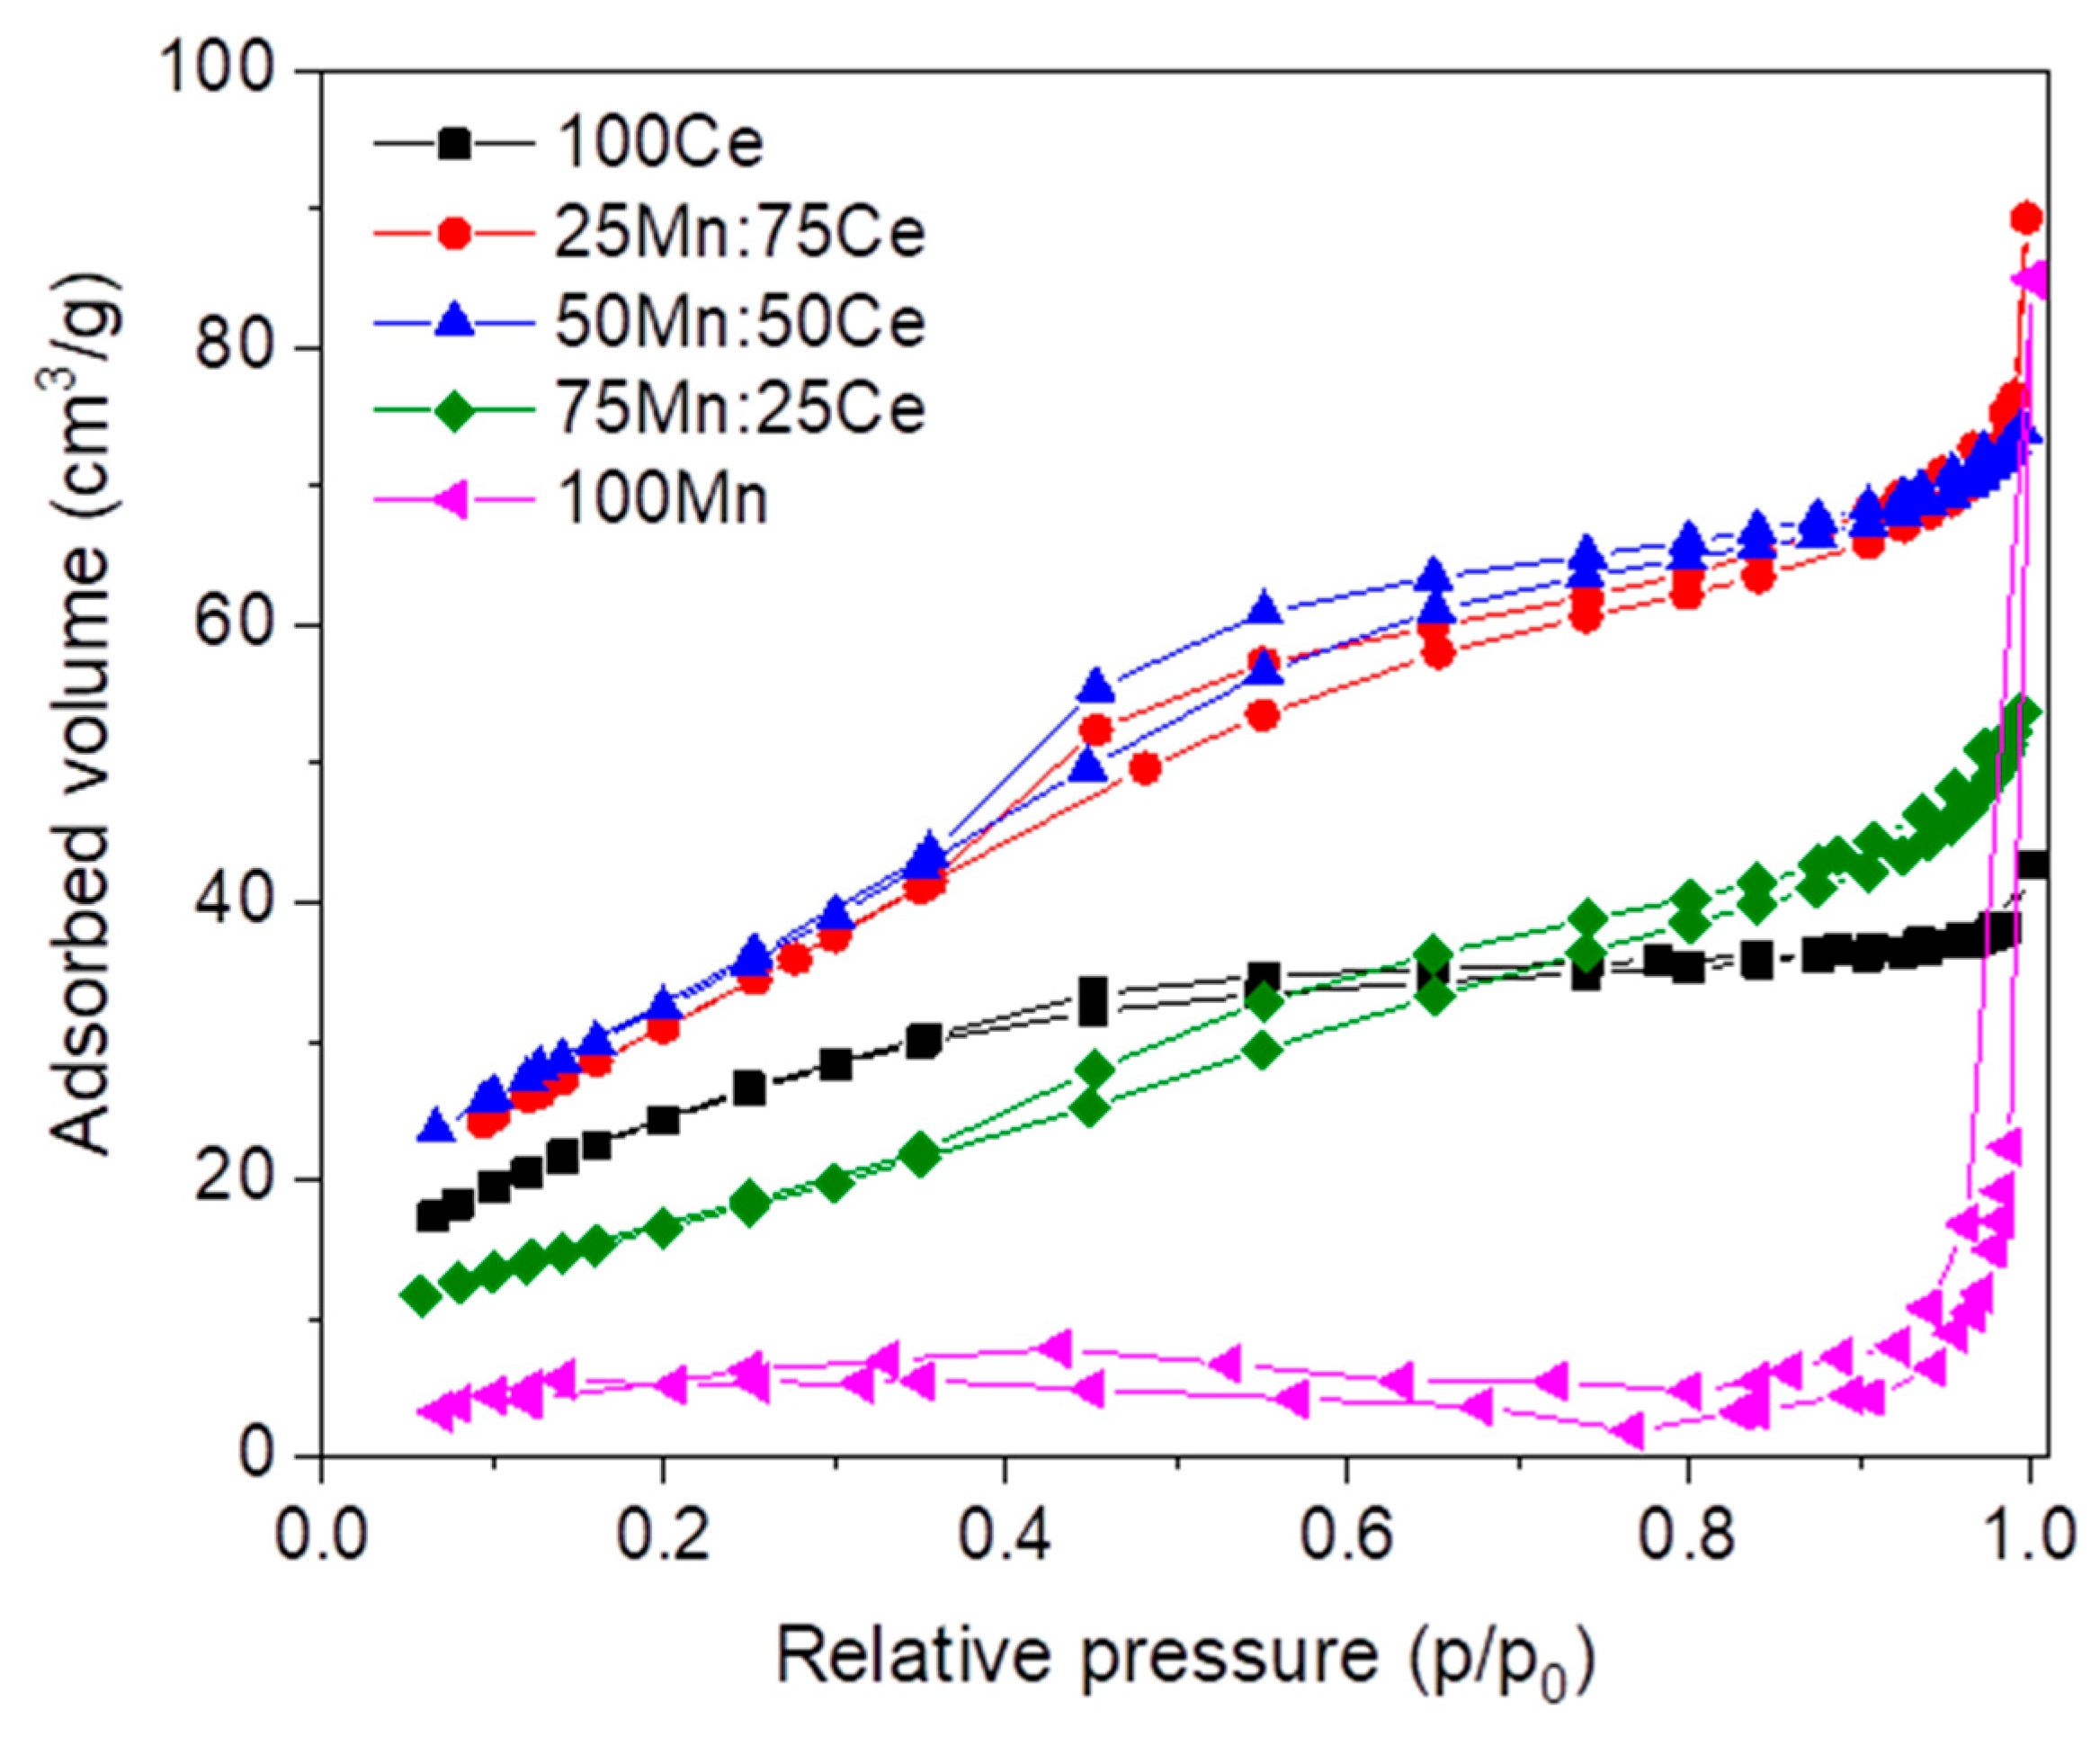
Nitrogen adsorption–desorption isotherms of the prepared samples are displayed in
Figure 6, while the specific surface areas and average pore diameters are listed in
Table 3. According to the IUPAC classification, all investigated samples exhibit type IV adsorption–desorption isotherms, characteristic of mesoporous materials [
30]. However, noticeable differences in the shape of the hysteresis loops and adsorbed nitrogen volume indicate significant variations in pore structure and textural properties depending on the Ce:Mn ratio. The hysteresis loops can generally be classified as H3-type, which are typically associated with aggregates of plate-like particles and slit-shaped pores. Such behaviour is especially pronounced in Mn-containing samples and is consistent with the lamellar birnessite-like morphology observed in the SEM micrographs and reported previously for layered manganese oxides [
24].
The 100Ce sample shows a typical mesoporous type IV isotherm with moderate hysteresis, comparable to previously reported nanocrystalline ceria systems prepared hydrothermally [
17,
31]. The relatively high specific surface area (91.54 m
2 g
−1) and narrow pore size distribution with an average pore size value of 2.6 nm indicate the presence of small mesopores formed between agglomerated ceria nanoparticles. The mixed 25Mn:75Ce and 50Mn:50Ce samples exhibit the most developed porous texture, reflected in the highest specific surface areas (119.41 and 121.65 m
2 g
−1, respectively) and well-defined hysteresis loops. Their isotherms are characteristic of mesoporous solids with significant interparticle porosity. The coexistence of ceria nanoparticles and layered birnessite structures likely promotes the formation of slit-shaped mesopores and interconnected pore networks. Similar textural behaviour has been reported for Mn-containing ceria systems and birnessite-based materials [
17,
24]. With further increase in manganese content, the total adsorbed nitrogen volume decreases considerably. The 75Mn:25Ce sample still retains a type IV isotherm, although with less developed mesoporosity and lower specific surface area (61.59 m
2 g
−1). In contrast, the 100Mn sample exhibits substantially different adsorption behaviour compared to the other samples. Although a hysteresis loop is still present, the isotherm shows significantly lower adsorption capacity and a steep increase in nitrogen uptake at high relative pressures, indicating the predominance of larger interparticle voids rather than well-developed uniform mesopores. Such behaviour is consistent with aggregated layered manganese oxide structures, particularly birnessite-type materials composed of lamellar particles forming slit-shaped pores [
24,
30]. As predicted on the basis of FTIR spectra, samples with a Ce content of 50% and above indeed have a higher specific surface area than Mn rich samples.
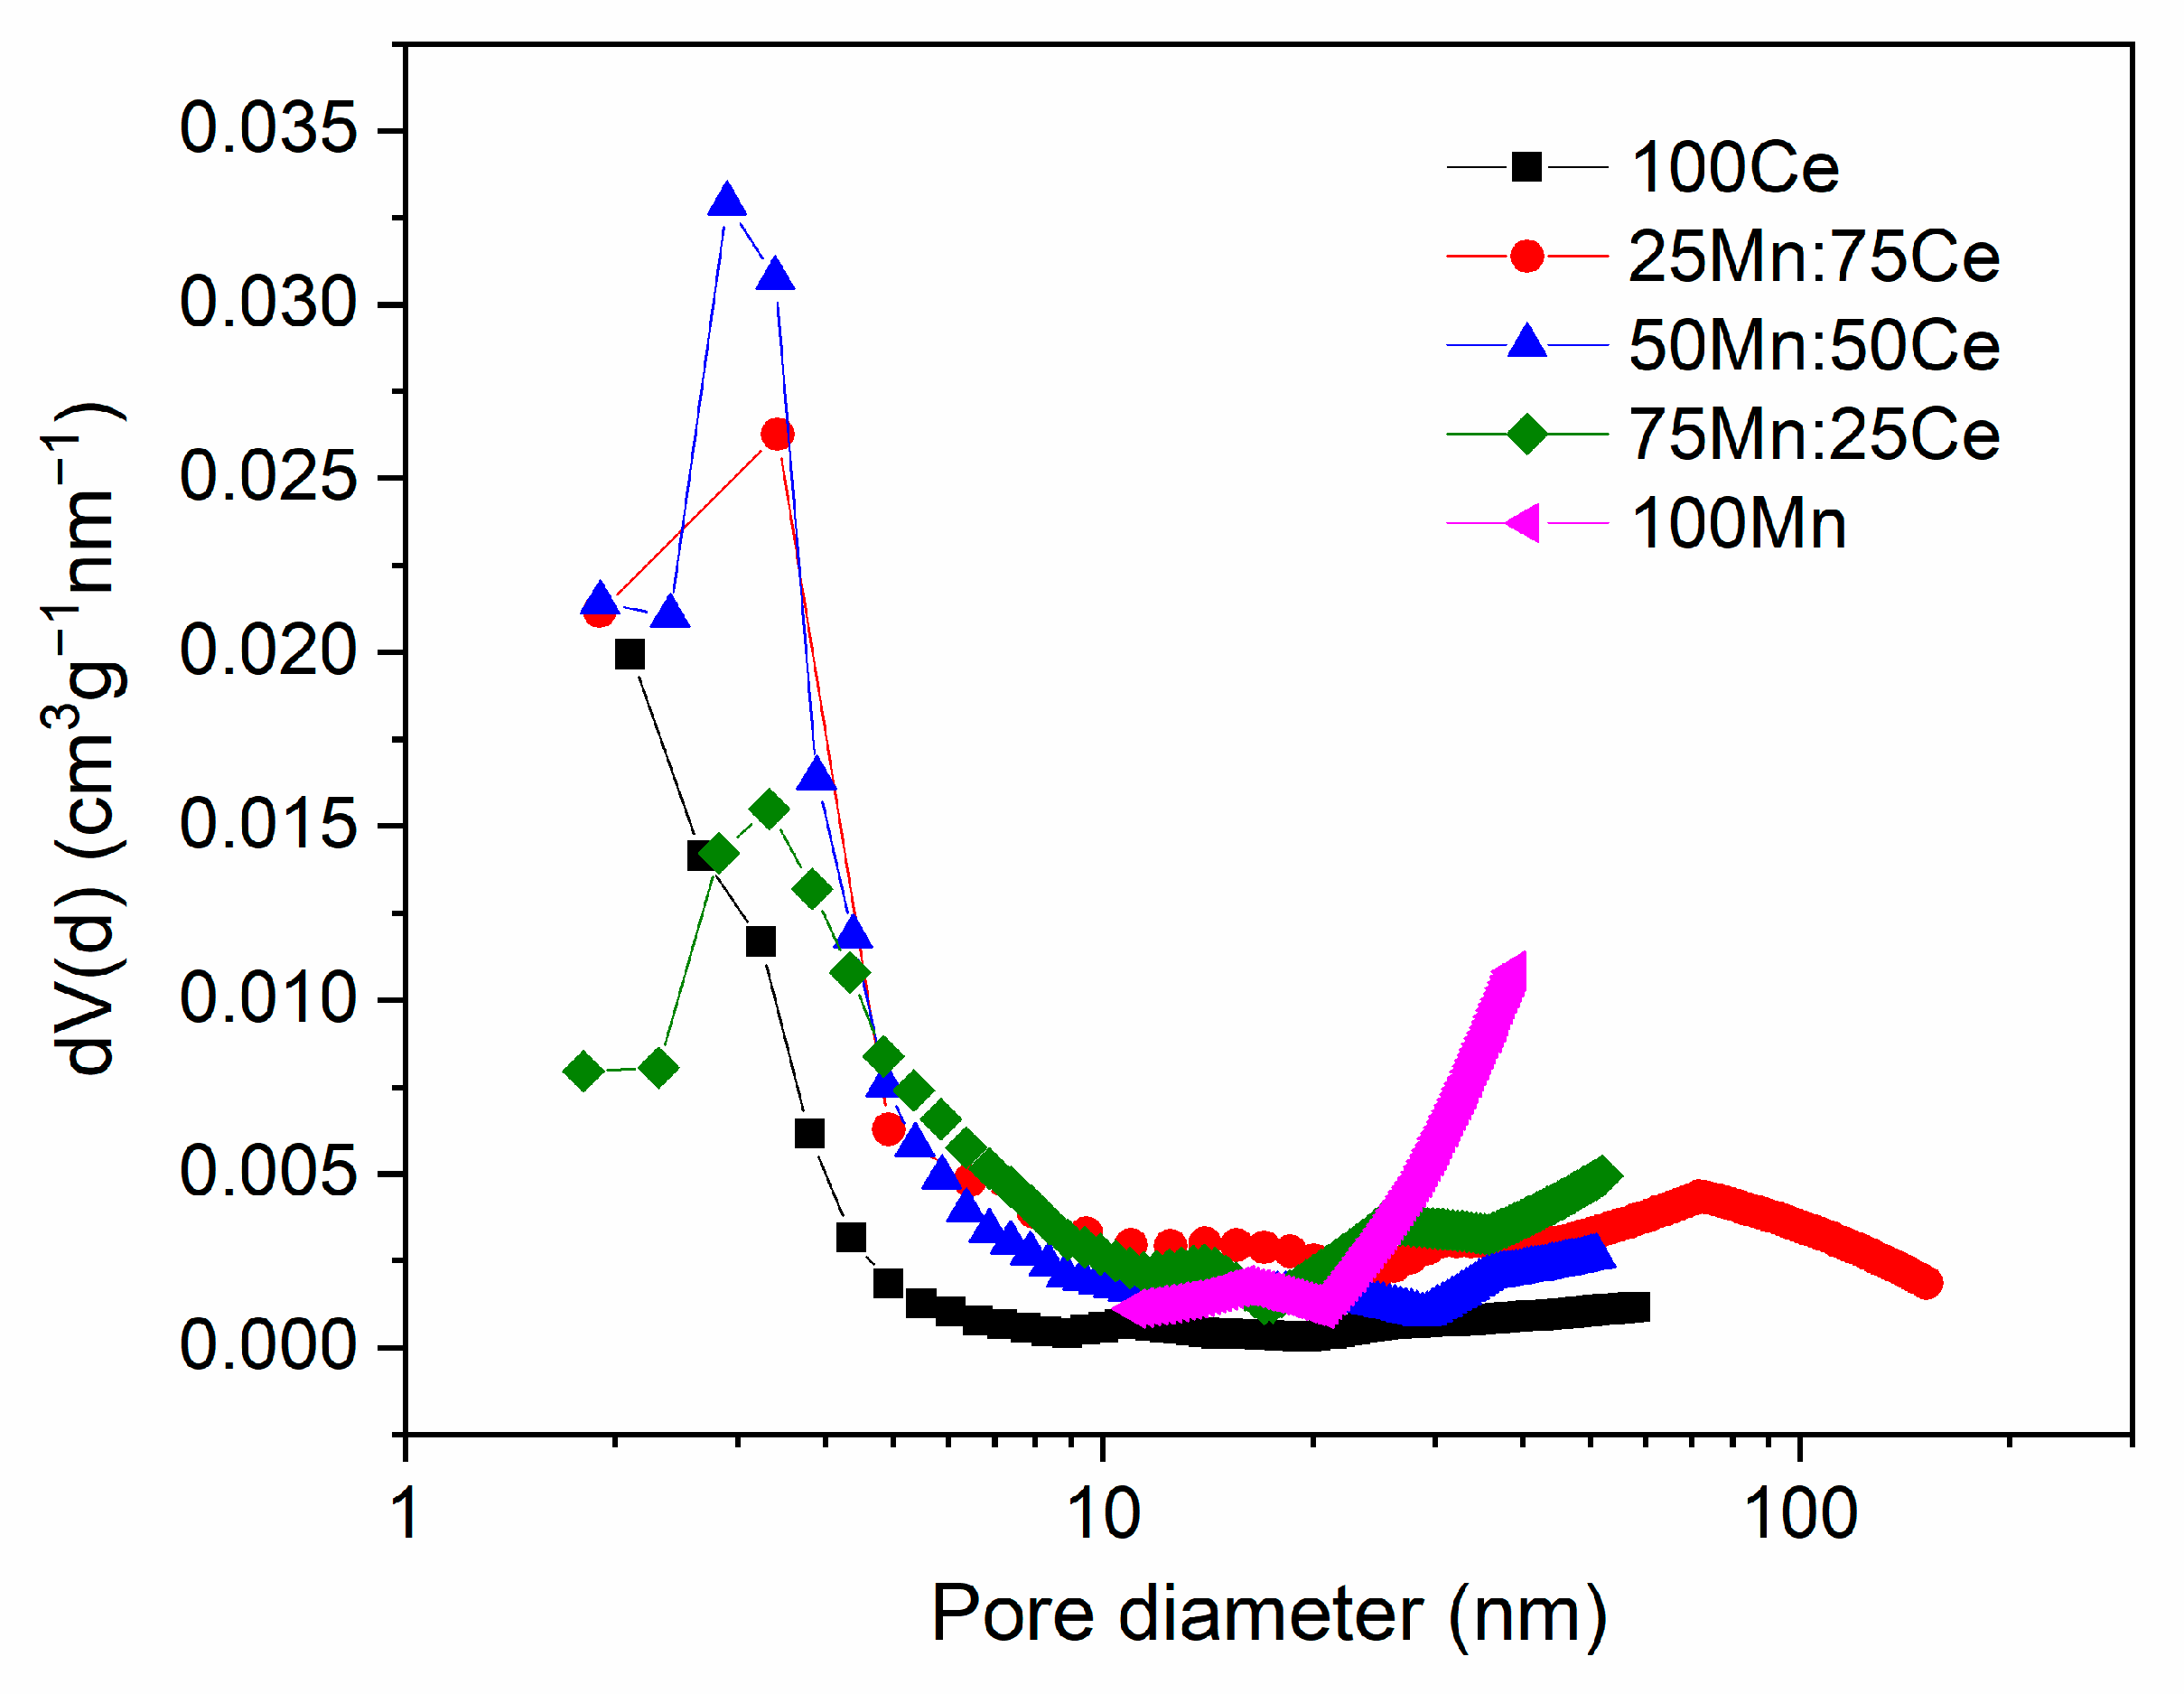
The pore size distributions are shown in
Figure 7 and are in good agreement with the trends discussed above. The mixed Ce-Mn samples exhibit more clearly defined pore size distributions than the pure oxides. With increasing manganese content, the distribution maximum shifts towards larger pore diameters, in agreement with the increase in average pore size shown in
Table 3. The 50Mn:50Ce sample shows the highest incremental pore volume, which is consistent with its highest specific surface area. In contrast, the pore size distributions of pure CeO
2 and pure manganese oxide do not exhibit a well-defined maximum.
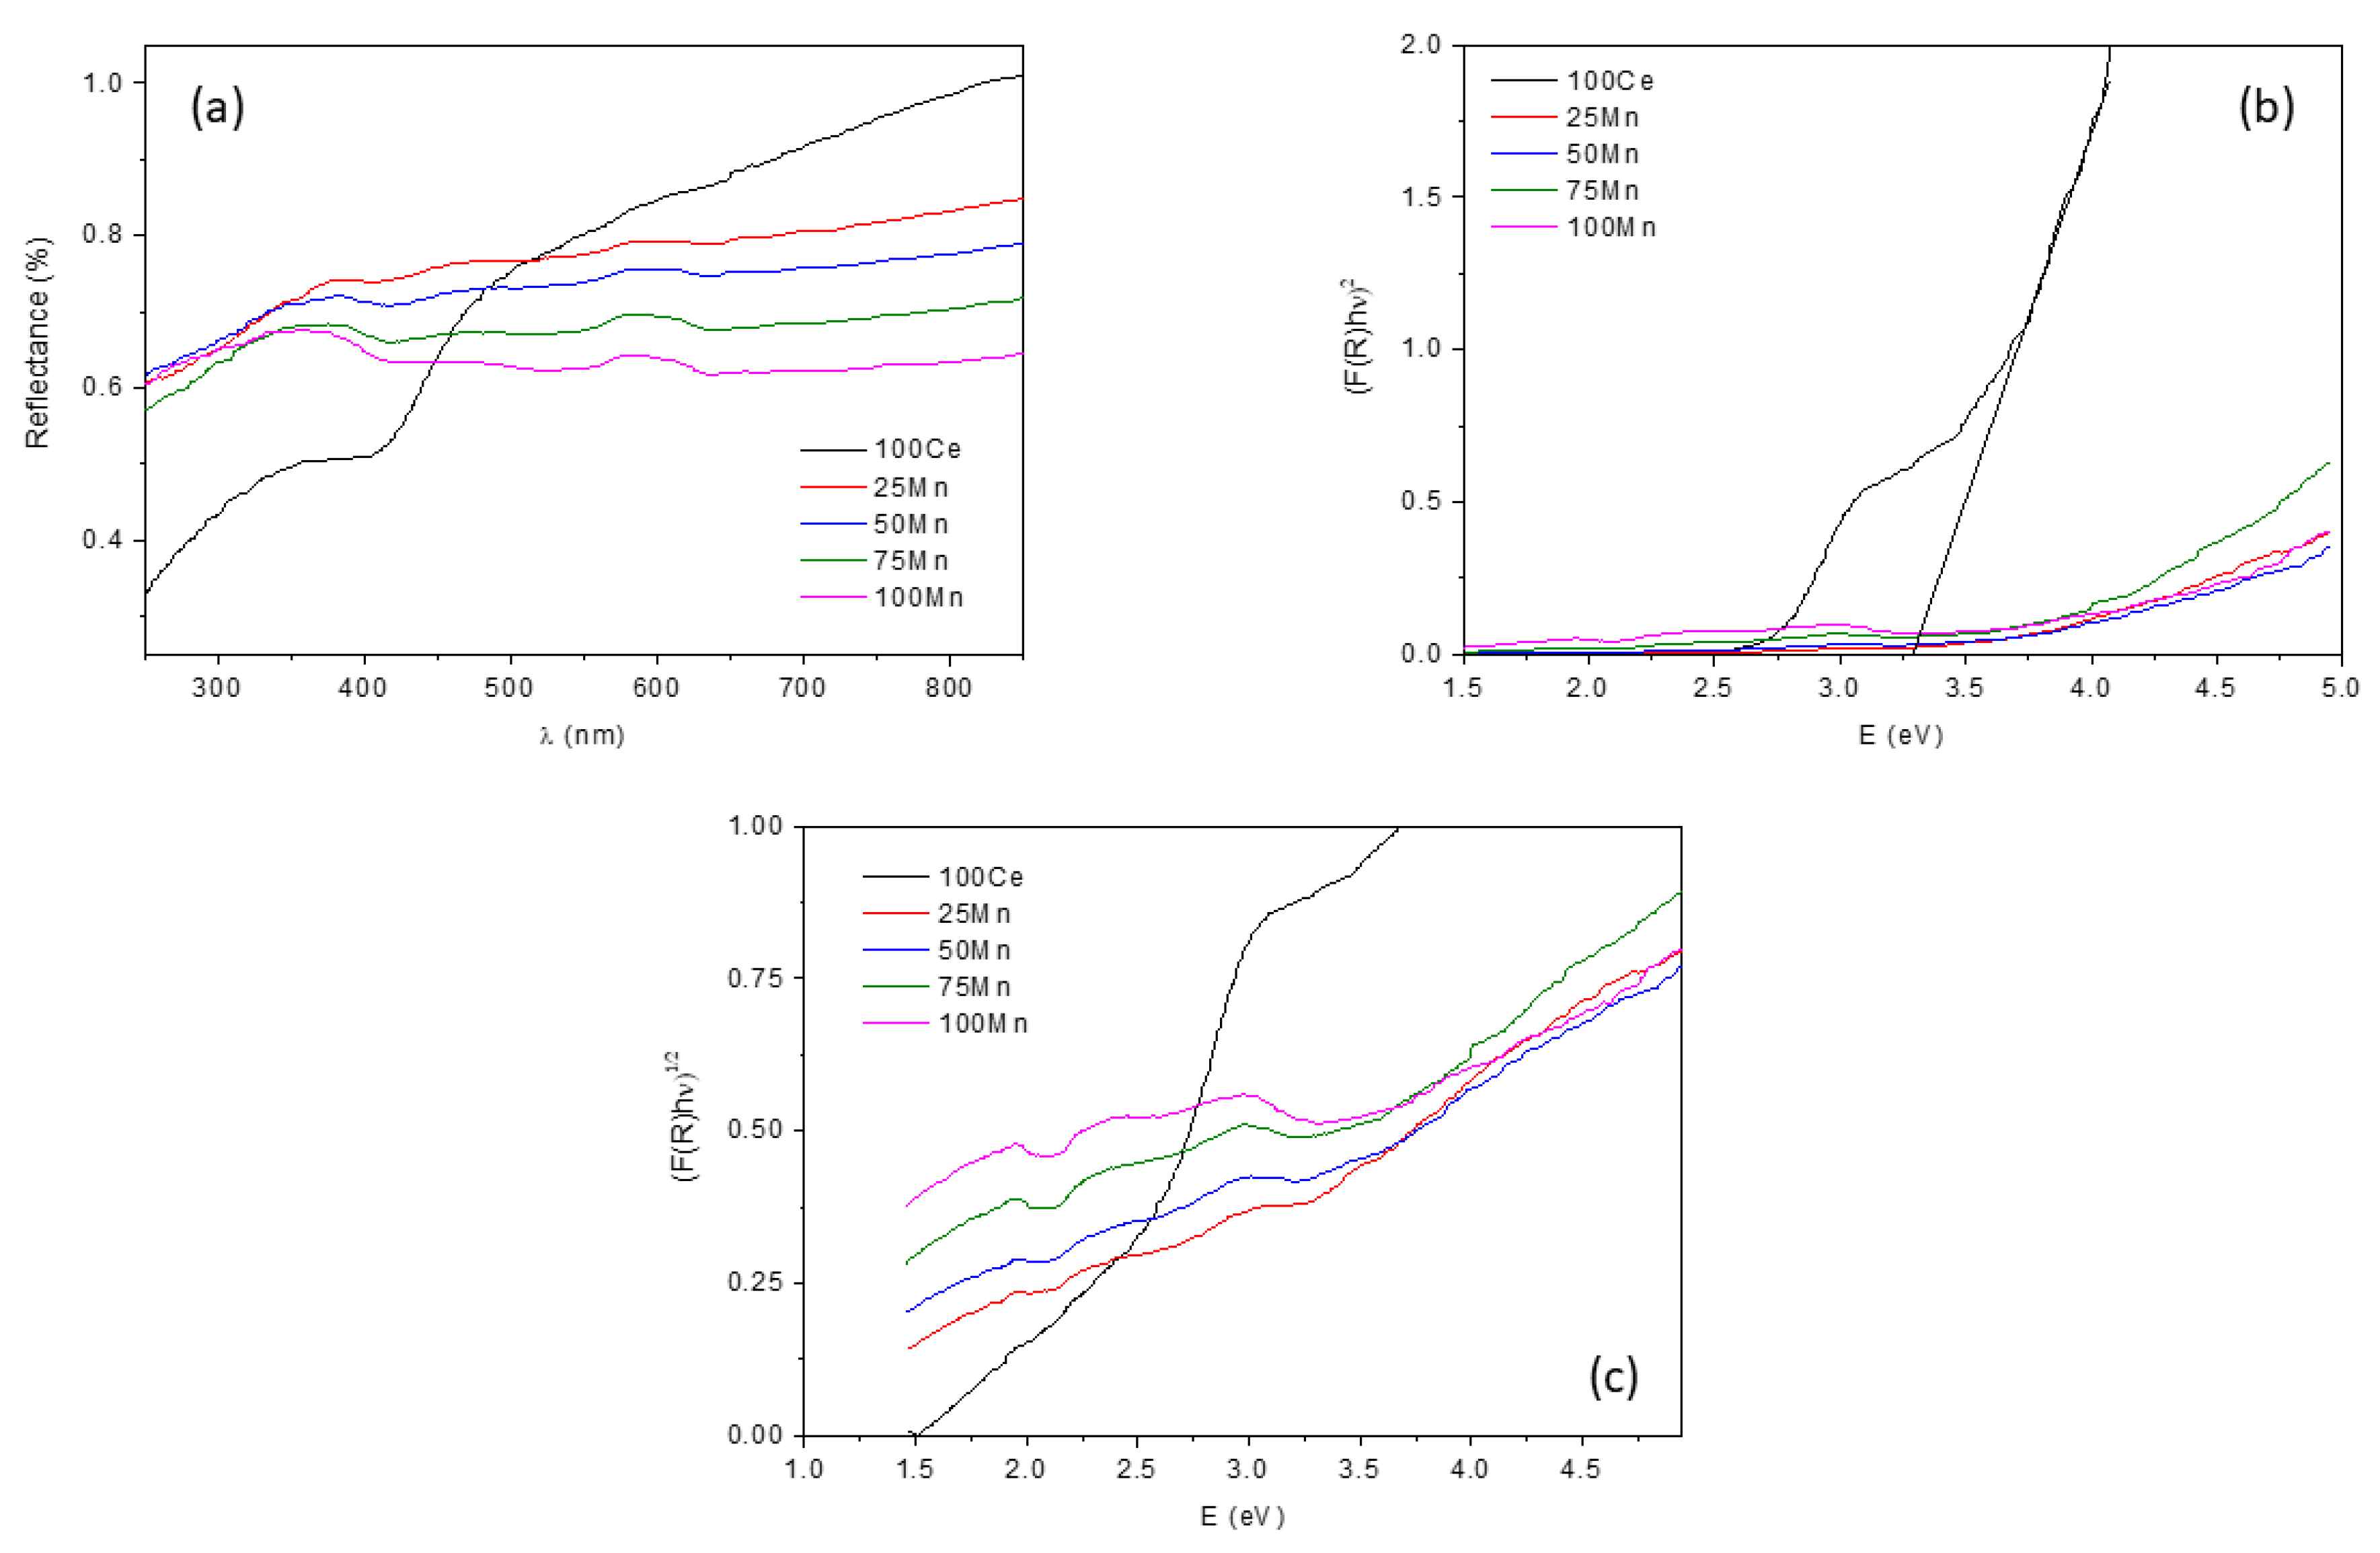
UV–Vis DRS spectra of the prepared samples are displayed in
Figure 8. The obtained spectra reveal a strong dependence of optical behaviour on the Ce:Mn ratio.
Pure CeO
2 exhibits high reflectance in the visible region together with a distinct absorption edge toward the UV region, which is characteristic of ceria semiconductors with a relatively wide band gap. As already mentioned, according to the literature, the band gap of CeO
2 typically ranges from approximately 2.6 to 3.4 eV depending on the preparation method and structural characteristics. The strong UV absorption of ceria is commonly associated with O
2− → Ce
4+ charge-transfer transitions [
3]. The pale-yellow colour of the synthesized 100Ce sample is consistent with this optical behaviour. In contrast, Mn-containing samples exhibit substantially lower reflectance throughout the visible region, indicating enhanced light absorption. Sodium birnessite is generally considered a narrow-band-gap semiconductor with reported band gap values typically ranging from approximately 1.8 to 2.3 eV, depending on composition, crystallinity, and synthesis conditions. The broad visible-light absorption of manganese-containing samples is commonly attributed to d-d electronic transitions and intervalence charge transfer between Mn
3+ and Mn
4+ species present in birnessite-type manganese oxides [
7,
32]. When darker and lighter powders are mixed, reflectance data is dominated by darker phase absorption properties and total reflectance of the mixture is lowered [
33]. Thus, birnessite content decreases the reflectance in the visible region, indicating extension of light absorption toward longer wavelengths. This behaviour becomes more noticeable with increasing birnessite content, which agrees with the gradual colour change in the samples from brown to nearly black. Such behaviour suggests that coupling ceria with sodium birnessite significantly modifies the optical response of the material and may improve the utilization of visible-light irradiation in photocatalytic applications.
The consequence of the darker phase dominance could be observed in Tauc plots given in
Figure 8b,c. The plot appropriate for the bandgap determination can be observed only for pure ceria in a direct bandgap plot (
Figure 8b), giving a bandgap of 3.29 eV; in all other cases the plots contained no flat baseline region. Thus, due to a strong influence of the phase absorbing in visible part of the spectra, reliable determination of band gap values from the diffuse reflectance spectra is unfeasible.
Photocatalysis
Preliminary photocatalytic experiments were carried out using Rhodamine B as a model organic dye in order to evaluate the photocatalytic activity of the synthesized materials. Initial experiments performed on the mixed samples under 365 nm irradiation did not result in measurable photocatalytic degradation. Although the mixed materials exhibited enhanced absorption toward the visible region due to the presence of sodium birnessite, increased light absorption alone was insufficient to induce photocatalytic activity under the applied irradiation conditions. Pinaud et al. similarly reported strong visible-light absorption for sodium birnessite-type MnO
2, but a low external quantum efficiency, indicating that favourable optical properties do not necessarily translate into efficient photoinduced redox activity [
32]. Photocatalytic performance also depends on the band-edge positions, charge-separation efficiency, charge-carrier lifetime, and interfacial charge-transfer processes [
2]. Thus, the observed absorption may predominantly arise from optical transitions associated with the birnessite phase without generating charge carriers with sufficiently long lifetimes or suitable redox potentials for Rhodamine B degradation. Rapid recombination of photogenerated carriers, either within the individual phases or at their shared interface, may also have contributed to the absence of measurable activity under 365 nm irradiation. However, these possibilities were not directly investigated in the present study and therefore remain hypothetical.
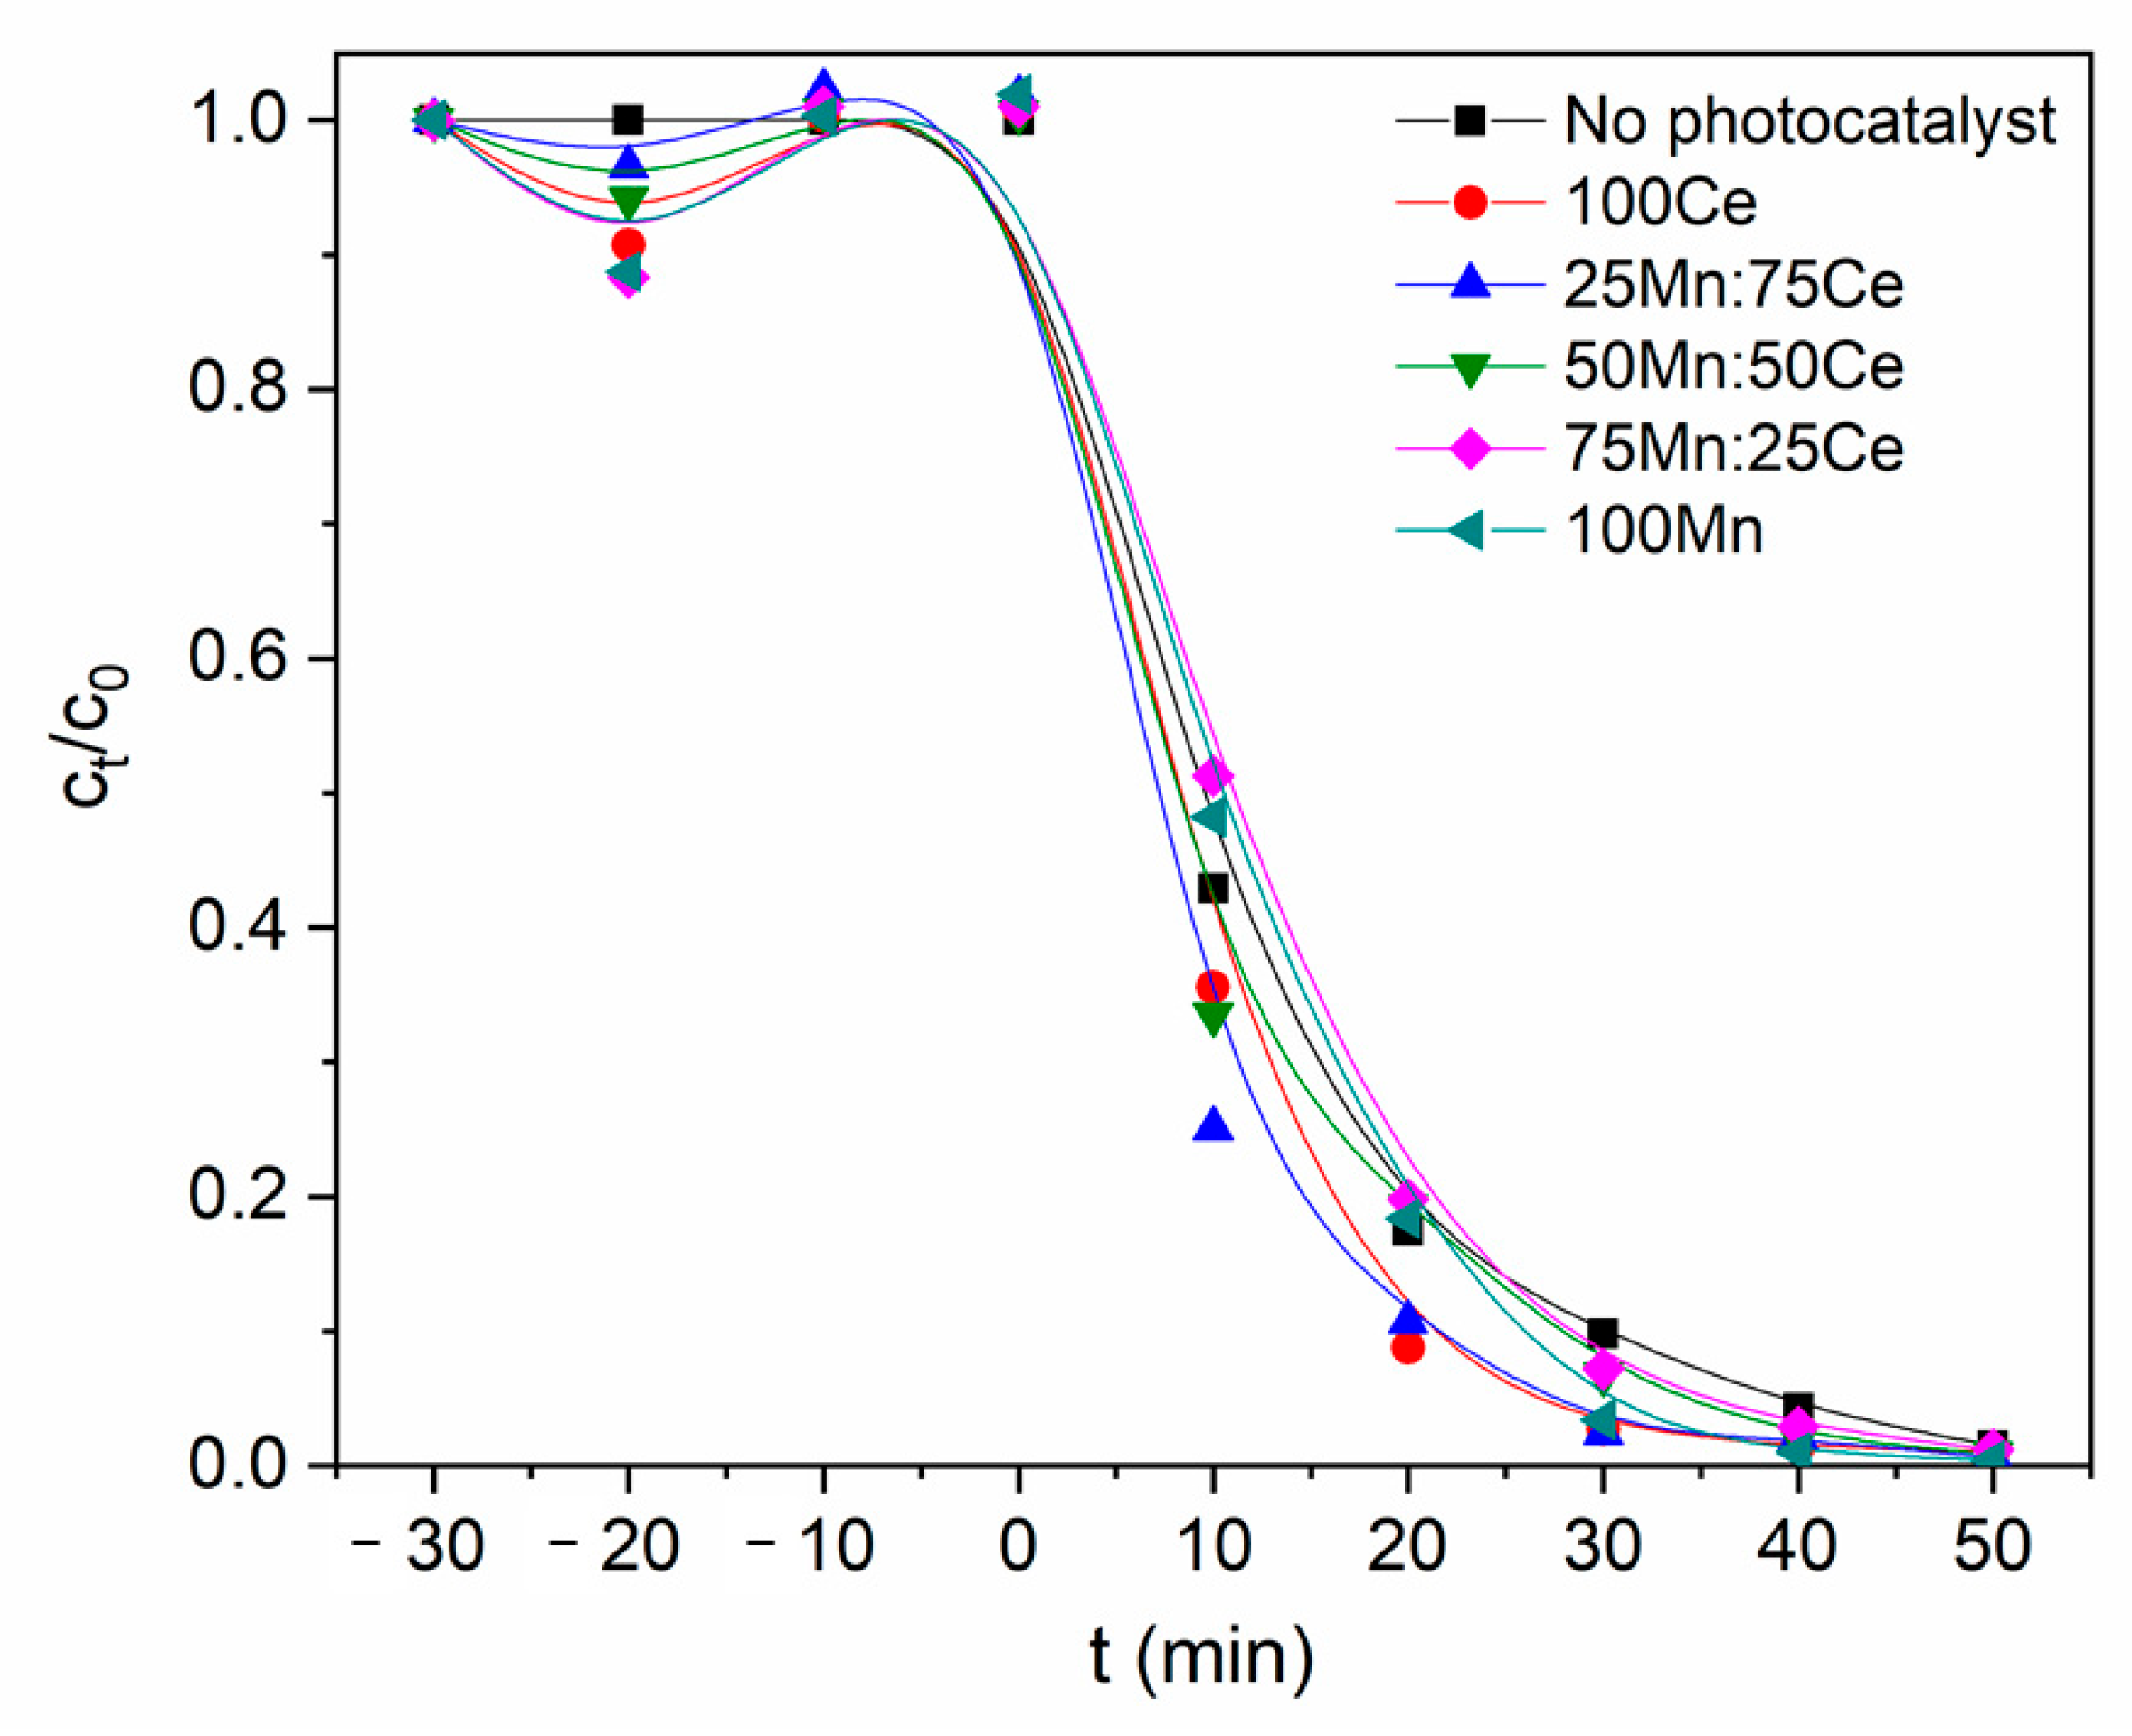
Therefore, further experiments were conducted using a UV lamp with a wavelength of 254 nm, which enabled measurable degradation of Rhodamine B. It should be noted that irradiation with the 254 nm UV lamp also led to partial photolysis of Rhodamine B in the absence of a photocatalyst due to the high energy and intensity of the applied UV radiation. Nevertheless, the presence of the synthesized photocatalysts noticeably accelerated the degradation process compared to the reference experiment without a catalyst, confirming their photocatalytic activity. The obtained photocatalytic degradation results are presented in
Figure 9 and
Figure 10, while the calculated kinetic parameters are summarized in
Table 4.
Figure 9 shows the dependence of the normalized Rhodamine B concentration (c
t/c
0) on irradiation time for the investigated samples. Prior to UV irradiation, the suspensions were stirred in the dark for 30 min in order to establish adsorption–desorption equilibrium between the dye molecules and the photocatalyst surface. Only negligible adsorption of Rhodamine B was observed for all investigated samples despite the noticeable differences in their specific surface areas. A slight decrease in the normalized Rhodamine B concentration was observed after the first 10 min of the dark equilibration period, followed by a return to values close to the initial concentration before UV irradiation. Since this behaviour was observed for almost all investigated samples, it is unlikely to originate from the adsorption properties of individual photocatalysts. One possible explanation is the initial interaction of Rhodamine B with the unused syringe filter, since the first aliquot collected after 10 min of the dark equilibration period was also the first to pass through a new filter membrane. This could lead to a slight underestimation of the Rhodamine B concentration in the first filtered sample. After switching on the UV lamp, rapid degradation of Rhodamine B was observed for all investigated systems, resulting in almost complete dye conversion after 50 min of irradiation. All investigated photocatalysts accelerated the degradation process compared to the experiment performed without a catalyst, confirming their photocatalytic activity.
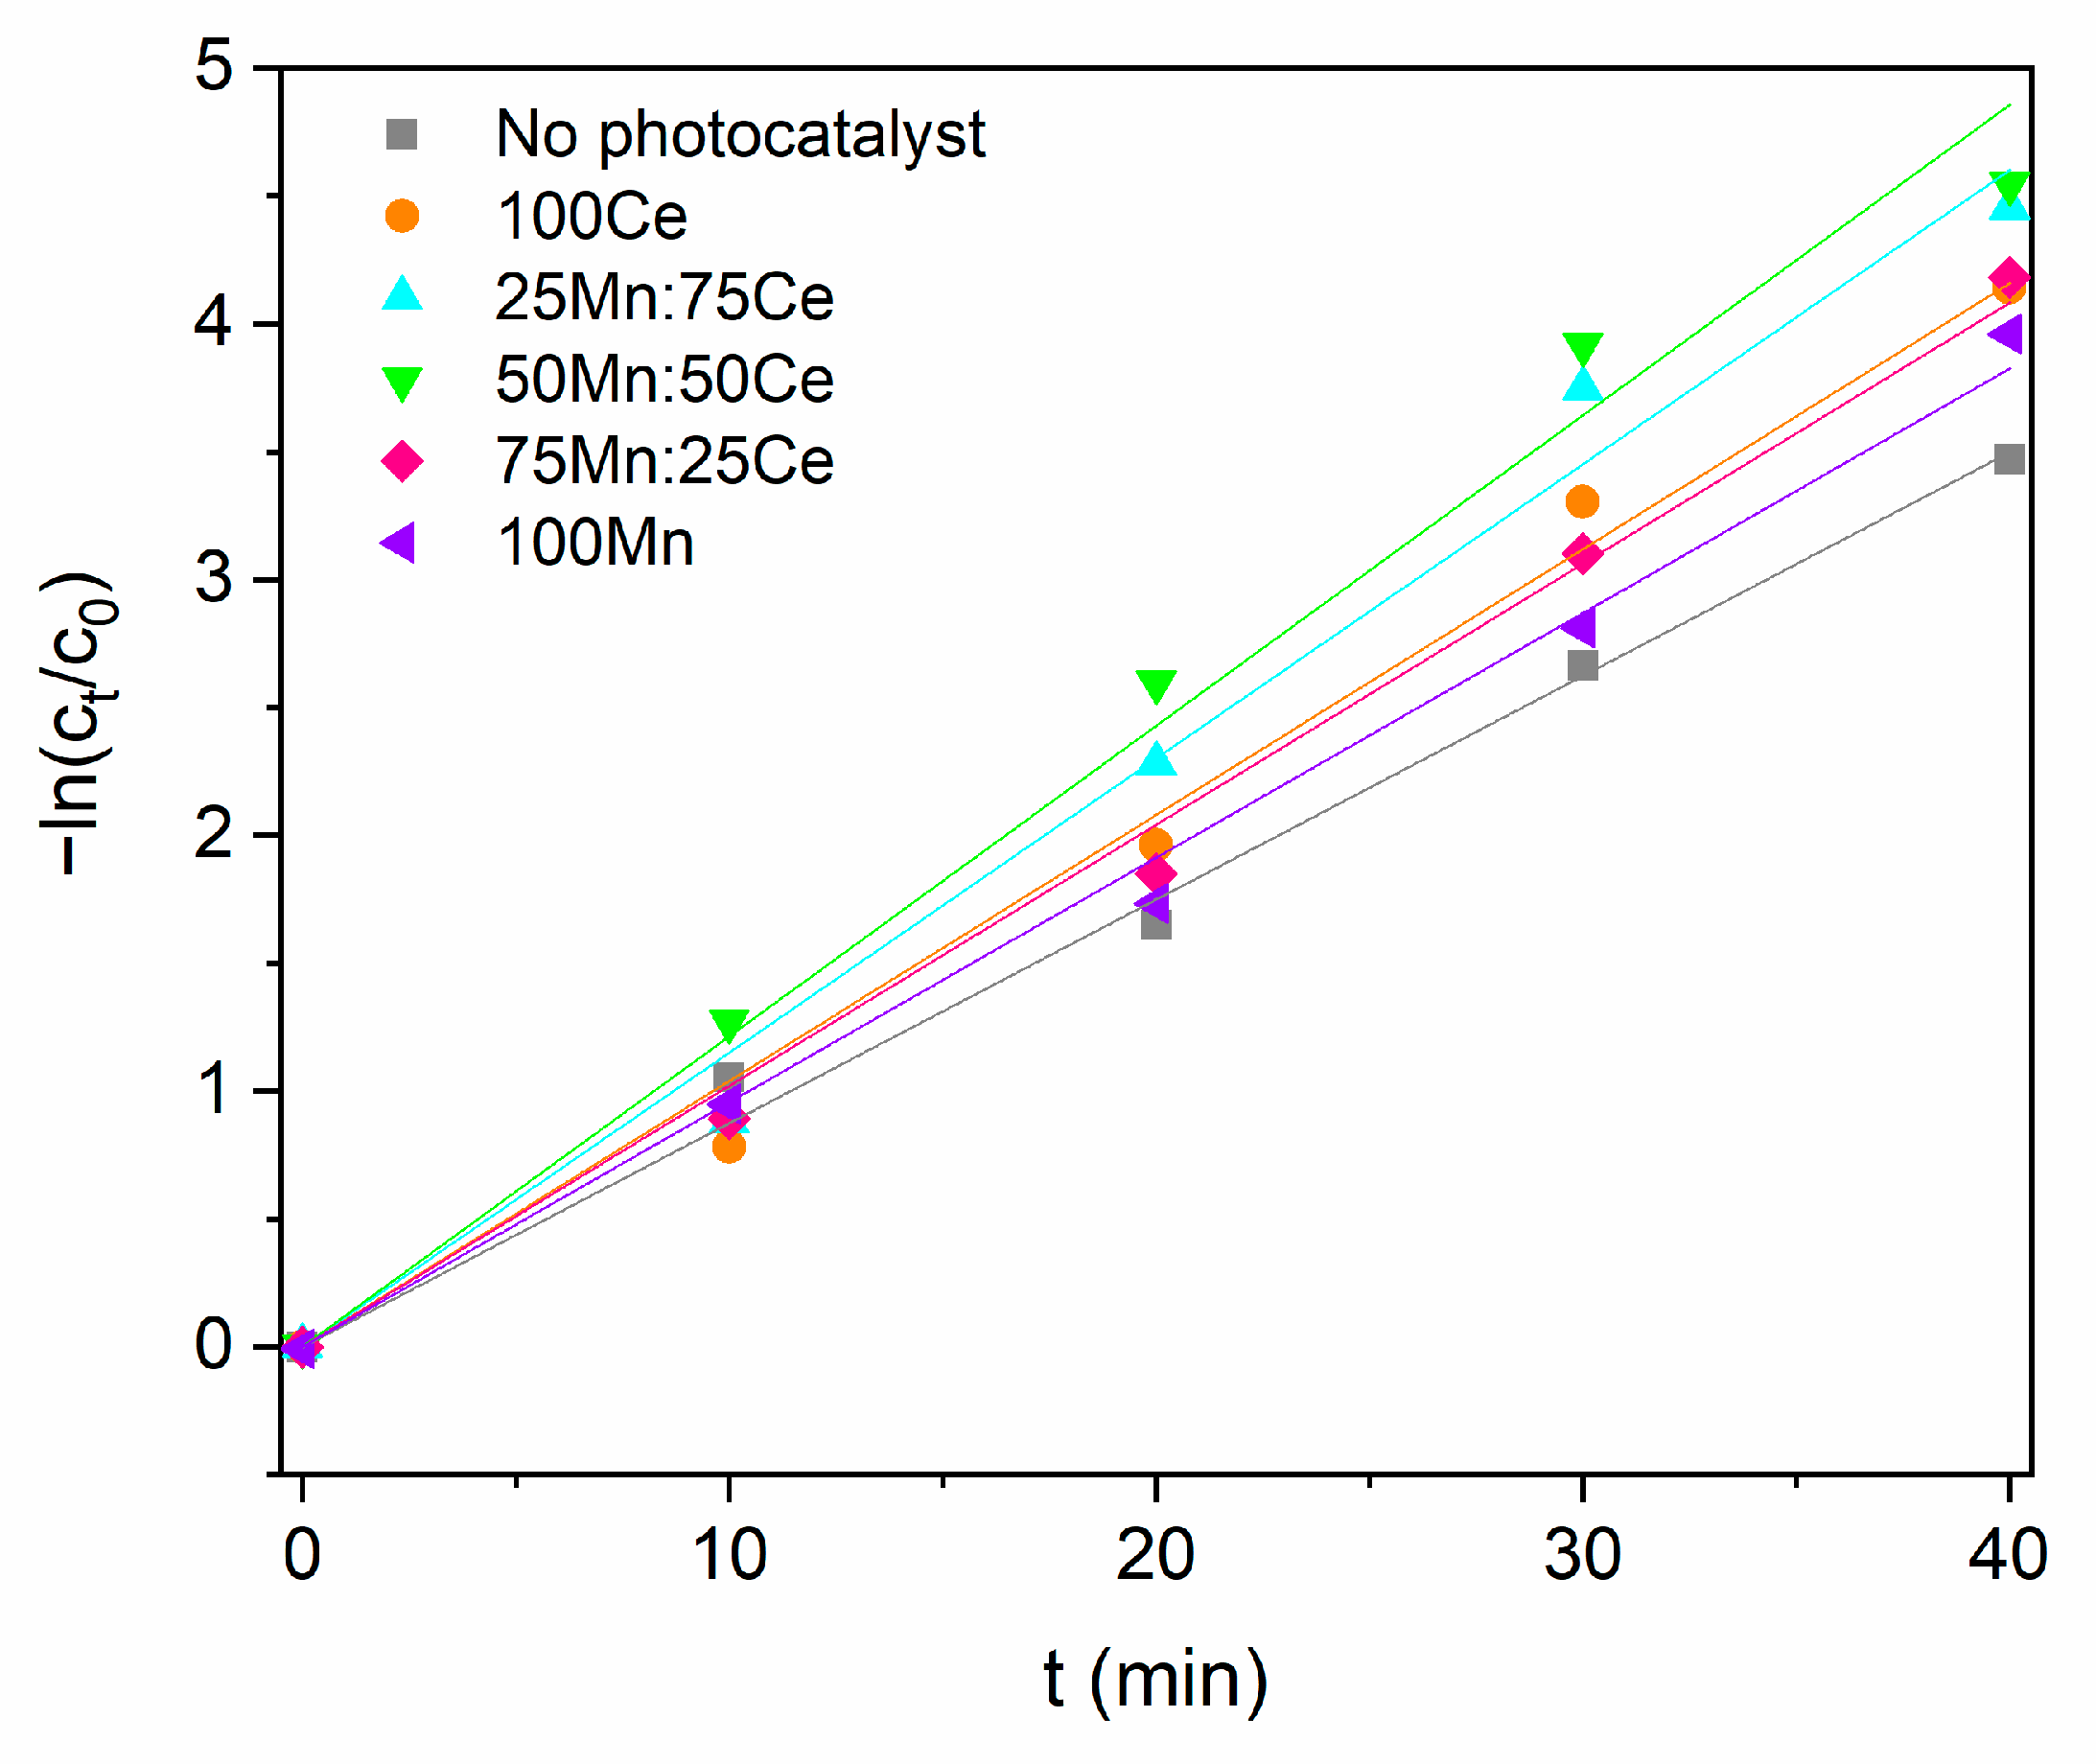
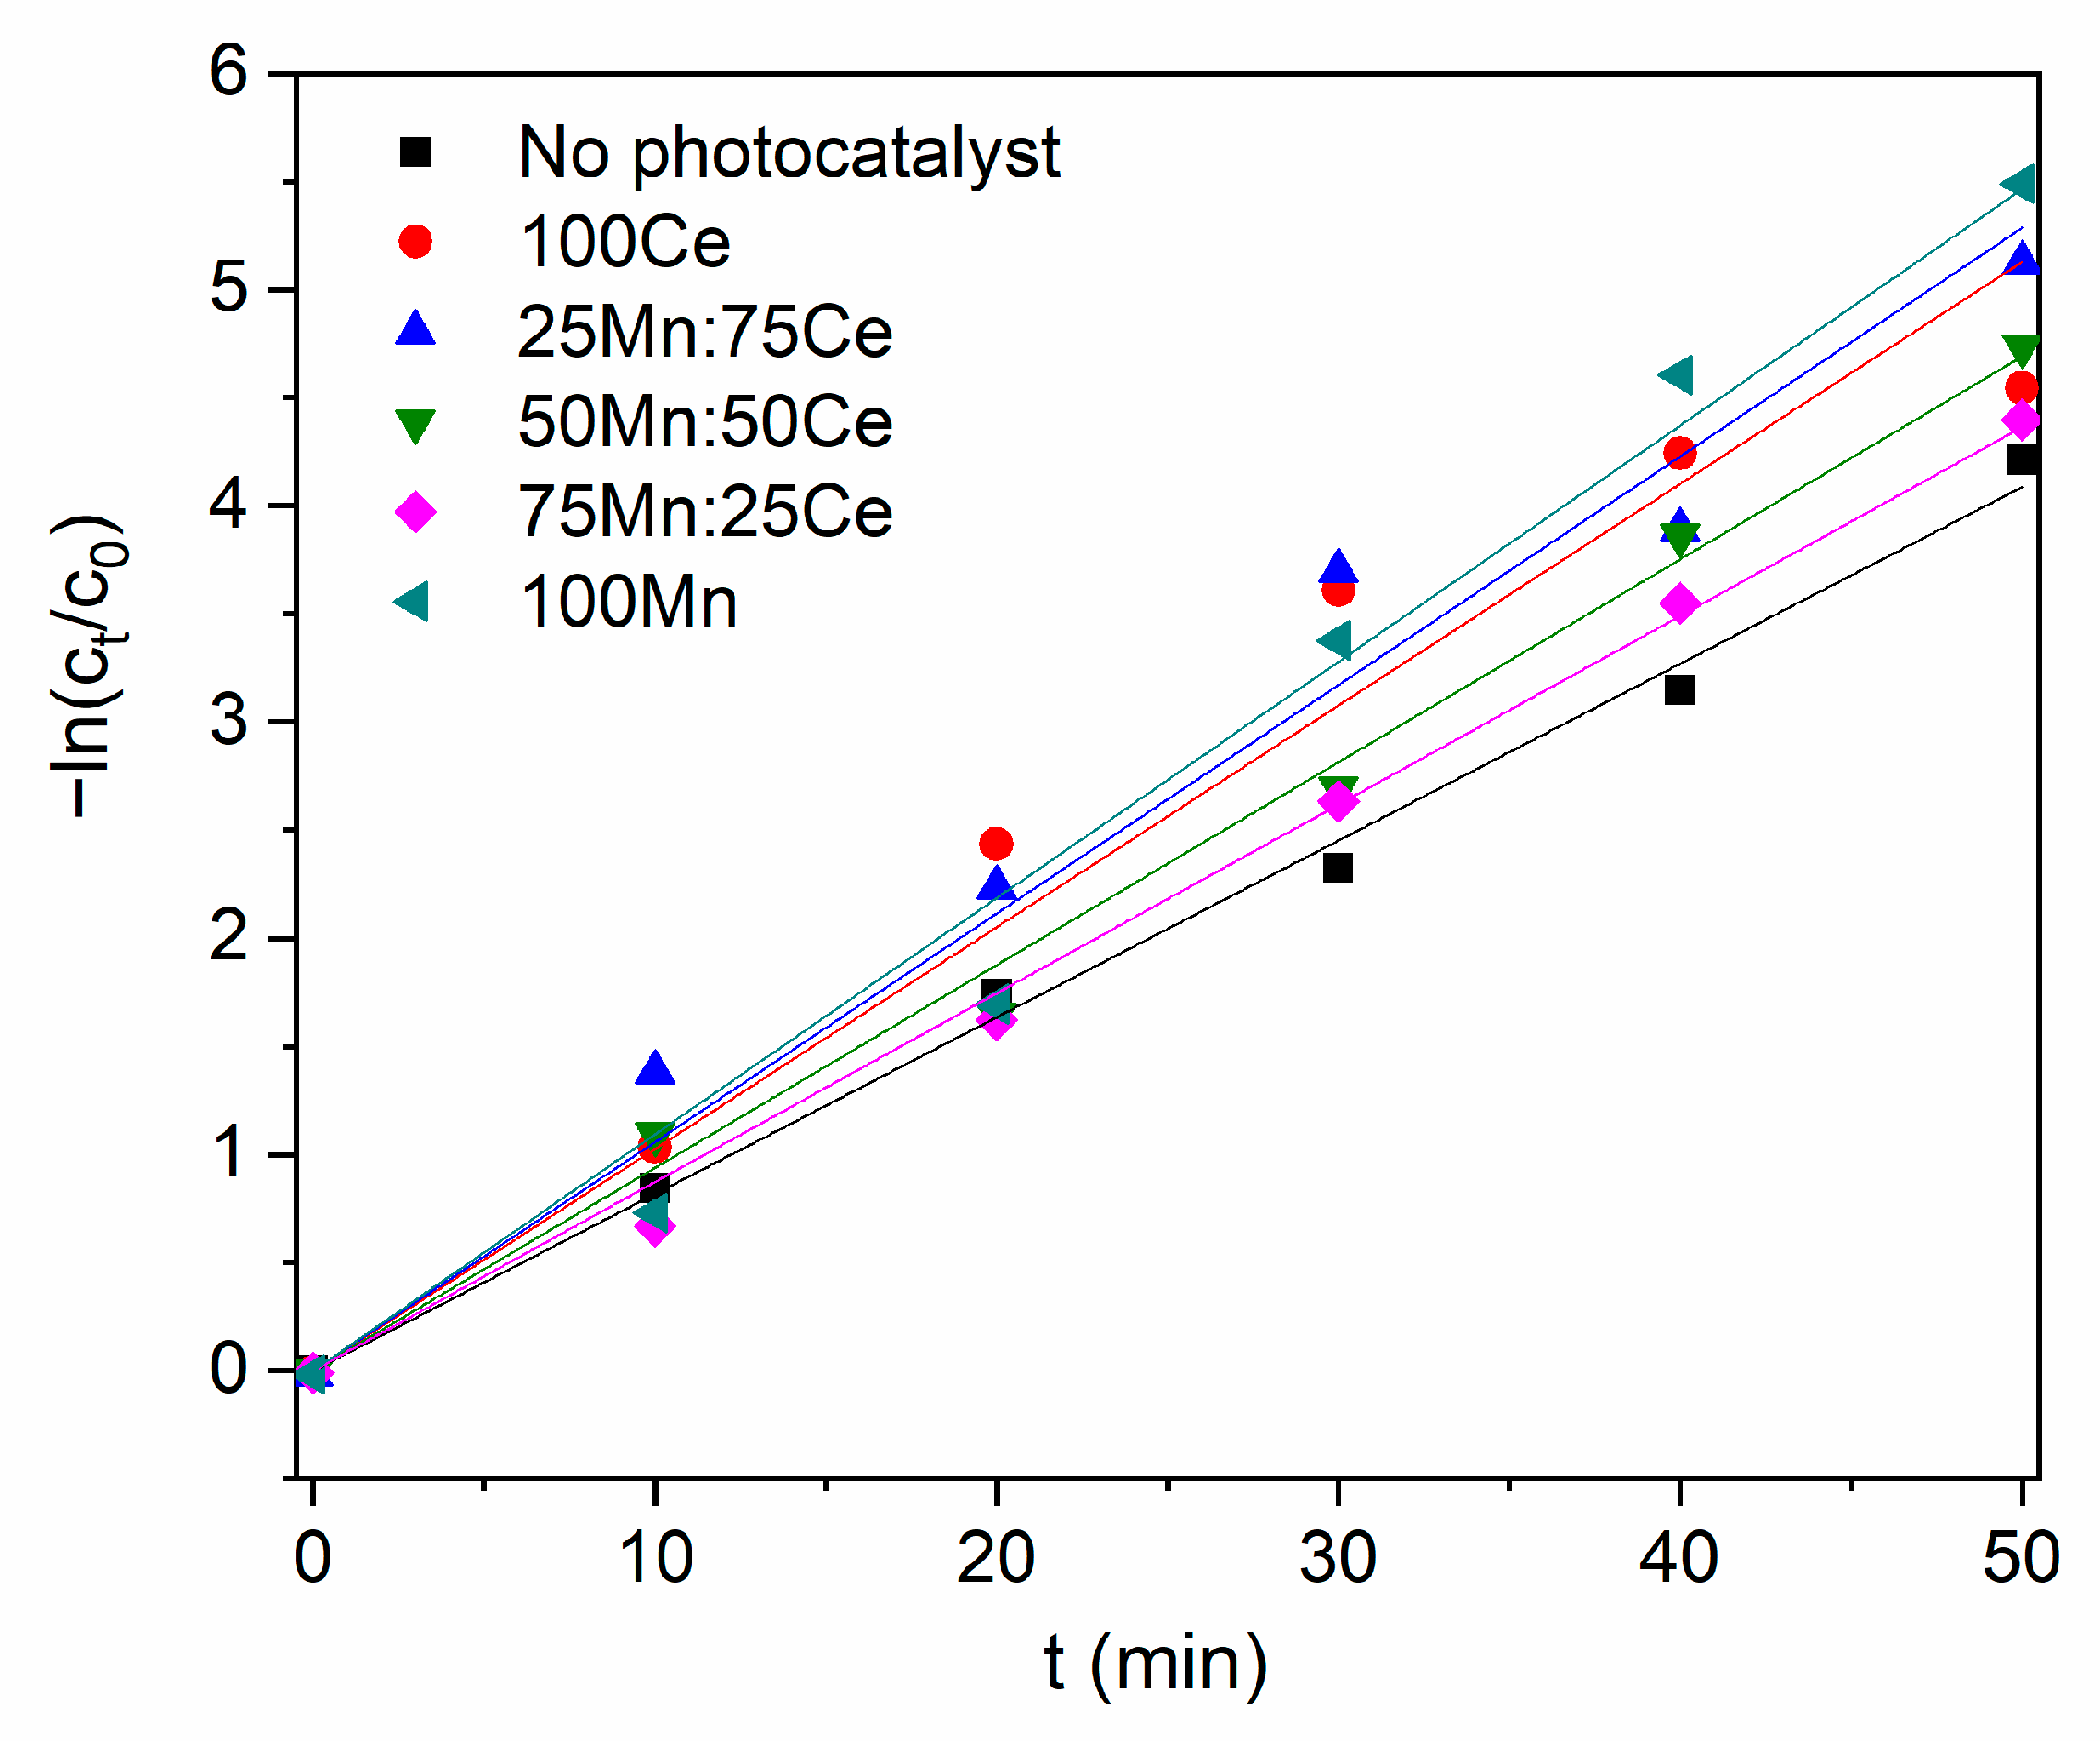
The photodegradation of dyes such as Rhodamine B is commonly described using the pseudo-first-order kinetic model according to the Langmuir–Hinshelwood approach −ln(c
t/c
0) = k
t, where c
t represents the Rhodamine B concentration after irradiation time t, c
0 is the initial concentration after the dark adsorption period, and k is the apparent rate constant [
34]. As shown in
Figure 10 and
Table 4, the pseudo-first-order model provides an excellent description of the obtained experimental data for all investigated samples, as confirmed by the high correlation coefficient values (R
2 ≈ 0.99). Under 254 nm irradiation, rapid degradation of Rhodamine B was observed for all investigated systems, including the reference experiment without a photocatalyst, indicating that direct photolysis contributed significantly to the overall degradation process. Nevertheless, all photocatalyst-containing systems exhibited higher apparent rate constants than the reference experiment, confirming that the prepared materials enhanced the degradation of Rhodamine B. Only relatively small differences in photocatalytic activity were observed among the investigated photocatalysts under these conditions. The highest apparent rate constants were obtained for the pure Mn sample, followed by the 25Mn:75Ce sample and the pure CeO
2 sample, whereas the 75Mn:25Ce sample showed the lowest activity among the photocatalyst-containing systems. Because the strong photolysis of Rhodamine B at 254 nm partly masked the influence of the photocatalyst composition, additional experiments were performed under modified conditions in order to better evaluate the role of the catalyst surface.
Adsorption of Rhodamine B is known to depend not only on the surface area and porosity of the adsorbent, but also on surface charge and electrostatic interactions, since Rhodamine B is a cationic dye. Previous studies have shown that favourable electrostatic interactions with negatively charged surface sites can significantly enhance Rhodamine B adsorption and consequently improve its photocatalytic degradation [
35,
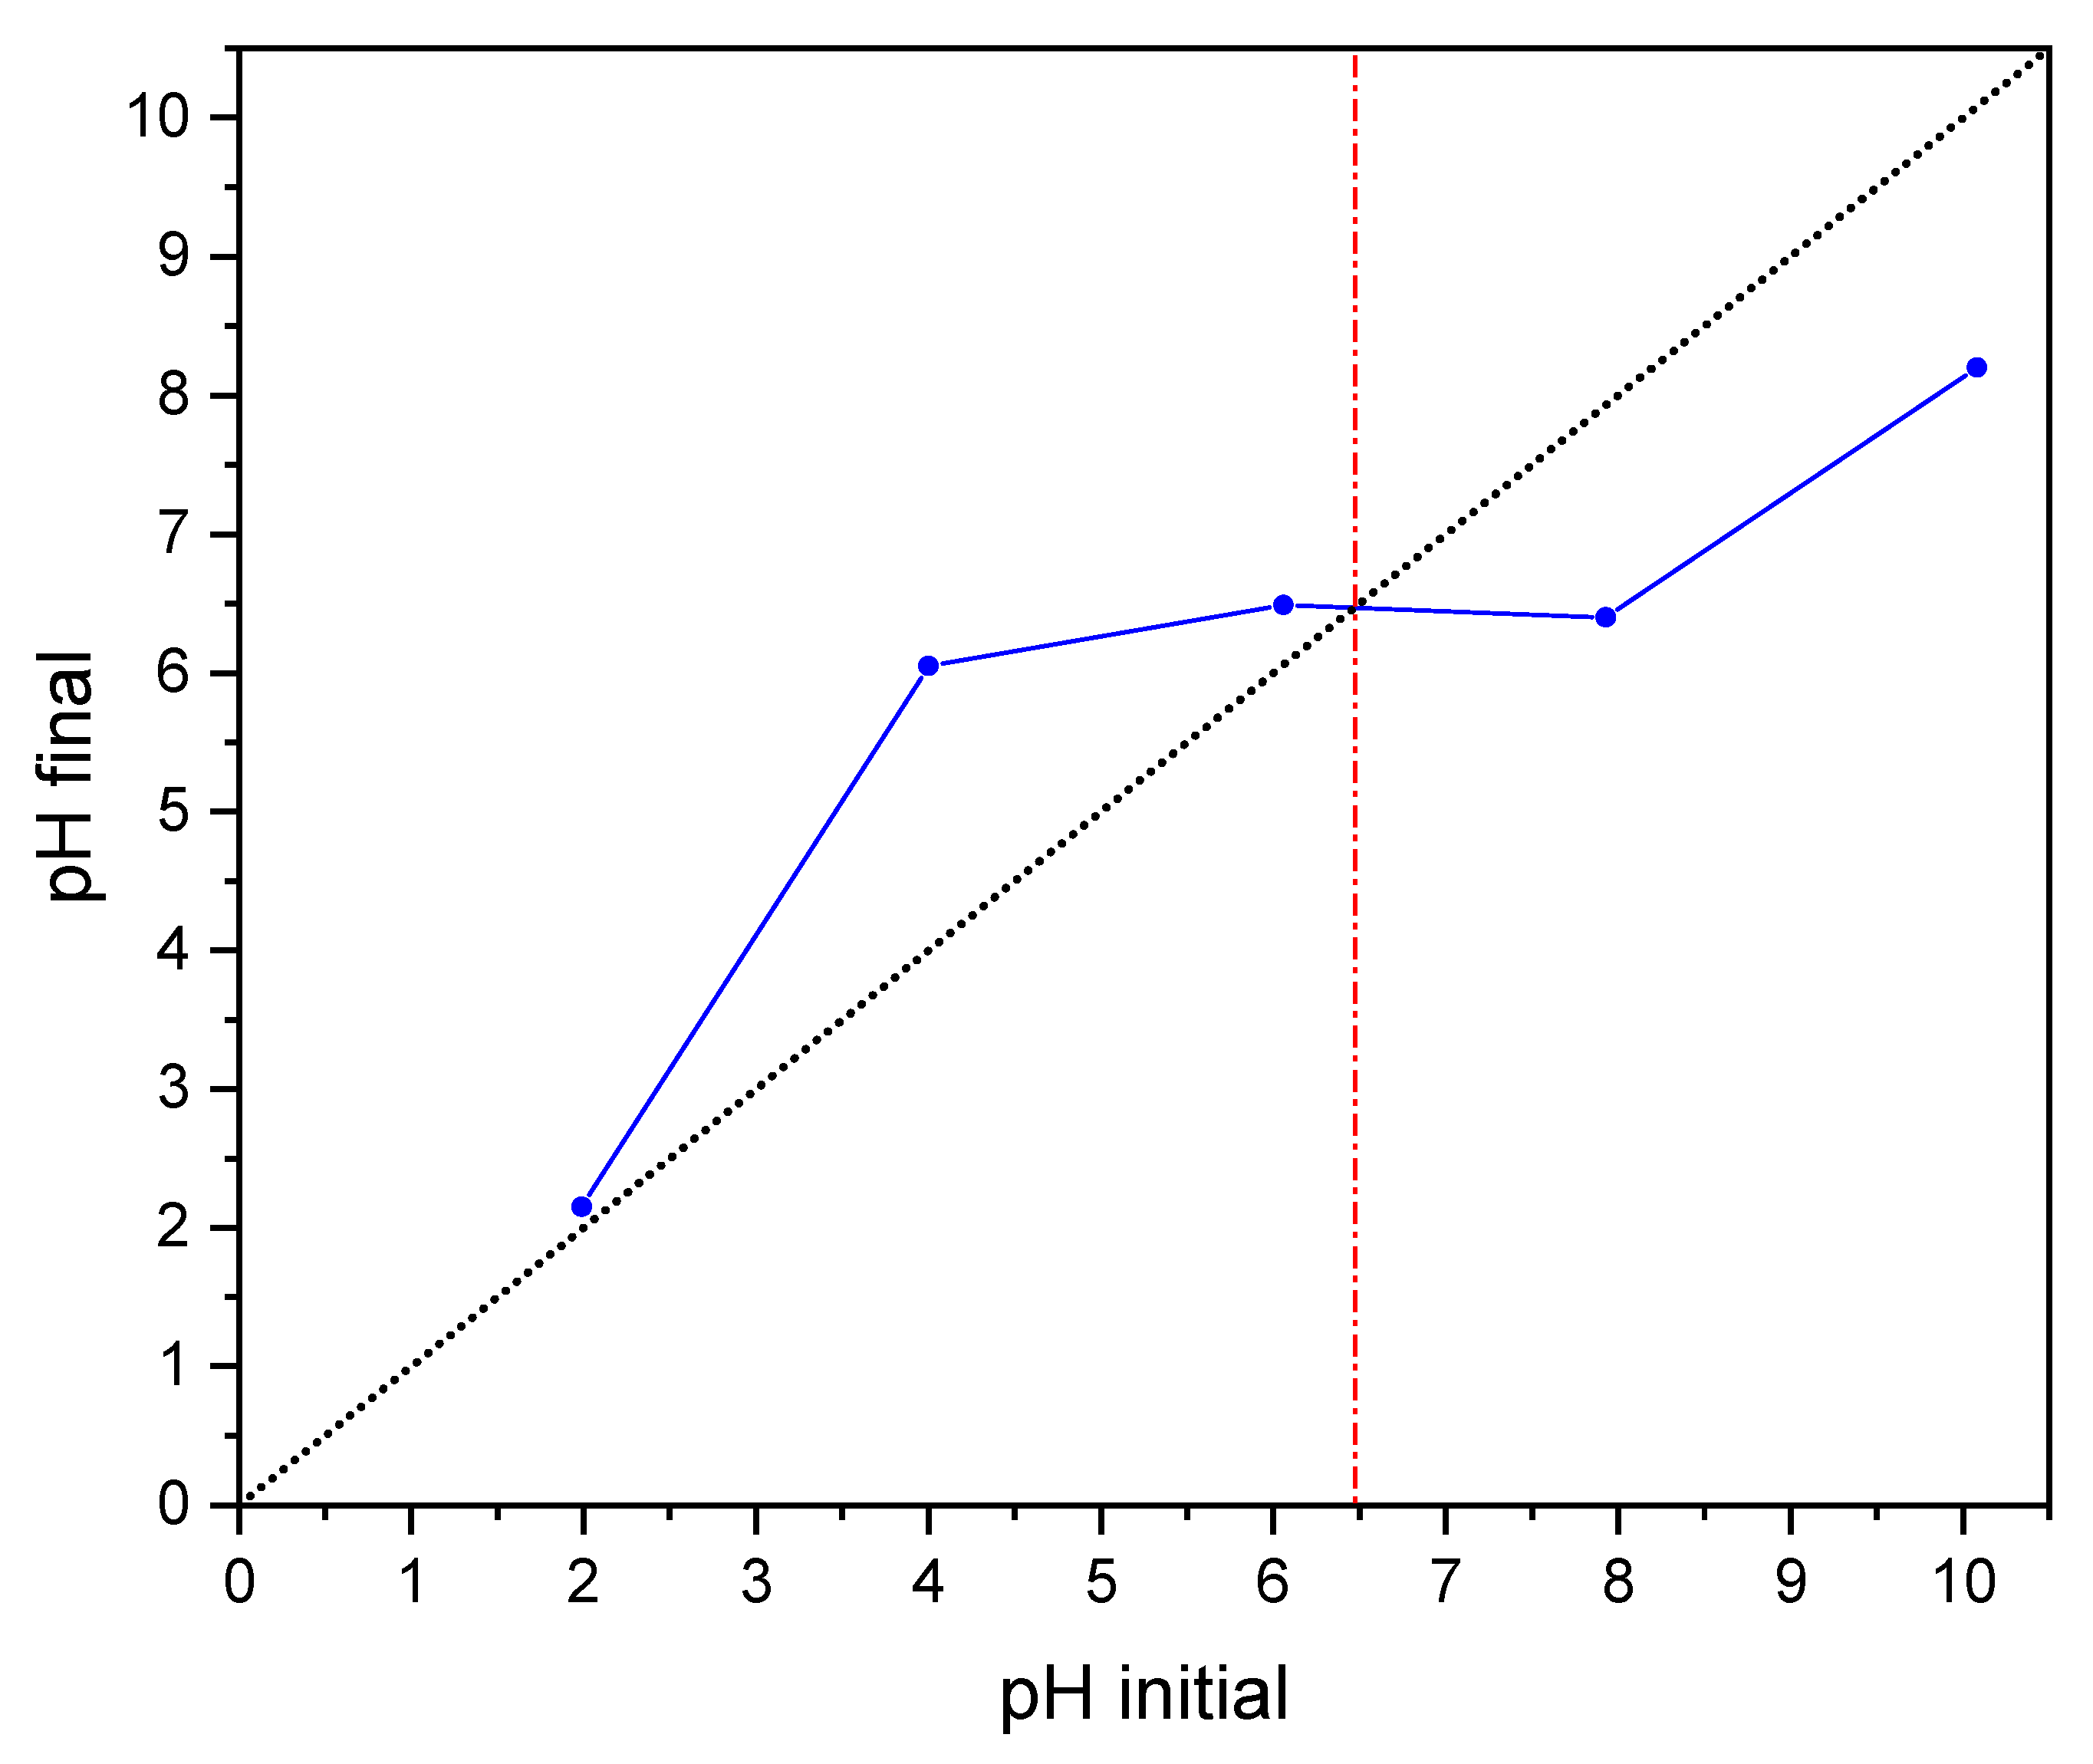
36]. Therefore, the point of zero charge (pH
pzc) of the 50Mn:50Ce sample was determined using the pH drift method. The results are shown in
Figure 11. Regardless of the initial pH value, the suspensions tended to reach a similar final pH, and the pH
pzc was determined to be 6.46 from the intersection of the pH
final and pH
initial curves. The obtained pH
pzc value is in good agreement with values reported for CeO
2, which are typically around 6–7, while birnessite-type manganese oxides usually exhibit considerably lower pH
pzc values, generally between 1 and 3 [
37,
38,
39]. The pH
pzc value of the 50Mn:50Ce sample is noticeably closer to that of CeO
2, suggesting that the surface charge behaviour of the material is largely influenced by the ceria phase.
The pH of the Rhodamine B solution used in the photocatalytic experiments was 4.3. Since this value is lower than the pH
pzc of the sample, the catalyst surface is expected to be positively charged under the experimental conditions. As Rhodamine B is a cationic dye, adsorption through electrostatic interactions is therefore not favoured, which may explain the very limited adsorption observed during the 30 min dark equilibration period despite the relatively high specific surface area of the material. To further examine the influence of surface charge on the adsorption and photocatalytic behaviour of the prepared materials, additional experiments were performed at pH 7.5, i.e., above the determined pH
pzc value of 6.46. The results are shown in
Figure 12 and
Figure 13, while the calculated kinetic parameters are presented in
Table 5. A new reference experiment without a photocatalyst was carried out under the same conditions to enable direct comparison. Prior to the photocatalytic experiments, the UV–Vis spectrum of the Rhodamine B solution was recorded after pH adjustment. No noticeable changes in the position, shape or intensity of the characteristic absorption band were observed, indicating that the addition of a small amount of NaOH did not significantly affect the optical properties of the dye.
As shown in
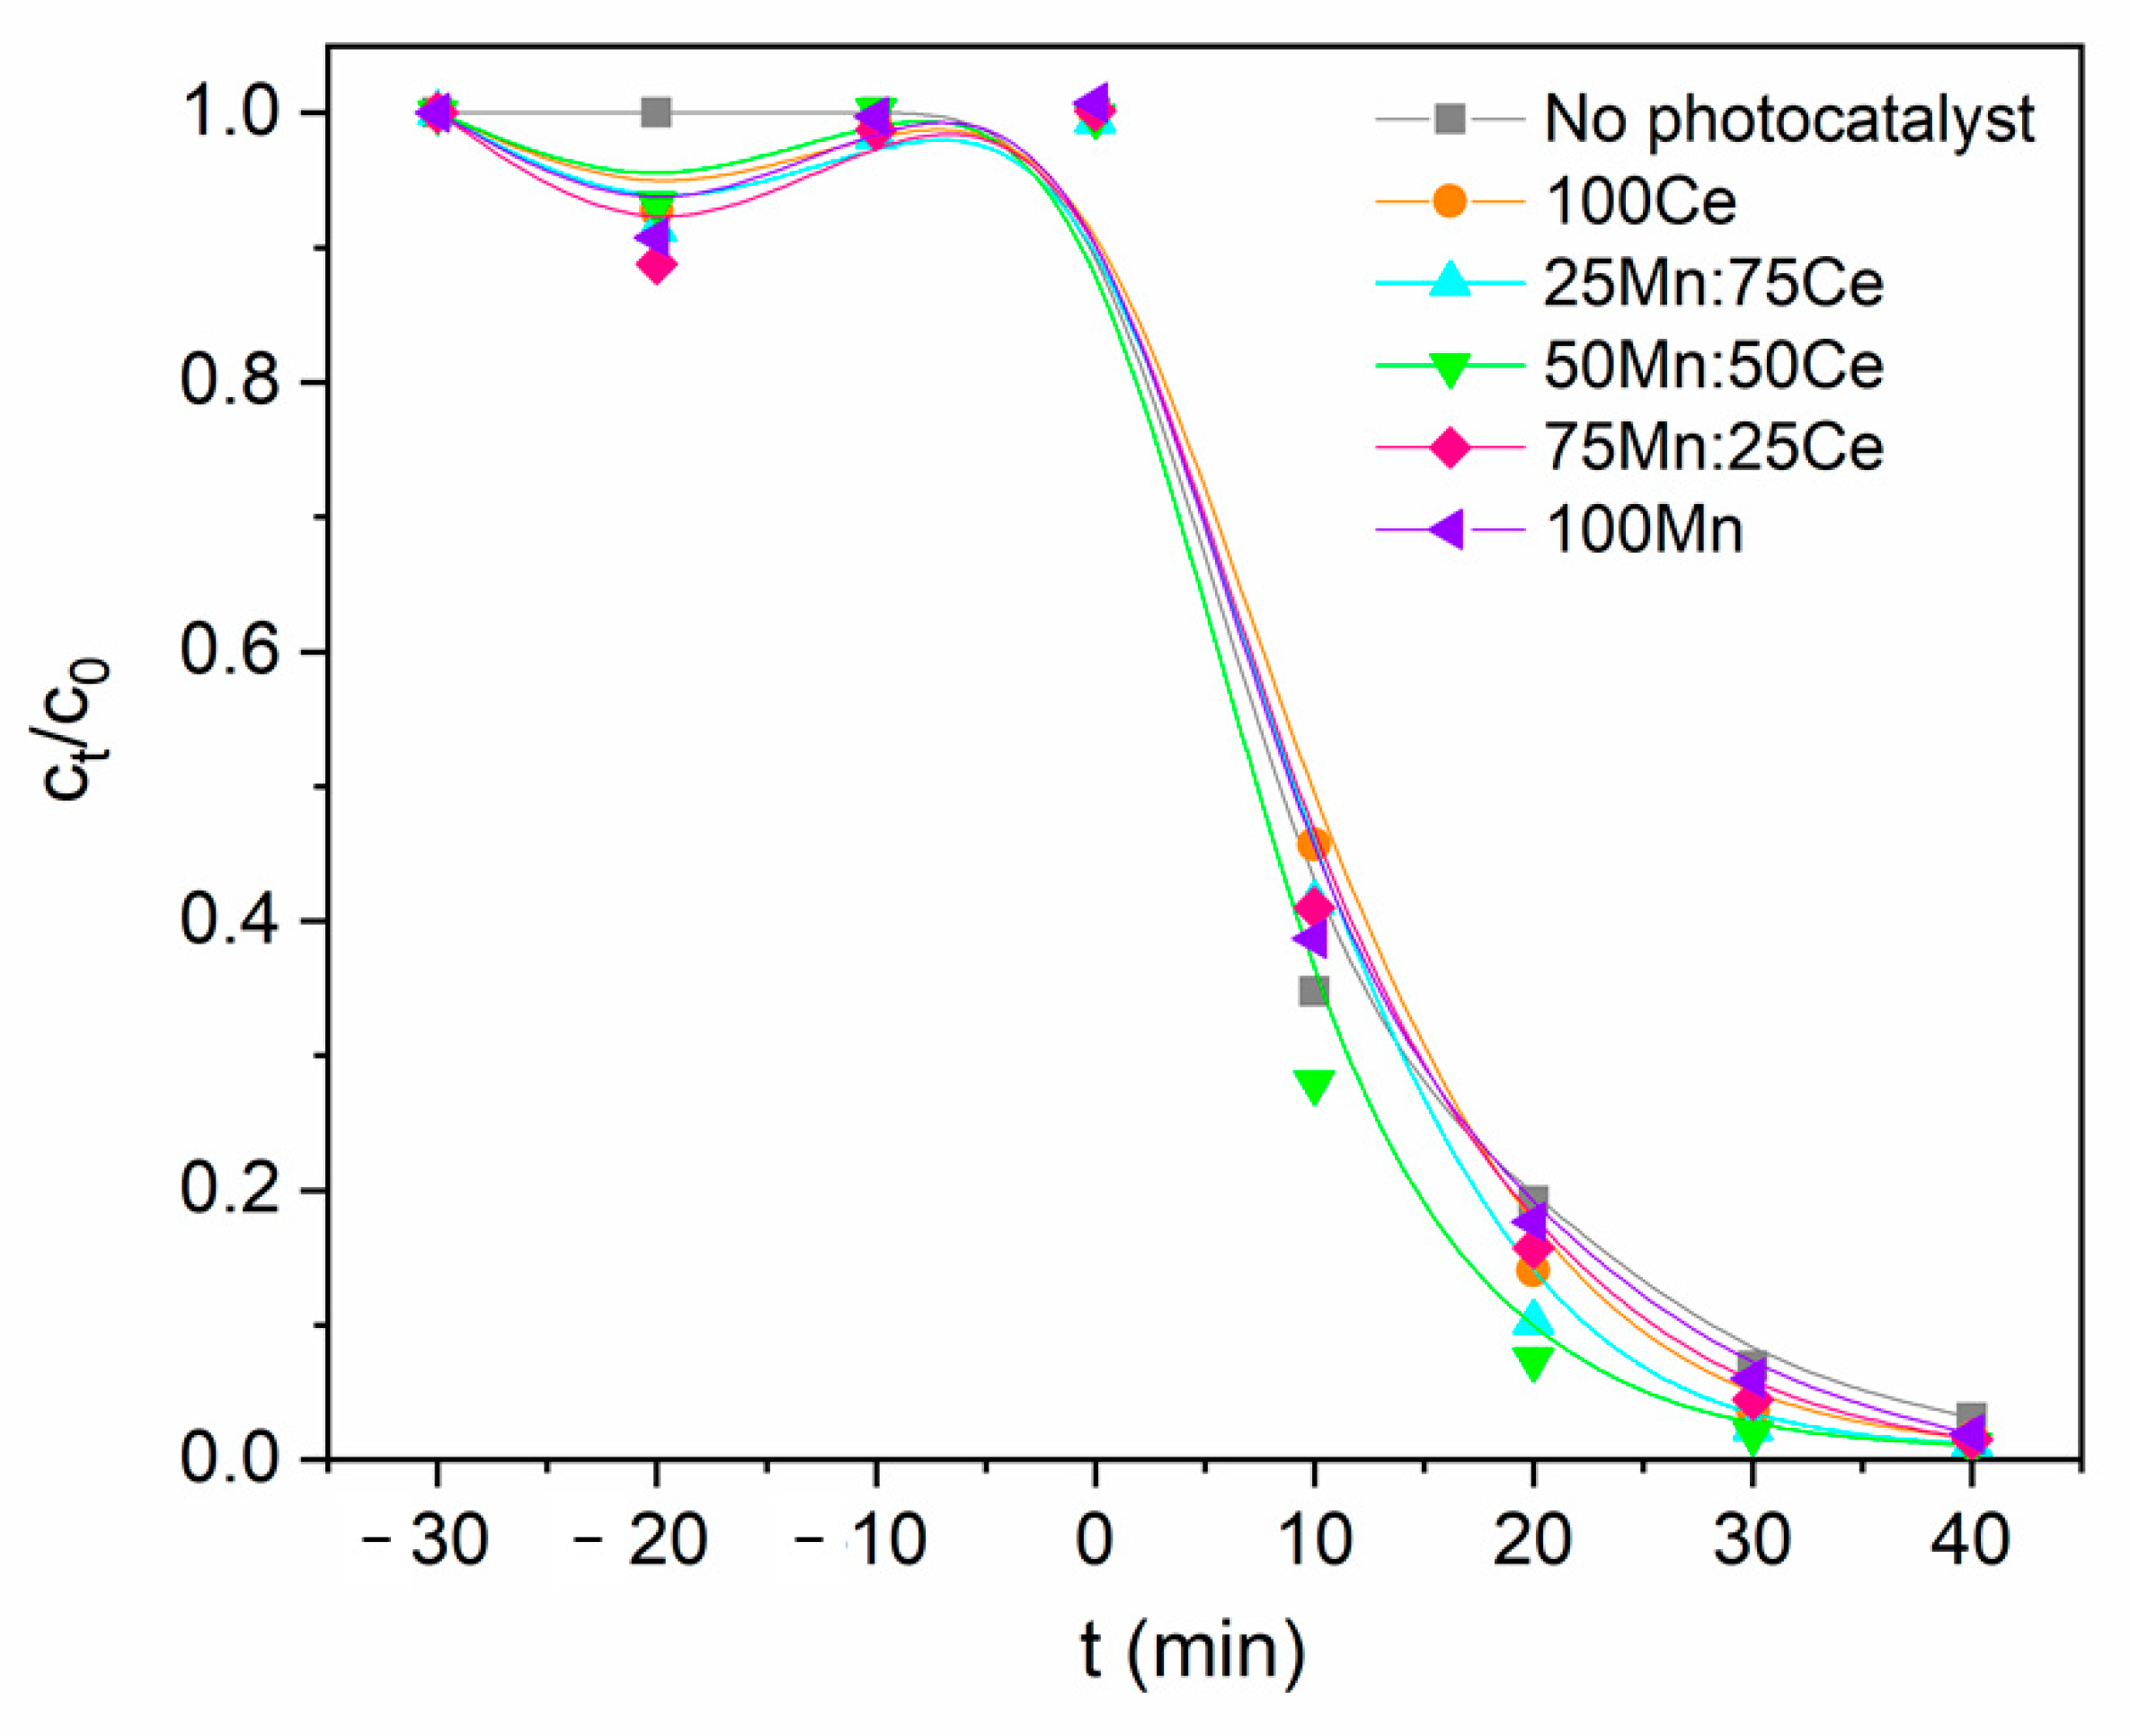
Figure 12, only negligible adsorption of Rhodamine B was observed during the 30 min dark equilibration period, similarly to the experiments performed at pH 4.3. However, after UV irradiation, the differences in photocatalytic activity between the investigated samples became much more pronounced. In addition, the degradation process proceeded faster, with almost complete Rhodamine B removal being achieved within 40 min instead of 50 min.
Figure 13 and the kinetic parameters summarized in
Table 5 show that the photodegradation of Rhodamine B at pH 7.5 can also be well described by the pseudo-first-order kinetic model. The obtained correlation coefficient values, which are close to 0.99 for all investigated systems, confirm that the model adequately describes the experimental data.
The highest photocatalytic activity was observed for the 50Mn:50Ce sample, which achieved 92.6% Rhodamine B conversion after only 20 min of irradiation, followed by the 25Mn:75Ce sample with a conversion of 89.8%. In comparison, the reference experiment without a photocatalyst reached only 80.8% conversion after the same irradiation time. Although all systems approached almost complete degradation after 40 min, the differences observed during the initial stage of the reaction clearly demonstrate the beneficial effect of the photocatalysts on the degradation rate. The improved performance observed at pH 7.5 can be explained by the change in surface charge relative to the pHpzc of the investigated material. Since the solution pH is higher than the pHpzc value, the photocatalyst surface is expected to be predominantly negatively charged, which promotes electrostatic attraction between the catalyst surface and cationic Rhodamine B molecules. This more favourable interaction promotes the adsorption of Rhodamine B molecules onto the catalyst surface and consequently facilitates their photocatalytic degradation. Among the investigated materials, the mixed samples 25Mn:75Ce and 50Mn:50Ce exhibited the highest specific surface areas and, under the investigated conditions, also benefited from favourable surface charge, which likely contributed to their superior photocatalytic performance. These results suggest that the photocatalytic performance of the investigated materials is influenced by the combined effect of surface area and surface charge rather than by either parameter alone.
The investigations on CeO
2/MnO
2 heterojunction remain scarce, and the question of charge transfer pathway is rarely addressed. In their paper on capacitance of carbon fibre paper-supported CeO
2/MnO
2, Yang et al. state that this material is type II heterojunction [
40]. However, several recent studies have pointed out that the conventional type-II model may not adequately explain charge-carrier transfer in some heterojunction systems. Consequently, the S-scheme charge-transfer mechanism has been proposed as an alternative interpretation [
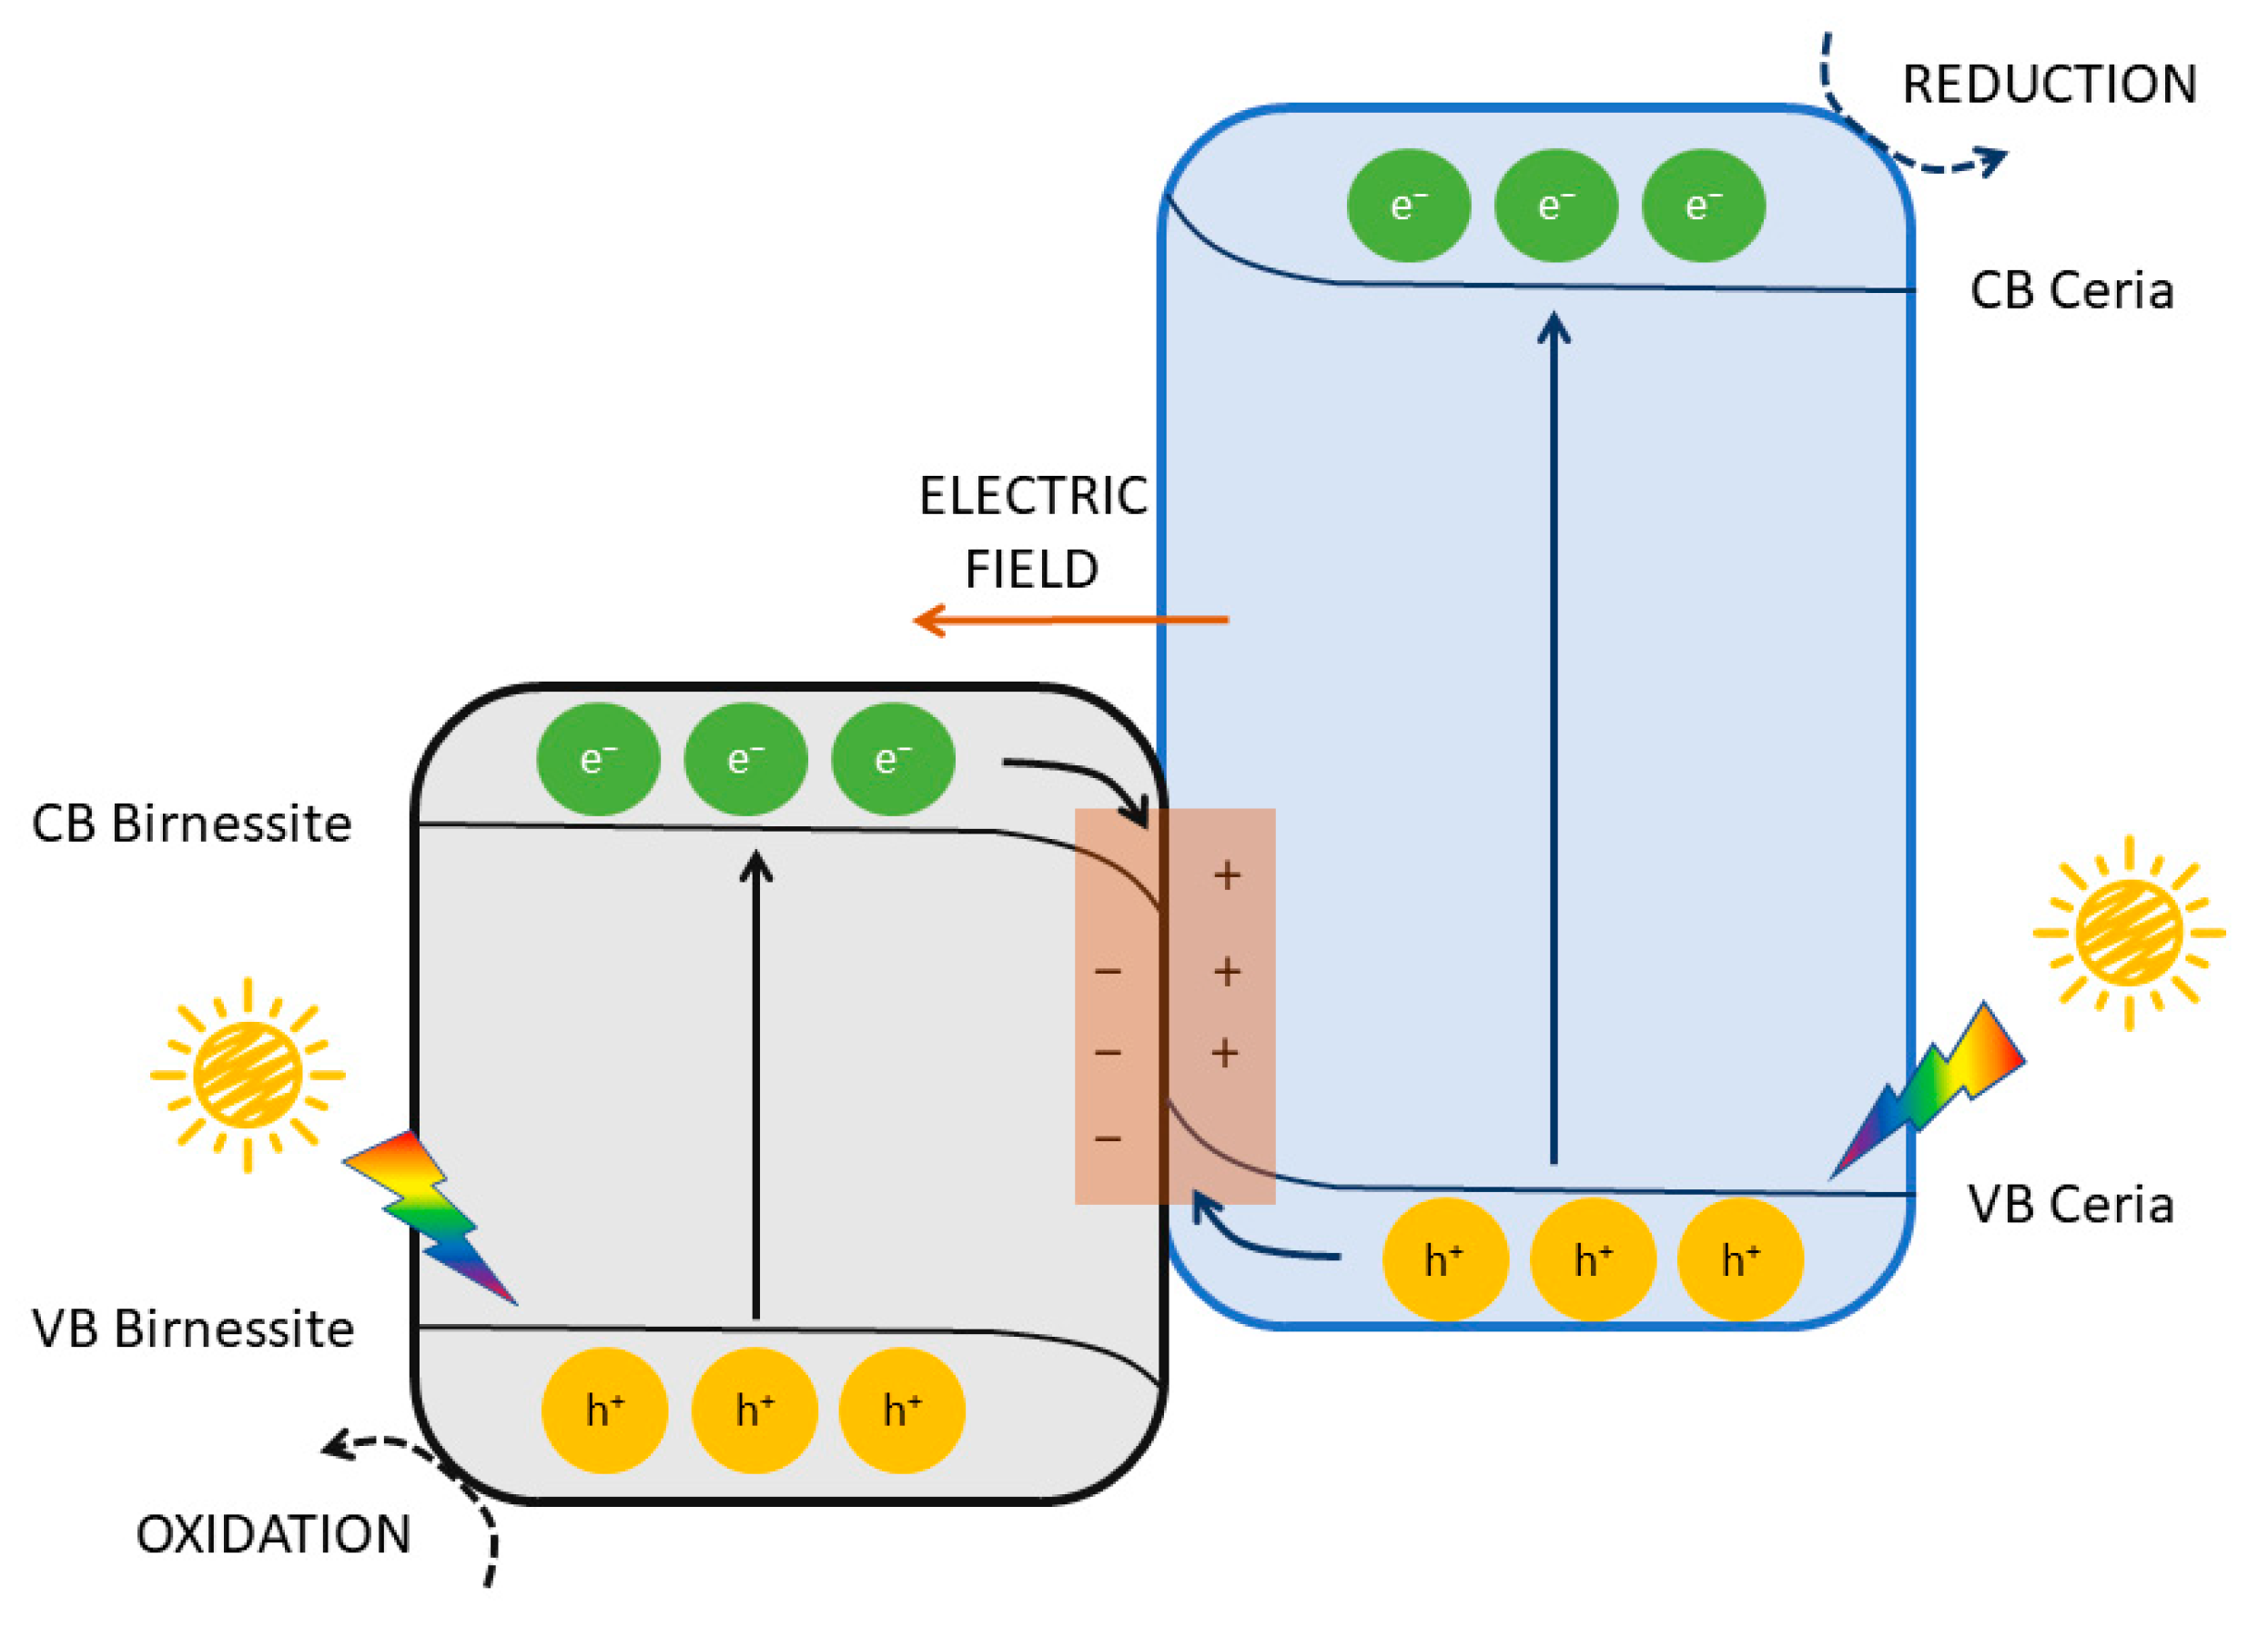
41]. Accordingly, a schematic illustration of a possible S-scheme charge-transfer pathway for the CeO
2/Na-birnessite system is presented in
Figure 14. This scheme is proposed solely as a conceptual interpretation based on the available results and relevant literature and should not be regarded as experimental confirmation of the actual charge-transfer mechanism. Because reliable numerical band-edge positions could not be determined from the available data, the revised scheme shows the proposed relative band alignment and charge-transfer pathway without assigning unsupported numerical potentials.
The structural, textural and photocatalytic results obtained in the present work suggest that the close spatial contact between the CeO2 and Na-birnessite phases may contribute to the enhanced photocatalytic performance of the mixed samples. However, the available experimental data do not provide sufficient evidence to unambiguously identify the charge-transfer pathway or to distinguish between different heterojunction mechanisms. Likewise, the present results do not allow reliable identification of the reactive oxygen species responsible for Rhodamine B degradation. A detailed understanding of the photocatalytic mechanism would require additional electrochemical and photoelectrochemical characterization, which was beyond the scope of the present study. Therefore, the nature of the CeO2/Na-birnessite shared boundary, charge transfer pathway and the resulting redox capabilities of the prepared material will be addressed in future research.




 ,
,