1. Introduction
Groundwater supports urban and rural water supply, agricultural irrigation and ecosystem functioning, making its quality central to regional water security and public health [
1,
2]. Nitrate (NO
3−) is among the most widespread contaminants in shallow groundwater and is commonly associated with fertilizer application, livestock manure, sewage leakage and urban expansion [
3,
4,
5,
6]. Its high mobility facilitates transport to aquifers through rainfall infiltration and irrigation return flow, producing delayed and spatially heterogeneous contamination [
5,
7,
8]. The World Health Organization recommends a drinking-water nitrate limit of 50 mg/L [
9], and prolonged exposure may threaten vulnerable populations, particularly children. Groundwater nitrate patterns are shaped by interacting controls, including nitrogen loading, land use, soil properties, groundwater depth, recharge and hydrogeological setting [
7,
10,
11,
12].
Across the North China Plain and adjacent regions, intensive agriculture, rapid urbanisation and long-term groundwater abstraction have substantially altered shallow groundwater systems. Groundwater nitrate has consequently become a major regional water-quality concern [
2,
13,
14]. However, sparse monitoring networks provide only discrete observations and cannot fully resolve continuous patterns of exceedance risk [
15,
16]. Conventional interpolation relies mainly on spatial autocorrelation and uses environmental information only indirectly. Vulnerability frameworks such as DRASTIC identify pollution-prone areas, but fixed weights and predefined relationships limit their representation of nonlinear controls and interactions [
17,
18]. Machine learning offers an alternative by integrating multi-source environmental predictors to estimate spatially explicit nitrate exceedance probability [
15,
19,
20,
21,
22,
23].
Despite its promise, machine learning for regional nitrate assessment requires careful evaluation of spatial transferability and interpretability. Random data partitioning can place neighbouring samples in both training and test sets, inflating apparent performance in unsampled areas [
24,
25]. Spatial cross-validation offers a more rigorous assessment under spatially independent conditions [
24,
25]. Machine-learning models also identify statistical associations rather than direct causal mechanisms or contaminant sources. Explainable methods such as SHAP quantify the contribution and response direction of individual predictors, thereby improving model transparency [
26]. However, SHAP patterns cannot replace isotopic tracers, source inventories or hydrogeochemical evidence for source attribution [
5,
27,
28,
29].
Groundwater nitrate assessment should extend beyond exceedance prediction to consider concentration-derived exposure concern. Non-carcinogenic risk frameworks estimate hazard quotients (HQs) for different population groups using nitrate concentrations and drinking-water exposure parameters [
30,
31,
32]. Children are generally more susceptible because of their lower body weight and greater water intake per unit body mass [
33,
34]. Exceedance probability and HQ are related assessment products rather than independent risk dimensions. Exceedance probability provides an early-warning estimate of where NO
3− is likely to exceed 50 mg/L, whereas child HQ identifies areas where interpolated nitrate concentrations imply greater exposure concern for a vulnerable population. A probability–HQ matrix can therefore be used as a transparent management-classification tool to distinguish areas where these two signals coincide or diverge, without combining them into a single additive composite index [
35,
36].
Previous studies have made substantial progress in groundwater nitrate assessment from several perspectives. Machine-learning models have been increasingly used to predict nitrate concentrations or identify elevated nitrate risk by integrating land use, soil, climate, topographic and hydrogeological predictors [
19,
20,
21,
22,
23]. Groundwater vulnerability and pollution-risk mapping have also helped identify areas susceptible to contamination by combining hydrogeological sensitivity and pollution pressure [
17,
18]. In parallel, health risk assessment studies have estimated non-carcinogenic risks for different population groups based on measured or interpolated nitrate concentrations and exposure parameters [
30,
31,
32,
33,
34]. More recent studies have further explored probabilistic risk mapping and management-oriented groundwater zoning [
35,
36]. However, these advances still leave several methodological issues relevant to regional early-warning management. First, many nitrate prediction studies focus mainly on concentration estimation or overall predictive accuracy, whereas spatially explicit exceedance probability is less often used as a direct early-warning product. Second, model validation is still often based on random partitioning, which may overestimate predictive performance when groundwater samples are spatially clustered; therefore, spatial transferability requires more explicit evaluation. Third, health risk assessments are commonly derived from measured or interpolated nitrate concentrations, but their relationship with machine-learning-derived exceedance probability is not always clearly represented in management zoning. To address these gaps, the methodological innovation lies in a transparent, non-additive probability–HQ matrix that integrates spatially validated, interpretable nitrate-exceedance probability modelling with concentration-derived child HQ. The matrix preserves the distinct management meanings of exceedance likelihood and exposure concern, revealing where the two signals coincide or diverge. These patterns support the delineation of general-protection, exceedance-warning, concentration-verification, and priority-intervention zones for targeted management. We further characterise the uncertainty associated with the resulting zones by quantifying variability in predicted exceedance probabilities, kriging-derived HQ uncertainty, and sensitivity to the probability threshold and the HQ = 1 classification criterion. We apply the framework to 157 shallow groundwater samples and 14 environmental predictors from Handan City, providing a transparent basis for screening, verification, and spatially differentiated groundwater nitrate management.
2. Materials and Methods
2.1. Study Area
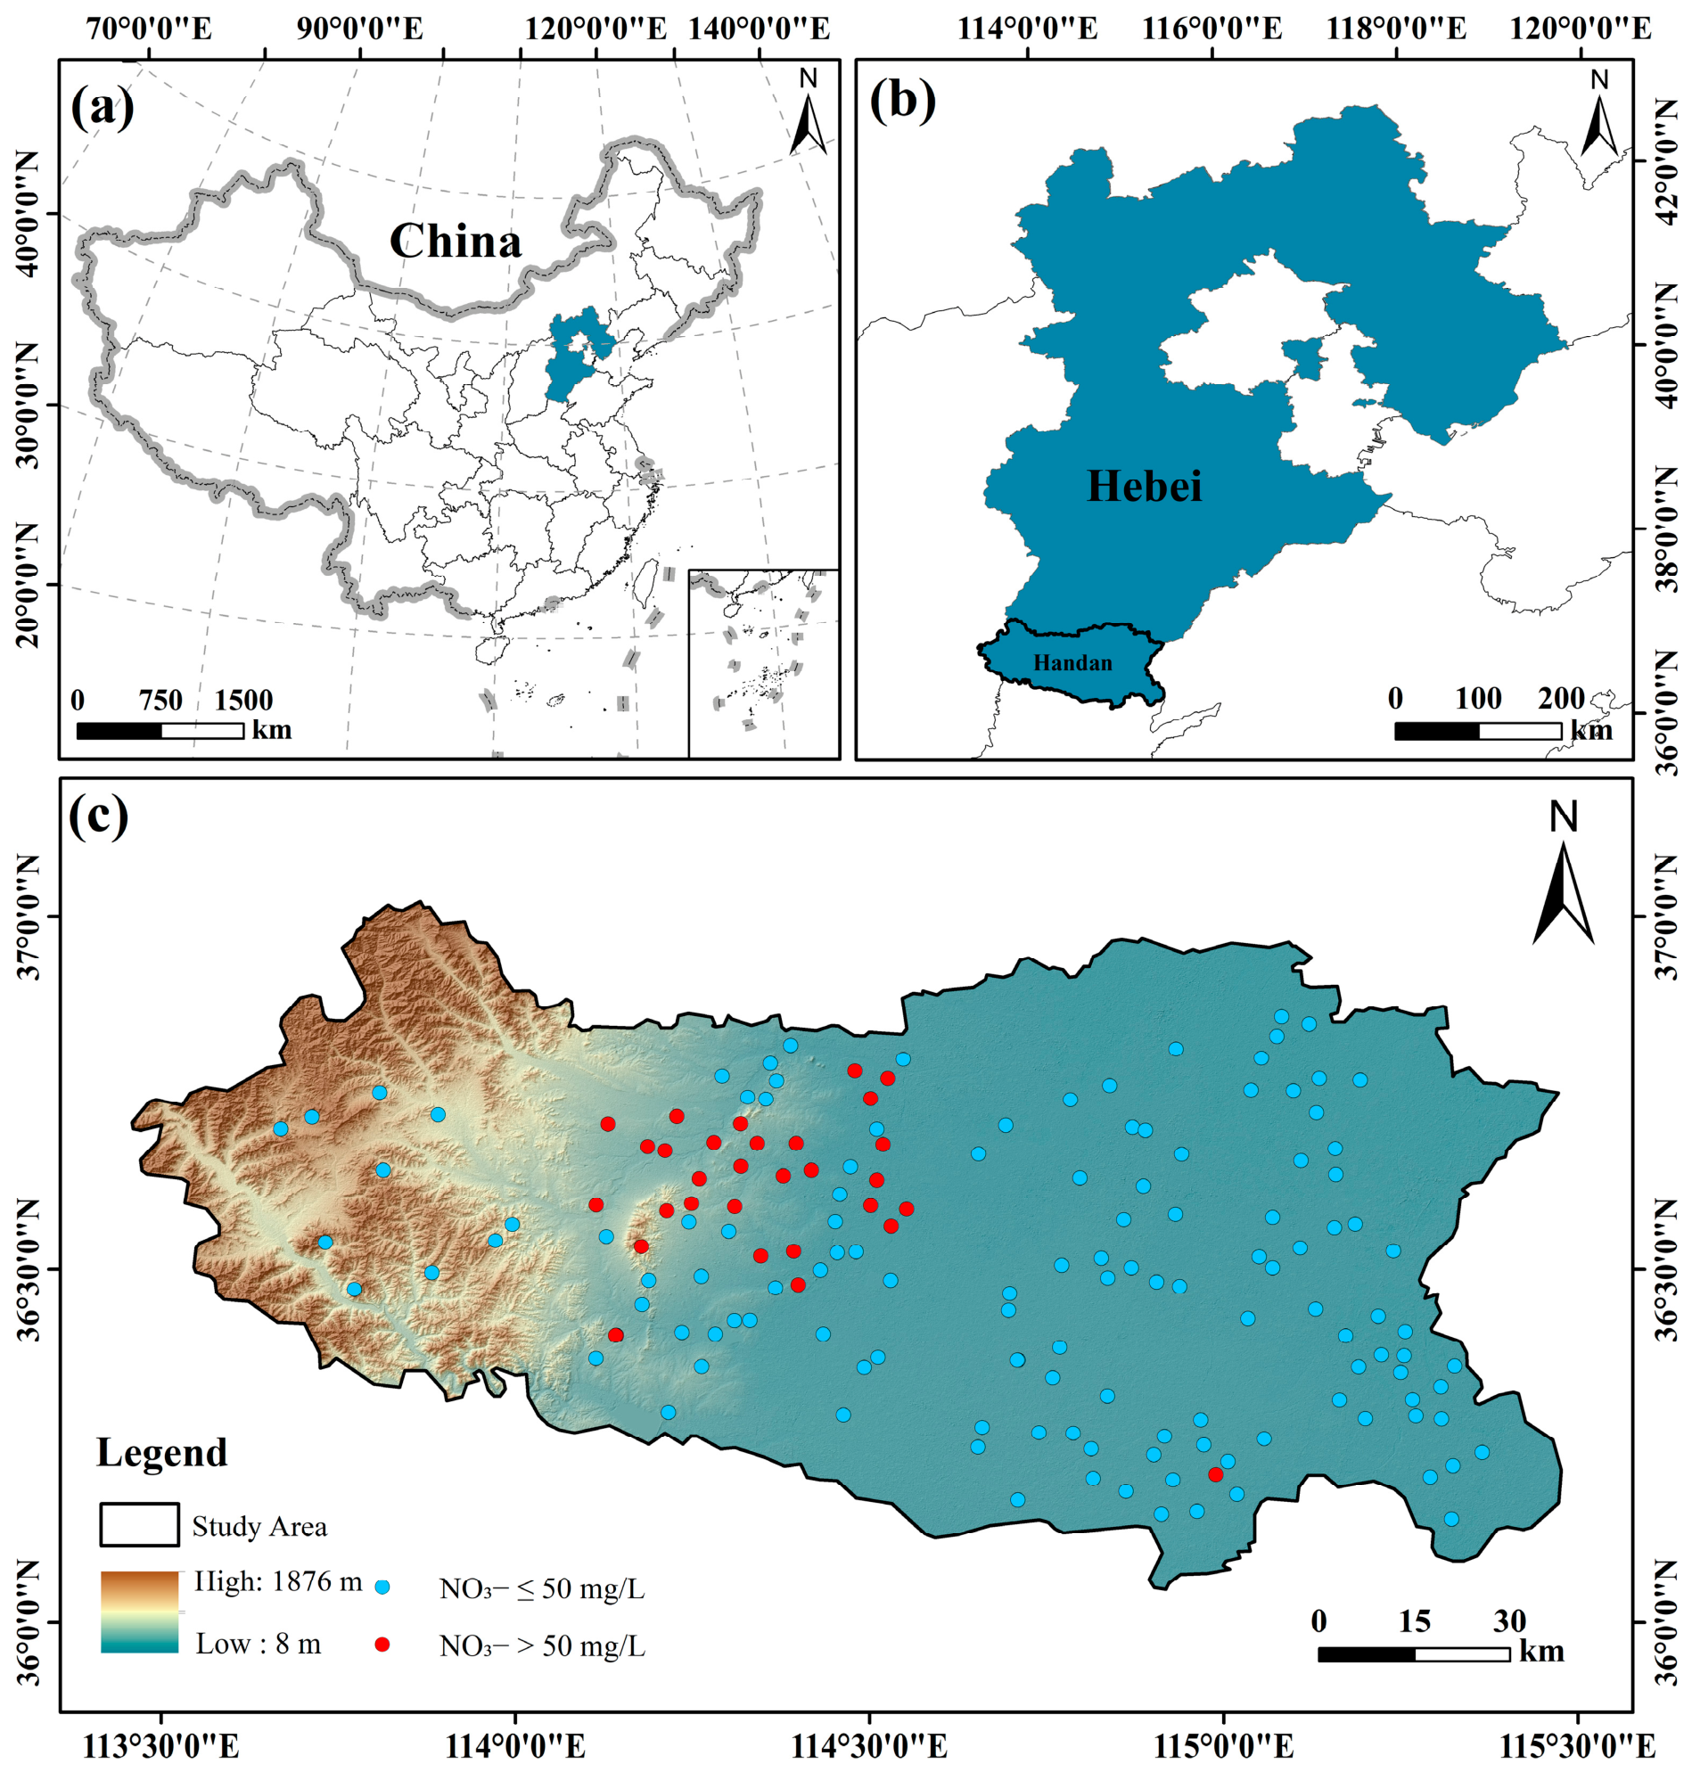
Handan City is located in southern Hebei Province, where the eastern foothills of the Taihang Mountains grade into the North China Plain. Elevation generally decreases from west to east, accompanied by a transition from bedrock and karst-fissure groundwater systems in the western hills to Quaternary porous aquifers in the central and eastern plains. In the plain area, shallow groundwater occurs mainly within alluvial sediments of silt, silty clay and sand, and is closely linked to seasonal rainfall, river leakage and irrigation return flow. Deeper groundwater is more confined and is replenished more slowly through lateral flow and leakage between aquifer layers. Groundwater flow is broadly eastward to northeastward. The region has a warm-temperate continental monsoon climate and receives approximately 500–600 mm of precipitation annually. More than 60% of precipitation falls from June to August, while winters are comparatively dry. Concentrated summer rainfall can promote nitrogen leaching into shallow aquifers [
10,
12], whereas strong evapotranspiration may favour nitrate accumulation within the soil–groundwater continuum. Intensive agriculture, urban development and dense human activity further increase nitrogen inputs through fertilizer use, irrigation return flow, domestic sewage and land development [
5,
10,
14]. The location of the study area and groundwater sampling sites is shown in
Figure 1.
2.2. Data Sources and Environmental Predictors
The core dataset comprised 157 shallow groundwater samples collected across Handan City in 2023. Sampling locations covered diverse geomorphic, hydrogeological and anthropogenic settings to represent spatial variation in groundwater NO
3−. Exceedance was defined as NO
3− > 50 mg/L [
9], and samples were coded as 1 for exceedance and 0 otherwise. Thirty-one samples exceeded the threshold, giving an exceedance rate of 19.7%. To prevent target leakage, NO
3− concentration was used only to define exceedance labels and estimate health risk. It was excluded from the machine-learning predictor set.
We selected 14 environmental predictors based on both the known hydrogeochemical controls on groundwater nitrate and variables commonly used in previous nitrate-prediction and groundwater-vulnerability studies [
7,
10,
11,
12,
17,
18,
19,
20,
21,
22,
23]. The predictors were chosen to represent four key processes affecting nitrate occurrence in shallow groundwater: nitrogen input, leaching and transport, dilution or enrichment, and hydrogeological susceptibility. Selection also considered spatial coverage, data quality, representativeness, limited redundancy and availability at the regional scale. Soil predictors included clay content, pH, bulk density and cation-exchange capacity, which influence infiltration, solute transport and nitrogen transformation. Human-activity predictors comprised population density and built-up, cropland and vegetation fractions, representing domestic and agricultural nitrogen inputs and land-use pressure. Climate variables included mean annual precipitation, potential evapotranspiration and temperature, reflecting recharge, evaporative concentration and hydrothermal conditions. Elevation, slope and groundwater table depth represented topographic and hydrogeological controls on runoff, infiltration, vadose-zone thickness and aquifer susceptibility.
Multi-year or long-term averages were used for soil clay content, pH, bulk density, cation-exchange capacity, precipitation, potential evapotranspiration, temperature and groundwater table depth. Elevation and slope were treated as static terrain attributes. Population density from 2022 represented human activity near the sampling period, and 2021 land-cover data were used to derive built-up, cropland and vegetation fractions.
Table 1 summarises the data sources, spatial resolutions and temporal coverage.
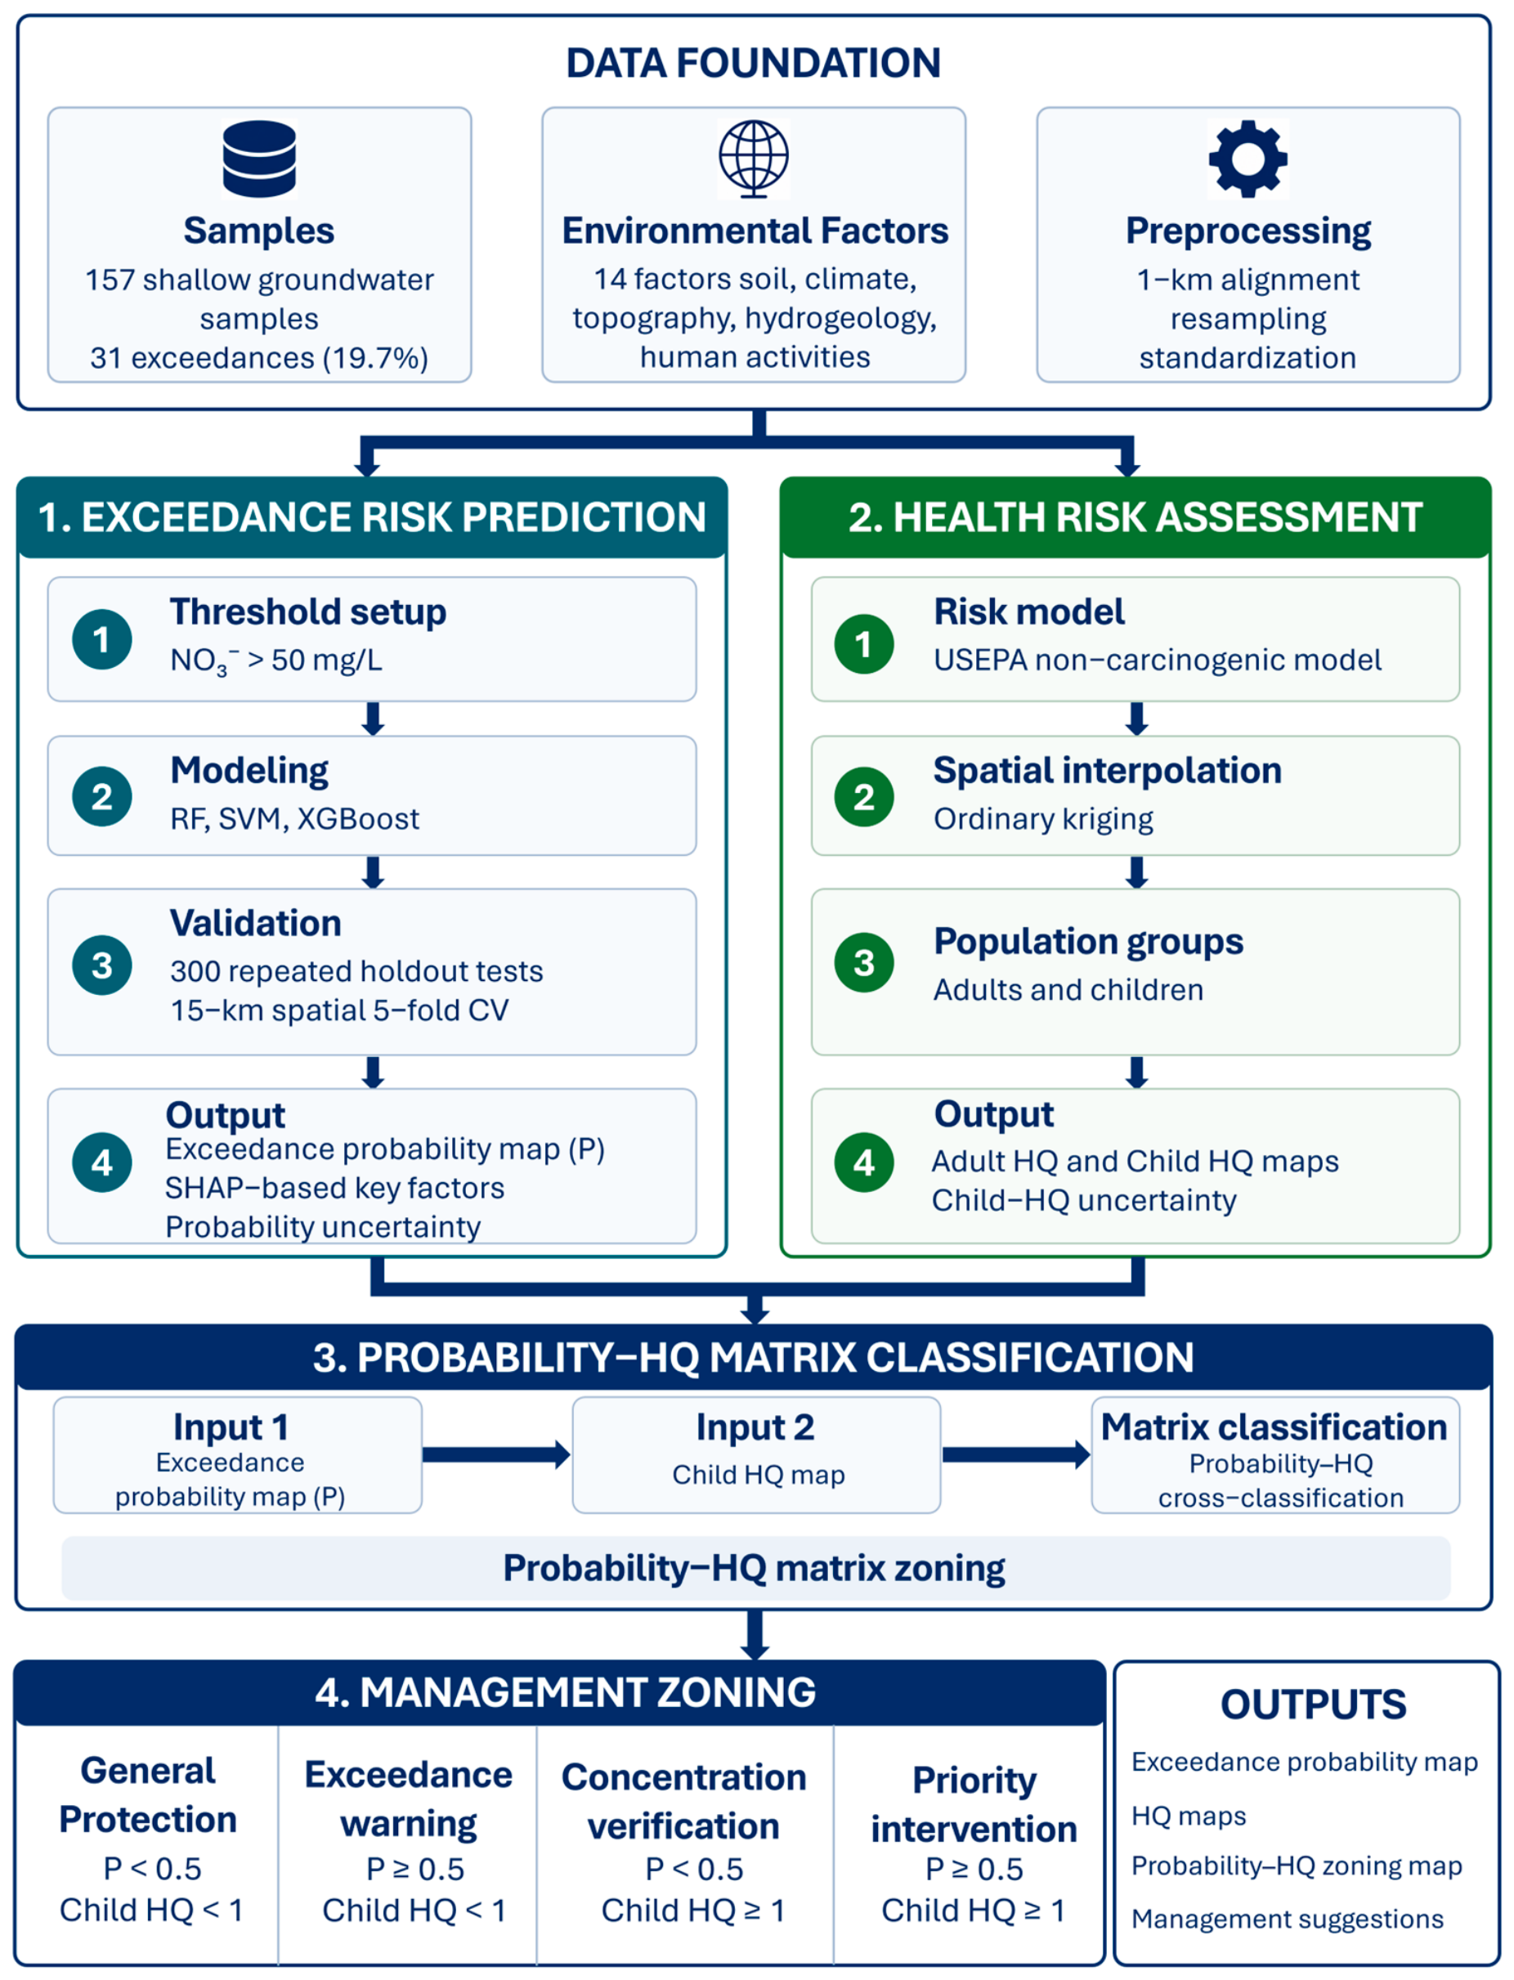
Figure 2 summarises the analytical workflow. We first derived NO
3− exceedance labels from the 2023 groundwater samples and extracted multi-source environmental predictors. Machine-learning models were then used to map nitrate exceedance probability, and spatial cross-validation was applied to assess model transferability. SHAP analysis was used to interpret the principal environmental responses captured by the model. Finally, child HQ derived from interpolated NO
3− concentrations was cross-classified with exceedance probability using a probability–HQ matrix to delineate management-oriented groundwater nitrate risk zones.
2.3. Data Preprocessing and Site-Specific Predictor Extraction
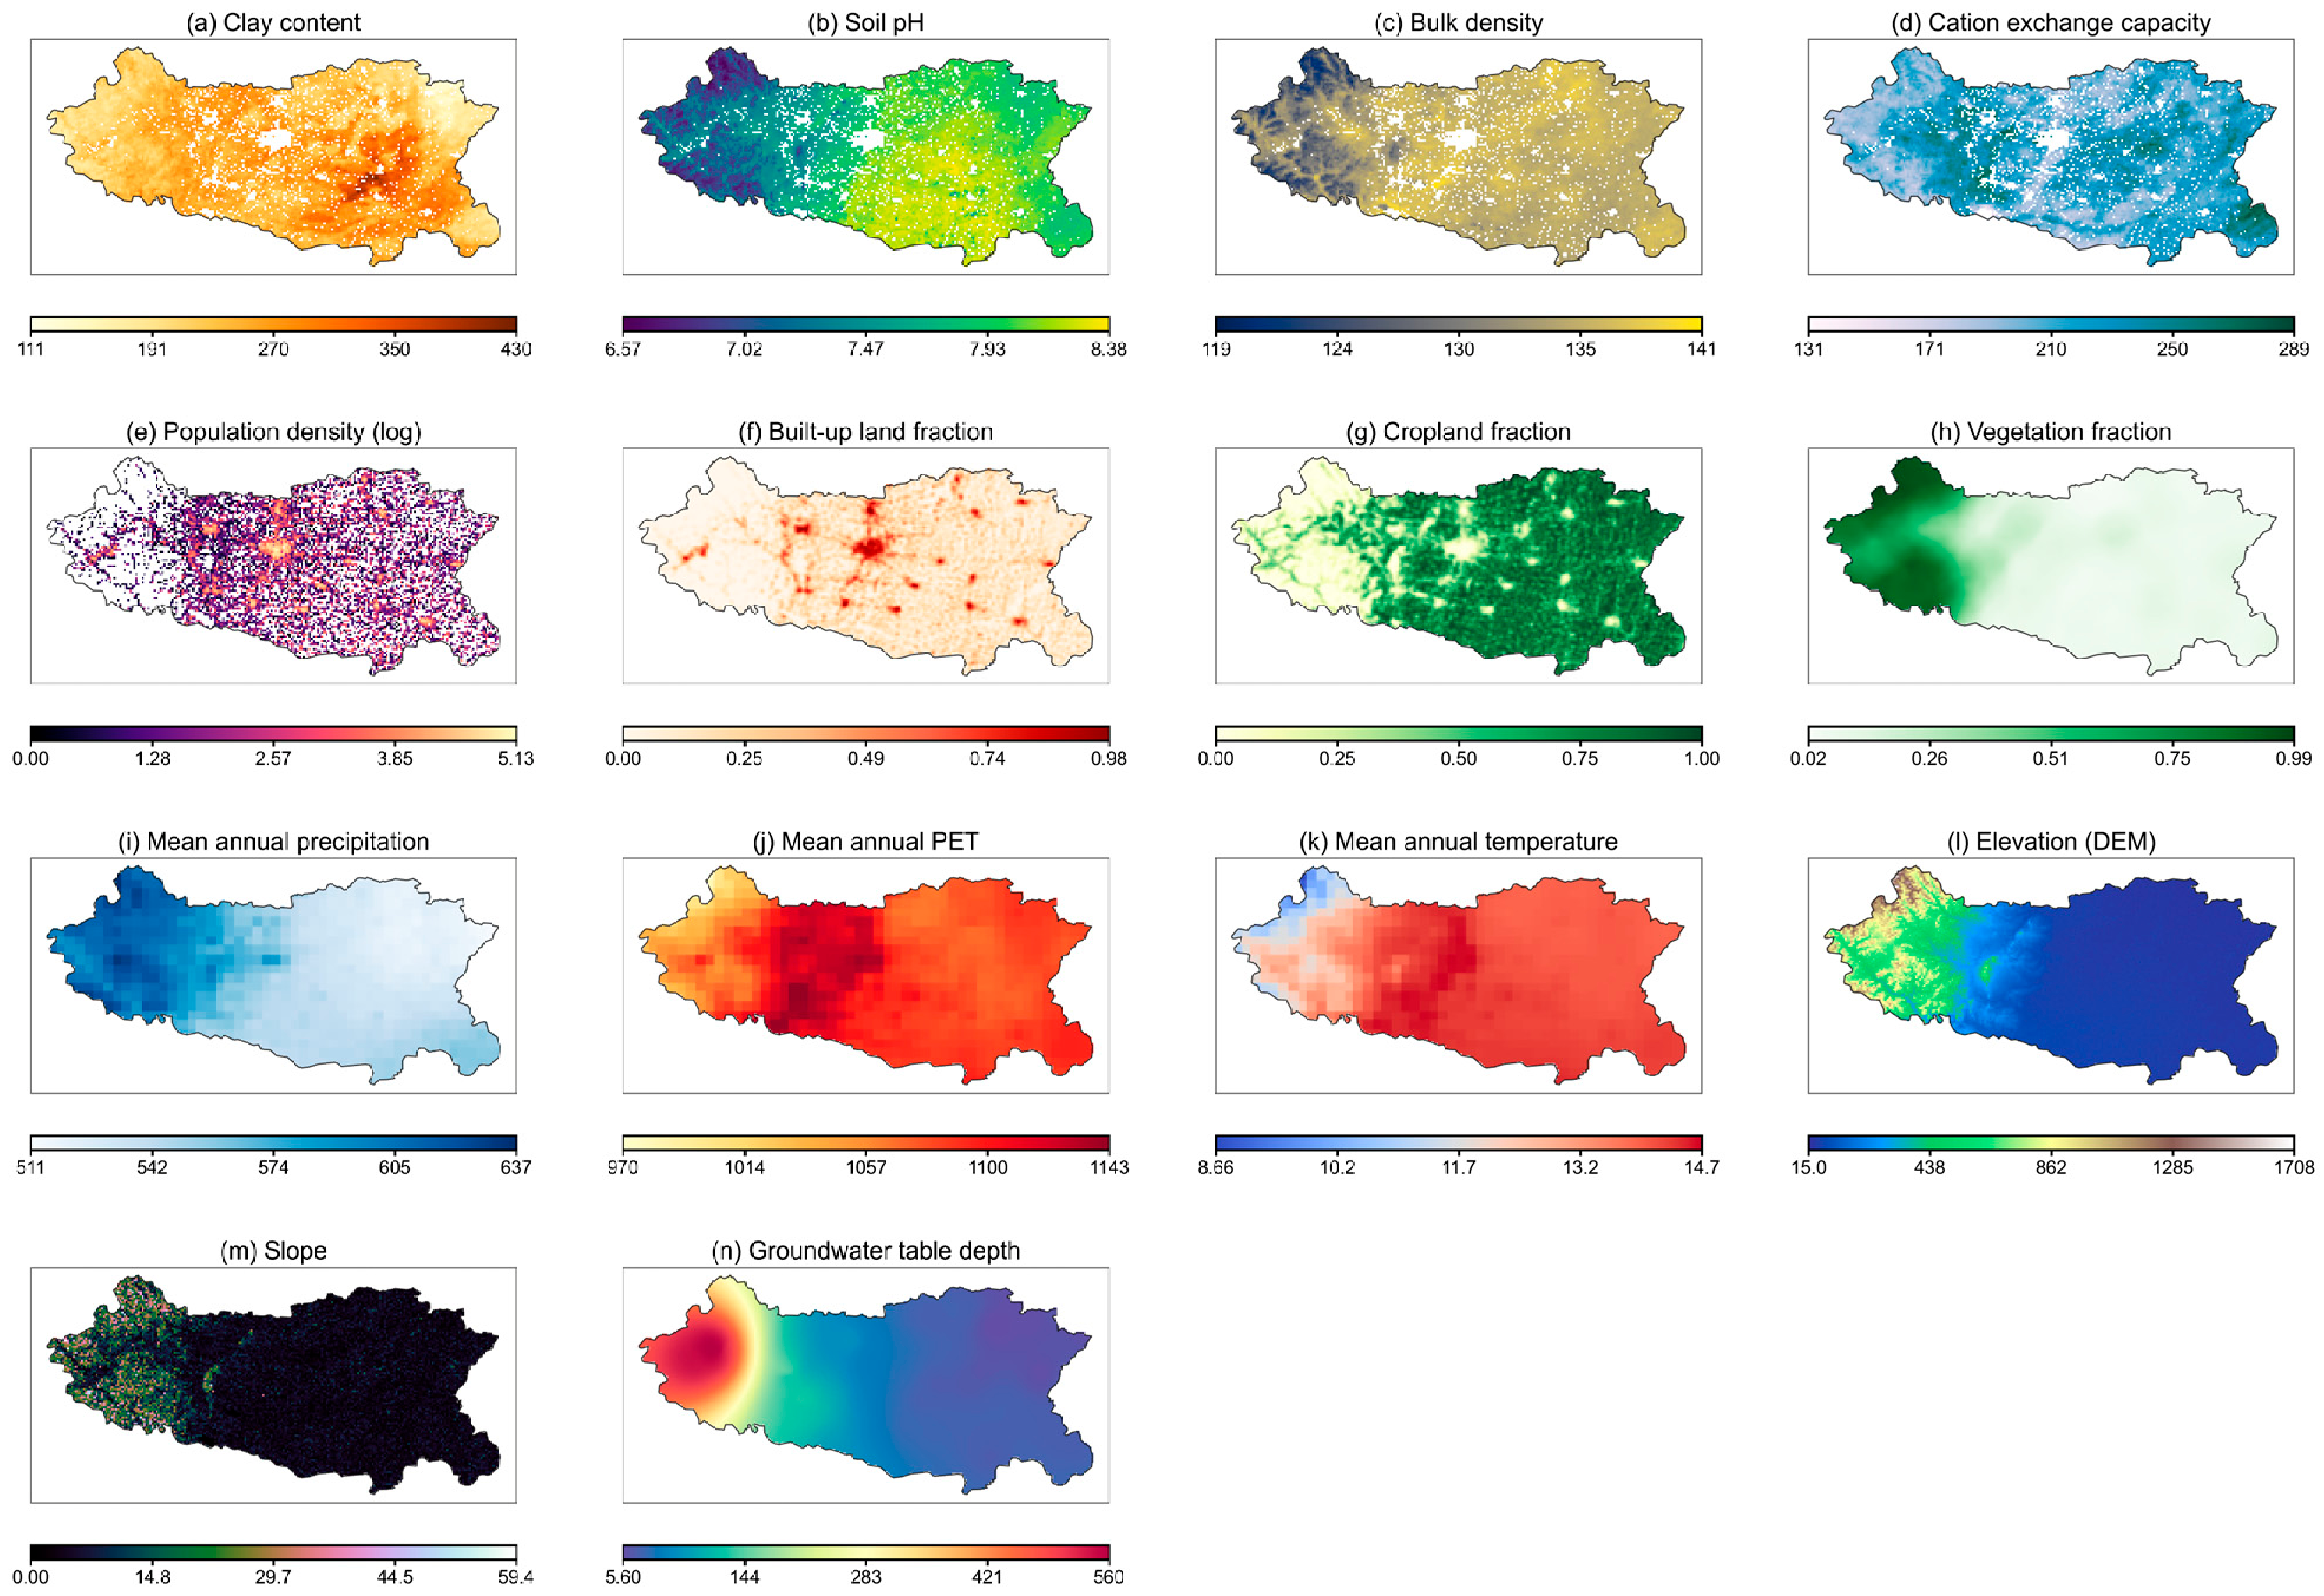
Before model development, groundwater samples, environmental predictors and land-cover data were harmonised within a common spatial framework. All datasets were referenced to GCS_WGS_1984, clipped to the study area, resampled to a common resolution and aligned to a consistent raster grid. Continuous rasters were resampled to an approximately 1 km analytical scale using bilinear interpolation. Categorical land-cover data were not interpolated. Instead, class proportions were calculated within local buffers around sampling sites to avoid artificial mixing of categorical information. The processed raster layers for the 14 environmental predictors are provided in
Figure A1.
Continuous predictors describing soil, climate, topography and groundwater table depth were extracted at each sampling location. Built-up, cropland and vegetation fractions were calculated from 2021 land-cover data within a 1000 m circular buffer around each site. Population density was extracted from the 2022 raster and log-transformed to reduce skewness and the influence of extreme values. The final site-level dataset contained sample identifiers, NO3− concentrations, binary exceedance labels and 14 environmental predictors.
After extraction, variables were checked for unit consistency, plausible ranges and completeness. The few missing predictor values were imputed using neighbourhood medians, allowing all 157 samples to be retained. Continuous predictors were screened for outliers, adjusted for extreme values where necessary and standardised using Z-score normalisation. Random forest, SVM and XGBoost were trained and evaluated with the same processed predictor set to ensure comparability.
All spatial preprocessing, statistical analysis, machine-learning modelling and visualization were performed using Python version 3.12.2 with pandas version 2.2.2, NumPy version 1.26.4, scikit-learn version 1.3.2, xgboost version 2.0.3, imbalanced-learn version 0.11.0, shap version 0.47.2 and matplotlib version 3.9.0rc2. Spatial mapping and raster processing were conducted using ArcGIS Desktop version 10.8.
2.4. Machine-Learning Modelling, Spatial Prediction and SHAP Interpretation
2.4.1. Model Development and Performance Assessment
Groundwater nitrate exceedance was formulated as a binary classification problem. The 14 environmental predictors served as model inputs, and NO
3− exceedance above 50 mg/L was the response. The resulting probability,
P, represented the likelihood of nitrate exceedance at each location. Three widely used classifiers were evaluated: random forest (RF), support vector machine (SVM) and extreme gradient boosting (XGBoost) [
43,
44,
45]. Samples were repeatedly divided into training and test sets at an 80:20 ratio using stratified random sampling. Three hundred repetitions reduced dependence on any single split. Within each repetition, hyperparameters were optimised by random search with stratified five-fold cross-validation using only the training data [
46]. Performance and stability were summarised as the mean and standard deviation across the 300 independent test evaluations.
Because exceedance samples were relatively scarce, the synthetic minority oversampling technique (SMOTE) was applied during training to improve sensitivity to the minority class [
47]. To prevent data leakage, SMOTE was restricted to the training set or to training folds within cross-validation. Test sets and validation folds retained their original class distributions. Performance was assessed using ROC-AUC, accuracy, precision, recall and F1-score [
48]. Model selection considered both overall discrimination and the early-warning objective of limiting false negatives. Metrics were reported at probability thresholds of 0.5 and 0.7 to compare conventional and high-confidence decision settings.
2.4.2. Spatial Cross-Validation and Exceedance-Probability Mapping
Spatial transferability was evaluated using five-fold spatial block cross-validation with 15 km × 15 km grid-based groups [
24,
25]. The study area was first divided into regular spatial blocks, and each groundwater sample was assigned to a block according to its geographic coordinates. Blocks, rather than individual samples, were then allocated to five folds. In each fold, samples located in the held-out blocks were used for validation, whereas samples in the remaining blocks were used for model training and hyperparameter optimisation. SMOTE was applied only to the training samples within each fold and was not applied to the held-out validation samples.
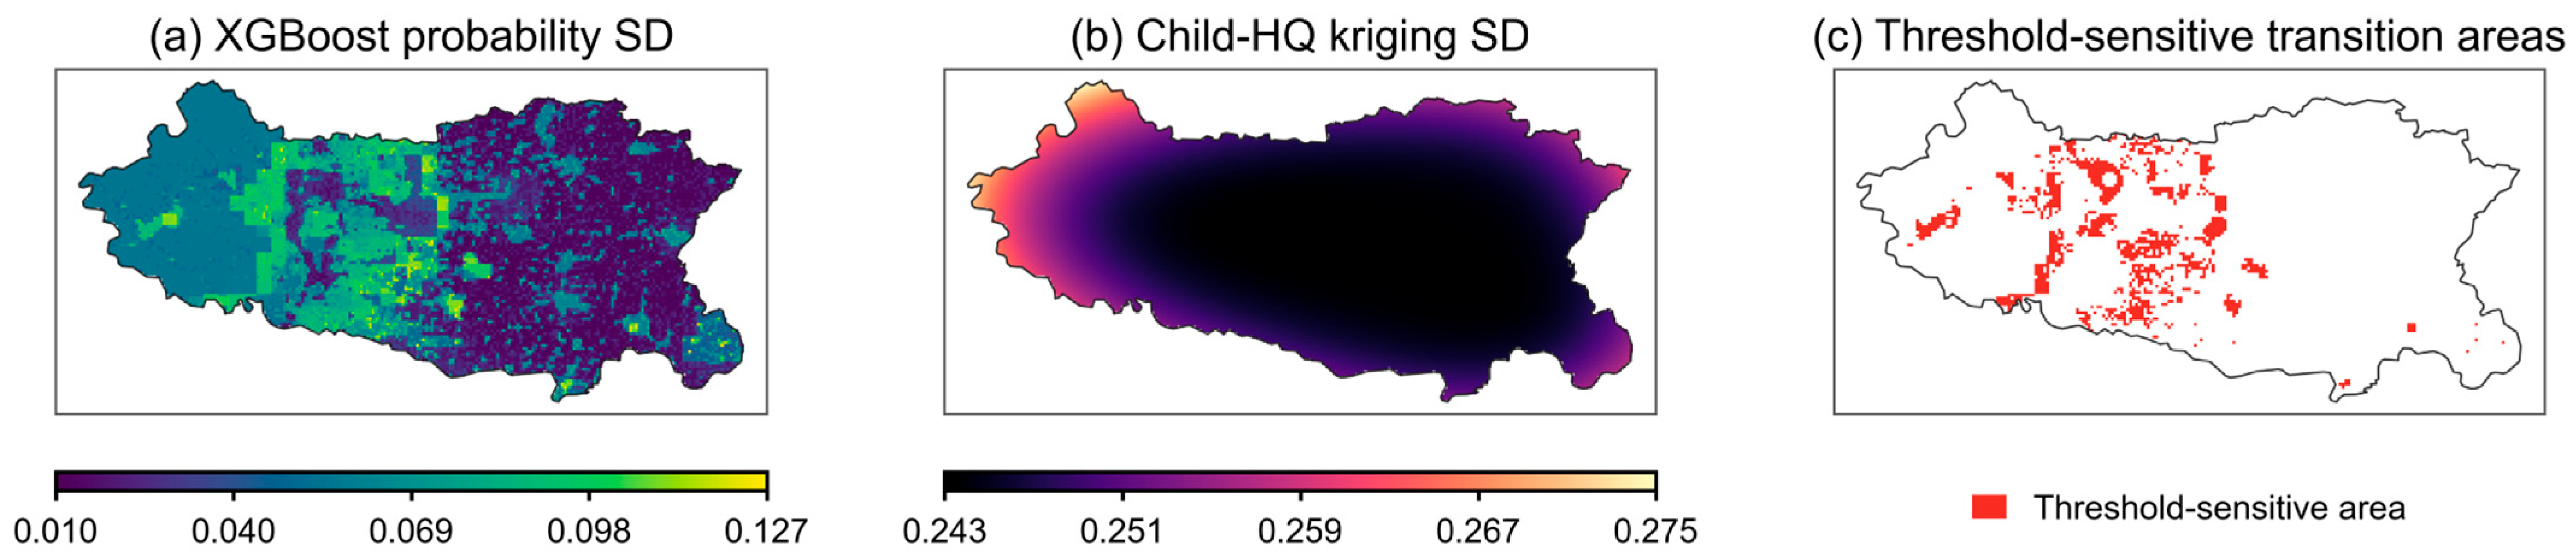
For spatial prediction, the classifier retained after model evaluation was retrained in 300 repeated runs and applied to the full predictor raster stack. In each run, the model was trained using the available labelled groundwater samples and then used to predict nitrate exceedance probability for each raster pixel. The pixel-wise mean probability from the 300 runs was used as the final exceedance-probability map, while the pixel-wise standard deviation was used as a supplementary prediction-variability layer.
2.4.3. SHAP-Based Model Interpretation
SHAP analysis was applied to the final spatial prediction model to improve interpretability. Based on game theory, SHAP decomposes a model output into predictor-level contributions [
26]. It therefore quantifies how individual environmental variables influence the predicted probability of nitrate exceedance.
Mean absolute SHAP values quantified the overall contribution of each predictor and identified the variables most influential to model discrimination. Predictor values were also examined against their SHAP values to assess response direction and nonlinearity. These analyses describe the environmental patterns used by the model to distinguish potential nitrate exceedance. Because several predictors were spatially structured and potentially collinear, SHAP results were interpreted only as model-response patterns rather than evidence of independent causal drivers.
2.5. Health Risk Assessment and Probability–HQ Matrix Construction
2.5.1. Health Risk Assessment
The USEPA non-carcinogenic risk framework was used to estimate hazard quotients (HQs) for adults and children exposed to groundwater NO
3− through drinking-water ingestion [
30,
31,
32]. The average daily dose (ADD) was calculated from nitrate concentration, water intake, exposure frequency, exposure duration, body weight and averaging time:
where
denotes the average daily dose, mg/(kg·d);
is nitrate concentration expressed as NO
3−, mg/L. To maintain unit consistency, both nitrate concentration and the oral reference dose were expressed on a nitrate-ion basis. Measured NO
3− concentrations were therefore used directly for HQ calculation, and the RfD was set to 7.09 mg NO
3−/(kg·d), equivalent to 1.6 mg NO
3−-N/(kg·d).
is daily drinking-water intake, L/d;
is exposure frequency, d/a;
is exposure duration, a;
is average body weight, kg; and
is averaging time, d.
The non-carcinogenic hazard quotient (HQ) was then calculated as follows:
where
denotes the oral reference dose for nitrate, mg/(kg·d). An HQ value greater than 1 indicates a potential non-carcinogenic health risk [
30,
32]. Separate exposure parameters were assigned to adults and children to account for differences in water intake, body weight and exposure duration. Given their higher water intake per unit of body mass and greater susceptibility to environmental exposure, children were considered the priority vulnerable population in assessing groundwater nitrate health risk [
33,
34]. Parameter values are summarized in
Table 2.
Sample NO
3− concentrations were interpolated by ordinary kriging to produce a continuous regional concentration surface [
34,
50]. Given the right-skewed distribution of NO
3− concentrations, experimental semivariograms were carefully examined before interpolation. Spherical, exponential and Gaussian variogram models were compared, and the final model was selected based on leave-one-out cross-validation. Model selection considered a mean error close to zero, a lower root mean square error and a standardized root mean square error close to one. Kriging standard deviation was retained as the interpolation uncertainty layer. Adult- and child-specific exposure parameters were then applied to estimate the spatial distribution of HQ for each population group.
2.5.2. Probability–HQ Matrix Zoning
Exceedance probability and child HQ were cross-classified using a probability–HQ risk matrix rather than combined into a single additive score. The two layers were treated as related assessment products rather than independent likelihood and consequence dimensions. Child HQ was classified using the non-carcinogenic risk criterion HQ = 1 according to the USEPA health risk assessment framework [
30,
32]. The exceedance probability map was classified using
P = 0.5 as the primary warning threshold, and
P = 0.7 was used for sensitivity analysis. This matrix-based classification defines an intersection-based priority footprint and a broader warning or verification footprint. Four management zones were defined to support differentiated groundwater risk screening and management [
35,
36,
51]: general protection, exceedance-warning, concentration-verification and priority-intervention zones. To account for zoning uncertainty, pixel-wise probability standard deviation from 300 repeated final-model training-and-prediction runs, child-HQ kriging standard deviation and threshold-sensitive pixels around
P = 0.5 and child HQ = 1 were mapped as supplementary uncertainty layers. The classification criteria for the four management zones are summarized in
Table 3.
The priority-intervention zone represents the conservative coincidence footprint, whereas the union of exceedance-warning, concentration-verification and priority-intervention zones represents the broader warning and verification footprint [
51].
3. Results
3.1. Spatial Characteristics of Groundwater Nitrate Concentrations and Exceedances
Groundwater NO3− concentrations varied markedly among the 157 samples, ranging from 0.009 to 270.673 mg/L. The mean, median and standard deviation were 24.405, 5.626 and 39.541 mg/L, respectively. Most samples contained relatively low nitrate concentrations, while a small number of high values strongly influenced the distribution. This pattern indicates pronounced spatial heterogeneity and localised nitrate enrichment in shallow groundwater.
Using the NO3− > 50 mg/L threshold, 31 samples were classified as exceedances and 126 as non-exceedances. The corresponding exceedance rate was 19.7%. Thus, nitrate contamination was characterised by localised hotspots rather than widespread regional exceedance. Nevertheless, nearly one-fifth of samples exceeded the drinking-water limit, indicating a clear need for risk screening and water-safety reassessment. Exceedance and high-concentration samples clustered mainly in central-western Handan and around parts of the urban core. Eastern and northeastern areas contained comparatively few exceedances.
3.2. Model Performance and Selection for Spatial Prediction
Across 300 repeated hold-out validations, RF, SVM and XGBoost showed distinct performance profiles (
Table 4). SVM achieved the highest ROC-AUC at 0.903, compared with 0.893 for XGBoost and 0.884 for RF. This result indicated a modest advantage for SVM in overall discrimination.
Threshold-dependent metrics showed that XGBoost detected exceedance samples more effectively. At the P = 0.5 threshold, XGBoost increased recall from 0.840 for SVM to 0.917 and reduced the mean number of false negatives from 0.96 to 0.50. At the stricter P = 0.7 threshold, XGBoost increased recall from 0.676 to 0.809 and reduced the mean number of false negatives from 1.95 to 1.15. Because false negatives could leave potential nitrate-exceedance areas unidentified, model selection prioritised recall and missed-case control. XGBoost was therefore selected for spatial probability mapping despite the slightly higher ROC-AUC of SVM.
Five-fold spatial block cross-validation yielded a mean ROC-AUC of 0.867 for XGBoost. This value was lower than the result from random partitioning, indicating some performance inflation under random validation. Nevertheless, XGBoost retained sufficient spatial discrimination to resolve broad regional patterns of nitrate exceedance probability.
3.3. Spatial Distribution of Groundwater Nitrate Exceedance Probability
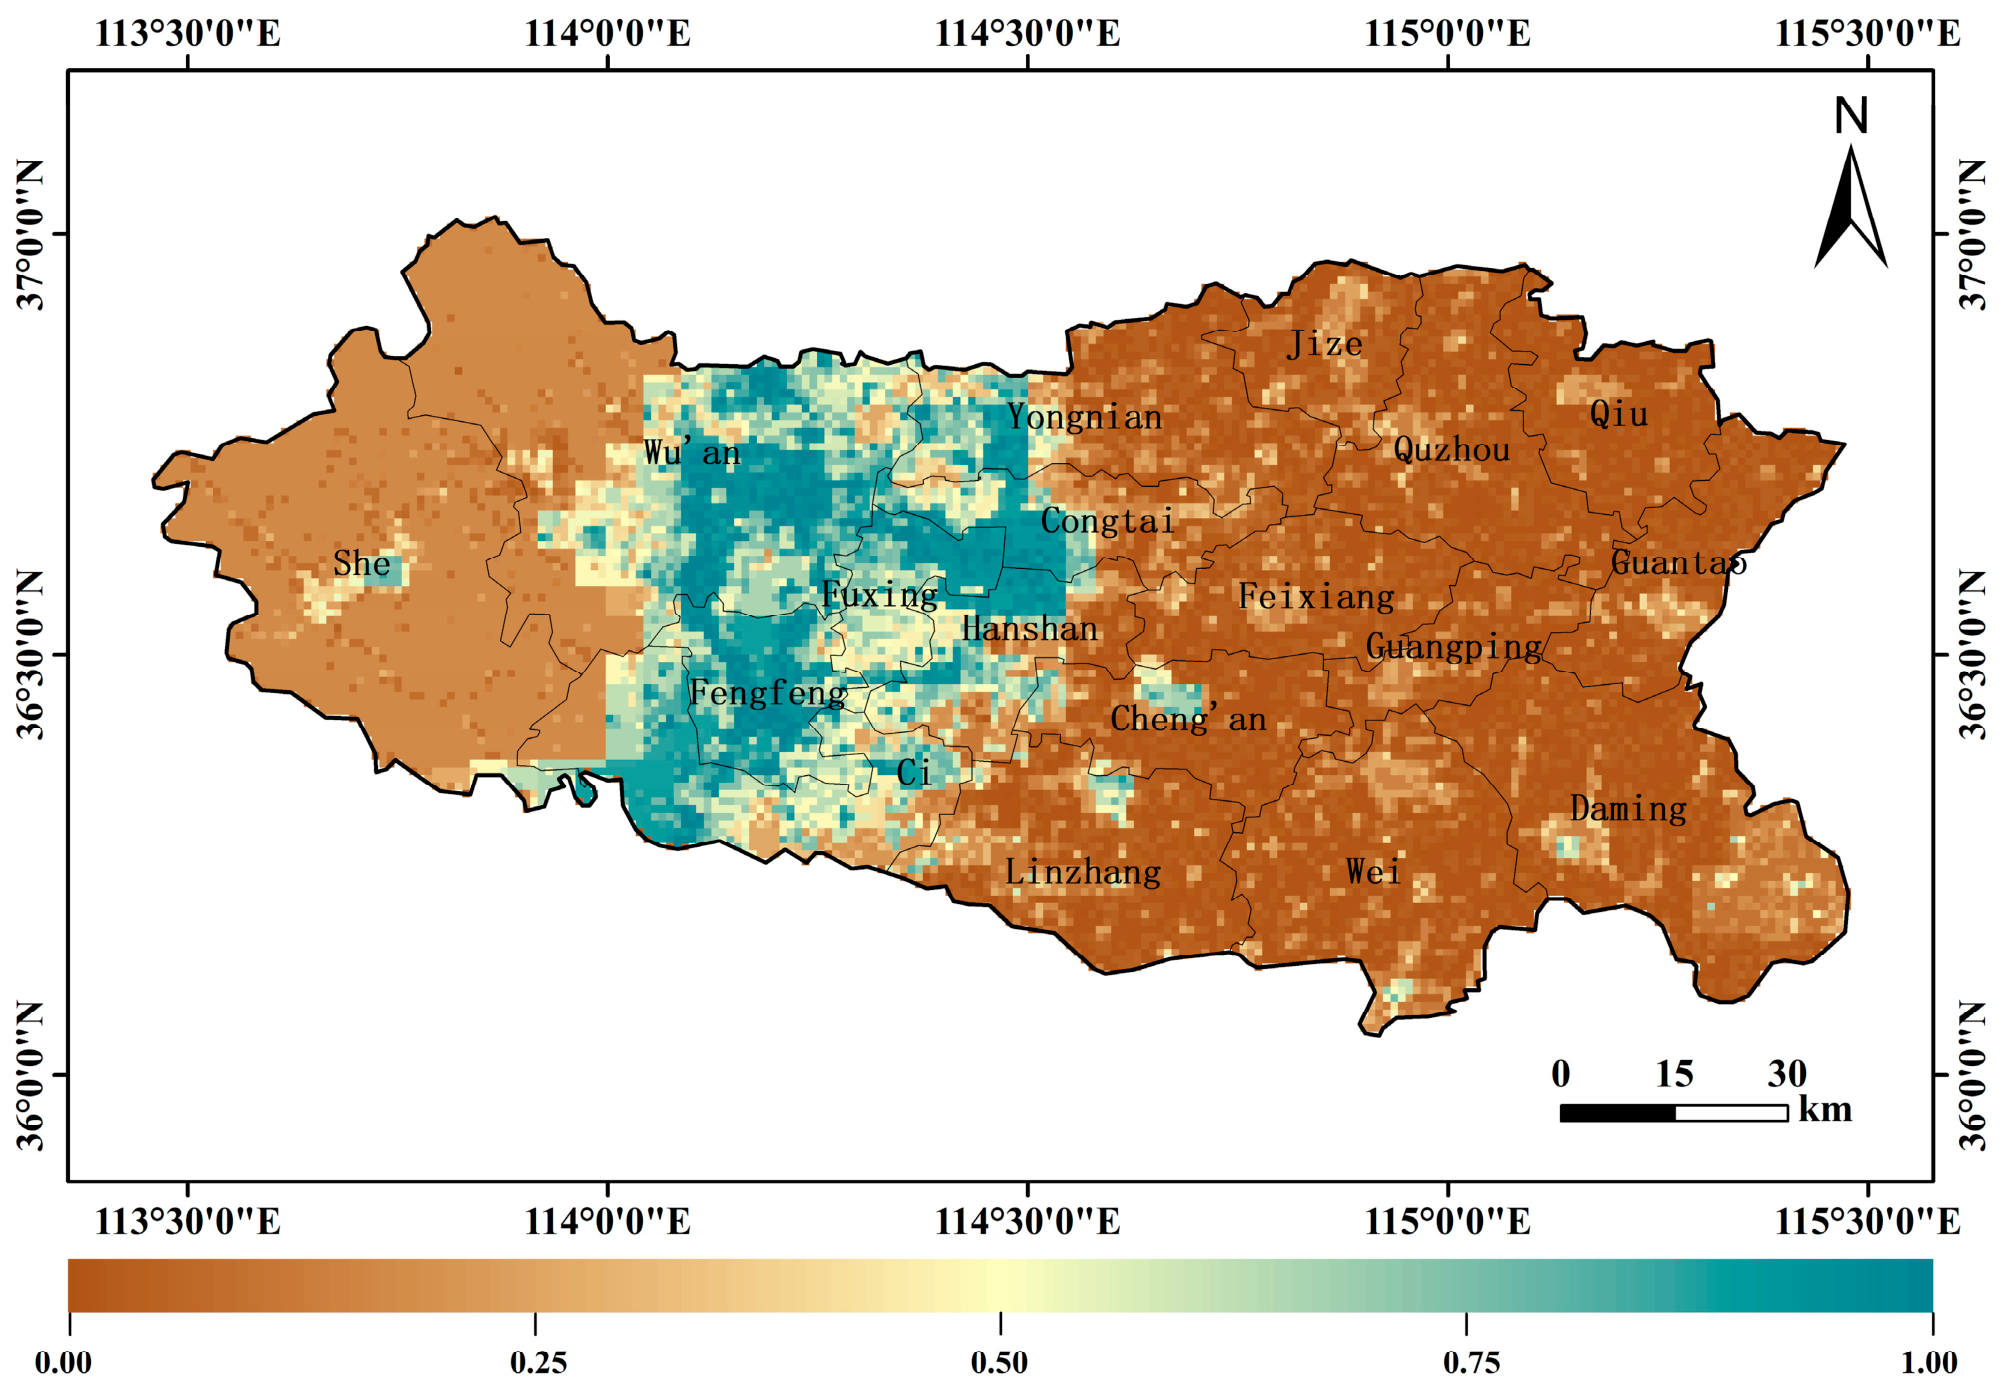
The final exceedance-probability map was represented by the pixel-wise mean probability from 300 repeated XGBoost training-and-prediction runs. Values ranged from 0 to 1 and represented the probability that groundwater NO3− exceeded 50 mg/L in each spatial unit.
Predicted exceedance probability varied markedly across Handan, with higher values in the central-western region and lower values in the east (
Figure 3). Principal high-probability zones occurred in Fengfeng Mining District, Fuxing District, northern Cixian County and central-eastern Wu’an. These areas were identified as potential exceedance hotspots under the observed environmental conditions. Eastern and northeastern Handan generally showed lower predicted probabilities.
Mean predicted probabilities also differed among administrative units. Relatively high values occurred in Fengfeng Mining District, Fuxing District, Cixian County, Hanshan District, Congtai District and parts of Wu’an. Eastern and northeastern counties generally had lower values. These patterns confirm that nitrate exceedance potential is spatially uneven and concentrated in localised clusters.
3.4. SHAP Responses of Key Environmental Predictors
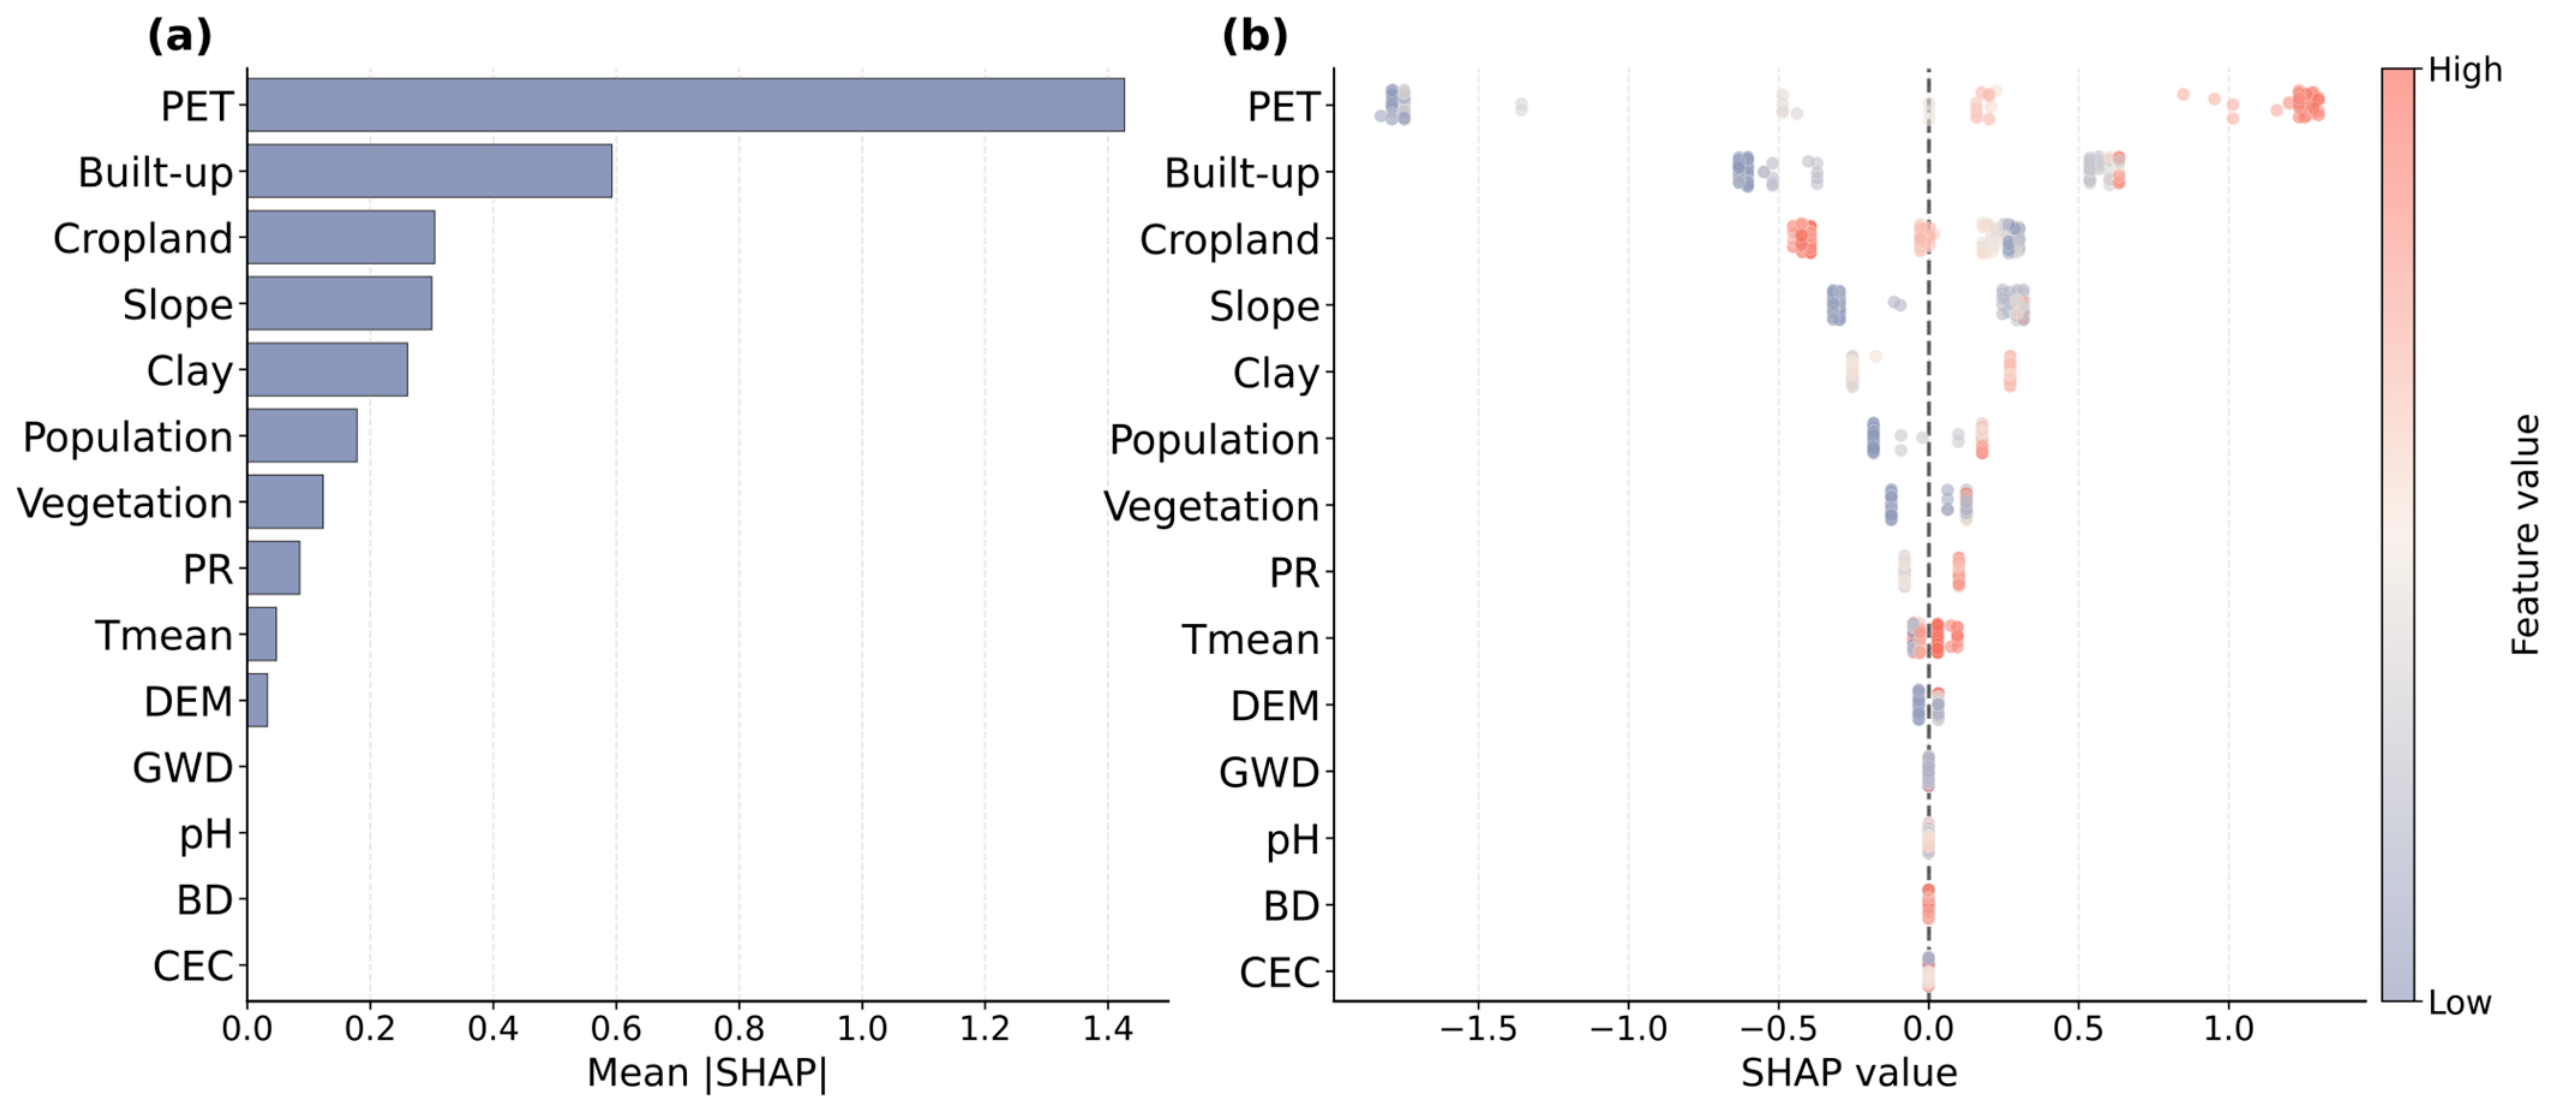
SHAP analysis was used to interpret how XGBoost differentiated nitrate exceedance probability. Mean annual potential evapotranspiration, built-up land fraction, cropland fraction, slope and soil clay content were the five most influential predictors. Their mean absolute SHAP values were 1.4267, 0.5933, 0.3048, 0.3000 and 0.2607, respectively. These results indicate that model discrimination reflected the combined influence of climatic water balance, anthropogenic pressure, land-use structure and terrain-soil conditions (
Figure 4).
Mean annual potential evapotranspiration had the largest mean absolute SHAP value in the final XGBoost model. However, this result should be interpreted as a model-response pattern rather than evidence that PET independently controls nitrate exceedance. PET is a smooth climate variable and is broadly aligned with the west–east topographic and hydroclimatic gradient of Handan. Therefore, its high SHAP importance may partly reflect the model’s use of PET as a proxy for broader spatial gradients.
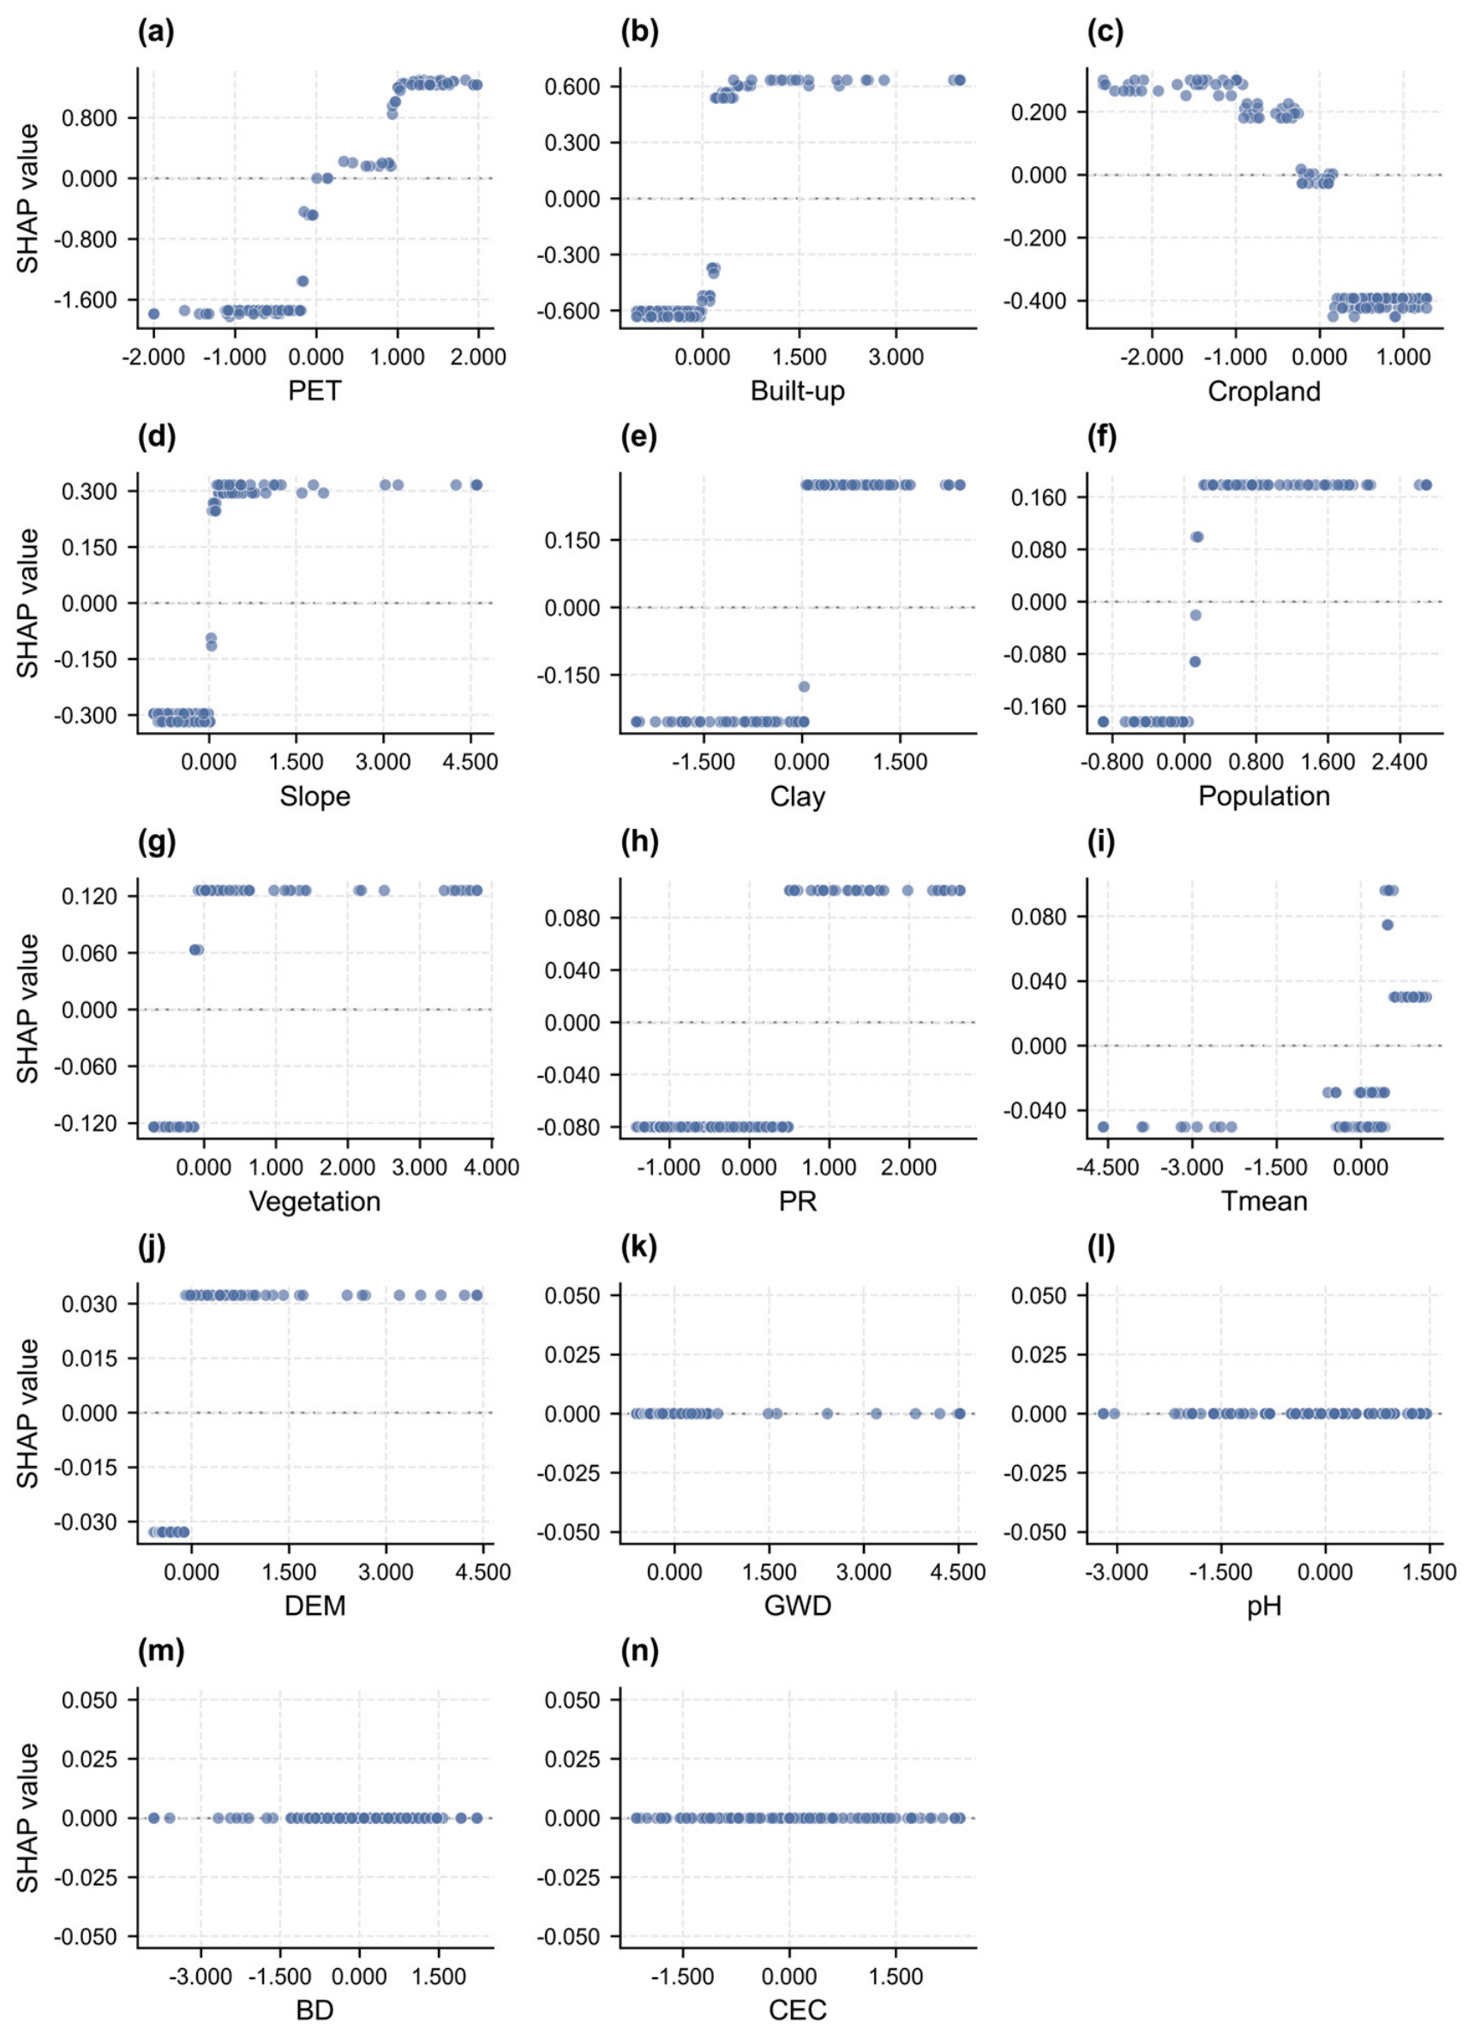
Cropland fraction, slope and soil clay content showed nonlinear SHAP responses (
Figure 5). Cropland fraction did not increase monotonically with SHAP values, indicating a context-dependent association with model output. Slope and soil clay content also showed segmented or nonlinear responses across their observed ranges. Overall, no single predictor governed the modelled probability. Instead, model discrimination reflected the combined effects of climate, human activity, land use and terrain-soil conditions.
3.5. Health Risk Assessment and Probability–HQ Matrix Zoning
3.5.1. Health Risk Assessment for Adults and Children
Ordinary kriging was used to spatialise NO3− concentrations, after which population-specific exposure parameters were applied to calculate drinking-water HQs. Groundwater nitrate health risk was generally low across the study area. However, child HQs were consistently higher than adult HQs. The Gaussian variogram model provided the best cross-validation performance, with a nugget of 1170.89 (mg/L)2, sill of 3185.98 (mg/L)2 and range of 193.06 km. Leave-one-out cross-validation yielded a mean error of 0.11 mg/L, RMSE of 32.56 mg/L and standardized RMSE of 0.94. These results indicate little overall bias and acceptable interpolation performance for regional health-risk screening. The relatively high RMSE mainly reflected the influence of a small number of high-concentration samples in the right-skewed nitrate dataset.
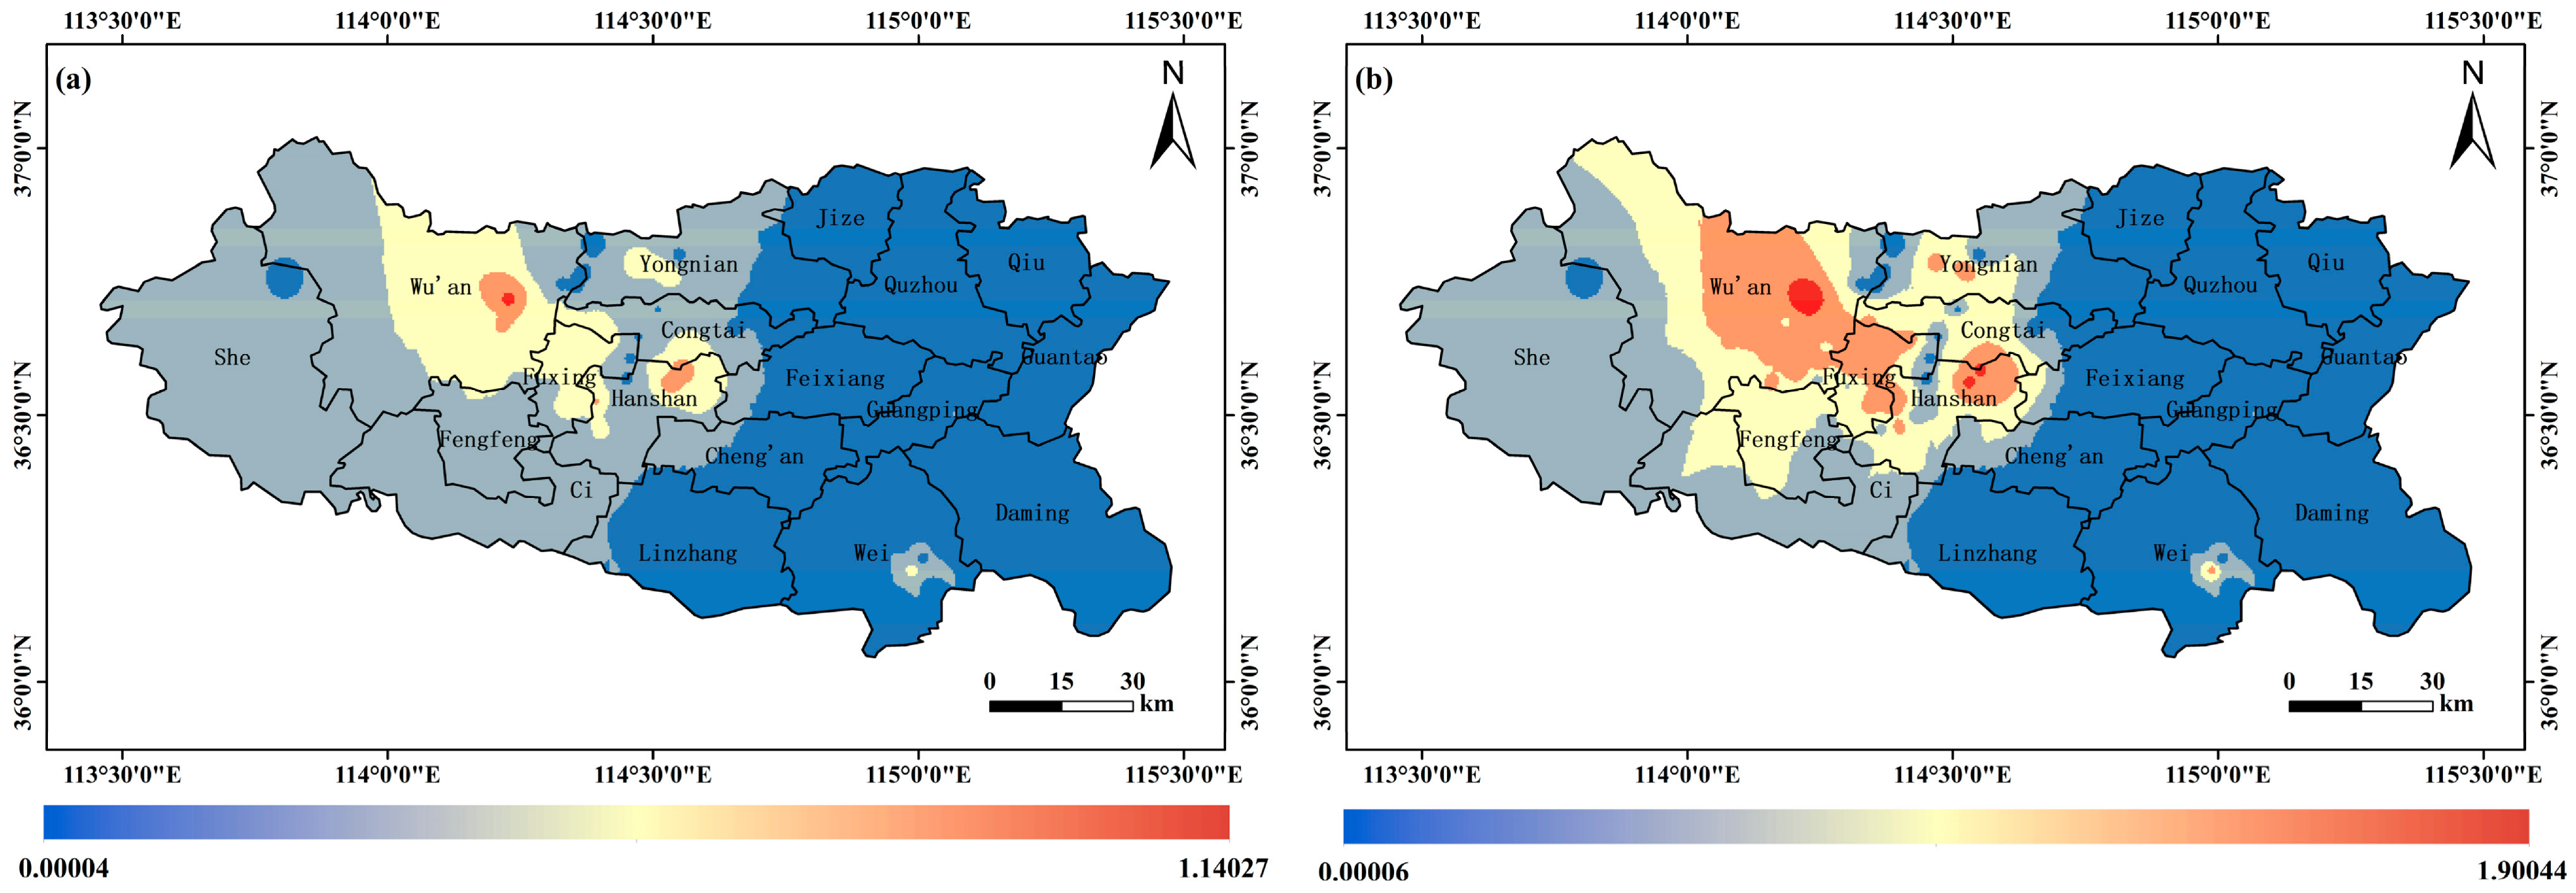
Adult HQs ranged from 0.00004 to 1.14027, with a mean of 0.0948 and a standard deviation of 0.1147. Child HQs ranged from 0.00006 to 1.90044, with a mean of 0.1580 and a standard deviation of 0.1912. The maximum, mean and variability were all higher for children. Mean child HQ was approximately 1.67 times the adult value.
Areas with HQ > 1 accounted for approximately 0.03% of the study area for adults and 0.35% for children. Adult and child hotspots showed broadly similar spatial patterns, with higher values in western and central Handan and lower values in the east and south. Elevated-risk areas occurred mainly in central-eastern Wu’an and localised parts of the urban core (
Figure 6). Child HQ was therefore used as the concentration-derived health-concern indicator in the probability–HQ risk matrix.
3.5.2. Management-Oriented Probability–HQ Matrix Zoning
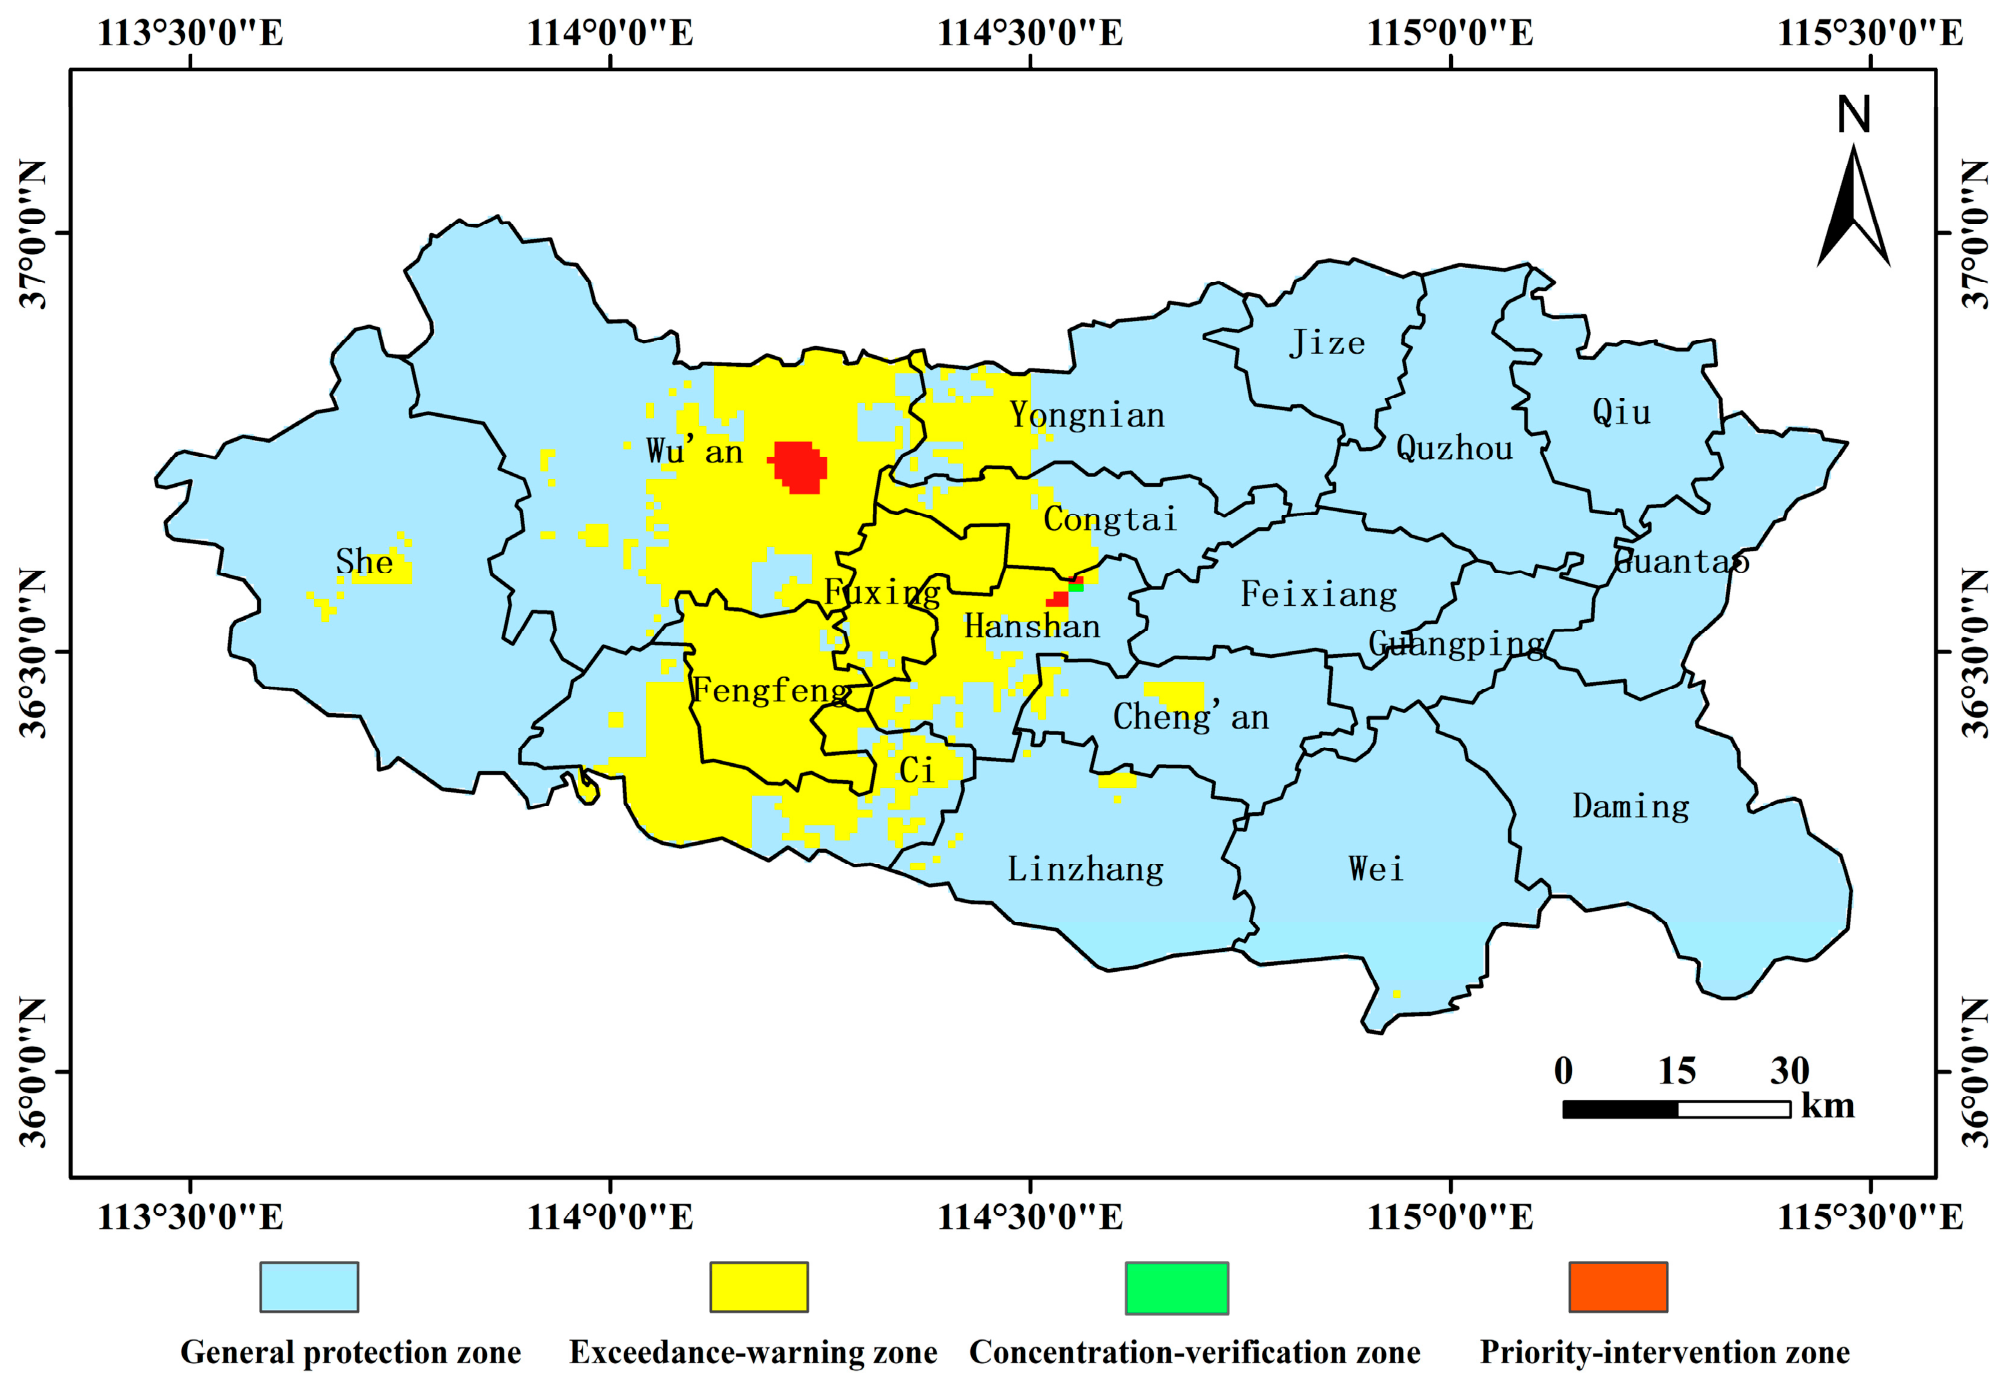
The probability–HQ matrix reclassified the study area into four management zones. Under the primary
P = 0.5 matrix, general protection and exceedance-warning zones covered 81.26% and 18.40% of the study area, respectively. The concentration-verification zone was negligible, covering 0.01%, and the priority-intervention zone covered 0.33% (
Table 5;
Figure 7).
The matrix zones contained most observed exceedance samples. Among the 31 samples exceeding the nitrate threshold, 26 were located in exceedance-warning zones and 3 in priority-intervention zones. Thus, 29 exceedance samples, corresponding to 93.55%, fell within the broader warning and verification footprint. Only two exceedance samples were located in general protection zones. The broader warning and verification footprint covered 18.74% of the study area.
When the probability threshold was increased to
P = 0.7, the exceedance-warning zone decreased to 8.79%, whereas the priority-intervention zone remained similar at 0.29%. Uncertainty analysis showed that threshold-sensitive transition areas accounted for 8.06% of the mapped study area, including 7.24% of pixels sensitive to
P = 0.5 and 0.97% sensitive to child HQ = 1 (
Figure A2;
Table A1). Because the two masks partly overlapped, the combined transition area was smaller than their sum. These transition areas occurred mainly near the boundary between general protection and exceedance-warning zones, indicating that local zone boundaries remain uncertain although the regional zoning pattern is stable.
4. Discussion
4.1. Machine-Learning Prediction and Key Environmental Responses
Recent machine-learning studies have predicted groundwater nitrate concentration or elevated nitrate risk using land-use, soil, climatic, topographic and hydrogeological variables [
15,
16,
19,
20,
21,
22,
23]. Consistent with these studies, our results show that nitrate exceedance risk is spatially heterogeneous and reflects the combined influence of natural conditions and human activities. The difference is that this study focused on exceedance probability and early-warning screening rather than concentration prediction alone; therefore, model selection emphasised recall and missed-exceedance control in addition to overall discrimination.
The three machine-learning models captured nonlinear associations between nitrate exceedance and multi-source environmental predictors, but their performance profiles differed. Although SVM achieved the highest ROC-AUC, XGBoost showed stronger recall and fewer false negatives at both probability thresholds. For early-warning purposes, identifying as many potential exceedances as possible is more important than maximising overall classification accuracy. XGBoost was therefore selected because it better matched the practical objective of reducing missed exceedance areas.
The reduction in performance under spatial cross-validation indicates that sample location influenced model extrapolation. Random partitioning can overstate generalisation when nearby samples occur in both training and test sets [
24,
25]. Spatial cross-validation provides a more conservative estimate of performance in unsampled areas and is therefore important for regional groundwater risk mapping.
High-probability zones occurred mainly in central-western Handan and along the transition between the piedmont plain and urbanised areas. This distribution broadly corresponds to the regional gradient from western mountains and hills to central-eastern alluvial-proluvial plains. Variations in terrain, aquifer properties, recharge–runoff–discharge processes and human activity may jointly affect nitrate input, leaching, transport and local accumulation. These combined gradients may explain why the model identified central-western Handan as a potential hotspot.
SHAP analysis identified potential evapotranspiration, built-up land fraction, cropland fraction, slope and soil clay content as the leading predictors of model response. These variables are broadly consistent with previous nitrate studies showing that land use, anthropogenic nitrogen input, hydroclimatic conditions, soil properties and groundwater-related transport processes jointly affect nitrate accumulation [
7,
10,
11,
12,
19,
20,
21,
22,
23]. The high SHAP importance of PET should be interpreted cautiously because PET covaries with the regional west–east elevation and hydroclimatic gradient. It may represent a broader climatic–topographic context rather than an independently verified evapotranspiration mechanism. Built-up land fraction reflects urbanisation and possible domestic nitrogen inputs. The non-monotonic response of cropland fraction suggests that agricultural effects also depend on irrigation, fertilizer practices, soil texture and groundwater depth. Slope and clay content may further influence runoff, infiltration and solute transport. These interpretations describe plausible environmental contexts for the model response, but they do not establish causality or identify nitrate sources, which would require isotope evidence, hydrochemical indicators or source inventories [
27,
28,
29].
4.2. Interpreting Probability–HQ Matrix Zoning
The probability–HQ matrix translates two related assessment products into management zones. Child HQ reflects concentration-derived exposure concern, whereas exceedance probability captures environmental conditions associated with nitrate exceedance. In Handan, almost all pixels with child HQ ≥ 1 were located within areas where P ≥ 0.5, while the concentration-verification zone was negligible. In this case, the off-diagonal disagreement was one-sided: high-probability but low-HQ areas were common, whereas high-HQ but low-probability areas were absent. The matrix therefore separated a small priority-intervention footprint from a broader exceedance-warning zone. The priority-intervention zone represents a narrow conservative target where child-health concern and exceedance susceptibility overlap. This zone covered only 0.33% of the study area and remained similar at 0.29% when the stricter P ≥ 0.7 threshold was used, indicating that the highest-priority footprint was relatively stable.
For management, the most informative class was the exceedance-warning zone. Although child HQ remained below 1 in this zone, it contained 26 of the 31 observed nitrate exceedance samples. These areas are therefore more suitable for intensified monitoring, source-load prevention and repeated water-quality checks than for immediate intervention. General protection zones can remain under routine monitoring, but the two observed exceedance samples in this class indicate that local verification is still needed where site-specific conditions differ from regional model patterns. Therefore, the zoning boundaries should be interpreted as screening and verification boundaries rather than deterministic contamination boundaries, especially in threshold-sensitive transition areas.
4.3. Uncertainty and Study Limitations
Several uncertainties constrain how the predicted zones should be used. The sample set was small and imbalanced, with nitrate exceedances accounting for 19.7% of observations. Although SMOTE was restricted to the training folds to reduce leakage, minority-class patterns may still be under-represented. The probability surface should therefore be interpreted as a relative indicator of regional exceedance susceptibility rather than as a site-specific estimate for operational decisions.
Predictors also differed in temporal coverage, spatial resolution and measurement quality. For example, groundwater depth was represented by a multi-year mean, capturing the broad hydrogeological setting rather than conditions at the sampling date. These scale mismatches make the results more appropriate for regional screening and trend interpretation than for parcel-scale boundary delineation. Higher-frequency groundwater, nitrogen-loading and land-use data would improve sensitivity to short-term variability.
Interpretation of the probability–HQ matrix depends on both model and interpolation uncertainty. SHAP analysis described associations within the selected predictor set, but these associations should not be treated as causal evidence or source attribution. Similarly, HQ estimates depended on kriged NO3− concentrations. Despite low overall cross-validation bias, the right-skewed distribution and fitted variogram may smooth local concentration peaks. Repeated XGBoost runs, kriging standard deviation and threshold-sensitive masks all indicate that local boundaries remain uncertain, especially near P = 0.5 and child HQ = 1. The matrix should therefore guide monitoring, drinking-water verification and management prioritisation rather than define fixed contamination or intervention boundaries. Source attribution and targeted management would require repeated monitoring, independent validation, isotopic and hydrochemical evidence, source inventories and more detailed hydrogeological information.
5. Conclusions
Among 157 shallow groundwater samples collected in 2023, 31 exceeded the NO3− threshold, giving an exceedance rate of 19.7%. Exceedances were spatially clustered, indicating that nitrate risk in Handan is dominated by localised hotspots. Although SVM achieved the highest ROC-AUC, XGBoost showed stronger recall and fewer false negatives, making it more suitable for early-warning mapping. High-probability areas were mainly located in central-western and urban-fringe areas, including Fengfeng Mining District, Fuxing District, northern Cixian County and central-eastern Wu’an.
SHAP analysis indicated that the XGBoost model mainly used potential evapotranspiration, built-up land fraction, cropland fraction, slope and soil clay content to discriminate exceedance probability. These variables reflect combined hydroclimatic, land-use, terrain and soil conditions, but should be interpreted as model-response patterns rather than direct evidence of nitrate sources. Non-carcinogenic health risk was generally low, but children had higher HQs than adults and should remain the priority receptor group in nitrate-related drinking-water risk assessment.
Under the primary P = 0.5 threshold, the probability–HQ matrix classified 81.26%, 18.40%, 0.01% and 0.33% of the study area as general protection, exceedance-warning, concentration-verification and priority-intervention zones, respectively. The broader warning and verification footprint covered 18.74% of the study area and contained 29 of the 31 observed exceedance samples. These results support the use of the matrix as a transparent screening and verification tool rather than a deterministic contamination boundary or an independent composite risk index. Future work should incorporate multi-year monitoring, denser sampling in transition zones and applications in other hydrogeological settings to validate the framework. The integration of isotope tracing, source inventories, groundwater-flow information and seasonal hydrochemical data would further help distinguish statistical risk patterns from nitrate sources and transport processes.