1. Introduction
In areas affected by historical nuclear testing, radioactive and chemical contamination of surface waters and related environmental compartments remains a major concern. Bottom sediments are particularly relevant because they accumulate potentially toxic elements, including heavy metals and radionuclides, and record the ecological status and contamination history of aquatic systems [
1,
2,
3,
4,
5,
6,
7,
8].
In industrially affected watersheds, the composition and quality of bottom sediments reflect both natural geochemical processes and anthropogenic inputs. Natural controls include rock weathering, hydrological and aeolian particle transport, sediment sorting, and biogeochemical reactions. Anthropogenic sources include industrial and domestic wastewater discharge, agricultural runoff, erosion enhanced by land-use change, hydraulic structures, and mining activities [
9,
10,
11,
12,
13,
14,
15,
16]. In sparsely populated, non-industrial watersheds, sediment composition is expected to reflect natural geochemical conditions more strongly, although legacy contamination and local hydrogeological interactions may still influence sediment quality.
The Shagan River is a major watercourse associated with the Semipalatinsk Test Site (STS), flowing for more than 200 km along its eastern boundary. Its flow is mainly generated by winter snow accumulation and spring snowmelt, producing a strongly seasonal hydrological regime [
17]. Under the arid conditions of the Kazakh lowlands, small rivers are particularly sensitive to hydrological variability, salinization, and contamination, and climate-driven changes may further increase their instability and vulnerability to environmental pressures [
18,
19,
20]. Because freshwater resources are limited, the quality of surface waters and associated sediments is environmentally important. The Shagan River supports local ecosystem functioning and economic activities, although high mineralization and water scarcity constrain its use for drinking-water supply. These characteristics make it a relevant system for examining geochemical processes and the long-term environmental consequences of historical nuclear testing.
Assessment of trace element concentrations in bottom sediments is essential for determining contamination levels and potential ecological risks. Geochemical evaluation commonly compares measured concentrations with reference compositions, such as the upper continental crust (UCC) and clay shales, using Clarke values and the geoaccumulation index (Igeo) [
21,
22,
23]. Potential adverse effects on aquatic organisms can be screened using sediment-quality criteria, including the threshold effect concentration (TEC), probable effect concentration (PEC), lowest effect level (LEL), and severe effect level (SEL) [
24,
25]. TEC and PEC are consensus-based guidelines derived from several sediment-quality systems and validated using extensive datasets on sediment chemistry and toxicity.
The TEC and PEC criteria are consensus-based sediment quality guidelines developed through the integration of several previously published SQG systems and validated using extensive datasets on the chemical composition and toxicity of bottom sediments. The combined application of the TEC, PEC, LEL, and SEL criteria provides a more robust preliminary assessment of sediment quality by relating the degree of geochemical enrichment of elements to the likelihood of adverse biological effects.
Several studies have investigated the radioecological status of environmental compartments associated with the Shagan River [
26,
27,
28,
29,
30,
31], confirming the continuing relevance of areas affected by technogenic radionuclide migration. Tritium (
3H) concentrations approximately one order of magnitude above regulatory values have been reported in specific sections. Aktayev et al., 2017a [
32] identified elevated radioactivity associated with contaminated sub-channel and fissure waters discharging into the river. These zones include the 2 km and 5 km sites, the 8–14 km section where fissure waters enter floodplain groundwater before reaching the river, and parts of the former channel influenced by water manifestations from the Lake Atomnoe deposits and embankments.
Despite extensive attention to radionuclide contamination, the chemical composition of Shagan River bottom sediments remains poorly documented. Systematic elemental studies are scarce, and the available information was obtained mainly through individual research projects [
33,
34,
35]. This lack of sediment-specific geochemical data limits definition of the regional background and assessment of potential contamination processes. Particular attention is required in river sections where contaminated groundwater discharge may interact with surface water and bottom sediments, potentially generating marked spatial heterogeneity in major and trace element concentrations.
Although sediment contamination has been examined in downstream sections, the 2 km site remains insufficiently characterized in terms of trace element accumulation, contamination level, spatial variability, and enrichment relative to UCC and clay shale reference values. This site is especially relevant because groundwater hydraulically connected to the Lake Atomnoe retaining zone may discharge into the river.
The objective of this study is therefore to conduct a screening-level geochemical and ecotoxicological assessment of bottom sediments along a 2 km stretch of the Shagan River, characterize the spatial variability of elemental concentrations, and identify potential factors controlling their distribution.
To achieve this objective, the study:
Assesses the enrichment of major and trace elements in bottom sediments relative to upper continental crust and clay shale reference values.
Identifies spatial distribution patterns and localized geochemical enrichment potentially related to sediment redistribution, hydrogeochemical conditions, or external inputs.
Evaluates sediment quality using the geoaccumulation index (Igeo) and the TEC, PEC, LEL, and SEL ecotoxicological criteria.
Compares the results with published data from downstream sections of the Shagan River to examine spatial differences in elemental composition.
2. Materials and Methods
2.1. Study Area
The Shagan River is located within the Kazakh lowlands, in the administrative territory of the Abai Region, and is a left-bank tributary of the transboundary Irtysh River. The regional hydrographic network is poorly developed, primarily due to the steppe landscape and the arid to semi-arid climatic conditions. The current state of the hydrographic network reflects low drainage density and dominant accumulation processes, as indicated by pronounced channel meandering, the formation of oxbow lakes and closed water bodies, and the seasonal or complete drying of numerous surface water features.
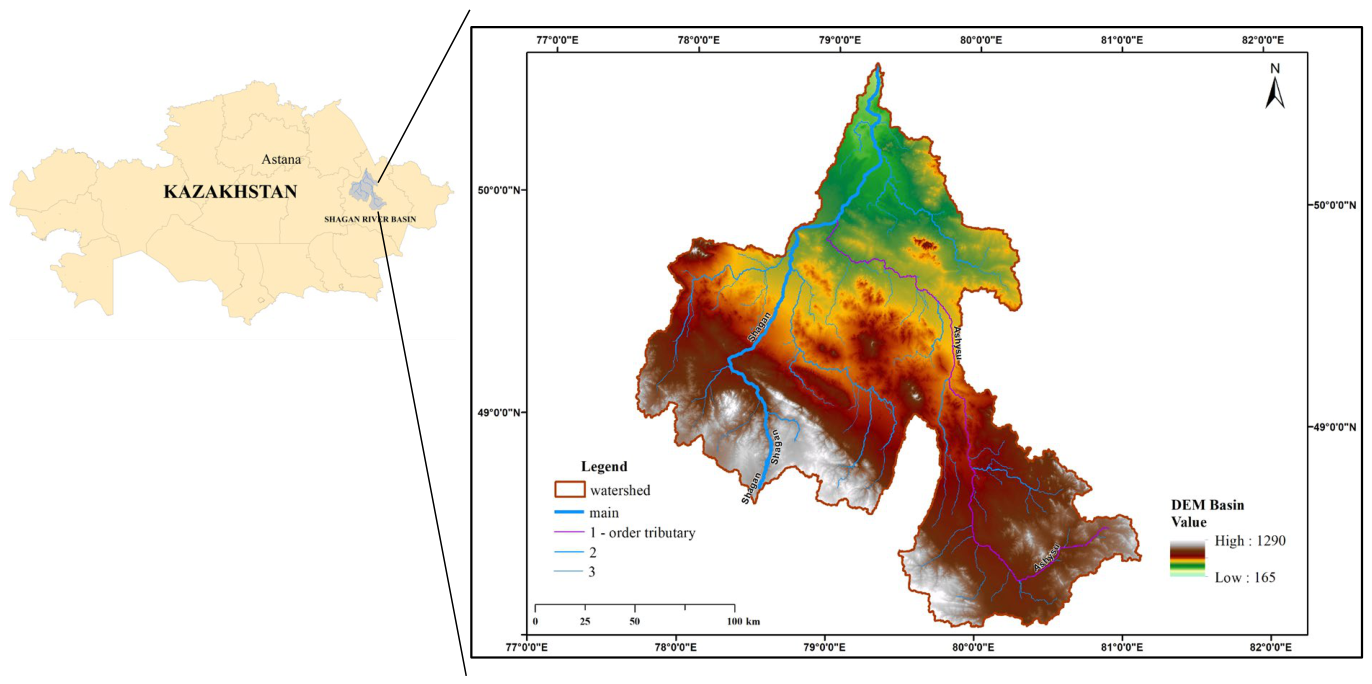
The Shagan River originates in the southwestern foothills of the Chingiz-Tau Range. In the mountainous part of the basin, the river maintains a relatively defined flow, whereas in the lowland plain it includes reaches with intermittent flow, partial drying, and isolated pools connected by sub-channel flow. The river is more than 200 km long, and its drainage basin covers approximately 1890 km
2 [
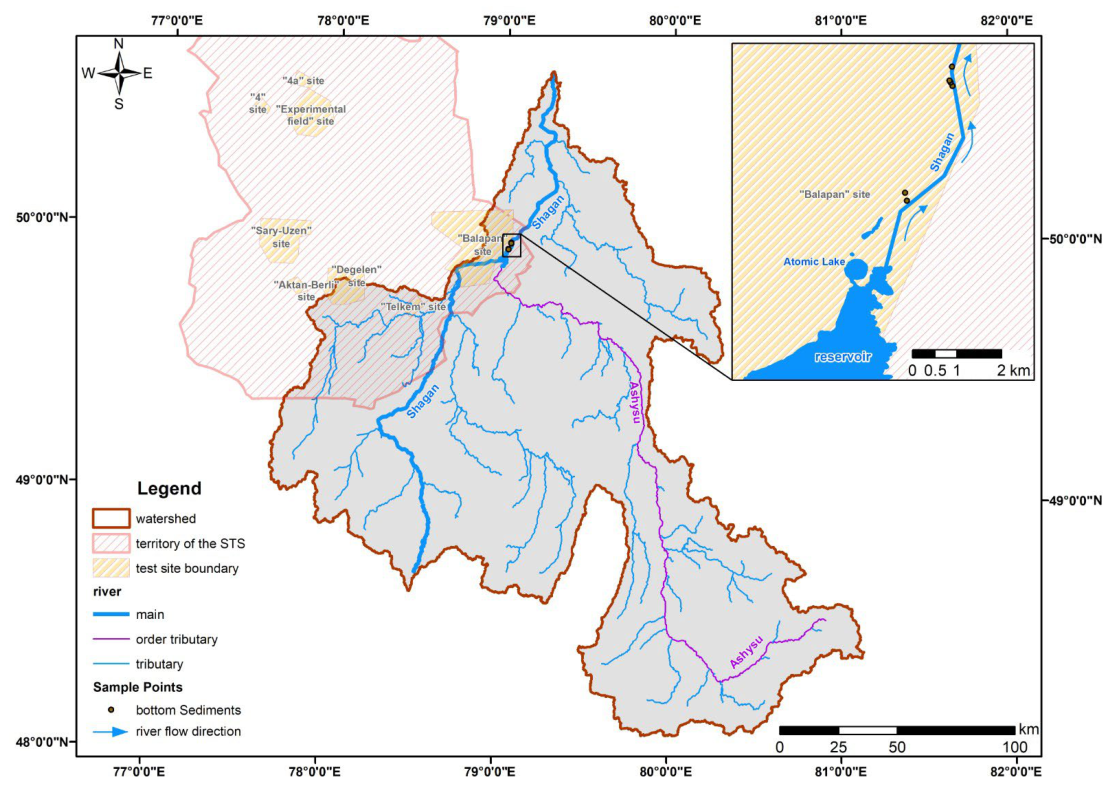
36]. Ice formation generally occurs in November, and ice breakup takes place in early April. The Ashisu River is the largest tributary of the Shagan River (
Figure 1). Most tributaries in the basin are temporary watercourses that function mainly during the short period of spring snowmelt [
37]. In terms of hydrochemical composition, Shagan River water is predominantly of the sulfate–chloride sodium–potassium type, slightly alkaline, and very hard [
33,
34,
35,
38].
The study area is located within the conventionally designated 2 km site of the Shagan River. This section was selected because it is characterized by locally distinct hydrogeological and sedimentation conditions that may influence the geochemical composition of bottom sediments. Sampling was conducted during a single field campaign along a river section bounded approximately by 49.93997–49.97522° N and 79.01383–79.04189° E. The selected reach represents a longitudinal profile of the river channel and includes sampling points distributed along the upper and lower parts of the studied section.
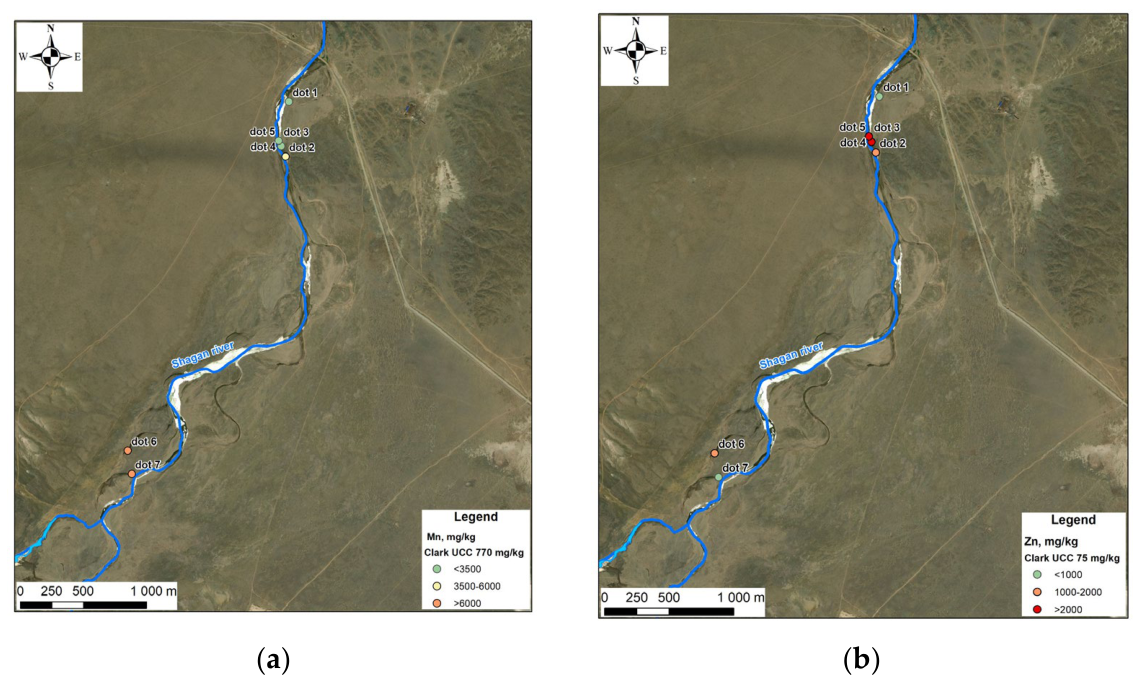
A total of 21 surface sediment samples were collected from seven sampling stations along a 3.5 km river reach downstream of Lake Atomnoe (
Figure 2). The number of point samples collected at each station varied depending on the characteristics of the bottom sediments and the availability of representative material. Individual point samples were subsequently composited to obtain an integrated sample representative of each sampling station. Because the sampling points were located in close proximity to one another, displaying all individual points on the overview map resulted in overlapping symbols. Therefore, only the sampling stations (composited samples) are shown in
Figure 2.
Surface bottom sediments were collected using a universal Eijkelkamp sediment sampler (Royal Eijkelkamp, Giesbeek, The Netherlands) by the penetration method, allowing the collection of material from the upper 0–10 cm sediment layer.
At each sampling point, individual spot samples were collected and then combined into composite samples to reduce the influence of local microheterogeneity and improve sample representativeness. Sampling was performed in shallow water at an approximate depth of 0.5 m, allowing access to the surface sediment layer. The sampling points were distributed along the river channel to characterize longitudinal spatial variability. Each sediment sample, weighing approximately 200 g, was placed in containers made of inert materials to prevent secondary contamination and was subsequently transported to the laboratory for analytical testing.
2.2. Preparation of Bottom Sediment Samples
Sediment samples were dried at room temperature, approximately 20 °C, until an air-dry state was reached. The dried samples were sieved through polyamide sieves to remove the coarse fraction (>2 mm) and were then divided into five subsamples using the quartering method. Equal portions were taken from each subsample to obtain a composite sample of approximately 10 g. This composite sample was further sieved through a <1 mm mesh sieve. The resulting fraction was ground to a fine powder and homogenized.
Subsamples of 1 g were obtained by quartering. From each homogenized subsample, 0.1 g was weighed using an analytical balance with an accuracy of ±0.0001 g and placed in Teflon beakers for complete acid digestion. Sample preparation for elemental analysis was conducted in accordance with the methodological guidelines NSAM 499-AES/MS [
39]. Samples were digested in batches of 15–20 samples, including one control sample, one procedural blank, one isotopic-labelled sample, and one certified reference sample. The certified reference material (CRM) of Lake Baikal bottom silt (LBBS-1), (GSO 7126-94, KZ.03.02.02409-2016/7126-94), produced in 1994 by the A.P. Vinogradov Institute of Geochemistry, Siberian Branch of the Russian Academy of Sciences (IGC SB RAS, Irkutsk, Russia), was used for quality assurance of the analytical measurements.
Prior to acid digestion, the sediment samples were moistened with deionized water, and an isotopic tracer solution containing Nd, Dy, and Yb isotopes was added. The tracer solution was prepared from powdered oxides of 146Nd (98.8% isotopic enrich-ment), 161Dy (94.8%), and 174Yb (98.2%) manufactured by the Federal State Unitary Enterprise Electrokhimpribor Combine (Lesnoy, Russia; quality certificates Nos. 4835, 4834, and 4836). A separate aliquot of the spike solution was used to evaluate digestion efficiency and analyte recovery.
Samples were digested in Teflon beakers using high-purity HF (Hydrofluoric acid, Chemical Plant of Fluoride Salts LLC, Perm, Russia), HCl (Hydrochloric acid, Sigma Tech LLC, Khimki, Russia), and HNO3 (Nitric acid, LLC “Technological Laboratory Giredmet”, Verkhnyaya Pyshma, Russia). Following sequential acid treatment, the solutions were repeatedly evaporated to near dryness to ensure complete decomposition of the sediment matrix. The resulting residues were dissolved in HNO3 and further heated to complete digestion and remove volatile components.
Residual organic matter was oxidized using H2O2 (Hydrogen peroxide, Khimprom PJSC, Novocheboksarsk, Chuvash Republic, Russia), with additional HNO3 treatment applied when necessary to obtain clear solutions. Subsequently, H3BO3 (Boric acid, chemically pure grade, Eti Maden İşletmeleri Genel Müdürlüğü (ETİ MADEN İ.G.M.), Ankara, Turkey) was added to complex residual fluoride species, and the samples were converted to a chloride medium.
The final solutions were transferred to polypropylene tubes, spiked with indium as an internal standard, and diluted to a fixed volume with deionized water prior to inductively coupled plasma mass spectrometry (ICP-MS) analysis. A reagent blank, prepared following the same procedure but without sediment sample addition, was used to evaluate the effectiveness of acid mineralization and to control potential contamination during elemental analysis. The prepared solutions were then submitted for instrumental analysis.
For each analytical series, one bottom sediment control sample was subjected to acid digestion using the same protocol to assess the reproducibility of parallel determinations. In addition, one certified reference material LBBS-1 (KZ.03.02.02409-2016/7126-94), was digested together with the analyzed samples to ensure analytical quality control.
2.3. Laboratory Analysis
Following acid digestion, the resulting solutions were analyzed by inductively coupled plasma mass spectrometry (ICP-MS) using a SUPEC 7000 manufactured by Focused Photonics Inc., Hangzhou, Zhejiang, China. The method is based on nebulizing the sample solution into an aerosol, which is subsequently introduced into a high-temperature argon plasma, where desolvation, vaporization, atomization, and ionization of the elements occur. The resulting ions are separated in the mass analyzer according to their mass-to-charge ratio (m/z) and subsequently detected. Quantitative determination of the elements was performed using the external calibration method by comparing the ion signal intensities of the samples with those obtained from certified multi-element standard solutions.
Instrument calibration was performed using certified multi-element standard solutions supplied by Perkin Elmer (Waltham, MA, USA) and Inorganic Ventures (Christiansburg, VA, USA). The relative standard deviation (RSD) of replicate measurements did not exceed 10%. When deviations in the calibration curve reached 8–10%, the instrument was recalibrated.
Analytical measurements were performed in accordance with GOST ISO 17294-2:2019 [
40]. Analytical quality control included the use of the certified reference material LBBS-1, isotopic markers, and a bottom sediment control sample to assess accuracy, reproducibility, and potential element losses during sample preparation. Analytical accuracy was evaluated by calculating the relative deviation between the measured concentrations and the certified values of the reference material.
For the 32 certified components selected from the LBBS-1 reference material, the measured concentrations of four elements or components, namely Li, MgO, V, and Cr, showed relative deviations not exceeding −10% from the certified values. For Be, Al2O3, K2O, CaO, total Fe2O3, Co, Cu, Zn, As, Rb, Mo, Sn, Ba, La, Nd, Yb, Lu, Th, and U, relative deviations ranged from −10% to −20%. For Na2O, MnO, Ni, Sr, Cs, Ce, Sm, Eu, and Pb, relative deviations ranged from −20% to −25% relative to the certified values.
The relative standard deviations of parallel determinations did not exceed 5%, indicating satisfactory reproducibility of the analytical measurements.
Quality assurance/quality control (QA/QC) was performed using a certified reference material LBBS-1, and procedural blanks. The accuracy of elemental determinations was assessed by comparing the measured concentrations with the certified values of the CRM. Limits of quantification (LOQs), certified values, measured values, and procedural blank characteristics for each element are presented as
Supplementary Material (Table S1). The close agreement between the measured and certified values confirms the accuracy of the analytical method and the reliability of the obtained results.
2.4. Data Processing
2.4.1. Statistical Analysis
Statistical processing of the analytical data was performed using Statistica 13.0 and Microsoft Excel. Descriptive statistics were calculated for each element, including the minimum (Min) and maximum (Max) values, the arithmetic mean (), the median (Me), the standard deviation (σ), and the coefficient of variation (CV). Due to the high spatial heterogeneity of the study area, principal component analysis (PCA) was used to identify the main patterns of variability in the studied parameters. This method allows for the transformation of the original set of interrelated variables into a smaller number of new independent variables (principal components) that consistently explain the maximum proportion of the total data variance. Using PCA allows for a reduction in the dimensionality of the original data set, the identification of the hidden structure of relationships between variables, and the determination of the main factors determining the spatial variability of the studied characteristics. PCA was used to identify the structure of relationships between elements and the main drivers of variability, rather than for statistical inference.
2.4.2. Geochemical Indices
Based on the processed dataset, geochemical indicators were calculated for the chemical elements determined in the bottom sediment samples. These indicators included the Clarke concentration coefficient (K
k), calculated using reference concentrations for the upper continental crust and clay shales [
21,
22], and the geoaccumulation index (Igeo) [
23].
Clark concentration (K
k) was determined by expression (1):
where C
i is the concentration of the element in the sample under investigation (mg/kg); K is the average concentration of this element in the Earth’s crust and clay shales (mg/kg) [
21,
22].
The geoaccumulation index (Igeo) was calculated using the following formula [
23]:
where C
n is the concentration of the analyzed element in bottom sediments, B
n is the geochemical background value (concentration values corresponding to the natural content of elements in clay shales were taken [
21], and 1.5 is the correction factor that takes into account possible natural fluctuations in the concentrations of chemical elements in an environment with low anthropogenic impact.
The following quality classes of bottom sediments are distinguished based on the geoaccumulation index: «0» (Igeo ≤ 0)—uncontaminated; «1» (0 < Igeo < 1)—uncontaminated to moderately contaminated; «2» (1 < Igeo < 2)—moderately polluted; «3» (2 < Igeo < 3)—moderately to heavily polluted; «4» (3 < Igeo < 4)—heavily polluted; «5» (4 < Igeo < 5)—heavily to extremely polluted; «6» (Igeo > 5)—extremely polluted.
2.4.3. Ecotoxicological Criteria for Sediment Quality Assessment
A screening-level ecotoxicological assessment of bottom sediments was performed to evaluate the potential risk posed by sediment-associated trace elements to benthic organisms. For this purpose, the threshold effect concentration (TEC) and probable effect concentration (PEC) were used. The TEC represents the concentration below which adverse effects on benthic organisms are not expected to occur, whereas the PEC represents the concentration above which adverse biological effects are expected to occur more frequently [
24].
Because TEC and PEC values are not available for all chemical elements considered in this study, the lowest effect level (LEL) and severe effect level (SEL) were additionally applied. Exceedance of the LEL indicates the possibility of initial adverse effects on benthic organisms, whereas exceedance of the SEL indicates a greater likelihood of severe toxic effects [
25]. The measured trace element concentrations at each sampling point were compared with the available TEC, PEC, LEL, and SEL values to assess the potential toxicity of the bottom sediments (
Table 1).
2.5. GIS-Based Data Analysis
Spatial data sources included open attribute datasets and map overlays available through the geographic information system (GIS) user community and Google Earth Engine cloud services. ArcGIS Online basemaps © Esri, DigitalGlobe, and GIS User Community members were used as cartographic base layers.
Spatial data processing and thematic map generation were performed using ArcGIS 10.8 for Desktop (ESRI). Additional tools, including the Geostatistical Analyst extension 10.8 and XTools Pro 21.0, were applied to support spatial analysis, including the identification of relative elevation differences along the river corridor and the delineation of river basin boundaries. Schematic maps were generated, and the spatial distribution of the results was visualized using geographic information analysis methods.
3. Results
3.1. Element Contents of Bottom Sediments of the 2 km Site of the Shagan River
Table 2 shows the content of major elements (Na, Mg, Al, K, Ca, Fe, Mn), trace elements and heavy metals (Li, Be, V, Cr, Co, Ni, Cu, Zn, As, Rb, Sr, Mo, Cd, Cs, Ba, Pb), rare earth elements (La, Ce, Pr, Nd, Sm, Eu, Gd, Dy, Yb), as well as Th and U in the composition of bottom sediments collected at the 2 km site downstream of Lake Atomnoe.
Statistical analysis of total trace element concentrations in bottom sediments revealed significant variability between minimum and maximum values. The coefficient of variation (CV) of element concentrations in bottom sediments along a 2 km stretch of the Shagan River ranged from 21 to 172%, reflecting varying degrees of spatial variability for individual elements.
No element exhibited low variability, defined here as CV values below 20%. Moderate variability, with CV values ranging from 20% to 51%, was observed for Li, Be, Mg, K, Ca, V, Ni, Sr, Mo, Cs, Ba, La, Ce, Pr, Nd, Sm, Eu, Gd, Dy, Yb, and Th, indicating moderate dispersion of concentrations within the study area. High variability with variation coefficients ranging from 51% to 100% was observed for Na, Al, Cr, Fe, Cu, Rb, Cd, Pb and U. Very high variability with variation coefficients exceeding 100% was recorded for Mn, Co, Zn and As.
3.2. Geochemical Assessment of Sediment Quality
3.2.1. Clarke Concentrations
All elements, including rare earth elements and radioactive elements, were analyzed. Since there are no established local background values for element content in bottom sediments for regional delineation, average elemental contents in the upper continental crust (UCC) and shales were used as reference sources.
First, element concentrations were compared with Clarke values for the upper continental crust (UCC) [
21]. These values provide a global geochemical reference representing the average composition of the upper continental crust. This comparison allows the degree of deviation of the studied sediments from average crustal abundances to be evaluated and enables the identification of potential regional geochemical anomalies.
Second, element concentrations were compared with Clarke values for clay shales, which represent a lithologically more appropriate reference material for fine-grained bottom sediments [
21]. Clay shales are commonly used as a sedimentary geochemical reference because their grain-size characteristics, mineral composition, and depositional origin are closer to those of fine-grained modern alluvial and lacustrine-fluvial sediments. This comparison provides a more sediment-specific assessment of relative elemental enrichment.
The first group comprises elements whose maximum concentrations did not exceed the Clarke values for either the upper continental crust or clay shales. This group includes Li, Be, Al, K, V, Cr, Fe, Ni, Rb, Sn, Cs, Ba, La, Ce, Pr, Nd, Sm, Eu, Gd, Dy, Yb, and Th. These elements show no significant enrichment relative to the selected geochemical reference values.
The second group includes elements whose concentrations in the bottom sediments of the studied section of the Shagan River exceeded the Clarke values for the upper continental crust and/or clay shales. Relative to the upper continental crust, the decreasing order of enrichment was as follows: Zn100 > Mn20 > Mo10 > Cd8.0 > U, Sr, As7.0 > Ca3.0 > Pb2.0 > Na1.5. Relative to clay shales, the decreasing order was Zn80 > Mn20 > Mo12.5 > Sr8.0 > Cd, Ca6.0 > U, As4.0 > Na3.0 > Pb2.0 > Mg1.5. The subscript values indicate the approximate factor by which the corresponding Clarke values were exceeded.
The concentrations of indicator elements are presented as concentration clarkes relative to the Upper Continental Crust (UCC) (
Figure 3). The maps, constructed using composite samples (seven sampling stations), visualize the spatial heterogeneity of element distribution and identify local zones of enrichment.
3.2.2. Geoaccumulation Index (Igeo)
The geoaccumulation index (Igeo) was calculated to evaluate the relative accumulation of chemical elements in bottom sediments from the studied section of the Shagan River. Element concentrations in clay shales were used as geochemical background values because they are widely applied as global reference values for fine-grained sedimentary materials [
21]. The calculated Igeo values for the analyzed elements are presented in
Table 3.
The distribution of Igeo values shows that sediment classification ranges from uncontaminated to extremely contaminated, with values between −4.48 and 5.79 depending on the element considered.
For most elements, including Li, Be, Mg, Al, K, V, Cr, Fe, Co, Ni, Cu, Rb, Cs, Ba, rare earth elements (REEs), and Th, Igeo values were below zero. These values correspond to the uncontaminated class. For Pb, the Igeo value was below 1, corresponding to the uncontaminated to moderately contaminated class and indicating slight relative enrichment.
The Igeo values for Na, Ca, As, Cd, and U ranged from 1 to 2, corresponding to the moderately contaminated class and indicating moderate relative accumulation in the studied sediments. Sr showed an Igeo value within the range of 2 to 3, classifying the sediments as moderately to heavily contaminated. Mn and Mo showed Igeo values between 3 and 4, corresponding to the heavily contaminated class.
The highest Igeo value was recorded for Zn (5.79), corresponding to the extremely contaminated class.
3.3. Assessment of Bottom Sediments Ecotoxicity
Due to the elevated concentrations of several trace elements, particularly heavy metals, a screening-level ecotoxicological assessment of bottom sediments from the studied section of the Shagan River was performed. The assessment was based on comparison of the measured concentrations with commonly used indicative sediment-quality thresholds for freshwater sediments, including the threshold effect concentration (TEC) and probable effect concentration (PEC) [
24], as well as the lowest effect level (LEL) and severe effect level (SEL) [
25]. These criteria provide a preliminary basis for evaluating the likelihood of adverse biological effects and identifying elements that require further ecological investigation. It should also be noted that sediment quality assessment based on sediment quality guidelines (TEC, PEC, LEL, and SEL) reflects only the potential likelihood of adverse biological effects. Confirmation of the actual toxicity of the bottom sediments requires specialized bioassays and other ecotoxicological investigations involving aquatic organisms.
The results showed that TEC values were exceeded for Cu, As, Cd, and Zn by factors of 1.5, 3.9, 5.5, and 60, respectively. LEL exceedances were identified for a broader set of elements, including Ni, Cr, Cu, As, Cd, Mn, and Zn, with exceedance factors of 2.0, 2.1, 3.0, 6.3, 9.0, 36, and 62, respectively.
Zinc exceeded the PEC, which indicates concentrations associated with probable adverse biological effects, by a factor of 16 and exceeded the SEL by a factor of 9. In addition, Mn exceeded the SEL by a factor of 15.
4. Discussion
4.1. Major Geochemical Anomalies
Comparison of the measured mean element concentrations with average concentrations in clay shales [
21] allowed the identification of element groups that define the geochemical profile of the studied section of the Shagan River. The most pronounced enrichment was observed for Zn, Mn, and Mo, whose concentrations exceeded the clay shale background by more than one order of magnitude. Additional enrichment was identified for Sr, Cd, Ca, U, As, Na, Pb, and Mg, with exceedance factors ranging from 1.5 to 10. These patterns indicate relative geochemical enrichment with respect to the selected sedimentary background. However, elevated concentrations alone do not provide direct evidence of anthropogenic pollution, because such enrichments may also result from natural geological, mineralogical, sedimentological, or biogeochemical processes [
41].
It should be noted that Ca, Na and Mg are among the main macrocomponents, the content of which in the studied bottom sediments exceeds the corresponding clarke values for the upper continental crust and shales. Elevated concentrations of these elements are consistent with the hydrochemical features of the Shagan River. As presented in earlier works [
33,
34,
35,
38], the concentrations of the main macrocomponents in the river waters change synchronously with the total mineralization; according to the anion composition, the waters belong to the chloride-sulfate type, and according to the cation composition, they are sodium–magnesium, sodium–potassium or sodium–calcium. Aidarkhanov et al. (2010) [
30] suggested that the increased mineralization of surface waters may be associated with the presence of several zones of mineralized groundwater discharge into the riverbed. Spatial variability in total mineralization and major cation concentrations is also considered evidence of the influx of groundwater with varying degrees of mineralization. Under these conditions, prolonged discharge of mineralized groundwater could have facilitated the influx of Ca, Na, and Mg into the river system and their subsequent accumulation in bottom sediments, consistent with exceeding their clarke values.
Overall, the calculated geoaccumulation index (Igeo) values indicate element-specific enrichment in the bottom sediments of the studied section of the Shagan River relative to the selected geochemical background. Consistent exceedances of the Igeo above background levels were also observed for several elements, particularly Zn, Mn, and Mo. However, high Igeo values indicate the magnitude of deviation from the selected geochemical background and do not by themselves identify the source of enrichment. The observed Zn enrichment may reflect local geochemical characteristics of the sedimentary material, external element inputs, or a combination of both.
Since the obtained results do not allow for a definitive determination of the source of Zn, Mn, and Mo, the discussion is based on an analysis of the most probable accumulation mechanisms, taking into account the hydrogeological features of the study area and published literature.
Considering the results presented in the study [
31], it is noted that cavities formed after underground nuclear explosions in vertical boreholes are located below the groundwater level, and prolonged elevated temperatures can facilitate the development of thermal convection and hydrogeochemical migration. Under these conditions, groundwater is capable of mobilizing and transporting chemical elements, including Zn, Mn, and Mo, if present in migratory forms in the explosion zone, in the direction of the regional filtration flow toward the discharge zone. Since the maximum values of Zn, Mn, and Mo in this study are confined to the groundwater discharge zone, this mechanism is considered as one of the possible causes of the observed geochemical anomaly.
These results indicate significant relative enrichment within the study area. However, the observed deviations from background values do not allow for a definitive determination of the sources of these elements. Therefore, enrichment patterns should be interpreted as evidence of geochemical anomalies requiring further investigation, rather than as direct evidence of specific natural or anthropogenic sources. Source attribution remains limited, as this assessment is based on total element concentrations and geochemical indices and does not include mineralogical, isotopic, species-specific, or detailed hydrogeochemical analyses.
4.2. Possible Factors Influencing Geochemical Characteristics
The identified element distribution patterns may reflect the combined influence of several natural processes controlling bottom sediment formation. Potentially relevant factors include hydrogeological conditions, particularly groundwater discharge and localized inputs of dissolved and suspended element-bearing phases. According to [
42], active groundwater discharge occurs at the 2 km site in a northeastern direction from Lake Atomnoe through layered sand–gravel interbeds. This discharge is associated with the transport of particles that are lithologically distinct from sediments occurring in the lower reaches of the Shagan River. Such hydrogeological conditions may contribute to elevated or anomalous concentrations of specific elements. However, within the scope of the present study, this interpretation remains a working hypothesis.
Element redistribution may also be influenced by hydrodynamic conditions controlling the transport, sorting, and deposition of fine-grained particles with high sorption capacity [
43,
44,
45]. Additional controlling factors may include granulometric and textural heterogeneity and the proximity of the Lake Atomnoe outlet zone to the studied section of the Shagan River. Similar patterns have been reported in previous studies. Ref. [
46] indicated that heavy metal concentrations may increase in the upper and middle reaches of rivers due to the accumulation of fine-grained fractions with high sorption capacity. Refs. [
47,
48] also reported that spatial heterogeneity in element distribution may be controlled by local inputs, hydrodynamic conditions, and suspended material redistribution, whereas dilution and sediment sorting processes tend to be more relevant in lower river reaches.
Secondary concentration processes may also contribute to element redistribution, particularly evaporative enrichment under the regional climatic conditions [
49]. In the studied region, semi-arid climatic conditions favor continental salt accumulation processes, which may enhance the concentration of dissolved constituents and their subsequent redistribution within the rock–soil–bottom sediment system. Shallow groundwater occurrence and intense evaporation may further promote local concentration of dissolved components. In addition, the geological structure of the area, characterized by Paleozoic sedimentary and igneous rocks with well-developed fracturing, may facilitate the migration and input of chemical elements into bottom sediments [
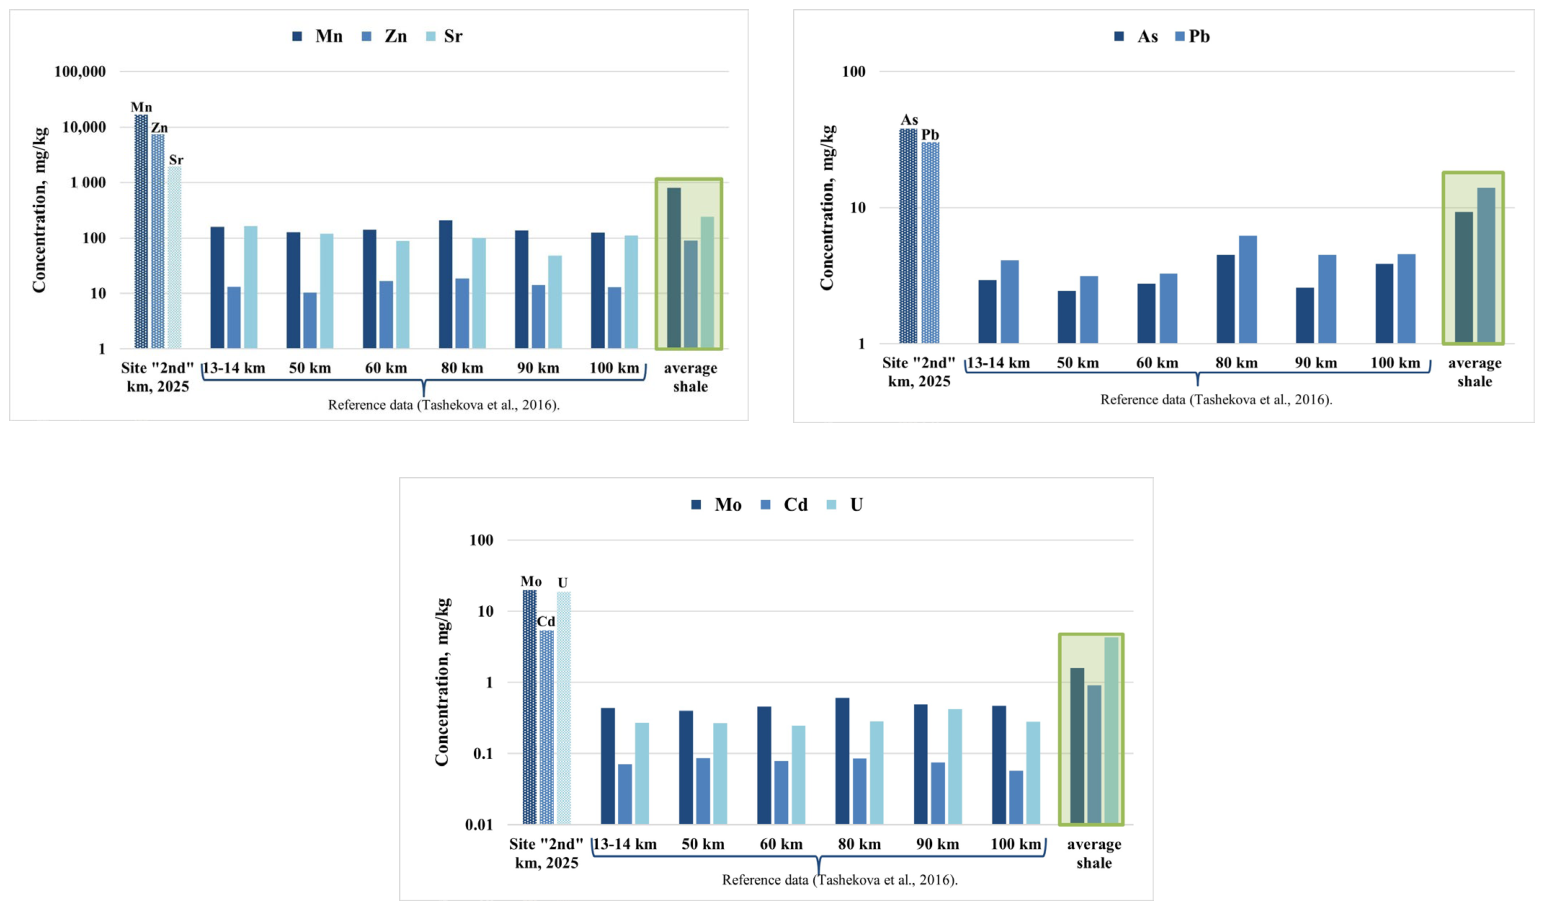
37]. Comparison with values reported in an earlier study [
35] showed that the mean concentrations of the selected element groups at the 2 km site of the Shagan River are higher than those reported for downstream sections of the river (
Figure 4).
Comparison with previously published data shows that the concentrations of the selected elements within the study area are generally 5 to 500 times higher for different elements than in the lower sections of the Shagan River. However, this comparison must be interpreted with caution because of methodological and temporal limitations, including differences in sampling periods, spatial resolution, analytical coverage, and the absence of an equivalent high-density survey for the downstream reaches. The sampling season should be particularly highlighted, as it could have contributed to the differences identified, since seasonal changes in the hydrological regime can influence sedimentation processes, redistribution of chemical elements, and the intensity of groundwater discharge. Therefore, the comparison should be considered qualitative and should not be interpreted as establishing strict quantitative equivalence between datasets.
Overall, the observed patterns are consistent with previously described trends in riverine sediment systems, particularly the influence of local hydrodynamic conditions, sediment sorting, and fine-grained particle accumulation on trace element distributions. Nevertheless, the interpretation remains tentative because the available data do not allow definitive discrimination among natural lithological controls, sediment redistribution processes, and potential external inputs.
4.3. The Extent to Which Anthropogenic or Technogenic Influences Are Substantiated
The available data do not allow definitive confirmation or exclusion of a significant anthropogenic influence on the geochemical composition of the bottom sediments. Elevated geoaccumulation index (Igeo) values for specific elements indicate relative enrichment with respect to the selected geochemical background. However, enrichment indices alone are insufficient for source attribution.
The absence of data on element bioavailability, chemical speciation, mineralogical composition, grain-size distribution, isotopic characteristics, and site-specific background variability limits the interpretation of the observed anomalies. Consequently, the detected enrichments cannot be unequivocally linked to specific sources, including anthropogenic inputs.
Therefore, potential anthropogenic influence should be considered a plausible but unconfirmed hypothesis. Additional mineralogical, isotopic, hydrogeochemical, and speciation-based analyses are required to distinguish between natural lithological controls, sediment redistribution processes, and possible external contamination sources.
4.4. Environmental Consequences of Exceeding Regulatory Limits
The results of the ecotoxicological assessment, based on comparisons with TEC, PEC, LEL, and SEL [
24,
25,
50,
51,
52], indicate the presence of elements whose concentrations exceed the established indicative threshold values for freshwater bottom sediments. High concentrations of Zn and Mn can lead to a reduction in species diversity, impaired growth and reproductive capacity of benthic organisms, as well as changes in biocenotic relationships [
53]. For Mo, regulatory PEC and SEL threshold values have not been established, making it difficult to assess its ecological risk.
However, the results obtained should be considered solely as a screening assessment of environmental risk, as the study does not include bioassays, benthic community analysis, SEM/AVS analysis, bioavailability data, or normalization for organic matter. Therefore, the results should be interpreted as a screening-level ecological risk assessment rather than as direct evidence of actual ecological damage or toxic effects on aquatic organisms.
Furthermore, the threshold values used were developed for typical freshwater conditions and may have limited applicability in geochemically heterogeneous and mineralized river systems, which increases the uncertainty of interpretation.
Furthermore, the TEC, PEC, LEL, and SEL threshold values are based primarily on the total concentrations of elements and do not take into account their chemical forms, bioavailability, particle size distribution, organic matter content, and mineralogical features of bottom sediments, which can significantly influence the toxic effects of pollutants. Therefore, exceeding these threshold values should be considered evidence of a potential environmental risk, requiring subsequent confirmation by specialized hydrogeochemical and ecotoxicological studies.
Integrated indices of potential toxicity were not calculated, as the purpose of this study was an initial screening assessment of bottom sediment quality for individual elements and the identification of local geochemical anomalies. The use of integrated indices is appropriate for subsequent stages of a comprehensive assessment of the environmental status of the study area.
4.5. Statistic Analysis
The article considers the problem of identifying sources of accumulation and spatial variability of chemical elements based on local geoecological monitoring data (7 sampling posts). Due to the high spatial heterogeneity of the study area, the authors proposed and implemented an integrated approach based on a combination of principal component analysis (PCA).
Principal Component Analysis demonstrated that the first two principal components explained 87.2% of the total variance (PC1 = 67.5%, PC2 = 19.7%), indicating that the geochemical variability can be reliably represented in a two-dimensional PCA space (
Table 4).
Principal Component Analysis (PCA) revealed that the spatial variability of the geochemical composition of the bottom sediments is controlled by three major factors. The first principal component (PC1), accounting for 67.5% of the total variance, is characterized by high positive loadings of Be, Al, K, Cr, Zn, Rb, Ba, REE and Th (loadings ranging from 0.98 to 1.00). The coherent distribution of these elements indicates a common source and a high degree of geochemical association.
The predominance of lithophile elements (K, Al, Rb, Ba, and Th) together with rare earth elements (La-Yb) suggests that PC1 represents a lithogenic factor reflecting the influence of the mineralogical composition of the sediments and the parent geological material. Rare earth elements are generally characterized by low mobility under natural environmental conditions and conservative geochemical behavior; therefore, their distribution in bottom sediments is primarily controlled by the composition of the terrigenous material. The high loadings of Al and K further indicate the contribution of the aluminosilicate fraction, whereas the enrichment of Ba and Rb is commonly associated with K-feldspars, micas, and fine-grained clay minerals.
The high loadings of Zn and Cr within PC1 are also likely to reflect their predominant lithogenic origin and association with the aluminosilicate matrix. Within the investigated dataset, these elements exhibit a distribution pattern consistent with the lithophile assemblage, suggesting that their variability is mainly governed by natural geological processes rather than by an independent anthropogenic source.
The second principal component (PC2), explaining 19.7% of the total variance, is dominated by high positive loadings of V, Mn, Fe, Co, Ni, As (loadings ranging from 0.90 to 1.00). In contrast to PC1, this component does not primarily reflect the bulk mineralogical composition of the sediments but rather represents processes controlling the redistribution of trace elements within the surface sediment layer. The dominant contributions of Fe and Mn indicate the important role of iron and manganese oxides and oxyhydroxides, which act as highly effective natural sorbents for numerous trace elements.
The close association of Ni, Co, V, and As with Fe and Mn suggests that the accumulation of these elements is controlled by adsorption, co-precipitation, and subsequent remobilization processes occurring on Fe-Mn oxyhydroxides. Similar elemental associations have been widely reported for bottom sediments, where changes in redox conditions promote either the dissolution or precipitation of Fe-Mn mineral phases, resulting in the redistribution of associated trace elements. In addition, PC2 may reflect local variations in hydrodynamic conditions, sediment grain-size composition, and early diagenetic processes, all of which contribute to the spatial heterogeneity of trace-element distribution.
The third principal component (PC3), accounting for 6.7% of the total variance, is characterized by high positive loadings of Ca, Sr and Cs. This elemental association indicates the influence of local mineralogical characteristics within the study area. The strong loadings of Ca and Sr are consistent with the presence of carbonate material, as strontium is well known to substitute for calcium in the crystal lattice of carbonate minerals and biogenic carbonates. The elevated loading of Cs most likely reflects its preferential fixation by clay minerals, particularly illite and mixed-layer aluminosilicates. Therefore, PC3 represents the influence of local mineralogical variability and differences in sediment composition, although its contribution to the overall geochemical variability is considerably smaller than that of the dominant lithogenic factor represented by PC1.
4.6. Limitations of the Study and Directions for Future Research
The main limitation of this study is that the assessment is based on total element concentrations and geochemical indices, without determination of element speciation or bioavailability. The dataset was obtained from a single sampling campaign conducted within one section of the Shagan River and did not include a contemporaneous control site. These factors limit the possibility of assessing temporal variability and establishing robust spatial comparisons with unaffected reference conditions.
The absence of mineralogical data, grain-size distribution, isotopic analyses, organic matter content, and detailed hydrogeochemical parameters also constrains the interpretation of the mechanisms controlling element migration, accumulation, and redistribution in bottom sediments. In addition, although radionuclide contamination is relevant to the environmental context of the study area, radionuclides were not analyzed in the present work. This limits the integration of the chemical and radioactive components of sediment contamination.
Because the approach did not include quantitative assessment of bioavailability, chemical speciation, or source-specific tracers, conclusions regarding the origin of the detected enrichments remain inferential. Future research should integrate geochemical, mineralogical, granulometric, isotopic, hydrogeochemical, biological, and toxicological analyses. Such an integrated approach would allow a more robust assessment of sediment quality, improve discrimination among natural and anthropogenic controls, and clarify the processes governing the spatial distribution of trace elements in the Shagan River.
5. Conclusions
Bottom sediments from the conventionally designated 2 km site of the Shagan River showed marked spatial heterogeneity and relative enrichment of several elements compared with upper continental crust and clay-shale reference values. Mn, Mo, and Zn exceeded the selected backgrounds by more than one order of magnitude and therefore defined the principal geochemical anomaly of the studied river section.
The geoaccumulation index (Igeo) classified the sediments from uncontaminated to extremely contaminated, depending on the element considered. Mn and Mo corresponded to the heavily contaminated class, while Zn reached the extremely contaminated class. These results confirm substantial relative accumulation but do not establish whether its origin is lithological, sedimentological, hydrogeochemical, or anthropogenic.
Concentrations of several elements were also higher than those previously reported in downstream sections. This pattern may reflect local hydrodynamic conditions, fine-grained sediment accumulation, groundwater–surface water interactions, and site-specific geochemical characteristics. However, the comparison remains qualitative because the datasets differ in sampling period, spatial resolution, analytical coverage, and supporting mineralogical and granulometric information.
Sediment-quality screening identified the most critical threshold exceedances for Zn and Mn: Zn exceeded the probable effect concentration and severe effect level, while Mn exceeded the severe effect level. Additional TEC or LEL exceedances occurred for Cu, As, Cd, Ni, and Cr. These findings indicate potential adverse effects on benthic organisms but do not demonstrate actual toxicity because bioavailability, chemical speciation, sediment-normalization parameters, benthic community responses, and direct ecotoxicological tests were not assessed.
Principal component analysis indicated that sediment composition is primarily controlled by a lithogenic factor (PC1) associated with terrigenous and aluminosilicate material. Fe–Mn oxyhydroxide-mediated sorption and remobilization constitute a secondary control (PC2), while local carbonate and clay variability is represented by PC3. Overall, natural geochemical and early diagenetic processes appear to govern much of the observed variability, although external inputs cannot be excluded.
Future studies should combine seasonal monitoring and a broader sampling network, including suitable reference sites, with hydrogeochemical, mineralogical, granulometric, isotopic, and ecotoxicological analyses of sediments and waters. This integrated approach would clarify the origin and mobility of the anomalies and provide a more robust environmental risk assessment of the Shagan River.




 ,
,