Article

Evaluation of ERA5-Land Against Ground-Based Precipitation Observations in Supporting Landslide Analysis in Pannonian Croatia


1
Croatian Geological Survey, Sachsova 2, 10000 Zagreb, Croatia
2
Laboratory of Atmospheric Physics, Physics Department, University of Patras, 26504 Rio, Greece
*
Author to whom correspondence should be addressed.
Water 2026, 18(15), 1783; https://doi.org/10.3390/w18151783
Submission received: 24 June 2026 / Revised: 20 July 2026 / Accepted: 21 July 2026 / Published: 23 July 2026
(This article belongs to the Special Issue Water Management and Geohazard Mitigation in a Changing Climate)

Abstract

Due to its global coverage, high temporal and enhanced spatial resolution (compared with the ERA5 product), and open availability, the ERA5-Land global atmospheric reanalysis dataset offers a promising framework for various applications in environmental modeling. In this study, the ERA5-Land post-processed daily precipitation product was compared against ground-based observations to evaluate its reliability in representing regional precipitation patterns and its capacity to reproduce landslide-triggering rainfall conditions. The investigation was conducted across five landslide locations in Pannonian Croatia over a 35-year period (1990–2024). It encompassed a comparative statistical analysis of daily and monthly precipitation, an evaluation of rainfall day and event frequency distributions, and a reconstruction of specific historical landslide-triggering events. The results confirm that ERA5-Land exhibits a systematic dual bias, overestimating low-intensity precipitation frequencies while underestimating high-intensity rainfall peaks. Concurrently, the pronounced drizzle effect directly increases the duration of rainfall events, altering landslide-triggering rainfall conditions. The findings align with previous research, confirming that ERA5-Land data can effectively capture broad, long-term regional climate trends and track antecedent rainfall indices. However, its integration into operational landslide early warning systems would benefit from statistical bias-correction or localized calibration to reduce systematic errors.

1. Introduction

Landslides are the most widespread geohazard events, posing a major threat to human lives, infrastructure, and the socioeconomic environment [1,2,3]. Defined in the simplest way as any downslope movement of a mass of rock, earth or debris [4], landslides are preconditioned by inherent factors (such as geological and lithological settings, soil properties, topography and terrain morphology) but require an external dynamic trigger to initiate movement. Among these triggering mechanisms, rainfall-induced landslides are the most frequent [5,6]. They are activated by the infiltration of water that leads to soil saturation and a subsequent rise in pore-water pressure, thereby reducing the soil’s shear strength [7,8]. Beyond infiltration and intrinsic soil properties, groundwater conditions are also influenced by antecedent soil moisture content and the pre-existing rainfall history [9]. These factors govern the timing of landslide activation, so slope failure can occur either rapidly during an intense rainfall event or with a significant temporal lag following the cessation of precipitation.
The relationship between precipitation and landslide occurrence has long been the focus of extensive research, primarily aimed at defining critical rainfall thresholds that trigger landslides. In the current era of increasing frequency of extreme meteorological events, this topic has become more urgent for forecasting the temporal probability of landslide hazards and establishing operational early warning systems. Rainfall thresholds are defined as the rainfall conditions that are likely to trigger landslides when reached or exceeded and can generally be divided into physically based and empirical models [10]. Among these, empirical thresholds remain the most widely applied approach for regional hazard assessments [11,12]. They are typically established by analyzing historical rainfall events associated with past landslide occurrences with the following configurations being most commonly used worldwide [10,13,14]: (i) intensity–duration (I-D) thresholds, which evaluate the power-law relationship between the mean event intensity and event duration, and (ii) event rainfall amount–duration (E-D) thresholds, which analyze the total event precipitation against time. Furthermore, a third category of empirical thresholds considers the antecedent rainfall accumulation.
Because empirical models rely entirely on statistical relationships between slope failures and meteorological inputs, their predictive accuracy is highly dependent on the completeness of landslide inventories and the spatial and temporal resolution of the available precipitation data. Historically, ground-based rain gauges have been the dominant source of meteorological data used for landslide threshold analysis [12]. However, their effectiveness can be influenced by factors such as an uneven spatial distribution, the time of their establishment, and the accuracy of both instruments and human operation [15]. To overcome these limitations, satellite- and reanalysis-based gridded precipitation datasets have increasingly emerged as a valuable alternative due to their almost-global coverage (extending to areas not covered by ground-based instruments), temporal consistency, and growing open availability [16]. In this context, a prominent example is the global dataset for the land component of the fifth generation of European reanalysis (ERA5-Land), produced by the European Centre for Medium-Range Weather Forecasts as part of the Copernicus Climate Change Service of the European Commission [17]. It is generated by forcing the land component of the ERA5 reanalysis with atmospheric forcing adjusted for elevation differences through a lapse-rate correction. The dataset provides near-global gridded coverage at a horizontal resolution of 0.1° × 0.1° (~9 km), featuring an hourly temporal resolution as its finest interval, spanning continuously from 1950 to the present. ERA5-Land offers a comprehensive multivariable dataset for more than 50 variables, including hydrological parameters such as total precipitation [18], which is also available as post-processed daily statistics datasets [19].
Across Europe, researchers have evaluated ERA5-Land variables to verify their suitability for regional climate monitoring and hydrological modeling. Specifically, precipitation fields have been validated against dense gauge networks in Spain [20], Greece [21], Portugal [22], Italy [16], Slovenia [23], and the southeastern Alps [24]. However, for landslide applications, the suitability of ERA5-Land cannot be assumed from general precipitation validation alone, because empirical rainfall thresholds depend strongly on event duration, rainfall intermittency, peak intensity, and antecedent wetness conditions. Within this context, soil moisture acts as an important hydrological control variable that directly influences shear strength reduction and pore-water pressure dynamics. Thus, in recent studies, meteorological parameters are increasingly integrated with soil moisture estimates to construct dynamic hydro-meteorological thresholds [25,26,27,28,29]. Concurrently, the ERA5-Land soil moisture variable has been analyzed in Italy to identify pre-failure conditioning and antecedent wetness conditions critical for landslide prediction and to enable the transition toward operational early warning systems [30,31,32,33].
In Croatia, mass movement types such as sliding and flowing are the dominant processes within the continental, Pannonian region. Given that precipitation is their primary trigger, testing the reliability of gridded reanalysis frameworks for landslide hazard analysis represents a logical step. This study, therefore, contributes to the validation of ERA5-Land precipitation data for analyzing landslide-triggering rainfall conditions in Pannonian Croatia, while also broadly testing the performance of ERA5-Land rainfall products across different geographical regions, as such research has not yet been conducted for this specific area.
To address this gap, this study focuses on the evaluation of the ERA5-Land reanalysis product against ground-based meteorological stations of the Croatian National Meteorological and Hydrological Service (DHMZ) across five specific locations in Pannonian Croatia over the last 35 years (1990–2024). The primary objective is to systematically evaluate whether the ERA5-Land dataset is sufficiently reliable to represent regional precipitation patterns and accurately reproduce the rainfall conditions associated with landslide activation. To achieve this goal, a stepwise approach is used: (i) a broad comparative statistical analysis of daily and monthly precipitation between the ERA5-Land and the DHMZ ground-based stations, (ii) an evaluation of the frequency distributions of individual rainfall days (Rd) and independent rainfall events (Re), and (iii) a diagnostic reconstruction of the specific meteorological events that directly triggered landslide activation (LRe). Through this multi-scale validation, the paper provides a comprehensive assessment of both the capabilities and structural limitations of utilizing global reanalysis products for local landslide hazard assessment.

2. Materials and Methods

2.1. Study Area

The wider study area encompasses the northern and eastern continental parts of Croatia (Figure 1), a region that geographically belongs to the European Pannonian Basin System. Covering approximately 30,000 km2, which represents roughly half of the total Croatian territory, this area is naturally bounded by the Sutla, Sava, Drava, and Danube rivers, while gradually transitioning southwards into the mountainous Dinaric region.
The geological framework of the region is characterized by the cores of the highest mountains, including Moslavačka gora, Medvednica, Psunj, and Papuk, which are primarily composed of Palaeozoic, Mesozoic, and Cenozoic magmatic–metamorphic complexes [34,35,36,37,38]. Other mountains and hilly areas are predominantly built of clastic and carbonate rocks of Paleozoic and Mesozoic age [39,40]. The regional hypsometry gradually decreases from west to east, corresponding to the dominant flow direction of the major river systems.
Foothills and loess plateaus are largely composed of heterogeneous Neogene and subordinate Paleogene deposits [41]. Distinct lithological variations occur between the older Neogene units, dominated by moderately to poorly cemented rock complexes, and the younger Pliocene and Plio-Quaternary formations, which mainly consist of unconsolidated sediments such as sand, silt, clay, and gravel [42]. In fragmented hilly and mountainous terrain, the dominant relief-forming processes include sheet and linear erosion, as well as slope processes, particularly landslides [42,43,44]. These processes have produced numerous ravines and valleys, which are locally deeply incised and associated with dense drainage networks prone to torrential flows and flash floods.
The plains of the major rivers are characterized by very low relief energy and extensive alluvial deposits consisting of gravel, sand, silt, and clay, together with aeolian and lacustrine–marsh sediments [38]. Thick loess covers, especially widespread in eastern Croatia, additionally contribute to the geomorphological diversity and local slope instability conditions.
According to the Köppen climate classification [45], the study area is characterized by a temperate humid climate with warm summers [46,47]. Continental Croatia exhibits relatively narrow variations in mean annual air temperature, with regional average values around 11 °C and lower temperatures generally associated with higher elevations [48].
The spatial distribution of precipitation reflects a pronounced macro-climatic transition from the wetter western and central parts to the warmer and drier lowlands in the east. The highest mean annual precipitation amounts are recorded in the mountainous zones of northwestern Croatia, ranging from 1000 to 1500 mm. Conversely, the eastern region represents the driest part of the study area, with annual averages dropping to between 600 and 700 mm. Across the remaining central parts of Pannonian Croatia, mean annual precipitation typically ranges from 700 to 1000 mm [48]. The seasonal precipitation regime defines two precipitation maximums and minimums. Maximum precipitations are recorded during early summer (June) and in late autumn (November), while the primary minimum is typical for the end of winter (February/March), with a secondary minimum in October. Significant historical deviations in monthly totals, statistically exceeded only once in 50 years, have also been documented and are predominantly associated with convective frontal events during August or prolonged rainfall events in November [48].
Within this wider area of the Pannonian region, five specific landslide locations across four counties were chosen as study sites (Figure 1; Table 1). These landslides represent typical mass movements in the region and were selected from the available landslide inventories. It should be emphasized that for the majority of landslides within these inventories, the exact time of activation remains unrecorded, and for those with documented entries, the temporal accuracy varies significantly. Specifically, among the selected locations, a high daily activation accuracy is available for two landslides, whereas the remaining three sites are limited to a monthly temporal resolution. Additionally, this dataset captures four distinct meteorological events across four different years (2014, 2015, 2018, and 2022).

2.2. Precipitation Data

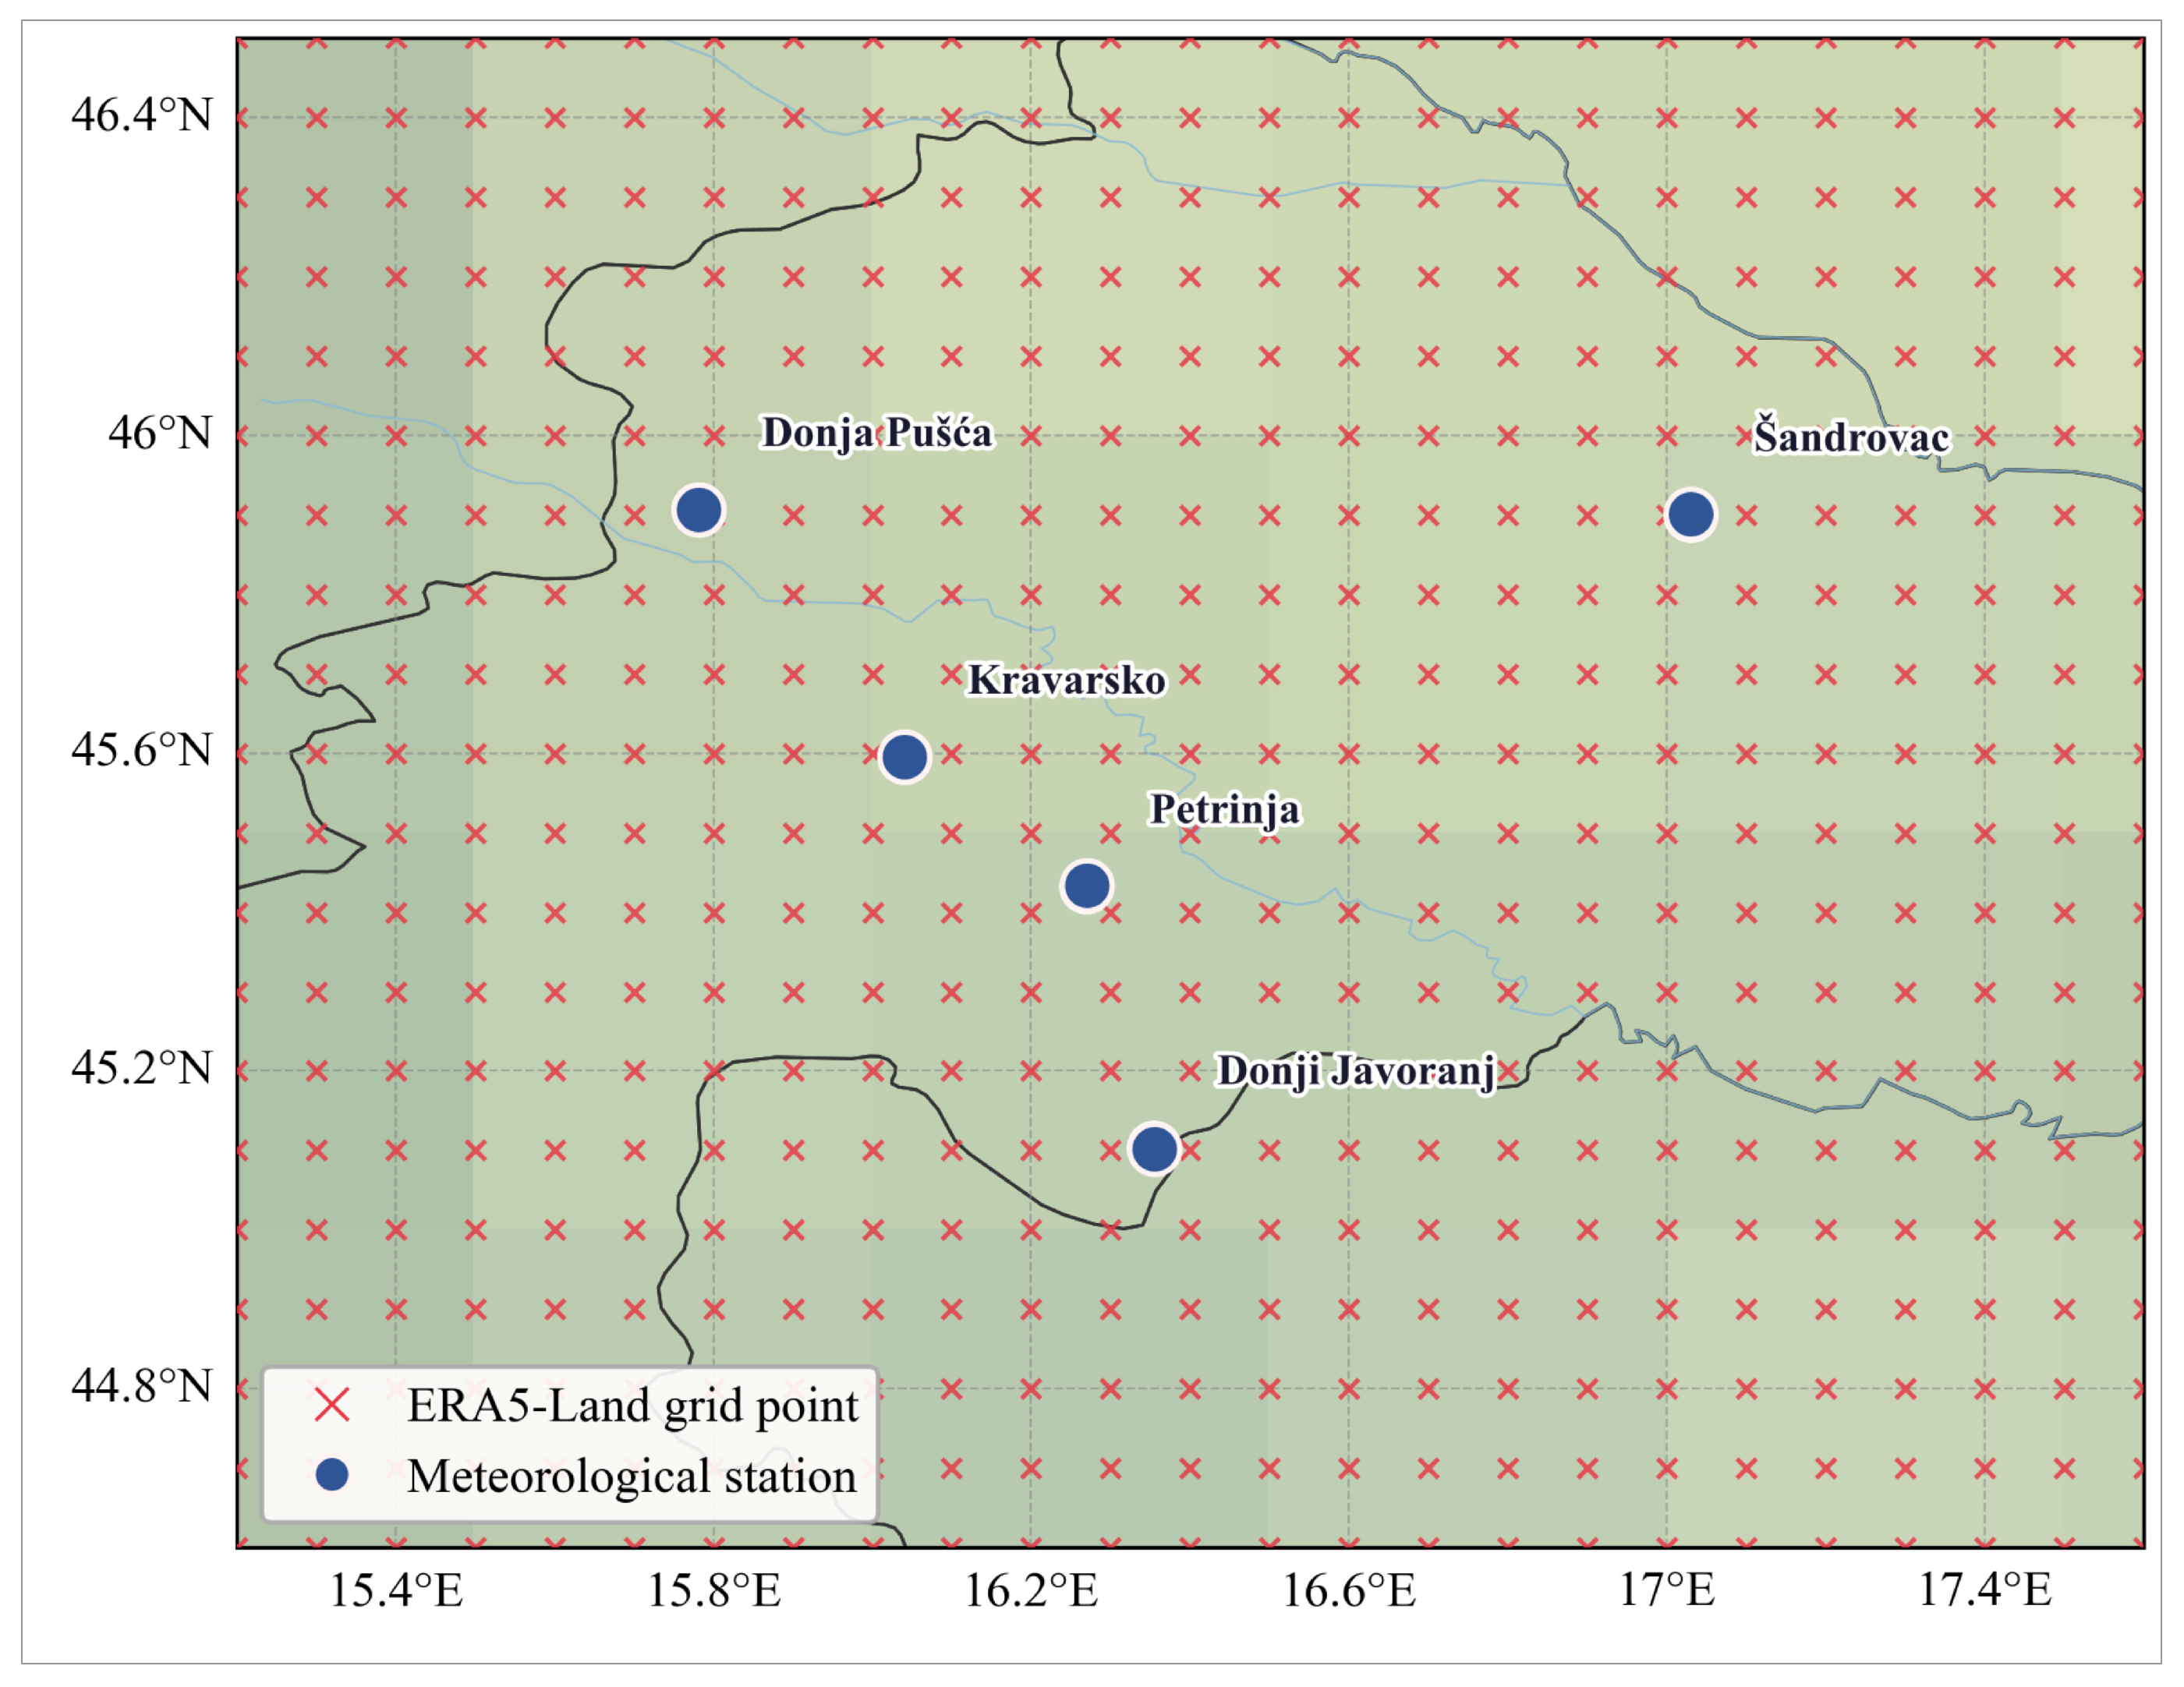
Two sources of precipitation data were compared: a gridded ERA5-Land reanalysis dataset and ground-based DHMZ point observations (Figure 2).

2.2.1. Ground-Based Station Observations

For each landslide location, daily precipitation sums were obtained from the closest ground-based DHMZ meteorological station (Table 2). To account for the unequal amount of missing data across stations, the precise valid observation length for each station was determined by counting the exact number of operational days with data and dividing this sum by 365.25 (to account for leap years) to calculate the equivalent operational years.
According to DHMZ standards, daily precipitation is recorded at 07:00 CET, representing the accumulation of the previous 24 h. Consequently, approximately 70% of the 24 h observation window falls within the preceding calendar day. To optimize the temporal alignment with the calendar day-based ERA5-Land post-processed daily statistics, a temporal adjustment was applied, shifting all DHMZ daily records one day backward. Preliminary sensitivity tests comparing adjusted and unadjusted DHMZ datasets across all stations showed a substantial improvement in performance. On average, R2, r, and ρ increased by 0.24, 0.23, and 0.16, respectively, while MAE and RMSE decreased by 0.80 and 1.43, respectively. Nevertheless, it should be noted that this uniform one-day shift could introduce minor temporal uncertainties, particularly for short-duration, high-intensity convective events.

2.2.2. ERA5-Land Reanalysis Dataset

The ERA5-Land variable used in this study is total precipitation, expressed in meters of water equivalent in the original dataset and converted to millimeters for consistency with the DHMZ observations. This variable was obtained from the ERA5-Land post-processed daily statistics dataset [19], distributed by the Copernicus Climate Change Service (C3S) via the Climate Data Store. The daily statistic was selected as the accumulated precipitation sum, ensuring direct comparability with the daily precipitation totals reported by the DHMZ stations after temporal adjustment. For each DHMZ station, ERA5-Land precipitation was extracted from the surrounding grid cells and interpolated to the station coordinates using the inverse distance weighting method. The interpolation weights were calculated as a function of the distance between the station and each ERA5-Land grid-cell center, giving stronger influence to closer grid cells. It is important to note that while spatial interpolation estimates the grid-scale variables at the station coordinates, it does not resolve the scale mismatch between gridded reanalysis and point rain gauges, and can further smooth localized rainfall extremes.
It should be noted that ERA5-Land represents grid-cell-scale precipitation rather than point-scale gauge measurements. Therefore, localized convective rainfall peaks may be smoothed, while low-intensity precipitation can be spatially overrepresented. This scale mismatch is particularly relevant for landslide-triggering rainfall analysis.

2.3. Statistical Evaluation and Data Analysis

The evaluation of ERA5-Land data was conducted in several steps, moving from a regional statistical perspective to site-specific landslide-triggering events.

2.3.1. Statistical Metrics

Initially, the general performance was assessed using daily and monthly precipitation series across the following statistical metrics (Table 3): mean absolute error (MAE), root mean squared error (RMSE), and relative bias (rBias). To evaluate the model’s ability to explain data variance and linear/monotonic relationships, the coefficient of determination (R2), Pearson correlation coefficient (r), and Spearman rank correlation coefficient (ρ) were employed.
To ensure statistical integrity, data points were only analyzed when records from DHMZ stations were available. If a daily record was missing, that day was excluded from the ERA5-Land dataset as well. Furthermore, monthly totals were calculated if the month had a complete daily dataset or a missing record for a maximum of one day. While this introduces a potential minor underestimation if a rainfall event occurred on the missing day, this threshold was applied as a practical compromise to preserve near-complete operational years in the historical record. Annual sums were then computed strictly for years with all 12 monthly totals.

2.3.2. Frequency Analysis of Rainfall Days (Rd) and Rainfall Events (Re)

In order to identify structural biases, a frequency analysis of Rd and Re was performed. An Rd is defined as a day with a daily precipitation amount of at least 0.1 mm, ensuring consistency with the precision measurement limits of the DHMZ stations. An Re represents a sequence of consecutive rainy days separated by a dry period, which is defined as a period without rain lasting at least 3 days. This definition is partially adapted from Peruccacci et al. [49], taking a mean value of 3 days from their dry-period thresholds, which range from 2 days for dry seasons to 4 days for wet seasons.
To ensure a reliable frequency comparison among stations with varying record lengths and missing data, all counts of Rd and Re were normalized by equivalent operational years (reported in Table 2) to represent average annual values.

2.3.3. Analysis of Specific Landslide-Triggering Rainfall Events (LRe)

Finally, to link the time of landslide activation to specific events, an analysis of LRe was performed, where LRe denotes the event that preceded and was responsible for triggering the landslide. For landslides with a confirmed day of activation, the LRe was identified as the Re immediately preceding the failure. For landslides with a monthly accuracy, if multiple individual Re were recorded, the LRe was defined as the one with the highest cumulative precipitation that terminated within the month of activation.
Each LRe was analyzed through hyetographs, cumulative precipitation, and antecedent rainfall (5, 15, and 30 days). Each LRe was characterized by: (i) the duration of the event defined as the total time from the start to the end of the event (days), (ii) the event rainfall amount defined as the total precipitation accumulated during the event (mm), and (iii) the rainfall mean intensity calculated as the ratio of cumulative rainfall to duration (mm/day). These parameters were utilized to construct I-D and E-D plots, comparing the landslide-triggering rainfall conditions derived from both datasets.

3. Results and Discussion

3.1. Daily and Monthly Precipitation

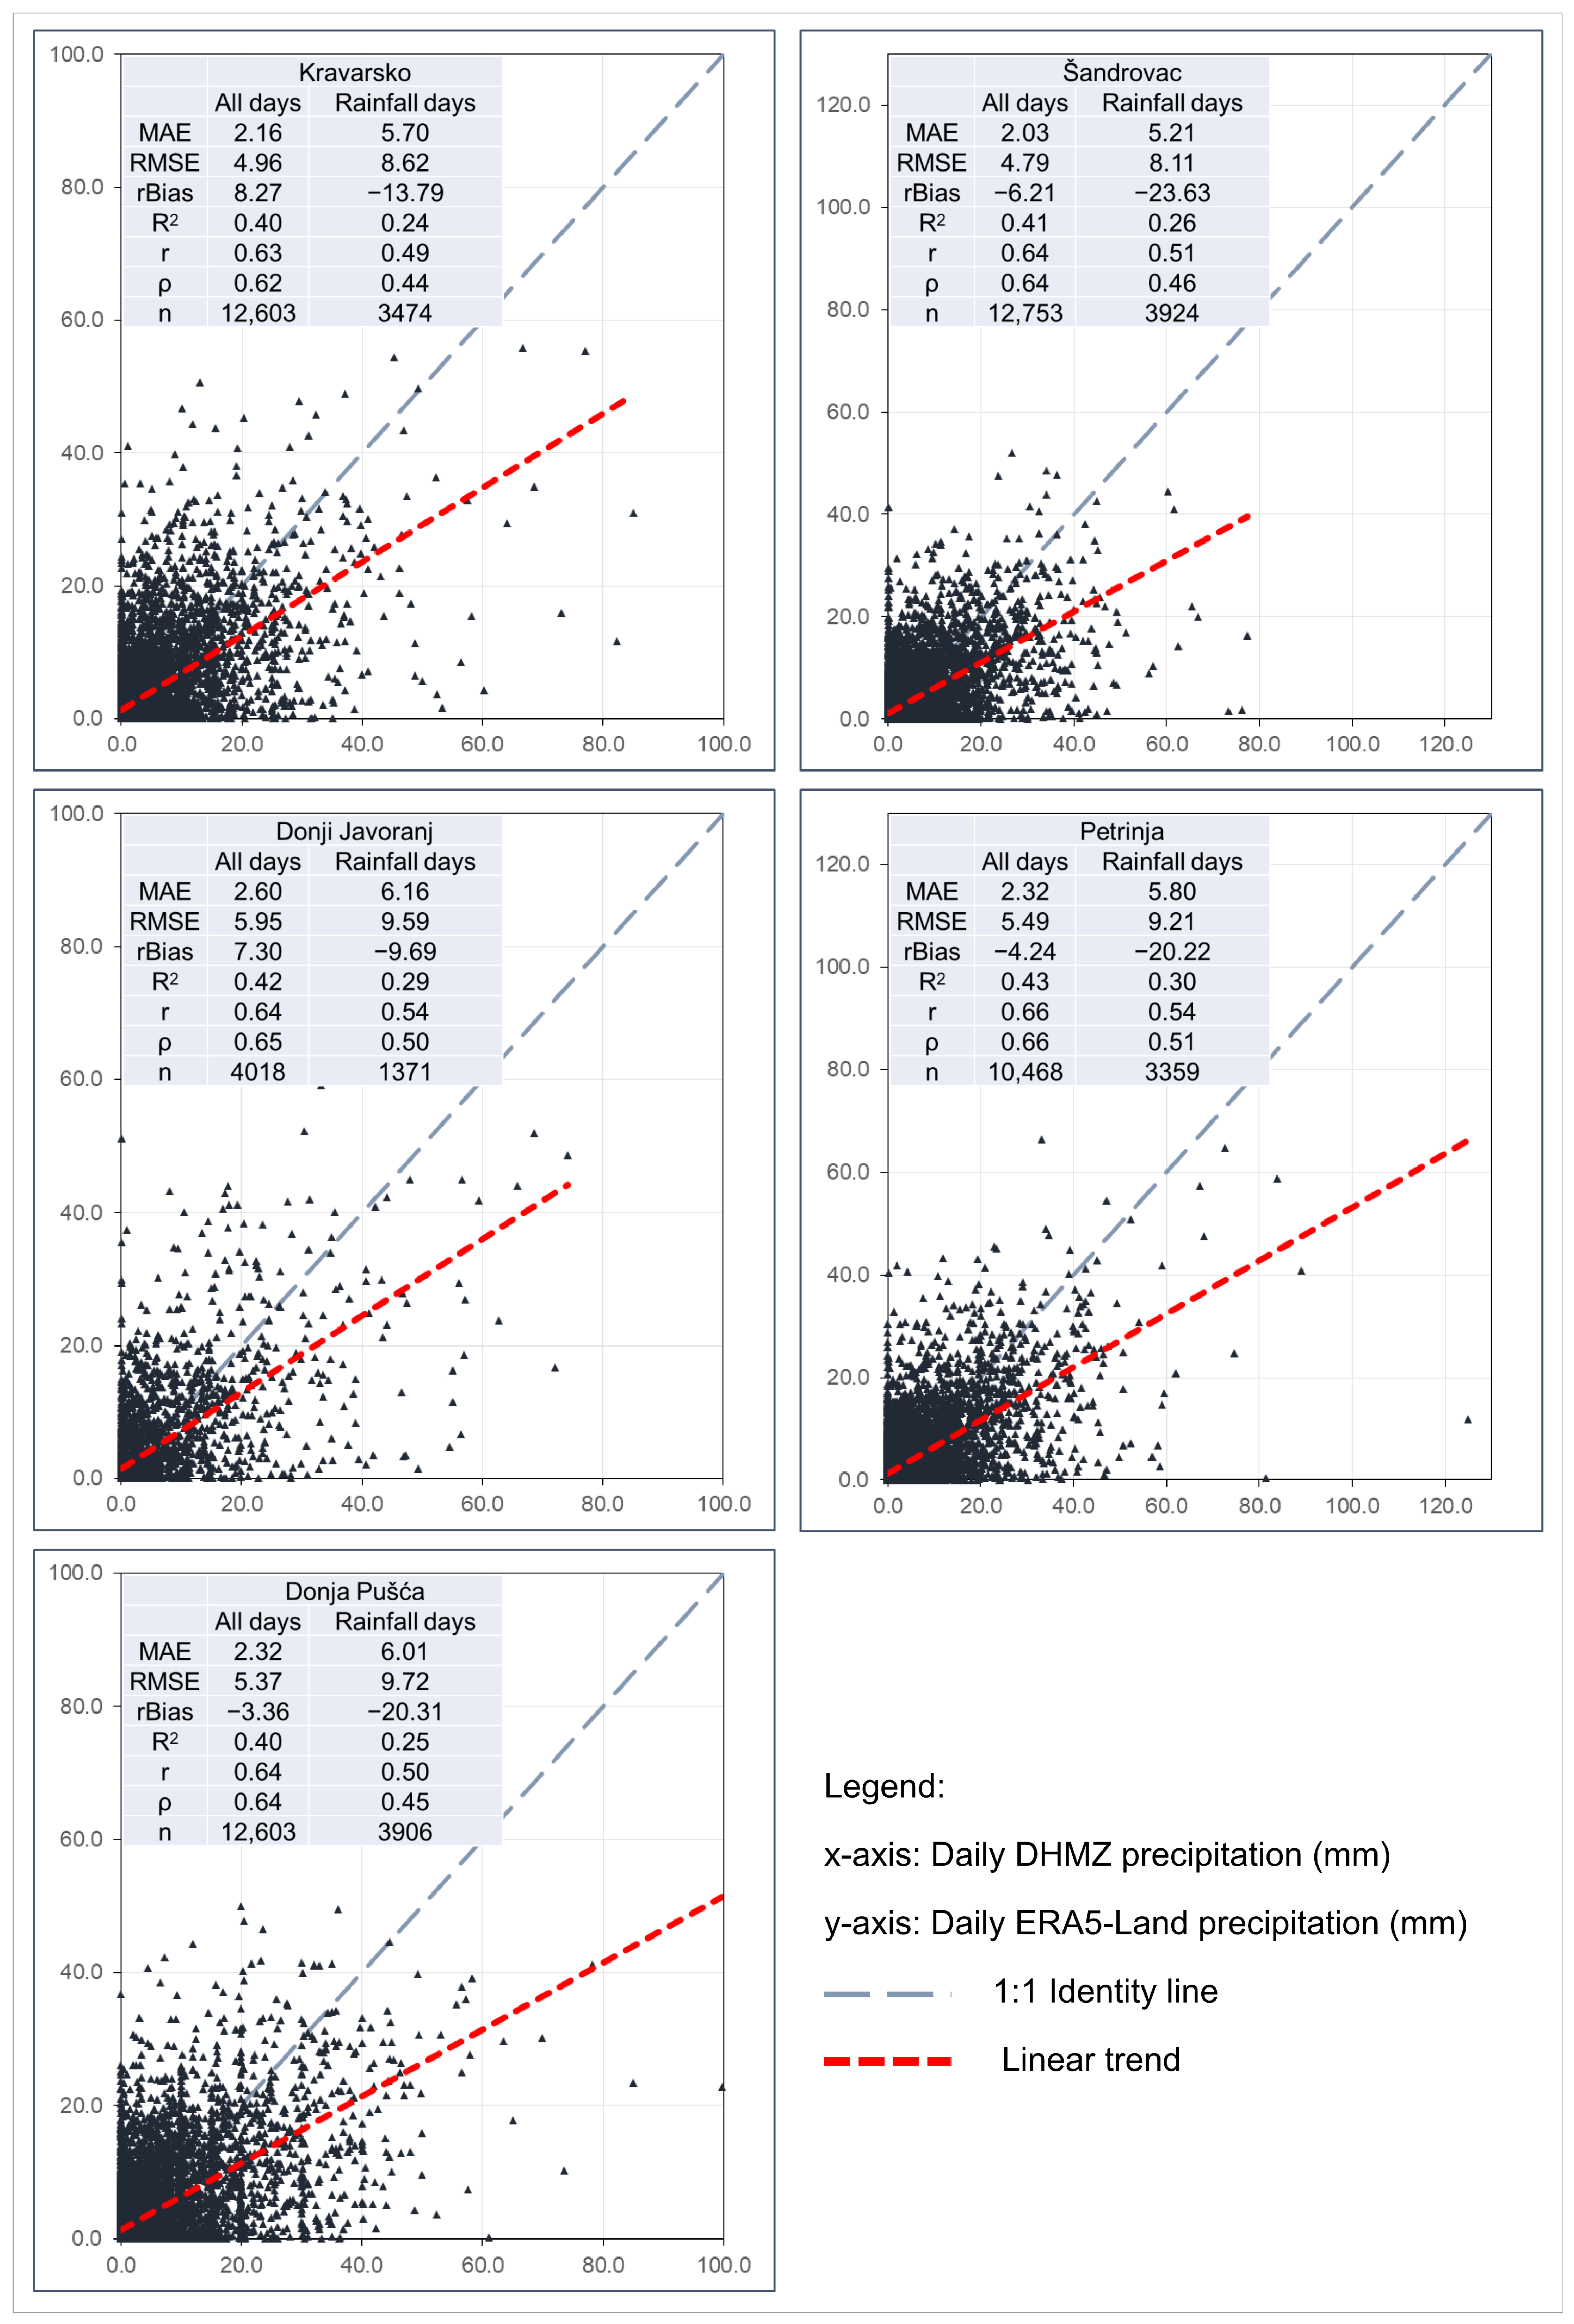
The initial evaluation of the ERA5-Land performance was conducted by comparing the gridded reanalysis estimates against the DHMZ ground-based observations across the five sites on a daily scale (Figure 3). The statistical metrics were calculated for two distinct datasets to isolate the ERA5-Land performance: (i) the complete time series data (“All days”), and (ii) a conditional subset excluding non-Rd (<0.1 mm) at the DHMZ stations (“Rainfall days”).
When considering the complete time series, the results exhibit a moderate but highly consistent correlation across all sites, with the r values ranging from 0.63 to 0.66 and the R2 stabilizing around 0.40. This spatial homogeneity demonstrates that ERA5-Land reliably captures the precipitation patterns across the entire study area, explaining approximately 40% of the daily rainfall variability regardless of the geographical location of the meteorological station. The rBias for the complete series is generally low, ranging from −6.21% to 8.27%, suggesting a good agreement in total precipitation amount over long periods. The highest deviations are recorded with a positive sign for Kravarsko (8.27%) and Donji Javoranj (7.30%), indicating a slight overestimation of total precipitation. The RMSE values across all sites are more than twice as high as the MAE. Because RMSE is mathematically more sensitive to outliers than MAE, this discrepancy provides clear evidence of large errors in the dataset. This implies that while ERA5-Land generally matches the ground-based baseline on most days, it severely miscalculates the daily precipitation amount during isolated extreme meteorological events. Furthermore, the r and ρ values are nearly identical across all stations. This confirms that the observed correlation represents a stable linear relationship throughout the entire dataset.
A significant shift in performance is observed when the analysis is restricted strictly to Rd, enabling a targeted assessment of ERA5-Land’s capacity to accurately quantify daily precipitation. Although a strong regional consistency remains evident, a distinct drop in performance occurs across all locations. The average r value decreases from 0.64 to 0.52, and R2 drops from 0.41 to 0.27. Unlike the complete series analysis, where the high occurrence of dry days (<0.1 mm) inflated the accuracy metrics of ERA5-Land, the conditional subset reveals that the reanalysis product struggles to estimate the exact daily precipitation amount measured at the rain gauges, explaining on average only 27% of the variance when it actually rains. In this conditional subset, the rBias becomes notably negative at all locations, ranging from −9.69% at Donji Javoranj to −23.63% at Šandrovac. This indicates that while ERA5-Land captures general weather trends, it systematically underestimates the precipitation amount on days when rainfall actually occurs, yielding an average underestimation of 17.5% across the study sites. Concurrently, on average, the MAE increases from 2.29 to 5.78 mm, while the RMSE rises from 5.31 to 9.05 mm. This increase is directly caused by the exclusion of no-Rd from the full time series. When these days are removed, the true performance gap is revealed, with the average model discrepancy exceeding 5.78 mm per actual Rd. This analysis highlights a systematic structural limitation in the reanalysis product, meaning that ERA5-Land exhibits a tendency to generate low-intensity precipitation too frequently while failing to capture the high-intensity peaks actually measured at the DHMZ stations.
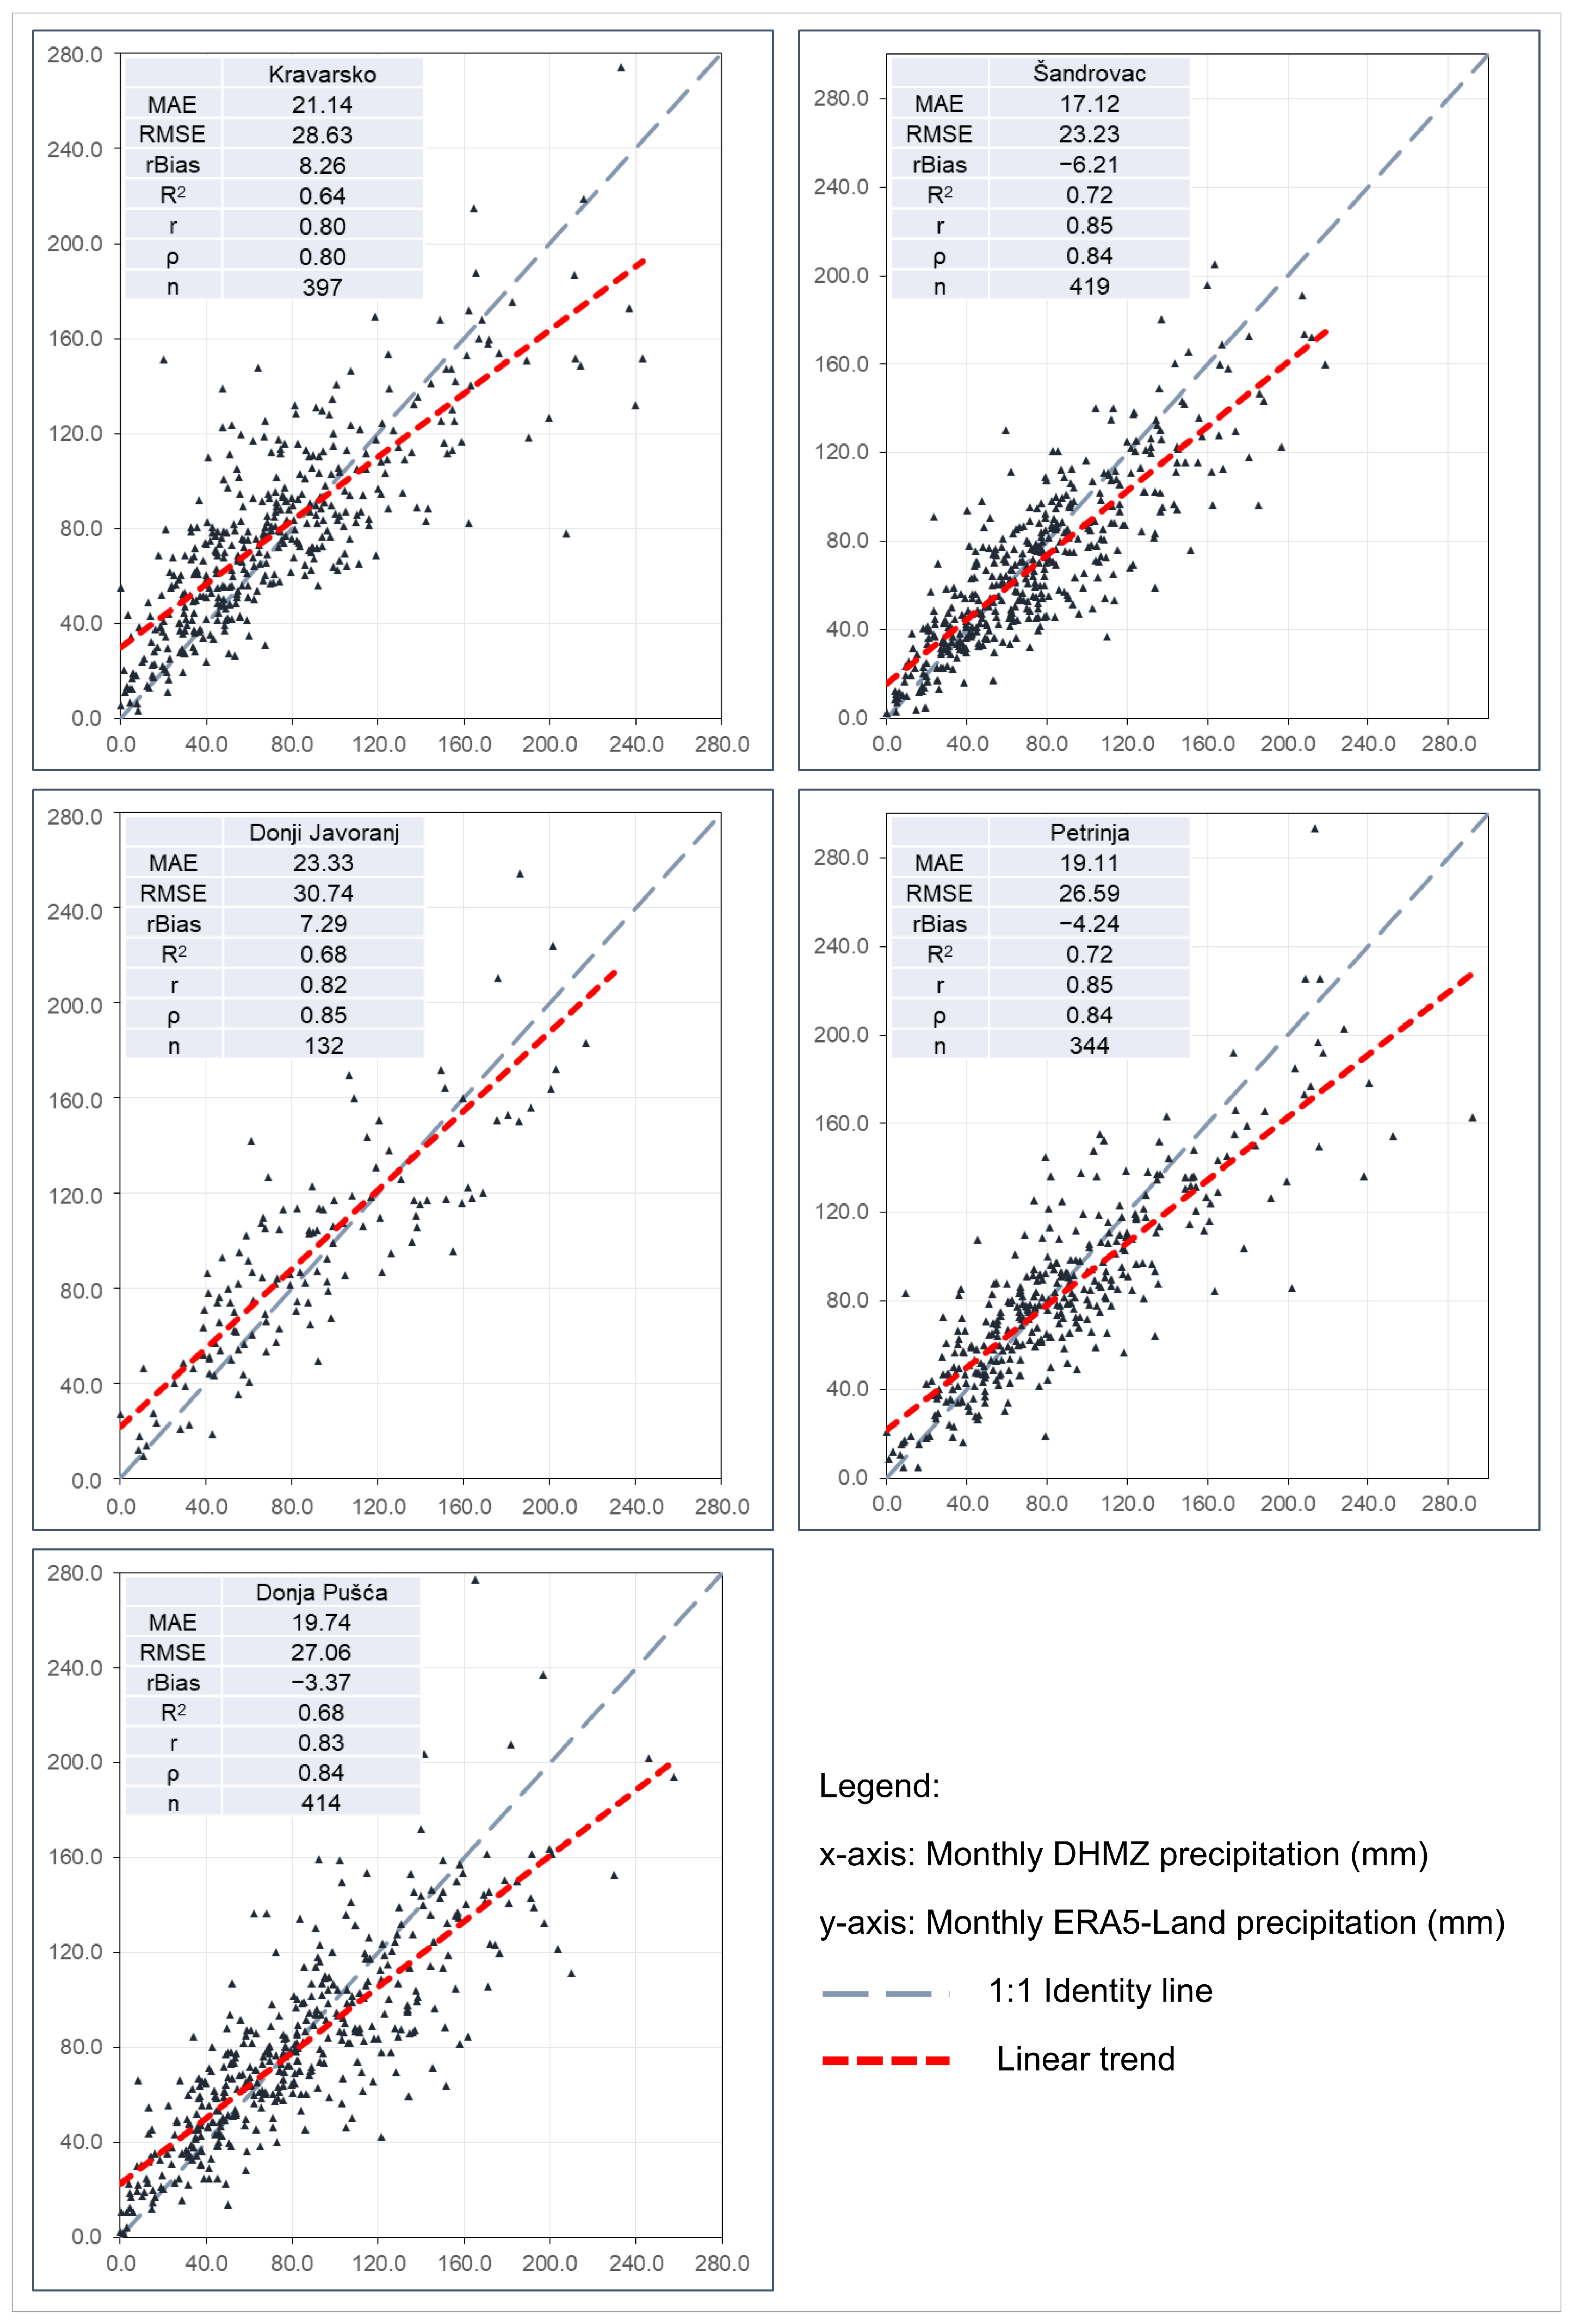
The second evaluation was performed across the five sites by comparing monthly precipitation totals of the two datasets (Figure 4).
On a monthly scale, as expected, the correlation metrics improve significantly across all five study sites. The r values increase to a range of 0.80 to 0.85, indicating a strong relationship and demonstrating ERA5-Land’s capability to capture regional seasonal dynamics. On the scatter plots, the data points are visibly more concentrated around the regression line, which aligns much closer to the 1:1 identity line than observed for the daily precipitation data. Similar to the daily analysis, the r and ρ values remain nearly identical across all stations, confirming a stable linear relationship throughout the monthly dataset. The R2 ranges from 0.64 at Kravarsko to 0.72 at Šandrovac and Petrinja, meaning that the ERA5-Land successfully explains between 64% and 72% of the monthly precipitation variability. At this temporal scale, Kravarsko and Donji Javoranj exhibit a slight positive rBias (+8.26% and +7.29%, respectively), indicating a minor overestimation of total monthly precipitation. Conversely, Šandrovac and Petrinja show a slight negative rBias (−6.21% and −4.24%, respectively), while Donja Pušća displays the best performance with an rBias of −3.37%.
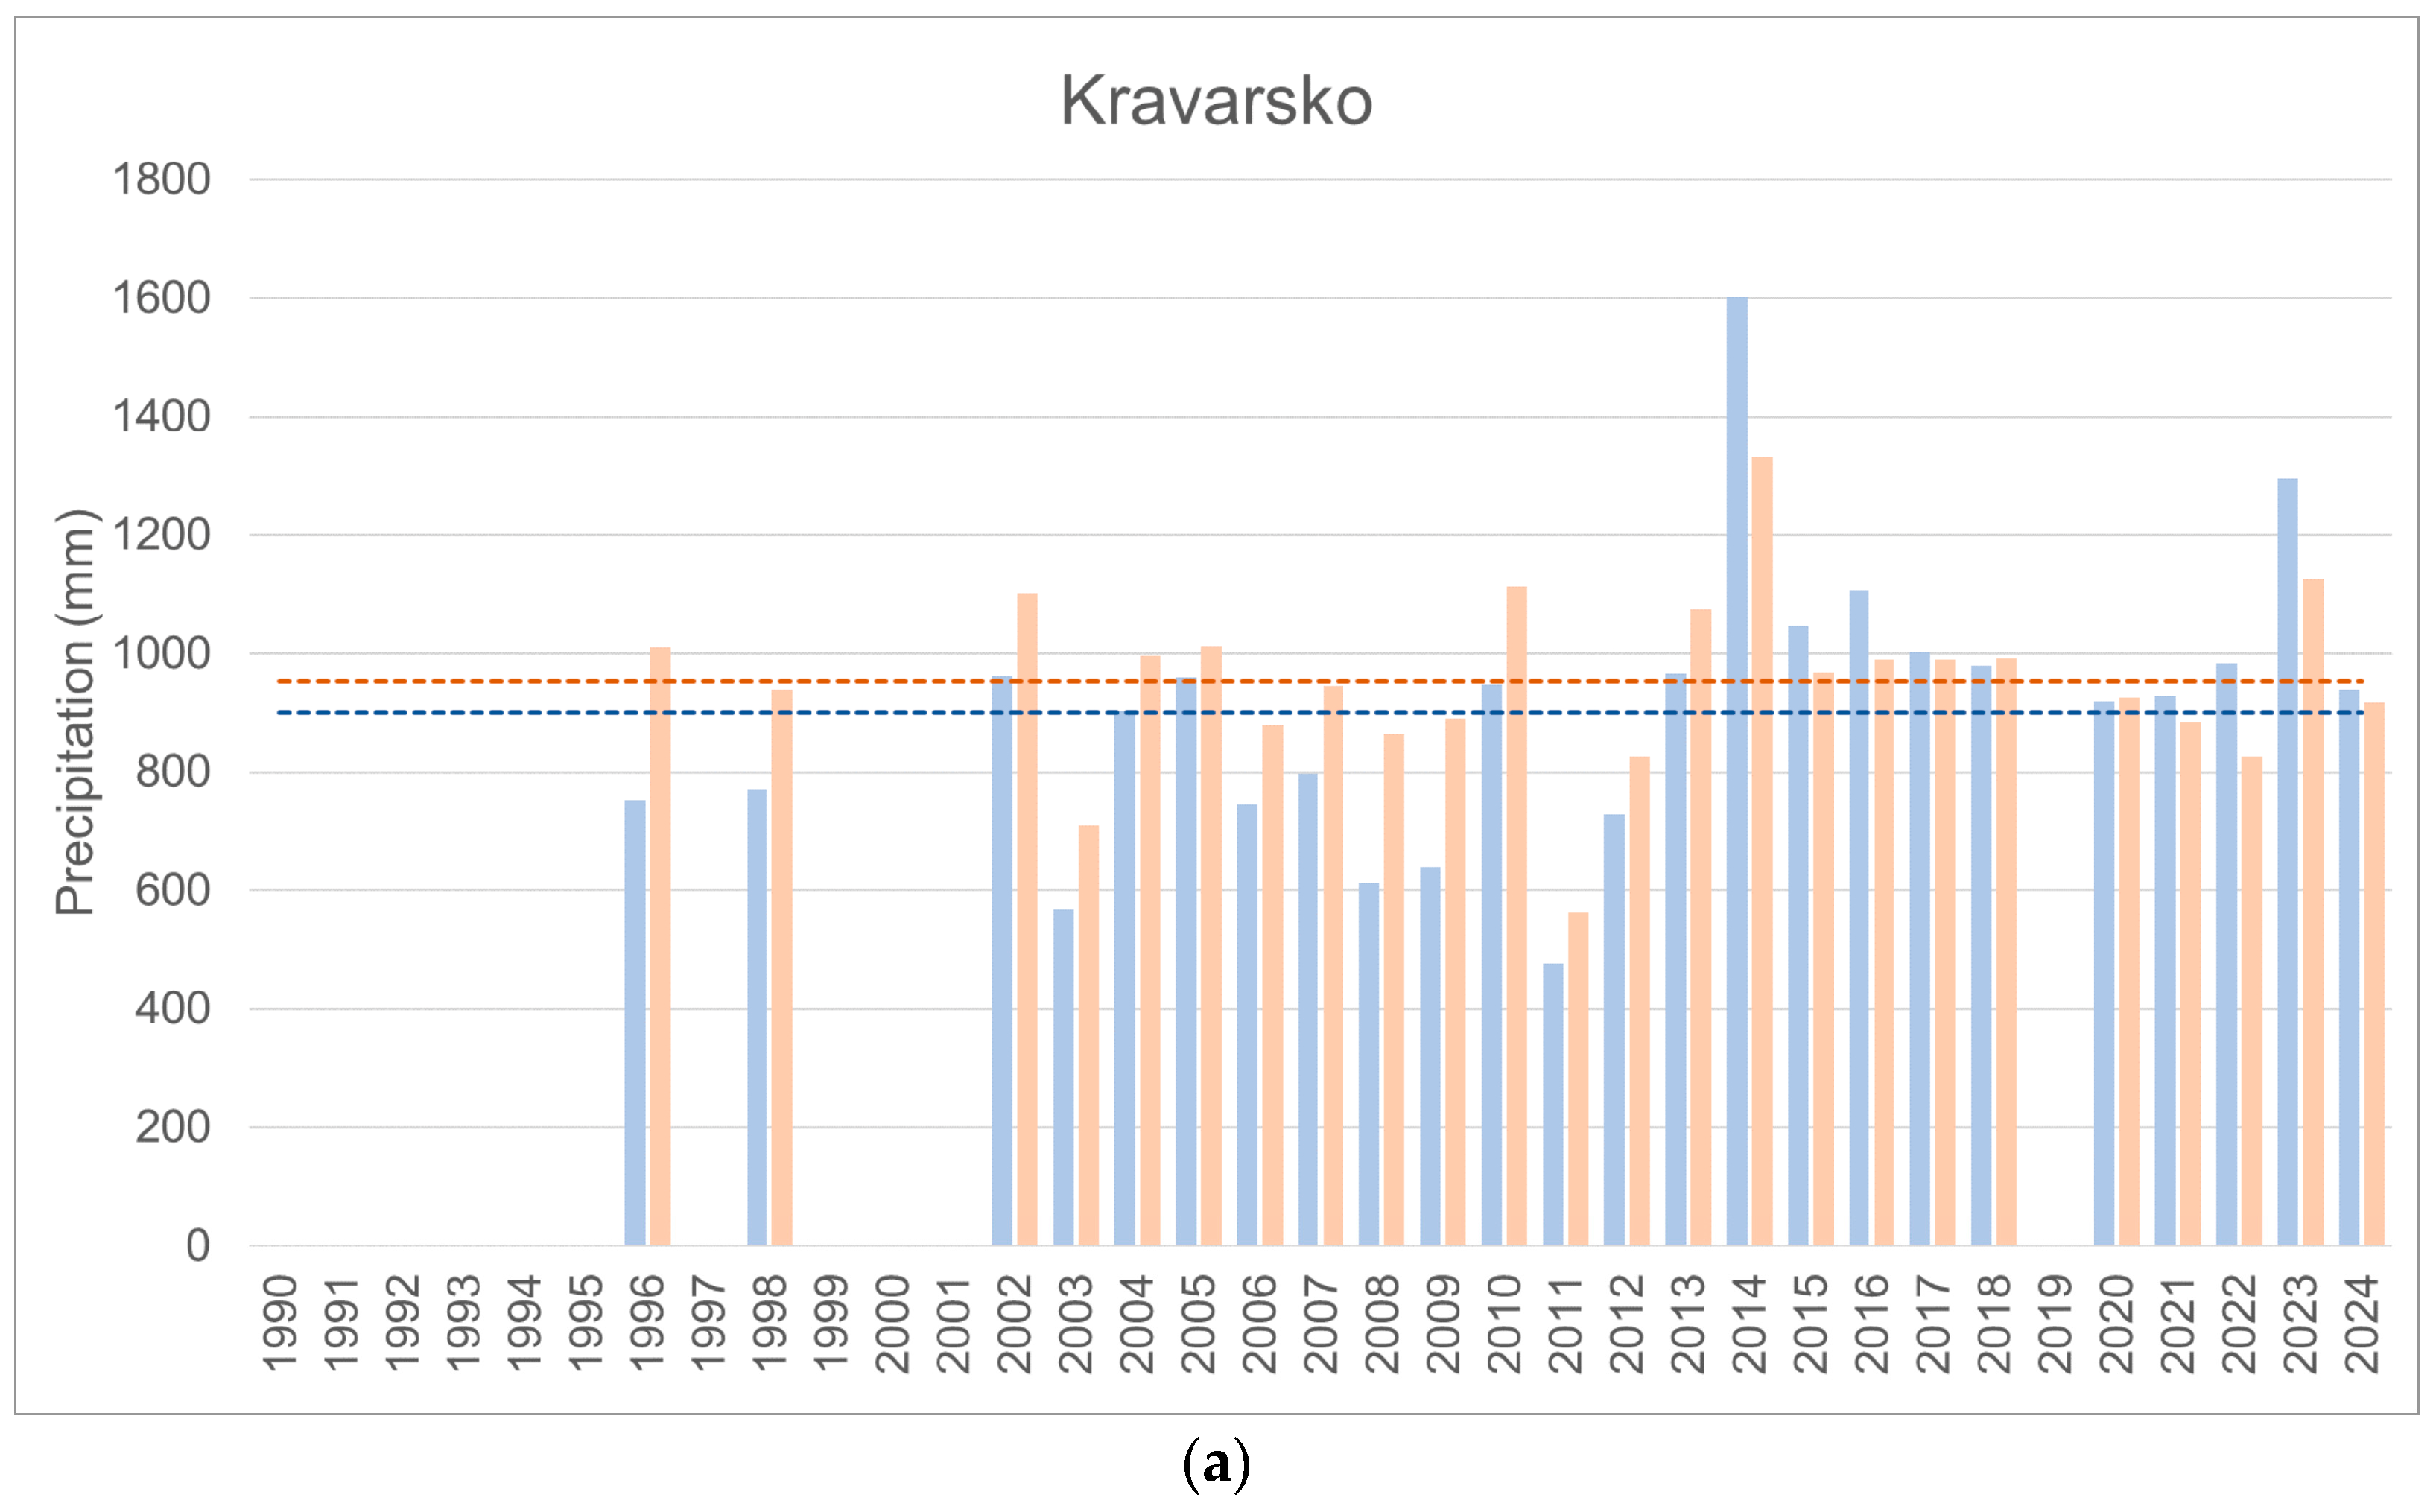
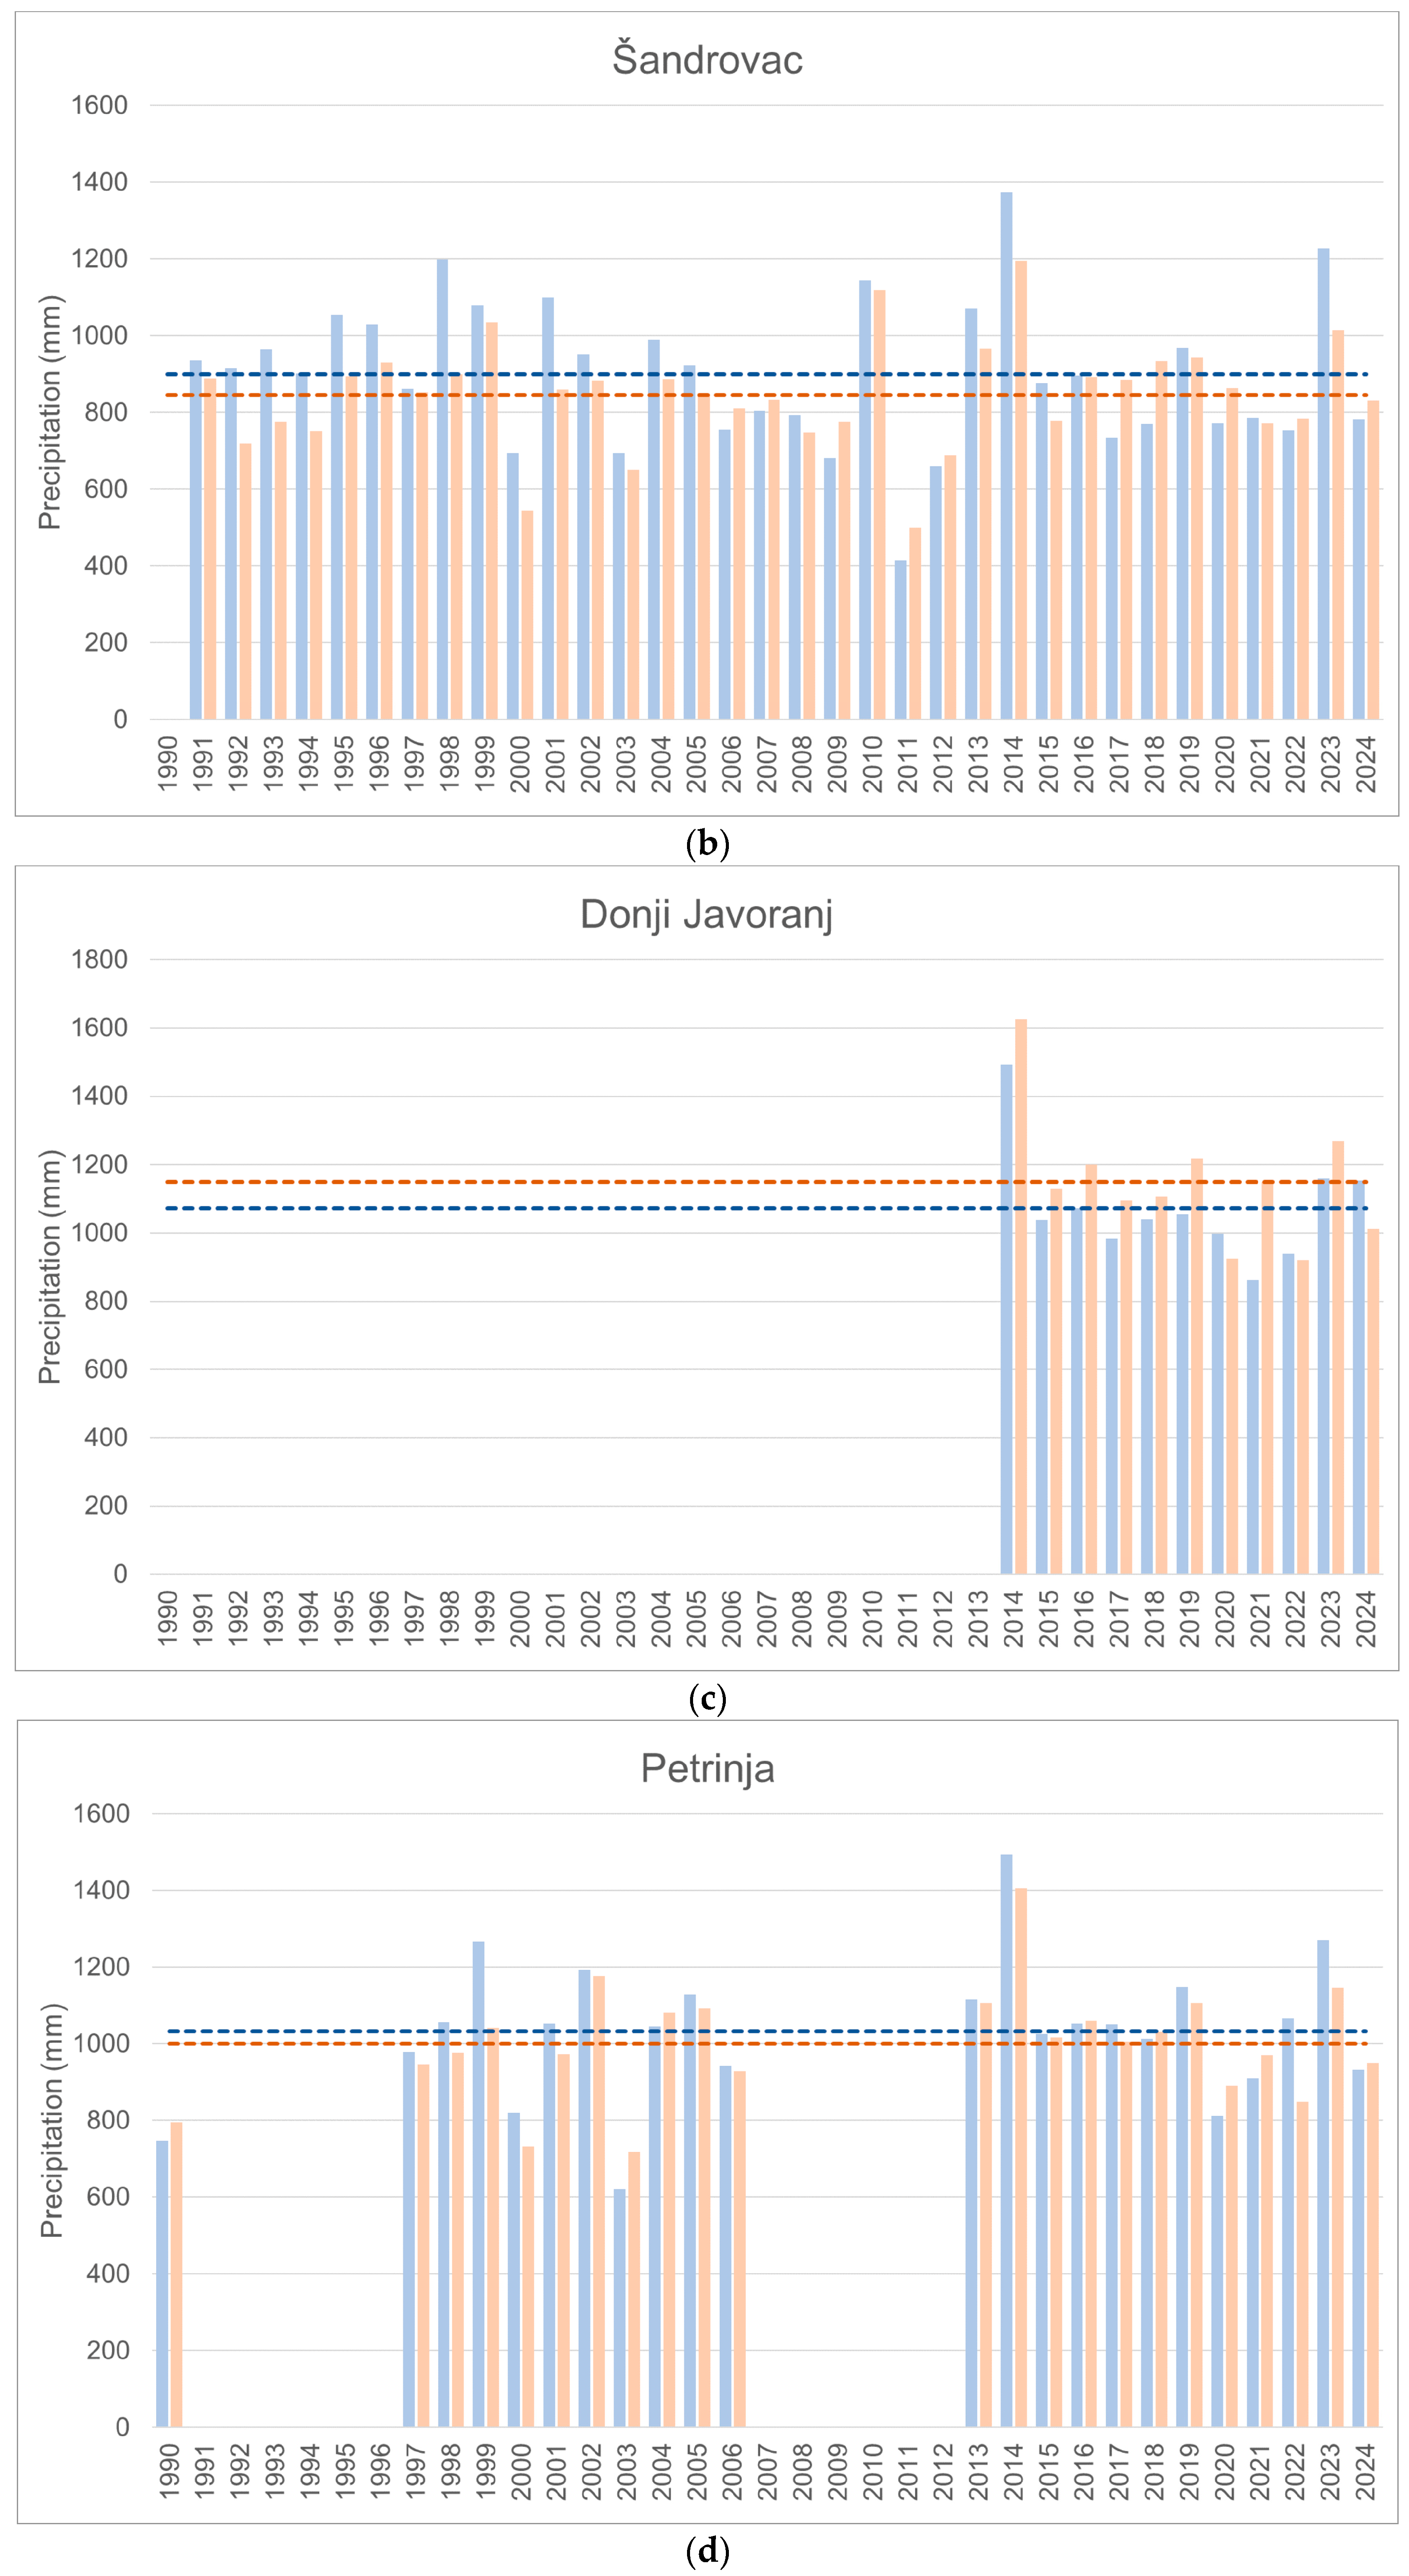
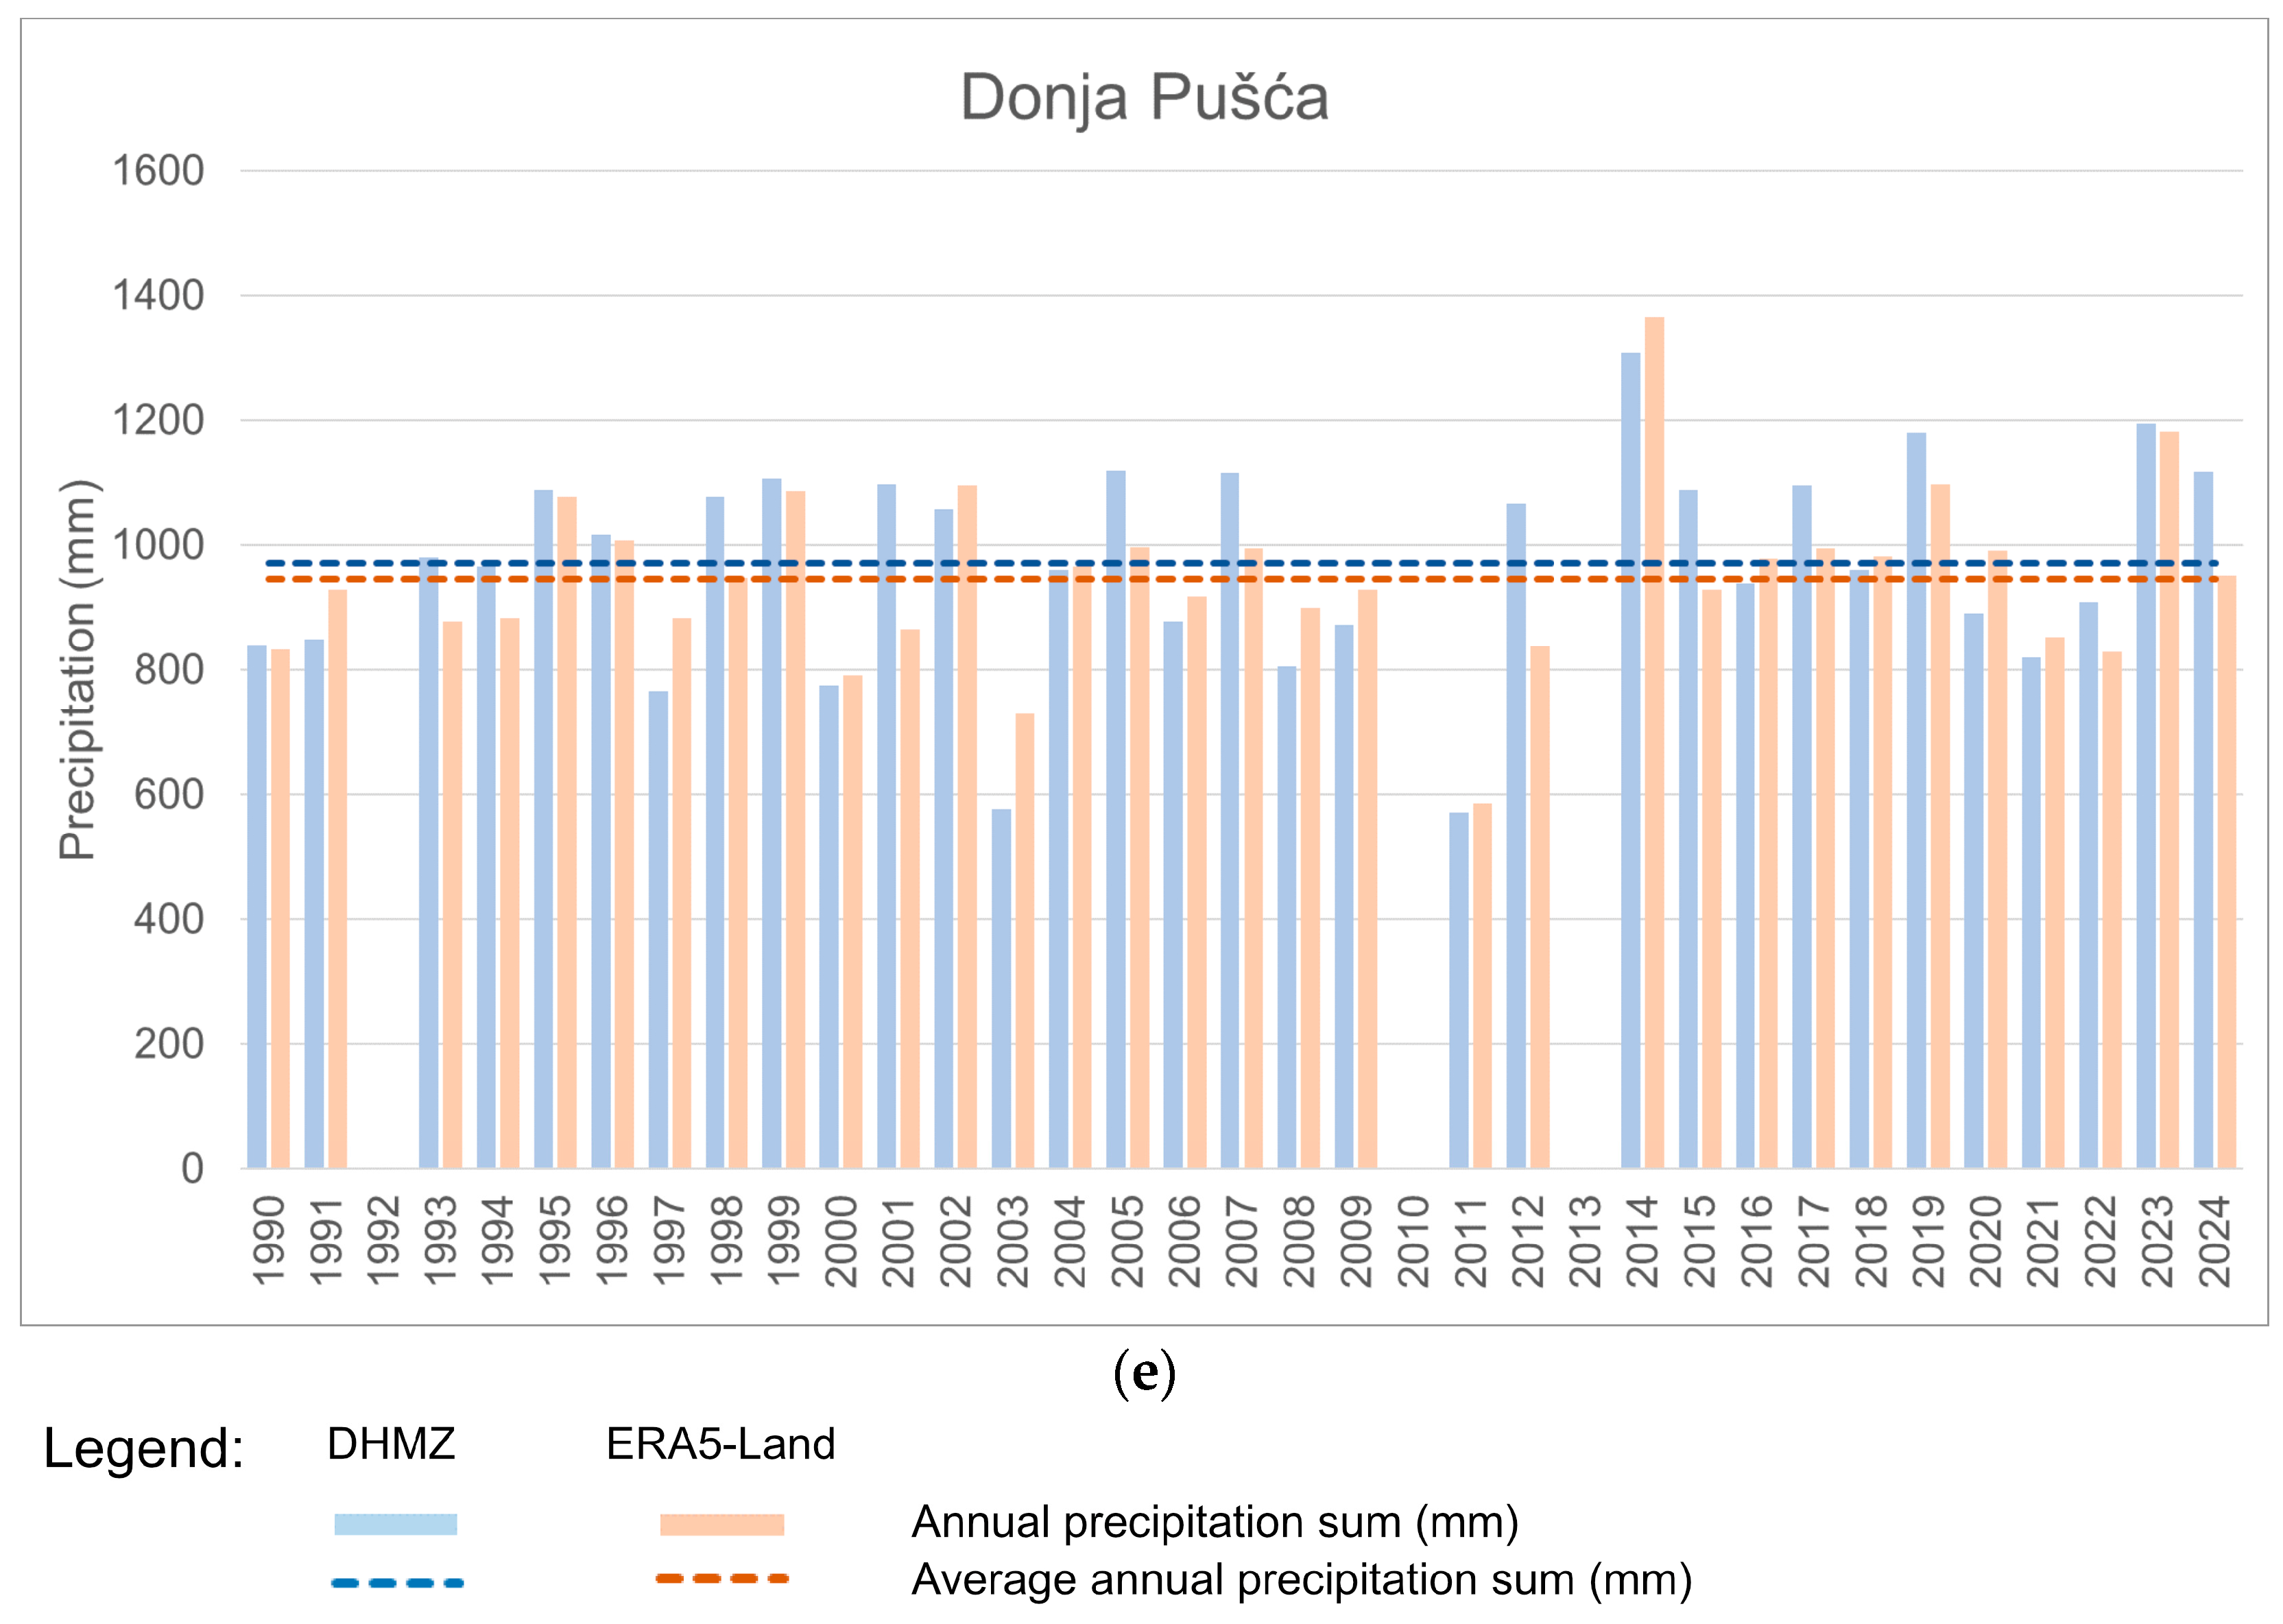
To further evaluate the long-term statistical stability and extreme-value behavior of the ERA5-Land reanalysis product against DHMZ ground-based observations, total annual precipitations for the period from 1990 to 2024 are presented for each study site (Appendix A, Figure A1). To ensure data integrity, years containing incomplete monthly datasets at the DHMZ stations were excluded from the analysis. When aggregated to an annual scale, the statistical consistency between the two datasets reaches a high level. The multi-year average annual precipitation calculated across all sites for ERA5-Land (979 mm) closely aligns with the DHMZ ground-based observations (975 mm), representing a minor overall overestimation. The reanalysis product accurately captures major regional climate shifts, such as the dry periods in 2003, 2011, and 2012, as well as exceptionally wet years like 2010, 2014, and 2023.
The observations regarding the scale-dependent performance of reanalysis data are consistent with recent literature. Moccia et al. [16] showed that for six commonly used gridded precipitation products, including ERA5-Land, the performance increases with a decrease in temporal resolution (i.e., from daily to annual) in Italy. Furthermore, Gomis-Cebolla et al. [20] and Guo et al. [15] reported that ERA5-Land effectively captures temporal trends in precipitation over Spain and in the Yellow River Basin, China, respectively.

3.2. Rainfall Days (Rd) and Rainfall Events (Re)

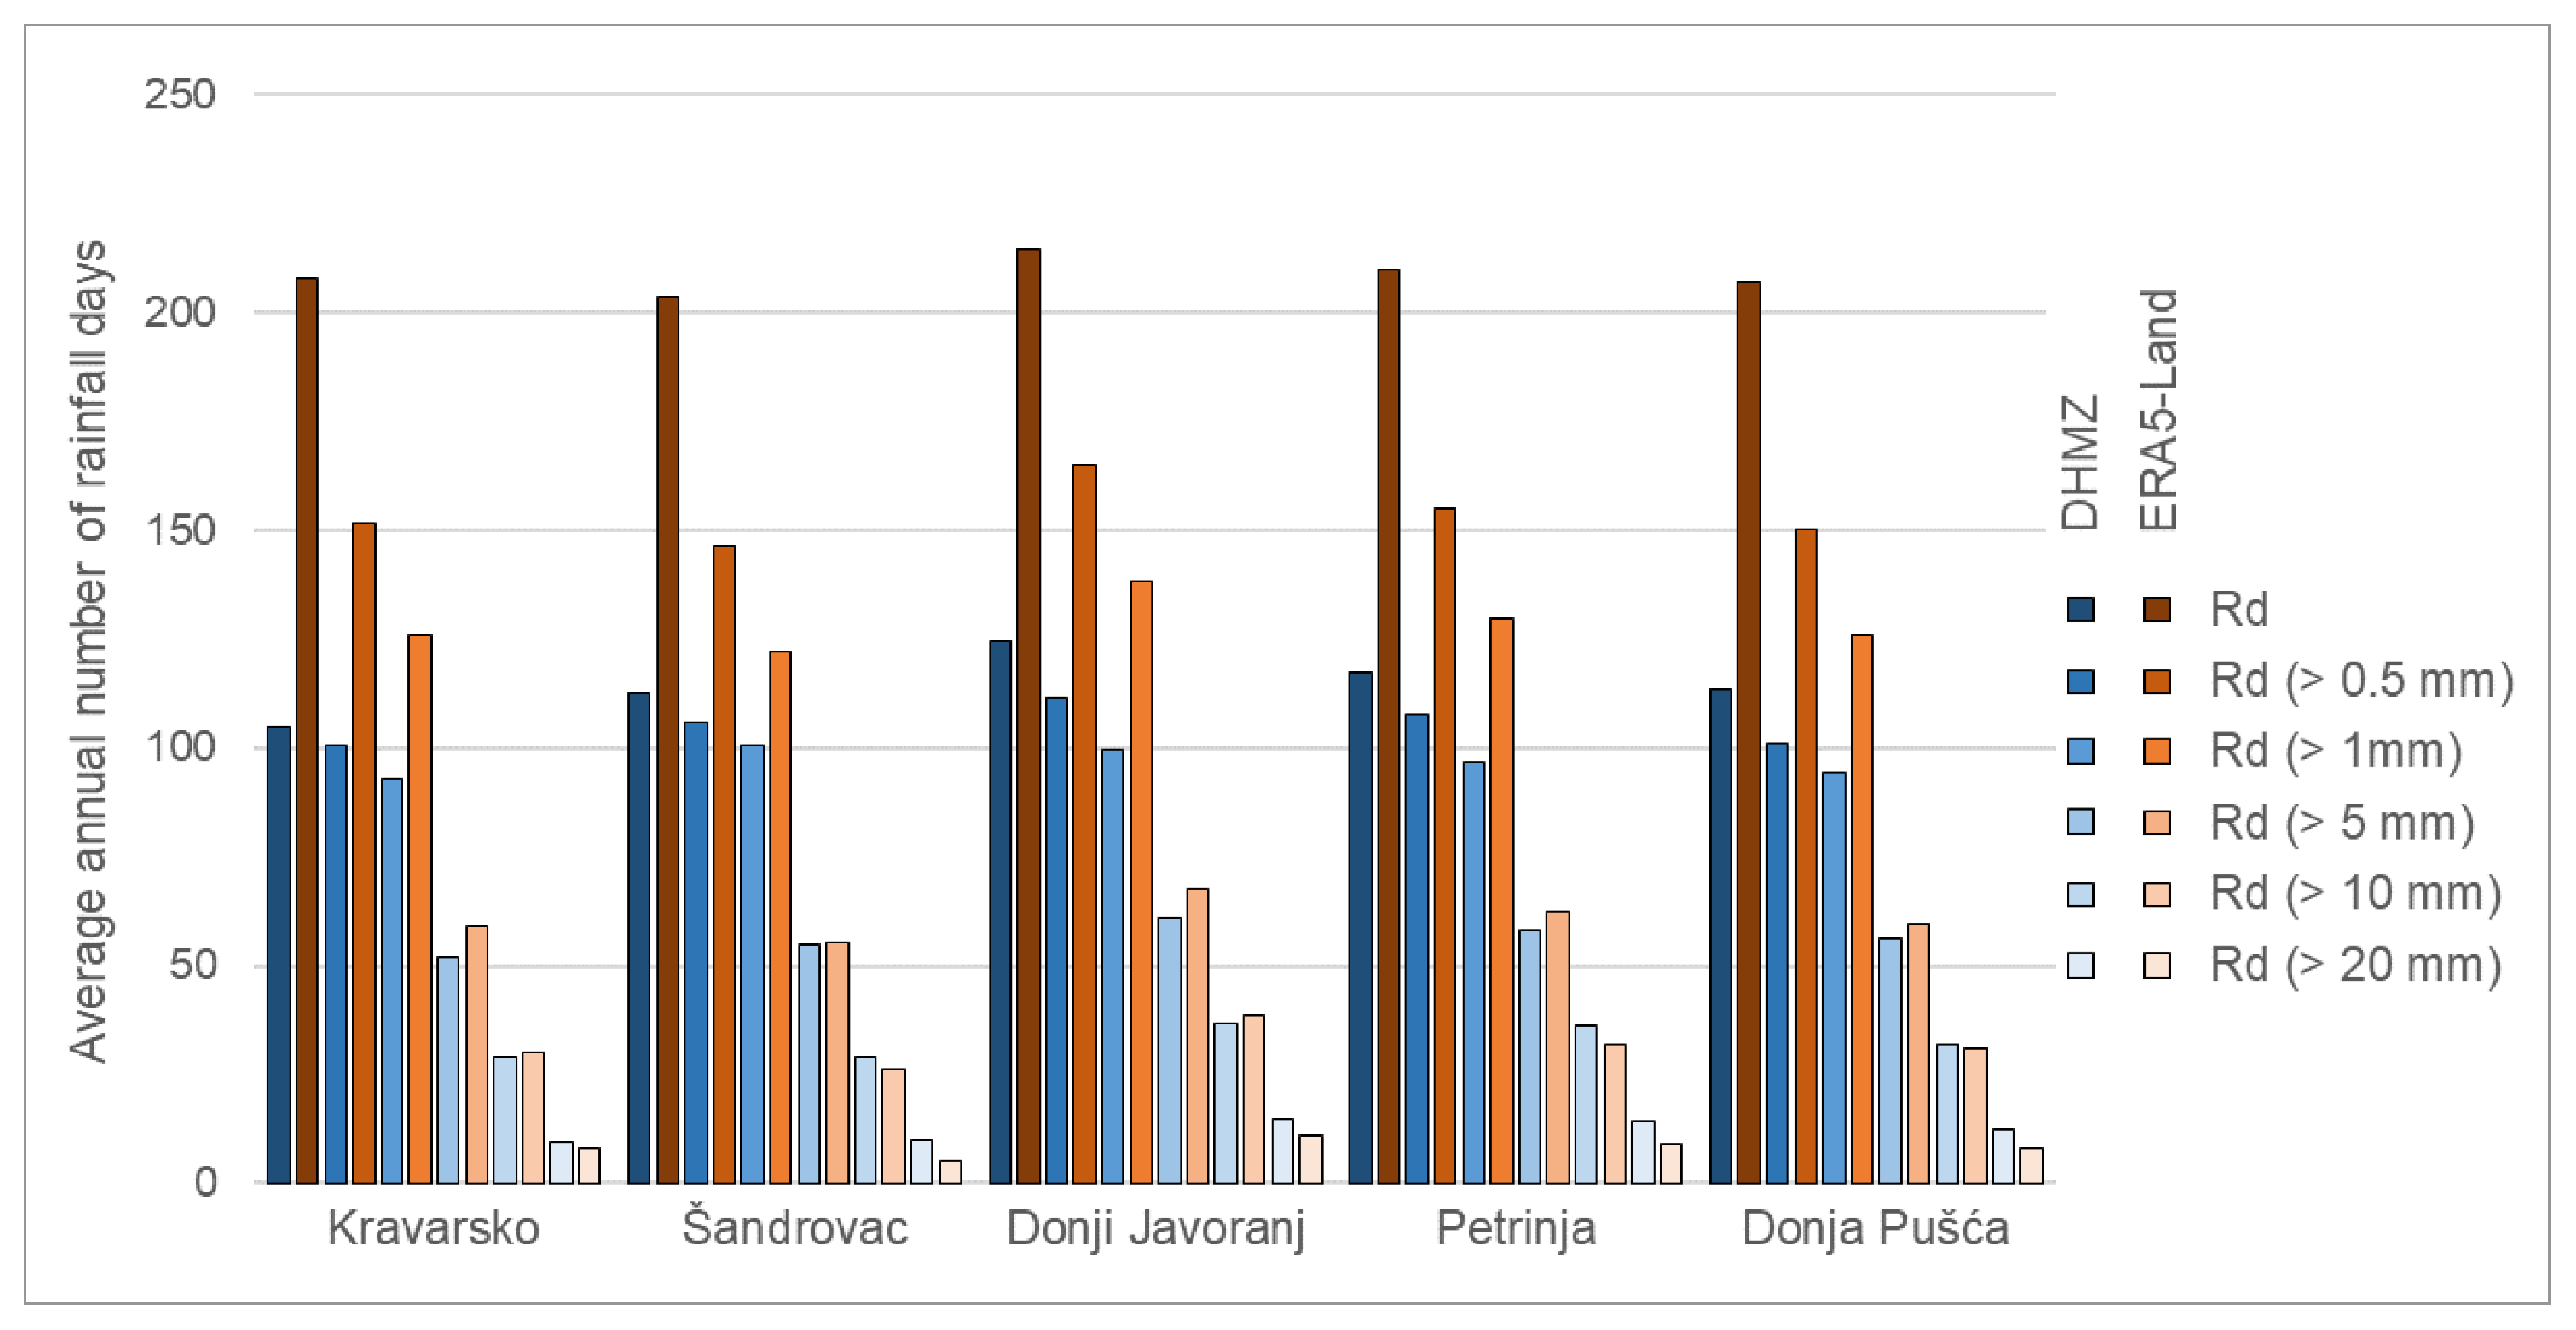
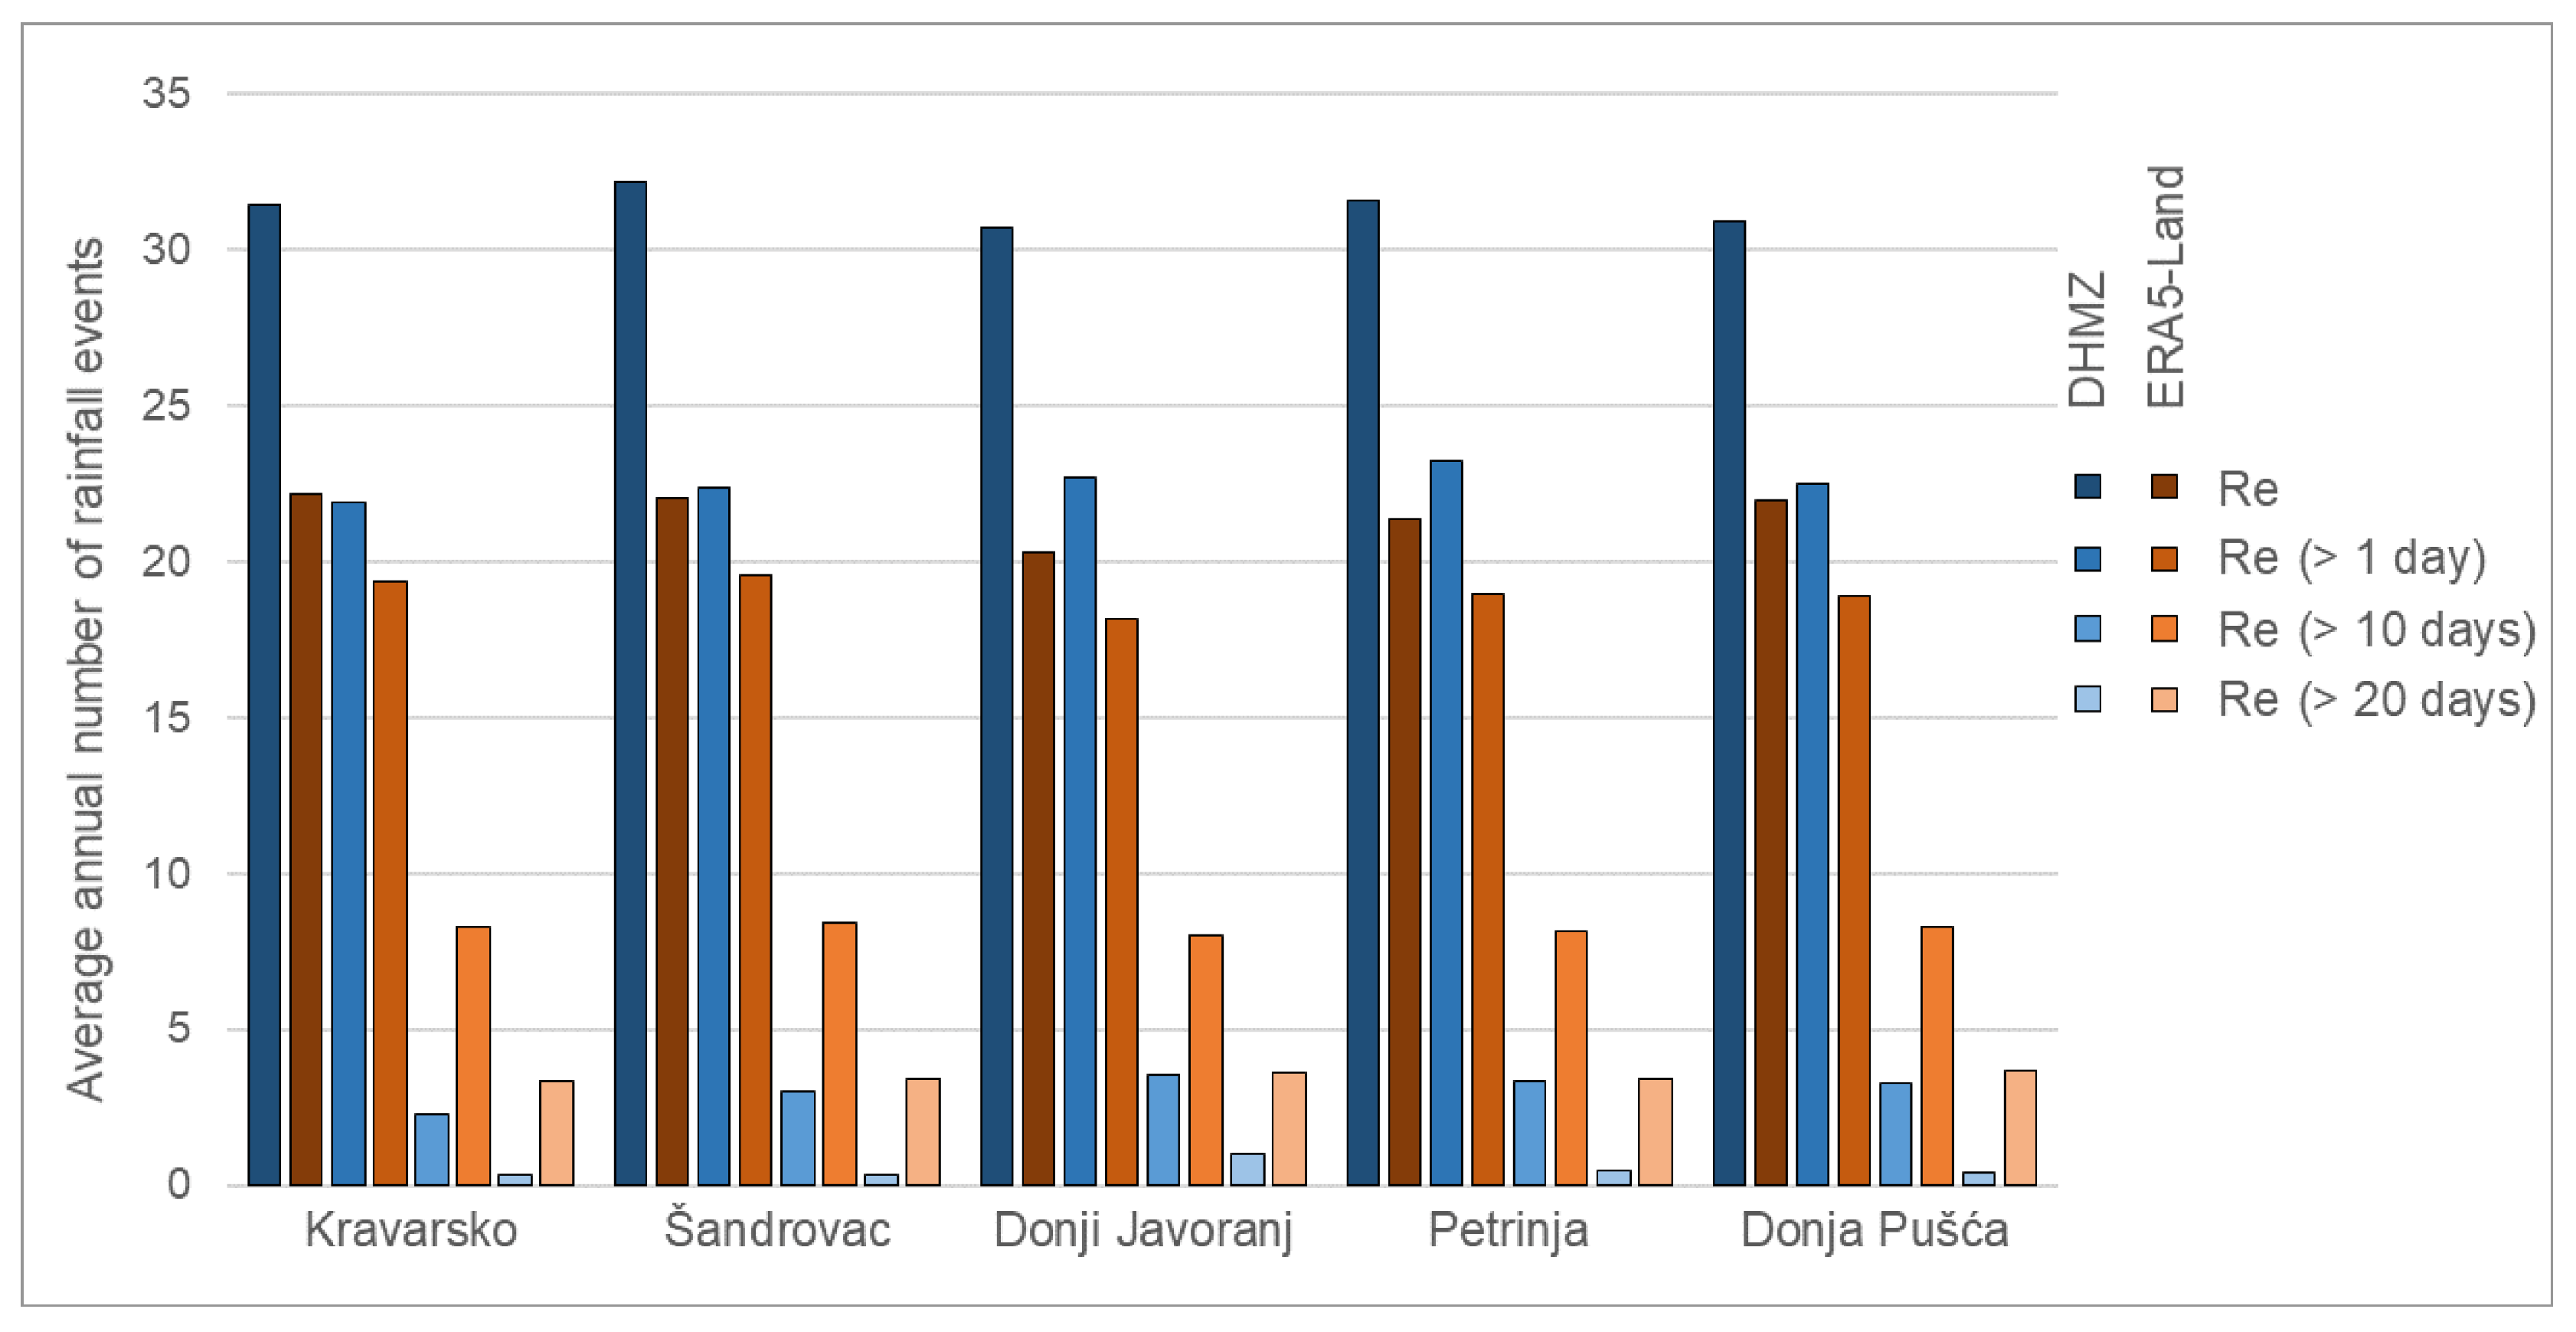
In order to understand the structural consequences of the daily precipitation discrepancies identified in the previous section (Section 3.1), a detailed analysis of precipitation characteristics was performed. This was achieved by comparing the frequency and properties of Rd (Figure 5) and Re (Figure 6), following their definitions described in Section 2.3.2.
The analysis of the average annual number of Rd reveals a highly consistent pattern across all five study sites (Figure 5). At the lowest threshold of precipitation amount, when all defined Rd (≥0.1 mm) are analyzed, a substantial divergence is observed between the DHMZ observations and the ERA5-Land data. However, as the daily precipitation threshold increases (from 0.5 mm to 5 mm), the frequency bars of the two datasets progressively converge. This convergence clearly indicates that ERA5-Land highly overestimates the frequency of low-intensity Rd, while it performs significantly better when simulating moderate daily precipitation amounts. Conversely, for higher thresholds (>10 mm and >20 mm), the ground-based observations exceed the reanalysis estimates, confirming that the DHMZ stations record a higher frequency of heavy and extreme daily precipitation events than captured by ERA5-Land.
These observations are further reflected in the statistical properties of all recorded Rd (Table 4). Across all five locations, the average daily precipitation amount on actual Rd is nearly twice as high in the DHMZ dataset compared with ERA5-Land. The most pronounced discrepancy is observed at Donji Javoranj, which records an average daily rainfall amount of 10.8 mm, compared with only 3.6 mm estimated by ERA5-Land. Furthermore, the single-day maximum precipitation values underscore a severe underestimation by the reanalysis product. The averaged maximum daily rainfall for ERA5-Land is 59.34 mm, whereas the corresponding average for DHMZ observations is 97.42 mm. The absolute highest single-day precipitation estimated by ERA5-Land across the entire period is 72.4 mm (at Donji Javoranj), while the DHMZ network captured a maximum single-day amount of 125.0 mm (at Petrinja).
The frequency and structure of Re exhibit a clear trend that is heavily dictated by the drizzle effect, which is characterized by an overestimation of low-intensity precipitation frequency within the ERA5-Land dataset. By estimating low-intensity daily precipitation too frequently, ERA5-Land creates an artificial, nearly continuous sequence of wet days that does not truly exist. Because the reanalysis rarely records dry intervals exceeding the critical dry-period criteria established to separate independent Re, it systematically merges multiple distinct events into a single, prolonged event. As a consequence, ERA5-Land records a significantly lower average annual number of individual Re (Figure 6). However, this discrepancy in event frequency diminishes, and eventually reverses, when filtering for longer event durations. For Re lasting longer than 10 and 20 days, the average annual number of Re becomes higher in the ERA5-Land dataset, confirming its tendency to generate unnaturally prolonged wet periods due to event merging.
This structural merging drastically alters the Re metrics (Table 5). While the average durations of Re in ERA5-Land are approximately 2.5 times longer than those observed on the ground, the maximum durations are 1.7 to 4 times longer, depending on the station. For instance, at Kravarsko, Donji Javoranj, and Petrinja, ERA5-Land estimates maximum Re durations exceeding 100 days, whereas the gauge-based events barely exceed 30 days (specifically, 34, 34, and 31 days, respectively). This extension of Re duration directly impacts the cumulative precipitation totals. Due to the persistent drizzle effect, small amounts of daily rainfall are continuously aggregated over these excessively long periods. As a result, ERA5-Land accumulates higher total precipitation values per event. The average cumulative precipitation values are 1.36 to 1.53 times higher, while the maximum cumulative values are 1.32 to 1.85 times higher than those of the DHMZ observations across all locations. Specifically, the average cumulative rainfall per Re ranges from 27.5 to 34.9 mm for the DHMZ stations, compared with a much higher range of 38.1 to 56.7 mm for ERA5-Land. The absolute maximum cumulative Re precipitation recorded by DHMZ is 297.2 mm at Donja Pušća, while ERA5-Land reaches a maximum of 519.9 mm at Donji Javoranj.
The presented results confirm that the drizzle effect is a persistent characteristic of ERA5-Land, which systematically generates a wet bias by substituting discrete precipitation pulses with continuous, low-intensity moisture. This is supported by the findings of Gomis-Cebolla et al. [20], who reported that ERA5-Land tends to overestimate light and moderate precipitation (≥1 and <20 mm/day) while underestimating heavy and violent events (≥20 mm/day). Similarly, Li et al. [50] demonstrated an overestimation of low-level ERA5-Land precipitation, while Alexopoulos et al. [23] revealed that both the ERA5-Land and COSMO-REA6 precipitation reanalysis products underestimate extreme events by at least 20%. Moreover, Nguyen-Duy et al. [51] also reported that ERA5-Land overestimates the number of wet days, but underestimates the heavy events, leading to underestimation of rainfall intensity.

3.3. Landslide-Triggering Rainfall Events (LRe)

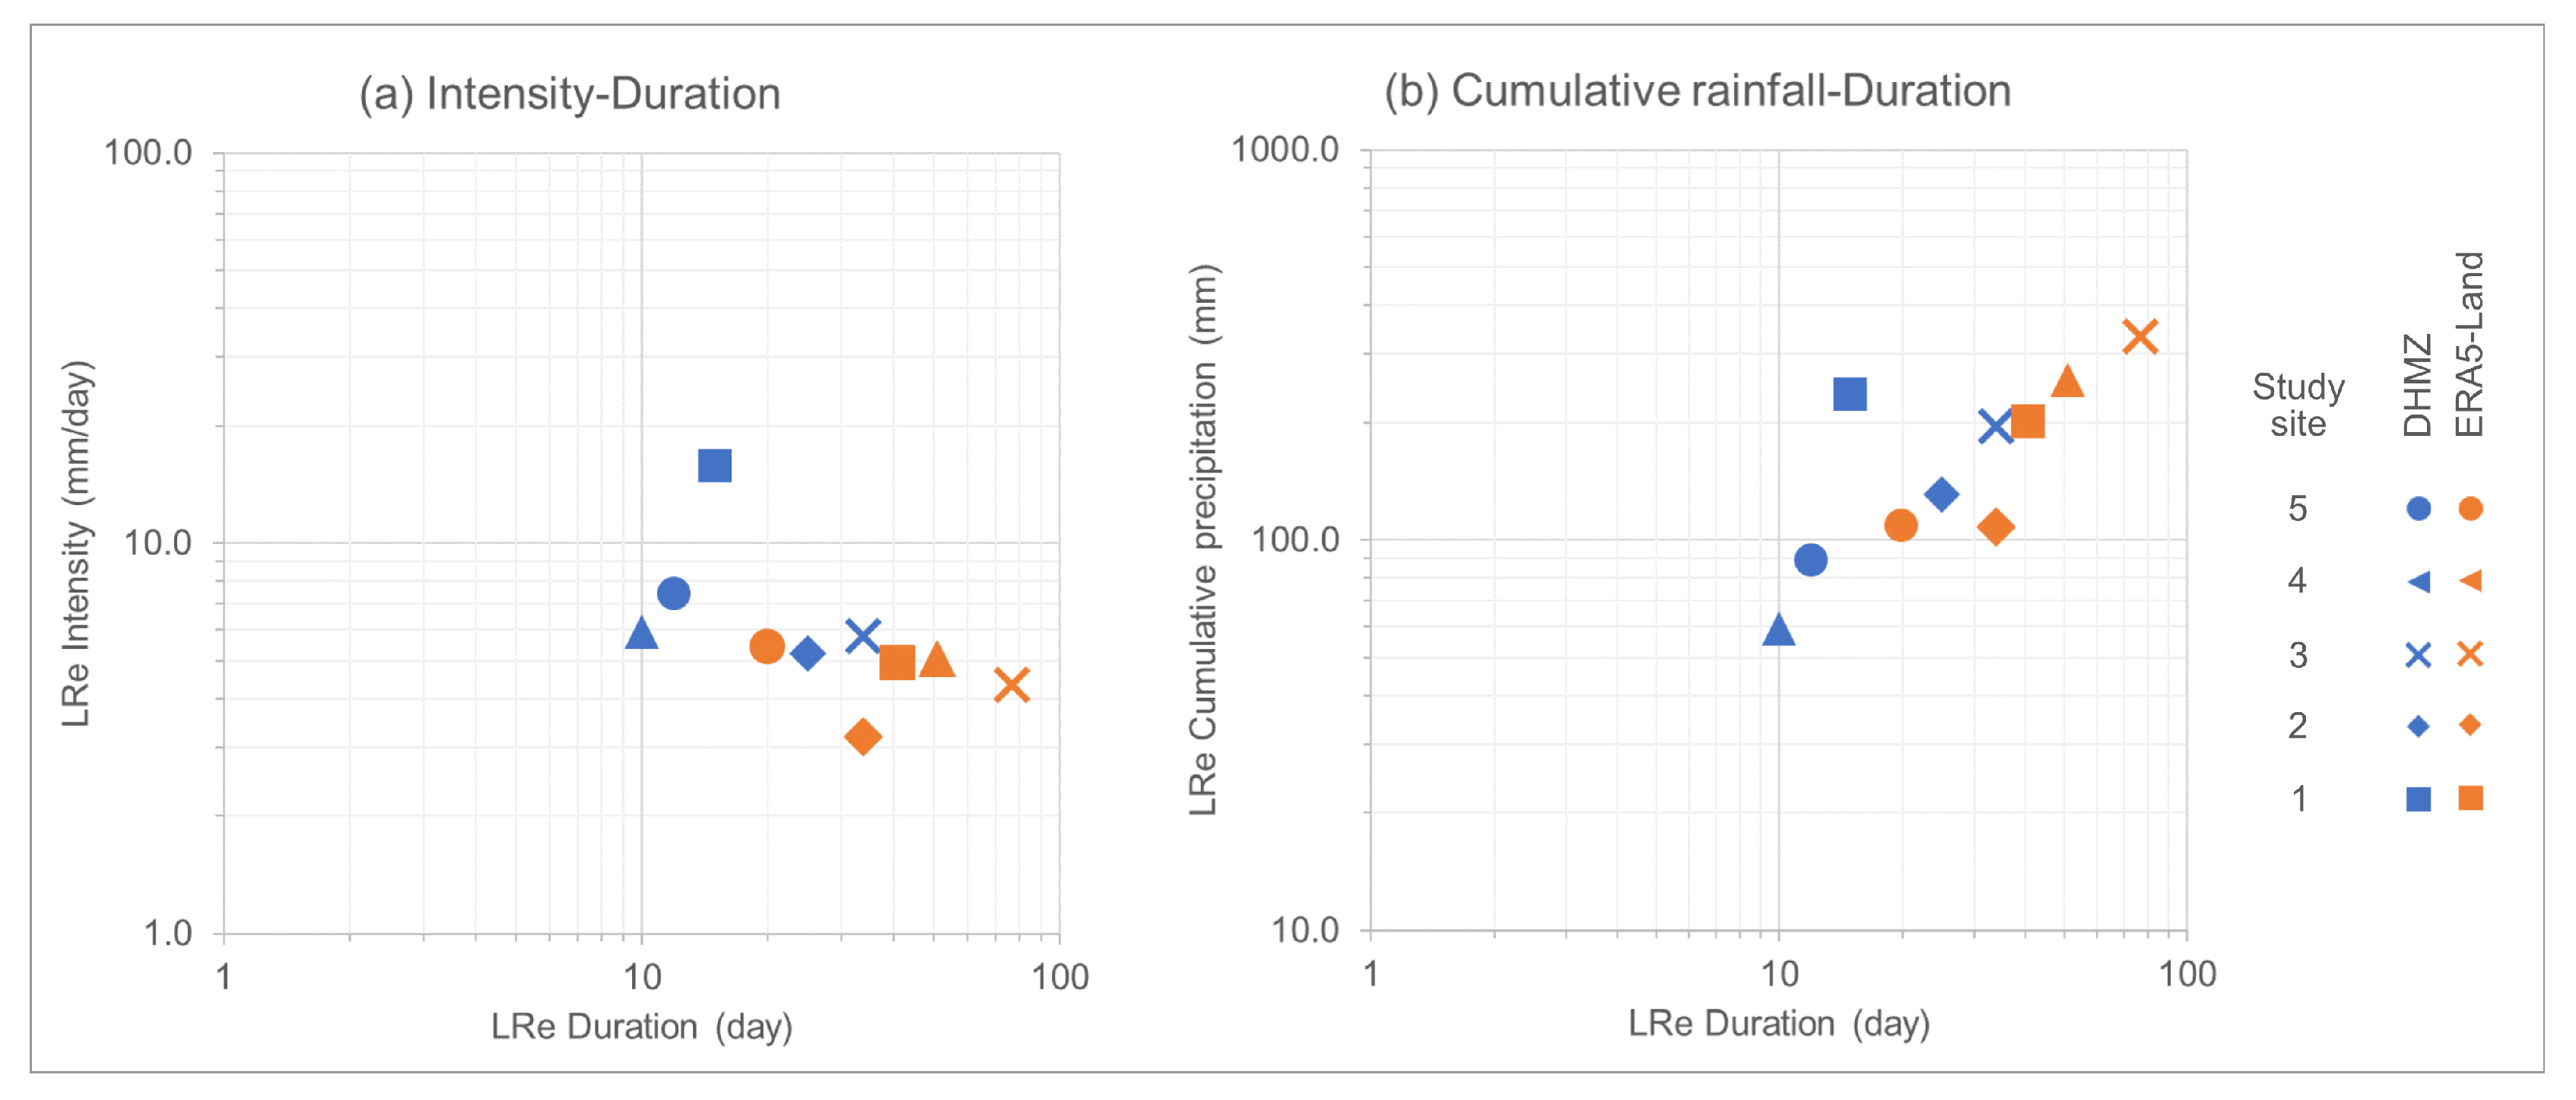
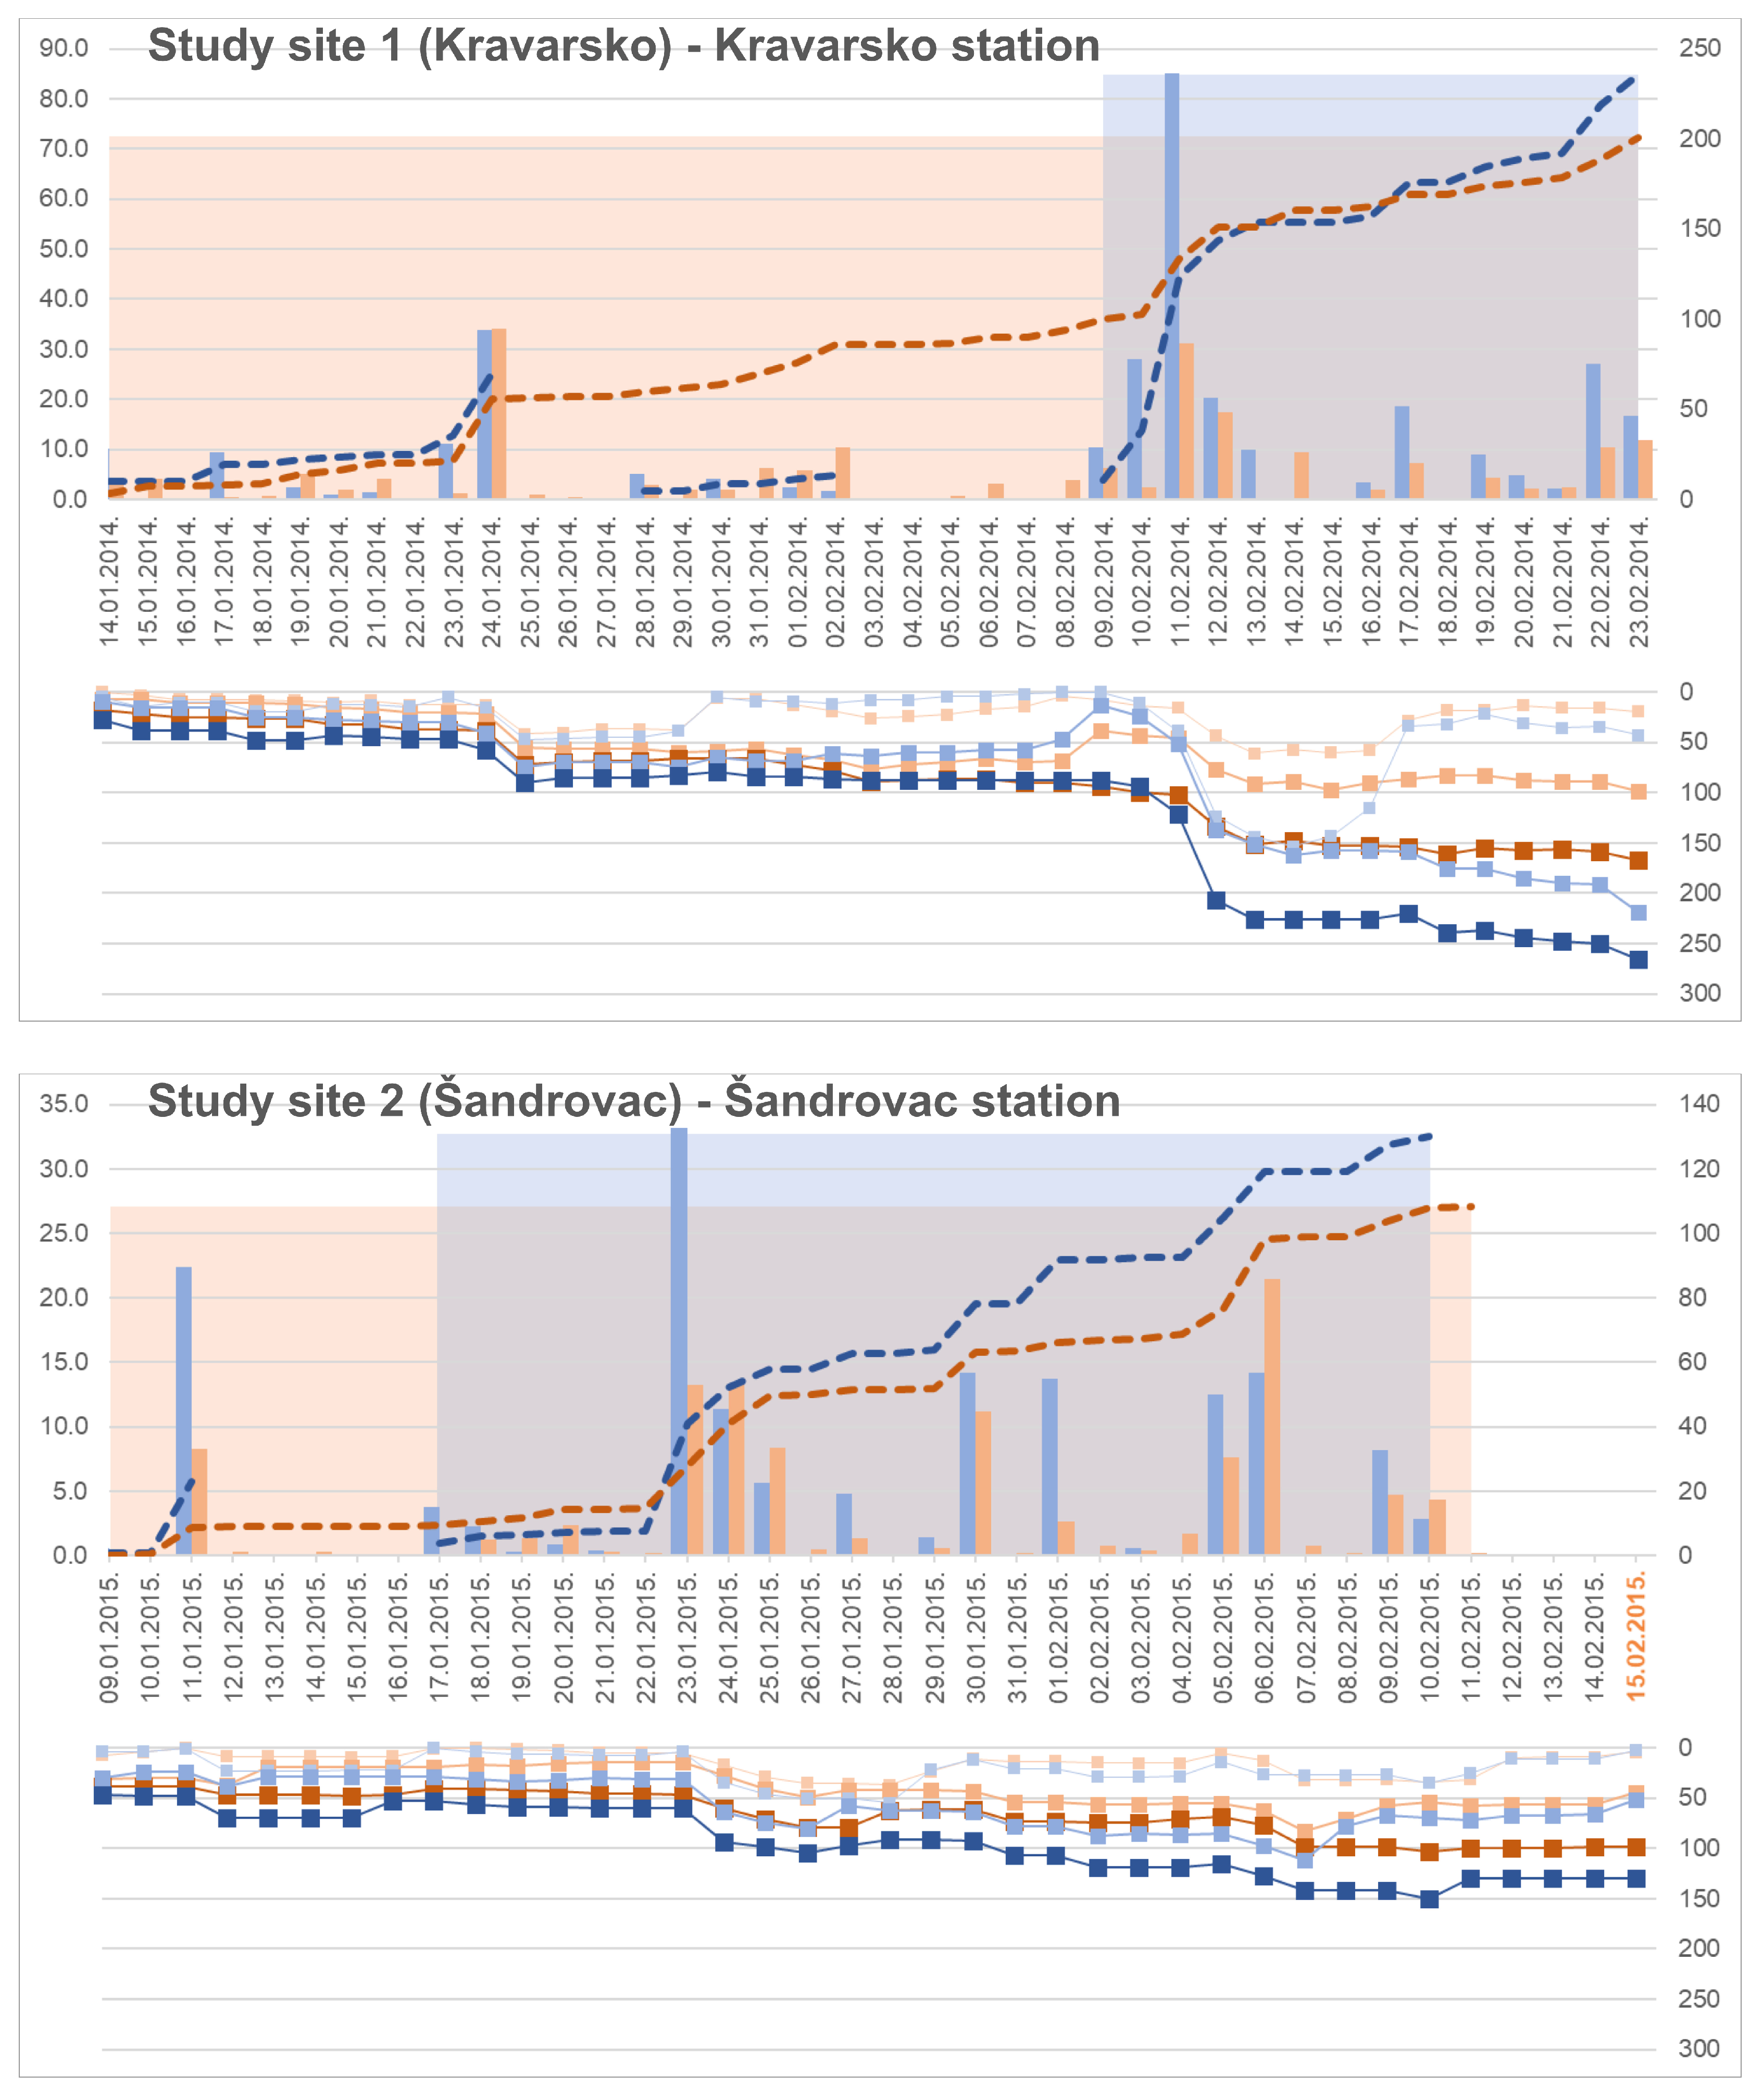
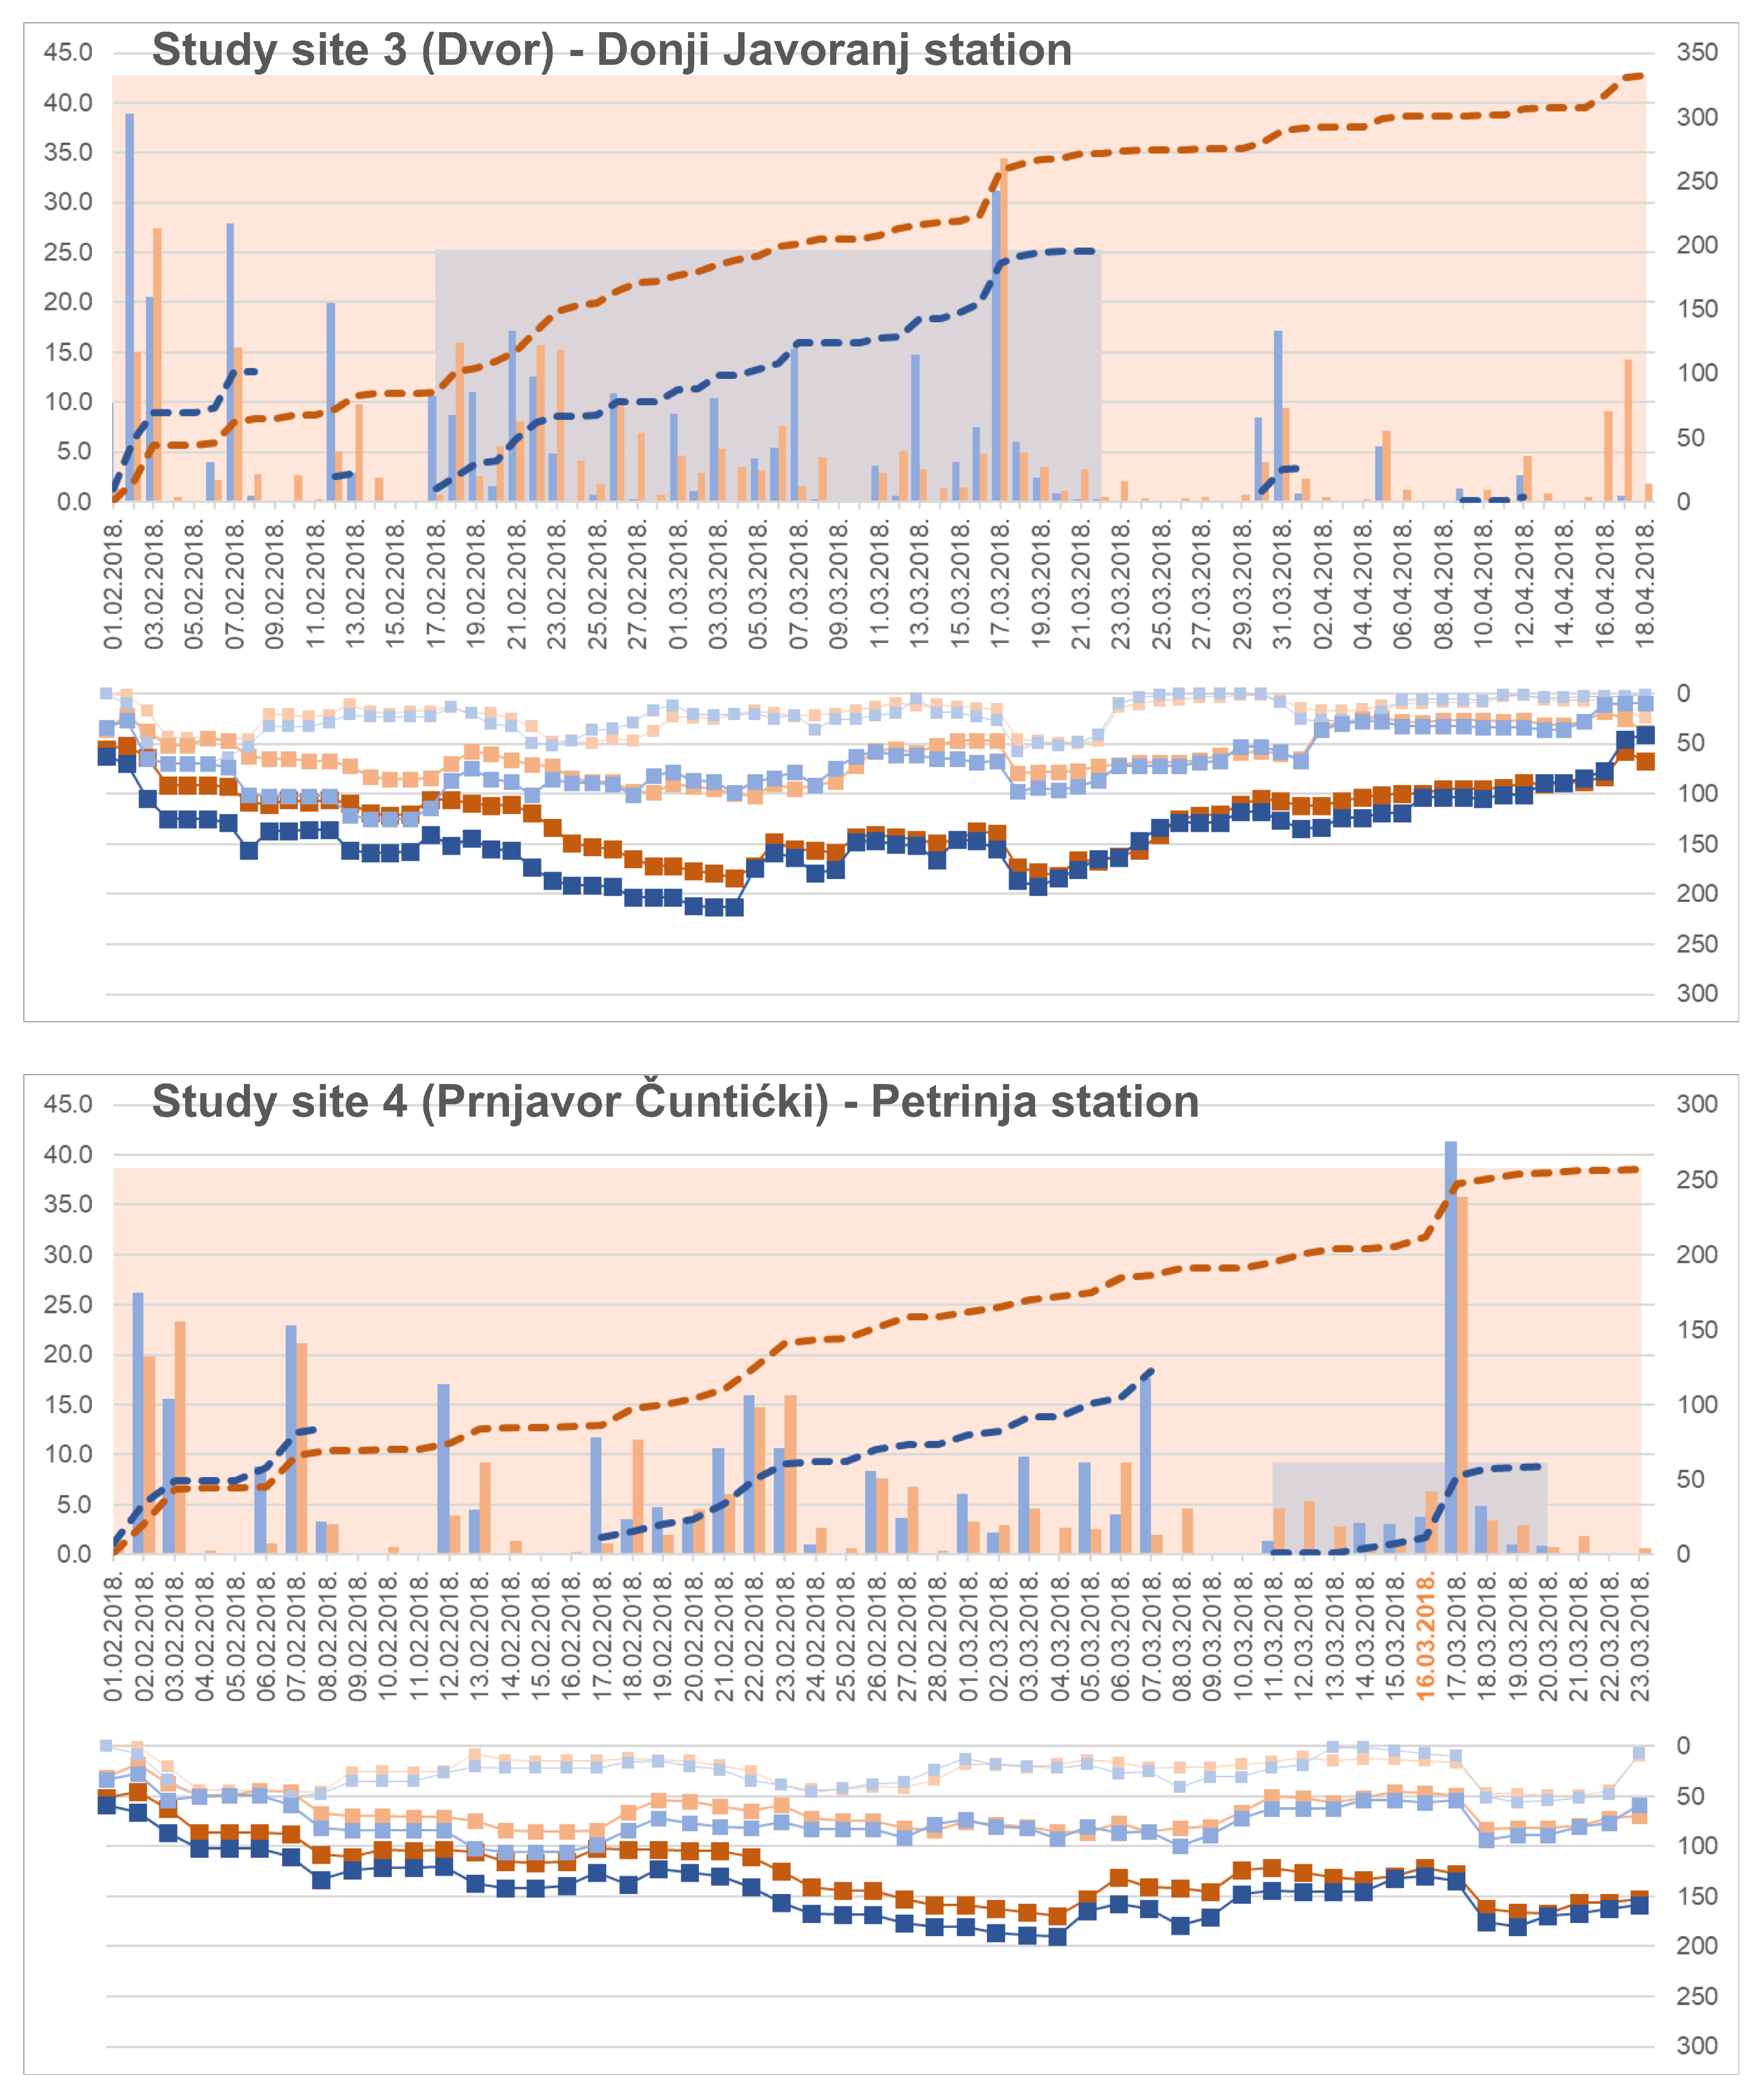
To indicate how the structural deviations and the drizzle effect of the ERA5-Land reanalysis translate into landslide hazard assessments, a targeted event-based analysis was performed. Specifically, LRe were isolated and evaluated against the DHMZ ground-based observations across the five study locations (Figure 7). Finally, the pairs of intensity–duration (I-D) and cumulative rainfall–duration (E-D) were plotted to evaluate the impact on landslide-triggering rainfall conditions (Figure 8).
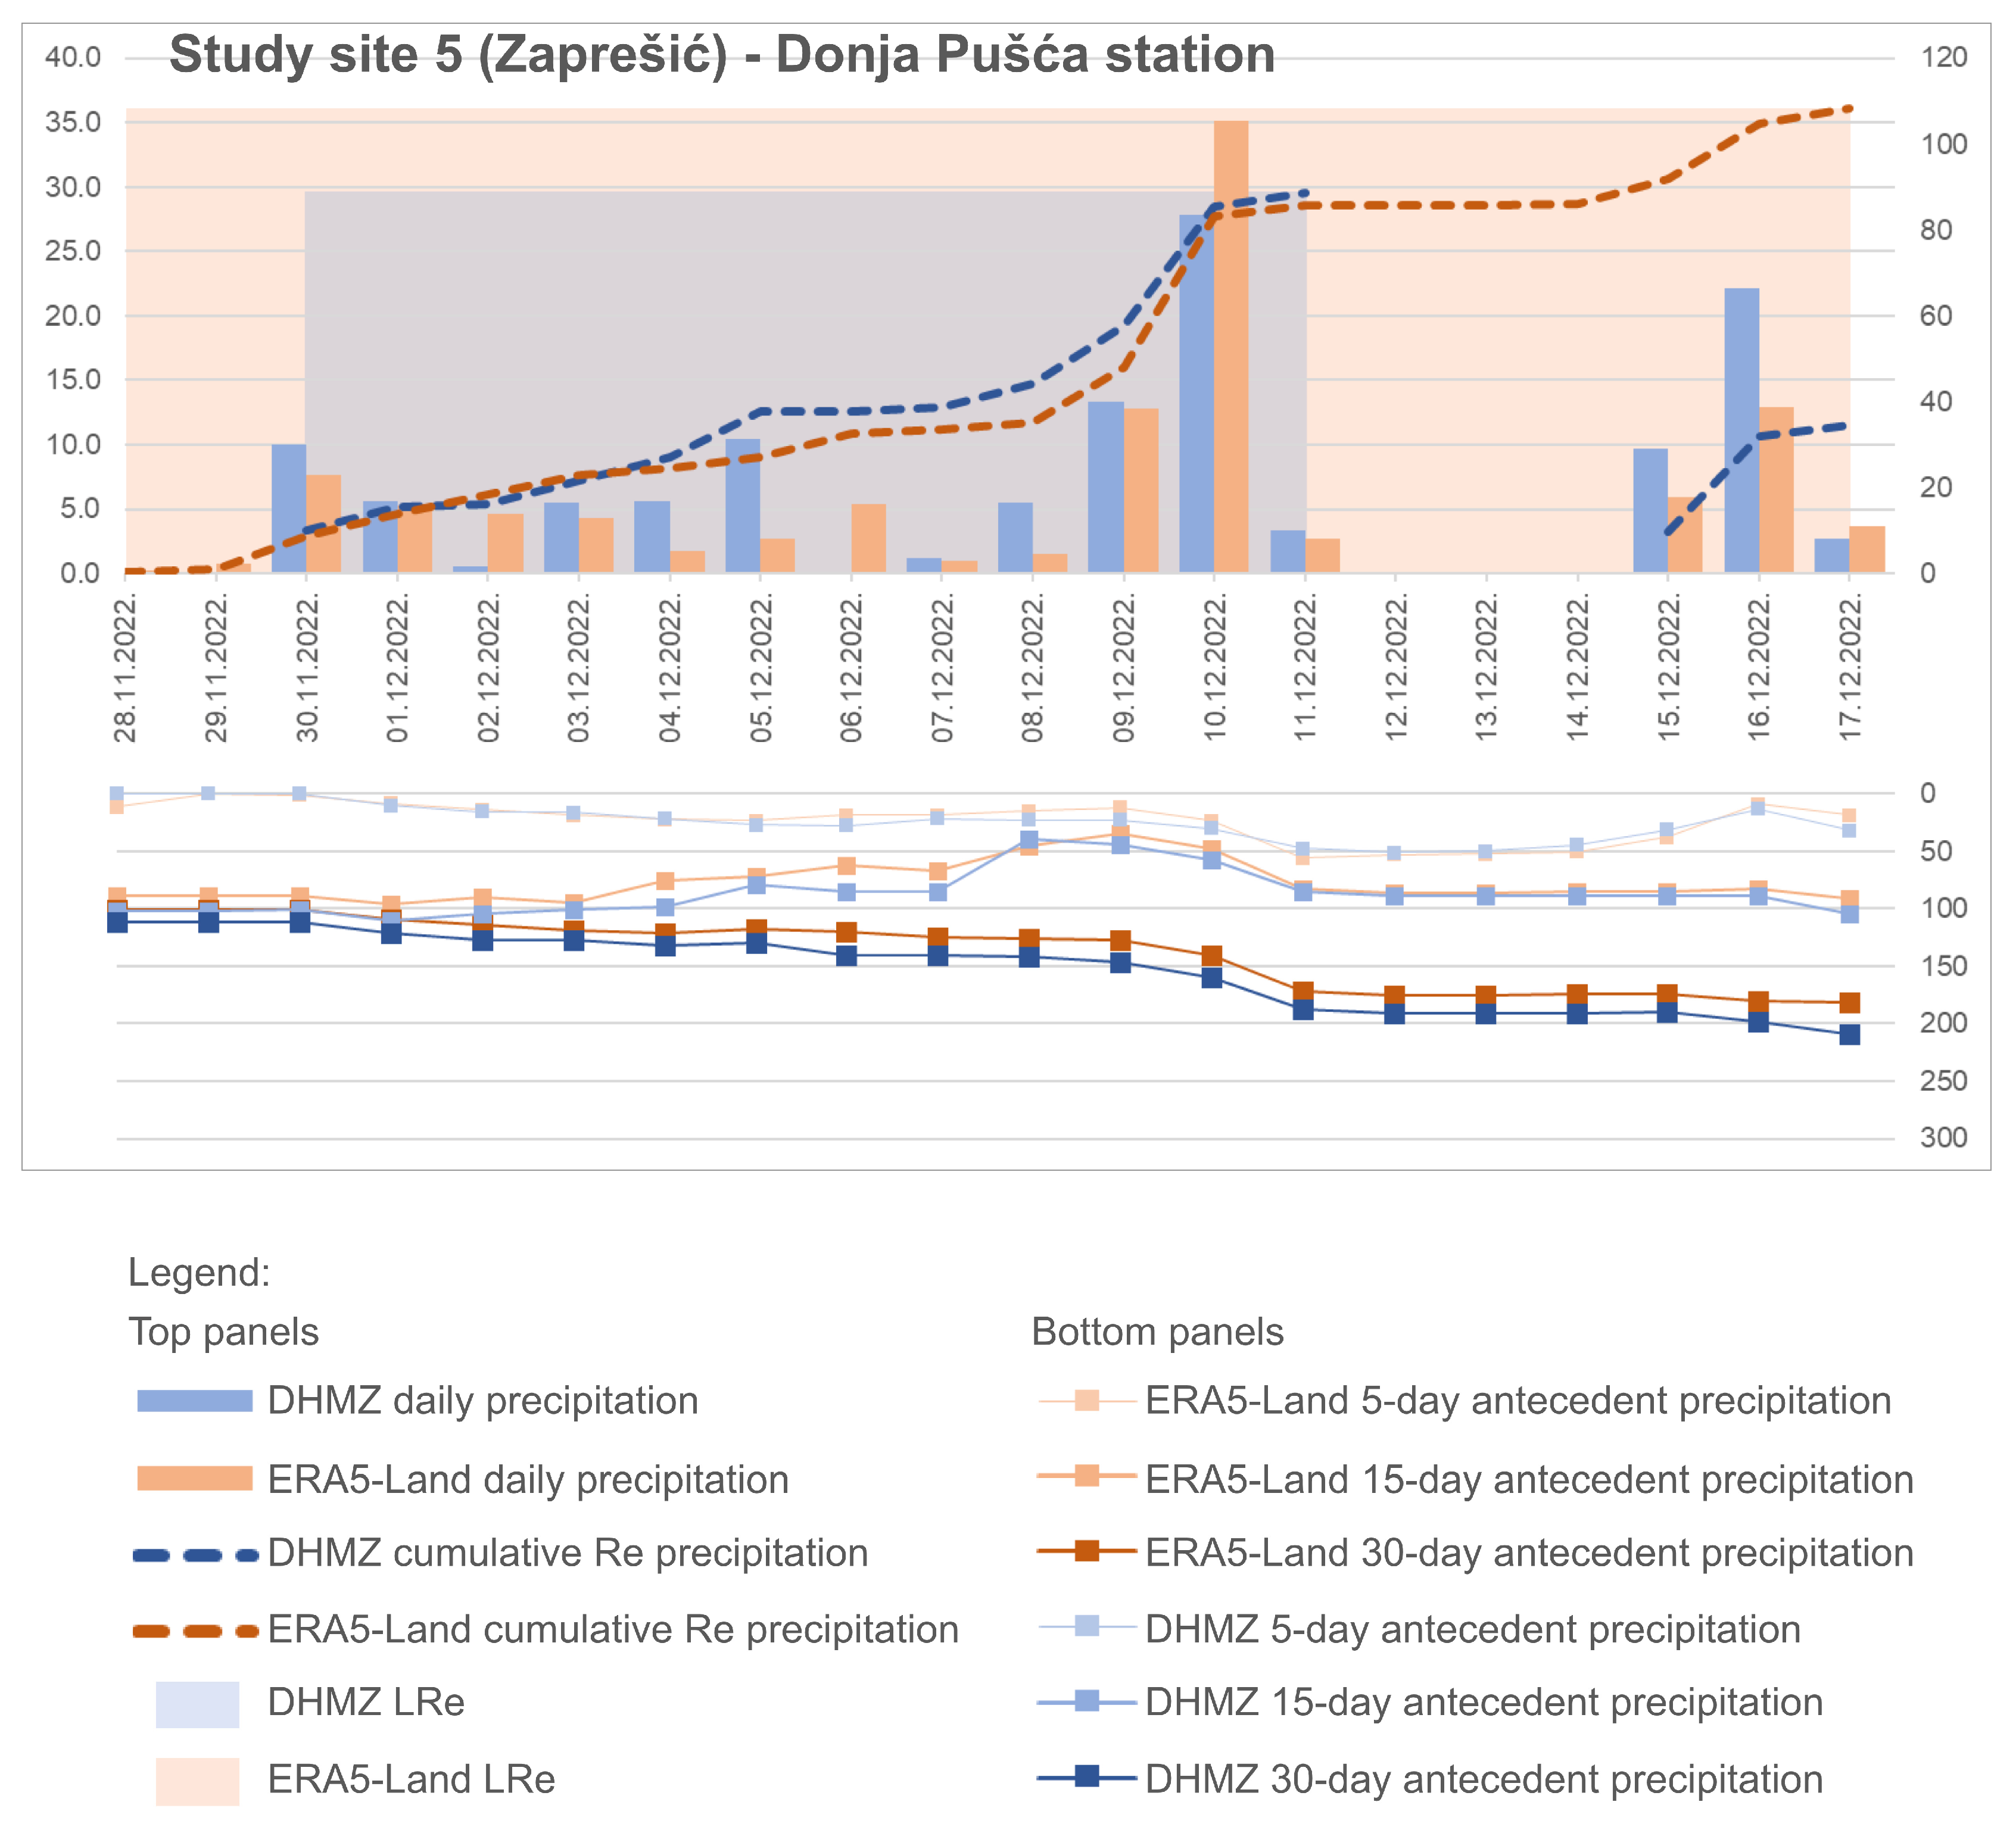
The graphical breakdown in Figure 7 couples the daily and cumulative precipitation timeline of the triggering conditions (top panels) with the corresponding 5-, 15-, and 30-day antecedent precipitation amounts (bottom panels). A prominent, systematic feature visible across all study sites is the substantial expansion of the LRe duration in the ERA5-Land dataset (orange rectangles) in comparison with the DHMZ stations (blue rectangles). Due to the continuous generation of low-intensity drizzle, the reanalysis fails to capture dry intervals, effectively merging multiple naturally independent Re into a singular, prolonged triggering sequence. This phenomenon is highly evident at the Kravarsko, Donji Javoranj, and Petrinja sites. In these locations, while the ERA5-Land timeline records a single, uninterrupted LRe, the ground-based DHMZ gauge resolves three to five distinct, episodic events interrupted by clear dry periods.
Despite this structural elongation, the cumulative precipitation trend of ERA5-Land replicates the overall rainfall behavior captured by the DHMZ stations remarkably well, with the closest trend synchronization observed at the Donja Pušća site. However, due to artificial event merging and the resulting earlier initiation of the LRe, the cumulative curves of ERA5-Land exhibit a distinct upward shift at the Donji Javoranj and Petrinja sites. At the Kravarsko and Šandrovac sites, near the end of the event window, the cumulative totals of the DHMZ stations plot above the cumulative curves of ERA5-Land. This divergence is driven by a single extreme Rd, during which the precipitation amount was underestimated by ERA5-Land by nearly a factor of two. Specifically, at the Kravarsko site, the station recorded a peak of 85 mm/day, whereas ERA5-Land estimated only 31 mm/day; similarly, for the Šandrovac station, a peak of 33 mm/day was recorded compared with an ERA5-Land estimate of only 13 mm/day. This pattern further demonstrates how ERA5-Land fails to replicate the high-intensity peaks observed at the DHMZ stations.
Regarding the antecedent precipitation time series, the fluctuations in the 5-, 15-, and 30-day antecedent moisture indicators calculated from ERA5-Land mirror the ground-based observational baselines with high fidelity. However, the most notable discrepancies in amplitude occur at the Kravarsko and Šandrovac sites, manifesting immediately after the previously mentioned extreme Rd. This behavior can be explained as a consequence of the ERA5-Land spatial resolution, where the 0.1° × 0.1° (approx. 9 km) grid cells average out events that are captured as intense point-source measurements by the ground-based rain gauges.
Mathematically, this introduces a critical, systematic bias when analyzing landslide-triggering rainfall conditions. Ranges for duration, total rainfall amount, and mean intensity vary drastically between the two source datasets. LRe windows span a range of 10 to 34 days according to the DHMZ stations, whereas ERA5-Land expands this window to a range of 20 to as many as 77 days at Donji Javoranj. Cumulative rainfall triggering instability ranges from 59.2 to 235.3 mm for ground observations, while the prolonged aggregation in ERA5-Land inflates this range to 108.1 to 332.5 mm. Consequently, because ERA5-Land divides a slightly higher or equal cumulative precipitation amount over an elongated period, the calculated triggering mean intensities drop drastically to a range of 3.2 to 5.4 mm/day, severely underestimating the actual ground-measured triggering mean intensities of 5.2 to 15.7 mm/day.
To explicitly visualize how these results affect the empirical frameworks commonly used in landslide early warning systems, I-D and E-D relationships were plotted for both datasets (Figure 8).
The I-D and E-D relationships exhibit a highly consistent general trend across the plots, characterized by a significant rightward shift along the x-axis, directly resulting from the overestimation of LRe duration, as reported previously by Guo et al. [15]. In the I-D plot, the points derived from the ERA5-Land dataset are positioned substantially lower compared with the ground-based DHMZ observations. Conversely, the E-D plot shows the opposite trend. Although this upward shift is less clear than in the I-D plot, the general trend is still present due to the continuous aggregation of precipitation over excessively long periods.
As described in Section 2.3.3, for the study sites lacking daily resolution for landslide activation, the LRe was defined as the event with the maximum cumulative precipitation within the month of activation. While this selection rule provides a practical and consistent approach for historical databases, it introduces a potential bias toward longer-duration and larger cumulative rainfall events, as the true triggering mechanism could have been a shorter, high-intensity storm preceding the peak event. Thus, to ensure full transparency, all candidate Re for both DHMZ and ERA5-Land across these locations are compiled in Table 6. Out of the three study sites analyzed with monthly resolution, this selection uncertainty in ERA5-Land applies only to one location (Zaprešić) where multiple individual events were recorded, while for the other two locations (Kravarsko and Dvor), the ERA5-Land dataset recorded only a single, continuous Re within the respective activation months. In contrast, there were multiple Re across all three study sites in the DHMZ dataset.
As evident from Table 6, the evaluation of all alternative candidate Re consistently reflects the observations in the primary analysis. For instance, in the cases of Kravarsko and Dvor sites, while the ground-based DHMZ stations recorded two shorter rainfall intervals, the ERA5-Land continuously aggregated precipitation into multi-week events, which lowers the mean rainfall intensity. For the Zaprešić site, the primary candidate Re in ERA5-Land also mirrors this systematic overestimation of duration compared with the ground observations.
Additionally, it should be noted that while this study was conducted on a limited number of landslide locations, the observed general I-D and E-D trends are consistent across all analyzed study sites. The minor localized variations in cumulative rainfall profiles do not obscure the overarching systematic pattern. Consequently, these findings provide useful evidence to suggest that ERA5-Land estimates should be treated with caution if directly applied for characterizing critical landslide-triggering rainfall conditions. Specifically, in practical terms, these underestimated intensity conditions could potentially lead to unnecessary false alarms in early warning systems. Because the model suggests that landslides occur at much lower rainfall intensities than they do in reality, alarms would be triggered before the actual physical rainfall needed for a landslide is reached.
Therefore, a statistical calibration or bias-correction procedure is highly recommended before exploring the potential use of ERA5-Land data in local or regional landslide early warning applications. In that sense, to appropriately correct ERA5-Land biases, researchers have successfully applied daily quantile mapping and statistical bias-correction procedures [51,52,53], making the bias-corrected dataset reasonably accurate in detecting and forecasting precipitation. Furthermore, using spatial downscaling techniques on gridded precipitation products demonstrates their higher accuracy and enables a better ability to detect extreme precipitation events [51,54].

4. Conclusions

This study provides an evaluation of the reliability of ERA5-Land daily precipitation data for representing regional precipitation patterns and analyzing landslide-triggering rainfall conditions across five historical landslide locations in Pannonian Croatia. By comparing grid-based reanalysis estimates with ground-based observations obtained from DHMZ stations over a 35-year period (1990–2024), several key conclusions can be drawn:
ERA5-Land demonstrates a stable regional but scale-dependent performance with a moderate daily correlation (R2 approx. 0.40) and high monthly reliability (R2 > 0.65), making it effective at tracking broader regional precipitation patterns and overall seasonal dynamics;
The ERA5-Land dataset is characterized by a structural dual bias, systematically overestimating the frequency of low-intensity precipitation while underestimating high-intensity rainfall peaks during extreme meteorological events;
A substantial drizzle effect was identified, where ERA5-Land systematically generates low-intensity Rd too frequently, thereby artificially merging independent Re into single, excessively prolonged rainfall sequences;
The reconstruction of five specific historical LRe confirmed a systematic distortion in I-D and E-D relationship plots, prolonging the triggering ERA5-Land event durations up to 77 days (compared with the observed maximum values of 34 days) while consequently underestimating the mean event intensities.
Despite these limitations, ERA5-Land remains capable of tracking background soil saturation via antecedent rainfall indices (5-, 15-, and 30-day windows). Therefore, while ERA5-Land data cannot simply replace high-resolution ground stations for identifying precise, short-term rainfall triggers, it represents a complementary dataset for regional geohazard mitigation.
By exposing these inherent structural biases, this research provides useful preliminary evidence for future bias correction, local statistical calibration, and downscaling of ERA5-Land precipitation data for landslide applications in Pannonian Croatia. Building on this baseline, future work could focus on the site adaptation of ERA5-Land precipitation data by correcting systematic biases in daily rainfall amounts, wet-day frequency, low-intensity precipitation occurrence, dry-period thresholds used for Re separation, event duration, cumulative rainfall, and mean rainfall intensity. Such a calibrated dataset would allow ERA5-Land to be used more reliably for evaluating landslide-triggering rainfall conditions, antecedent wetness assessment, and regional landslide early-warning applications, particularly in areas where long-term ground-based observations are sparse, incomplete, or unavailable.

Author Contributions

Conceptualization, I.B., V.G. and D.P.; methodology, I.B., A.K. and P.I.; software, A.K. and P.I.; formal analysis, I.B. and P.I.; investigation, P.I., A.K., I.B., V.G. and D.P.; writing—original draft preparation, I.B.; writing—review and editing, A.K., P.I., D.P. and V.G.; visualization, I.B.; supervision, A.K.; project administration, P.I., A.K. and I.B.; funding acquisition, A.K. and I.B. All authors have read and agreed to the published version of the manuscript.

Funding

This research was supported by the IPA-ADRION00414 project (Development and testing of a shared, AI-based predictive model for a coordinated use of big data and for a joint Monitoring System of landslide risk in the Adriatic-Ionian region—AIMS), implemented in the framework of Interreg VI-B IPA Adriatic-Ionian (ADRION) 2021–2027 Cooperation Programme, co-financed by the European Union.

Data Availability Statement

ERA5-Land precipitation dataset was obtained from Copernicus Climate Change Service (C3S) Climate Data Store (CDS), https://doi.org/10.24381/cds.e9c9c792. Ground-based precipitation data were obtained upon formal request by the Croatian National Meteorological and Hydrological Service (DHMZ). Processed datasets generated during the current study are available from the corresponding author upon reasonable request.

Acknowledgments

The authors express their gratitude to the Croatian Meteorological and Hydrological Service (DHMZ) for the data provided and to two anonymous Reviewers whose comments and suggestions significantly improved the manuscript.

Conflicts of Interest

The authors declare no conflicts of interest.

Abbreviations

The following abbreviations are used in this manuscript:
I-DIntensity–Duration threshold/plot
E-DEvent rainfall amount–Duration threshold/plot
ERA5-LandGlobal dataset for the land component of the fifth generation of European reanalysis
DHMZCroatian National Meteorological and Hydrological Service
RdRainfall day
ReRainfall event
LReLandslide-triggering rainfall event
MAEMean absolute error
RMSERoot mean squared error
rBiasRelative bias
R2Coefficient of determination
rPearson correlation coefficient
ρSpearman’s rank correlation coefficient

Appendix A

The annual precipitation time series (Figure A1) demonstrates the capacity of the ERA5-Land reanalysis to replicate the interannual hydrological variability across Pannonian Croatia. By aggregating precipitation data over longer temporal scales, the daily structural deviations are effectively minimized, allowing the regional macro-climate patterns to emerge clearly.
Consequently, the reanalysis product successfully captures major regional climate shifts, accurately reflecting dry periods (e.g., 2003, 2011, and 2012) as well as exceptionally wet years marked by widespread regional flooding (e.g., 2010, 2014, and 2023). This confirms that while ERA5-Land data exhibits limitations in simulating short-term, localized landslide triggers, it remains a valuable tool for tracking long-term precipitation trends, cumulative water balance variations, and broader climate change impacts across the study region.
Figure A1. Annual precipitation sums comparison between DHMZ ground stations and ERA5-Land estimates across the five study sites: (a) Kravarsko, (b) Šandrovac, (c) Donji Javoranj, (d) Petrinja, and (e) Donja Pušća. Years with incomplete monthly records at DHMZ stations are excluded to ensure data integrity.
Water 18 01783 g0a1aWater 18 01783 g0a1bWater 18 01783 g0a1c

References

  1. Bell, F.G. Geological Hazards: Their Assessment, Avoidance and Mitigation; Taylor & Francis e-Library: London, UK, 2002. [Google Scholar]
  2. Haque, U.; Blum, P.; da Silva, P.F.; Andersen, P.; Pilz, J.; Chalov, S.R.; Malet, J.P.; Auflič, M.J.; Andres, N.; Poyiadji, E.; et al. Fatal Landslides in Europe. Landslides 2016, 13, 1545–1554. [Google Scholar] [CrossRef]
  3. Alcántara-Ayala, I. Landslides in a Changing World. Landslides 2025, 22, 2851–2865. [Google Scholar] [CrossRef]
  4. Cruden, D.M. A Simple Definition of a Landslide. Bull. Int. Assoc. Eng. Geol. 1991, 43, 27–29. [Google Scholar] [CrossRef]
  5. Polemio, M.; Cerist, C.; Petrucci, O. Rainfall as a Landslide Triggering Factor: An Overview of Recent International Research. In Proceedings of the 8th International Symposium on Landslides: Landslides in Research, Theory and Practice; Bromhead, E., Dixon, N., Ibsen, M.-L., Eds.; Emerald Publishing Limited: Leeds, UK, 2000. [Google Scholar]
  6. Zhang, Q.; Shen, D. Rainfall-Induced Landslides: Influencing, Modelling and Hazard Assessment. Water 2024, 16, 3384. [Google Scholar] [CrossRef]
  7. Terzaghi, K. Theoretical Soil Mechanics; Wiley: Hoboken, NJ, USA, 1943. [Google Scholar]
  8. Rababa, F.; Ngezahayo, E.; Jefferson, I. Laboratory-Based Physical Modeling of Rainfall-Induced Landslides: A Systematic Review. Model. Earth Syst. Environ. 2026, 12, 118. [Google Scholar] [CrossRef]
  9. Wieczorek, G.F. Landslide Triggering Mechanisms. In Landslides: Investigation and Mitigation; Turner, A.K., Schuster, R.L., Eds.; Transportation Research Board, National Research Council, Special Report: Washington, DC, USA, 1996; pp. 76–90. [Google Scholar]
  10. Guzzetti, F.; Peruccacci, S.; Rossi, M.; Stark, C.P. Rainfall Thresholds for the Initiation of Landslides in Central and Southern Europe. Meteorol. Atmos. Phys. 2007, 98, 239–267. [Google Scholar] [CrossRef]
  11. Melillo, M.; Brunetti, M.T.; Peruccacci, S.; Gariano, S.L.; Roccati, A.; Guzzetti, F. A Tool for the Automatic Calculation of Rainfall Thresholds for Landslide Occurrence. Environ. Model. Softw. 2018, 105, 230–243. [Google Scholar] [CrossRef]
  12. Segoni, S.; Piciullo, L.; Gariano, S.L. A Review of the Recent Literature on Rainfall Thresholds for Landslide Occurrence. Landslides 2018, 15, 1483–1501. [Google Scholar] [CrossRef]
  13. Brunetti, M.T.; Melillo, M.; Peruccacci, S.; Ciabatta, L.; Brocca, L. How Far Are We from the Use of Satellite Rainfall Products in Landslide Forecasting? Remote Sens. Environ. 2018, 210, 65–75. [Google Scholar] [CrossRef]
  14. Gonzalez, F.C.G.; Cavacanti, M.d.C.R.; Nahas Ribeiro, W.; Mendonça, M.B.d.; Haddad, A.N. A Systematic Review on Rainfall Thresholds for Landslides Occurrence. Heliyon 2024, 10, e23247. [Google Scholar] [CrossRef] [PubMed]
  15. Guo, C.; Ning, N.; Guo, H.; Tian, Y.; Bao, A.; De Maeyer, P. Does ERA5-Land Effectively Capture Extreme Precipitation in the Yellow River Basin? Atmosphere 2024, 15, 1254. [Google Scholar] [CrossRef]
  16. Moccia, B.; Buonora, L.; Bertini, C.; Ridolfi, E.; Russo, F.; Napolitano, F. What Is Our Pick? Assessment of Satellite and Reanalysis Precipitation Datasets over Italy. J. Hydrol. Reg. Stud. 2025, 60, 102487. [Google Scholar] [CrossRef]
  17. Muñoz-Sabater, J.; Dutra, E.; Agustí-Panareda, A.; Albergel, C.; Arduini, G.; Balsamo, G.; Boussetta, S.; Choulga, M.; Harrigan, S.; Hersbach, H.; et al. ERA5-Land: A State-of-the-Art Global Reanalysis Dataset for Land Applications. Earth Syst. Sci. Data 2021, 13, 4349–4383. [Google Scholar] [CrossRef]
  18. Copernicus Climate Change Service (C3S). ERA5-Land Hourly Data from 1950 to Present; Copernicus Climate Change Service (C3S) Climate Data Store (CDS); European Union: Brussels, Belgium, 2019. [Google Scholar] [CrossRef]
  19. Copernicus Climate Change Service. ERA5-Land Post-Processed Daily-Statistics from 1950 to Present; Copernicus Climate Change Service (C3S) Climate Data Store (CDS); European Union: Brussels, Belgium, 2024. [Google Scholar] [CrossRef]
  20. Gomis-Cebolla, J.; Rattayova, V.; Salazar-Galán, S.; Francés, F. Evaluation of ERA5 and ERA5-Land Reanalysis Precipitation Datasets over Spain (1951–2020). Atmos. Res. 2023, 284, 106606. [Google Scholar] [CrossRef]
  21. Alexandridis, V.; Stefanidis, S.; Dafis, S. Evaluation of ERA5 and ERA5-Land Reanalysis Precipitation Data with Rain Gauge Observations in Greece. Environ. Sci. Proc. 2023, 26, 104. [Google Scholar] [CrossRef]
  22. Espinosa, L.A.; Portela, M.M.; Gharbia, S. Assessing Changes in Exceptional Rainfall in Portugal Using ERA5-Land Reanalysis Data (1981/1982–2022/2023). Water 2024, 16, 628. [Google Scholar] [CrossRef]
  23. Alexopoulos, M.J.; Müller-Thomy, H.; Nistahl, P.; Šraj, M.; Bezak, N. Validation of Precipitation Reanalysis Products for Rainfall-Runoff Modelling in Slovenia. Hydrol. Earth Syst. Sci. 2023, 27, 2559–2578. [Google Scholar] [CrossRef]
  24. Dalla Torre, D.; Di Marco, N.; Menapace, A.; Avesani, D.; Righetti, M.; Majone, B. Suitability of ERA5-Land Reanalysis Dataset for Hydrological Modelling in the Alpine Region. J. Hydrol. Reg. Stud. 2024, 52, 101718. [Google Scholar] [CrossRef]
  25. Zhao, B.; Dai, Q.; Han, D.; Dai, H.; Mao, J.; Zhuo, L. Probabilistic Thresholds for Landslides Warning by Integrating Soil Moisture Conditions with Rainfall Thresholds. J. Hydrol. 2019, 574, 276–287. [Google Scholar] [CrossRef]
  26. Marino, P.; Peres, D.J.; Cancelliere, A.; Greco, R.; Bogaard, T.A. Soil Moisture Information Can Improve Shallow Landslide Forecasting Using the Hydrometeorological Threshold Approach. Landslides 2020, 17, 2041–2054. [Google Scholar] [CrossRef]
  27. Wicki, A.; Lehmann, P.; Hauck, C.; Seneviratne, S.I.; Waldner, P.; Stähli, M. Assessing the Potential of Soil Moisture Measurements for Regional Landslide Early Warning. Landslides 2020, 17, 1881–1896. [Google Scholar] [CrossRef]
  28. Abraham, M.T.; Satyam, N.; Rosi, A.; Pradhan, B.; Segoni, S. Usage of Antecedent Soil Moisture for Improving the Performance of Rainfall Thresholds for Landslide Early Warning. Catena 2021, 200, 105147. [Google Scholar] [CrossRef]
  29. Halter, T.; Lehmann, P.; Bast, A.; Aaron, J.; Stähli, M. In Situ Soil Moisture Data Improve Precipitation-Based Shallow Landslide Early Warning through Innovative Machine Learning Methods. Landslides 2025, 22, 3599–3614. [Google Scholar] [CrossRef]
  30. Distefano, P.; Peres, D.J.; Piciullo, L.; Palazzolo, N.; Scandura, P.; Cancelliere, A. Hydro-Meteorological Landslide Triggering Thresholds Based on Artificial Neural Networks Using Observed Precipitation and ERA5-Land Soil Moisture. Landslides 2023, 20, 2725–2739. [Google Scholar] [CrossRef]
  31. Palazzolo, N.; Cancelliere, A.; Zofei, R.D.; Peres, D.J. Use of Delayed ERA5-Land Soil Moisture Products for Improving Landslide Early Warning. Nat. Hazards Earth Syst. Sci. 2025, 25, 4907–4919. [Google Scholar] [CrossRef]
  32. Zhang, S.; Pecoraro, G.; Huang, D.; Peng, J.; Calvello, M. Integrating Rainfall Severity and Soil Saturation Indices to Define Hydro-Meteorological Thresholds for Landslides. J. Hydrol. 2025, 654, 132873. [Google Scholar] [CrossRef]
  33. Zhang, S.; Pecoraro, G.; Huang, D.; Peng, J.; Zhang, B.; Calvello, M. From hydro-meteorological thresholds towards an operational warning model for landslides at regional scale: A real-case application. Eng. Geol. 2026, 362, 108542. [Google Scholar] [CrossRef]
  34. Basch, O. Basic Geological Map of SFRY 1:100 000, Geology of the Ivanić Grad Sheet; Savezni Geološki Zavod: Belgrade, Serbia, 1983. [Google Scholar]
  35. Jamičić, D. Structural Pattern of the Slavonian Mountains (Northern Psunj, Papuk, Krndija). Doctoral Thesis, University of Zagreb, Zagreb, Croatia, 1988. [Google Scholar]
  36. Pamić, J. Crystalline Basement of the South Pannonian Basin Based on Surface and Subsurface Data. Nafta 1998, 49, 371–390. [Google Scholar]
  37. Pamić, J.; Jurković, I. Paleozoic Tectonostratigraphic Units of the Northwest and Central Dinarides and the Adjoining South Tisia. Int. J. Earth. Sci. 2002, 91, 538–554. [Google Scholar] [CrossRef]
  38. HGI-CGS (Croatian Geological Survey). Geology of the Geological Map of the Republic of Croatia 1:300 000; Croatian Geological Survey: Zagreb, Croatia, 2009. [Google Scholar]
  39. Šegvić, B.; Slovenec, D.; Badurina, L. Major and Rare Earth Element Mineral Chemistry of Low-Grade Assemblages Inform Dynamics of Hydrothermal Ocean-Floor Metamorphism in the Dinaridic Neotethys. Geol. Mag. 2023, 160, 444–470. [Google Scholar] [CrossRef]
  40. Borojević Šoštarić, S.; Palinkaš, L.A.; Strmić Palinkaš, S.; Bermanec, V.; Neubauer, F.; Spangenberg, J.; Prochaska, W. Origin of Siderite Mineralisation in Petrova and Trgovska Gora Mts., NW Dinarides. Mineral. Petrol. 2009, 97, 111–128. [Google Scholar] [CrossRef]
  41. Bognar, A. The Physico-Geographic Dispodition of the Regional Development of the Republic of Croatia. In Proceedings of the 1st Croatian Geographical Congress; Pepeonik, Z., Ed.; Croatian Geographical Society: Zagreb, Croatia, 1996; pp. 51–65. [Google Scholar]
  42. Gulam, V.; Pollak, D.; Bostjančić, I.; Frangen, T. Defining the Geological Units Susceptible to Landslides in Pannonian Croatia Using Energy Relief Index. Bull. Eng. Geol. Environ. 2025, 84, 175. [Google Scholar] [CrossRef]
  43. Bognar, A. The Main Types of Landslides in the Republic of Croatia and Republic of Bosnia and Hercegovina—Geomorphological and Landscape Ecological Aspects. Acta Geogr. Croat. 1996, 31, 27–39. [Google Scholar]
  44. Jurak, V.; Matković, I.; Miklin, Ž.; Mihalić, S. Data Analysis of the Landslides in the Republic of Croatia: Present State and Perspectives. In Proceedings of the 7th International Symposium on Landslides; Senneset, K., Ed.; A.A. Balkema Publishers: Leiden, The Netherlands, 1996; pp. 1923–1929. [Google Scholar]
  45. Köppen, W. Klassifikation Der Klimate Nach Temperatur, Niederschlag Und Jahreslauf. Petermanns Geogr. Mitt. 1918, 64, 193–203. [Google Scholar]
  46. Filipčić, A. Climatic Regionalization of Croatia According to W. Köppen for the Standard Period 1961–1990 in Relation to the Period 1931–1960. Acta Geogr. Croat. 1998, 33, 7–14. [Google Scholar]
  47. Šegota, T.; Filipčić, A. Köppen’s Classification of Climates and the Problem of Corresponding Croatian Terminology. Geoadria 2003, 8, 17–37. [Google Scholar]
  48. Zaninović, K.; Gajić-Čapka, M.; Perčec Tadić, M.; Vučetić, M.; Milković, J.; Bajić, A.; Cindrić, K.; Cvitan, L.; Katušin, Z.; Kaučić, D.; et al. Klimatski Atlas Hrvatske/Climate Atlas of Croatia 1961–1990, 1971–2000; Zaninović, K., Ed.; Croatian Meteorological and Hydrological Service: Zagreb, Croatia, 2008. [Google Scholar]
  49. Peruccacci, S.; Brunetti, M.T.; Gariano, S.L.; Melillo, M.; Rossi, M.; Guzzetti, F. Rainfall Thresholds for Possible Landslide Occurrence in Italy. Geomorphology 2017, 290, 39–57. [Google Scholar] [CrossRef]
  50. Li, Q.; Jiang, Y.; Wei, L.; Liu, F.; Zhu, J. Comparison of ERA5-Land and CMPAS Reanalysis Data for the Regional Assessment of Precipitation in Chongqing, China. Meteorol. Atmos. Phys. 2025, 137, 16. [Google Scholar] [CrossRef]
  51. Nguyen-Duy, T.; Ngo-Duc, T.; Choisy, M.; Fernandez, I.P.; Sparrow, S. Performance and Added Value of a High-Resolution (2 Km) Rainfall Product Based on WRF-Downscaled ERA5 for Ho Chi Minh City, Vietnam. Theor. Appl. Climatol. 2025, 156, 656. [Google Scholar] [CrossRef]
  52. Botto, V.; Tiranti, D.; Barbarino, S.; Ronchi, C. Using ERA-5 LAND Reanalysis Rainfall Data to Better Evaluate the Performance of the Regional Shallow Landslide Early Warning System of Piemonte (North-Western Italy) in the Context of Climate Change. Front. Earth Sci. 2025, 12, 1536277. [Google Scholar] [CrossRef]
  53. Zhang, L.; Yan, Z.; Huang, K.; Zhang, W. Evaluation and Statistical Bias Correction of ERA5-Land Meteorological Variables for a Humid River Basin in Southwest China. Sci. Rep. 2025, 15, 41101. [Google Scholar] [CrossRef] [PubMed]
  54. Ning, S.; Ge, Y.; Bai, S.; Ma, C.; Sun, Y. I–D Threshold Analysis of Rainfall-Triggered Landslides Based on TRMM Precipitation Data in Wudu, China. Remote Sens. 2023, 15, 3892. [Google Scholar] [CrossRef]
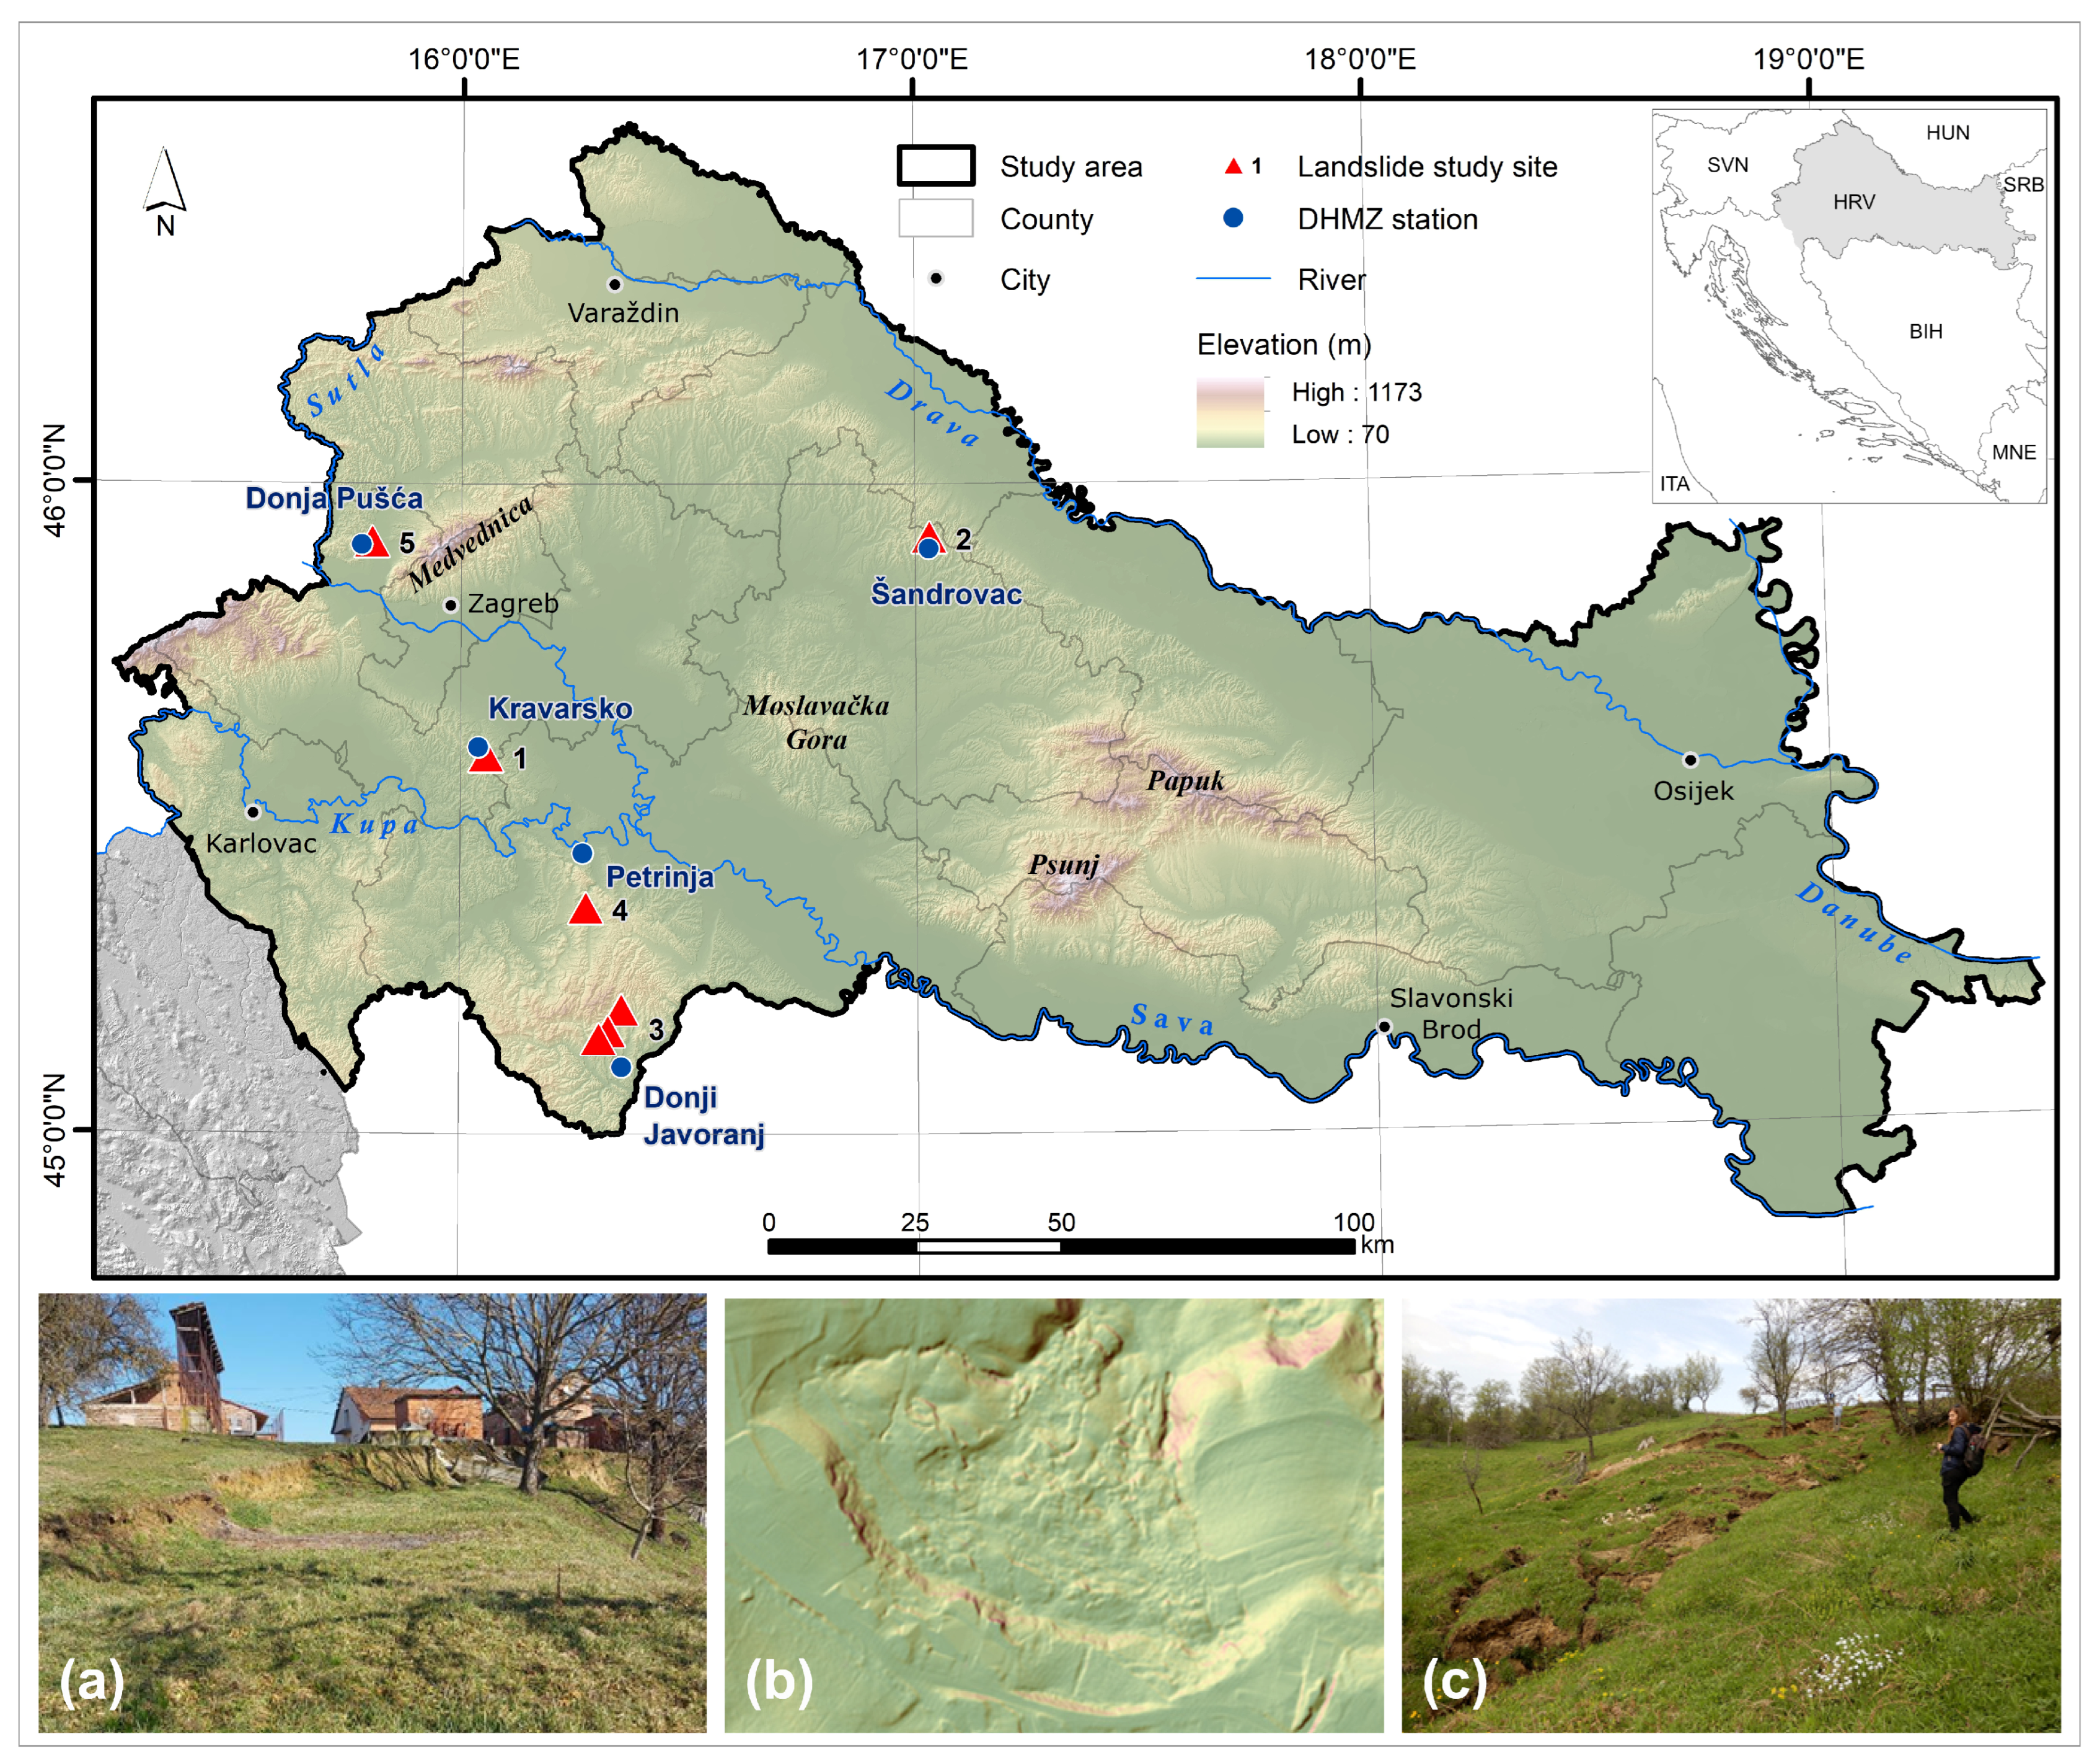
Figure 1. Map of the wider study area in Pannonian Croatia highlighting the five investigated landslide study sites with corresponding DHMZ meteorological stations. The inset panels present selected study site locations: (a) Study site 2 (Šandrovac), (b) LiDAR-based hillshade overlapped with a slope map showing the morphology at the study site 1 (Kravarsko), and (c) Study site 3 (Dvor).
Water 18 01783 g001
Figure 2. Spatial distribution of the ERA5-Land reanalysis grid points relative to the location of the selected DHMZ ground-based meteorological stations.
Water 18 01783 g002
Figure 3. Scatter plots and linear regression analysis of daily precipitation between DHMZ station observations and ERA5-Land across the five study sites. The embedded tables show the corresponding daily statistical metrics compared for the complete time series (“All days”) and the conditional subset (“Rainfall days”).
Water 18 01783 g003
Figure 4. Scatter plots and linear regression analysis of monthly precipitation between DHMZ station observations and ERA5-Land across the five study sites. The embedded tables show the corresponding monthly statistical metrics.
Water 18 01783 g004
Figure 5. Comparison of the average annual number of rainfall days across the five study sites, showing the total rainfall days (Rd) and categories based on daily precipitation thresholds (>0.5, >1.0, >5.0, >10.0, and >20.0 mm) between DHMZ stations (blue bars) and ERA5-Land (orange bars).
Water 18 01783 g005
Figure 6. Comparison of the average annual number of rainfall events across the five study sites, showing the total rainfall event (Re) and categories based on event duration thresholds (>1, >10, and >20 days) between DHMZ stations (blue bars) and ERA5-Land (orange bars).
Water 18 01783 g006
Figure 7. Landslide-triggering rainfall events (LRe) and antecedent precipitation conditions across the five study sites. Top panels present daily precipitation (left y-axis, mm) and corresponding cumulative precipitation of the rainfall events (Re) (right y-axis, mm). Bottom panels present synchronized temporal variations in 5-day, 15-day, and 30-day antecedent precipitation (mm) for both datasets.
Water 18 01783 g007aWater 18 01783 g007bWater 18 01783 g007c
Figure 8. Comparison of landslide-triggering rainfall conditions derived from DHMZ ground observations (blue symbols) and ERA5-Land reanalysis (orange symbols): (a) Intensity–Duration (I-D) relationship plot and (b) Cumulative rainfall–Duration (E-D) relationship plot.
Water 18 01783 g008
Table 1. Landslide study sites with corresponding DHMZ meteorological stations.
Study SiteLandslideLatitude (°)Longitude (°)Time of ActivationDHMZ Station
1Kravarsko45.581716.0568February 2014Kravarsko
2Šandrovac45.918217.030415 February 2015Šandrovac
3 *Dvor (Zrinska Draga)45.191616.3533March 2018Donji Javoranj
Dvor (Gorička)45.158616.3244
Dvor (Pedalj)45.147016.3039
4Prnjavor Čuntićki45.348516.275816 March 2018Petrinja
5Zaprešić45.911915.8032December 2022Donja Pušća
Note: * Three separate landslides in the Dvor area (Zrinska Draga, Gorička, Pedalj) are considered as one study site, since these landslides are triggered by the same rainfall event (Re) and are associated with the same DHMZ station.
Table 2. Overview of the selected DHMZ stations.
DHMZ
Station
Latitude (°)Longitude (°)Elevation (m)Missing Data *Operational DaysOperational Years
Kravarsko45.595016.03972051990, 1991-09, 1992-07, 1993-07, 1994-07, 1995-07, 1997-08, 1997-10, 1999-02, 2000-07, 2001-09, 2019-0912,08433.08
Šandrovac45.900317.03001441990-0612,75335.92
Donji Javoranj45.103316.35441551990–2013401811.00
Petrinja45.432216.26921061991-09, 1991-10, 1991-11, 1991-12, 1992, 1993, 1994, 1995, 1996-01, 1996-02, 1996-03, 1996-04, 1996-05, 2007-03, 2007-04, 2007-05, 2007-06, 2007-07, 2007-08, 2007-09, 2007-10, 2007-11, 2007-12, 2008-01, 2008-02, 2009-01, 2010-12, 2011-11, 2011-12, 2012-01, 2012-02, 2012-0310,46828.66
Donja Pušća45.906415.78111591992-05, 2010-02, 2013-04, 2013-05, 2013-06, 2013-1112,60334.51
Note: * If data are missing for an entire year, the entry is listed in YYYY format; missing monthly data are presented in YYYY-MM format.
Table 3. Formulas of the evaluation statistical metrics.
Statistical MetricFormula */Explanation
Mean Absolute Error (MAE) M A E = 1 n i = 1 n y i x i
Root Mean Squared Error (RMSE) R M S E = 1 n i = 1 n y i x i 2
Relative Bias (rBias) r B i a s = i = 1 n y i x i i = 1 n x i 100
Coefficient of Determination (R2) R 2 = r 2
Pearson correlation coefficient (r) r = i = 1 n x i x ¯ y i y ¯ i = 1 n x i x ¯ 2 i = 1 n y i y ¯ 2
Spearman’s rank correlation coefficient (ρ)Calculated as Pearson’s r applied to ranked variables
Note: * x i is the DHMZ precipitation on day i; y i is the ERA5-Land precipitation on day i; x ¯ is the mean of DHMZ precipitation; y ¯ is the mean of ERA5-Land precipitation; n is the number of observations.
Table 4. Comparison of average and maximum precipitations for all rainfall days (Rd ≥ 0.1) across the five study sites, between DHMZ stations and ERA5-Land.
DatasetKravarskoŠandrovacDonji
Javoranj
PetrinjaDonja
Pušća
Average precipitation amount (mm)DHMZ8.28.010.88.98.7
ERA5-Land4.54.13.64.74.6
Maximum precipitation amount (mm)DHMZ85.077.599.8125.099.8
ERA5-Land55.952.172.466.350.0
Table 5. Comparison of average and maximum duration, and cumulative precipitations for all rainfall events (Re) across the five study sites, between DHMZ stations and ERA5-Land.
DatasetKravarskoŠandrovacDonji
Javoranj
PetrinjaDonja
Pušća
Average durationDHMZ4.24.65.34.84.7
ERA5-Land11.611.512.912.111.7
Maximum durationDHMZ34.045.034.031.056.0
ERA5-Land104.098.0136.0105.096.0
Average cumulative precipitationDHMZ27.527.934.932.931.8
ERA-5 Land42.238.156.746.643.3
Maximum cumulative precipitationDHMZ235.3264.9284.7253.2297.2
ERA5-Land435.4380.6519.9407.6393.3
Table 6. Overview of all rainfall events recorded within the landslide activation months across the three study sites with monthly resolution of activation, comparing ERA5-Land reanalysis data and DHMZ ground observations.
Study SiteActivation MonthData SourceRainfall EventDuration (Day)Cumulative
Precipitation (mm)
Mean Intensity (mm/Day)
KravarskoFebruary 2014ERA5-Land1 *41200.54.9
DHMZ1613.32.2
2 *15235.315.7
DvorMarch 2018ERA5-Land1 *77332.54.3
DHMZ1 *34195.75.8
2326.58.8
ZaprešićDecember 2022ERA5-Land1 *20108.45.4
230.80.3
315.55.5
DHMZ1 *1288.77.4
2334.511.5
311.01.0
Note: * Re selected as LRe.
Disclaimer/Publisher’s Note: The statements, opinions and data contained in all publications are solely those of the individual author(s) and contributor(s) and not of MDPI and/or the editor(s). MDPI and/or the editor(s) disclaim responsibility for any injury to people or property resulting from any ideas, methods, instructions or products referred to in the content.