Article

Impacts of Human Activities on the Spatial Distribution of Surface Diatoms in Nansi Lake, China
1
School of Geography, Geomatics & Planning, Jiangsu Normal University, Xuzhou 221008, China
2
College of Resources and Environment, Lanzhou University, Lanzhou 730000, China
*
Authors to whom correspondence should be addressed.
Water 2026, 18(14), 1705; https://doi.org/10.3390/w18141705
Submission received: 10 June 2026 / Revised: 2 July 2026 / Accepted: 10 July 2026 / Published: 14 July 2026
(This article belongs to the Special Issue Diatom Biodiversity and Their Adaptation to Environment Change)

Abstract

Shallow lakes are vulnerable to multiple anthropogenic stressors. However, the spatial responses of benthic ecosystems to these composite disturbances and the underlying mechanisms driving them remain poorly understood. Nansi Lake is a strategic water-regulating reservoir of the Eastern Route of the South-to-North Water Transfers. It has long been subjected to multiple human activities, and its aquatic ecological environment exhibits pronounced spatial heterogeneity. A systematic assessment is thus needed to evaluate the spatial distribution patterns of surface-sediment diatom communities and their trophic response characteristics. This study integrates the Trophic Diatom Index (TDI) with multivariate statistical approaches. It analyzes the spatial distribution and driving factors of surface-sediment diatom assemblages based on diatom and water quality data from 62 sampling sites. The results reveal three distinct community zones across the lake. The first is a high-disturbance zone dominated by hydraulic regulation and mining activities. In this zone, Stephanodiscus parvus Stoermer & Håkansson is the absolute dominant species, indicating a clear eutrophic status. The second is a hydrochemically stable zone dominated by Achnanthidium minutissimum (Kützing) Czarnecki, exhibiting relatively high community integrity. The third is a vast central open-water zone characterized by the dominance of Pseudostaurosira brevistriata (Grunow) Williams & Round, representing a mesotrophic transitional state. Partial redundancy analysis (pRDA) shows that multiple explanatory variables jointly explain 28.91% of the community variation. The independent explanatory powers of anthropogenic variables (9.12%) and environmental factors (7.94%) are both higher than that of pure spatial dispersal processes (0.35%). Redundancy Analysis (RDA) indicates that different types of human activities—such as reservoir regulation, coal mining, and estuarine inflows—may influence the spatial distribution patterns of surface-sediment diatoms. They do so by jointly driving variations in lake trophic status and the ionic environment, particularly Mg2+ and SO42−. This study provides a scientific basis for the water resource management of shallow lakes subject to anthropogenic impacts.

1. Introduction

Large shallow lakes worldwide are increasingly threatened by climatic and intensive anthropogenic stressors. They face ecological crises such as habitat degradation and community restructuring. Anthropogenic disturbance has become a primary driver altering benthic ecosystem structure [1,2].
Diatoms are highly sensitive to changes in the aquatic environment and are readily preserved in sediments. They serve as ideal indicators for reconstructing environmental evolution and identifying anthropogenic disturbances [3,4]. Compared with instantaneous water quality monitoring, surface-sediment diatoms integrate long-term environmental information. They avoid the contingency of single sampling events and reliably reflect the cumulative environmental pressure on lakes [5]. Furthermore, the Trophic Diatom Index (TDI), developed based on diatoms, has become a core standardized tool for the quantitative assessment of lake eutrophication and organic pollution worldwide [6,7,8].
Nansi Lake serves as a critical water-regulating hub for the Eastern Route of the South-to-North Water Transfers. It is essential for regional water supply and ecological security [9,10]. The lake is characterized by shallow, open waters and strong hydrodynamic disturbance. Its sediments are highly sensitive to external pollution, making it a natural site for conducting surface-sediment ecological records [11,12]. Meanwhile, multiple anthropogenic disturbances—such as sluice regulation, coal mining, and agricultural non-point source pollution—are superimposed within the watershed. These stressors profoundly differentiate lake habitats through nutrient loading, hydrodynamic alteration, and ionic modification of the water column, thereby generating significant spatial heterogeneity [13,14,15,16]. This makes Nansi Lake a typical region for investigating the spatial differentiation of surface-sediment diatoms under composite stressors.
Current research on Nansi Lake has largely focused on instantaneous water quality or plankton dynamics [17,18]. Two major gaps remain. First, there is a lack of analysis based on sedimentary diatoms to capture long-term cumulative ecological signals. Second, spatial proxy variables are rarely constructed to quantitatively disentangle the independent contributions of environmental factors and anthropogenic stressors to variations in surface-sediment diatom communities. Therefore, this study employs surface-sediment diatoms and the TDI across the entire lake, combined with partial redundancy analysis (pRDA), to systematically identify the key environmental and anthropogenic factors driving diatom spatial differentiation. This study aims to elucidate the response mechanisms of benthic ecosystems in shallow lakes under multiple disturbances. It also seeks to provide quantitative scientific support for water quality security and spatially targeted management of the Eastern Route of the South-to-North Water Transfers.

2. Materials and Methods

2.1. Study Area and Sample Collection

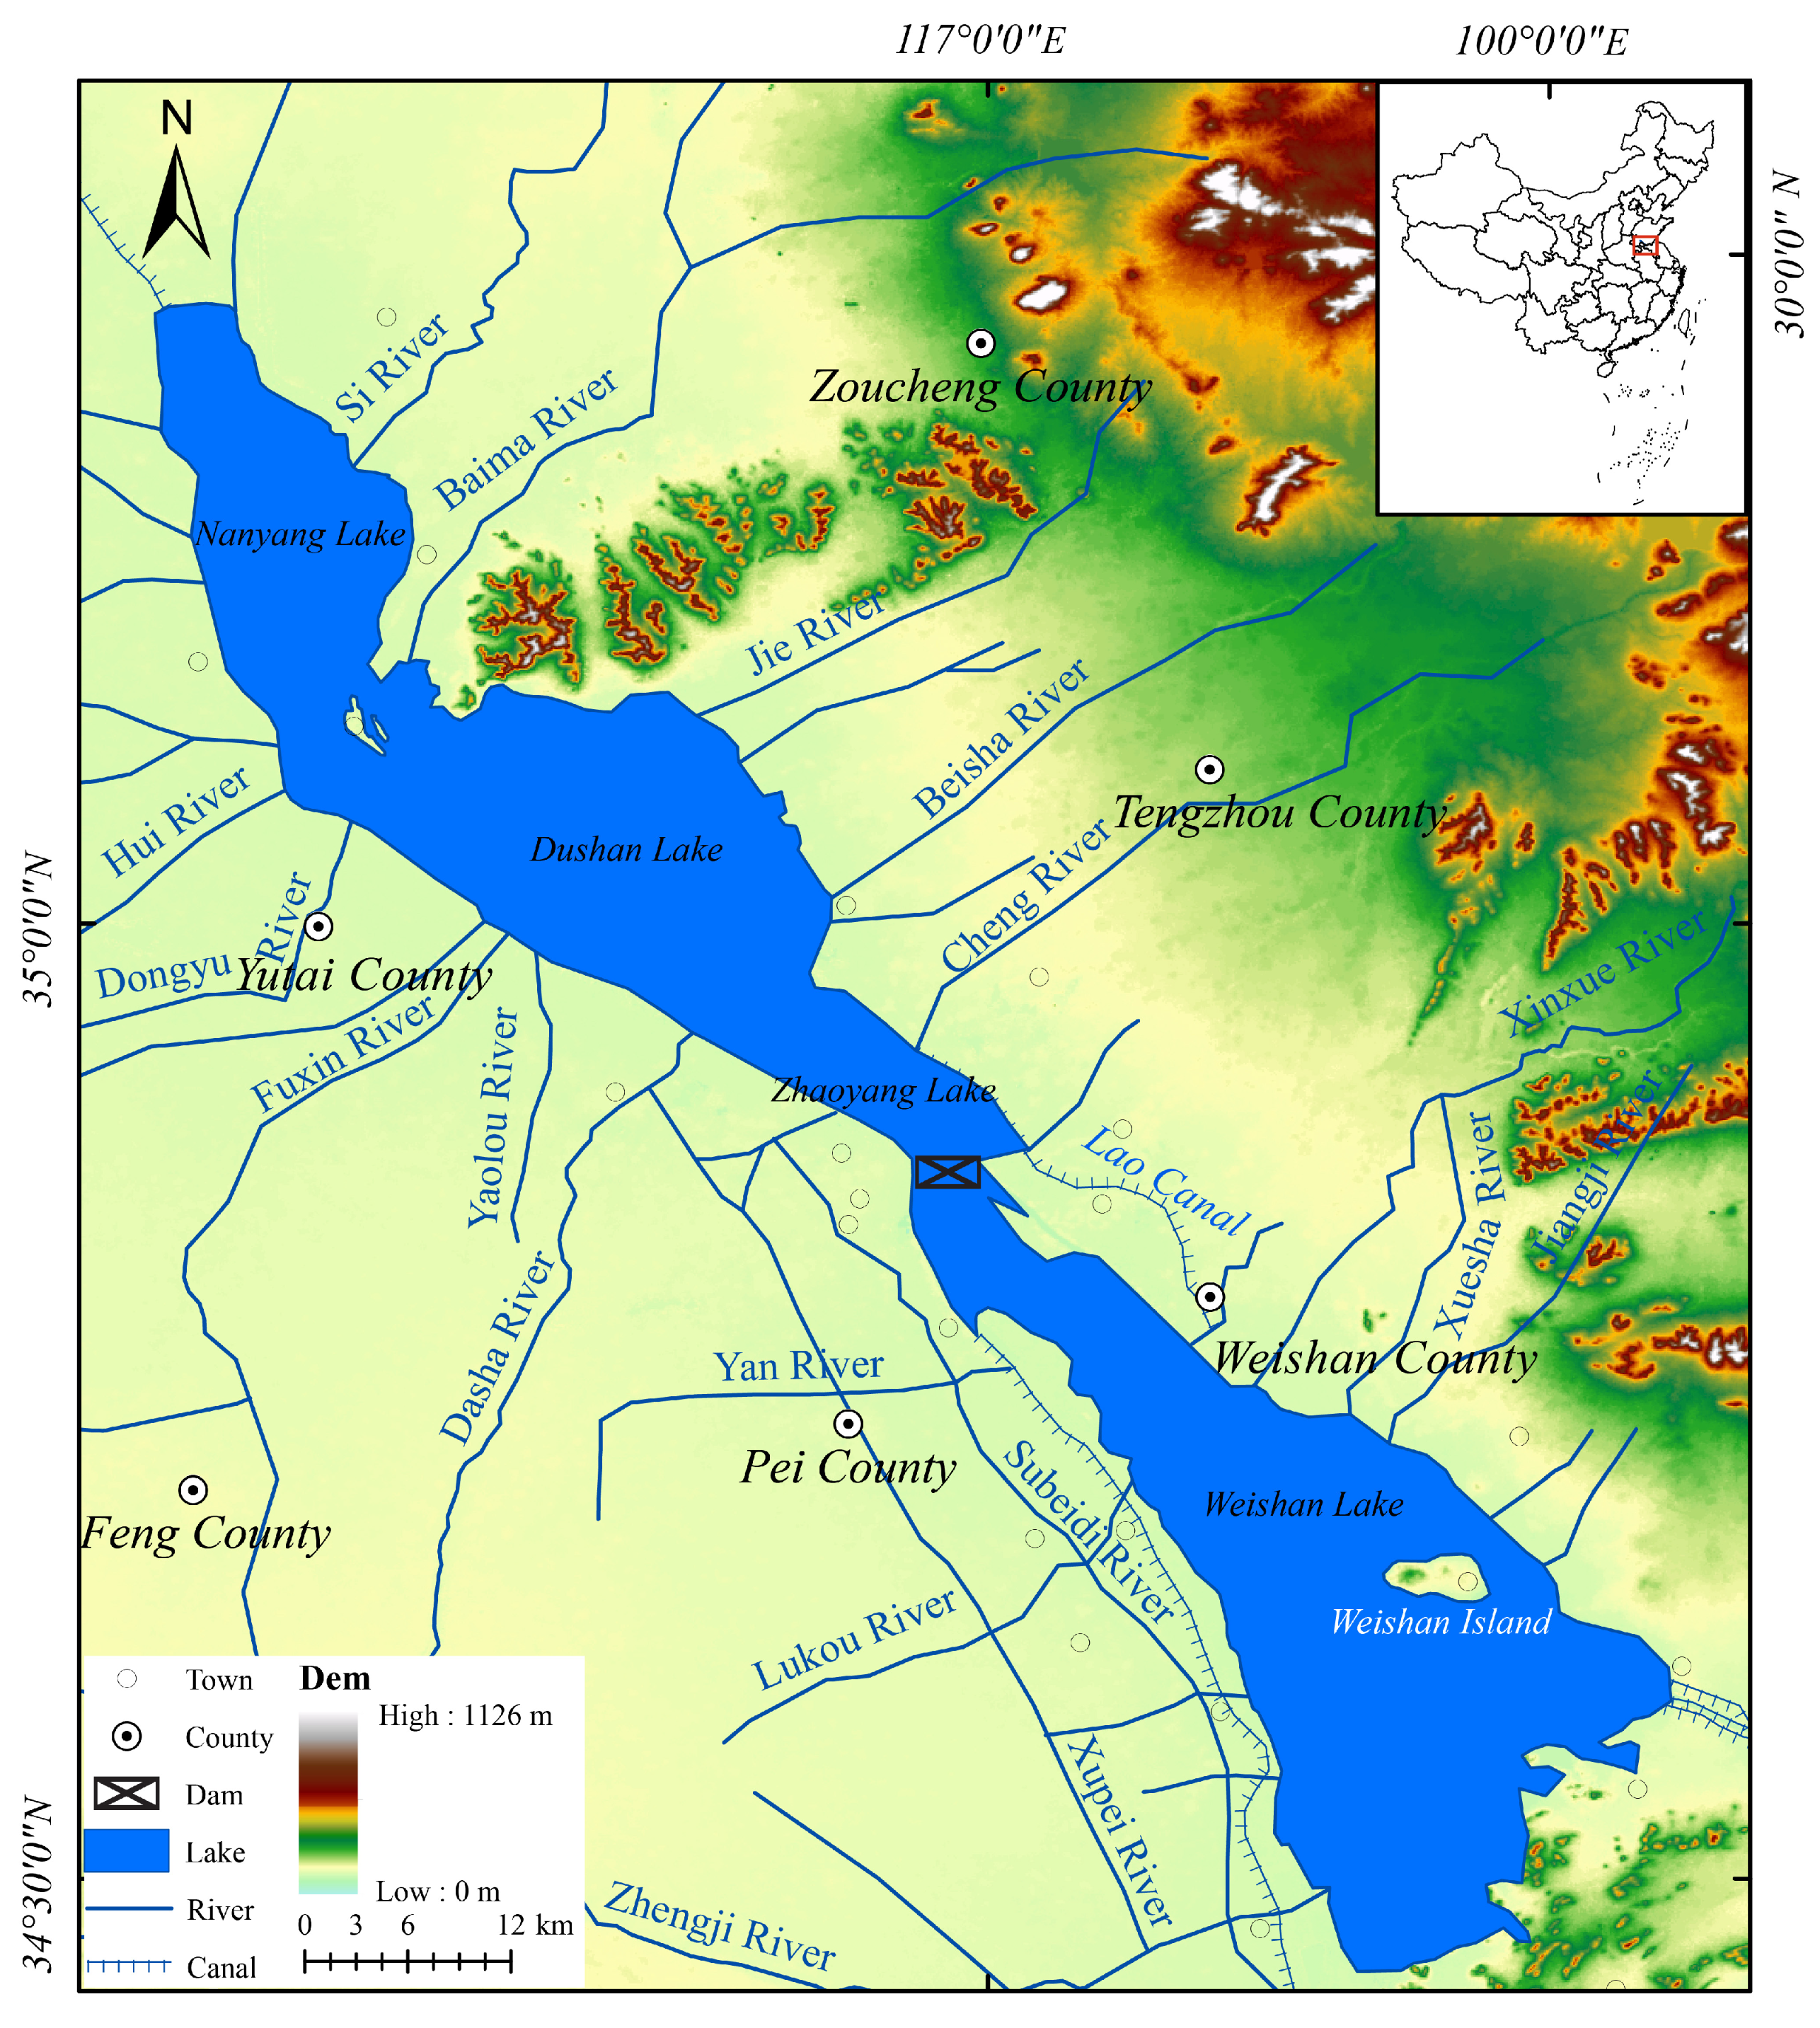
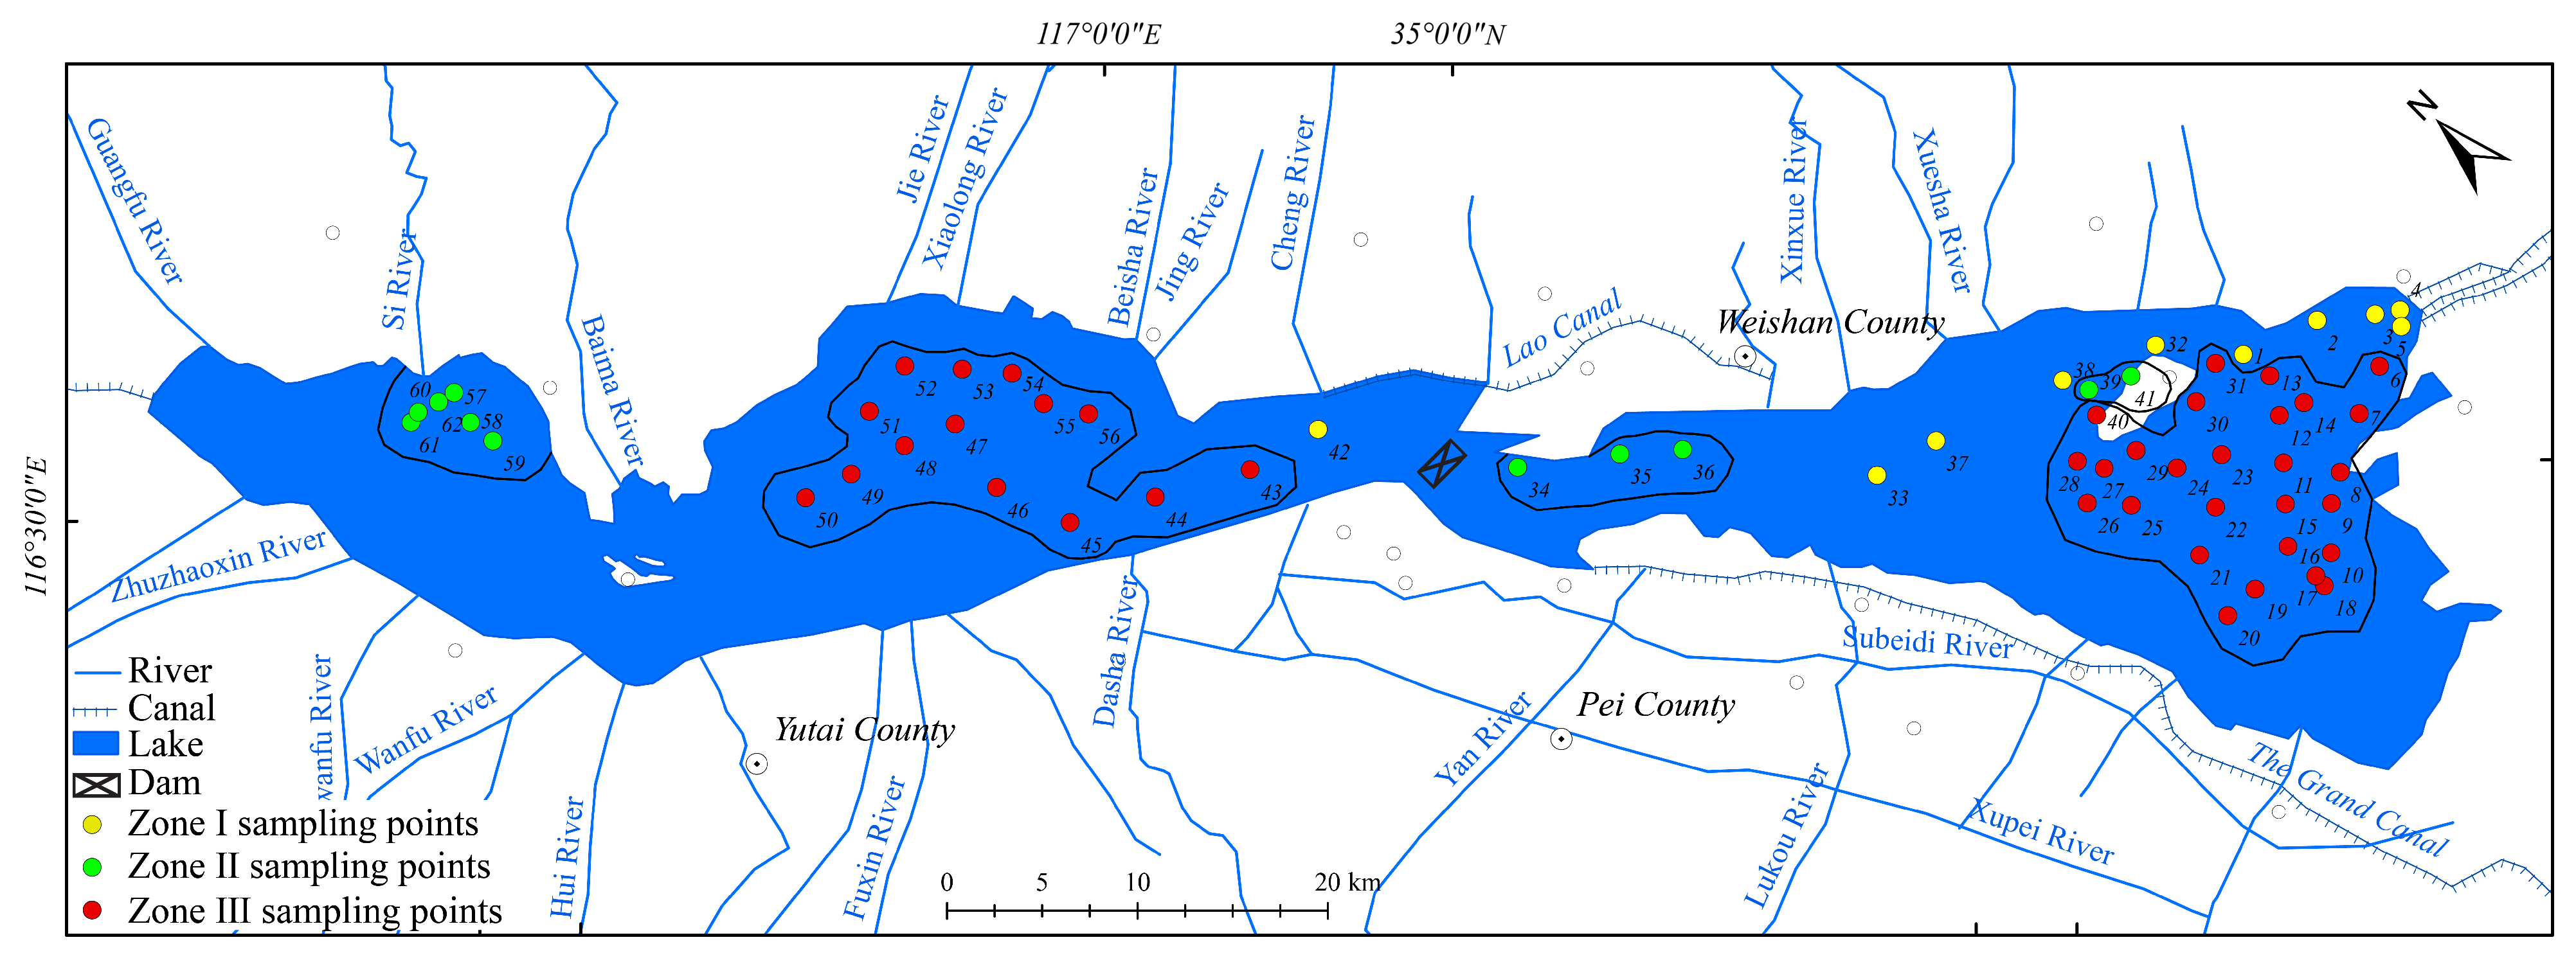
Nansi Lake (34°27′–35°20′ N, 116°34′–117°21′ E) is located in the southwestern part of Shandong Province, at the junction of Shandong, Jiangsu, Henan, and Anhui provinces. It consists of four interconnected shallow lakes: Nanyang Lake, Dushan Lake, Zhaoyang Lake, and Weishan Lake (Figure 1). It is a major freshwater lake group in northern China and serves as a key water conveyance channel and regulating hub for the Eastern Route of the South-to-North Water Transfers [18,19,20]. The lake plays an important role in flood control, water supply, biodiversity maintenance, and wetland ecological security. Its water quality is crucial for regional ecological security and the assurance of water quality during water diversion. Nansi Lake has a warm temperate monsoon climate with four distinct seasons. Precipitation is mainly concentrated in summer. The annual mean temperature ranges from 11.1 °C to 14.4 °C, and the annual mean precipitation ranges from 550.8 mm to 794.5 mm [21].
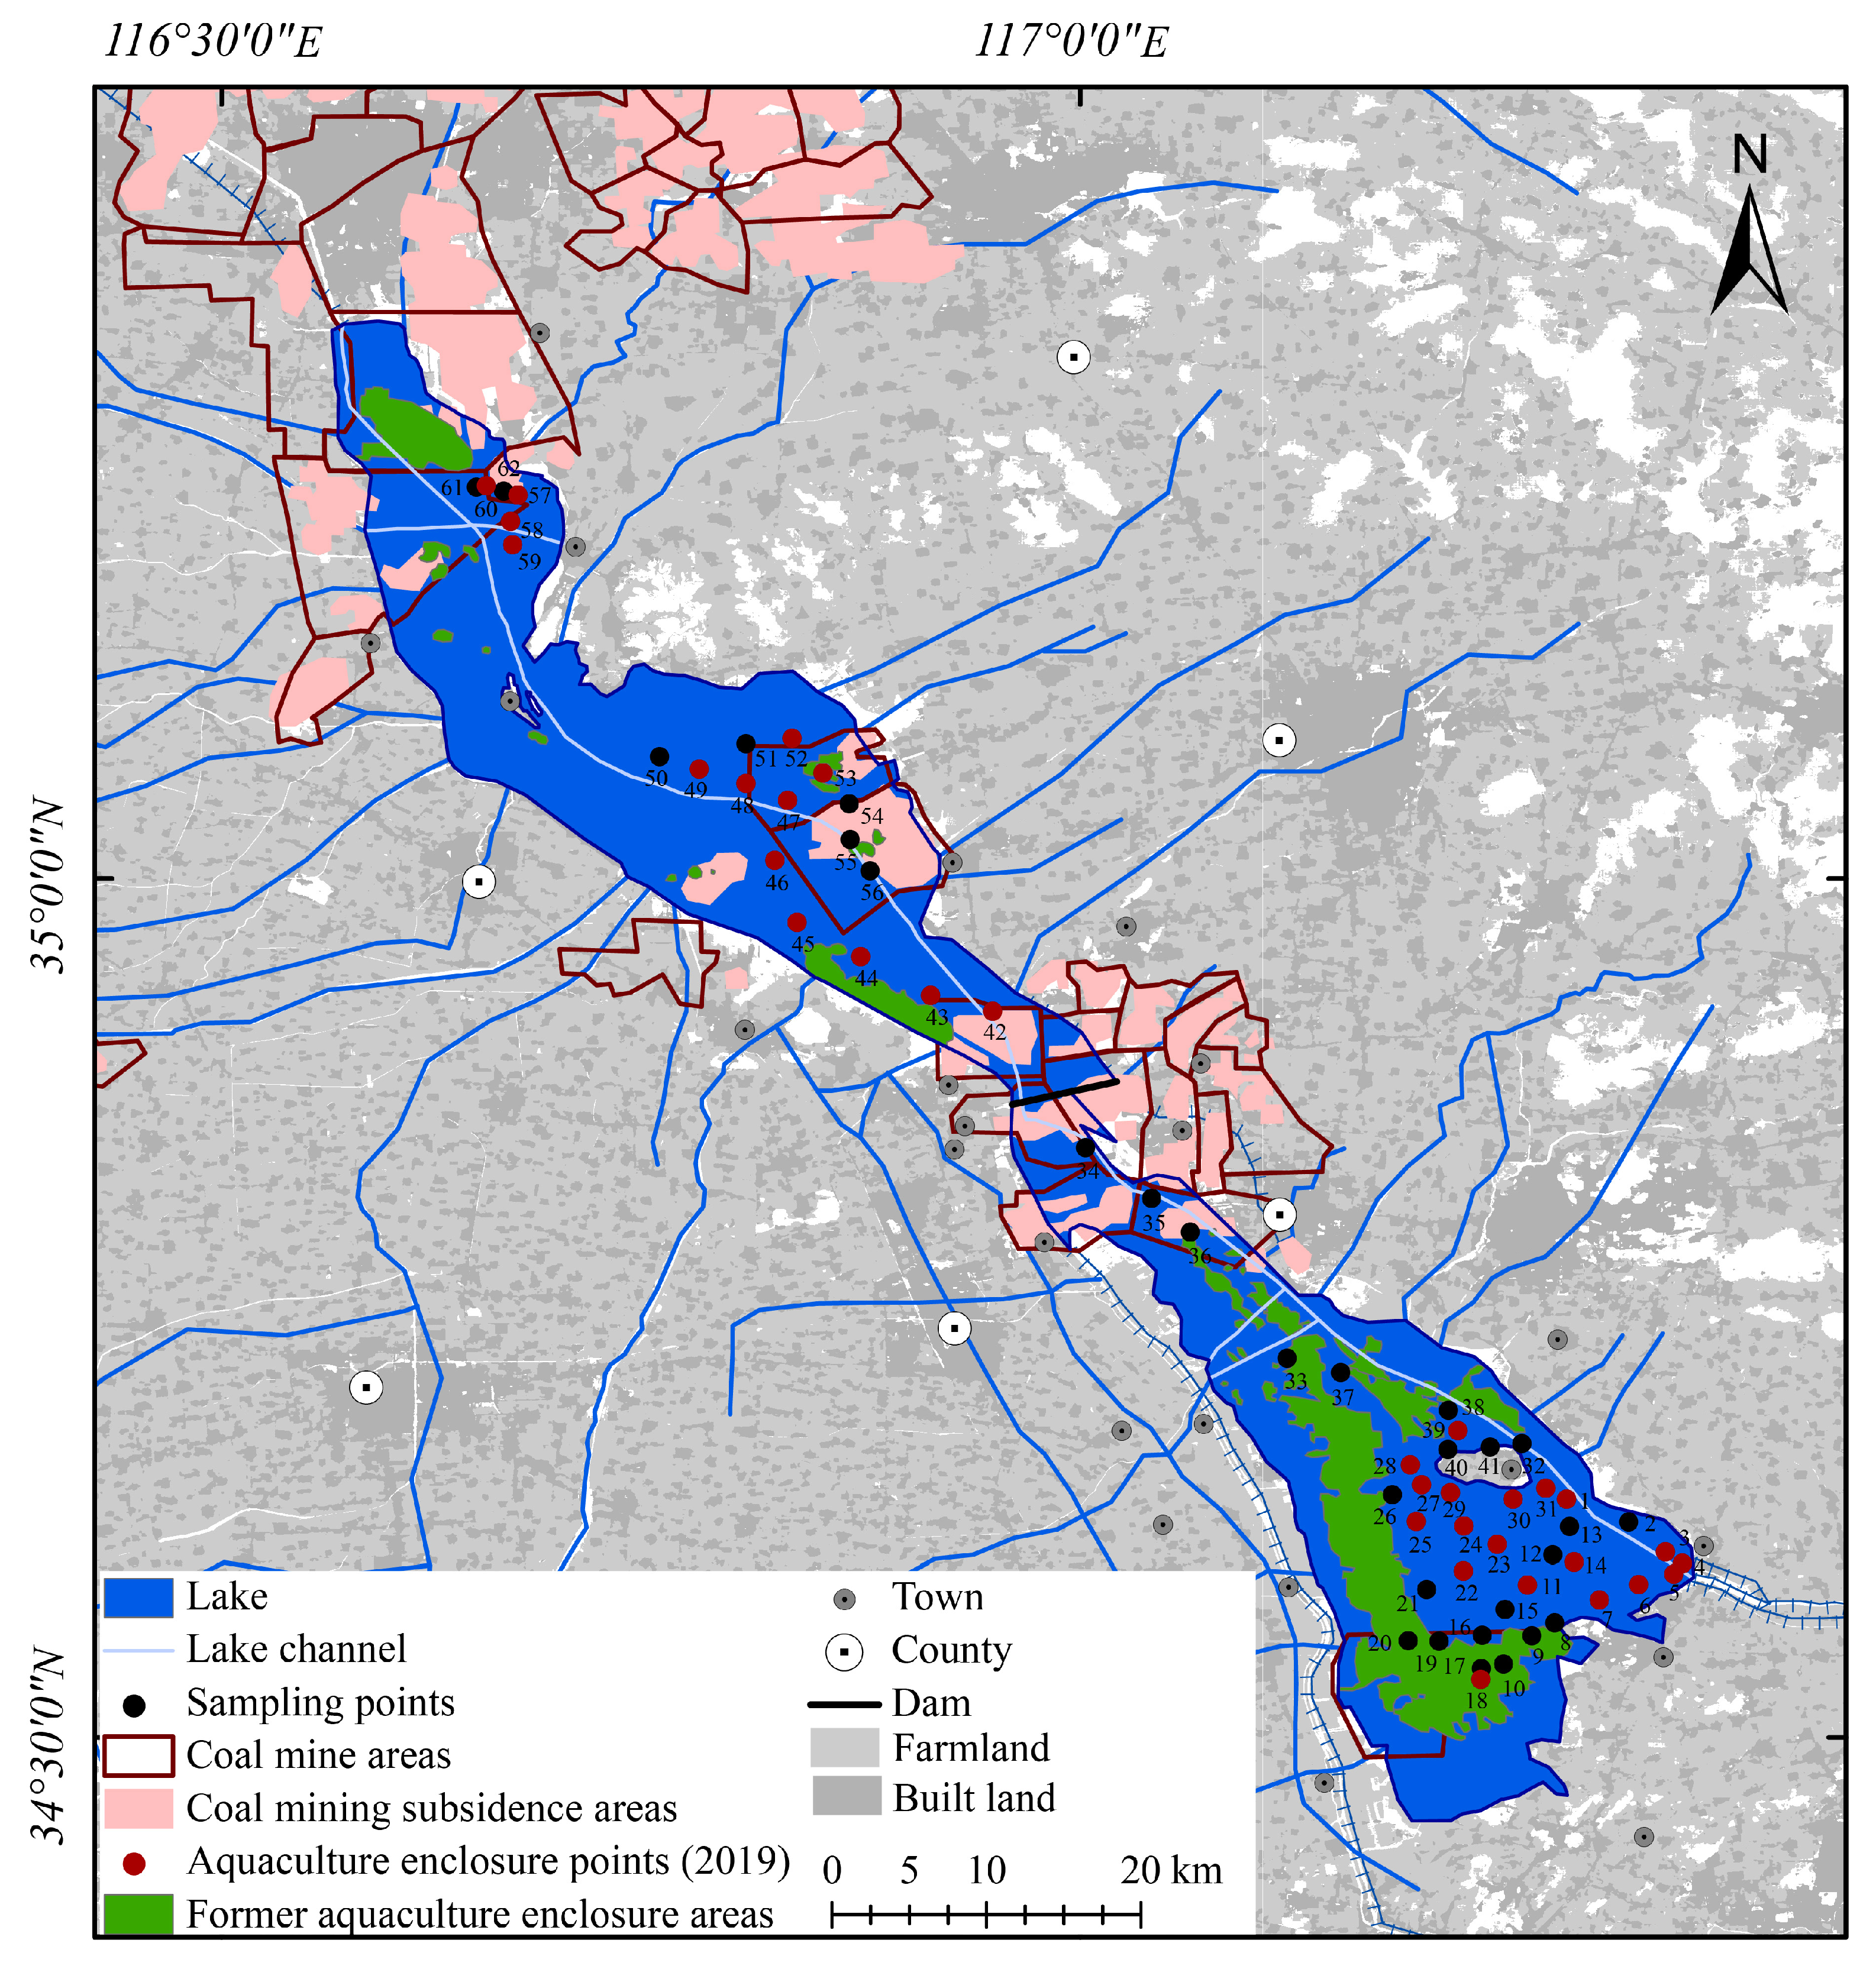
Considering the river-channel morphology with narrow water surfaces in the central part of the lake, combined with the distribution of surrounding environments, 62 sampling sites were established across the entire lake basin. Surface sediment samples (2 cm in thickness) were collected in October 2019 using a Kajak gravity corer (KC Denmark A/S, Silkeborg, Denmark) and sealed for preservation. According to Ding et al. [22], the sedimentation rate of Nansi Lake after the construction of the Erji Dam in 1960 reached 0.25 cm·a−1. Based on this, the 2 cm sediment core integrates ecological signals from 2011 to 2019. The diatom community is thus able to reflect the continuous pressure of human activities. Identification of surface-sediment diatom species was conducted at the Key Laboratory of Regional Sustainable Development System Analysis and Simulation (Jiangsu Normal University). All sampling sites were precisely positioned using a GPS system. The specific sampling locations are shown in Figure 2.

2.2. Diatom Processing, Identification, and Community Indices

2.2.1. Diatom Processing and Identification

Approximately 0.5 g of sediment sample was placed in a beaker. Hydrogen peroxide (30% H2O2) was added to remove organic matter. The sample was heated on a hot plate until no obvious bubbles were produced. Subsequently, 10% HCl was added to remove calcium salts and carbonates. After the reaction, distilled water was added. The sample was centrifuged at 2000 r/min for 10 min, and the supernatant was discarded. This washing procedure was repeated until the supernatant became neutral. The treated diatom suspension was brought to a fixed volume. An aliquot of 0.2 mL was pipetted onto a cover slip and air-dried. The cover slip was then mounted with Naphrax (Naphrax Ltd., Harrold, UK) and fixed by drying at 130 °C.
Diatom observation, identification, and counting were performed under a Leica light microscope (Leica Microsystems, Wetzlar, Germany) at 1000× magnification. At least 300 diatom valves were counted per sample. After reaching 300 individuals, nine additional fields of view were examined. If no new taxa appeared, counting was terminated. Otherwise, identification continued until the condition was met. Diatom taxonomic identification followed the European diatom classification system of Krammer and Lange-Bertalot and the Flora Algarum Sinicarum Aquae Dulcis.

2.2.2. Diversity Indices and Diatom Indices

The Shannon diversity index (H′) [23,24], Pielou’s evenness index (E) [25], Margalef’s richness index (D) [26], and Simpson’s diversity index (D′) [27] were calculated to evaluate diatom community diversity. The trophic state of the water body was assessed using TDI [28,29]. Although the TDI was originally developed for rivers [6], it has proven to be equally effective as a relative proxy indicator for discriminating anthropogenic-driven relative trophic gradients within shallow lakes [30].

2.3. Environmental Factors and Human Activity Variables

2.3.1. Measurement of Water Chemistry Variables

Water quality parameters were measured at each sampling site. These included water temperature (T), water depth (WD), Secchi depth (SD), dissolved oxygen (DO), pH, chlorophyll a (Chl.a), permanganate index (CODMn), total phosphorus (TP), total nitrogen (TN), ammonia nitrogen (NH3-N), nitrate nitrogen (NO3-N), nitrite nitrogen (NO2-N), dissolved organic carbon (DOC), phosphate (PO43−), and ions including SO42−, Ca2+, Cl, K+, Mg2+, Na+, N-NH4+, and NO3. Water depth, SD, T, pH, and DO were measured in situ using portable instruments. The remaining indicators were analyzed in the laboratory at Liaocheng University.
All analyses of water chemistry indicators strictly followed the Monitoring and Analytical Methods for Water and Wastewater (Fourth Edition, 2002) [31] issued by the State Environmental Protection Administration and relevant national standards. Chlorophyll a (Chl.a) was determined by spectrophotometry (HJ 897-2017) [32]. CODmn was determined by the acidic potassium permanganate method (GB 11892-1989) [33]. NH3-N was determined by Nessler’s reagent spectrophotometry (HJ 535-2009) [34]. NO2-N was determined by spectrophotometry (GB 7493-1987) [35]. NO3-N was determined by ultraviolet spectrophotometry (HJ/T 346-2007) [36]. TP was determined by ammonium molybdate spectrophotometry. The determination of major cations (Ca2+, K+, Mg2+, and Na+) in water was entrusted to the relevant laboratory at Liaocheng University. Following Section 3.2, Part IV of the Monitoring and Analytical Methods for Water and Wastewater (Fourth Edition), an Optima 2100 DV inductively coupled plasma optical emission spectrometer (PerkinElmer, Waltham, MA, USA) was used for analysis. The testing process strictly followed the standard operating procedures (SOP) of the professional laboratory. The instrument was operated under optimized standard radio frequency power and gas flow conditions. National standard reference materials were used for quality control. Anions (Cl and SO42−) were determined by ion chromatography.

2.3.2. Extraction and Quantification of Human Activity Variables

Human activity variables (Table 1) were extracted using ArcGIS 10.8 based on the geographic coordinates of each sampling site and multiple spatial datasets. In this study, human activity variables include both landscape and land-use indicators that directly characterize the intensity of anthropogenic disturbance, and composite geographic proxy indicators that reflect the gradient of human disturbance impacts. Some variables (e.g., proximity to lake inlet estuaries, proximity to the Erji Dam, and zoning south/north of the dam) are composite geographic proxy indicators related to human activity processes. These are used to characterize the influence gradients formed by river input, hydraulic regulation, and lake compartmentalization, rather than being direct measurements of the intensity of a specific human activity.
In defining spatial proxy variables of human activity, this study adopted a dual criterion to ensure ecological rationality: (1) The gradient is dominantly formed or significantly intensified by human activities. For example, the Erji Dam (a hydraulic engineering structure completed in 1960) completely disrupted the natural hydrological connectivity of the lake [41]. Lake inlet estuaries, due to their role in receiving agricultural fertilizers (contribution rate > 52%) and urban domestic sewage from the watershed [16], have become core transport pathways for nutrients and pollutants, with ecological effects far exceeding those of natural river input processes. (2) The variable characterizes the spatial attenuation pattern of persistent anthropogenic disturbance. For instance, the distance gradient from the dam or estuary directly reflects the spatial decline in the intensity of sluice–dam regulation disturbance and pollutant diffusion flux [14], rather than reflecting natural habitat differentiation such as water depth or substrate type. Although such variables are carried by natural geographic elements, their ecological stress nature originates from the spatial organization pattern of human activities. Based on this, the zoning south/north of the dam and proximity to lake inlet estuaries are all classified as Human-Mediated Spatial Gradients.
Distance-based variables were calculated as the minimum Euclidean distance between each sampling site and the corresponding disturbance feature in a standardized projected coordinate system, with all distances expressed in meters. A 500 m-radius buffer around each sampling site was used as the spatial unit for count-based variables, and the number of enclosure aquaculture sites recorded in 2019 within each buffer was counted to represent the intensity of local aquaculture activity. Area-proportion variables were derived through spatial overlay analysis. A circular buffer with a radius of 500 m was created around each sampling site, and the areas of mining sites, subsidence zones, historical enclosure aquaculture areas, farmland, and construction land within the buffer were quantified. The area proportion was calculated as follows:
P i = A i A b u f f e r
where Pi is the area proportion of a given land-cover type within the buffer of the ith sampling site, Ai is the area of that land-cover type within the buffer, and Abuffer is the total buffer area.

2.3.3. Variable Screening and Standardization

The extracted human activity variables were standardized using Z-score normalization prior to analysis to eliminate dimensional differences. Distance-based variables were reverse-standardized, while the remaining variables were forward-standardized. Spearman correlation analysis and the Variance Inflation Factor (VIF) test were first conducted on the candidate human activity variables to remove variables that could compromise the stability of parameter estimation and the reliability of variable interpretation (VIF > 5) [42,43]. The results showed that proximity to subsidence areas was highly correlated with proximity to mining areas (r = 0.937), and the VIF of the former was 14.05. Similarly, proximity to the nearest enclosure culture site (2019) was highly correlated with the number of enclosure culture sites within a 500 m buffer in 2019 (r = 0.938). Therefore, the variables “proximity to subsidence areas” and “number of enclosure culture sites within a 500 m buffer in 2019” were removed. The retained variables after screening were used for subsequent correlation analysis, Redundancy Analysis (RDA), and pRDA.

2.4. Data Analysis

2.4.1. Cluster Analysis

Hierarchical cluster analysis was conducted in SPSS 24.0 to categorize diatom assemblages based on species abundance data from 62 sample sites. The Bray–Curtis distance was employed to quantify dissimilarity among samples, resulting in the categorization of the samples into three diatom assemblage zones [44,45].

2.4.2. Correlation Analysis

Dominant diatom species were selected based on their presence at two or more sample sites and a relative abundance above 1%. Subsequently, Spearman rank correlation analysis was conducted in R 4.5.3 to investigate the associations between human activity factors and the Shannon–Wiener, Pielou, and Margalef diversity indices, TDI, and the abundance of dominant species. Before conducting group comparisons, normality was assessed using the Shapiro–Wilk test, and homogeneity of variance was examined using Levene’s test. For variables that met both normality and homogeneity of variance assumptions, one-way ANOVA was performed, followed by Tukey’s HSD post hoc test. For variables that did not meet these assumptions, the Kruskal–Wallis test was used, followed by pairwise comparisons with Bonferroni correction. To control the Type I error rate arising from multiple comparisons, all p-values obtained from Spearman correlation analyses were adjusted using the Benjamini–Hochberg method for false discovery rate (FDR) correction. An adjusted q-value < 0.05 was considered statistically significant.

2.4.3. Ordination Analysis

Prior to ordination analysis, diatom relative abundance data were Hellinger-transformed to reduce the influence of high-abundance taxa and make the data more suitable for linear methods [46]. Environmental variables (except pH) were log(x + 1)-transformed to improve normality. In the RDA preprocessing, redundant variables with VIF > 5 were removed. Significant explanatory factors were selected through forward selection and 999 Monte Carlo permutation tests (p < 0.05). Separate RDA models (Canoco5) were constructed for environmental variables and human activity variables to identify the main drivers influencing diatom community composition and spatial differentiation.
Ordination analysis was performed using CANOCO 5. Environmental and human activity variables were changed using log10(x + 1), while diatom data underwent square-root transformation. Detrended correspondence analysis (DCA) was initially employed to ascertain the type of gradient. Due to the gradient length of the first axis being less than 2, RDA was chosen. During RDA preprocessing, variables exhibiting multicollinearity with a VIF of 5 or greater were eliminated. Substantial explanatory variables were subsequently identified by forward selection in conjunction with 999 Monte Carlo permutation tests (p < 0.05). pRDA was employed to delineate the variance attributed to environmental factors and human activity variables, as well as to quantify their independent contributions to the variation in the diatom community.

2.4.4. Spatial Variable Construction, Variance Partitioning, and Residual Spatial Autocorrelation Test

Based on the planar coordinates of the 62 sampling sites, distance-based Moran’s eigenvector maps (dbMEM) were constructed in R 4.5.3 to characterize the spatial structure. Significant spatial variables were retained through forward selection and permutation tests, and a spatial RDA model was subsequently established. Variance partitioning and pRDA were further employed to evaluate the independent and shared contributions of environmental variables, human activity variables, and spatial variables to the variation in diatom communities, with adjusted R2 calculated. Meanwhile, Moran’s I test was performed on the residuals of the full-model RDA to determine whether significant spatial autocorrelation remained in the residuals.

3. Results

3.1. Distribution Characteristics of Environmental Factors in Nansi Lake

Analysis of environmental factors at 62 sampling sites in the surface waters of Lake Nansi revealed significant spatial variation in key parameters reflecting nutrient loading, organic pollution, and ionic composition (Figure S1). TP concentrations ranged from 0.06 to 0.22 mg/L (mean: 0.09 mg/L), with high values concentrated mainly in Nanyang Lake and the central narrow lake area. N-NH4+ concentrations ranged from 0.37 to 3.74 mg/L (mean: 0.86 mg/L), showing a pattern of higher values in the east and lower values in the west, with local extremes observed south of the Erji Dam and in the river mouth areas. CODMn was 1.81 mg/L, indicating relatively low overall organic pollution in the lake area, with high values distributed in localized aquaculture zones and nearshore areas. Regarding ionic composition, SO42− (mean: 123.46 mg/L) and Mg2+ (mean: 18.42 mg/L) both exhibited significant spatial heterogeneity, with high values concentrated in the Jie River inlet, along the Old Canal, and in the eastern river mouths. In addition, Chl.a concentrations ranged from 1.36 to 3.25 mg/m3, and the spatial distribution of high Chl.a values closely overlapped with the distribution patterns of nutrients (TP, N-NH4+).

3.2. Spatial Patterns of Surface Sediment Diatom Assemblages

3.2.1. Diatom Community Composition and Dominant Species

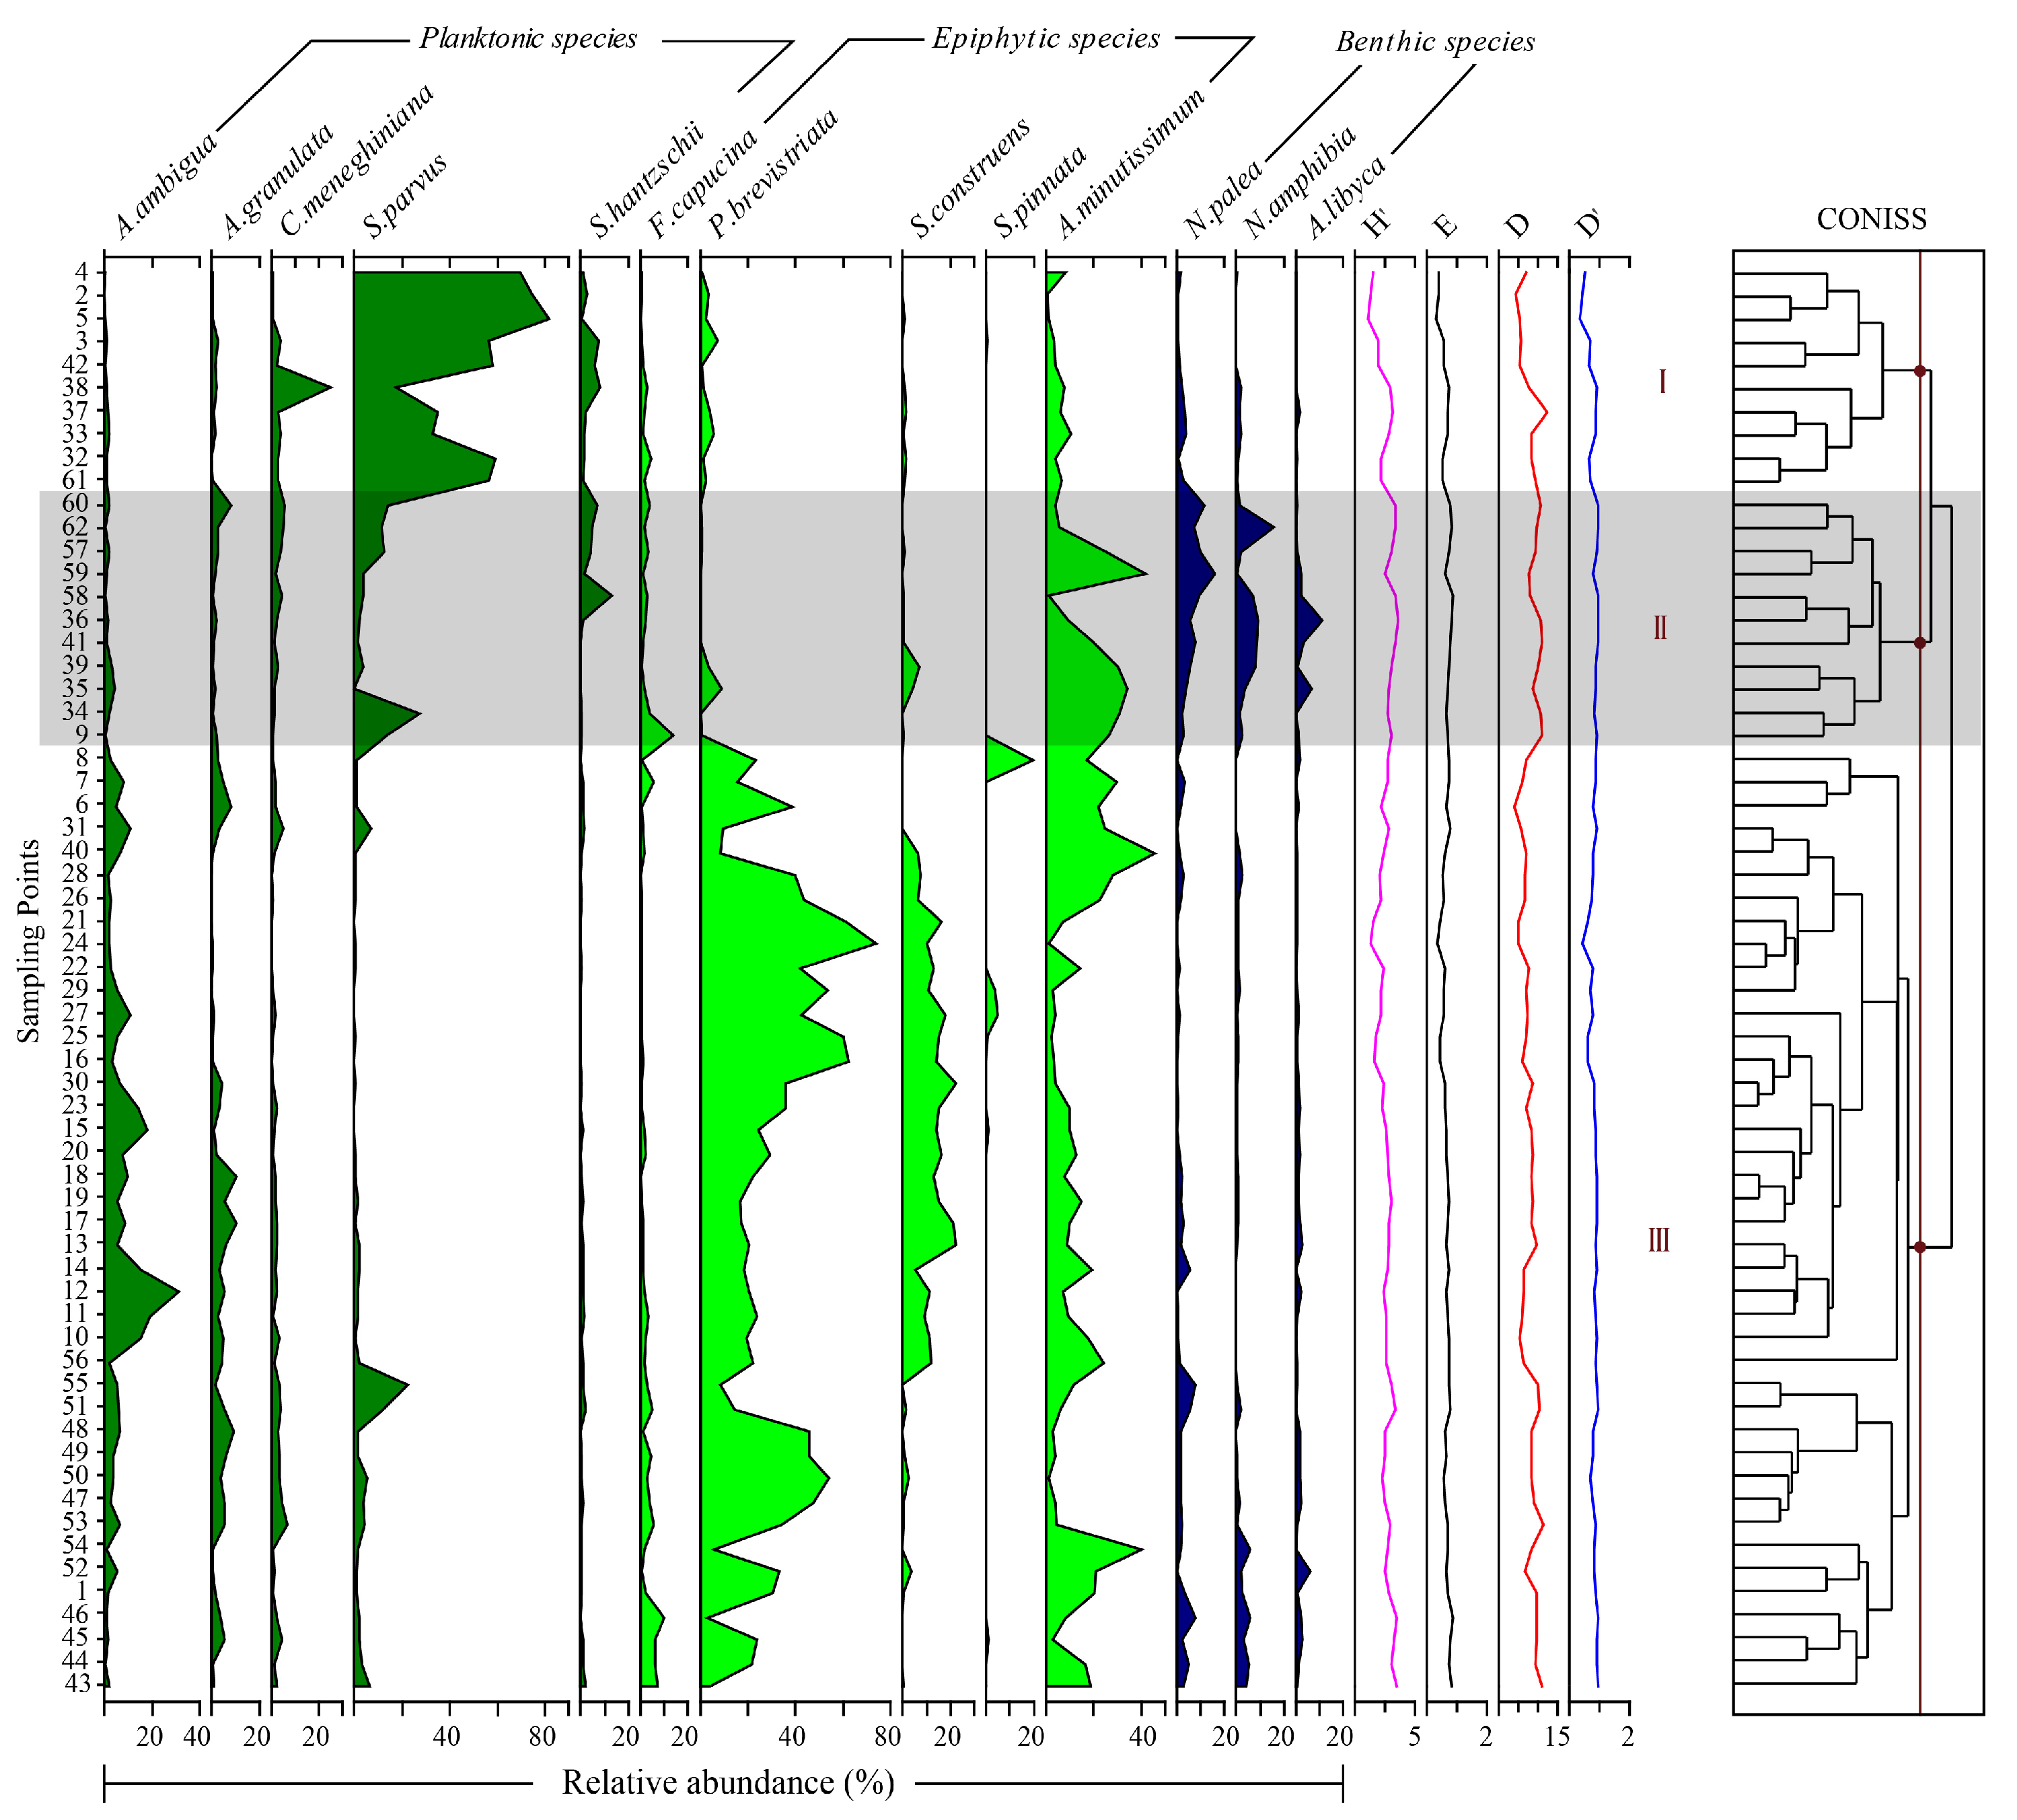
A total of 181 diatom species across 39 genera were identified from the surface sediments of 62 sampling locations in Nansi Lake. The predominant genera included Aulacoseira, Cyclotella, Stephanodiscus, Fragilaria, Achnanthes, Nitzschia, Amphora, Staurosira, and Pseudostaurosira (Figure 3). The predominant taxa were primarily epiphytic and planktonic species. Thirteen species exhibited relative abundances over 1%, with the most prevalent being Pseudostaurosira brevistriata (Grunow) Williams & Round (22.71%), Achnanthidium minutissimum (Kützing) Czarnecki (13.40%), Stephanodiscus parvus Stoermer & Håkansson (9.93%), Staurosira construens Ehrenberg (6.55%), and Aulacoseira ambigua (Grunow) Simonsen (5.01%).

3.2.2. Spatial Distribution Characteristics of Diatom Communities

Based on cluster analysis, the surface sediment diatom communities in Lake Nansi could be divided into three assemblage zones (Figure 3 and Figure 4). Assemblage Zone I was located in the eastern and central parts of the lake, with sampling sites adjacent to rivers, sluice gates, ferry crossings, and littoral zones, and some sites were near cage aquaculture areas, residential areas, and tourist areas. The dominant species was S. parvus. Assemblage Zone II was distributed in local western areas and northeastern nearshore waters of the lake, surrounded by rivers, the Erji Dam, ferry crossings, islands, lotus ponds, and tourist lands, with scattered distribution near cage aquaculture areas, ship mooring sites, sand mining pits, and residential areas. This zone had the highest overall diversity index of diatom communities, with the dominant species being A. minutissimum. Assemblage Zone III was the most widely distributed group, occupying the central lake area. Sampling sites were extensively scattered in cage aquaculture areas, littoral rivers, lotus ponds, and open lake surfaces, with some extending to the lake center, tourist areas, fish ponds, industrial and mining areas, and lakeside residential areas. The dominant species was P. brevistriata.
The results of the Shapiro–Wilk test and Levene’s test indicated that H′, E, and D met the assumptions of parametric tests, while D′ and TDI did not. Therefore, one-way ANOVA was used for H′, E, and D, and the Kruskal–Wallis test was used for D′ and TDI. Significant differences in diversity indices were observed among the three assemblage zones (Table 2). One-way ANOVA results showed that H′, E, and D differed significantly among the three zones: H′: F = 10.659, p < 0.001; E: F = 8.931, p < 0.001; D: F = 6.695, p = 0.002. Tukey’s post hoc test indicated that both H′ and E were significantly higher in Assemblage Zone II than in Zones III and I, and significantly higher in Zone III than in Zone I. For D, Zone II was significantly higher than Zones I and III, while the difference between Zone I and Zone III was not significant. Since D′ did not conform to a normal distribution, the Kruskal–Wallis test was used for comparison. The results showed that D′ also differed significantly among the three zones (H = 14.589, p = 0.001). Pairwise comparisons revealed that both Zone II and Zone III were significantly higher than Zone I, while the difference between Zone II and Zone III was not significant.

3.2.3. Spatial Variation in TDI and Trophic Status Assessment in Nansi Lake

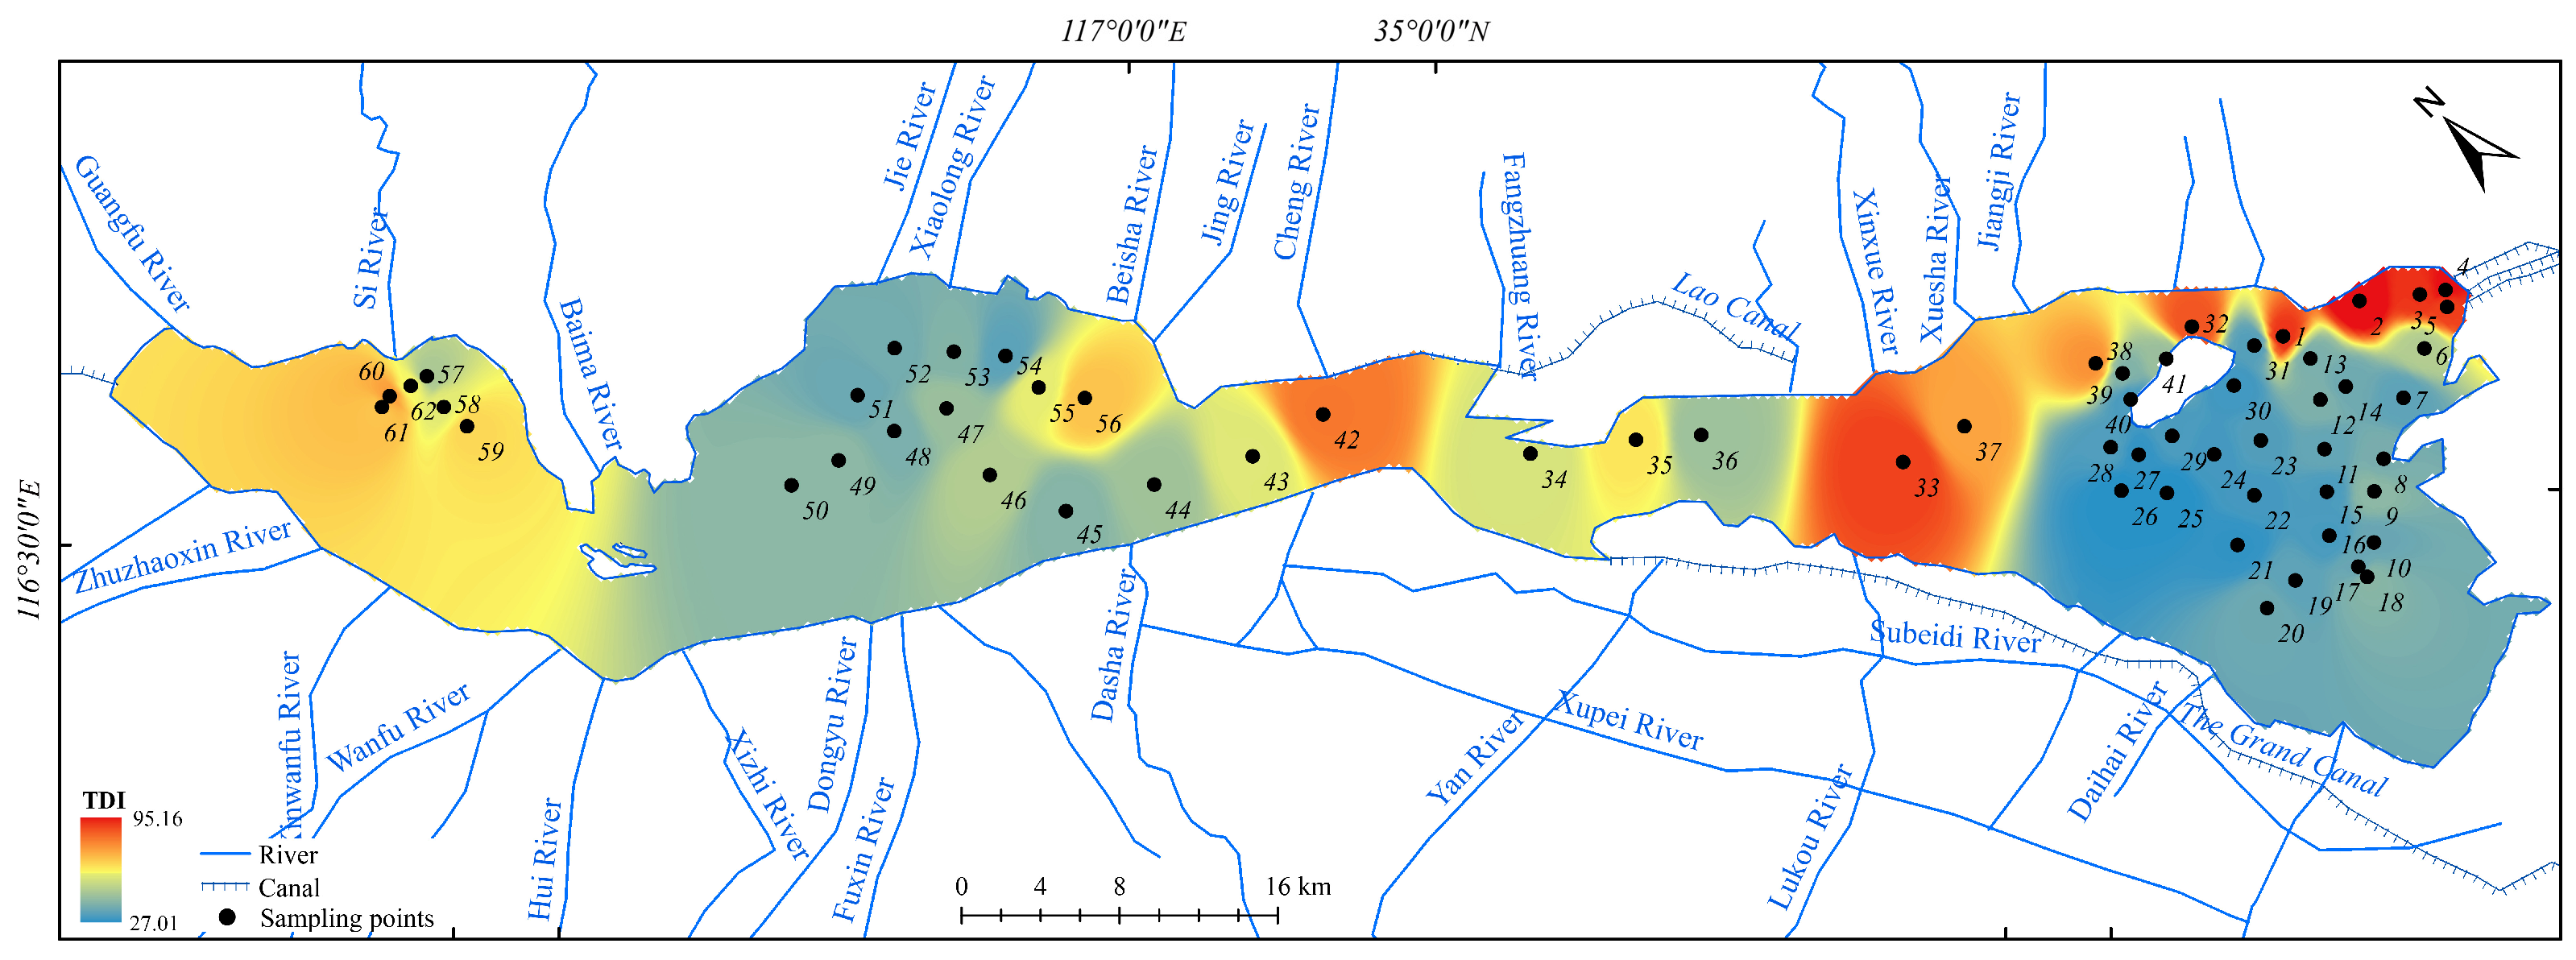
The TDI values in Lake Nansi ranged from 27.01 to 95.16, with a mean value of 47.94, indicating significant spatial variation in trophic status (Figure 5). High TDI values were concentrated in Assemblage Zone I, followed by Zone II, while Zone III exhibited the lowest values (Table 1). Since the TDI data did not conform to a normal distribution, the Kruskal–Wallis test followed by Bonferroni-corrected post hoc comparisons was employed. The results showed highly significant differences among the three zones. Pairwise comparisons indicated no statistically significant difference between Zone I and Zone II, while both Zone I and Zone II were significantly higher than Zone III. According to the TDI classification criteria, Assemblage Zone I was classified as eutrophic, whereas Zones II and III were classified as mesotrophic. Notably, Zone II was closer to Zone I, with localized areas exhibiting a transition toward eutrophic conditions.
Spearman correlation analysis indicated that TDI exhibited a significant positive connection with TP (r = 0.259, p = 0.042), NO3-N (r = 0.397, p = 0.001), NO2-N (r = 0.563, p < 0.001), SO42− (r = 0.405, p = 0.001), and Ca2+ (r = 0.485, p < 0.001). The results indicate that elevated TDI values in the lake correlated with fertilizer buildup and alterations in ionic composition. TDI shown sensitivity to fluctuations in the aquatic environment, making it appropriate for spatial evaluation of eutrophication in Nansi Lake.

3.3. Characteristics of Human Activities and Their Relationships with Diatom Community Metrics

3.3.1. Characteristics of Human Activities in the Nansi Lake Basin

Human activities in the Nansi Lake basin were varied and exhibited significant regional variation (Figure 2). The majority of human activities were focused near the lakefront, along river estuaries, along primary navigation routes, and in proximity to industrial and mining regions.
Enclosure aquaculture is widely distributed in the lake area. In 2019, enclosure aquaculture sites were mainly concentrated in the western part of Nanyang Lake, on both sides of the narrow waterway in the central lake area, and in the nearshore areas along the west and southwest coasts of Weishan Lake. Historical enclosure aquaculture areas were primarily distributed along the nearshore shallow water zones and the north–south lake basin, with relatively continuous distribution in the southern lake area and central transitional waters. Agricultural land and built-up land are mainly distributed on the plains surrounding the lake area, along the lakeside zone, and on both sides of the inflowing rivers. Nearshore residential activities are relatively concentrated in estuaries, bay areas, and areas adjacent to towns. Shipping disturbances are mainly distributed along the main navigation channels and rivers in the lake area, and are more pronounced in the narrow central lake section and the southern passage area. Coal mining areas and coal mining subsidence areas are mainly distributed in the western and southwestern parts of the lake area, as well as in localized areas near the lake, and exhibit certain spatial adjacency relationships with surrounding built-up land and river networks.

3.3.2. Correlations Between Human Activity Variables and Diatom Community Metrics

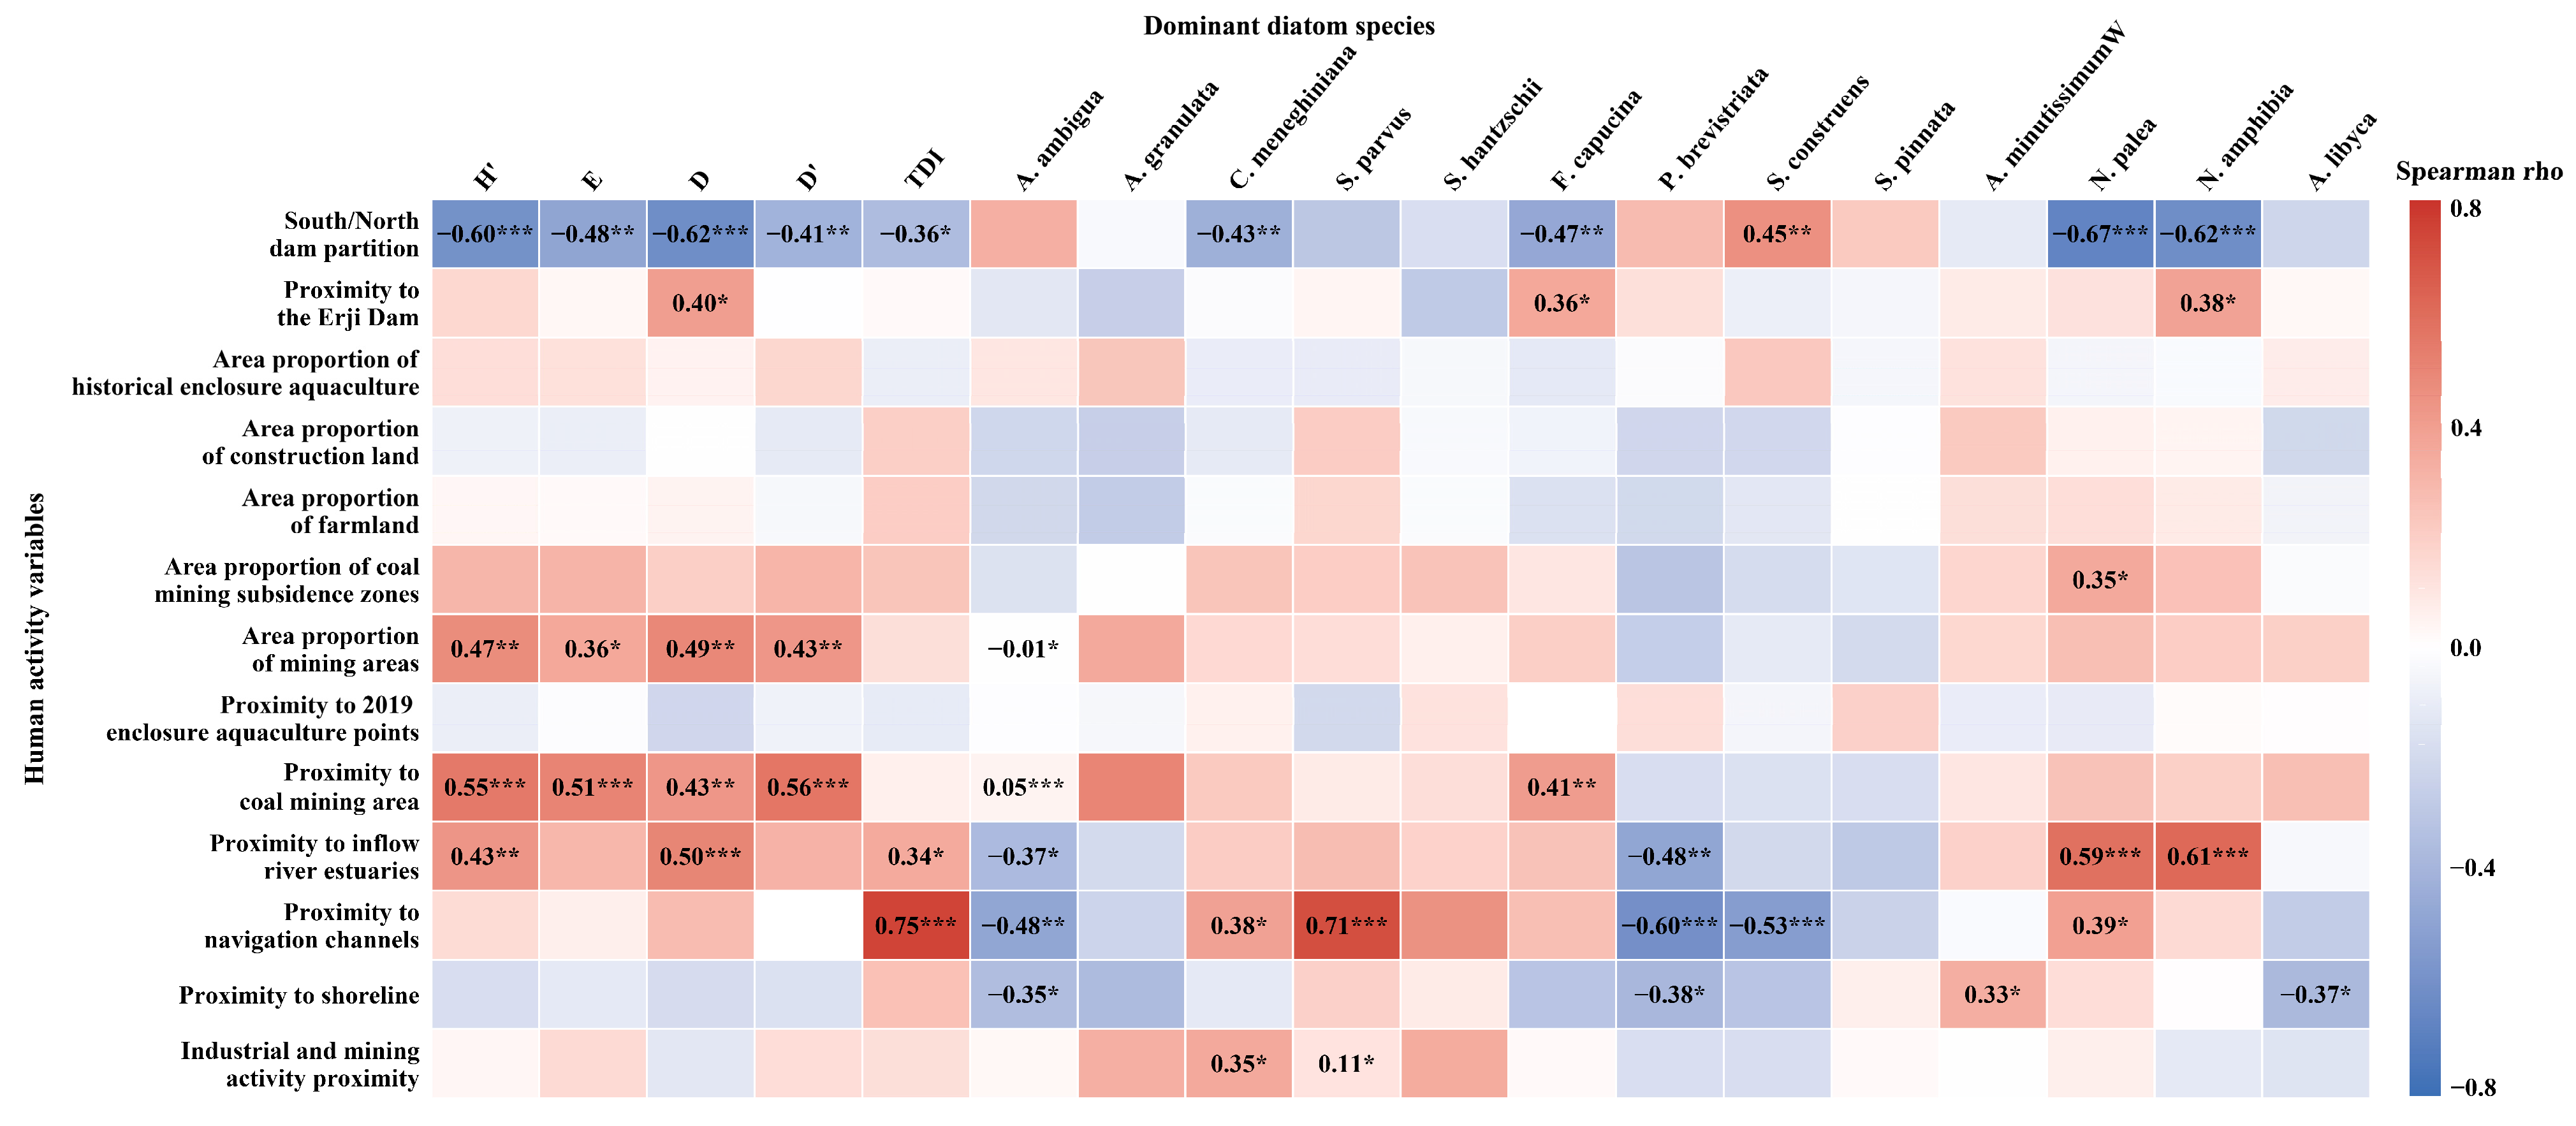
Spearman correlation analysis showed that, after FDR correction, several significant correlations remained between human activity variables and the characteristics of surface sediment diatom communities in Lake Nansi (Figure 6). Distance-based variables were inversely standardized, so larger values indicate higher proximity to the corresponding human activity factor.
At the level of diversity indices, the south/north dam zone was significantly negatively correlated with H′, E, D, D′, and TDI. The proportion of mining area was significantly positively correlated with H′, E, D, and D′. Proximity to mining areas was also significantly positively correlated with H′, E, D, and D′. In addition, proximity to inflowing river estuaries was significantly positively correlated with H′, D, and TDI, while proximity to the Erji Dam was significantly positively correlated only with D. No significant correlations were found between other human activity indicators and the diversity indices. Overall, dam-related spatial partitioning, mining activities, and riverine input processes were important factors influencing the diversity and trophic indicator characteristics of surface sediment diatom communities in Lake Nansi.
Few significant relationships were observed between TDI and human activity variables. TDI was significantly negatively correlated with the south/north dam partition, and significantly positively correlated with proximity to inflowing river estuaries and proximity to navigation channels. This indicates that areas closer to river estuaries and navigation channels tend to have higher diatom trophic status index values.
The responses of dominant species to human activity variables varied considerably (Figure 6). S. parvus was significantly positively correlated with navigation channel proximity and weakly positively with industrial/mining proximity. C. meneghiniana showed significant negative correlation with the south/north dam zone, and positive correlations with navigation channel and industrial/mining proximity. F. capucina was significantly negatively correlated with the dam zone, but positively with proximity to Erji Dam and mining areas. P. brevistriata was significantly negatively correlated with proximity to inflowing river estuaries, navigation channels, and shorelines. S. construens was positively correlated with the dam zone and negatively with navigation channel proximity. N. palea was negatively correlated with the dam zone, but positively with coal mining subsidence area proportion and proximity to river estuaries and navigation channels. N. amphibia also showed a negative correlation with the dam zone and positive correlations with Erji Dam and river estuary proximity. A. ambigua was weakly positively correlated with mining proximity, but significantly negatively with river estuary, navigation channel, and shoreline proximity. A. minutissimum was only positively correlated with shoreline proximity, while A. libyca was negatively correlated with it. These results indicate differentiated responses of dominant species to human-activity-driven spatial gradients.

3.4. Relative Contributions of Human Activities and Environmental Variables to Variation in Diatom Assemblages


DCA ordination results showed that the gradient lengths of the first four axes were 1.67, 1.31, 1.10, and 0.75 SD, all less than 2 SD. Therefore, RDA was used to analyze the relationships between diatom communities and environmental variables as well as human activity variables.
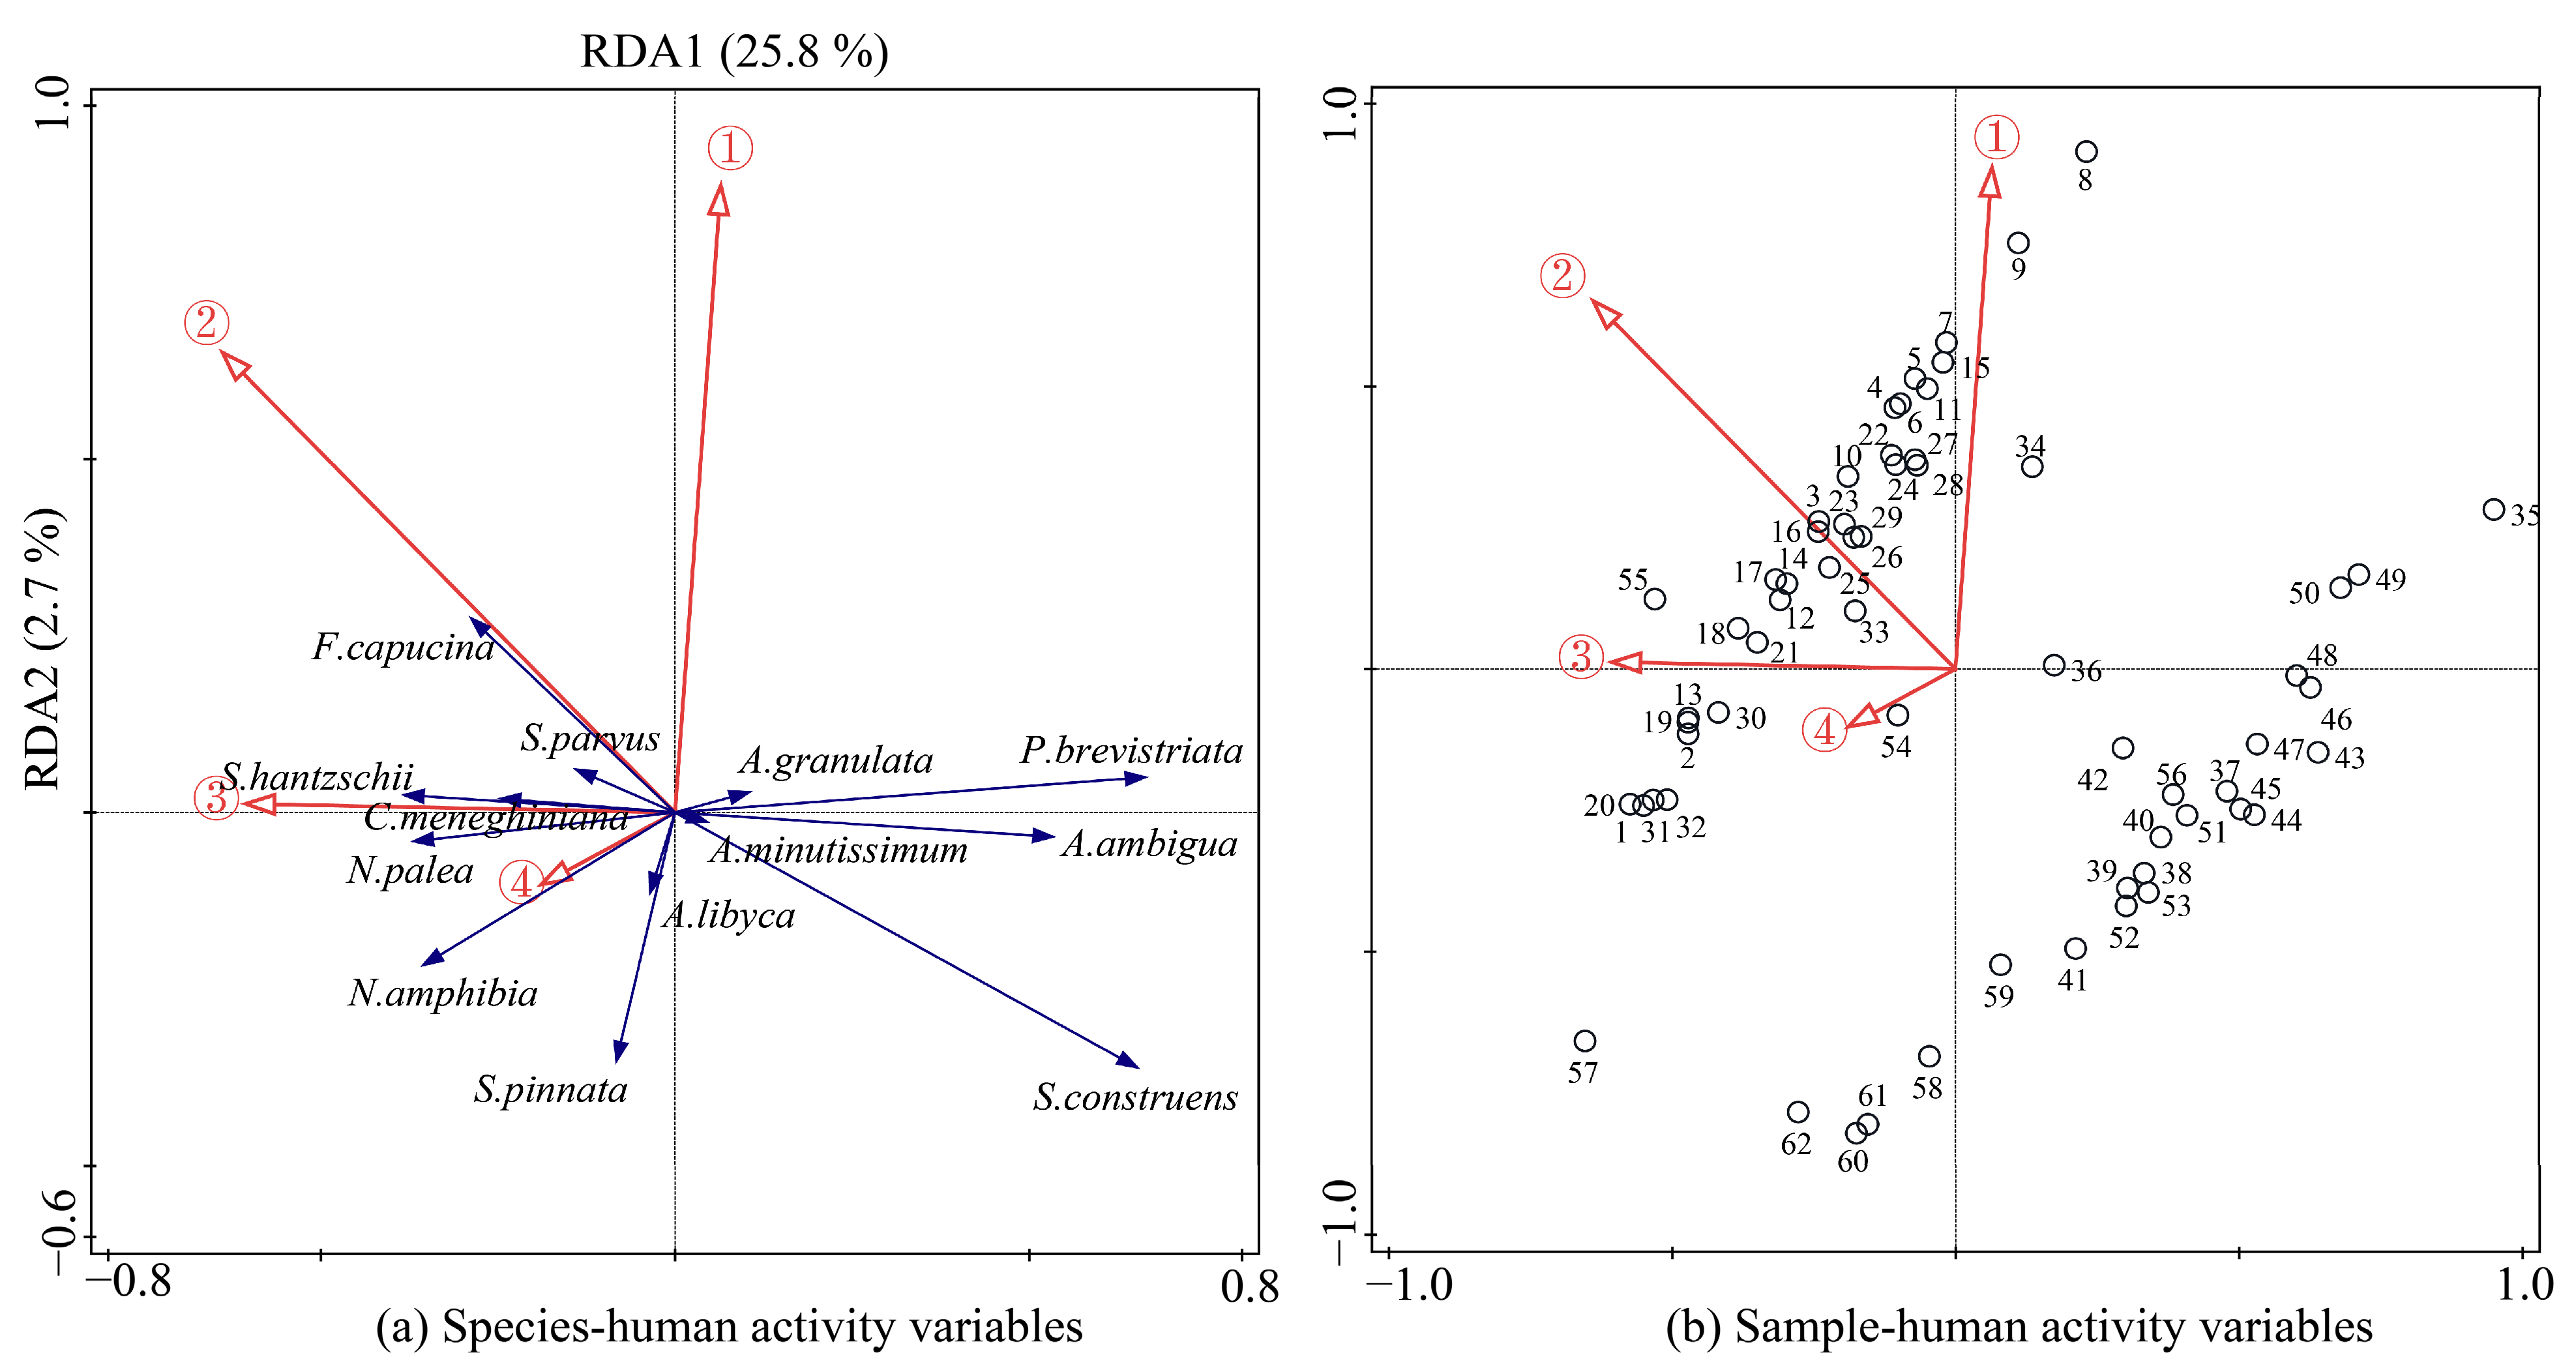
The RDA results for human activity variables showed that the eigenvalues of the first four axes were 0.2583, 0.0270, 0.0055, and 0.0030, respectively. The first two axes cumulatively explained 28.54% of the total species variation and 97.10% of the fitted variation. The species–environment correlation coefficients for the first two axes were 0.6916 and 0.4696, respectively. All human activity variables together explained 29.4% of the total community variation, with an adjusted explained rate of 24.4%. Forward selection identified four major variables: North–south dam partition, proximity to inflowing river estuaries, proximity to Erji Dam, and proportion of coal mining subsidence areas, with explained contributions of 11.7%, 6.9%, 5.6%, and 5.1%, respectively, and corresponding pseudo-F values of 8.0, 5.0, 4.3, and 4.2 (all p < 0.05). The ordination diagram (Figure 7) showed that S. hantzschii, C. meneghiniana, and N. palea were strongly associated with the North–south dam partition and the gradient of proximity to inflowing river estuaries. N. amphibia and S. pinnata were more closely related to proximity to Erji Dam, while P. brevistriata, A. ambigua, and S. construens exhibited certain correspondence with the lake zoning pattern and coal mining subsidence disturbances.
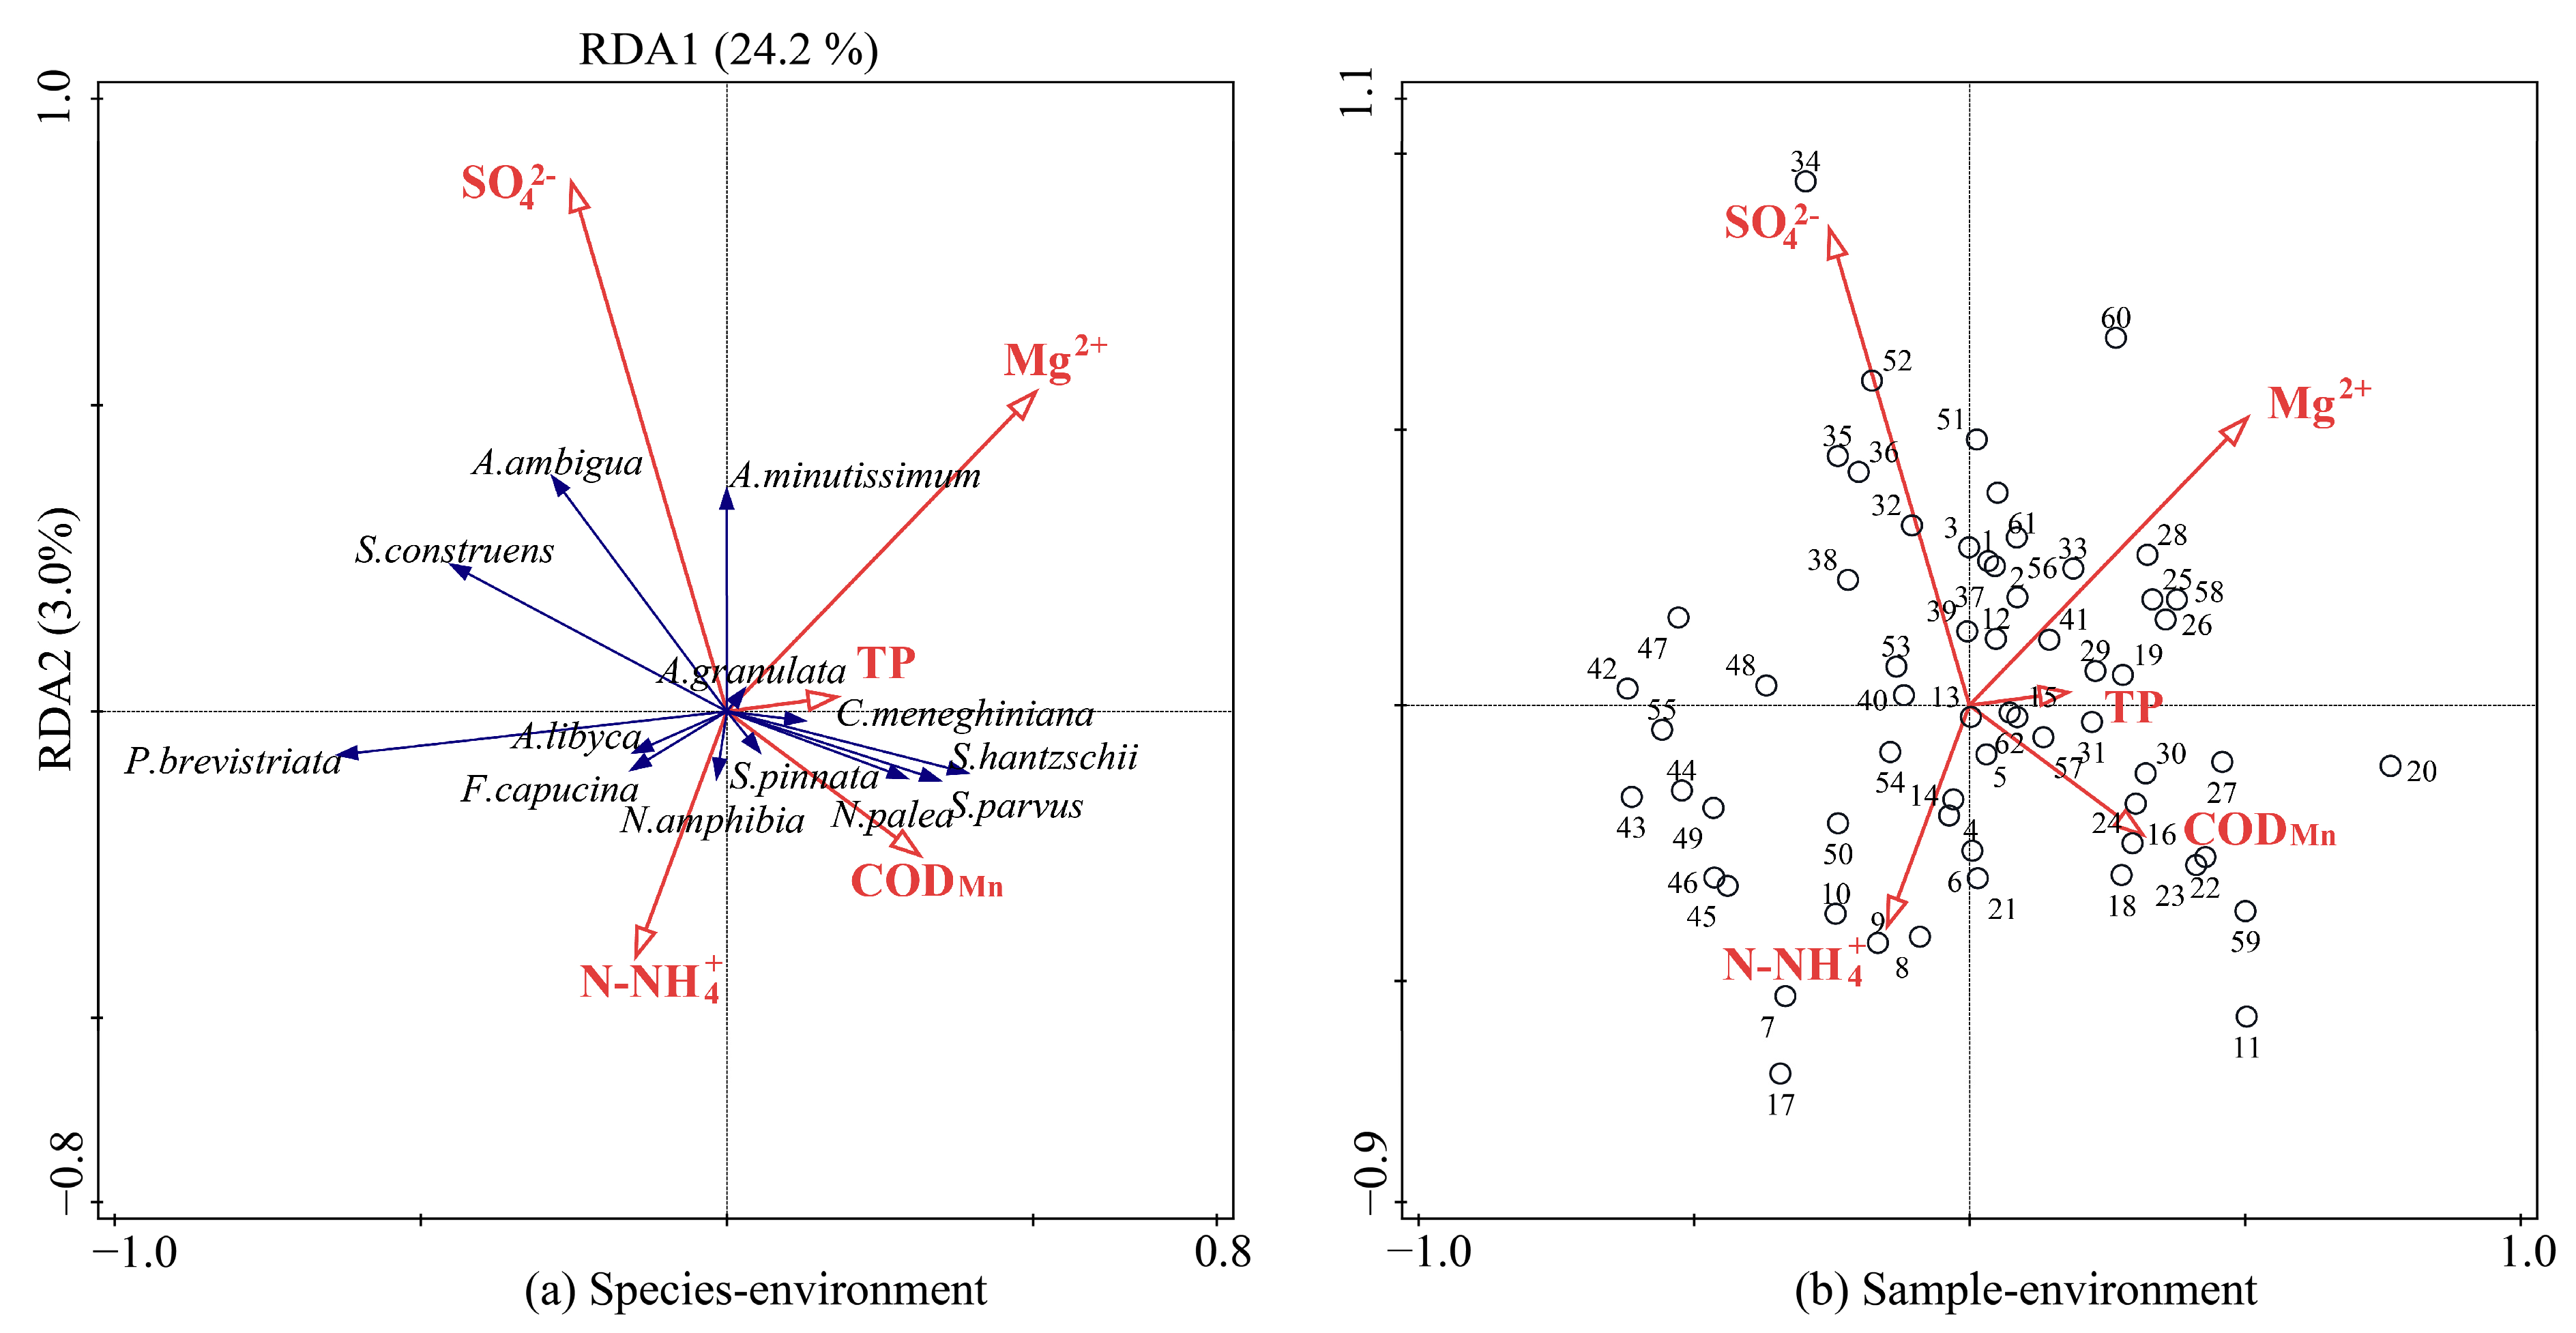
The RDA results for environmental variables showed that the eigenvalues of the first four axes were 0.2420, 0.0303, 0.0240, and 0.0032, respectively. The first two axes cumulatively explained 27.23% of the total species variation and 90.56% of the fitted variation. The species–environment correlation coefficients for the first two axes were 0.6426 and 0.4490, respectively. After VIF screening and forward selection, a total of five significant environmental factors were retained: Mg2+, SO42−, CODMn, N-NH4+, and TP (p < 0.05), with individual explained contributions of 7.4%, 7.3%, 7.1%, 3.8%, and 4.5%, respectively. Among them, S. parvus and N. palea were positively correlated with TP, CODMn, and N-NH4+; A. minutissimum was closely related to Mg2+ and SO42−; while P. brevistriata, S. construens, and A. ambigua were located in the center of the ordination diagram (Figure 8), indicating a broad ecological tolerance. These results suggest that diatom community differentiation is jointly driven by water chemistry background, nutrient levels, and organic pollution.
Based on the planar coordinates of sampling sites, nine dbMEM spatial variables were constructed. After forward selection, MEM1 and MEM3 were retained in the final constrained spatial model. Among them, MEM1 exhibited the strongest explanatory power for diatom community composition, accounting for 9.3% of the total variation and reaching a significant level (p = 0.002). MEM3 further explained 4.2% of the variation, showing marginal significance (p = 0.054). The RDA model constrained by MEM1 and MEM3 was overall significant (pseudo-F = 4.6, p = 0.004), with a total explained rate of 13.5% and an adjusted explained rate of 10.6%. These results indicate that a detectable spatial structure exists in the surface sedimentary diatom communities of Nansi Lake, and different species exhibit distinct differentiation along spatial gradients.
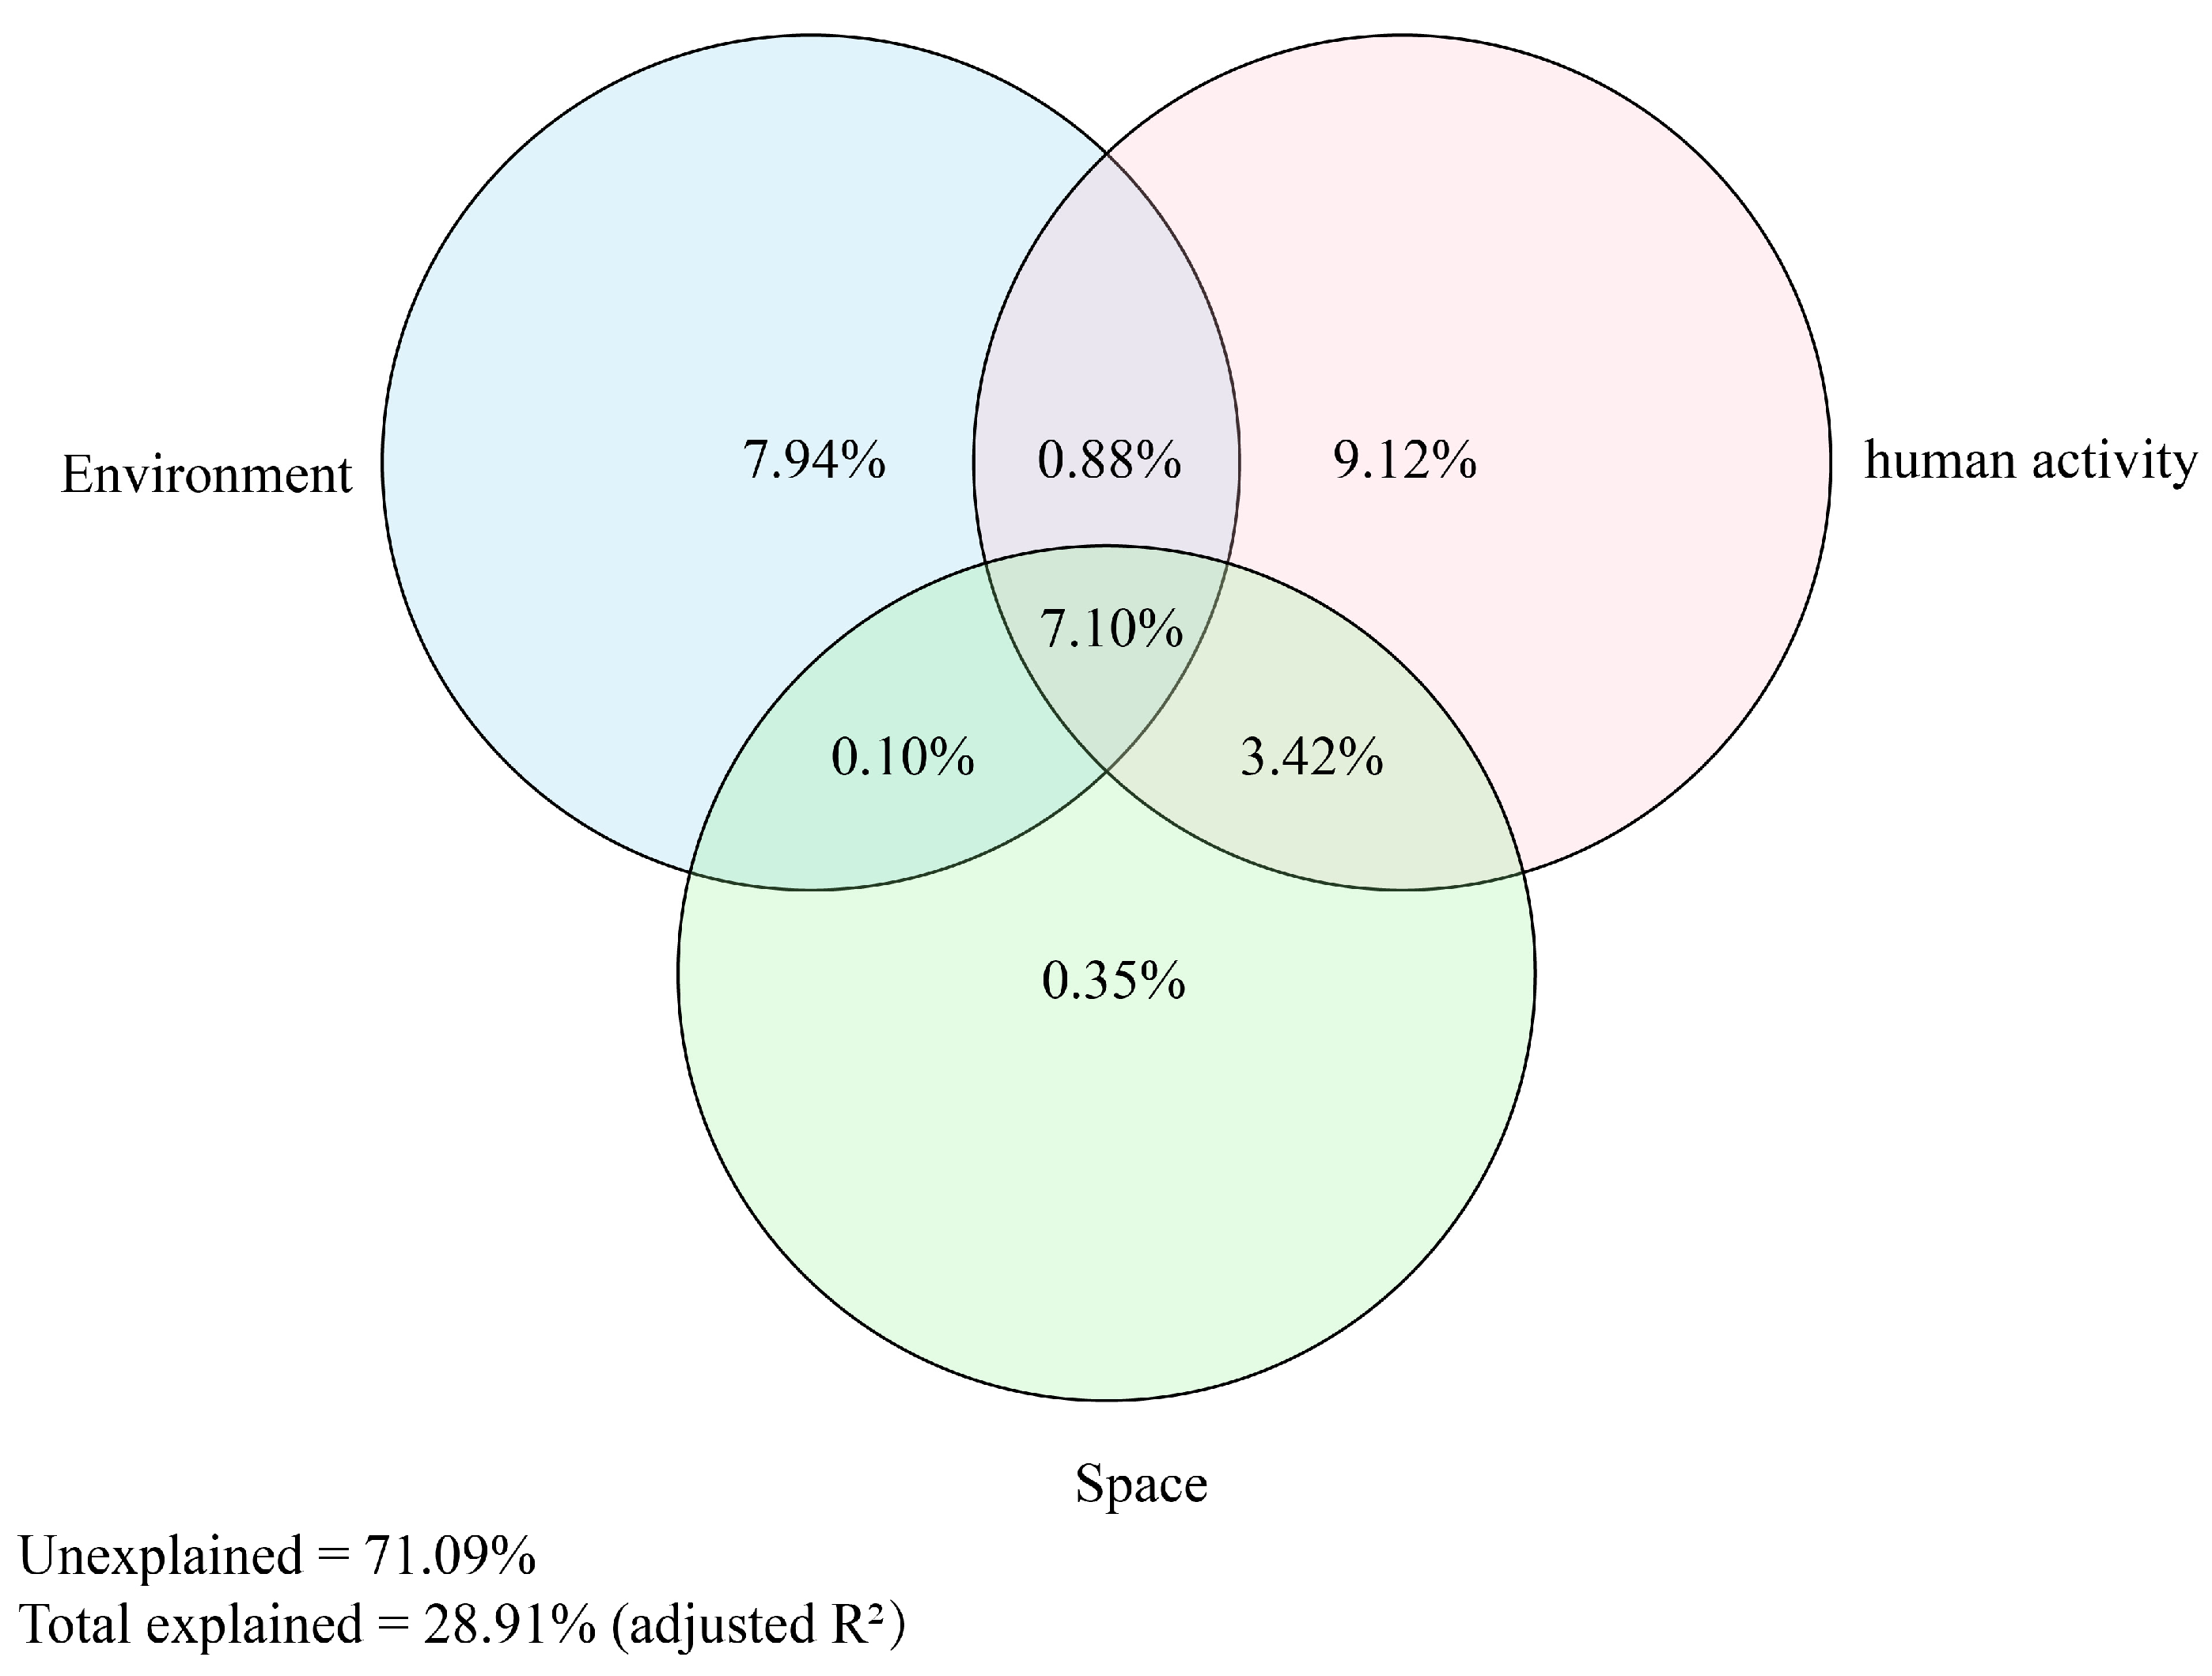
However, the variance partitioning results (Figure 9) further showed that environmental variables, human activity variables, and spatial variables together explained 28.91% (adjusted R2) of the total variation in the surface diatom communities of Nansi Lake, with the remaining 71.09% left unexplained. Among the pure effects of the three groups, human activity variables had the highest independent explanatory contribution at 9.12%, followed by environmental variables at 7.94%, and spatial variables at the lowest, only 0.35%. In addition, the shared explained rate between environmental and human activity variables was 0.88%, between human activity and spatial variables was 3.42%, and between environmental and spatial variables was 0.10%, while the three groups together contributed a shared explained rate of 7.10%.
Figure 9. Variation partitioning of diatom assemblage variation explained by environmental, human activity, and spatial variables in surface sediments of Nansi Lake. Values in the Venn diagram indicate unique and shared fractions of explained variation (%) based on adjusted R2. Pure fractions were 7.94% for environment, 9.12% for anthropogenic variables, and 0.35% for space. Shared fractions were 0.88% for environment × anthropogenic, 3.42% for anthropogenic × space, 0.10% for environment × space, and 7.10% for the overlap among all three components. The unexplained fraction was 71.09%. Further partial RDA significance tests (Table 3) showed that, after controlling for the other two groups of variables, the pure effect of environmental variables was significant (F = 2.229, p = 0.007), the pure effect of human activity variables was highly significant (F = 2.731, p = 0.001), while the pure effect of spatial variables was not significant (F = 1.127, p = 0.333). This suggests that although the dbMEM spatial variables can identify spatial structures in diatom community composition, such spatial structures are primarily coupled with environmental heterogeneity and patterns of human activities, with only a weak independent pure spatial contribution.
Water 18 01705 g009
Table 3. Significance tests of pure environmental, human activity, and spatial fractions based on partial RDA.
EffectDfVarianceF-Valuep-ValueR2Adjusted R2
Pure environmental effect50.04112.2290.0070.12990.0794
Pure human activity effect40.04032.7310.0010.12730.0912
Pure spatial effect20.00831.1270.3330.02630.0035
Notes: The pure environmental effect was tested after controlling for human activity and spatial variables; the pure human activity effect was tested after controlling for environmental and spatial variables; the pure spatial effect was tested after controlling for environmental and human activity variables. p values were obtained by permutation tests.
Based on the screened environmental variables, human activity variables, and spatial variables, a full-model RDA was established. The results showed that the model significantly explained the variation in diatom community composition (F = 3.255, p = 0.001). Further Moran’s I tests on the full-model residuals (Table 4) showed that the Moran’s I values for the first and second axes of the residual PCA were 0.009 and −0.070, respectively, with parametric test p values of 0.376 and 0.745, and permutation test p values of 0.350 and 0.727, none of which reached a significant level (p > 0.05). This indicates that after incorporating environmental, human activity, and spatial variables, no significant spatial autocorrelation remained in the model residuals, suggesting that the final model has adequately captured the spatial structure present in the community data.

4. Discussion

4.1. Spatial Differentiation of Surface-Sediment Diatom Communities in Nansi Lake and Their Ecological Implications

The surface sedimentary diatom communities of Nansi Lake exhibited significant spatial differentiation, forming three assemblage zones that were highly aligned with environmental gradients. Assemblage Zone I was dominated by the eutrophic indicator species S. parvus, mostly distributed in areas such as river mouths and sluice gates that are subject to strong exogenous inputs and compound disturbances. This zone showed the lowest community diversity and the highest TDI, reflecting habitat characteristics of high nutrient levels and strong stress. Assemblage Zone II was dominated by A. minutissimum, distributed in areas with relatively stable local environmental conditions, and exhibited the highest community diversity, indicating relatively favorable water ecological conditions. A. minutissimum has a broad ecological amplitude and can occur in various lake and river environments [47,48]. Therefore, in this study, it is more appropriately considered a relative indicator taxon for locally better ecological conditions in Nansi Lake. Assemblage Zone III was represented by the widespread species P. brevistriata, occupying the main lake area, and reflected transitional community characteristics shaped by the combined effects of wind-wave disturbance and sediment resuspension under mesotrophic conditions in shallow lakes [49].
The ecological habits of the dominant species, along with the spatial patterns of diversity indices and the TDI, were highly consistent, collectively confirming that surface sedimentary diatoms can serve as sensitive bioindicators to effectively identify environmental heterogeneity within Nansi Lake. Notably, the TDI showed significant positive correlations with nutrients such as TP and NO2-N, as well as with ions including Ca2+ and SO42−, indicating that the diatom communities of Nansi Lake not only respond to conventional eutrophication processes but are also profoundly influenced by changes in water ionic composition.

4.2. Driving Mechanisms of Human Activity–Related Spatial Gradients on the Spatial Differentiation of Diatom Communities

4.2.1. Distinguishing Human Activity–Related Spatial Proxy Variables from Natural Hydrological Gradients

Although spatial proxy variables such as proximity to lake–inflow river confluences and the secondary dam–related gradient are constructed based on the natural hydrological configuration of rivers and lakes and thus usually carry a certain natural background signal, the results of multi-source observational data and statistical analyses indicate that their variation characteristics are largely controlled by long-term anthropogenic modification processes.
Taking the secondary dam partition (independent explanation rate: 11.7%) as an example, as a typical artificial hydraulic structure, its completion in 1960 substantially altered the original natural connectivity system of the lake. Existing observations have shown that the nutrient retention time in the north-dam area is approximately 3.2 times longer than that in the south-dam area, gradually leading to the formation of regional eutrophic habitats. The average abundance of S. parvus at sampling sites north of the dam was significantly higher, suggesting that the community differentiation in this area is more likely driven by material retention differences caused by artificial regulation rather than solely by natural lake basin water depth or lake current gradients. Proximity to lake–inflow river confluences (independent explanation rate: 6.9%) primarily characterizes the transport gradient of exogenous pollution from the watershed. Monitoring of major inflowing rivers such as the Zhuzhaoxin River and Wanfu River indicates that agricultural non-point sources and rural domestic pollution together account for 68–72% of the total TN and TP loads [4], while the contribution of natural background nutrient inputs is relatively limited. Furthermore, the TDI showed a significant positive correlation with proximity to river confluences (r = 0.48, p < 0.01), providing indirect evidence that this gradient has the potential to serve as a spatial tracer for exogenous anthropogenic pollution. Proximity to the secondary dam (independent explanation rate: 5.6%) mainly reflects the artificial hydrodynamic disturbance caused by the operation of sluice gates and the dam. Frequent water level fluctuations associated with the operation of navigation locks (an average of 4.2 openings per day) readily induce sediment resuspension, resulting in an average suspended solid concentration within a 500 m radius around the dam that is 3.1 times higher than the background value in the open lake area. This disturbance intensity typically exceeds the influence of conventional natural wind–wave actions in the lake area.
The results of pRDA showed that, after controlling for spatial covariates such as natural water chemistry and topography, human activity variables still exhibited a significant independent explanatory capacity (9.12%, p = 0.001). This indicates that the explanatory contributions of the three types of spatial proxy variables mentioned above to diatom communities can be, to a certain extent, separated from the natural hydrological background. Nevertheless, background factors such as natural runoff and lake basin substrate may still introduce confounding interference in practice. Future studies could consider introducing methods such as structural equation modeling to further control for natural covariates, thereby more accurately quantifying the direct driving pathways of each human activity factor.

4.2.2. Spatiotemporal Coupling Effects of Persistent Human Activity Disturbances and Sedimentary Records

The spatial zonation pattern of diatoms identified in this study largely reflects the combined effects of long-term sedimentary ecological memory and sustained anthropogenic stress.
It is known that the surface sedimentation rate in the main lake area of Nansi Lake is approximately 0.25 cm·yr−1 [22]. Therefore, the 0–2 cm surface sediment layer roughly preserves diatom frustules that have been continuously deposited over the past several years. This community composition comprehensively reflects the long-term spatial gradients of nutrients and ions in the lake, while short-term seasonal fluctuation signals have been smoothed to some extent during the sedimentation process. For example, the spatial feature of high S. parvus abundance aggregation in Assemblage Zone I may be associated with the full operation of the Eastern Route of the South-to-North Water Diversion Project in 2013. After the water diversion, the annual average nitrogen and phosphorus fluxes in the lake area increased by 42.7% [14], suggesting that surface sedimentary diatoms are capable of recording, to some extent, the restructuring of nutrient patterns induced by interannual artificial water transfers.
Moreover, the various core human activity variables selected in this study all possess long-term disturbance attributes. The secondary dam, which has been in operation for over 60 years, constitutes an important basis for the macro-habitat differentiation within the lake area. The proportion of coal mining subsidence areas, meanwhile, characterizes the cumulative modification of substrate physicochemical conditions resulting from mining development over the past two decades. The high significance of human activity variables in the pRDA results (p = 0.001) indicates that the ecological imprints from anthropogenic engineering and resource exploitation have surpassed short-term seasonal fluctuations and have become stable factors regulating the spatial pattern of diatoms. The temporal integration characteristics of sedimentary archives, coupled with the long-term persistence of anthropogenic disturbance gradients, exhibit a good spatiotemporal coupling, which also provides theoretical support for identifying stable spatial patterns through single sampling campaigns. Future studies could incorporate 210Pb sediment dating methods to resolve and analyze the relative contributions of human activities to diatom communities across different historical periods.
Overall, the three anthropogenic gradients—dam partition, river confluence proximity, and mining subsidence—exhibited differentiated driving effects on the diatom communities. Connectivity differences caused by dam barrier effects are a key factor influencing the macro-scale differentiation of diatoms throughout the lake. Lake–inflow river confluences dominate the community succession driven by nearshore exogenous pollution. Mining subsidence, by altering local substrate conditions, has shaped special diatom habitats. Although enclosure aquaculture and shipping disturbances were not included in the final core constraint model, the localized nutrient inputs and sediment resuspension they cause may further amplify the community differences created by macro-scale gradients at smaller spatial scales.

4.2.3. Synergistic Driving Pathways of Diatom Community Differentiation by Human Activities and Environmental Factors

The results of RDA and pRDA collectively indicate that various human activities may shape the spatial differentiation of diatom communities through multiple pathways—including nutrient enrichment, organic pollution, artificial hydrodynamic regulation, and alterations in water ionic composition—which are coupled with environmental factors.
In addition to conventional nutrient and organic pollution indicators such as TP and CODMn, the combined explanatory power of Mg2+ and SO42− for diatom community differentiation reached 14.7%, suggesting an important regulatory role of freshwater ion enrichment induced by human activities on benthic algae in the lake area—a process that has been relatively overlooked in previous studies of shallow regulated lakes. Measured data from this study showed that ion concentrations in locally disturbed waters (e.g., around coal mining subsidence areas) exhibited pronounced fluctuations. For instance, the highest concentrations of SO42− and Mg2+ reached 185.57 mg/L and 24.34 mg/L, respectively, significantly exceeding the whole-lake average background values of 123.46 mg/L and 18.42 mg/L. The relatively high explanatory power of Mg2+ and SO42− in this study suggests that, under the context of intense human activities, diatom community changes in large shallow lakes may reflect not only classical eutrophication processes but also shifts in ionic composition and the associated composite hydrochemical heterogeneity.
Industrial and mining drainage, agricultural fertilizer leaching, and inter-basin water diversion have collectively altered the background ionic composition of Nansi Lake. Currently, industrial and mining wastewater and agricultural runoff contribute approximately 35% and 28%, respectively, to the SO42− load in the lake area. The spatial gradient of Mg2+, in turn, has been shown to be highly coupled with mineral dissolution processes in the watershed induced by the South-to-North Water Diversion Project [49]. Such hydrochemical fluctuations generally do not exceed the absolute physiological tolerance limits of local diatom species so as to cause lethal effects. Rather, changes in water ionic composition may regulate interspecific competition among diatoms through osmotic stress or by altering the bioavailability of nutrients. Overall, the spatial differentiation of Mg2+ and SO42− may not be solely the direct result of individual chemical elements, but rather a composite environmental signal arising from the superimposition of multiple human activities, including industrial and mining operations, agriculture, and water diversion. Due to limitations in the available monitoring indicators, this study is currently unable to fully disentangle the direct ecological effects of ions from other associated environmental processes. Future research could further clarify the relevant mechanisms by incorporating continuous sediment geochemical observations of variables such as conductivity and alkalinity.

4.2.4. Relative Contributions of Human Activities and Pure Spatial Processes to Diatom Spatial Patterns

Constrained ordination based on dbMEM eigenvectors revealed significant geographic spatial differentiation in the diatom communities of Nansi Lake. However, variance partitioning results showed that the pure independent explanatory power of spatial variables was only 0.35% (p = 0.333), indicating that pure spatial processes such as natural dispersal or geographic distance decay alone are insufficient to fully explain the distributional differences of diatoms in the lake area.
The shared explanatory fraction between human activity and spatial variables was 3.42%, and the joint explanatory fraction of all three variable categories (environment, human activity, and space) reached 7.10%. These results suggest that the currently observed community spatial structure may largely stem from the environmental heterogeneity induced by human disturbances distributed along fixed spatial nodes—such as river channels, sluice gates, and mining areas—rather than being primarily driven by natural spatial processes. Moran’s I tests for the first two axes of the full model residuals showed no significant spatial autocorrelation (Moran’s I ranging from 0.070 to 0.009, p > 0.05), indicating that after incorporating environmental, human activity, and spatial variables, the potential spatial dependence in the data has been adequately controlled. In summary, the spatial differentiation of diatoms in Nansi Lake can be understood as a benthic ecological response shaped by spatially structured human activities that drive multiple environmental gradients, whereas pure natural spatial processes play a relatively weak role at the current study scale.

4.2.5. Unexplained Components of Community Variation and Study Limitations

In this study, the combined explanatory power of environmental, human activity, and spatial variables accounted for 28.91% of the total variation in diatom communities, leaving 71.09% of the variation unexplained. This residual variation may be attributed to other complex ecological processes not incorporated into the analysis, which also constitutes a limitation of the present study.
First, benthic habitat parameters such as sediment grain size, organic matter content, and substrate stability may directly influence diatom communities by altering the conditions for diatom attachment and the intensity of internal nutrient release. Second, hydrodynamic spatial heterogeneity formed by the combined effects of wind–wave action and sluice gate/dam operations, as well as water residence time, may significantly regulate the sedimentation and preservation efficiency of diatoms. Third, the coverage and spatial distribution of large aquatic macrophytes can modify local light availability, flow velocity, and microhabitats for attached algae. However, this study did not incorporate macrophytes as a constraining variable in the model. Finally, imperfect temporal matching of the data may also introduce some interference: the surface sedimentary diatoms integrate ecological signals over multiple years, whereas the synchronously collected water quality data primarily reflect the instantaneous environmental conditions of autumn 2019. Seasonal dynamic differences in the water environment may, to some extent, weaken the statistical correspondence between variables.
To address the above limitations, future studies could consider synchronously collecting data on sediment grain size, aquatic vegetation coverage, and fine-scale hydrodynamic parameters, and conducting cross-seasonal continuous monitoring of water quality and sediments. Combined with sediment chronological sequence analysis, this would enable a more systematic elucidation of the synergistic driving mechanisms of environmental filtering, human activities, and natural spatial processes on benthic diatom communities in shallow lakes at different scales.

4.3. Advances of This Study Compared to Previous Research and Implications for Shallow Lake Management

Comparing the results of this study with relevant research on large shallow lakes worldwide reveals that the surface sedimentary diatom community patterns of Nansi Lake exhibit both certain universalities and distinct regional characteristics.
At the level of community spatial differentiation, areas with strong disturbances dominated by river channels, sluice gates, and industrial/mining activities are dominated by the eutrophic, small opportunistic species S. parvus, with low community diversity. In local waters with stable hydrochemical conditions, the dominant species is A. minutissimum, and community integrity is higher. In the open lake center, the cosmopolitan species P. brevistriata is representative, forming a transitional diatom assemblage under mesotrophic background conditions. This differentiation pattern is widely observed in shallow lakes globally: areas with strong exogenous pollution and anthropogenic disturbance are often enriched with tolerant diatom taxa, while open and stable lake areas maintain higher community diversity [4,50,51], confirming that human activities and environmental factors jointly drive the formation of stable spatial ecological zonation of benthic diatoms in shallow lakes.
In terms of driving mechanisms, nutrients, hydrodynamics, and hydrological connectivity are core factors regulating the distribution of benthic algae in shallow lakes [52], and the conclusions of this study are consistent with this. Differentiating it from natural shallow lakes, Nansi Lake is subjected to the superimposed effects of sluice/dam regulation, multi-source pollution inputs, and inter-basin water diversion, forming a unique coupling pathway of “engineering regulation—ionic environment alteration—diatom community response.” The significant explanatory power of Mg2+ and SO42− for community differentiation in the model indicates that diatom community succession in regulated shallow lakes is not solely driven by nitrogen and phosphorus eutrophication but is also sensitive to hydrochemical heterogeneity induced by watershed human activities. Existing studies have confirmed that freshwater salinization syndrome triggered by agricultural cultivation, mining extraction, and inter-basin water diversion significantly alters the ionic background of inland lakes and disturbs sensitive aquatic organisms such as diatoms [53,54]. Thus, Mg2+ and SO42− can serve as comprehensive tracers reflecting the ionic differentiation of water bodies resulting from the superimposition of multiple anthropogenic stresses.
The results of hydrological engineering regulation show that anthropogenic spatial gradients such as dam partitions and inflow river mouths can reshape the spatial pattern of benthic diatoms. The spatial proxy variables constructed in this study, including the north–south dam partition and proximity to inflow river mouths, effectively explained variation in community structure. The physical barrier formed by the secondary dam and the continuous material transport at the river mouths altered water residence time and local disturbance intensity, shaping the spatial heterogeneity of diatom habitats at the macro scale.
From the perspective of community assembly mechanisms, this study provides local empirical evidence on the relative contributions of environmental filtering and spatial dispersal in strongly disturbed shallow lakes. The pRDA variance partitioning showed that only 0.35% of diatom community variation could be attributed to pure spatial dispersal processes, while environmental filtering centered on human activities and human–space coupling effects dominated. This result is consistent with existing findings that environmental filtering dominates in highly disturbed water bodies [55,56,57], while also refining the applicability boundary of distance decay theory in regulated lakes: the spatial distribution of diatoms in Nansi Lake is not dependent on natural dispersal limitation, but is dominated by structured anthropogenic disturbances at fixed points such as dams, mining areas, and river mouths.
Integrating the analytical results of multi-chemical stress, hydraulic engineering regulation, and community assembly mechanisms, this study proposes differentiated management strategies for Nansi Lake and similar inter-basin regulated shallow lakes. Existing lake management predominantly focuses on nitrogen and phosphorus load reduction. However, this study confirms that single-nutrient management is insufficient to maintain lake stability, and a multidimensional synergistic control scheme that addresses both nutrient and ionic pollution is urgently needed. Management efforts should implement spatially targeted precision measures, focusing on the control of three high-risk habitat types: (1) inflow river mouth zones, where exogenous nutrient and organic pollution interception and reduction should be strengthened; (2) upstream and downstream hydraulic engineering areas of the secondary dam, where connectivity disruption and intense hydrodynamic disturbance caused by sluice/dam operations should be mitigated; and (3) coal mining subsidence areas, where substrate damage and abnormal inputs of ions such as SO42− should be prevented and controlled. Targeted restoration of these critical areas can ensure the integrity of benthic diatom habitats, thereby supporting the water transfer safety of the Eastern Route of the South-to-North Water Diversion Project and the long-term ecological health of the lake.

5. Conclusions

The surface sedimentary diatom communities in Nansi Lake exhibit significant spatial heterogeneity, forming a sharp spatial contrast between highly disturbed areas (dominated by the eutrophic opportunistic species S. parvus) and hydrochemically stable areas (dominated by A. minutissimum), effectively indicating the differential response of the benthic ecosystem to complex disturbances.
Different from the traditional single eutrophication-driven model, the RDA indicates that diatom communities are simultaneously constrained by the synergistic alteration of nutrient enrichment and the water ionic environment (Mg2+ and SO42−). Differentially spatialized human activities (e.g., river mouth inputs, sluice–dam engineering regulation, and coal mining) act as environmental filters, collectively reshaping the community structure of sedimentary diatoms.
The pRDA variance partitioning confirmed that environmental filtering centered on human activities dominated the community assembly process, with pure spatial natural dispersal explaining only 0.35% of the variation. Although surface sedimentary diatoms provide a good time-integrated proxy for long-term ecological status, given the unexplained fraction of model variation, more refined spatiotemporal dynamics still require long-term continuous monitoring in the future, incorporating substrate characteristics and aquatic vegetation coverage.
In light of the identified spatial heterogeneity and multi-stress mechanisms, Nansi Lake should shift from traditional single-nutrient control toward multidimensional synergistic management. Prioritizing the regulation of key spatial nodes—such as inflow river mouth zones, the secondary dam hydraulic engineering area, and coal mining subsidence areas—is crucial for ensuring the water quality safety of the Eastern Route of the South-to-North Water Diversion Project and the long-term ecological stability of the lake.

Supplementary Materials

The following supporting information can be downloaded at https://www.mdpi.com/article/10.3390/w18141705/s1, Figure S1: Spatial distribution map of water environmental parameters of Nansi Lakes.

Author Contributions

Conceptualization, S.C. and L.Y.; methodology, P.X.; software, X.W.; validation, P.X. and Y.C.; formal analysis, X.W.; investigation, S.C. and P.X.; resources, S.C.; data curation, P.X.; writing—original draft preparation, X.W.; writing—review and editing, X.W.; visualization, X.W.; supervision, S.C. and Y.C.; project administration, S.C.; funding acquisition, S.C. and L.Y. All authors have read and agreed to the published version of the manuscript.

Funding

This research was funded by the National Natural Science Foundation of China, grant number 41807430 and 41871073.

Data Availability Statement

The original data presented in the study are openly available in FigShare at https://doi.org/10.6084/m9.figshare.32871176.

Acknowledgments

The authors would like to thank all members of the research team for their assistance in field sampling and laboratory analysis.

Conflicts of Interest

The authors declare no conflicts of interest.

References

  1. Halpern, B.; Walbridge, S.; Selkoe, K.A.; Kappel, C.V.; Micheli, F.; D’Agrosa, C.; Bruno, J.F.; Casey, K.S.; Ebert, C.; Fox, H.E.; et al. A global map of human impact on marine ecosystems. Science 2008, 319, 948–952. [Google Scholar] [CrossRef] [Scilit] [PubMed]
  2. Dudgeon, D.; Arthington, A.H.; Gessner, M.O.; Kawabata, Z.-I.; Knowler, D.J.; Lévêque, C.; Naiman, R.J.; Prieur-Richard, A.-H.; Soto, D.; Stiassny, M.L.J.; et al. Freshwater biodiversity: Importance, threats, status and conservation challenges. Biol. Rev. 2006, 81, 163–182. [Google Scholar] [CrossRef] [Scilit] [PubMed]
  3. Birk, S.; Chapman, D.; Carvalho, L.; Spears, B.M.; Andersen, H.E.; Argillier, C.; Auer, S.; Baattrup-Pedersen, A.; Banin, L.; Beklioğlu, M. Impacts of multiple stressors on freshwater biota across spatial scales and ecosystems. Nat. Ecol. Evol. 2020, 4, 1060–1068. [Google Scholar] [CrossRef] [Scilit] [PubMed]
  4. Cantonati, M.; Zorza, R.; Bertoli, M.; Spitale, D.; Angeli, N.; Scalfi, A.; Vescovi, E.; Pasolli, L.; Vannuccini, A.; Filippi, M.L.; et al. Recent and subfossil diatom assemblages as indicators of environmental change (including fish introduction) in a high-mountain lake. Ecol. Indic. 2021, 125, 107603. [Google Scholar] [CrossRef] [Scilit]
  5. Smol, J.P. The power of the past: Using sediments to track the effects of multiple stressors on lake ecosystems. Freshw. Biol. 2010, 55, 43–59. [Google Scholar] [CrossRef] [Scilit]
  6. Kelly, M.; Whitton, B. The Trophic Diatom Index: A new index for monitoring eutrophication in rivers. J. Appl. Phycol. 1995, 7, 433–444. [Google Scholar] [CrossRef] [Scilit]
  7. Kelly, M.; Bennion, H.; Burgess, A.; Ellis, J.; Juggins, S.; Guthrie, R.; Jamieson, J.; Adriaenssens, V.; Yallop, M. Uncertainty in ecological status assessments of lakes and rivers using diatoms. Hydrobiologia 2009, 633, 5–15. [Google Scholar] [CrossRef] [Scilit]
  8. Bennion, H.; Kelly, M.G.; Juggins, S.; Yallop, M.L.; Burgess, A.; Jamieson, J.; Krokowski, J.; Monteith, D.; Owen, R.; Taylor, A.; et al. Assessment of ecological status in UK lakes using benthic diatoms. Freshw. Sci. 2014, 33, 639–654. [Google Scholar] [CrossRef] [Scilit]
  9. Liu, E.; Shen, J.; Yang, L.; Zhu, Y.; Sun, Q.; Wang, J. Speciation composition and pollution of heavy metals in surface sediments of Nansi Lake and its main inflow rivers. Environ. Sci. 2007, 28, 1377–1383. [Google Scholar] [CrossRef]
  10. Xu, J.; Dong, J. Landscape pattern changes of Nansi Lake wetland and their driving forces from 1987 to 2010. Wetl. Sci. 2013, 11, 438–445. [Google Scholar] [CrossRef]
  11. Yu, M.; Lian, L.; Li, B.; Zhang, W.; Chu, C. Evaluation of land use and its ecological effects in Nansi Lake Basin based on CLUE-S model. Bull. Soil Water Conserv. 2018, 38, 231–239. [Google Scholar] [CrossRef]
  12. Zhang, D.; Xu, Y.; Liu, Z.; Su, R.; Peng, W. Review on formation, evolution and climate of Nansi Lake. China Water Transp. 2023, 23, 61–64+67. [Google Scholar]
  13. Lin, X.; Jing, Y. Evaluation and classification control of agricultural non-point source pollution in Nansi Lake Basin 2014 Shandong Province. Chin. J. Ecol. 2014, 33, 3278–3285. [Google Scholar] [CrossRef]
  14. Wang, B.; Liu, N.; Tong, L. Analysis of sulfate sources and control measures in Nansi Lake Basin. J. Qufu Norm. Univ. (Nat. Sci.) 2021, 47, 119–123. [Google Scholar]
  15. Zhao, Y.; Pan, Y.; Kou, R.; Lu, X. Establishment and empirical study of assessment method for discharge standards of water pollutants in basin type. China Water Wastewater 2024, 40, 108–114. Available online: http://zggsps.paperonce.org/oa/DArticle.aspx?type=view&id=202415016 (accessed on 8 May 2026).
  16. Jiao, P.; Jiang, D.; Xu, P.; Wang, S.; Wu, H.; Shi, X.; Wang, L.; Wang, Y.; Ma, Z. Spatio-temporal variation characteristics and control countermeasures of agricultural non-point source pollution in Nansi Lake Basin Shandong Province. South. Agric. Mach. 2025, 56, 17–24+45. [Google Scholar]
  17. Wei, J.; Cao, P.; Hu, W.; Xie, J.; Pei, H.; Ren, Y.; Feng, Y. Seasonal succession of planktonic diatoms and their correlation with environmental factors in Nansi Lake. Res. Environ. Sci. 2015, 28, 1209–1218. [Google Scholar] [CrossRef]
  18. Hou, X.; Xu, H.; Li, X.; Wang, M.; Sui, X.; Liang, S. Dynamic changes of water area and driving force analysis of Nansi Lake in recent 35 years. Shandong Agric. Sci. 2021, 53, 127–132. [Google Scholar] [CrossRef]
  19. Lu, X.; Liu, H.; Ju, C.; Hao, H.; Gao, Y.; Tao, R. Study on seasonal association characteristics of submerged plants and benthic animals in Nansi Lake wetland. Environ. Ecol. 2025, 7, 107–112. [Google Scholar]
  20. Liu, P.; Zhang, X.; Shang, Y.; Zhang, L.; Feng, E. Ideas and suggestions for building a municipal-level modern water network demonstration zone. Harnessing Huaihe River 2026, 76–78. [Google Scholar]
  21. Li, W. Spatio-Temporal Distribution Characteristics of Pesticide Pollution in Surface Water of Nansi Lake Basin and Its Response to Land Use. Master’s Thesis, Qufu Normal University, Qufu, China, 2022. [Google Scholar] [CrossRef]
  22. Ding, Z.Y.; Yang, H.; Xie, B.; Zhang, M.; Wang, X. Effects of hydraulic engineering on modern sedimentation rates in Nansi Lake. Res. Environ. Sci. 2015, 28, 242–249. [Google Scholar] [CrossRef]
  23. Spellerberg, I.F.; Fedor, P.J. A tribute to Claude Shannon (1916–2001) and a plea for more rigorous use of species richness, species diversity and the ‘Shannon–Wiener’ Index. Glob. Ecol. Biogeogr. 2003, 12, 177–179. [Google Scholar] [CrossRef] [Scilit]
  24. Shannon, C.E. A mathematical theory of communication. Bell Syst. Tech. J. 1948, 27, 379–423. [Google Scholar] [CrossRef] [Scilit]
  25. Lobo, E.; Katoh, K.; Aruga, Y. Response of epilithic diatom assemblages to water pollution in rivers in the Tokyo Metropolitan area, Japan. Freshw. Biol. 1995, 34, 191–204. [Google Scholar] [CrossRef] [Scilit]
  26. Margalef, R. Information Theory in Ecology. Gen. Syst. 1958, 3, 36–71. [Google Scholar]
  27. Simpson, E.H. Measurement of diversity. Nature 1949, 163, 688. [Google Scholar] [CrossRef] [Scilit]
  28. Zelinka, M.; Marvan, P. Zur Präzisierung der biologischen Klassifikation des Reinheitsfliessender Gewässer. Arch. Hydrobiol. 1961, 57, 389–407. [Google Scholar]
  29. Kelly, M.G. Use of the trophic diatom index to monitor eutrophication in rivers. Water Res. 1998, 32, 236–242. [Google Scholar] [CrossRef] [Scilit]
  30. Stenger-Kovács, C.; Buczkó, K.; Hajnal, E.; Padisák, J. Epiphytic, littoral diatoms as bioindicators of shallow lake trophic status: Trophic Diatom Index for Lakes (TDIL) developed in Hungary. Hydrobiologia 2007, 589, 141–154. [Google Scholar] [CrossRef] [Scilit]
  31. State Environmental Protection Administration of China. Monitoring and Analytical Methods for Water and Wastewater, 4th ed.; China Environmental Science Press: Beijing, China, 2002. [Google Scholar]
  32. HJ 897-2017; Water Quality—Determination of Chlorophyll a—Spectrophotometric Method. China Environmental Science Press: Beijing, China, 2017.
  33. GB 11892-1989; Water Quality—Determination of Permanganate Index. Standards Press of China: Beijing, China, 1989.
  34. HJ 535-2009; Water Quality—Determination of Ammonia Nitrogen—Nessler’s Reagent Spectrophotometry. China Environmental Science Press: Beijing, China, 2009.
  35. GB 7493-1987; Water Quality—Determination of Nitrite Nitrogen—Spectrophotometric Method. Standards Press of China: Beijing, China, 1987.
  36. HJ/T 346-2007; Water Quality—Determination of Nitrate Nitrogen—Ultraviolet Spectrophotometric Method (Trial). China Environmental Science Press: Beijing, China, 2007.
  37. Xu, X.L.; Liu, J.Y.; Zhang, S.W.; Li, R.D.; Yan, C.Z.; Wu, S.X. China Multi-Period Land Use and Land Cover Remote Sensing Monitoring Dataset (CNLUCC); Resource and Environment Science and Data Center, Chinese Academy of Sciences: Beijing, China, 2018. [Google Scholar] [CrossRef]
  38. Jining Urban-Rural Water Affairs Bureau. Nansi Lake. Available online: https://jnsl.jining.gov.cn/art/2018/9/18/art_14547_719999.html (accessed on 8 May 2026).
  39. Wan, P. Study on the Impacts of Coal Mining on Surface and Soil Environment Around Nansi Lake in Shandong Province. Master’s Thesis, Kunming University of Science and Technology, Kunming, China, 2021. [Google Scholar] [CrossRef]
  40. Li, Y.F. Study on Water Body Information Extraction and Land Cover Classification of Nansi Lake Based on SPOT5 Satellite Imagery. Master’s Thesis, Shandong University, Jinan, China, 2008. [Google Scholar]
  41. Liu, Y.; Han, W.; Sun, Z.; Sang, G. Multi-scenario simulation of economic losses from flood disasters in lake-type basins: A case study of Nansi Lake Basin. Acta Ecol. Sin. 2024, 44, 4129–4141. [Google Scholar] [CrossRef]
  42. Zuur, A.; Ieno, E.; Elphick, C. A protocol for data exploration to avoid common statistical problems. Methods Ecol. Evol. 2010, 1, 3–14. [Google Scholar] [CrossRef] [Scilit]
  43. Dormann, C.; Elith, J.; Bacher, S.; Buchmann, C.M.; Carl, G.; Carré, G.; Márquez, J.; Gruber, B.; Lafourcade, B.; Leitão, P.; et al. Collinearity: A review of methods to deal with it and a simulation study evaluating their performance. Ecography 2013, 36, 27–46. [Google Scholar] [CrossRef] [Scilit]
  44. Bray, J.R.; Curtis, J.T. An Ordination of the Upland Forest Communities of Southern Wisconsin. Ecol. Monogr. 1957, 27, 326–349. [Google Scholar] [CrossRef] [Scilit] [PubMed]
  45. Zhang, J. The Methods of Quantitative Ecology for Vegetation; Science and Technology Press: Beijing, China, 1995; pp. 256–267. [Google Scholar]
  46. Legendre, P.; Gallagher, E.D. Ecologically meaningful transformations for ordination of species data. Oecologia 2001, 129, 271–280. [Google Scholar] [CrossRef] [Scilit] [PubMed]
  47. Cantonati, M.; Angeli, N.; Virtanen, L.; Wojtal, A.; Gabrieli, J.; Falasco, E.; Lavoie, I.; Morin, S.; Marchetto, A.; Fortin, C.; et al. Achnanthidium minutissimum (Bacillariophyta) valve deformities as indicators of metal enrichment in diverse widely-distributed freshwater habitats. Sci. Total Environ. 2014, 475, 201–215. [Google Scholar] [CrossRef] [Scilit] [PubMed]
  48. Potapova, M.; Hamilton, P.B. Morphological and ecological variation within the Achnanthidium minutissimum (Bacillariophyceae) species complex. J. Phycol. 2007, 43, 561–575. [Google Scholar] [CrossRef] [Scilit]
  49. Zhang, Y. Pollution Characteristics and Risk Assessment of Typical Toxic and Harmful Pollutants in Nansi Lake. Master’s Thesis, Beijing Jiaotong University, Beijing, China, 2023. [Google Scholar] [CrossRef]
  50. Santos, C.B.D.; Corrêa, I.C.S.; Weschenfelder, J.; Stone, J.R. Grain-size parameters and diatom records as indicators of environmental changes along the southern Brazilian coastal plain. Int. J. Sediment Res. 2025, 40, 269–285. [Google Scholar] [CrossRef] [Scilit]
  51. Bennion, H.; Fluin, J.; Simpson, G. Assessing eutrophication and reference conditions for Scottish freshwater lochs using subfossil diatoms. J. Appl. Ecol. 2004, 41, 124–138. [Google Scholar] [CrossRef] [Scilit]
  52. Blanco, S.; Cejudo-Figueiras, C.; Álvarez-Blanco, I.; Van Donk, E.; Gross, E.M.; Hansson, L.-A.; Irvine, K.; Jeppesen, E.; Kairesalo, T.; Moss, B.; et al. Epiphytic diatoms along environmental gradients in Western European shallow lakes. CLEAN. Soil Air Water 2014, 42, 229–235. [Google Scholar] [CrossRef] [Scilit]
  53. Dugan, H.; Bartlett, S.; Burke, S.; Doubek, J.; Krivak-Tetley, F.; Skaff, N.; Summers, J.; Farrell, K.; McCullough, I.; Morales-Williams, A.M.; et al. Salting our freshwater lakes. Proc. Natl. Acad. Sci. USA 2017, 114, 4453–4458. [Google Scholar] [CrossRef] [Scilit] [PubMed]
  54. Liu, G.; Lin, Z.; Qi, X.; Wang, Y.; Wang, Y.; Jiang, W.; He, F.; Wu, N. Environmental filtering, spatial processes and biotic interactions jointly shape different traits communities of stream macroinvertebrates. Front. Ecol. Evol. 2023, 11, 1196296. [Google Scholar] [CrossRef] [Scilit]
  55. Oliveira, P.H.; Machado, K.B.; Teresa, F.B.; Heino, J.; Nabout, J. Spatial processes determine planktonic diatom metacommunity structure of headwater streams. Limnologica 2020, 84, 125813. [Google Scholar] [CrossRef] [Scilit]
  56. Liu, Z.; Zhou, T.; Cui, Y.; Li, Z.; Wang, W.; Chen, Y.; Xie, Z. Environmental filtering and spatial processes equally contributed to macroinvertebrate metacommunity dynamics in the highly urbanized river networks in Shenzhen, South China. Ecol. Process. 2021, 10, 23. [Google Scholar] [CrossRef] [Scilit]
  57. Cañedo-Argüelles, M.; Kefford, B.; Piscart, C.; Prat, N.; Schäfer, R.; Schulz, C. Salinisation of rivers: An urgent ecological issue. Environ. Pollut. 2013, 173, 157–167. [Google Scholar] [CrossRef] [Scilit] [PubMed]
Figure 1. Map of the study area.
Water 18 01705 g001
Figure 2. Distribution of sampling sites and human activities.
Water 18 01705 g002
Figure 3. Representative diatom taxa and cluster analysis in Nansi Lake. Species abbreviations are as follows: A. ambigua, Aulacoseira ambigua; A. granulata, Aulacoseira granulata (Ehrenberg) Simonsen; C. meneghiniana, Cyclotella meneghiniana Kützing; S. parvus, Stephanodiscus parvus; S. hantzschii, Stephanodiscus hantzschii Grunow; F. capucina, Fragilaria capucina Desmazières; P. brevistriata, Pseudostaurosira brevistriata; S. construens, Staurosira construens; S. pinnata, Staurosirella pinnata (Ehrenberg) Williams & Round; A. minutissimum, Achnanthidium minutissimum; N. palea, Nitzschia palea (Kützing) W. Smith; N. amphibia, Nitzschia amphibia Grunow; and A. libyca, Amphora libyca Ehrenberg. H′, E, D, and D′ represent the Shannon-Wiener diversity index, Pielou evenness index, Margalef richness index, and Simpson diversity index, respectively. The dark green, bright green, and blue areas represent the relative abundances of planktonic, epiphytic, and benthic species, respectively; the gray horizontal bands indicate the three CONISS groups (I–III).
Water 18 01705 g003
Figure 4. Diatom assemblage zones in Nansi Lake.
Water 18 01705 g004
Figure 5. Spatial distribution of TDI in Nansi Lake.
Water 18 01705 g005
Figure 6. Heatmap showing Pearson correlations between human activity variables and dominant diatom species/community diversity indices. * p < 0.05, ** p < 0.01, *** p < 0.001.
Water 18 01705 g006
Figure 7. RDA ordination of diatom assemblages constrained by human activity variables. ① Proximity to inflow river estuaries. ② North–south dam partition. ③ Proximity to the erji dam. ④ Area proportion of coal mining subsidence zones.
Water 18 01705 g007
Figure 8. RDA ordination diagram showing the relationships between diatom assemblages in surface sediments and environmental variables in Nansi Lake.
Water 18 01705 g008
Table 1. Definitions, types, and data sources of human activity variables in Nansi Lake.
Variable NameDefinitionData Source
Proximity to shorelineThis reflects the intensity of nearshore human activities and shoreline development impacts. The closer the distance, the higher the proximity, and the stronger the shoreline anthropogenic disturbance.[37]
Proximity to navigation channelsThis reflects the disturbance intensity of shipping activities. The closer the distance, the higher the proximity, and the stronger the shipping-related anthropogenic disturbance.[38]
Proximity to inflow river estuariesThis reflects the potential intensity of river input and upstream pollution transport affecting the sampling site. The closer the distance, the higher the proximity, and the greater the impact from exogenous inputs.[37]
Proximity to the nearest mining areaThis reflects the proximity of mining and industrial activities. The closer the distance, the higher the proximity, and the stronger the anthropogenic disturbance related to coal mining.[39]
Proximity to the nearest coal mining subsidence areaThis reflects the disturbance proximity of coal mining subsidence. The closer the distance, the higher the proximity, and the stronger the ecological disturbance related to coal mining subsidence.[39]
Proximity to the Erji DamThis reflects the regulation intensity of hydraulic engineering structures. The closer the distance, the higher the proximity, and the stronger the hydrological regulation and compartmentalization impacts of the dam project.[37]
Proximity to 2019 enclosure aquaculture pointsThis reflects the influence intensity of enclosure culture in 2019. The closer the distance, the higher the proximity, and the greater the impact from enclosure culture.[40]
Area proportion of mining areasRepresents the intensity of industrial and mining disturbance in the local area surrounding a sampling site; higher proportion indicates stronger human activities disturbance associated with coal mining.[39]
Area proportion of coal mining subsidence zonesRepresents the intensity of coal mining subsidence disturbance in the local area surrounding a sampling site; higher proportion indicates stronger subsidence-related ecological disturbance.[39]
Area proportion of farmlandRepresents the potential for agricultural non-point source pollution around a sampling site; higher proportion indicates greater risk of nutrient input from agricultural activities.[37]
Area proportion of construction landRepresents the intensity of residential activity and urban development around a sampling site; higher proportion indicates stronger human activities disturbance related to urban living and construction.[37]
Area proportion of historical enclosure aquacultureRepresents the historical cumulative impact intensity of enclosure aquaculture; higher proportion indicates greater long-term ecological effects of aquaculture activities.[40]
Number of 2019 enclosure aquaculture pointsRepresents the current intensity of enclosure aquaculture activity in 2019; larger numbers indicate stronger aquaculture-related human activities disturbance.Field survey in 2019
South/North dam partitionRepresents the spatial partitioning and hydrological regulation effects of the Erji Dam on the lake, reflecting differences in engineering regulation between the two partitions.Field survey in 2019
Table 2. Statistical comparison of diversity indices and TDI among the three diatom assemblage zones in Nansi Lake.
IndexZone IZone IIZone IIIStatistical MethodTest Statisticp-ValuePost Hoc Comparison
H’2.08 c3.09 a2.54 bANOVA + TukeyF = 10.659<0.001II > III > I
E0.55 c0.75 a0.66 bANOVA + TukeyF = 8.931<0.001II > III > I
D7.41 b9.76 a7.72 bANOVA + TukeyF = 6.6950.002II > I = III
D’0.66 b0.90 a0.82 aKruskal–Wallis + BonferroniH = 14.5890.001II = III > I
TDI85.85 a55.29 a36.73 bKruskal–Wallis + BonferroniH = 15.402<0.001I = II > III
Notes: The selection of statistical methods was based on the Shapiro–Wilk normality test and Levene’s test for homogeneity of variance. H′, E, and D satisfied the assumptions of normality and homogeneity of variance (Levene’s test: H′, p = 0.189; E, p = 0.335; D, p = 0.105). Accordingly, one-way ANOVA was employed, followed by Tukey’s HSD post hoc test for pairwise comparisons. D′ deviated from normality in Assemblage Zone III (p = 0.000285) and did not meet the assumption of homogeneity of variance (p = 0.048). TDI also deviated from normality in Assemblage Zone III (p = 4.09 × 10⁻⁵). Therefore, the Kruskal–Wallis test was used, followed by pairwise comparisons with Bonferroni correction. Different lowercase letters indicate significant differences among assemblage zones.
Table 4. Moran’s I tests for the first two principal component axes of the full-model residuals.
AxisMoran’s IExpected IVarianceParametric p ValuePermutation p Value
Residual PCA10.0094−0.01640.006630.3760.35
Residual PCA2−0.0702−0.01640.006680.7450.727
Notes: Moran’s I was calculated for the first two PCA axes derived from the residual matrix of the full RDA model. Both parametric and Monte Carlo permutation tests indicated non-significant residual spatial autocorrelation (p > 0.05).
Disclaimer/Publisher’s Note: The statements, opinions and data contained in all publications are solely those of the individual author(s) and contributor(s) and not of MDPI and/or the editor(s). MDPI and/or the editor(s) disclaim responsibility for any injury to people or property resulting from any ideas, methods, instructions or products referred to in the content.