Article

Flow-Induced Response Mechanisms and Energy-Harvesting Characteristics of a Novel Circular-T-Attachment Oscillator

1
Key Laboratory of Agricultural Soil and Water Engineering in Arid and Semiarid Areas, Ministry of Education, Northwest A&F University, Yangling 712100, China
2
College of Water Resources and Architectural Engineering, Northwest A&F University, Yangling 712100, China
3
National Science Center for Earthquake Engineering, Tianjin University, Tianjin 300350, China
4
School of Civil Engineering, Tianjin University, Tianjin 300350, China
*
Author to whom correspondence should be addressed.
Water 2026, 18(13), 1603; https://doi.org/10.3390/w18131603
Submission received: 27 May 2026 / Revised: 20 June 2026 / Accepted: 29 June 2026 / Published: 2 July 2026
(This article belongs to the Section Hydraulics and Hydrodynamics)

Abstract

A novel circular-T-attachment (CTA) oscillator is proposed to improve the oscillation response and energy-harvesting performance. This combined section is designed to change the boundary layer separation and avoid vortex reattachment, effectively enhancing energy conversion in the galloping branch. Results indicate that in the vortex-induced vibration (VIV) branch, the harvested fluid energy increases with reduced velocity. As system damping increases, the oscillatory response transitions from soft galloping (SG) to hard galloping (HG), indicating a progressive weakening of the self-excited transition to galloping. Within the tested parameter range, the galloping branch provided the most favorable energy-conversion performance. The maximum amplitude ratio reached 2.43, while the maximum active power and energy conversion efficiency (ECE) reached 19.3 W and 26.2%, respectively. Compared with a conventional triangular prism oscillator at the same reduced velocity, the proposed CTA oscillator achieved increases of 9.29 W in active power and 12.59 percentage points in energy conversion efficiency. These results clarify the flow-induced response mechanism of the circular-T-attachment oscillator and provide new insights for improving the performance and expanding the application range of flow-induced motion energy conversion systems (FIMECSs).

1. Introduction

The continued reliance on fossil-fuel-based energy systems contributes substantially to global greenhouse gas emissions, accelerates the depletion of finite resources, and threatens long-term energy security [1,2,3], despite ongoing international mitigation efforts [4,5]. Against this background, the rapid deployment of clean and renewable energy technologies has become an urgent global priority [6,7,8]. Among the available options, ocean energy—including wave, tidal, thermal, and salinity-gradient energy—constitutes a vast yet underexploited renewable resource [9,10]. With an estimated global potential exceeding 10 TW, ocean energy could make a meaningful contribution to decarbonization and carbon-neutrality targets [11].
Flow-induced motion (FIM), historically regarded as a source of structural vibration and fatigue damage, has increasingly been reconsidered as a viable mechanism for renewable energy harvesting [12,13]. In FIM-based systems, vortex shedding from a bluff body produces unsteady hydrodynamic forces; when the body is elastically mounted, these forces can induce VIV. The structural motion, in turn, modifies the surrounding flow field, producing a strongly coupled fluid–structure interaction that can be exploited for energy conversion [14,15,16]. These systems involve complex nonlinear coupling among fluid dynamics, structural mechanics, and electromechanical transduction. Owing to their relatively high-power density, environmental compatibility, and simple mechanical architecture, FIM-based energy harvesters have attracted growing attention [17,18].
Extensive numerical and experimental studies have therefore been conducted to improve the energy-conversion performance of such systems. A representative example is the vortex-induced vibration for aquatic clean energy (VIVACE) converter developed at the University of Michigan. Bernitsas et al. experimentally demonstrated that a cylinder-based VIVACE prototype can convert hydrokinetic energy into oscillatory mechanical motion and subsequently into electricity through electromagnetic induction [19]. Compared with conventional hydroelectric generators, VIVACE offers a lower startup flow velocity and higher energy density [19,20].
Subsequent studies explored oscillators with different cross-sectional geometries and appendage configurations to improve oscillation amplitude and power output [21,22]. For cylinder-based harvesters, passive turbulence control was shown by Park et al. to induce two characteristic response modes, namely SG and HG [23]. SG refers to a self-starting response in which the oscillator spontaneously evolves from the VIV branch to the galloping branch as the flow velocity is increased, without requiring a finite external perturbation. HG refers to a bistable response in which the oscillator remains on a low-amplitude branch beyond the nominal galloping-onset velocity and can reach the large-amplitude galloping branch only after a finite mechanical perturbation is applied. For the HG tests, the flow velocity was first maintained at the prescribed value until stable conditions were achieved. A brief mechanical perturbation was then applied to provide a finite initial displacement, after which the oscillator was released freely. The perturbation was not maintained during the subsequent oscillation and therefore did not contribute continuously to the harvested energy. Data acquisition began after the transient response had decayed and the oscillator had reached a statistically steady state. Beyond localized roughness, several appendage-assisted configurations have also been proposed. Song et al. showed that a cylinder equipped with rod-shaped attachments could develop self-excited oscillations when symmetric sharp attachments suppressed vortex reattachment [24]. Ding et al. introduced symmetrically mounted fin-like rods and identified an optimal installation-angle range for improved harvesting performance [25]. These studies have established effective strategies for manipulating separation and enhancing FIM-based energy harvesting.
Galloping is highly sensitive to both cross-sectional geometry and appendage arrangement [26,27,28]. In addition to modified cylinders, bluff bodies with sharp-edged cross-sections have been widely investigated because fixed separation points can promote large-amplitude oscillations. Chen et al. reported that an equilateral triangular prism can exhibit pure VIV, VIV–galloping interaction, or galloping-dominated motion, depending on the angle of attack and mass ratio [29]. Wang et al. further showed that a trapezoidal prism undergoes VIV, VIV–galloping transition, and galloping as the Reynolds number increases, and that its asymmetric geometry enhances oscillation amplitude relative to a square prism by modifying flow separation and wake development [30]. These results confirm the importance of geometry control in non-circular FIM energy harvesters.
Although non-cylindrical oscillators generally outperform circular cylinders in terms of energy-conversion capability [31,32,33], a persistent challenge lies in the transition from VIV to galloping. In SG, the transition occurs through self-excitation, enabling continuous energy harvesting over a wide operational range. However, HG requires external excitation (e.g., large imposed displacements) to initiate the transition, resulting in limited energy utilization during the galloping phase [13]. From an energy-harvesting perspective, SG is preferable because it broadens the usable operating range, whereas HG limits the accessibility of the high-energy galloping branch.
Existing studies have mainly focused on two design routes: cylinder-based oscillators modified by appendages and sharp-edged non-streamlined oscillators [18,34,35]. The former are advantageous in the VIV branch at relatively low flow velocities, whereas the latter are more effective in the galloping branch at higher flow velocities. However, both routes remain constrained by the VIV–galloping transition, particularly when HG dominates. This motivates the development of a composite-section oscillator capable of deliberately manipulating boundary-layer separation to promote a self-sustained transition from VIV to galloping and thereby enlarge the effective energy-harvesting range.
Drawing on the complementary advantages of circular cross-sections, which are well-suited for energy extraction from the VIV branch at relatively low flow velocities, and symmetric sharp-edged cross-sections, which are favorable for energy harvesting from the galloping branch at higher flow velocities, a composite CTA is proposed in this study. This configuration is intended to integrate the favorable response characteristics of the two cross-sectional forms and thereby broaden the effective energy-harvesting range across different flow-velocity regimes.
Another unresolved issue is the direct measurement of fluid forces in FIMECSs. Most previous studies have relied on indirect pressure-based measurements, which may disturb the incoming flow and hinder the simultaneous evaluation of energy-harvesting performance. In the present study, a high-precision torque sensor was integrated into the experimental system to infer the lift response directly from the drivetrain. Meanwhile, the influence of variable damping on the oscillation response and electrical output of the CTA oscillator was systematically examined.
Accordingly, the objectives of this study are to: (i) validate the variable-damping implementation in the proposed FIMECS; (ii) assess the reliability of the torque-based fluid-force measurement method; (iii) clarify the response evolution of the CTA oscillator from VIV to galloping; and (iv) identify the operating conditions that maximize energy-harvesting performance.

2. Flow-Induced Motion Energy Conversion System

This section presents the overall framework of the FIMECS used in this study. The system couples the hydrodynamic excitation of the oscillator, the transverse oscillatory response, the mechanical transmission process, and the electrical energy conversion of the generator. To clarify this coupled energy-transfer mechanism, the operating principle of the system is first introduced, followed by the governing equations describing the oscillator dynamics, fluid-force response, active power, and ECE. The experimental methodology is then described to provide the basis for evaluating the response characteristics and energy-harvesting performance of the proposed CTA oscillator.

2.1. Principle of Flow-Induced Motion Energy Harvesting

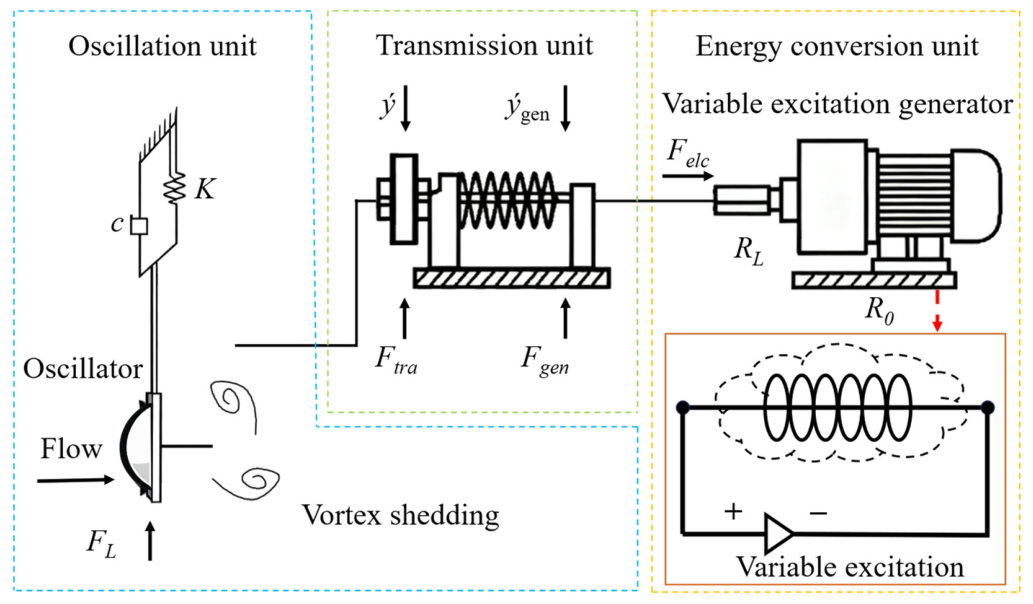
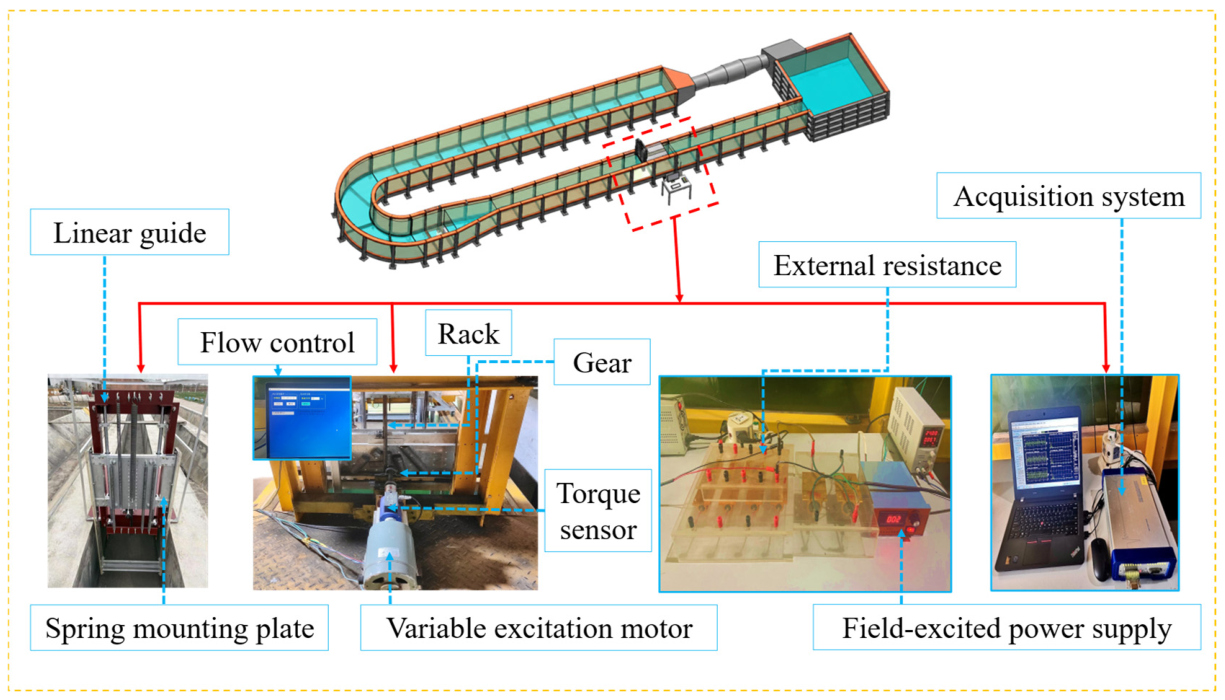
The operating principle of the FIMECS is illustrated in Figure 1. As shown, the system comprises three main components: an oscillation unit, a transmission unit, and an energy conversion unit. In operation, driven by the incoming flow, the oscillator is laterally constrained and thus undergoes single-degree-of-freedom motion only in the transverse direction. As a result, this oscillatory motion is transmitted via the transmission unit to rotate the generator rotor, converting fluid kinetic energy into electrical energy. In addition, the generator magnetic flux density can be adjusted through an external excitation voltage. Finally, the electrical energy generated is dissipated across the generator internal resistance R0 and the external load resistance RL.
In this study, the coupled interactions among the incoming flow, oscillator, generator, and electrical load are modeled as a mass-spring-damper system. The system dynamics can therefore be approximated by the linear equation of motion given in Equation (1):
m osc + m a y ¨ + c total y ˙ + K y = F L
where mosc is the system oscillation mass, kg; ma is the additional water mass, kg; ctotal is the total system damping, N·s/m; K is the system stiffness, N/m; FL is the incoming flow force, N; y, y′, and y″ are the oscillation displacement, velocity, and acceleration of the oscillator, m, m/s and m/s2, respectively.
The total system damping consists of mechanical damping and generator damping:
c total = c + c gen = c + α 2 L 2 L B 2 R 0 + R L V B 2
where c is the mechanical damping of the system, N·s/m; cgen is the motor damping caused by internal energy loss and external load consumption, N·s/m; α is the reduction ratio of the transmission part; L is the length of the motor coil, m; LB is the inductance, H; VB is the excitation voltage, V; R0 is the internal resistance of the generator, Ω; RL is the external load resistance, Ω.
The motion and fluid force are described as follows:
F L = 1 2 c L ( t ) ρ U 2 D l
c L ( t ) = C L sin ( 2 π f L t + φ )
where cL(t) is the instantaneous lift coefficient; ρ is the density of the incoming fluid, kg/m3; U is the inflow velocity, m/s; D is the characteristic width of the oscillator, m; l is the length of the oscillator, m; CL is the maximum lift coefficient; fL is the main frequency of lift, Hz; φ is the phase difference between lift and displacement; t is the oscillation time, s.
For the VIVACE energy harvester, sustained resonance is essential for efficient energy conversion, and the oscillation response is typically examined within the synchronization range. Within this range, the oscillator motion can be approximated as simple harmonic motion. Accordingly, based on the resonance theory of Bearman [36], the FIM response can be expressed approximately as follows:
y = A sin ( 2 π f osc t )
where A is the amplitude of oscillation, m; fosc is the main frequency of oscillation, Hz.
Under the assumption of approximately harmonic oscillator motion, the model-based active power and energy conversion efficiency can be theoretically estimated using Equations (6) and (7), respectively:
P harn = 2 π 2 α 2 L 2 R L R 0 + R L 2 ( A f osc ) 2 L B 2 V B 2
η harn = α 2 4 π 2 L 2 ( A f osc ) 2 R L ρ U 3 l ( 2 A + D ) R 0 + R L 2 L B 2 V B 2
where Pharn is the active power, W; ηharn is the ECE, %.
Equations (6) and (7) indicate that the excitation voltage is a key factor affecting the energy conversion performance of the system.

2.2. Experimental Methodology

The experimental methodology was designed to systematically evaluate the dynamic response, fluid-force characteristics, and energy-harvesting performance of the CTA oscillator. This section first describes the water-channel facility and the FIMECS, including the oscillation unit, transmission unit, variable-excitation generator, external load, and data-acquisition system. The geometric configuration and design parameters of the CTA oscillator are then introduced, followed by the measurement procedures for displacement, voltage, torque, and lift-force estimation. Finally, the calculation methods for active power, ECE, and upper-limit power are presented to support the subsequent analysis of oscillation response and power-generation performance.

2.2.1. Experimental Setup

As shown in Figure 2, the experimental system consisted of an open-loop horizontal recirculating water channel, a power unit, a make-up water tank, a control unit, and an oscillation-based power-generation device. More specifically, the channel was approximately 50 m long and comprised, in sequence along the flow direction, a 2-m-wide section, a curved section, a contraction section, and a 1-m-wide test section. To facilitate flow visualization, transparent glass sidewalls provided full visual access to the flow field and the test section. Water circulation was driven by a variable-frequency tubular pump rated at 90 kW. In addition, the make-up water tank had a storage capacity of approximately 200 m3. The pump speed was regulated by a variable-frequency drive over 0.0–50.0 Hz, which enabled the inflow velocity in the test section to be controlled between 0 and 1.8 m/s. During the present experiments, the actual inflow velocity ranged from 0.55–1.24 m/s−1. The oscillation-based power-generation device was installed in the 1-m-wide test section, where the water depth was maintained at 1.34 m.
Based on the controlled water depth and the tested flow-velocity range, the Froude number ranged from approximately 0.15 to 0.34 under all experimental conditions. Using a characteristic width of D = 0.1 m, the corresponding Reynolds number ranged from approximately 5.5 × 10⁴ to 1.2 × 10⁵. For reference, this Reynolds-number range falls within the TrSL3 regime of the circular-cylinder flow classification proposed by Bearman et al. [37], in which transition to turbulence occurs in the separated shear layers while the boundary layer on the cylinder surface remains predominantly laminar.
The inflow characteristics within the oscillator test region were previously characterized for this facility. The measured velocity and turbulence-intensity profiles showed only minor variations over the depth range of 20–100 cm throughout the tested flow-velocity range. Therefore, the inflow within the oscillator test region was considered approximately uniform, providing suitable conditions for investigating the flow-induced motion and energy-harvesting characteristics of the oscillator.
Boundary effects were also considered in the experimental design. The static geometric blockage ratio was approximately 6.7%, which is close to the low-blockage range reported for bluff-body water-channel experiments [38]. Therefore, blockage effects were considered limited under the present experimental conditions, although residual wall effects cannot be completely excluded. In addition, end plates were installed at both ends of the oscillator to reduce three-dimensional end effects, and a clearance was maintained between the end plates and the channel sidewalls to minimize direct wall interference.
In the experimental apparatus, the oscillator was rigidly connected to two side force-transmission plates, while the linear guide was fixed to the support frame. Specifically, the transmission unit was mounted on the linear guide through linear bearings, so that the oscillator was restricted to vertical motion. To provide the restoring force for reciprocating motion, one end of the spring was connected to the transmission structure and the other to the support frame. Then, the transmission assembly was coupled to a rack-and-pinion mechanism, which in turn converted linear oscillation into rotary motion to drive the generator rotor. Subsequently, the generated electrical power was delivered to an external resistor for load dissipation, while an external excitation power supply regulated the magnetic flux density of the variable-excitation generator. Finally, all sensor signals were acquired in real-time by the data-acquisition system.

2.2.2. Physical Model of Circular-T-Attachment Oscillator

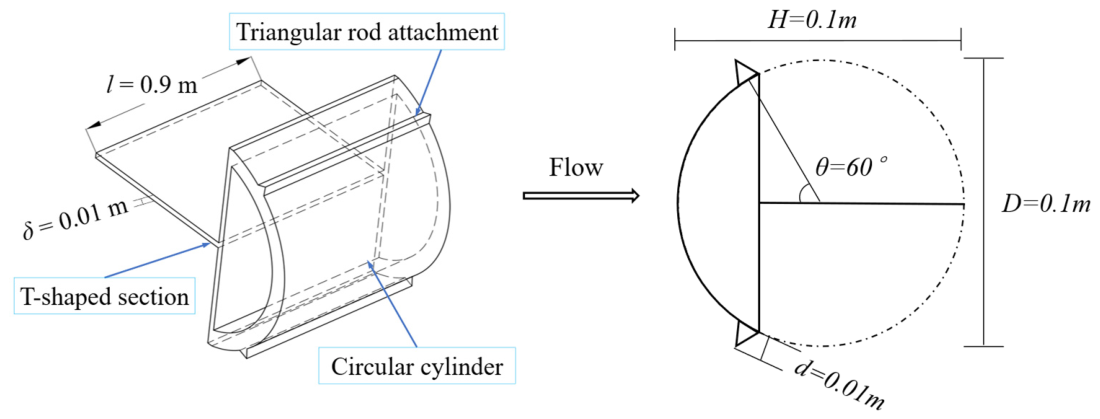
A composite oscillator comprising a circular cylinder integrated with a T-shaped section and equipped with two triangular rod attachments, hereafter referred to as the CTA oscillator, was investigated in this study, as shown in Figure 3. Previous studies [39] have reported that galloping of non-circular oscillators typically occurs when the reduced velocity exceeds a critical value of approximately 10. In the present experiments, the natural frequency of the system in air was controlled at fn, air ≈ 1 Hz, and the inflow velocity ranged from 0 to 1.8 m/s. On this basis, the characteristic width of the oscillator was set to D = 0.1 m. Moreover, Lian et al. [40] further reported that a height-to-width ratio of 1 yields stable oscillation and is favorable for energy harvesting; accordingly, the characteristic height was set to H = 0.1 m. In addition, because the test section was 1 m wide, the oscillator length was set to l = 0.9 m to minimize blockage and boundary effects, and end plates with a thickness of δ = 0.01 m were installed at both ends. Finally, following Hu et al. [41], two triangular attachments were added to the circular cylinder. Specifically, the protrusion thickness of each attachment was fixed at 10% of D (i.e., d ≈ 0.01 m), and the circumferential attachment angle was set to 60°.

2.2.3. Test Measurement

In the FIM power-generation experiments, the amplitude ratio A* (A* = A/D) was defined as the oscillation amplitude normalized by the characteristic width of the oscillator, where A was taken as the average amplitude over a 60 s record. For each energy-harvesting operating condition, data were recorded after the transient response had decayed and the oscillator had reached a steady state. A continuous 60 s record was then acquired using the same experimental apparatus, installation configuration, sensor settings, and data-processing procedure. The values reported for amplitude ratio, frequency ratio, active power, and energy conversion efficiency were obtained from this steady-state record. The frequency ratio f*(f* = fosc/fn, air) was determined from the dominant oscillation frequency identified from the displacement time-history using Fourier analysis, where fn, air denotes the natural frequency of the system in air. Oscillator displacement was measured using a hysteresis displacement sensor with a range of 0–800 mm, a sensitivity of 0.1%, and a full scale (FS) accuracy of ±0.05%. Electrical output was quantified via real-time load voltage acquired across the external load resistor; the voltage data acquisition system operates over a range of −10 to +10 V with an accuracy of ±0.1% FS. The force FT, derived from the measured torque, is an important parameter for lift calculation and is determined by FT = T/Rm, where T is measured by the torque sensor. The torque sensor had a range of 0–2 N·m and an accuracy of 0.5% FS, and the corresponding measurement range and accuracy is described in Table 1.
The uncertainties in the above parameters are mainly associated with instrument accuracy. The maximum uncertainties of A*, Pharn and FT are less than ±0.004, ±0.0026 W, and ±0.3333 N, respectively. To enable direct estimation of the fluid force during power generation, a torque sensor was incorporated into the experimental system.
Fluid-force characterization is essential for elucidating the oscillation mechanism. Previous studies have generally analyzed the lift force induced by the incoming flow based on classical resonance theory, whereas conventional fluid-force measurements have predominantly relied on indirect measurements using pulsating pressure sensors. Such methods may disturb the inflow characteristics and complicate the simultaneous evaluation of power generation performance. To address this issue, a torque sensor was integrated into the FIM power-generation apparatus to obtain direct lift-force data.
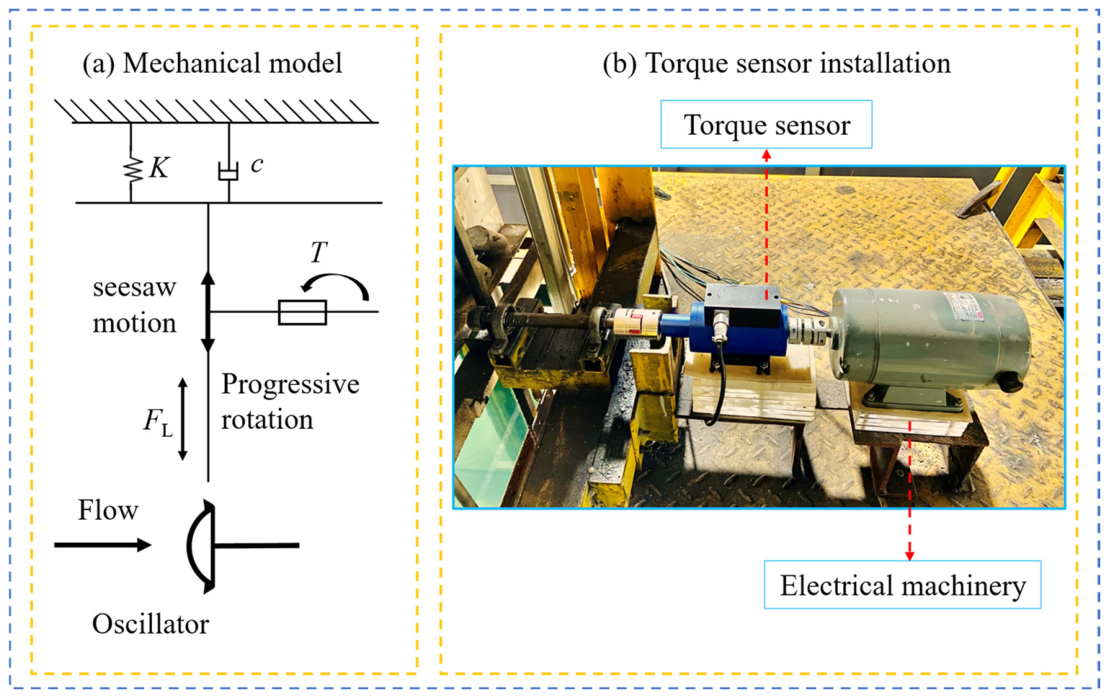
The installation arrangement and loading conditions of the torque sensor are shown in Figure 4. The HCNJ-103 torque sensor used in the present study was manufactured by Beijing Haibo Hua Technology Co., Ltd. (Beijing, China). For this sensor, the b-end serves as the measurement end, while the a-end serves as the auxiliary end connected to the tested equipment. In the present setup, the oscillating section, acting as the driving component, was connected to the b-end, whereas the generator, acting as the load component, was connected to the a-end.
A force analysis is performed on the isolated energy conversion section, and its motion can be approximately described by Equations (8) and (9):
( m osc + m a ) y ¨ + c y ˙ + K y = 1 2 ρ U 2 D l c L ( t ) T ( t ) R m
The lift coefficient can therefore be calculated from the measured data as follows:
c L ( t ) = 2 ( m osc + m a ) y ¨ + c y ˙ + K y + T ( t ) R m ρ U 2 D l
where T(t) is the torque at the end of the transmission section, Nm; Rm is the radius of the final gear of the transmission, m, which is 0.03 m in this system.
During the experiments, the electrical energy generated by the system was dissipated as heat through an external resistor. The active electrical power was therefore calculated from the real-time voltage across the external resistor using Equation (10), and the ECE was determined from Equation (11):
P harn = 1 T osc 0 T osc u 2 t R L d t
η harn   ( % ) = P harn P w × 100
where Tosc is the oscillation period, s; u(t) is the instantaneous voltage of the external load resistor, V; PW is the total power of the incoming flow, W; Amax is the maximum amplitude within the oscillation period, m.
The total power carried by the incoming flow can be partitioned into wake dissipation and the mechanical energy transferred to the oscillator. During power generation, part of this mechanical energy is converted into active power, while the remainder is dissipated by the mechanical damping of the system. Under an idealized condition in which the mechanical-damping loss could also be fully converted into useful electrical output, the upper-limit power PUL and the corresponding upper-limit efficiency ηUL can be obtained from Equations (12)–(14):
P mech = c y ˙ 2
P UL = P mech + P harn
η UL   ( % ) = P UL P w × 100
where Pmech is the mechanical damping power consumption of the system, W; PUL is the upper limit power generation capacity, W; ηharn is the upper limit power generation efficiency, %.

3. Validation of FIMECS

This section validates the reliability of the FIMECS before the response and energy-harvesting characteristics of the proposed oscillator are analyzed. First, free-decay tests were conducted to verify the implementation of variable damping and to examine the relationship between the total damping coefficient and the excitation voltage. Then, the fluid-force measurement and calculation method based on the torque sensor was evaluated by analyzing the oscillation response, lift-coefficient characteristics, frequency spectra, and wake-mode features. These validations provide the experimental basis for the subsequent investigation of the flow-induced response mechanism and energy-conversion performance of the CTA oscillator.

3.1. Implementation and Validation of Variable Damping

To validate the theoretical relationship between the total damping and the excitation voltage, free-decay tests of the FIMECS were conducted in air.
In these tests, the system stiffness was adjusted through a spring suspension and maintained at K = 1860 N/m, while the external load resistance was fixed at RL = 26 Ω. According to Equation (15), the system mass under different excitation voltages can be evaluated as follows:
f n ,   air = 1 2 π K m osc
where fn, air is the natural frequency of the system in air, Hz.
The damping ratio in air, ζair, and the total damping coefficient, Ctotal, were then calculated from Equations (16) and (17), respectively:
ζ air = ln η 2 π = 1 2 π ln A i A i + 1
C total = 2 m osc K ζ air
where ζair is the damping ratio of the system in air; Ai is the amplitude value of the i-th peak, m; Ai+1 is the amplitude value of the (i + 1)-th peak, m.
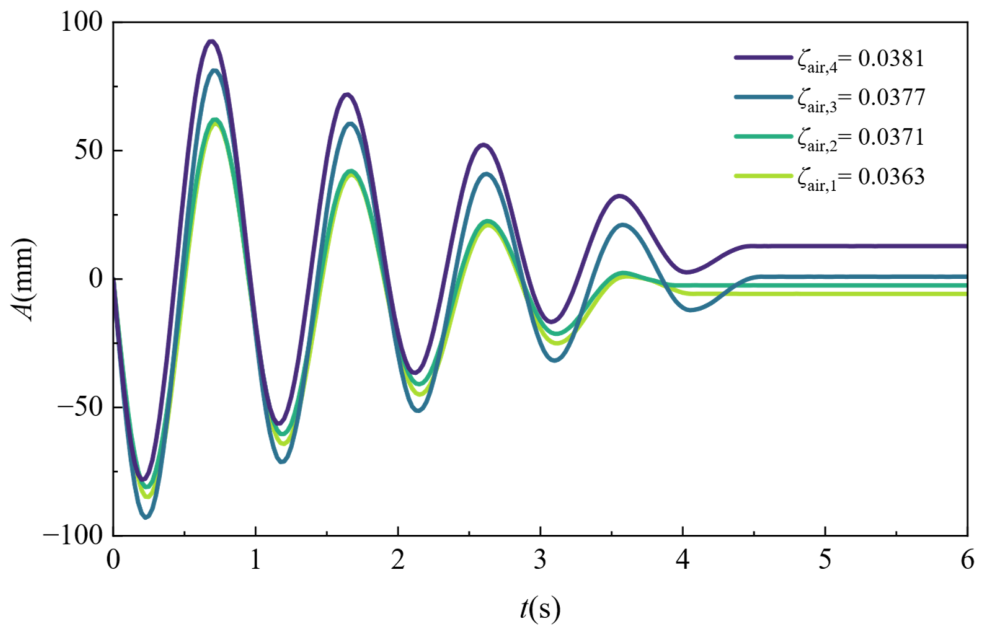
Each operating condition was subjected to four free-decay tests. Taking the generator open-circuit condition of the CTA oscillator (VB = 0 V) as an example, the damping ratios of the four free-decay tests were ζair,1 = 0.0363, ζair,2 = 0.0371, ζair,3 = 0.0377, and ζair,4 = 0.0381, as shown in Figure 5. The measured maximum relative error was 4.8%, which was within 5%, indicating that the experimental error was acceptable. The result was the average of the four tests.
To validate the validity of the theoretical model and physical model established in this study, the relationship between the total damping of the system and the excitation voltage was further investigated.
The free-decay test results of the CTA oscillator system in air are summarized in Table 2. Under different excitation voltages, the oscillating mass and natural frequency of the system remained nearly constant, with average values of mosc = 42.3 kg and fn, air = 1.05 Hz.
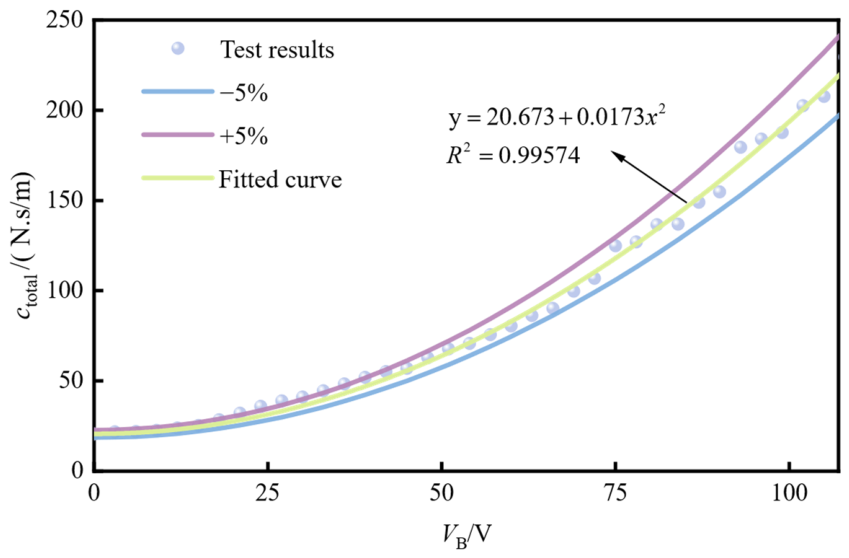
Figure 6 presents the experimental results and fitted curves of the total damping, ctotal, of the CTA oscillator system under different excitation voltages. The corresponding fitted expression is given in Equation (18):
c total - caculated = 20.673 + 0.0173 V B 2
The experimental results agree closely with the fitted results at all excitation voltages. The total damping, ctotal, exhibits a quadratic relationship with the excitation voltage, VB, which is consistent with Equation (2), indicating that the experimental setup and data acquisition in the present stage are reliable.

3.2. Validation of Fluid Measurement Calculation Methods

To further interpret the vortex-related characteristics of the CTA oscillator, fast Fourier transform (FFT) analysis was applied to the measured displacement and torque-derived lift-force time histories. The resulting spectra provide frequency-domain information on the structural response and hydrodynamic excitation. Previous studies have reported associations between the fundamental and higher-order harmonic components and characteristic vortex-shedding modes [42,43,44]. Accordingly, these spectral features are used in the present study to infer possible wake-pattern transitions.
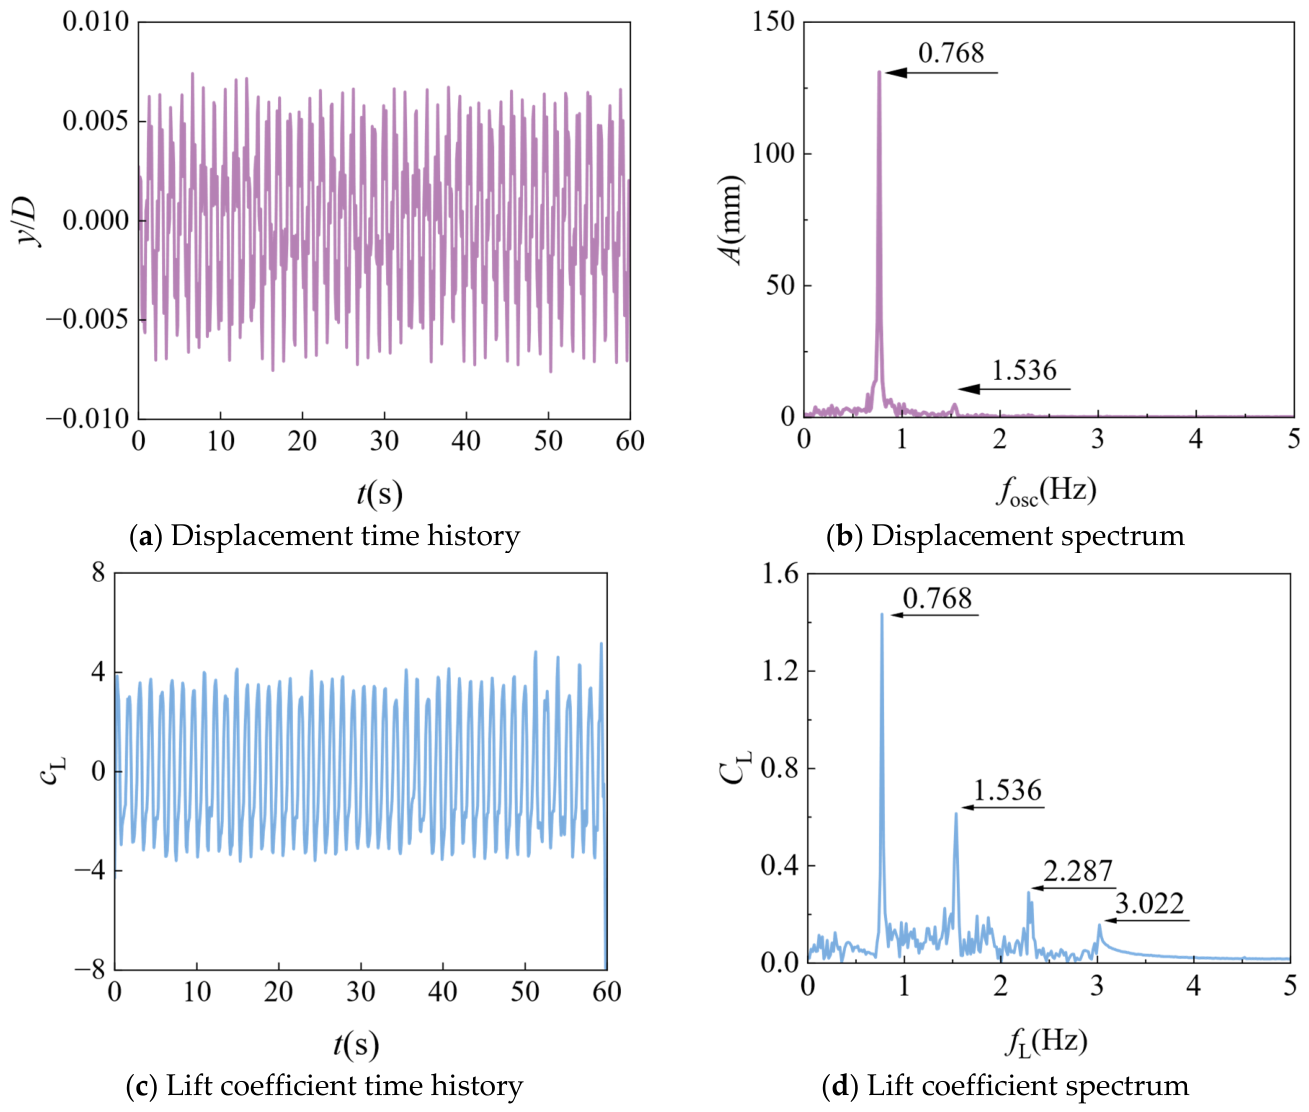
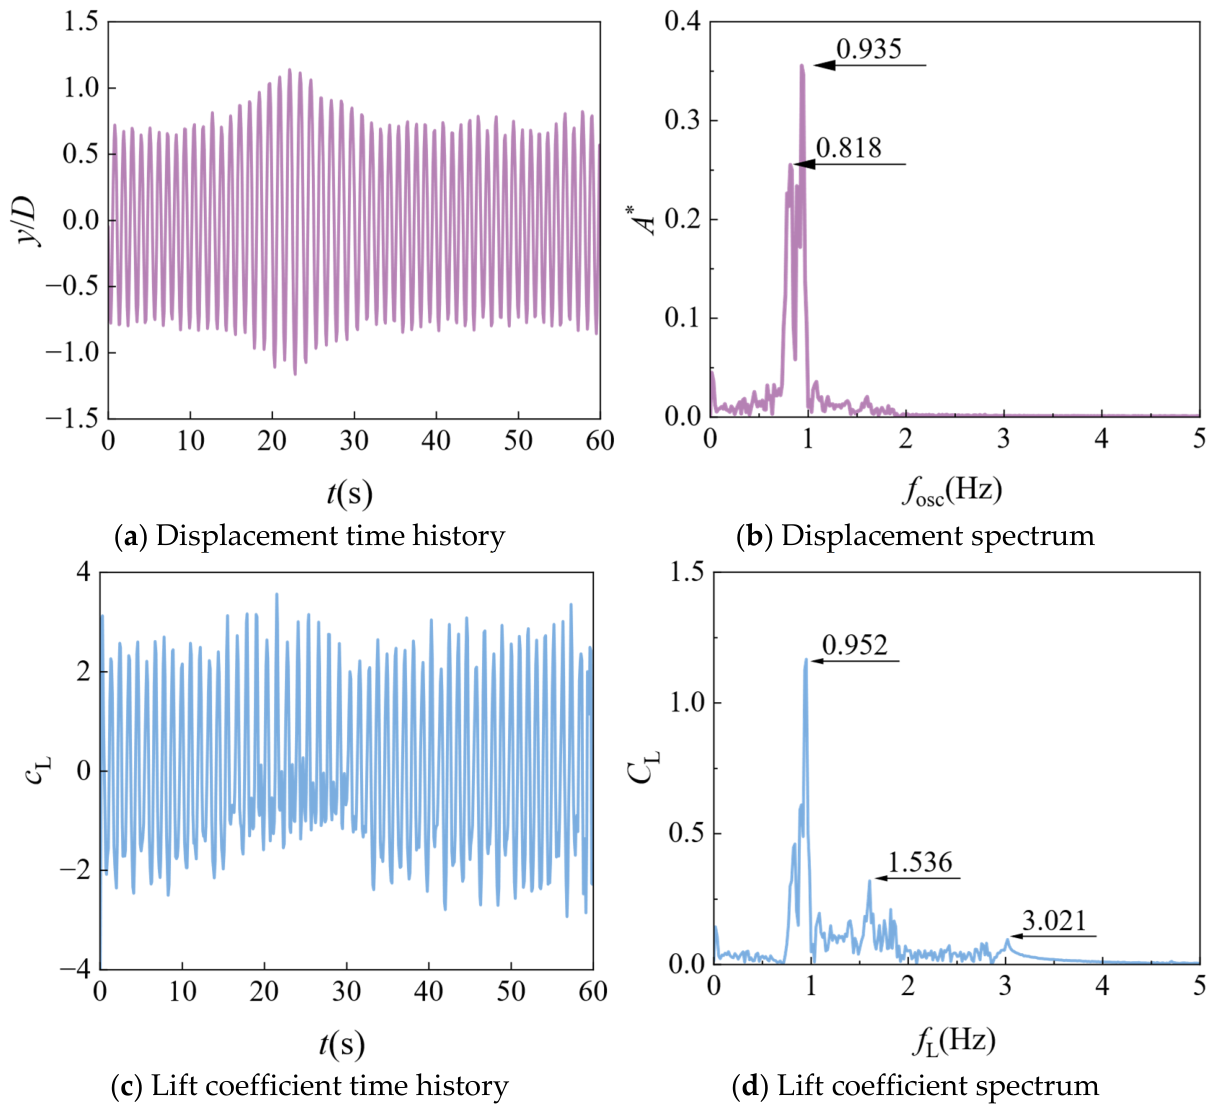
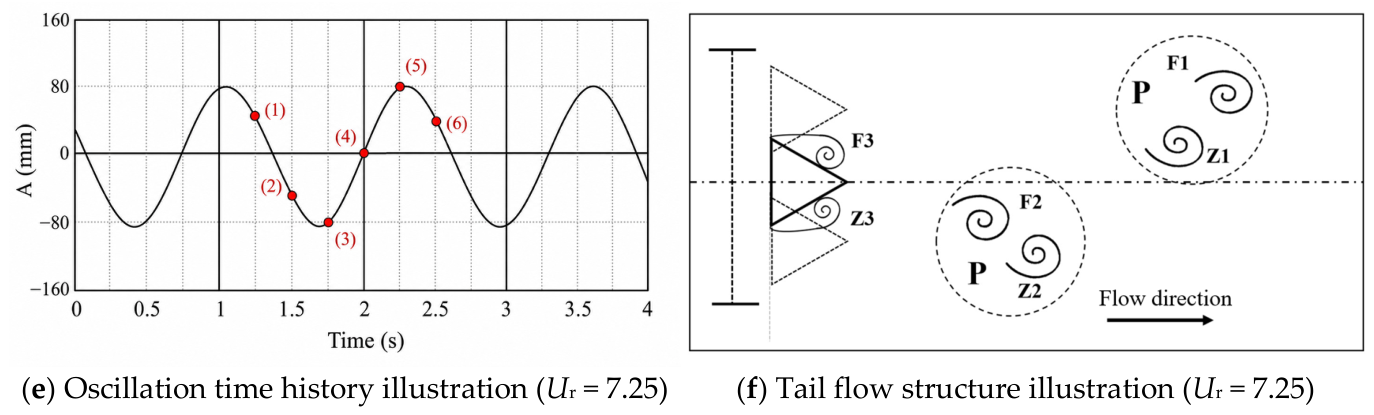
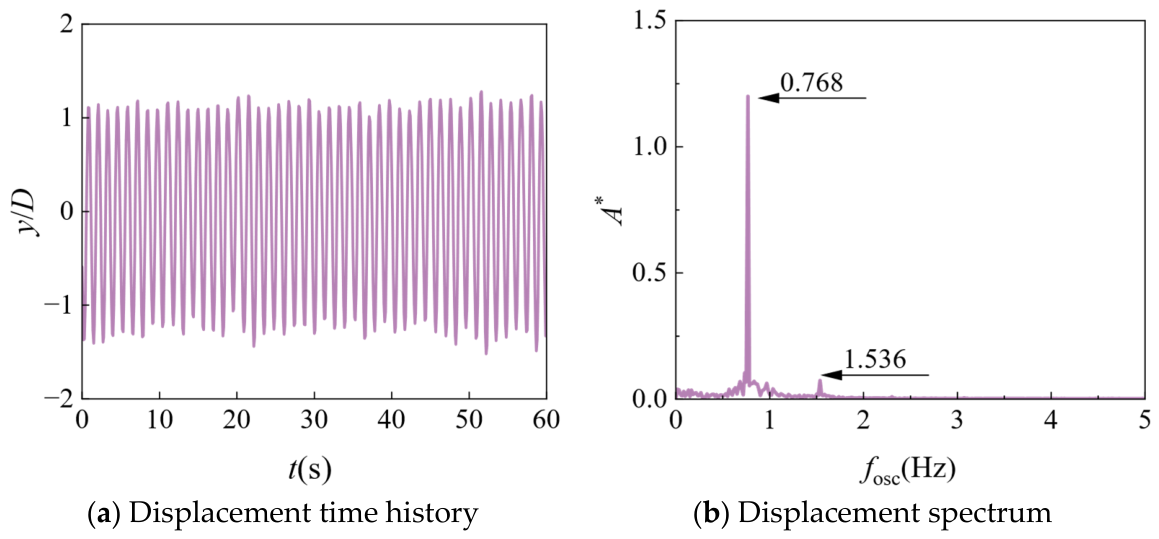
To assess the validity of the proposed fluid-force measurement method, the oscillation response and lift lock-in characteristics of the CTA oscillator system were analyzed at ζtotal = 0.039 and Ur = 8.55. Under this condition, the response is critical as it sits near the transition boundary between the VIV branch and galloping. As shown in Figure 7a,c, the CTA oscillator exhibited regular periodic motion, and both the displacement and fluid force varied approximately sinusoidally with time histories. This is consistent with the classical simple harmonic motion described in the theoretical analysis [36], providing an initial verification of the measurement principle.
Stronger validation was achieved through spectral analysis, as shown in Figure 7b,d. A key indicator of the measurement method’s accuracy is the capture of non-linear hydrodynamic characteristics. As expected for a second-order mass-damping system, the displacement spectrum acts as a band-pass filter, exhibiting two dominant peaks primarily at the fundamental frequency fosc = 0.768 Hz and fosc = 1.536 Hz. In contrast, the fluid force spectrum derived from the torque sensor revealed richer frequency content, exhibiting four dominant peaks at fL = 0.768, 1.536, 2.287, and 3.022 Hz. The presence of these distinct higher-order harmonics in the lift spectrum, which are physically consistent with the non-linear vortex shedding forces but filtered out in the structural displacement, demonstrates that the torque-based method accurately captures the instantaneous fluid dynamics rather than just the structural response.
Furthermore, the quantitative relationship between the spectral peaks and the wake structure confirms the method’s validity. Comparison of the lift coefficient spectrum of the CTA oscillator with the wake-structure analysis of VIV for a single triangular prism reported by Shao Nan [45] indicates that the fundamental frequency fL = 0.768 corresponds to the vortex shedding frequency. According to the estimation method proposed by Raghavan et al. [43], the wake at this stage corresponds to the 2P mode. Consistent with the wake structure observed in the VIV branch (Ur = 7.25) by Shao Nan (Figure 7e,f), two pairs of counter-rotating vortices are generated near the oscillator within one oscillation cycle as the oscillator moves upward and downward [46]. The consistency between the measured spectral harmonics and the wake characteristics reported in previous studies provides further supporting evidence for the validity of the proposed fluid-force measurement method.

4. Oscillation Response and Power Generation Characteristics

This section investigates the oscillation response and power-generation characteristics of the CTA oscillator under different reduced velocities and total damping ratios. The analysis first focuses on the evolution of the response branches, including VIV, the transition from VIV to galloping, SG, and HG, by examining the amplitude ratio, frequency ratio, and lift-force characteristics. Subsequently, time-history and frequency-spectrum analyses are performed to further clarify the lock-in behavior, harmonic components, and wake-mode features associated with different response regimes. Finally, the active power and ECE are evaluated to identify the optimal energy-harvesting branch and compare the performance of the proposed oscillator with that of a conventional triangular prism oscillator.

4.1. Oscillation Response

The oscillation response of the CTA oscillator was analyzed to clarify the effects of reduced velocity and total damping ratio on the response-branch evolution. In this section, the amplitude ratio and frequency ratio are first examined to identify the transition among VIV, VIV–galloping interaction, SG, and HG. The fluid-force characteristics are then evaluated using the maximum lift coefficient to further reveal the hydrodynamic mechanism governing different response regimes. This analysis provides the basis for interpreting the subsequent time-frequency behavior and energy-harvesting performance of the oscillator.

4.1.1. Amplitude and Frequency

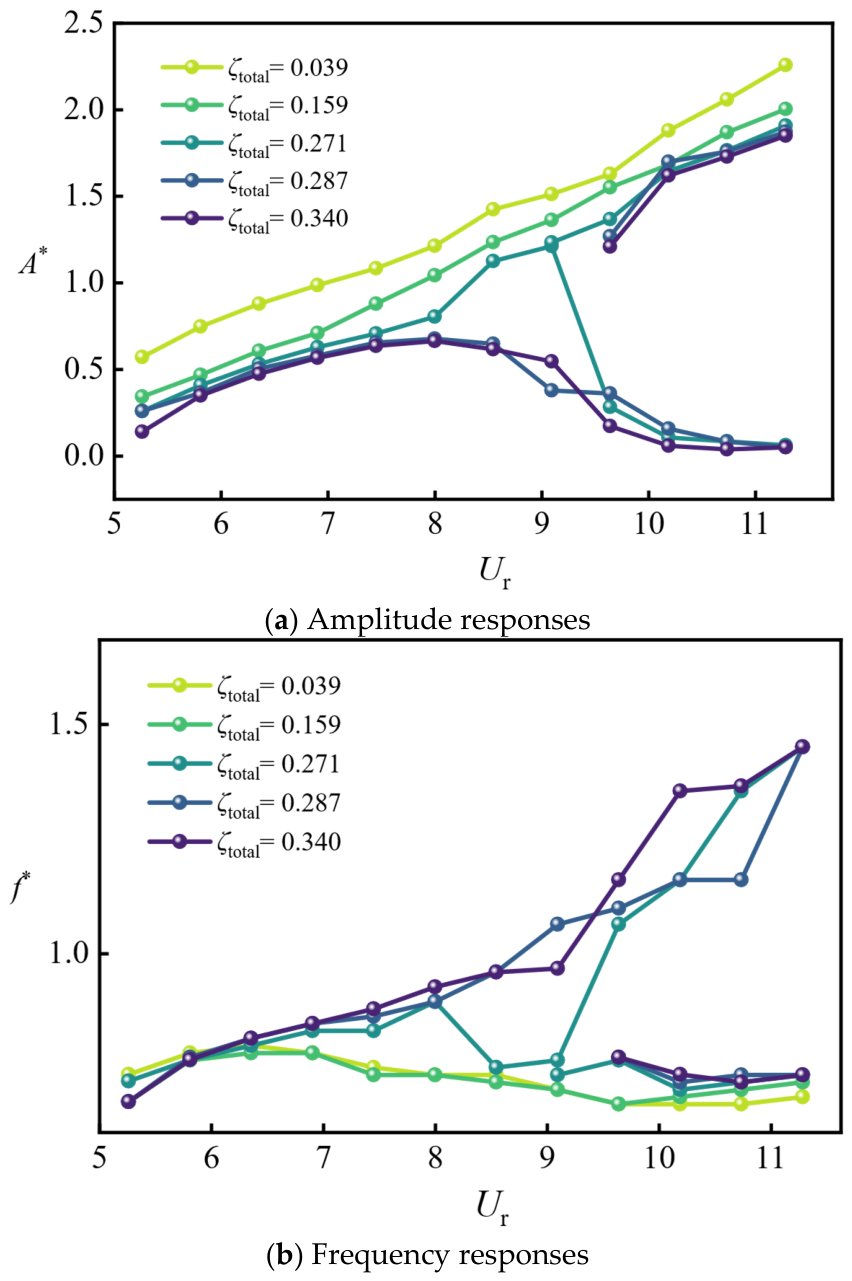
As shown in Figure 8, the oscillation mode of the CTA oscillator transitions from SG to HG as the excitation voltage increases.
When the total damping ratio satisfies 0.039 ≤ ζtotal < 0.271, corresponding to a total damping range of 21.807 N·s·m−1ctotal < 148.967 N·s·m−1, the oscillator exhibits the SG response mode. In the absence of external excitation, the oscillation response evolves successively from the initial branch of VIV to the transition branch between VIV and galloping, and finally to the galloping branch, as the reduced velocity increases. Oscillation starts at Ur = 5.26. With further increase in Ur, the amplitude ratio, maximum lift coefficient, and frequency ratio all increase, although the oscillation intensity remains relatively low. At this stage, the oscillator is in the initial branch of VIV, where the response is primarily induced by lift forces associated with vortex shedding. As Ur increases further, the amplitude ratio gradually rises to approximately 0.9, while the frequency ratio stabilizes around 0.8, indicating that the oscillator has entered the upper branch of VIV and that the response begins to evolve toward galloping. With a further increase in reduced velocity, the amplitude ratio continues to grow, whereas the frequency ratio shows a slight decrease. The oscillator then enters the transition branch from VIV to galloping. With a further increase in the reduced velocity, the amplitude ratio continues to increase monotonically, while the frequency ratio tends to stabilize again at approximately 0.7.
Furthermore, as the total damping ratio increases, the transition branch from VIV to galloping narrows from 6.36 < Ur < 9.64 to 8.00 < Ur < 8.55. Correspondingly, the amplitude ratio decreases from 0.88 < A* < 1.63 to 0.81 < A* < 1.13, while the frequency ratio changes from 0.67 < f* < 0.82 to 0.75 < f* < 0.93, indicating that the ability of the oscillator to self-excite into galloping is weakened. Within the experimental range considered in this study, the maximum amplitude ratio of the CTA oscillator is A* = 2.43, which occurs at Ur = 11.28 and ζtotal = 0.039.
When the total damping ratio is within 0.271 ≤ ζtotal ≤ 0.340, corresponding to 148.967 N·s·m−1ctotal ≤ 187.733 N·s·m−1, the oscillator exhibits the HG response mode. Without external excitation, the response remains entirely in the VIV branch. Once the reduced velocity exceeds a critical threshold, external excitation is able to drive the system back to the upper branch. A critical galloping condition is observed at ζtotal = 0.271, for which the corresponding critical reduced velocity is Ur = 9.09. With increasing total damping ratio, the critical reduced velocity increases from Ur = 9.09 to Ur = 9.64, indicating that the ability of the system to evolve from VIV to galloping under external excitation becomes progressively weaker. When ζtotal exceeds 0.340, however, external excitation is no longer sufficient to restore the system to the upper branch.

4.1.2. Fluid Forces

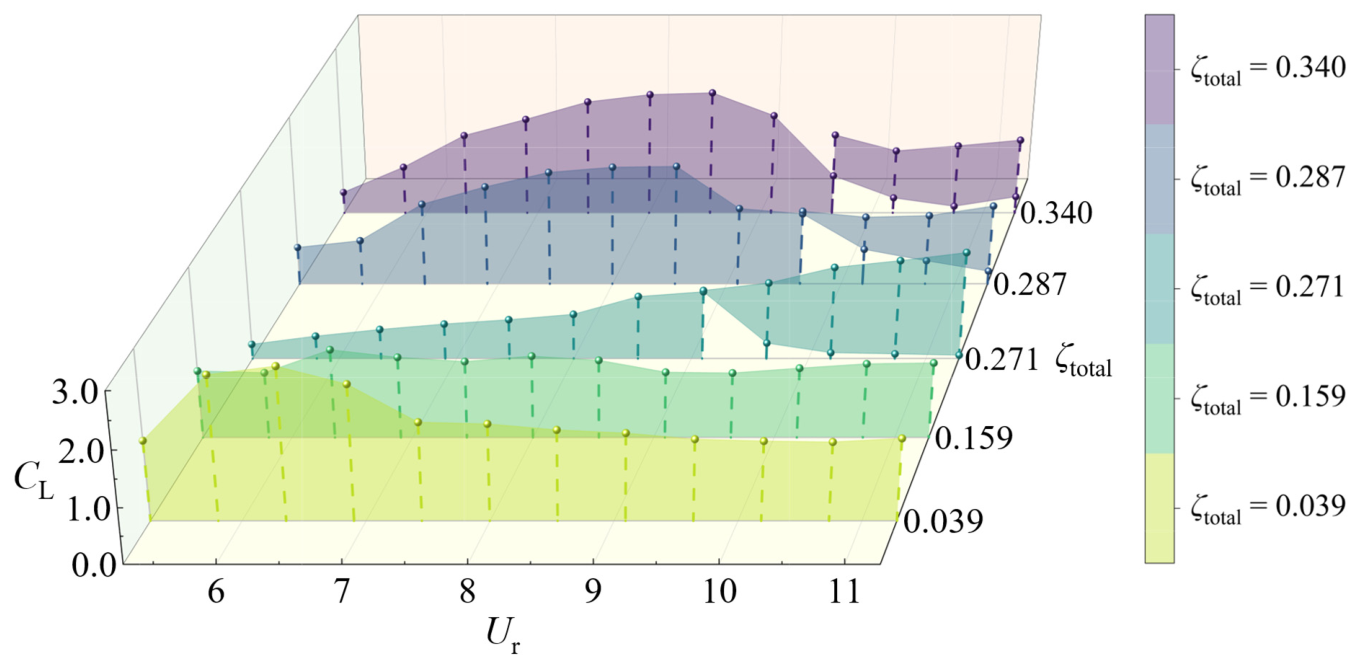
The fluid forces induced by the oncoming flow have a pronounced influence on the oscillation modes. Accordingly, the fluid-force characteristics of the CTA oscillator system were analyzed, as shown in Figure 9, and the main features are discussed below.
When 0.039 ≤ ζtotal < 0.271, the oscillator exhibits the SG response mode. The response first appears in the initial branch of VIV and then develops into the upper VIV branch. In this stage, the oscillation is primarily driven by the alternating lift forces induced by vortex shedding, and the maximum lift coefficient increases with increasing reduced velocity. Once the response enters the upper VIV branch, however, the maximum lift coefficient tends to stabilize, and the oscillation frequency locks in with the lift-force frequency associated with vortex shedding.
However, with a further increase in reduced velocity, the response enters the transition branch from VIV to galloping. In this stage, the oscillator may be subjected to the combined effects of vortex-shedding-induced lift and lift instability. As the reduced velocity increases, the contribution of vortex-induced lift gradually weakens, and the maximum lift coefficient exhibits a decreasing trend. With a further increase in reduced velocity, the response enters the stable galloping branch, where the oscillation is dominated primarily by lift instability. At this stage, the maximum lift coefficient tends to stabilize. This may be attributed to the synchronization between the oscillatory lift induced by shear-layer motion after boundary-layer separation and the oscillator motion, which becomes the primary driving mechanism for galloping. Meanwhile, with increasing system damping, the maximum lift coefficient in the VIV branch decreases from 1.42 < CL < 2.70 to 0.26 < CL < 0.81. In the transition branch from VIV to galloping, it changes from 1.45 < CL < 2.70 to 0.81 < CL < 1.13. In the galloping branch, the maximum lift coefficient decreases from 1.43 to approximately 1.32.
Subsequently, when 0.271 < ζtotal ≤ 0.340, the oscillator exhibits the HG response mode. With increasing reduced velocity, the response successively enters the initial and upper branches of VIV, and the corresponding lift-force characteristics are similar to those in the SG response mode. However, as the reduced velocity increases further and the response enters the lower VIV branch, the oscillator is unable to sustain stable vortex shedding and therefore cannot maintain stable oscillation, causing the maximum lift coefficient to approach zero.
Finally, particular attention should be paid to the transition branch from VIV to galloping. In this branch, the variation in the maximum lift coefficient with the angle of attack may reflect changes in the effective lift characteristics of the oscillator. Based on the behavior commonly reported for non-circular bluff bodies, the initial increase in the maximum lift coefficient may be associated with an attached or partially attached boundary layer, whereas the subsequent decrease may indicate changes in flow separation and the effective lift slope after a critical angle of attack is exceeded. Such changes may contribute to the development of lift instability and the transition toward the galloping branch.
The onset of galloping can be interpreted using the quasi-steady Den Hartog [47] instability criterion. For a bluff body undergoing transverse oscillation, the galloping stability function can be expressed as:
H α = d C l α c d α c + C d α c α c = α < 0
where Cl and Cd are the lift and drag coefficients, respectively. α is the instantaneous effective angle of attack. αc denotes the equilibrium angle. Galloping instability may occur when H(α) < 0, which indicates that the negative slope of the lift coefficient is sufficiently large to overcome the stabilizing contribution of drag and produce negative fluid-induced damping.
The T-shaped section and triangular attachments introduce sharp geometric features and surface discontinuities that may modify the boundary-layer separation position, wake evolution, and angle-dependent transverse hydrodynamic force. These geometric effects may cause H(α) to become negative for the Den Hartog instability condition to be approached or satisfied. Consequently, the hydrodynamic force may supply net positive energy to the oscillator over an oscillation cycle, thereby facilitating the transition from vortex-induced vibration to a stable, large-amplitude galloping response over a broader reduced-velocity range.
The resulting increases in oscillation amplitude and frequency enhance the relative motion within the generator, leading to a higher induced voltage and greater time-averaged active power. The increased harvested power subsequently contributes to the improvement in energy conversion efficiency. These results suggest that the CTA geometry enhances the coupling between the hydrodynamic response and the electromechanical conversion system.

4.2. Time–Frequency Curve and Spectrum

Under a total damping ratio of ζtotal = 0.039, the CTA oscillator exhibits a synchronous galloping (SG) response mode. Across the tested reduced velocities, both displacement and lift coefficient time histories displayed regular periodic oscillations. Specifically, at Ur = 5.81, 8.00, and 11.28, the peak-to-peak displacement amplitudes reached 10.32 mm, 53.3 mm, and 40.6 mm, respectively. Despite these amplitude variations, the cycle-to-cycle consistency remained high, confirming the inherent stability of the SG response. Conversely, when ζtotal was increased to 0.271, the system tended toward a hybrid galloping (HG) response mode. In this regime, the oscillation becomes highly irregular within the lower VIV branch; however, once external excitation drives the system into the galloping branch, stable limit-cycle oscillations are re-established.
(1)
SG response (ζtotal = 0.039)
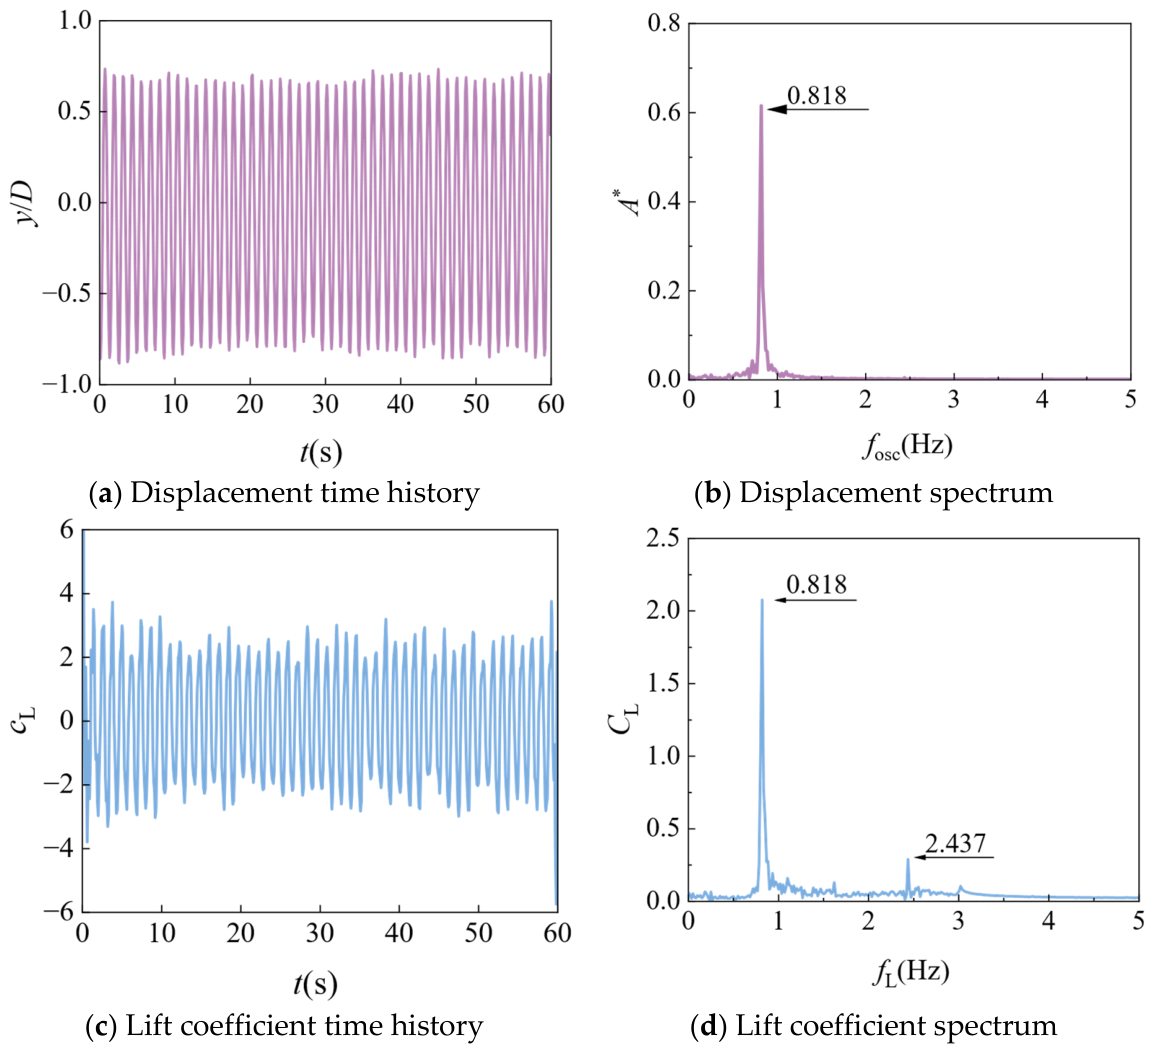
As shown in Figure 10, when Ur = 5.81, the response was in the initial branch of VIV, and the oscillation was primarily driven by the periodic lift force induced by vortex shedding from the oscillator. In the displacement spectrum, a dominant peak appeared at the oscillation frequency, fosc = 0.818 Hz. Similarly, the lift spectrum exhibited a dominant peak at the lift frequency, fL = 0.818 Hz, together with a smaller peak at a higher-order harmonic, fL = 2.437 Hz. According to the spectrum-based criterion reported by Raghavan et al. [43] and the corresponding flow-visualization observations in previous studies, the dominance of the fundamental component is consistent with a possible 2S vortex-shedding mode. In this mode, two counter-rotating vortices are shed from the upper and lower sides of the oscillator during one oscillation cycle as the oscillator moves upward and downward.
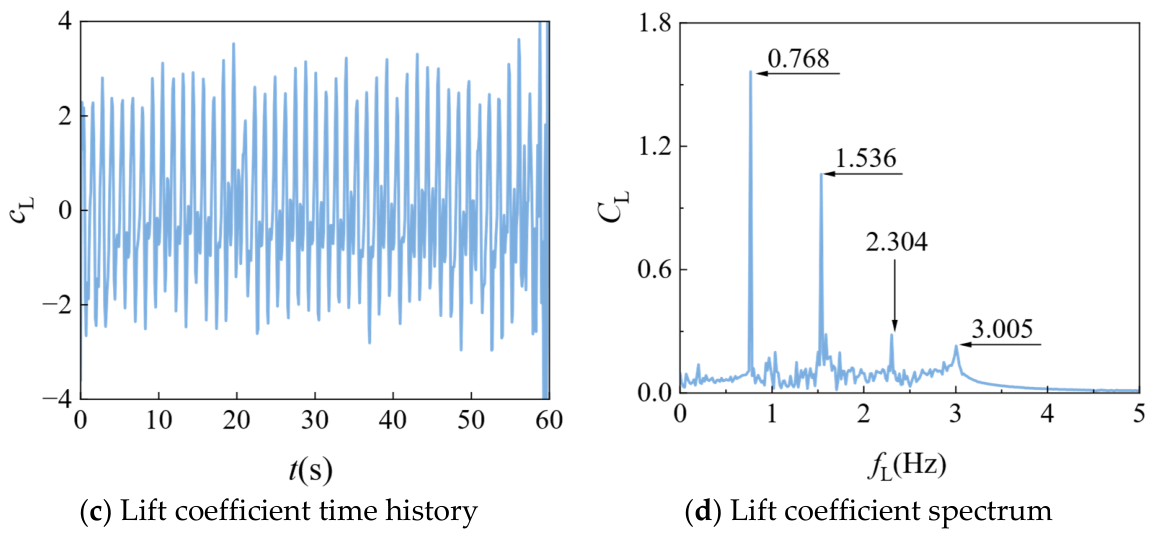
As shown in Figure 11, when Ur = 8.00, the displacement spectrum exhibited two peaks at the fundamental and second harmonic components of the oscillation frequency, with fosc = 0.768 and 1.536 Hz, respectively. This may be attributed to the fact that the oscillator is undergoing the transition from VIV to galloping, while still remaining in the VIV branch. At the same time, the lift-force spectrum showed four dominant peaks at fL = 0.768, 1.536, 2.304, and 3.005 Hz. Based on the spectral characteristics reported by Raghavan et al. [43], this response is consistent with a possible 2P vortex-shedding pattern, in which two pairs of vortices are shed from the oscillator during one oscillation cycle.
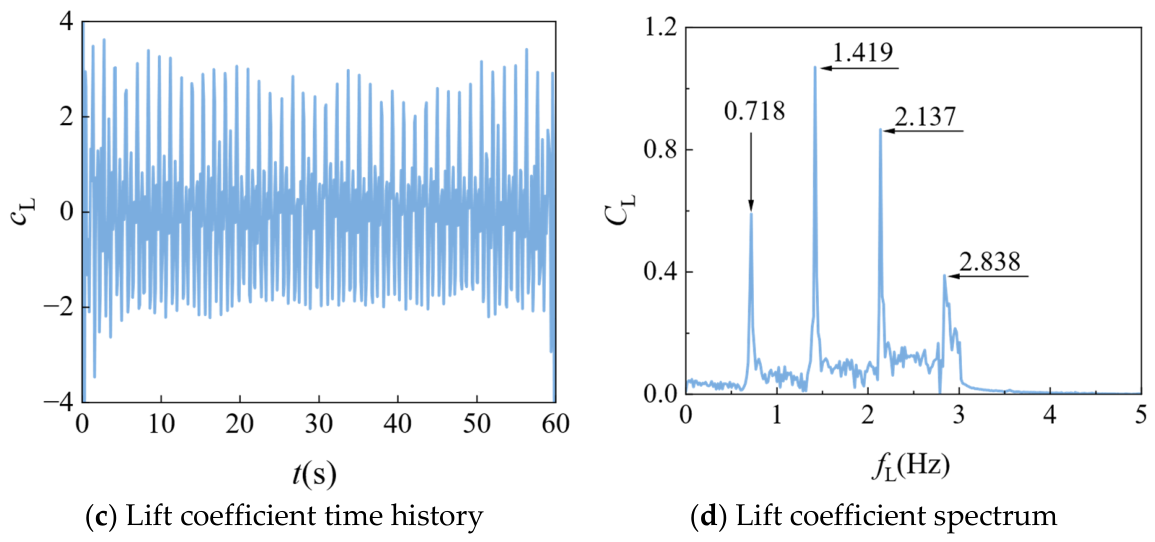
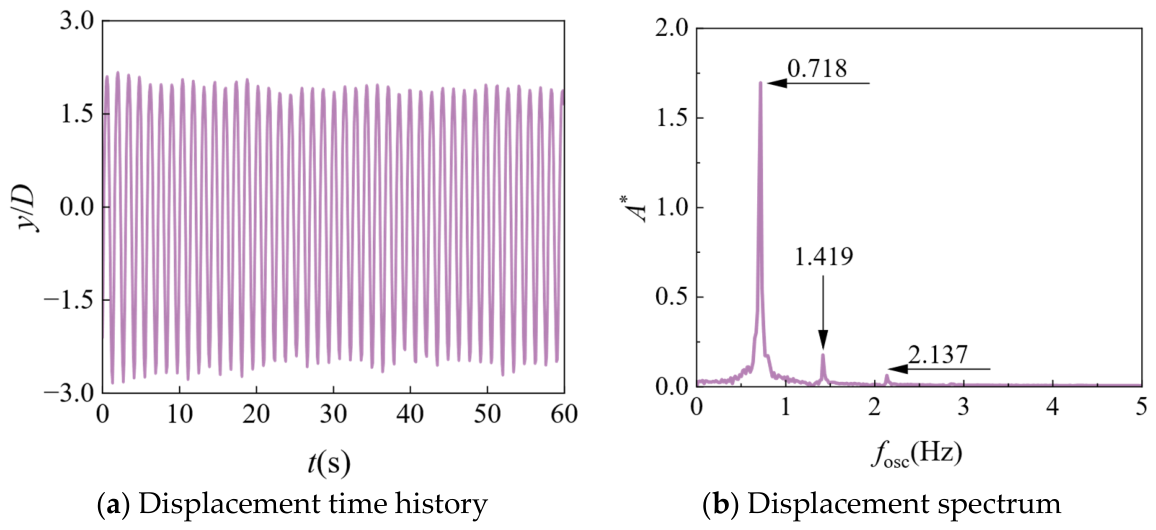
As shown in Figure 12, when the reduced velocity reached Ur = 11.28, the response entered the galloping branch. In the displacement spectrum, distinct peaks appeared at the first, second, and third harmonic components of the oscillation frequency (fosc = 0.718, 1.419 and 2.137 Hz). Meanwhile, the lift-force spectrum exhibited clear peaks at the first, second, third, and fourth harmonic components of the lift frequency (fL = 0.718, 1.419, 2.137 and 2.838 Hz). Once the response enters the galloping branch, the oscillation appears to be no longer dominated by the alternating lift associated with vortex shedding. Instead, these spectral characteristics may be associated with the development of lift instability and negative hydrodynamic damping, as commonly reported for the galloping responses of non-circular bluff bodies [23,26]. At this stage, the wake vortex field becomes highly complex. Although the wake vortices become highly unstable, the shear-layer motion remains synchronized with the unstable oscillation. Consequently, as long as the incoming flow is not suppressed, the oscillation can be continuously sustained in the galloping branch, with its amplitude increasing monotonically.
(2)
HG response (ζtotal = 0.271)
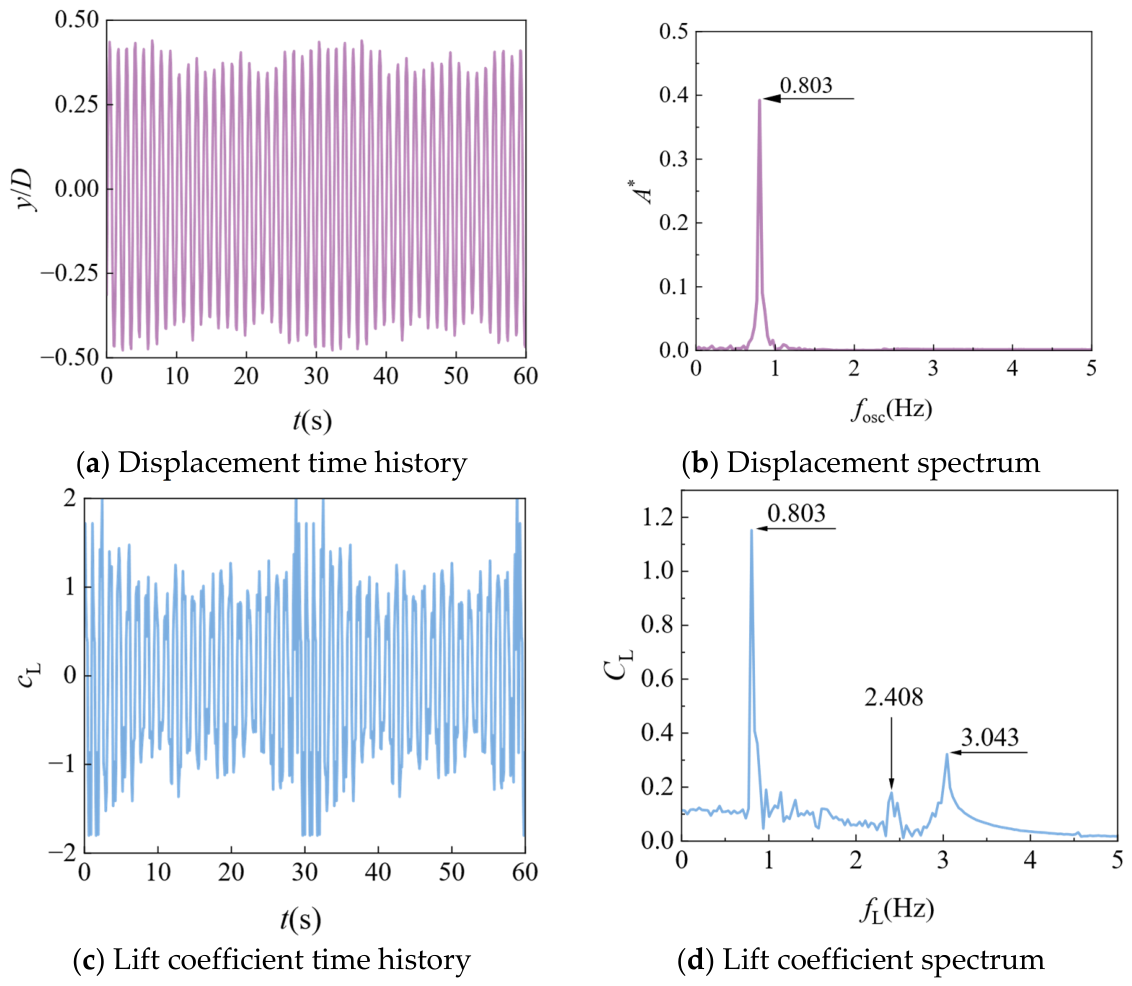
As illustrated in Figure 13, at Ur = 5.81, the response operated within the initial VIV branch, exhibiting spectral signatures highly consistent with those of the SG mode. Specifically, the displacement spectrum was dominated by a single peak at fosc = 0.803 Hz. According to previously reported spectrum-based criteria and flow-visualization observations, the dominance of this fundamental peak is consistent with a possible 2S vortex-shedding mode. In parallel, the lift-force spectrum mirrors this behavior, exhibiting a dominant peak at fL = 0.803 Hz while concurrently revealing two secondary peaks at higher harmonics (fL = 2.408 and 3.043 Hz).
As shown in Figure 14, a notable feature was observed when Ur = 8.00: two dominant peaks appeared in the displacement spectrum at fosc = 0.818 and 0.935 Hz. This may be attributed to the transition of the oscillator from VIV to galloping, during which the response is governed by the combined effects of vortex-shedding-induced lift and lift instability. At this stage, four dominant peaks were observed in the lift-force spectrum at fL = 1.536, 2.304, and 3.005 Hz. Once the response no longer remains in the pure VIV branch, Raghavan’s estimation method may no longer be directly applicable.
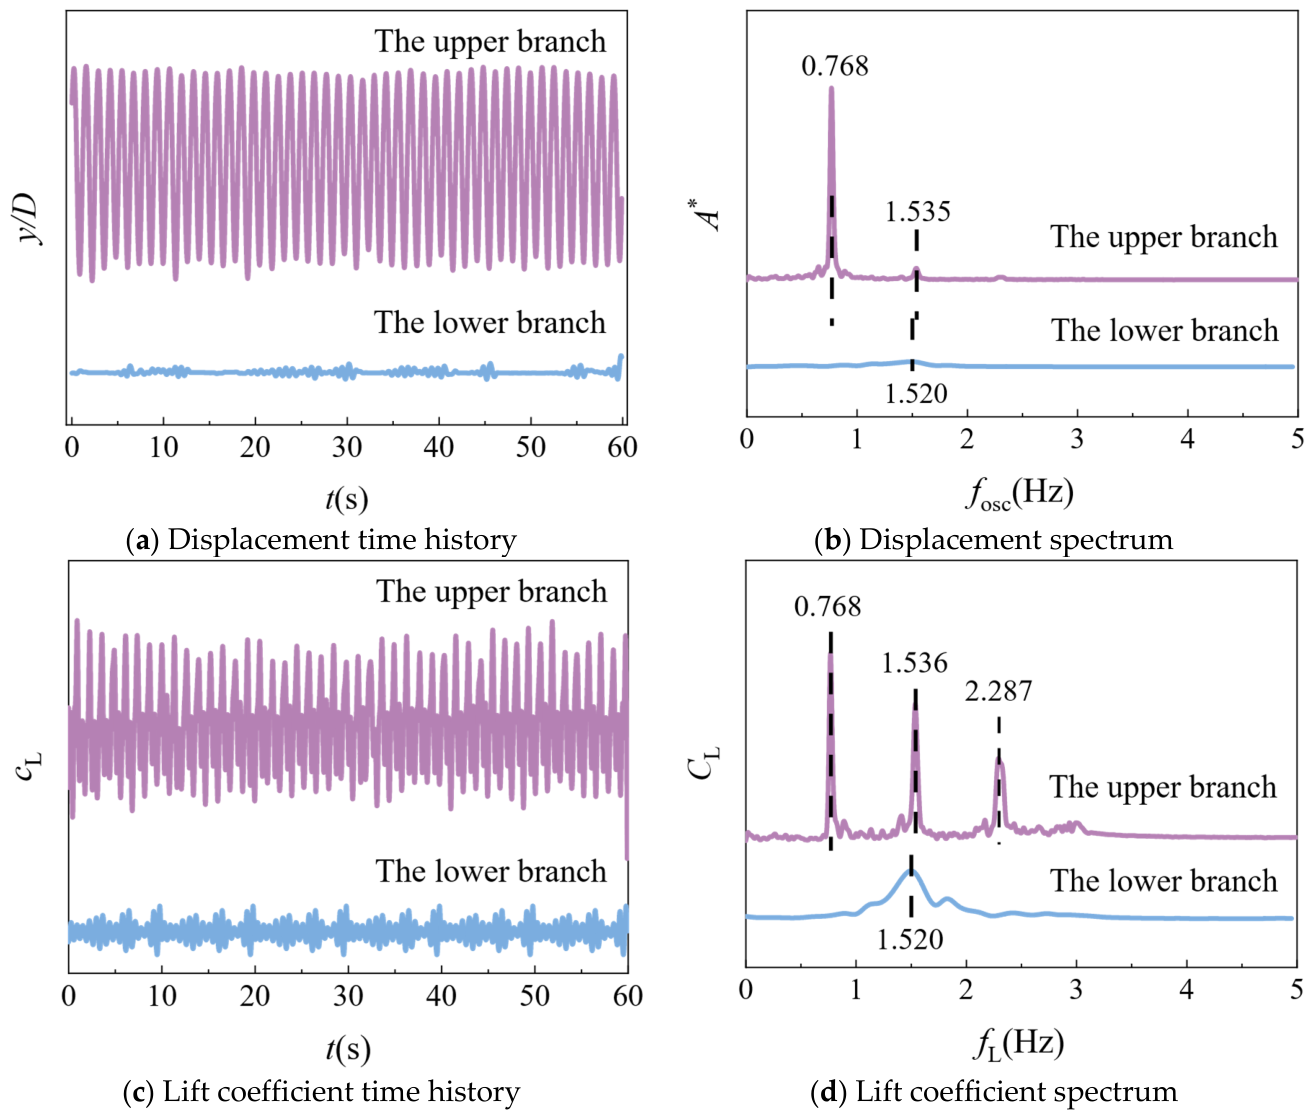
As shown in Figure 15, when Ur = 11.28, both the displacement and lift time histories were highly unstable. As the influence of differences among the various resonant frequency components on the vortex-shedding frequency becomes more pronounced, the response enters the lower branch of VIV. In this branch, almost no distinct peak could be identified in the displacement spectrum, and the peaks in the lift-force spectrum were also not pronounced. However, when appropriate external excitation is applied to the oscillator, the response shifts into the galloping branch and regains stability. At this stage, the displacement spectrum exhibited a distinct peak at fosc = 0.768 Hz, while the lift-force spectrum showed three dominant peaks at fL = 0.768, 1.536, and 2.287 Hz.
In addition, compared with the lift-force spectrum, the influence of higher-order harmonic components was less pronounced in the displacement spectrum. Regardless of whether the vortex-shedding mode is 2S or 2P, a lock-in relationship exists between the oscillation-frequency components and the lift-frequency components. Furthermore, with increasing oscillation amplitude, the number of vortices shed during each cycle increases, leading to more complex vortex-shedding patterns.

4.3. Energy Harvesting Performance

Active power and ECE are key metrics for evaluating the performance of the FIMECS. Based on the voltage measured in real-time across the external load, the instantaneous electrical power was first calculated, and the corresponding time-averaged active power (Pharn) and ECE (ηharn) were subsequently determined using Equations (20)–(23).
P harn = 1 T osc 0 T osc u 2 t R L d t
A proj = ( 2 A max + D ) l
P w = 1 2 ρ A proj U 3
η h a r n   ( % ) = P h a r n P w × 100
where Tosc is the oscillation period, s; u(t) is the instantaneous voltage collected, V; Aproj is the swept projected area normal to the incoming flow, m2; Amax is the maximum amplitude within the oscillation period, m; l is the spanwise length of the oscillator, m; Pw is the total power of the incoming flow, W; ρ is the fluid density; U is the incoming-flow velocity.
The ECE, (ηharn) is defined as the ratio of the active power, Pharn, to the available kinetic power of the incoming flow, PW. The available fluid power is calculated based on the projected frontal area normal to the incoming flow, Aproj. This definition of the reference area is consistent with the commonly adopted approach in flow-induced motion energy-harvesting studies. It represents the effective region of fluid momentum exchange and facilitates comparison with existing data for bluff-body oscillators.

4.3.1. Active Power

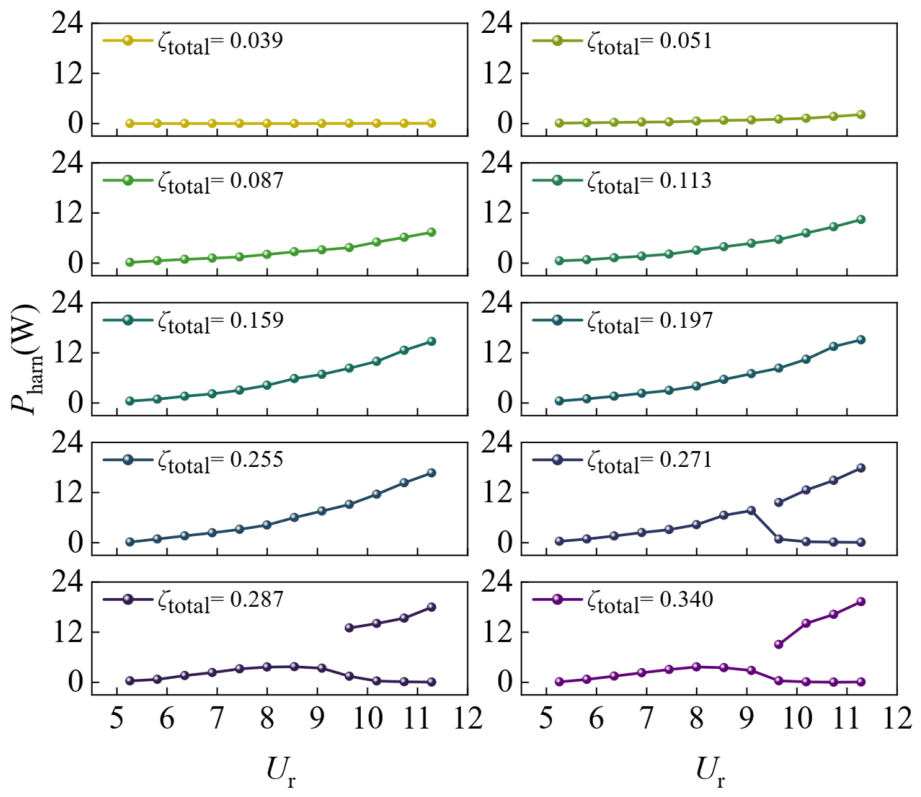
Figure 16 shows the variation of active power with reduced velocity at different system damping ratios. Once the oscillator starts to oscillate, the system begins to generate electrical power. For all damping-ratio conditions, the active power remains low in the VIV regime at relatively low reduced velocities, particularly in the initial VIV branch, where it is close to zero. However, once the response transitions into the galloping branch, the active power increases markedly.
Notably, when 0.039 ≤ ζtotal ≤ 0.271, the oscillator exhibits a soft-galloping response trend, and no lower VIV branch is observed. Over the entire experimental range, the active power shows a continuous upward trend with increasing reduced velocity. When 0.271 ≤ ζtotal ≤ 0.340, the response enters the lower VIV branch at higher reduced velocities and can then transition into the galloping branch under external excitation. In the galloping branch, the active power increases markedly with increasing system damping ratio. This is attributed to the fact that, as indicated by Equation (2), the active power is proportional to the square of the excitation voltage, and the system damping increases as the excitation voltage is raised. Within the experimental range considered in this study, the maximum active power of the CTA oscillator was Pharn = 19.3 W, occurring at ζtotal = 0.340 and Ur = 11.28.

4.3.2. Energy Conversion Efficiency

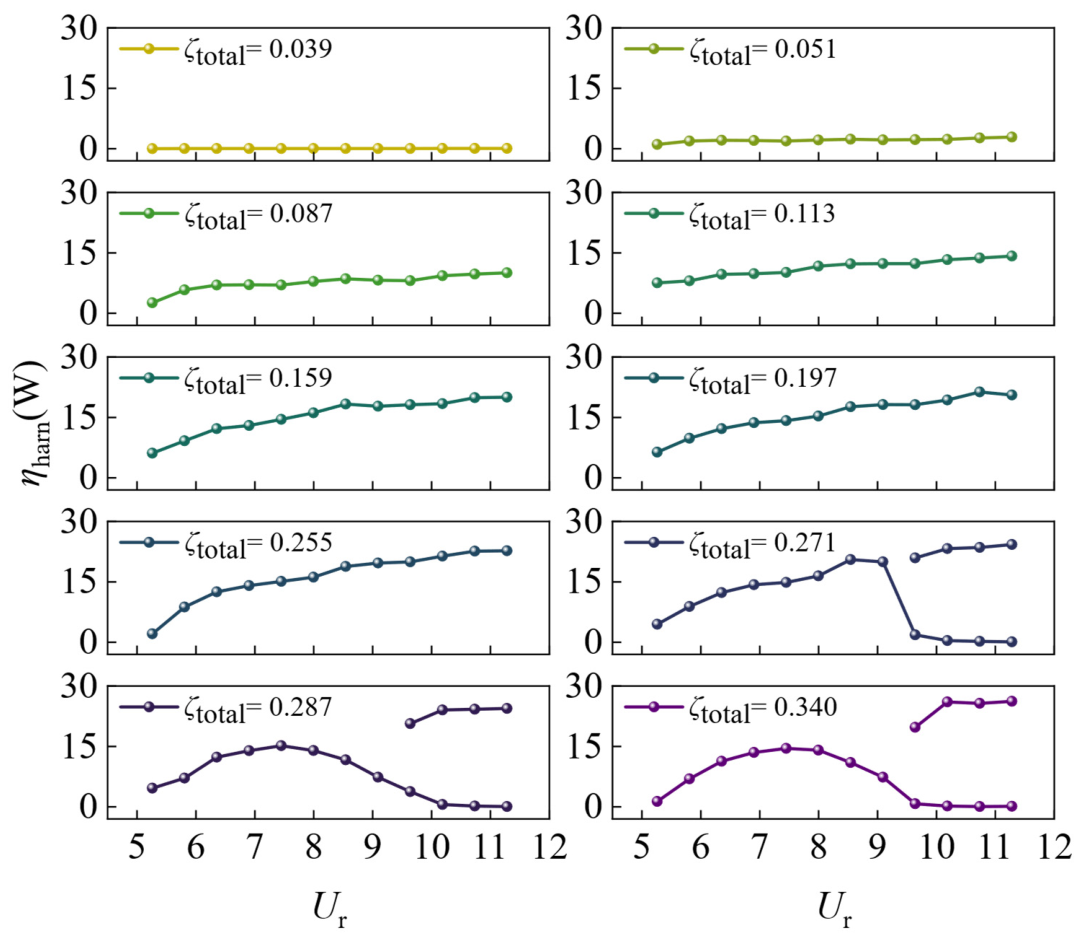
As shown in Figure 17, the ECE exhibited a steady increasing trend with increasing reduced velocity in the VIV branch. Under the operating conditions considered in this study, the ECE remained nearly constant over the entire oscillation range. In the galloping branch, the ECE generally increased with increasing reduced velocity. However, a higher active power does not necessarily correspond to a higher ECE. As indicated by Equation (7), in FIM power generation, the ECE depends on both the cube of the reduced velocity and the active power. Consequently, variations in reduced velocity can significantly affect the ECE; therefore, even when the active power increases, the efficiency may not increase and may even decrease. Within the experimental range considered in this study, the maximum ECE of the CTA oscillator reached ηharn = 26.2% at ζtotal = 0.340 and Ur = 11.28.
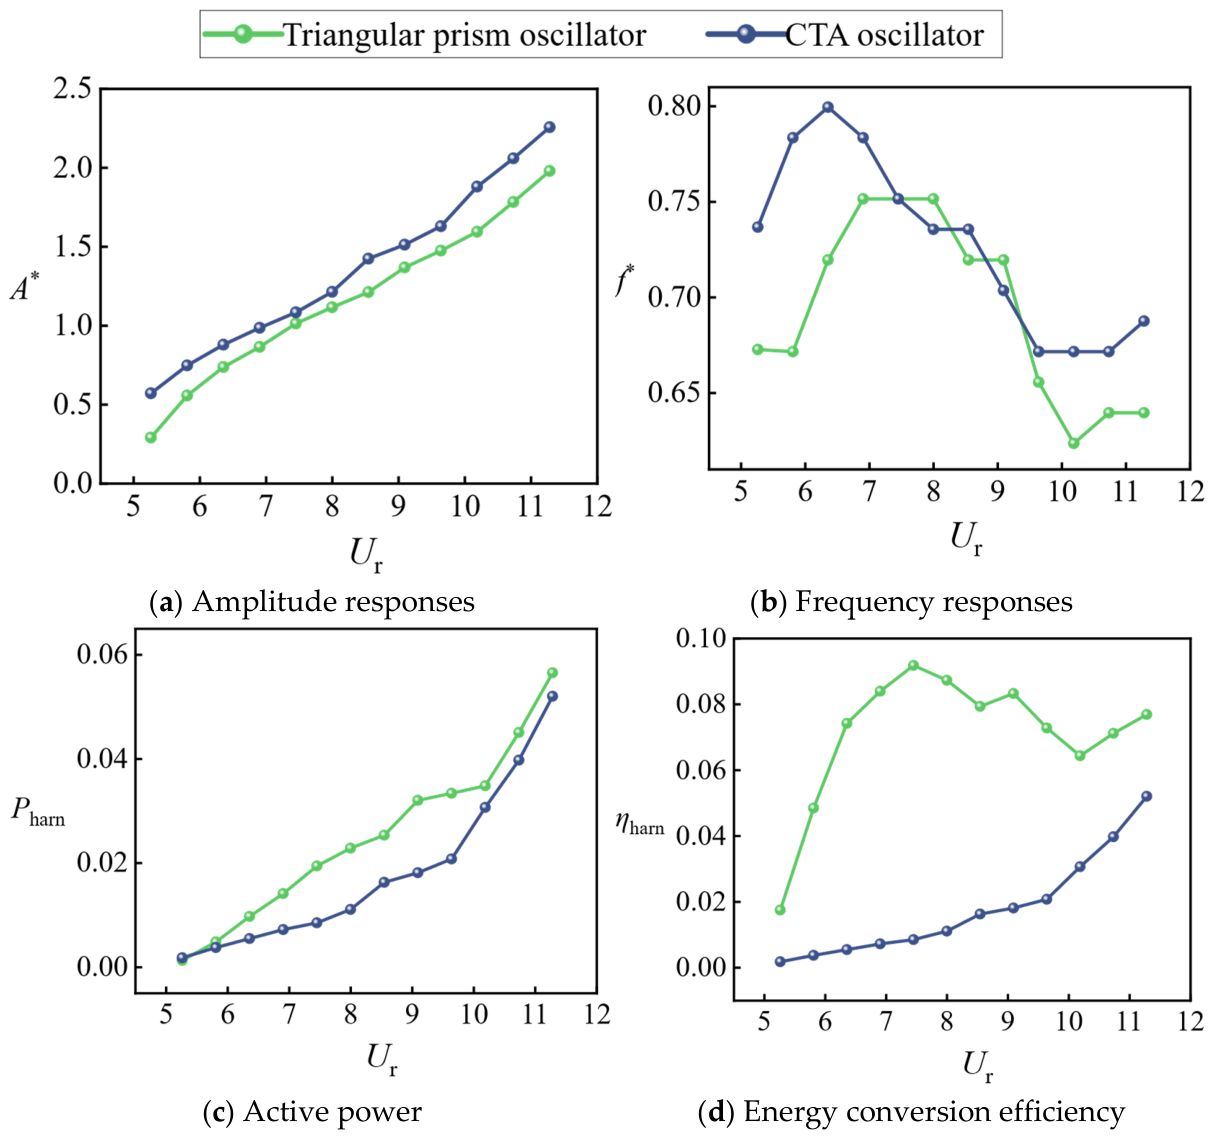
Compared with the power generation performance of the triangular prism oscillator reported in previous studies [48], the CTA oscillator proposed in this study reached a maximum active power of Pharn = 19.3 W at Ur = 11.28, with a corresponding peak ECE of ηharn = 26.2%. In contrast, the triangular prism oscillator produced an active power of Pharn = 10.01 W at the same reduced velocity (Ur = 11.28), with a corresponding ECE of ηharn = 13.61%. These results indicate that the CTA oscillator exhibits superior energy conversion performance compared with the conventional triangular prism oscillator under the same operating condition.
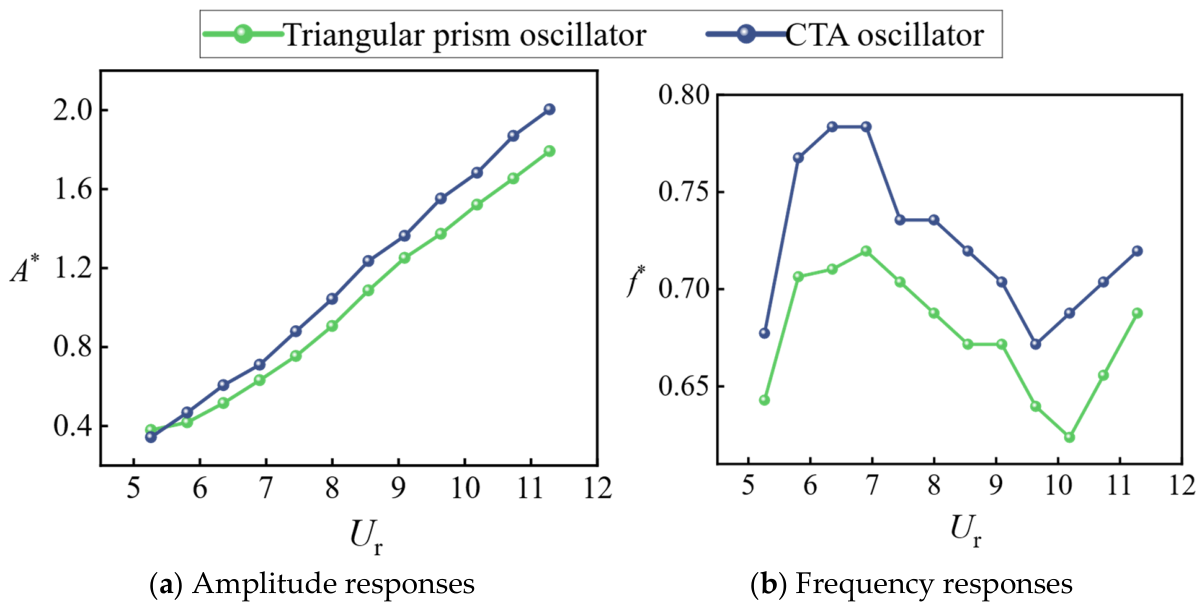
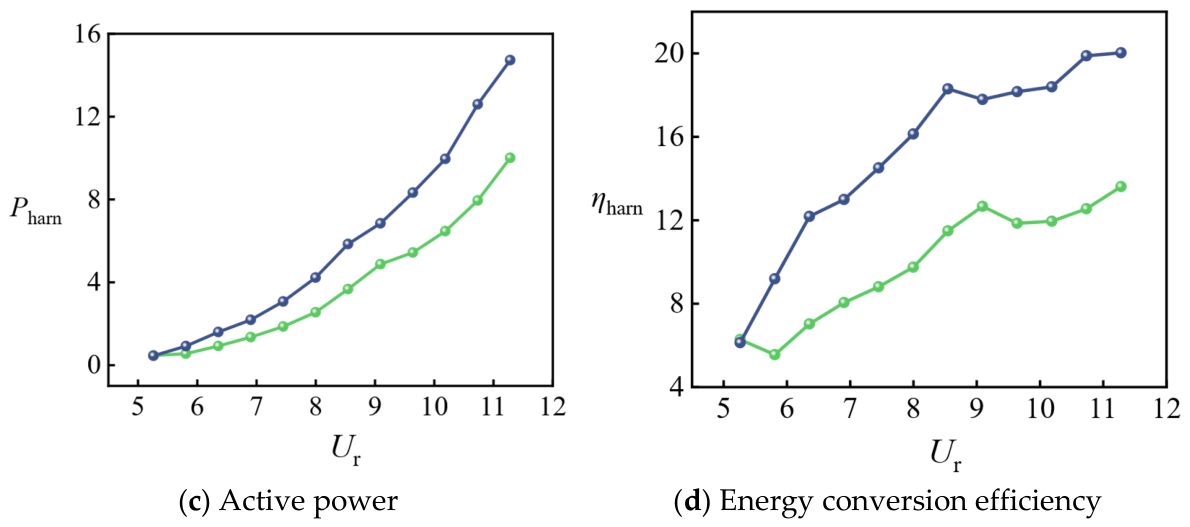
To further compare the performance of the proposed CTA oscillator with that of a conventional triangular prism oscillator, the oscillation characteristics and energy-harvesting performance of the two configurations were analyzed under both low- and high-damping conditions. All other experimental parameters were kept constant to ensure a fair comparison. Figure 18 and Figure 19 compare the amplitude ratio, frequency ratio, active power, and ECE of the two oscillators at a low total damping ratio of (ζtotal = 0.039) and a high total damping ratio of (ζtotal = 0.146).
(1)
Low-damping condition (ζtotal = 0.039)
At ζtotal = 0.039, the total system damping was relatively low, and the amplitude ratios of both oscillators generally increased with increasing reduced velocity. At (Ur = 11.28), the maximum amplitude ratios of the CTA oscillator and the triangular prism oscillator were 2.20 and 1.98, respectively. The larger maximum amplitude ratio achieved under the same operating conditions indicates that the former configuration produced a stronger oscillation response. Nevertheless, although both oscillator systems exhibited relatively large vibration amplitudes under the low-damping condition, their power-generation performance remained limited. As shown in Figure 17 and Figure 18c, the maximum active power of either oscillator did not exceed 0.06 W, and the maximum ECE remained below 0.10%. Therefore, neither oscillator configuration is suitable for oscillation-based power generation under the low-damping condition.
(2)
High-damping condition (ζtotal = 0.146)
At ζtotal = 0.146, the total system damping was relatively high. The amplitude ratios of both oscillators increased with increasing reduced velocity, and the maximum amplitude ratio of the CTA oscillator was higher than that of the triangular prism oscillator. Taken together with the results obtained under the low-damping condition, these findings indicate that the former configuration exhibited the stronger oscillation response under both damping conditions.
The active power and ECE of the two oscillator systems were further compared under the high-damping condition. The maximum active power and efficiency were generally achieved in either the upper branch of VIV or the galloping branch, and both quantities increased monotonically with reduced velocity. The CTA oscillator maintained a soft-galloping response over the tested high-damping range. Moreover, throughout the investigated reduced-velocity range, its maximum active power and ECEE were higher than those of the triangular prism oscillator, indicating superior energy-harvesting performance under the high-damping condition.
It is also noteworthy that the oscillation frequency strongly affected the energy-harvesting performance. Under identical operating conditions, the two oscillators exhibited only small differences in amplitude ratio; however, the frequency ratio of the CTA oscillator remained consistently higher. Consequently, its active power and ECE were substantially greater than those of the triangular prism oscillator.
Overall, the CTA oscillator exhibited superior performance to the triangular prism oscillator.

5. Conclusions

This study investigated the FIM energy harvesting characteristics of a CTA oscillator, designed to manipulate boundary-layer separation and extend the effective operating range, which successfully overcomes the limitations of traditional soft-to-hard galloping transitions. By integrating a direct torque measurement system into the experimental setup, simultaneous and non-intrusive quantification of fluid forces and electrical output was achieved. Combining theoretical modeling with comprehensive experimental tests, the hydrodynamic mechanisms, dynamic response, and energy conversion performance of the CTA oscillator were systematically elucidated. The principal conclusions are as follows:
(1)
Free-decay tests conducted in air demonstrate that the theoretical model established in this study can reasonably characterize the relationship between system damping and excitation voltage, with predictions in good agreement with the experimental results. The study further verifies that integrating a torque sensor into the FIM energy harvesting setup for fluid force calculation is reliable, without significantly interfering with incoming flow characteristics or electrical output. The fluid forces derived from real-time torque data also provide a reliable basis for analyzing the wake dynamics of the oscillating oscillator.
(2)
As the system damping ratio increases, the oscillation intensity gradually weakens, and the response of the CTA oscillator shifts from SG to HG. Under the present test conditions, the maximum amplitude ratio reached 2.43 at ζtotal = 0.039 and Ur = 11.28.
(3)
The CTA oscillator exhibits regular periodic motion under varying incoming flow conditions. In the VIV branch, the frequency spectrum of the transverse response agreed well with that of the lift coefficient, indicating that the transverse motion is driven by lift. Moreover, as the reduced velocity increases, the oscillator is capable of capturing more fluid energy.
(4)
The galloping branch is identified as the optimal energy conversion branch for the CTA oscillator. Under the present experimental conditions, both the active power and the ECE exhibited an overall increasing trend with increasing system damping ratio. The maximum active power reached Pharn = 19.3 W, with a corresponding peak ECE of ηharn = 26.2%, achieved at ζtotal = 0.340 and Ur = 11.28. Compared with a typical non-circular triangular prism oscillator, the CTA oscillator achieved an increase of 9.29 W in active power and 12.59 percentage points in ECE at the same reduced velocity. Comparative analysis revealed that the CTA oscillator significantly outperformed the conventional triangular prism oscillator in terms of energy conversion capability.
Collectively, this work demonstrates that targeted cross-sectional modification, combined with direct torque-based force monitoring, significantly enhances the practical viability of FIM energy harvesting systems. The CTA oscillator offers a robust, high-efficiency solution for expanding the operational envelope of FIM energy harvesters in real-world hydraulic and marine environments.

Author Contributions

Conceptualization, D.R.; methodology, D.R.; software, D.R.; validation, X.Y., J.L. and W.W.; formal analysis, B.F.; investigation, D.R.; resources, D.R.; data curation, K.C.; writing-original draft preparation, B.F.; writing-review and editing, B.F.; visualization, Y.L.; supervision, D.R.; project administration, Y.W.; funding acquisition, D.R. All authors have read and agreed to the published version of the manuscript.

Funding

This study was funded by the National Natural Science Foundation (52409069), the Key Technologies Research and Development Program (2024YFC3211800), and the Shared Project of Campus Recruitment, Department of Finance of Shaanxi Province (TG20250836).

Data Availability Statement

The data that support the findings of this study are available on request from the corresponding author, and all relevant data will be provided without extra restrictions.

Conflicts of Interest

The authors declare no conflicts of interest.

Nomenclature

The following nomenclature are used in this manuscript:
SGSoft galloping
HGHard galloping
FIMECSFlow-induced motion energy conversion system
CTACircular-T-attachment
FIMFlow-induced motion
VIVVortex-induced vibration
VIVACEVortex-induced vibration for aquatic clean energy
ECEEnergy conversion efficiency
FSFull scale
A*Amplitude ratio, A* = A/D
ζtotalSystem damping ratio
Urreduced velocity, Ur = U/(fnD)
PharnActive power
ηharnEnergy conversion efficiency
R0Generator internal resistance
RLGenerator external load resistance
moscOscillation mass
maAdditional water mass
ctotalTotal damping of FIMECS
FLThe incoming flow force
cMechanical damping of the system
VBExcitation voltage
cgenGenerator damping coefficient
LLength of the motor coil
cL(t)Instantaneous lift coefficient
UInflow velocity
DProjection width of the oscillator in the direction of incoming flow
lOscillator length
δEnd-plate thickness
CLMaximum lift coefficient
fLLift dominant frequency
tOscillation time
AAmplitude of oscillation
foscFrequency of oscillation
HCross-sectional height of the oscillator
dFeature dimensions of the attached plate of the oscillator
f*Frequency ratio, f* = fosc/fn, air
fn, airNatural frequency of the system in air
FTTorque force
T(t)Torque at the end of the transmission section
RmRadius of the final gear of the transmission
KSystem stiffness
ToscOscillation time
PWTotal power of the incoming flow
AmaxMaximum amplitude within the oscillation period
PmechMechanical damping power consumption of the system
PULUpper-limit power
ηULUpper-limit efficiency
ζairDamping ratio of the system in air
AiAmplitude value of the i-th peak
Ai+1Amplitude value of the (i + 1)-th peak
tOscillation time
maAdditional water mass
ρWater density
u(t)Instantaneous voltage
ClLift coefficients
CdDrag coefficients
αThe instantaneous effective angle of attack
αcThe equilibrium angle

References

  1. Achakulwisut, P.; Erickson, P.; Guivarch, C.; Schaeffer, R.; Brutschin, E.; Pye, S. Global Fossil Fuel Reduction Pathways under Different Climate Mitigation Strategies and Ambitions. Nat. Commun. 2023, 14, 5425. [Google Scholar] [CrossRef] [PubMed]
  2. Aslam, N.; Yang, W.; Saeed, R.; Ullah, F. Energy Transition as a Solution for Energy Security Risk: Empirical Evidence from BRI Countries. Energy 2024, 290, 130090. [Google Scholar] [CrossRef]
  3. Ullah, S.; Lin, B. Unpacking the Role of Green Supply Chain and Renewable Energy Innovation in Advancing Environmental Sustainability: A Quantile-Based Approach. Renew. Sustain. Energy Rev. 2025, 218, 115810. [Google Scholar] [CrossRef]
  4. Matthews, H.D.; Wynes, S. Current Global Efforts Are Insufficient to Limit Warming to 1.5 °C. Science 2022, 376, 1404–1409. [Google Scholar] [CrossRef] [PubMed]
  5. Sognnaes, I.; Gambhir, A.; van de Ven, D.-J.; Nikas, A.; Anger-Kraavi, A.; Bui, H.; Campagnolo, L.; Delpiazzo, E.; Doukas, H.; Giarola, S.; et al. A Multi-Model Analysis of Long-Term Emissions and Warming Implications of Current Mitigation Efforts. Nat. Clim. Change 2021, 11, 1055–1062. [Google Scholar] [CrossRef]
  6. Davis, S.J.; Lewis, N.S.; Shaner, M.; Aggarwal, S.; Arent, D.; Azevedo, I.L.; Benson, S.M.; Bradley, T.; Brouwer, J.; Chiang, Y.-M.; et al. Net-Zero Emissions Energy Systems. Science 2018, 360, eaas9793. [Google Scholar] [CrossRef] [PubMed]
  7. Gonzalez, N.; Serna-Torre, P.; Sánchez-Pérez, P.A.; Davidson, R.; Murray, B.; Staadecker, M.; Szinai, J.; Wei, R.; Kammen, D.M.; Sunter, D.A.; et al. Offshore Wind and Wave Energy Can Reduce Total Installed Capacity Required in Zero-Emissions Grids. Nat. Commun. 2024, 15, 6826. [Google Scholar] [CrossRef] [PubMed]
  8. Nijsse, F.J.M.M.; Mercure, J.-F.; Ameli, N.; Larosa, F.; Kothari, S.; Rickman, J.; Vercoulen, P.; Pollitt, H. The Momentum of the Solar Energy Transition. Nat. Commun. 2023, 14, 6542. [Google Scholar] [CrossRef] [PubMed]
  9. Chen, C.; Liu, D.; He, L.; Qin, S.; Wang, J.; Razal, J.M.; Kotov, N.A.; Lei, W. Bio-Inspired Nanocomposite Membranes for Osmotic Energy Harvesting. Joule 2020, 4, 247–261. [Google Scholar] [CrossRef]
  10. Khan, N.; Kalair, A.; Abas, N.; Haider, A. Review of Ocean Tidal, Wave and Thermal Energy Technologies. Renew. Sustain. Energy Rev. 2017, 72, 590–604. [Google Scholar] [CrossRef]
  11. Neill, S.P. Introduction to Ocean Renewable Energy. Compr. Renew. Energy 2022, 8, 1–9. [Google Scholar] [CrossRef]
  12. Chen, Z.; Alam, M.M.; Qin, B.; Zhou, Y. Energy Harvesting from and Vibration Response of Different Diameter Cylinders. Appl. Energy 2020, 278, 115737. [Google Scholar] [CrossRef]
  13. Masoudi, E.; Gan, L.; Sims-Williams, D.; Marshall, A. Flow Induced Vibration (FIV) of a Pentagonal Cylinder with High Mass-Damping Ratio. J. Fluids Struct. 2025, 133, 104267. [Google Scholar] [CrossRef]
  14. Mujtaba, A.; Latif, U.; Uddin, E.; Younis, M.Y.; Sajid, M.; Ali, Z.; Abdelkefi, A. Hydrodynamic Energy Harvesting Analysis of Two Piezoelectric Tandem Flags under Influence of Upstream Body’s Wakes. Appl. Energy 2021, 282, 116173. [Google Scholar] [CrossRef]
  15. Wang, K.; Xia, W.; Ren, J.; Yu, W.; Feng, H.; Hu, S. Wind Energy Harvesting Inspired by Palm Leaf Flutter: Observation, Mechanism and Experiment. Energy Convers. Manag. 2023, 284, 116971. [Google Scholar] [CrossRef]
  16. Yan, X.; Lian, J.; Liu, F.; Wang, X.; Shao, N. Hydrokinetic Energy Conversion of Flow-Induced Motion for Triangular Prism by Varying Magnetic Flux Density of Generator. Energy Convers. Manag. 2021, 227, 113553. [Google Scholar] [CrossRef]
  17. Sun, W.; Wang, Y.; Liu, Y.; Su, B.; Guo, T.; Cheng, G.; Zhang, Z.; Ding, J.; Seok, J. Navigating the Future of Flow-Induced Vibration-Based Piezoelectric Energy Harvesting. Renew. Sustain. Energy Rev. 2024, 201, 114624. [Google Scholar] [CrossRef]
  18. Wang, J.; Geng, L.; Ding, L.; Zhu, H.; Yurchenko, D. The State-of-the-Art Review on Energy Harvesting from Flow-Induced Vibrations. Appl. Energy 2020, 267, 114902. [Google Scholar] [CrossRef]
  19. Bernitsas, M.M.; Raghavan, K.; Ben-Simon, Y.; Garcia, E.M.H. VIVACE (Vortex Induced Vibration Aquatic Clean Energy): A New Concept in Generation of Clean and Renewable Energy From Fluid Flow. J. Offshore Mech. Arct. Eng. 2008, 130, 041101. [Google Scholar] [CrossRef]
  20. Li, H.; Bernitsas, C.C.; Congpuong, N.; Bernitsas, M.M.; Sun, H. Experimental Investigation on Synergistic Flow-Induced Oscillation of Three Rough Tandem-Cylinders in Hydrokinetic Energy Conversion. Appl. Energy 2024, 359, 122587. [Google Scholar] [CrossRef]
  21. Ding, L.; Zhang, L.; Wu, C.; Mao, X.; Jiang, D. Flow Induced Motion and Energy Harvesting of Bluff Bodies with Different Cross Sections. Energy Convers. Manag. 2015, 91, 416–426. [Google Scholar] [CrossRef]
  22. Lian, J.; Yan, X.; Liu, F.; Zhang, J. Analysis on Flow Induced Motion of Cylinders with Different Cross Sections and the Potential Capacity of Energy Transference from the Flow. Shock Vib. 2017, 2017, 4356367. [Google Scholar] [CrossRef]
  23. Park, H.; Kumar, R.A.; Bernitsas, M.M. Enhancement of Flow-Induced Motion of Rigid Circular Cylinder on Springs by Localized Surface Roughness at 3 × 10⁴Re ≤ 1.2 × 10⁵. Ocean Eng. 2013, 72, 403–415. [Google Scholar] [CrossRef]
  24. Song, R.; Xu, P.; Jia, S.; Zhang, Y. Experimental Investigation on Hydrokinetic Energy Harvesting from Flow-Induced Vibration of Oscillators with Rod-Shaped Attachments. Ocean Eng. 2025, 319, 120250. [Google Scholar] [CrossRef]
  25. Ding, L.; Yang, L.; Yang, Z.; Zhang, L.; Wu, C.; Yan, B. Performance Improvement of Aeroelastic Energy Harvesters with Two Symmetrical Fin-Shaped Rods. J. Wind Eng. Ind. Aerodyn. 2020, 196, 104051. [Google Scholar] [CrossRef]
  26. Cao, D.; Qin, W.; Zhou, Z.; Du, W. Enhancing Wind Energy Harvesting through Two V-Shaped Attachments and Monostable Characteristics in the Galloping Piezoelectric Harvester. Energy Convers. Manag. 2024, 318, 118871. [Google Scholar] [CrossRef]
  27. Zhang, C.; Wu, H.; Li, B.; Wang, E.; Wang, J. Investigation into the Performance of Galloping Piezoelectric Energy Harvesters with Two Symmetrical Splitters in Different Arrangements. J. Hydrodyn. 2025, 37, 553–568. [Google Scholar] [CrossRef]
  28. Zhang, H.; Chen, S.; Karimi, M.; Li, B.; Saydam, S.; Hassan, M. VIV–Galloping Coupled Piezoelectric Wind Energy Harvester for Industrial Applications. Int. J. Mech. Sci. 2025, 302, 110587. [Google Scholar] [CrossRef]
  29. Chen, W.; Wei, Y.; Ji, C.; Zhao, Y. Mass Ratio Effects on Flow-Induced Vibrations of an Equilateral Triangular Prism. J. Fluids Struct. 2023, 116, 103808. [Google Scholar] [CrossRef]
  30. Wang, X.; Yu, M.; Wang, F.; Brazhenko, V.; Cai, J.; E, S.; Xu, Z. Analysis on Flow-Induced Transverse Vibration and Pivoted Rotation of a Trapezoidal Prism with Single Degree of Freedom. Ocean Eng. 2025, 322, 120523. [Google Scholar] [CrossRef]
  31. Chen, W.; Ji, C.; Xu, D.; Zhang, Z.; Wei, Y. Flow-Induced Vibrations of an Equilateral Triangular Prism at Various Angles of Attack. J. Fluids Struct. 2020, 97, 103099. [Google Scholar] [CrossRef]
  32. Gurian, T.D.; Modarres-Sadeghi, Y. Vortex-Induced Vibrations of a Square Prism Free to Oscillate in the Inline Direction. J. Fluids Struct. 2021, 102, 103237. [Google Scholar] [CrossRef]
  33. Zhang, Z.; Xu, F.; Wang, Y.; Wang, X. Fluid-Structure Interaction Analysis of a 4:1 Rectangular Prism Undergoing Vortex-Induced Vibration. J. Wind Eng. Ind. Aerodyn. 2024, 254, 105918. [Google Scholar] [CrossRef]
  34. Wang, J.; Zhang, C.; Zhang, M.; Abdelkefi, A.; Yu, H.; Ge, X.; Liu, H. Enhancing Energy Harvesting from Flow-Induced Vibrations of a Circular Cylinder Using a Downstream Rectangular Plate: An Experimental Study. Int. J. Mech. Sci. 2021, 211, 106781. [Google Scholar] [CrossRef]
  35. Zhang, M.; Abdelkefi, A.; Yu, H.; Ying, X.; Gaidai, O.; Wang, J. Predefined Angle of Attack and Corner Shape Effects on the Effectiveness of Square-Shaped Galloping Energy Harvesters. Appl. Energy 2021, 302, 117522. [Google Scholar] [CrossRef]
  36. Bearman, P.W. Vortex Shedding from Oscillating Bluff Bodies. Annu. Rev. Fluid Mech. 1984, 16, 195–222. [Google Scholar] [CrossRef]
  37. Bearman, P.W. Circular Cylinder Wakes and Vortex-Induced Vibrations. J. Fluids Struct. 2011, 27, 648–658. [Google Scholar] [CrossRef]
  38. West, G.S.; Apelt, C.J. The Effects of Tunnel Blockage and Aspect Ratio on the Mean Flow Past a Circular Cylinder with Reynolds Numbers between 104 and 105. J. Fluid Mech. 1982, 114, 361–377. [Google Scholar] [CrossRef]
  39. Shao, N.; Lian, J.; Liu, F.; Yan, X.; Li, P. Experimental Investigation of Flow Induced Motion and Energy Conversion for Triangular Prism. Energy 2020, 194, 116865. [Google Scholar] [CrossRef]
  40. Lian, J.; Yan, X.; Liu, F.; Zhang, J.; Ren, Q.; Yang, X. Experimental Investigation on Soft Galloping and Hard Galloping of Triangular Prisms. Appl. Sci. 2017, 7, 198. [Google Scholar] [CrossRef]
  41. Hu, G.; Tse, K.T.; Wei, M.; Naseer, R.; Abdelkefi, A.; Kwok, K.C.S. Experimental Investigation on the Efficiency of Circular Cylinder-Based Wind Energy Harvester with Different Rod-Shaped Attachments. Appl. Energy 2018, 226, 682–689. [Google Scholar] [CrossRef]
  42. Davis, J.T. Velocity Characteristics in the Wake of an Oscillating Cylinder. Doctoral Dissertation, Massachusetts Institute of Technology, Cambridge, MA, USA, 2001. [Google Scholar]
  43. Raghavan, K.; Bernitsas, M.M. Experimental Investigation of Reynolds Number Effect on Vortex Induced Vibration of Rigid Circular Cylinder on Elastic Supports. Ocean Eng. 2011, 38, 719–731. [Google Scholar] [CrossRef]
  44. Hover, F.S.; Davis, J.T.; Triantafyllou, M.S. Three-Dimensionality of Mode Transition in Vortex-Induced Vibrations of a Circular Cylinder. Eur. J. Mech.-B/Fluids 2004, 23, 29–40. [Google Scholar] [CrossRef]
  45. Shao, N.; Lian, J.; Yan, X.; Liu, F.; Wang, X. Experimental Study on Energy Conversion of Flow Induced Motion for Two Triangular Prisms in Staggered Arrangement. Energy 2022, 249, 123764. [Google Scholar] [CrossRef]
  46. Shao, N. Experimental Study on Flow Induced Motion Characteristics and Energy Conversion Optimal Layout for Two Triangular Prisms. Doctoral Dissertation, Tianjin University, Tianjin, China, 2020; 183p. [Google Scholar] [CrossRef]
  47. Den Hartog, J.P. Mechanical Vibrations; McGraw-Hill Book Company: Columbus, OH, USA, 1956. [Google Scholar]
  48. Lian, J.; Ran, D.; Yan, X.; Liu, F.; Shao, N.; Wang, X.; Yang, X. Hydrokinetic Energy Harvesting from Flow-Induced Motion of Oscillators with Different Combined Sections. Energy 2023, 269, 126814. [Google Scholar] [CrossRef]
Figure 1. Schematic diagram of the FIMECS.
Water 18 01603 g001
Figure 2. Test setup.
Water 18 01603 g002
Figure 3. CTA oscillator model.
Water 18 01603 g003
Figure 4. Installation location and local stress analysis of the torque sensor.
Water 18 01603 g004
Figure 5. Free decay test curve of a CTA oscillator (VB = 0 V).
Water 18 01603 g005
Figure 6. Experimental results and fitting curves for the total damping of a CTA oscillator system.
Water 18 01603 g006
Figure 7. Spectrum at Ur = 8.55 and typical VIV initial branch wake structure.
Water 18 01603 g007aWater 18 01603 g007b
Figure 8. FIM response of a CTA oscillator (amplitude responses and frequency responses).
Water 18 01603 g008
Figure 9. FIM response of a CTA oscillator (maximum lift coefficient).
Water 18 01603 g009
Figure 10. Time history and frequency spectrum characteristics of the SG response (ζtotal = 0.039, Ur = 5.81).
Water 18 01603 g010
Figure 11. Time history and frequency spectrum characteristics of the SG response (ζtotal = 0.039, Ur = 8.00).
Water 18 01603 g011aWater 18 01603 g011b
Figure 12. Time history and frequency spectrum characteristics of the SG response (ζtotal = 0.039, Ur = 11.28).
Water 18 01603 g012aWater 18 01603 g012b
Figure 13. Time history and frequency spectrum characteristics of the HG response (Ur = 5.81).
Water 18 01603 g013
Figure 14. Time history and frequency spectrum characteristics of the HG response (Ur = 8.00).
Water 18 01603 g014
Figure 15. Time history and frequency spectrum characteristics of the HG response (Ur = 11.28).
Water 18 01603 g015
Figure 16. Active power of CTA oscillator under different damping conditions.
Water 18 01603 g016
Figure 17. ECE of CTA oscillator under different damping conditions.
Water 18 01603 g017
Figure 18. Comparison of the performance of oscillators with different cross-sectional configurations under low-damping conditions (ζtotal = 0.039).
Water 18 01603 g018
Figure 19. Comparison of the performance of oscillators with different cross-sectional configurations under high-damping conditions (ζtotal = 0.146).
Water 18 01603 g019aWater 18 01603 g019b
Table 1. Measurement range and accuracy of the main experimental instruments.
MeasuredInstrumentMeasurement RangeAccuracy
Oscillator displacementHysteresis displacement sensor0–800 mm±0.05% FS
Load voltageVoltage acquisition system−10 to +10 V±0.1% FS
TorqueTorque sensor0–2 N·m±0.5% FS
Table 2. Free decay test results of the CTA oscillator system in air.
VB/Vfn, air/Hzmosc/kgζtotalctotal (N·s·m−1)
01.05342.2800.03720.673
31.05342.2800.03921.807
61.05342.2800.04021.923
91.06041.7310.04122.526
121.05342.2800.04323.897
151.06041.7310.04625.393
181.05342.2800.05128.565
211.05342.2800.05732.110
241.05342.2800.06435.923
271.06741.1820.07138.972
301.06741.1820.07441.025
331.05342.2800.08044.625
361.06041.7310.08748.332
391.06041.7310.09451.988
421.07240.8160.10055.147
451.06241.5480.10357.070
481.06041.7310.11362.920
511.05341.7310.12167.737
541.06041.7310.12870.825
571.06741.1820.13775.579
601.06741.1820.14680.541
631.05342.2800.15486.318
661.05342.2800.15990.147
691.05342.2800.18499.809
721.05342.2800.197106.895
751.05342.2800.211124.886
781.05342.2800.225127.001
811.05342.2800.240136.661
841.05342.2800.255136.829
871.05342.2800.271148.967
901.05342.2800.287154.780
931.05342.2800.304179.564
961.05342.2800.322184.077
991.05342.2800.340187.733
1021.05342.2800.361202.586
1051.05342.2800.379207.769
1081.05342.2800.398229.520
Disclaimer/Publisher’s Note: The statements, opinions and data contained in all publications are solely those of the individual author(s) and contributor(s) and not of MDPI and/or the editor(s). MDPI and/or the editor(s) disclaim responsibility for any injury to people or property resulting from any ideas, methods, instructions or products referred to in the content.