Article

Chemical Evolution Characteristics and Health Risks Assessment of Surface Water–Groundwater in Large-Scale Coal Mining Areas of the Inner Mongolian Plateau Under Mining Activities


1
China Institute of Geo-Environment Monitoring, Beijing 100081, China
2
Key Laboratory of Mine Ecological Effects and Systematic Restoration, Ministry of Natural Resources, Beijing 100081, China
*
Author to whom correspondence should be addressed.
Water 2026, 18(13), 1604; https://doi.org/10.3390/w18131604
Submission received: 30 April 2026 / Revised: 16 June 2026 / Accepted: 18 June 2026 / Published: 2 July 2026
(This article belongs to the Section Water Quality and Contamination)

Abstract

Mining can significantly affect the spatial distribution and temporal evolution of groundwater chemistry. From July to August 2024, the research team collected 26 surface water and groundwater samples in the Shengli Coal Mine area of the Mongolian Plateau, conducting comprehensive hydrogeochemical analyses on surface water flowing through the mining area, groundwater within the mining area, seepage water, and groundwater outside the mining area. The results indicate that groundwater in this region is notably affected by human activities such as mining operations. Specifically, in surface water flowing through the mining area, concentrations of total dissolved solids (TDS), sulfates, nitrates, and nickel showed significant increases. Compared to groundwater systems in other areas of the Mongolian Plateau, nickel levels in the mining area’s groundwater were significantly higher, while nitrate levels exhibited the opposite trend. A significant positive correlation was observed between metal element concentrations in surface water and groundwater. The study found that abnormal distributions of heavy metals such as beryllium (Be), thallium (Tl), and tin (Sn) may originate from point-source pollution caused by mining activities. Furthermore, concentrations of manganese (Mn), arsenic (As), and antimony (Sb) in the groundwater of this area exceeded relevant regulatory limits, with arsenic being particularly prominent. The levels of arsenic in both surface water and groundwater may pose carcinogenic risks to human health. This study shows that nearly half of the sampled water bodies in the area require purification treatment to meet drinking water standards, highlighting the urgent need for further attention to water quality safety issues. The conclusions derived from this research provide theoretical support for understanding the long-term evolutionary mechanisms of groundwater in mining areas, while also offering important insights for improving groundwater environmental management and ensuring water resource security in mining regions.

1. Introduction

Water resources and water pollution represent critical water security challenges confronting the global community. Amidst the rapid development of the global economy, China and other developing nations are facing significant challenges in water pollution control, notably heavy metal contamination [1,2]. Heavy metals in water pose severe threats to both human health and ecological systems [3]. The sources of heavy metals in water primarily originate from natural processes and human activities [4,5]. Natural processes include atmospheric deposition, rock weathering, and volcanic activity [6], while human activities encompass mining operations, metal smelting, industrial manufacturing, urban wastewater discharge, and medical residues, among others [1,6]. Dissolved metals in water readily incorporate into food chains, inflicting severe damage to ecological systems and human health through bioaccumulation [7]. Consequently, investigating the distribution characteristics and pollution sources of metallic elements in aquatic environments, coupled with conducting water quality assessments and health risk evaluations, is crucial for advancing scientific understanding of their potential hazards and formulating targeted prevention strategies [8].
To assess health risks posed by heavy metals in aquatic environments, investigating their concentrations, distribution patterns, and sources constitutes an essential prerequisite [9,10,11]. Based on concentrations and spatial distribution of heavy metals within aquatic systems, their sources—whether natural processes or anthropogenic activities—can be qualitatively identified through multivariate statistical approaches, such as correlation analysis [9] and the positive matrix factorization (PMF) model [12]. Previous studies have demonstrated that heavy metals pose significant long-term risks to human health through dermal absorption and dietary intake pathways [13]. Cadmium, chromium, arsenic, lead, and mercury pose severe health risks to humans even at low concentrations [14]. Iron, manganese, nickel, zinc, and selenium are essential for normal physiological functions in humans, while excessive dietary intake of these elements may become detrimental to human health [15]. Heavy metal risk assessment constitutes an integral component of aquatic environmental risk evaluation, encompassing both water quality assessment and health risk evaluation. Among these methodologies, the heavy metal pollution index (HPI), Nemerow index (NI), and contamination degree (CD) have been extensively adopted as standardized approaches for comprehensive assessment of pollution levels in both surface water and groundwater [11,16,17]. Conventional health risk assessment models are routinely implemented to characterize human health risks through quantification of heavy metal concentrations in groundwater, encompassing both non-carcinogenic and carcinogenic risk evaluations [13,18].
The study area Shengli Coalfield is situated within the Xilingol Grasslands, approximately 45 km north of Xilinhot City in Inner Mongolia Autonomous Region. This mining zone extends approximately 45 km in a NE-SW trending belt, encompassing 725.8 km2 with proven coal reserves of 21.3 billion tonnes. As China’s largest lignite field featuring the thickest coal seams, it ranks among the nation’s 14 strategic coal mining bases and hosts associated beneficial minerals including germanium-rich deposits and petroleum resources. The study area experiences an arid climate with minimal precipitation, resulting in poorly developed surface drainage networks. The Xilin River maintains perennial flow status, while all other waterways function as intermittent flood-driven channels. Xilingol League serves as a pivotal livestock production hub where minimal industrial activity has maintained naturally low background levels of heavy metals [19]. However, large-scale open-pit coal mining operations have induced disruption of pedospheric and lithospheric structures, triggering soil erosion and enrichment of heavy metals in grassland topsoil, thereby posing significant health hazards to local populations [20]. The Xilin River surface waters—performing critical ecological regulation functions for mining and surrounding areas—and the groundwater serving as potable water sources for local communities face altered hydrogeochemical environments due to mining-induced groundwater drawdown cones that modify subsurface flow regimes and surface water–groundwater interactions. Consequently, investigating hydrogeochemical characteristics and conducting source apportionment of heavy metals in mining-impacted aquatic systems, coupled with management-oriented water quality assessments and health risk evaluations, bears significant implications for advancing ecological security protocols. The sustainable coexistence of mining, industrial, ecological, pastoral, and public health imperatives constitutes a fundamental mechanism for maintaining socioeconomic equilibrium within the Shengli Coalfield and the broader Xilingol Grassland ecosystem.
This study conducted a systematic investigation of physicochemical parameters and potentially toxic elements across 26 surface water (Xilin River) and groundwater (Shengli Coalfield) samples. Analytical methodologies included: (1) hydrogeochemical characterization via descriptive statistics, Piper trilinear diagrams, Gibbs plots, and ionic ratios; (2) metal source apportionment employing correlation analysis and PMF modeling; (3) comprehensive water quality assessment integrating health risk evaluation and potability analysis; (4) revelation of interconversion mechanisms between dissolved metal species in surface–groundwater systems. These findings provide critical references for enhancing drinking water management efficacy and formulating targeted heavy metal pollution control policies.

2. Materials and Methods

2.1. Study Area

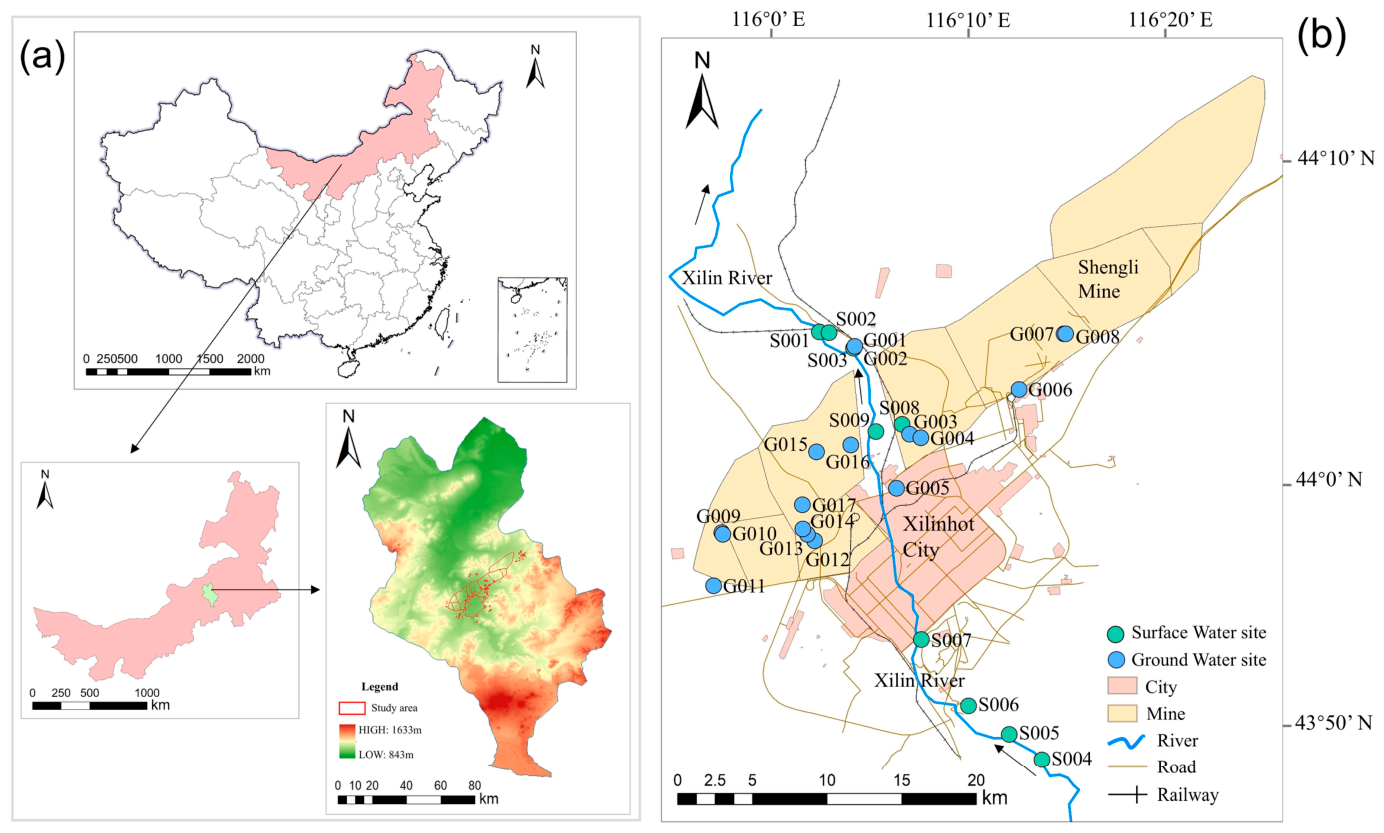
The sampling sites are located in the Shengli Coalfield Area (Figure 1), situated on the northern slope of the western extension of the Greater Khingan Mountains, in the eastern central part of the Inner Mongolia Plateau. It falls within a mid-temperate semi-arid to arid continental monsoon climate zone, with an annual precipitation of approximately 200–300 mm and an average annual temperature ranging from 0 to 4.8 °C. The area experiences dry and windy springs, uneven rainfall distribution in summers, scant rainfall and early cold spells in autumns, and prolonged winters with an ice period lasting up to five months. The Shengli Coalfield belongs to part of the Xilinhot Basin hydrogeological unit, specifically the Xilin River Valley hydrogeological subdistrict. The Xilin River flows northward through the open-pit mining area of the Shengli Coalfield. The aquifer in the study area is a Quaternary unconsolidated porous aquifer formation, distributed on both banks of the Xilin River. It thins out toward the eastern and western sides and gradually pinches out. The main lithology consists of fine to medium sand with gravel and sub-clay lenses formed by fluvial, lacustrine, and glaciofluvial deposits. The primary recharge sources for groundwater in the study area are atmospheric precipitation and lateral recharge from the river valley. Groundwater discharge is mainly concentrated in the Xilin River Valley plain, occurring in the form of phreatic water evaporation, plant transpiration, and anthropogenic extraction (such as urban water supply, power plant production, domestic water use, and dewatering drainage).

2.2. Sample Collection and Chemical Analysis

In this study, 26 sets of samples were collected in July 2024, including 9 sets of surface water, 17 sets of groundwater and 53 sets of soil. The surface water samples were obtained from the Xilin River, while the groundwater samples were distributed across mining areas surrounding the Xilin River. Sampling was completed in July 2024, with the collection, transportation, and preservation of surface water and groundwater samples conducted in accordance with the Chinese national ecological environment standards: “Technical specifications for surface water environmental quality monitoring” (HJ 91.2–2022) [21], “Technical specifications for environmental monitoring of groundwater” (HJ 164–2020) [22] and “Determination of Total Content of 19 Metallic Elements in Soil and Sediments by Inductively Coupled Plasma Mass Spectrometry” (HJ 1315–2023) [23]. Upon completion of sampling, all samples were transported under refrigeration to the analytical testing facility within 48 h. Meanwhile, in this study, the data measured in 2024 by the national groundwater monitoring network for the water resources area of Inner Mongolia were also referred to as a reference for comparison. We fully recognize that the single sampling campaign conducted from July to August 2024 cannot cover seasonal variations, which may limit the comprehensive understanding of annual groundwater hydrogeochemical evolution. The sampling period was deliberately selected because summer represents the most intensive stage of local mining and industrial activities. During this period, mining excavation, tailings stacking, and surface construction activities are frequent, leading to the strongest anthropogenic interference on groundwater systems.
The analysis of samples was conducted by the accredited laboratory of the China Institute of Geo-Environment Monitoring. Testing parameters included 11 physicochemical indicators: Total Hardness (TH), Total Dissolved Solids (TDS), Potassium (K+), Sodium (Na+), Calcium (Ca2+), Magnesium (Mg2+), Sulfate (SO42−), Chloride (Cl), Bicarbonate (HCO3), Carbonate (CO32−), Nitrate (as N, NO3-N), and 23 potentially toxic elements: Iron (Fe), Manganese (Mn), Copper (Cu), Zinc (Zn), Aluminum (Al), Mercury (Hg), Arsenic (As), Selenium (Se), Cadmium (Cd), Lead (Pb), Beryllium (Be), Antimony (Sb), Barium (Ba), Nickel (Ni), Cobalt (Co), Molybdenum (Mo), Thallium (Tl), Lithium (Li), Titanium (Ti), Vanadium (V), Gallium (Ga), Strontium (Sr), Tin (Sn). The analytical methods and detection limits for each parameter are provided in Table S1.
Quality control during sampling was achieved through trip blanks, field blanks, duplicate samples, and field spikes. For each batch of samples (defined as every 20 samples), one blank sample and one duplicate sample were collected, accounting for at least 5% of the total samples. Quality control during laboratory testing was implemented through laboratory blanks, laboratory duplicates, blank spikes, matrix spikes, certified reference materials (CRMs), and quality control samples. The charge balance error between cations and anions for all samples did not exceed ±5%.

2.3. Data Analysis

This study employed Piper trilinear diagrams, Shukarev classification, Gibbs diagrams, and ion ratio methods to analyze the hydrogeochemical distribution characteristics and formation mechanisms of surface water and groundwater. Data visualization and analysis were performed using OriginPro 2021 (Academic License) software to generate box plots, Piper diagrams, Gibbs diagrams, ion correlation plots, and heatmaps. Statistical analyses included difference tests (two-sample Mann–Whitney U test) and Spearman correlation analysis. Spatial mapping was conducted using ArcMap 10.2.

2.4. Positive Matrix Factorization (PMF) Model

Source apportionment of inorganic constituents in water samples was performed using the positive matrix factorization (PMF) model, implemented via the EPA-PMF 5.0 software. Originally proposed by Paatero and Tapper [24], the PMF model decomposes constituent concentrations into three components: factor contributions, factor profiles, and residuals, as mathematically expressed in Equation (1). The optimal solution of PMF is achieved when the objective function Q approaches its expected value, thereby determining the values of matrices G and F, as expressed in Equation (2):
X i j = k = 1 p g i k × f k j + e i j
Q = i = 1 p j = 1 m x i j k = 1 p g i k f k j u i j 2
u i j = 0.05 × X i j 2 + M D L j 2     ( X i j > M D L j )
u i j = 5 6 M D L j         ( X i j < M D L j )
where Xij is the concentration of constituent j in sample i (μg/L); gik is the contribution of source k to sample i; fkj is the concentration of constituent j in source k (μg/L); eij is the residual; p is the number of sources; uij is the uncertainty of constituent j in sample i; and MDLj is the method detection limit for constituent j.

2.5. Potentially Toxic Element Pollution Evaluation

The contamination levels of potentially toxic elements in surface water and groundwater within the study area were evaluated using the heavy metal pollution index (HPI) [25], Nemerow index (NI) [26], and contamination degree (CD) [27]:
H P I = i = 1 n M i S i × 100 × 1 S i i = 1 n 1 S i
N I = M i S i m e a n 2 + M i S i m a x 2 2
C D = i = 1 n M i S i
where Mi is the concentration of potentially toxic elements parameters in water samples (mg/L); Si is the standard concentration of elements of concern parameters water samples (mg/L), and the standard threshold Si for potentially toxic elements is defined as follows: surface water samples referring to Standard Limits for elements of concern in “Environmental quality standards for surface water” (GB 3838–2002) [28] and groundwater samples referring to Class III Thresholds in “Standard for groundwater quality” (GB/T 14848–2017) [29] (mg/L). The classification of HPI, NI, and CD is as follows: for HPI, HPI < 15 indicates Class I low pollution, 15 ≤ HPI ≤ 30 indicates Class II moderate pollution, 30 < HPI ≤ 100 indicates Class III moderately to highly polluted, HPI > 100 indicates Class IV severe pollution; For NI, NI < 1 indicates Class I low pollution, 1 ≤ NI < 2.5 indicates Class II mild pollution, 2.5 ≤ NI < 7 indicates Class III moderate pollution, NI ≥ 7 indicates Class IV severe pollution; for CD, CD < 6 indicates Class I low pollution, 6 ≤ CD < 12 indicates Class II moderate pollution, 12 ≤ CD < 24 indicates Class III significant pollution, CD ≥ 24 indicates Class IV very heavy pollution.

2.6. Health Risk Assessment

The human health risk assessment employs methodologies issued by the U.S. Environmental Protection Agency (USEPA) [30], including exposure assessment, non-carcinogenic risk assessment and carcinogenic risk assessment. Human health risk assessment is a function of hazard and exposure, defined as the process of estimating the probability of adverse health effects occurring at any given severity level during a specified time period. The health risk assessment for each metal is based on the quantification of risk levels, expressed in terms of carcinogenic or non-carcinogenic metals in the environment, typically reported as the average daily dose (ADD). The dose received via ingestion pathways is determined using Equation (8), as modified by the USEPA:
A D D = ( C W × I R × E F × E D ) / ( B W × A T )
where CW is the mean concentration of metals in water samples (μg/L); IR is the water ingestion rate (L/day); EF is the exposure frequency (day/year); ED is the exposure duration (year); BW is the body weight (kg); AT is the average time for non-carcinogens or carcinogens (day). The parameter values for each factor are presented in Table S2 [30].
Non-carcinogenic risk is calculated using the Hazard Quotient (HQ), which represents the ratio of exposure level to the reference dose of exposure (RfDO) for each toxic metal. Values from USEPA [30] were adopted for RfDO in this study.
H a z a r d   q u o t i e n t H Q = A D D / R f D o
The values of RfDO for heavy metal parameters are presented in Table S3. Non-carcinogenic risk is considered safe if HQ ≤ 1, while HQ > 1 indicates potential adverse health effects requiring concern [25].
To evaluate the aggregate potential non-carcinogenic effects of multiple metals in water samples, the hazard index (HI) is employed by summing the calculated HQ values of all metals:
H I = i = 1 n H Q i
where n is the number of heavy metals. An HI > 1 suggests the possibility of adverse effects on human health, warranting further investigation.
Carcinogenic risk assessment (CA) quantifies the probability of an individual developing cancer over a lifetime due to continuous exposure to carcinogenic contaminants. The tolerable range for carcinogenic risk is below 10−4 (1 in 10,000), while values exceeding 10−4 indicate significant carcinogenic risk from target contaminants.
C A = A D D × S F
where SF is the slope factor of contaminants [(μg/kg/day)−1]. In this study, the SF values for As and Cd are assigned as 0.0015 and 0.0061, respectively [30].

3. Results

3.1. Chemical Characteristics of Groundwater in Mining Areas

Laboratory analysis of 11 hydrogeochemical parameters from 9 surface water (SW) and 17 groundwater (GW) samples in the study area (Table S4) revealed that surface water sampling points exhibited TDS concentrations ranging from 323.15 to 1208.03 mg/L (mean: 769.48 mg/L), with 3 sites classified as brackish water and the remainder as freshwater, while GW sampling points showed broader TDS variations of 129.55–2002.45 mg/L (mean: 1003.55 mg/L), where 6 sites qualified as brackish water and others as freshwater, indicating higher salinity prevalence in subsurface aquifers. Analysis of SW sampling points showed cation concentrations ordered as Na+ > Ca2+ > Mg2+ > K+ and anion concentration as HCO3 > Cl > SO42−, while GW sampling points exhibited largely consistent dominant cations with surface water but demonstrated anion concentrations following HCO3 > SO42− > Cl—indicating minor variations in predominant anions between the two water bodies. The exceedance rates for each parameter were calculated based on the standard values specified in “Environmental quality standards for surface water” (GB 3838–2002) and the Class III water limit values defined in “Standard for groundwater quality” (GB/T 14848–2017). Among SW sampling points, only one site (specifically S001) exhibited Cl levels exceeding the standard limit, while sulfate SO42− and NO3-N remained within permissible thresholds across all tested points; among GW sampling points, exceedances were observed for five of the six parameters with established limits: TDS, TH, Na+, SO42− and Cl, with non-compliance recorded at 6, 8, 5, 10, and 3 sampling sites respectively. Affected locations included G003, G005, G009, G010, G013, and G017, while NO3-N remained within regulatory thresholds across all sites. With the exception of NO3-N, the coefficients of variation for hydrogeochemical indicators at SW sampling sites were all lower than those at GW sampling sites. This indicates that groundwater is significantly more affected by human activities such as mining operations, while also being influenced by factors such as slow groundwater renewal and uneven distribution of point source pollution [31]. NO3-N primarily originates from industrial and agricultural activities [32], and both surface water and groundwater showed relatively high coefficients of variation in NO3-N test results.
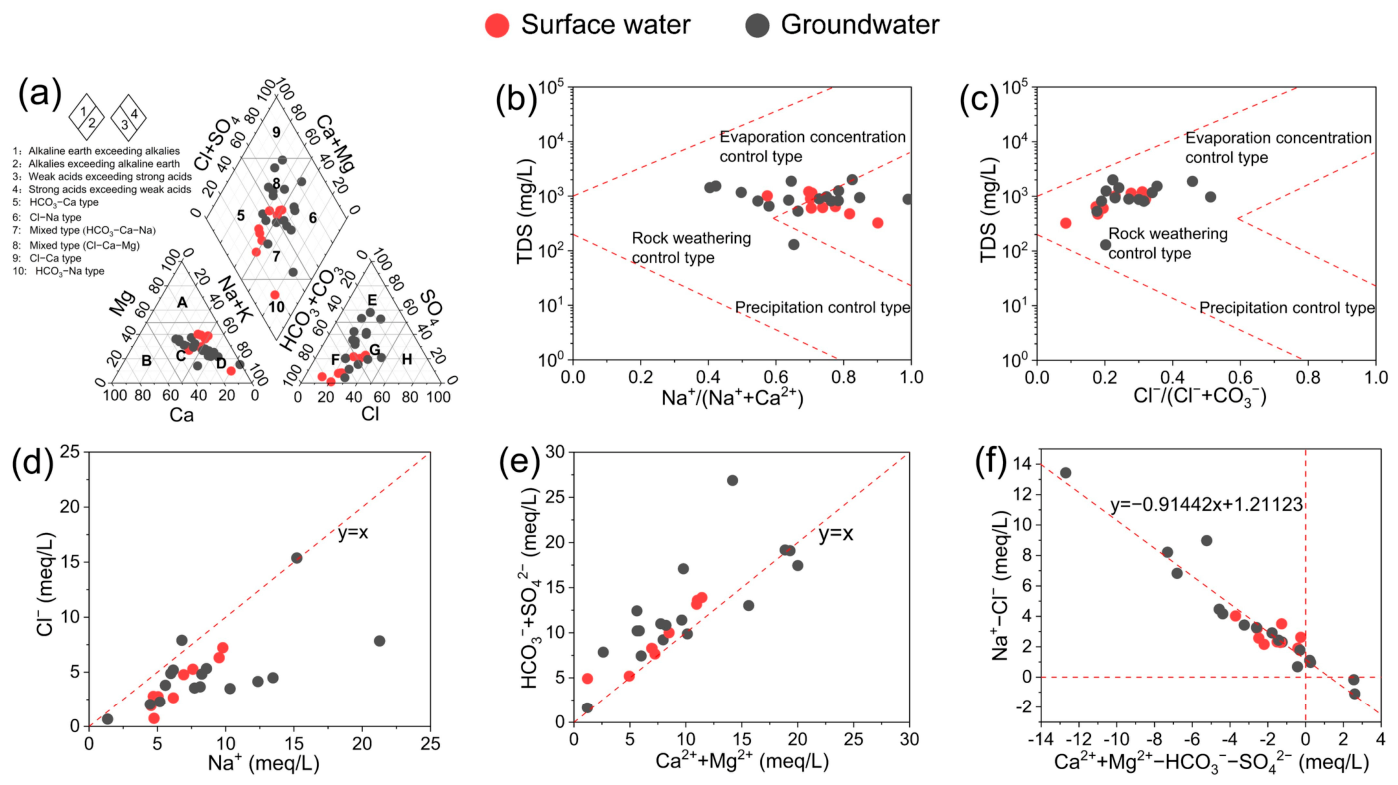
The identification of hydrogeochemical types for sampling points using the Piper trilinear diagram is shown in Figure 2a [33]. According to the Shukarev classification method for hydrogeochemical types, SW sampling sites were dominated by HCO3-Ca type and Cl-Ca·Mg mixed type, while GW sampling sites were primarily Cl-Na type and Cl-Ca·Mg mixed type. Gibbs diagrams visually reflect the control of natural factors (precipitation, rock weathering, and evaporative concentration) on the hydrochemistry of surface water and groundwater [34]. As shown in Figure 2b,c, sampling points in the study area predominantly cluster within the rock weathering zone, with a minority distributed in the evaporative concentration zone, indicating that hydrogeochemical components are primarily controlled by weathering dissolution of surrounding host media (rocks, soils, etc.), while minimally influenced by evaporative concentration. Moreover, some sampling points located beyond the defined zones suggest potential anthropogenic impacts on groundwater chemistry beyond natural factors [35]. The ion ratios of SW and GW samples reflect local hydrogeological conditions and are commonly used to analyze the sources of hydrogeochemical constituents [36,37]. The primary sources of Na+ in surface water and groundwater include the dissolution of silicate minerals, salt rock minerals, and cation exchange adsorption, while the main source of Cl stems from the weathering and dissolution of evaporite minerals, with its content remaining relatively stable [38]. The ratio γNa+/γCl (where γ represents the milligram-equivalent ratio) can reflect the source of Na+ in groundwater. If the ratio approaches 1, it indicates that halite weathering and dissolution is the predominant source [39]. In the study area, most water sampling points exhibit γNa+/γCl > 1 (Figure 2d). Besides halite dissolution, this may also be influenced by the dissolution of silicate minerals or sodium-bearing minerals, and cation exchange may occur. Specifically, Ca2+ and Mg2+ can replace adsorbed Na+ from clay minerals [40]. The ratio γ(Ca2+ + Mg2+)/γ(HCO3 + SO42−) is commonly used to trace the sources of Ca2+ and Mg2+ in groundwater [13]. When the ratio approaches 1, weathering of carbonic acid and silicate rocks serves as the primary source. If the ratio exceeds 1, carbonate rock weathering dominates. Conversely, if the ratio falls below 1, weathering of silicate rocks or evaporites becomes the predominant contributor [41]. Most sampling points in the study area exhibit γ(Ca2++Mg2+)/γ(HCO3+ SO42−) < 1 (Figure 2e), indicating that Ca2+ and Mg2+ primarily originate from silicate rock dissolution. The relationship between γ(Ca2+ + Mg2+ − HCO3 − SO42−) and γ(Na+ − Cl) serves as an indicator of cation exchange intensity. If the slope of their linear fit approaches -1, it demonstrates a strong negative correlation, confirming that cation exchange is actively occurring [42]. As shown in Figure 2f, in the γ(Ca2+ + Mg2+ − HCO3 − SO42−) versus γ(Na+ − Cl) plot, sample points are scattered along a trend near the −1 slope line. Hydrogeochemical composition implies the potential occurrence of cation exchange between Ca2+/Mg2+ and Na+ in groundwater, which may cause partial displacement of adsorbed Na+ on clay mineral surfaces by Ca2+ and Mg2+.

3.2. Distribution Characteristics of Potentially Toxic Elements in Surface Water and Groundwater

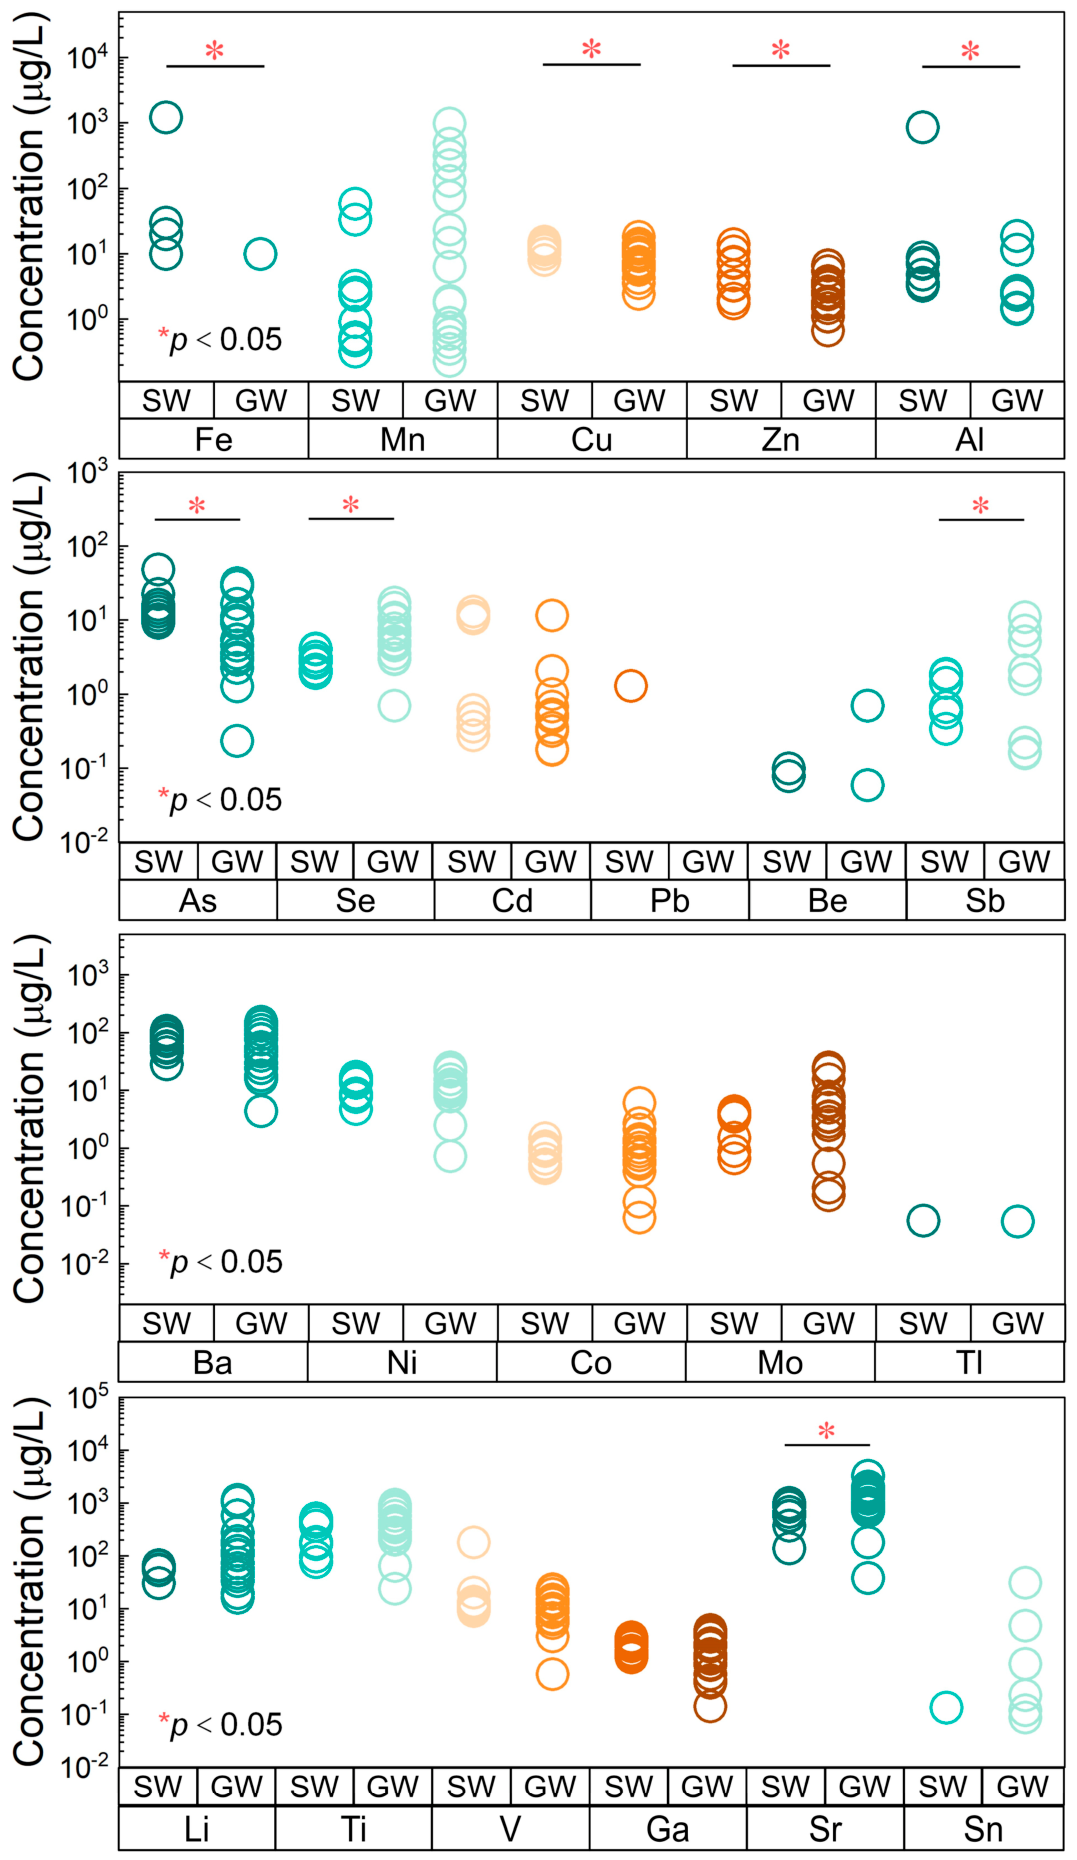
SW and GW samples collected within the study area were tested for concentrations of 23 potentially toxic elements. The exceedance rates for SW indicators were calculated against the Class III water quality limits specified in the “Environmental quality standards for surface water” (GB 3838–2002) and the standard limits for specific items of surface drinking water sources. For GW indicators, exceedance rates were assessed using Class III water criteria from the “Standard for groundwater quality” (GB/T 14848–2017). The tested indicators, detection results, and exceedance status are presented in Table S5. As shown in Table S5, Hg was not detected in either SW or GW samples, while Pb was undetected in GW samples. Other indicators were detected to varying extents. The SW samples exhibited high detection rates for elements of concern including Fe (66.67%), Mn, Cu, Zn, As, Se, Sb, Ba, Ni, Co, Mo, Li, Ti, V, Ga, Sr (all 100%), and Al (77.78%), among which 18 indicators have established standard limits with three showing exceedances: Fe (11.11% exceedance rate), Ti (77.78% exceedance rate), and V (11.11% exceedance rate), with exceedances occurring at S008 (Fe and V) and S001/S002/S003/S005/S006/S007/S009 (Ti). The GW samples exhibited high detection rates for elements of concern including Mn, Cu, Zn, As, Se, Ba, Ni, Co, Mo, Li, Ti, V, Ga, Sr (all 100%), Al (41.18%), Cd (29.41%), Sb (47.06%), and Sn (35.29%), among which 17 indicators with established standard limits revealed five exceedances: Mn (29.41% exceedance rate), As (23.53% exceedance rate), Se (23.53% exceedance rate), Sb (17.65% exceedance rate), and Ni (35.29% exceedance rate), with exceedances occurring at G003/G005/G009/G011/G013 (Mn), G003/G004/G007/G008 (As), G003/G007/G008/G015 (Se), G007/G008/G012 (Sb), and G002/G003/G005/G009/G010/G017 (Ni). To investigate the influences of geological environments and anthropogenic factors on potentially toxic element distribution, the detection frequency and concentration of elements of concern in SW and GW were compared. As illustrated in Figure 3, significant concentration differences were observed between SW and GW for detected elements including Fe, Cu, Zn, Al, As, Se, Sb, and Sr, with Fe, Cu, Zn, Al, As, and Sb exhibiting significantly higher concentrations in SW than in GW, whereas Se and Sr showed markedly lower concentrations in SW relative to GW.
Plots of metal concentrations versus stream distance have been conducted to gain a better view of the spatial distribution of heavy metals. As illustrated in Figure S1, heavy metals were concentrated at three different distances from the Xilin River, namely approximately 2600 m (Mn, As, Se, Ni and V), 5000 m (Co) and 13,500 m (Ba, Mo, and Ga). The enrichment of heavy metals may result from the combined effects of surface water–groundwater interaction and mining activities.

3.3. Comparison of Spatial Distribution Characteristics of Pollutants Between Mining Areas and Non-Mining Areas

The Xilin River, a vital inland watercourse of the Xilingol grassland, flows from south to north through the Shengli Coal Mine area investigated in this study. Its hydrogeochemical characteristics and water quality are significantly impacted by mining activities, making it a critical medium for investigating water environment pollution in the mining area. Previous research has established that in typical acidic, high-sulfur coal mining regions of China, characteristic groundwater pollutants primarily include sulfate, iron, manganese, ammonia nitrogen, and nickel. The spatial distribution and migration patterns of these contaminants serve as key indicators for assessing the environmental impact of mining operations.
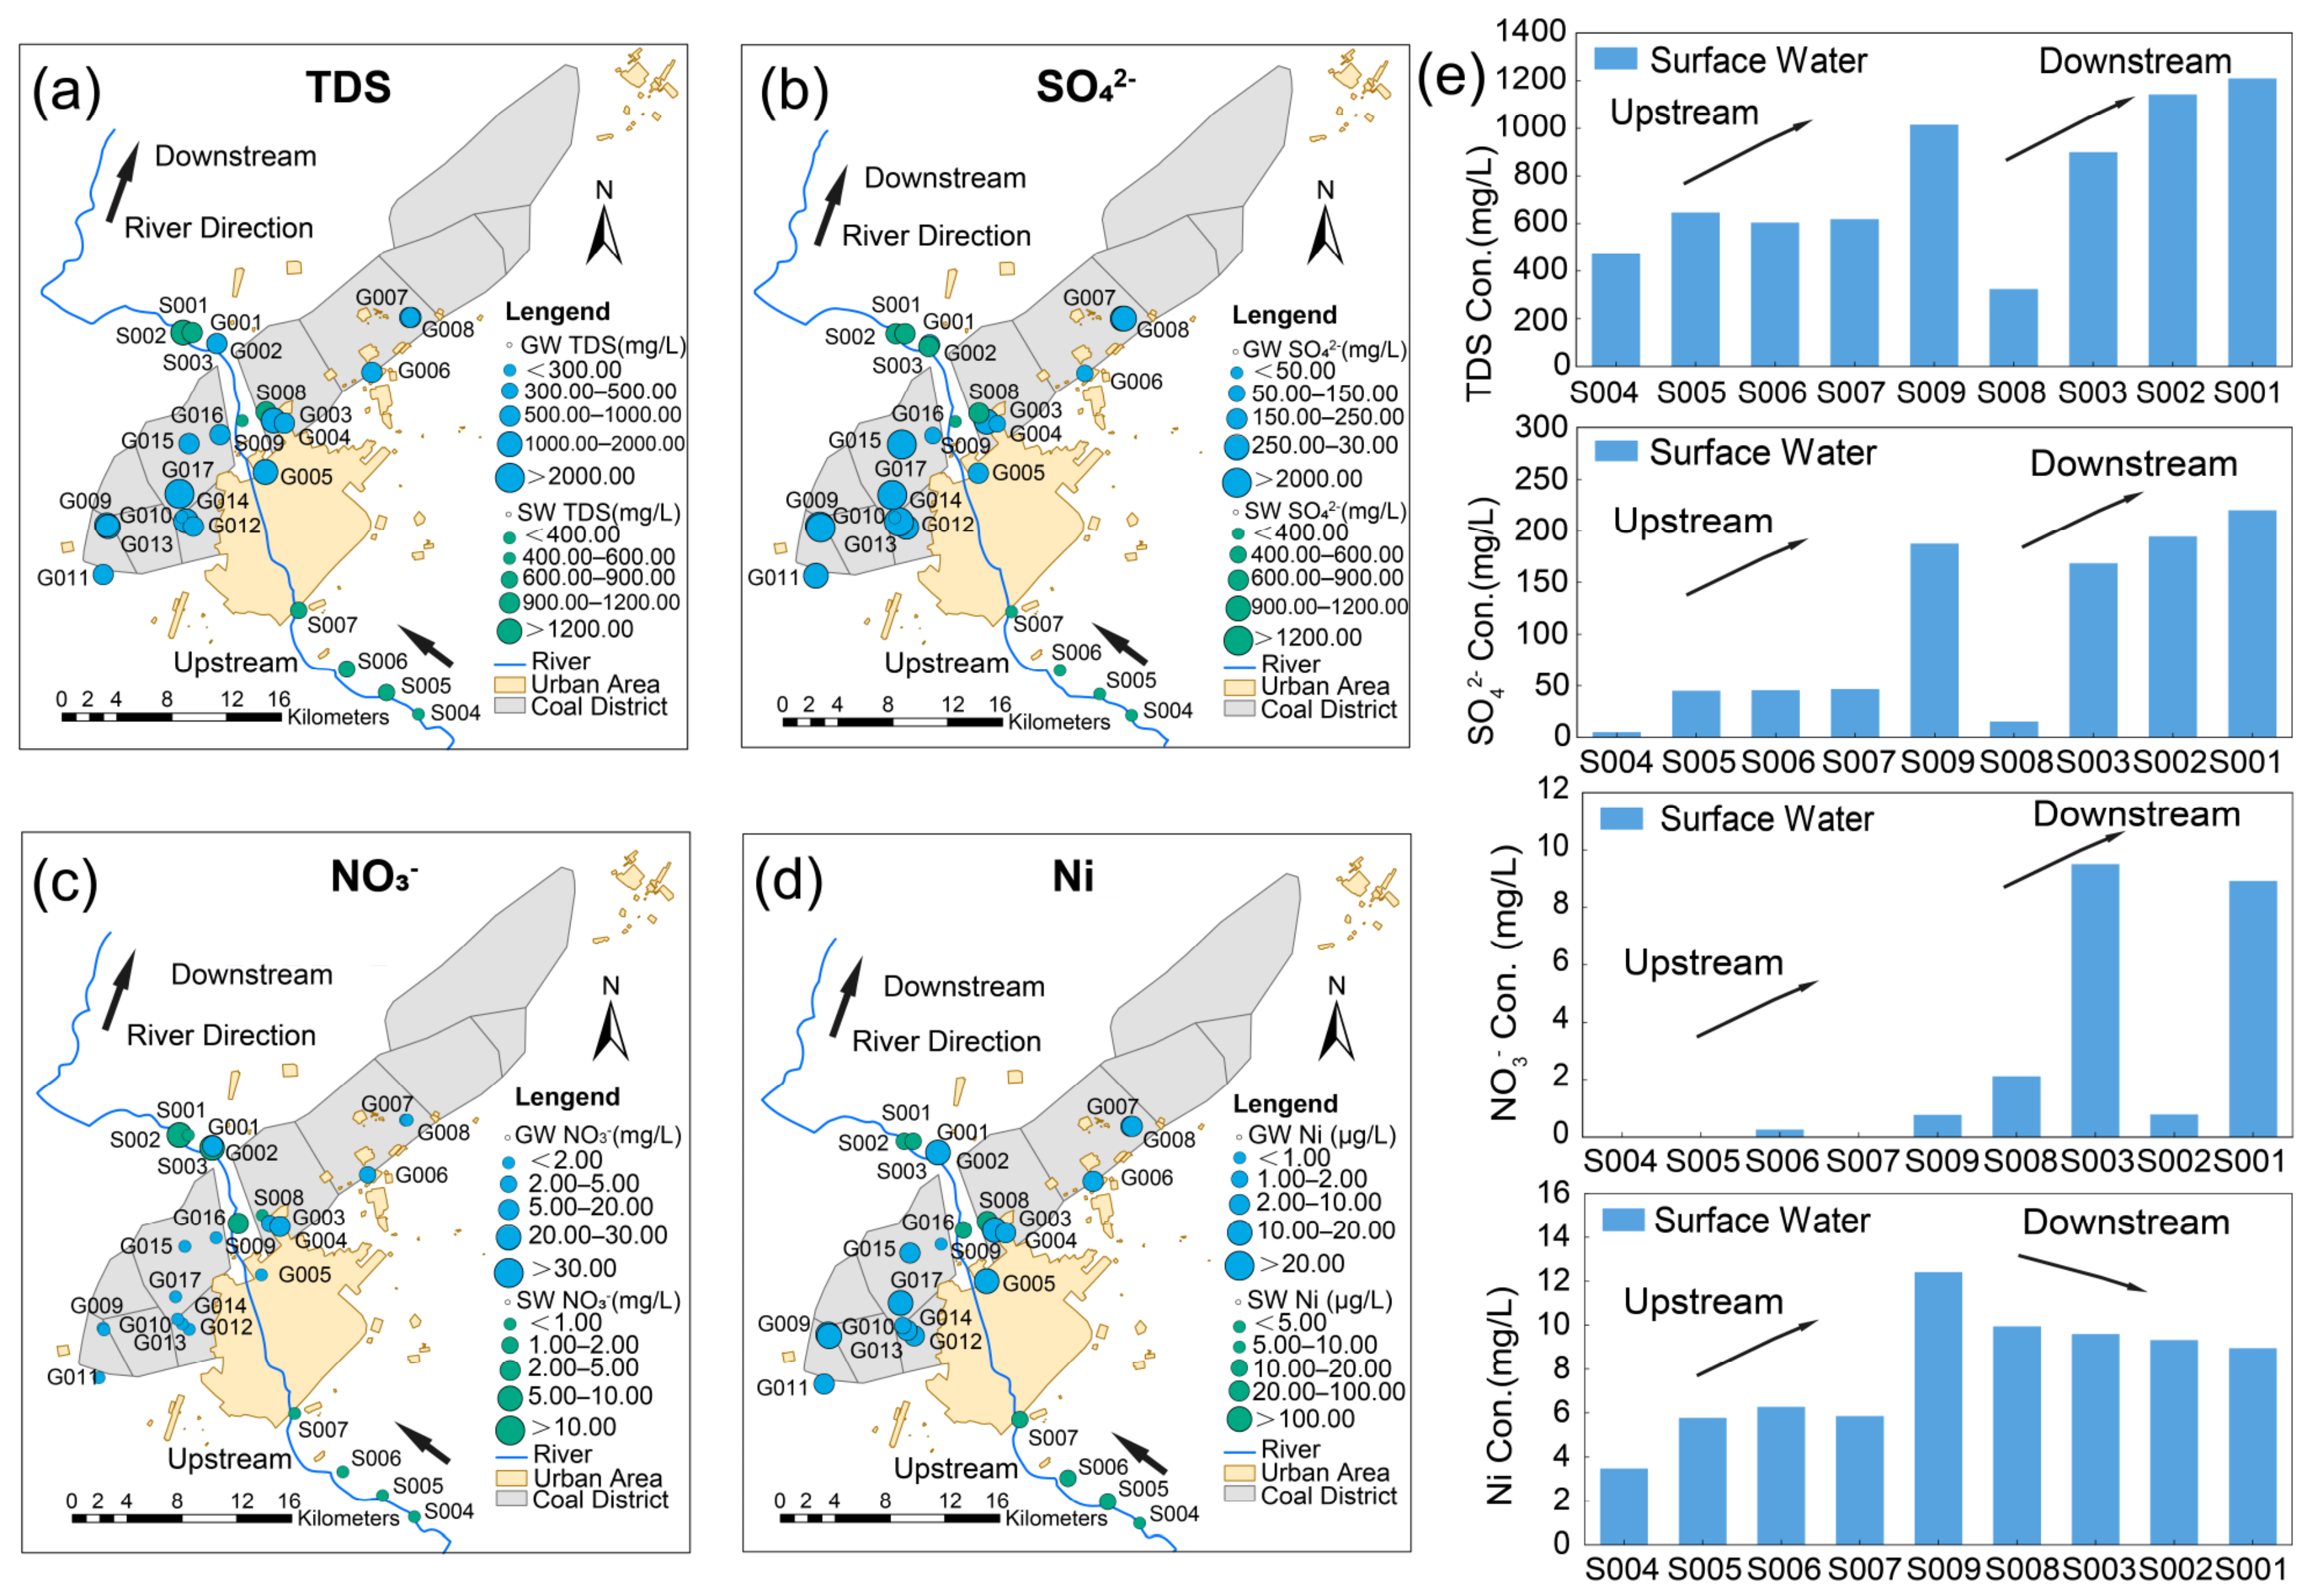
As illustrated in Figure 4, concentrations of total dissolved solids (TDS), sulfate, nitrate, and nickel in the surface water of the Xilin River’s upper reaches are significantly lower than those in the downstream sections, demonstrating a clear increasing trend from south to north. After flowing through the Shengli Coal Mine area, concentrations of various characteristic pollutants increase to different degrees. This confirms that mining activity is a primary driver of elevated pollutant levels in regional water bodies. Wastewater, slag, and other pollutants generated during mining processes enter the aquatic system through various pathways, leading to water quality degradation.
To further elucidate the combined impact of mining on both surface water and groundwater, this study conducted a comparative analysis of pollutant concentrations between the Xilin River surface water and shallow groundwater within the mining area. The results show no significant difference in the levels of nickel and nitrate between the two water bodies. This indicates a strong hydraulic connectivity between the shallow aquifer and the surface water environment in the study area, facilitating frequent mass exchange. Consequently, mining activities can simultaneously affect both surface water and groundwater, enabling pollutants to migrate and transform between the two systems.
Comparing different pollutants reveals that sulfate concentrations in groundwater (particularly in mine seepage water) are significantly higher than in surface water. Concentrations of elements of concern in soils and adjacent groundwater exhibit a positive correlation (Figure S2). This is primarily attributed to the oxidation and decomposition of sulfide minerals during mining, which generates substantial sulfate that infiltrates the groundwater system, causing a marked increase. In contrast, surface water concentrations remain relatively lower due to dilution effects. Furthermore, comparing groundwater data from the mining area with monitoring data from sites in the National Groundwater Monitoring Network within the Inner Mongolia river basin reveals that nitrate concentrations in non-mining areas are significantly higher. This difference stems mainly from agricultural activities, such as fertilizer application, as the primary source of nitrate, whereas mining has a relatively limited effect on nitrate levels and does not cause a notable concentration increase. Conversely, nickel concentrations in the mining area’s groundwater are significantly elevated compared to non-mining regions. This distinctly confirms that mining activity is the principal source of regional heavy metal nickel pollution. Processes including the extraction and crushing of nickel-bearing minerals, along with wastewater discharge, lead to the substantial release and subsequent ingress of nickel into the groundwater system. The local groundwater is subject to periodic metal contamination due to the mining activities during the rainy season, posing a potential threat to regional ecological health and human safety.

4. Discussion

4.1. Sources of Potentially Toxic Elements in the Water Environment

4.1.1. Interconversion of Metal Ions in Surface Water and Groundwater

A comparison of the metal element composition between closely located SW and GW sampling points (S003 and G002), as shown in Figure S3, reveals a significant positive correlation (p < 0.05) in metal content between surface water and groundwater. This suggests that strong ion exchange occurs between nearby surface water and groundwater through processes such as leakage recharge and runoff discharge recharge. Therefore, natural factors, such as geological genesis, combined with anthropogenic pollution from industrial activities like mining, as well as the interconversion between surface water and groundwater, have jointly contributed to the current state of potentially toxic elements in the water environment of the study area.

4.1.2. Correlation Between Potentially Toxic Elements and Chemical Factors

Since all elements of concern exhibit non-normally distributed concentrations, as confirmed by the Kolmogorov–Smirnov test, the Spearman coefficient was used to calculate the correlations among different potentially toxic elements in SW and GW samples, as well as the correlations between elements of concern and physicochemical factors [11,43].
As shown in Figure S4a, in SW samples, the following pairs exhibit strong positive correlations (r > 0.70, p < 0.05): Fe-Mn (0.87), Mn-Zn (0.73), Mn-Be (0.71), Mn-Co (0.88), Zn-Se (0.92), Zn-Sb (0.70), Zn-Ni (0.82), Al-Be (0.73), Se-Ni (0.80), Cd-Tl (0.75), Cd-Sn (0.75), Pb-Be (0.75), Sb-Ni (0.90), Sb-Co (0.87), Ba-Li (0.73), Ba-Ga (1.0), Ni-Co (0.77), Ni-Ti (0.83), Ni-Sr (0.78), Tl-Sn (1.0), Li-Ga (0.73), Ti-Sr (0.95). Conversely, the following pairs exhibit strong negative correlations (r < −0.70, p < 0.05): Fe-Ba (0.82), Fe-Li (0.72), Fe-Ga (0.82), Mn-Li (0.78), As-Ba (0.82), As-Ga (0.82), Be-Li (0.73). In surface water, physicochemical indicators such as Na+, Ca2+, Mg2+, Cl, and SO42− are primarily attributed to natural sources, including mineral dissolution from rocks/soils and atmospheric deposition. In contrast, the NO3-N indicator is predominantly linked to anthropogenic activities such as agricultural practices, industrial effluent discharge, and domestic sewage emissions [32]. In SW samples, potentially toxic elements such as Mn, Sb, Ni, Co, Ti, and Sr exhibit strong positive correlations with physicochemical indicators including Na+, Ca2+, Mg2+, Cl, SO42−, and NO3-N. This pattern indicates dual influences from both natural and anthropogenic sources, with elements positively correlated with Mn and Sb sharing similar origins. Sr exhibits geochemical behavior similar to calcium ions Ca2+ and typically resides in carbonates or potassium-silicates. In this study, there is a positive correlation between Sr, Na, and Mg ions in SW samples, indicating that they may originate from the dissolution of carbonate rocks and silicate rocks [44,45]. Ba and Ga exhibit positive correlations with physicochemical indicators such as Na+, Ca2+, Mg2+, and Cl, while showing negative correlations with NO3-N, Fe and Mn. The sources of Ba, Ga, and Li are preliminarily attributed to rock weathering processes within natural sources [46,47]. Cd, Tl, and Sn were infrequently detected in SW samples across the study area, with detections exclusively concentrated in sample S009. Their presence is likely attributed to point-source pollution from anthropogenic or industrial activities.
As shown in Figure S4b, in GW samples, the following pairs exhibit strong positive correlations (r > 0.60, p < 0.05): As-Se (0.68), As-Sb (0.61), As-Ba (0.69), As-V (0.92), As-Ga (0.67), Se-Mo (0.79), Se-V (0.85), Se-Ga (0.61), Cd-Sb (0.62), Cd-Mo (0.77), Be-Tl (0.64), Ba-V (0.76), Ba-Ga (0.99), Ni-Co (0.92), Ni-Ti (0.98), Ni-Sr (0.66), Co-Ti (0.89), Co-Sr (0.71), Mo-V (0.63), Ti-Sr (0.67), V-Ga (0.73). Conversely, the following pairs exhibit strong negative correlations (r < −0.60, p < 0.05): Fe-Ba (0.82), Fe-Li (0.72), Fe-Ga (0.82), Mn-Li (0.78), As-Ba (0.82), As-Ga (0.82), Be-Li (0.73). The physicochemical indicators including Na+, Ca2+, Mg2+, Cl and SO42− in groundwater are primarily derived from mineral dissolution and ion exchange processes within natural sources. In GW samples, elements such as As, Se, Ba, Mo, and V exhibit high detection frequencies and demonstrate strong positive correlations with indicators including Na+ and NO3−-N. These patterns indicate dual influences from both natural and anthropogenic sources, with positively correlated elements like As and Se sharing similar origins. Be, Tl, and Sn exhibit strong inter-element correlations despite their low detection frequencies, with detections spatially restricted to samples G011 and G012. Their presence is likely attributable to point-source pollution from anthropogenic or industrial activities. Ni, Co, and Ti exhibit strong positive correlations with physicochemical indicators such as Ca2+, Mg2+, Cl and SO42−, as well as with Sr. Their origins are attributed to halite dissolution and rock weathering processes within natural sources [48].

4.1.3. Heavy Metal/Quasi-Heavy Metal Pollution Source Identification

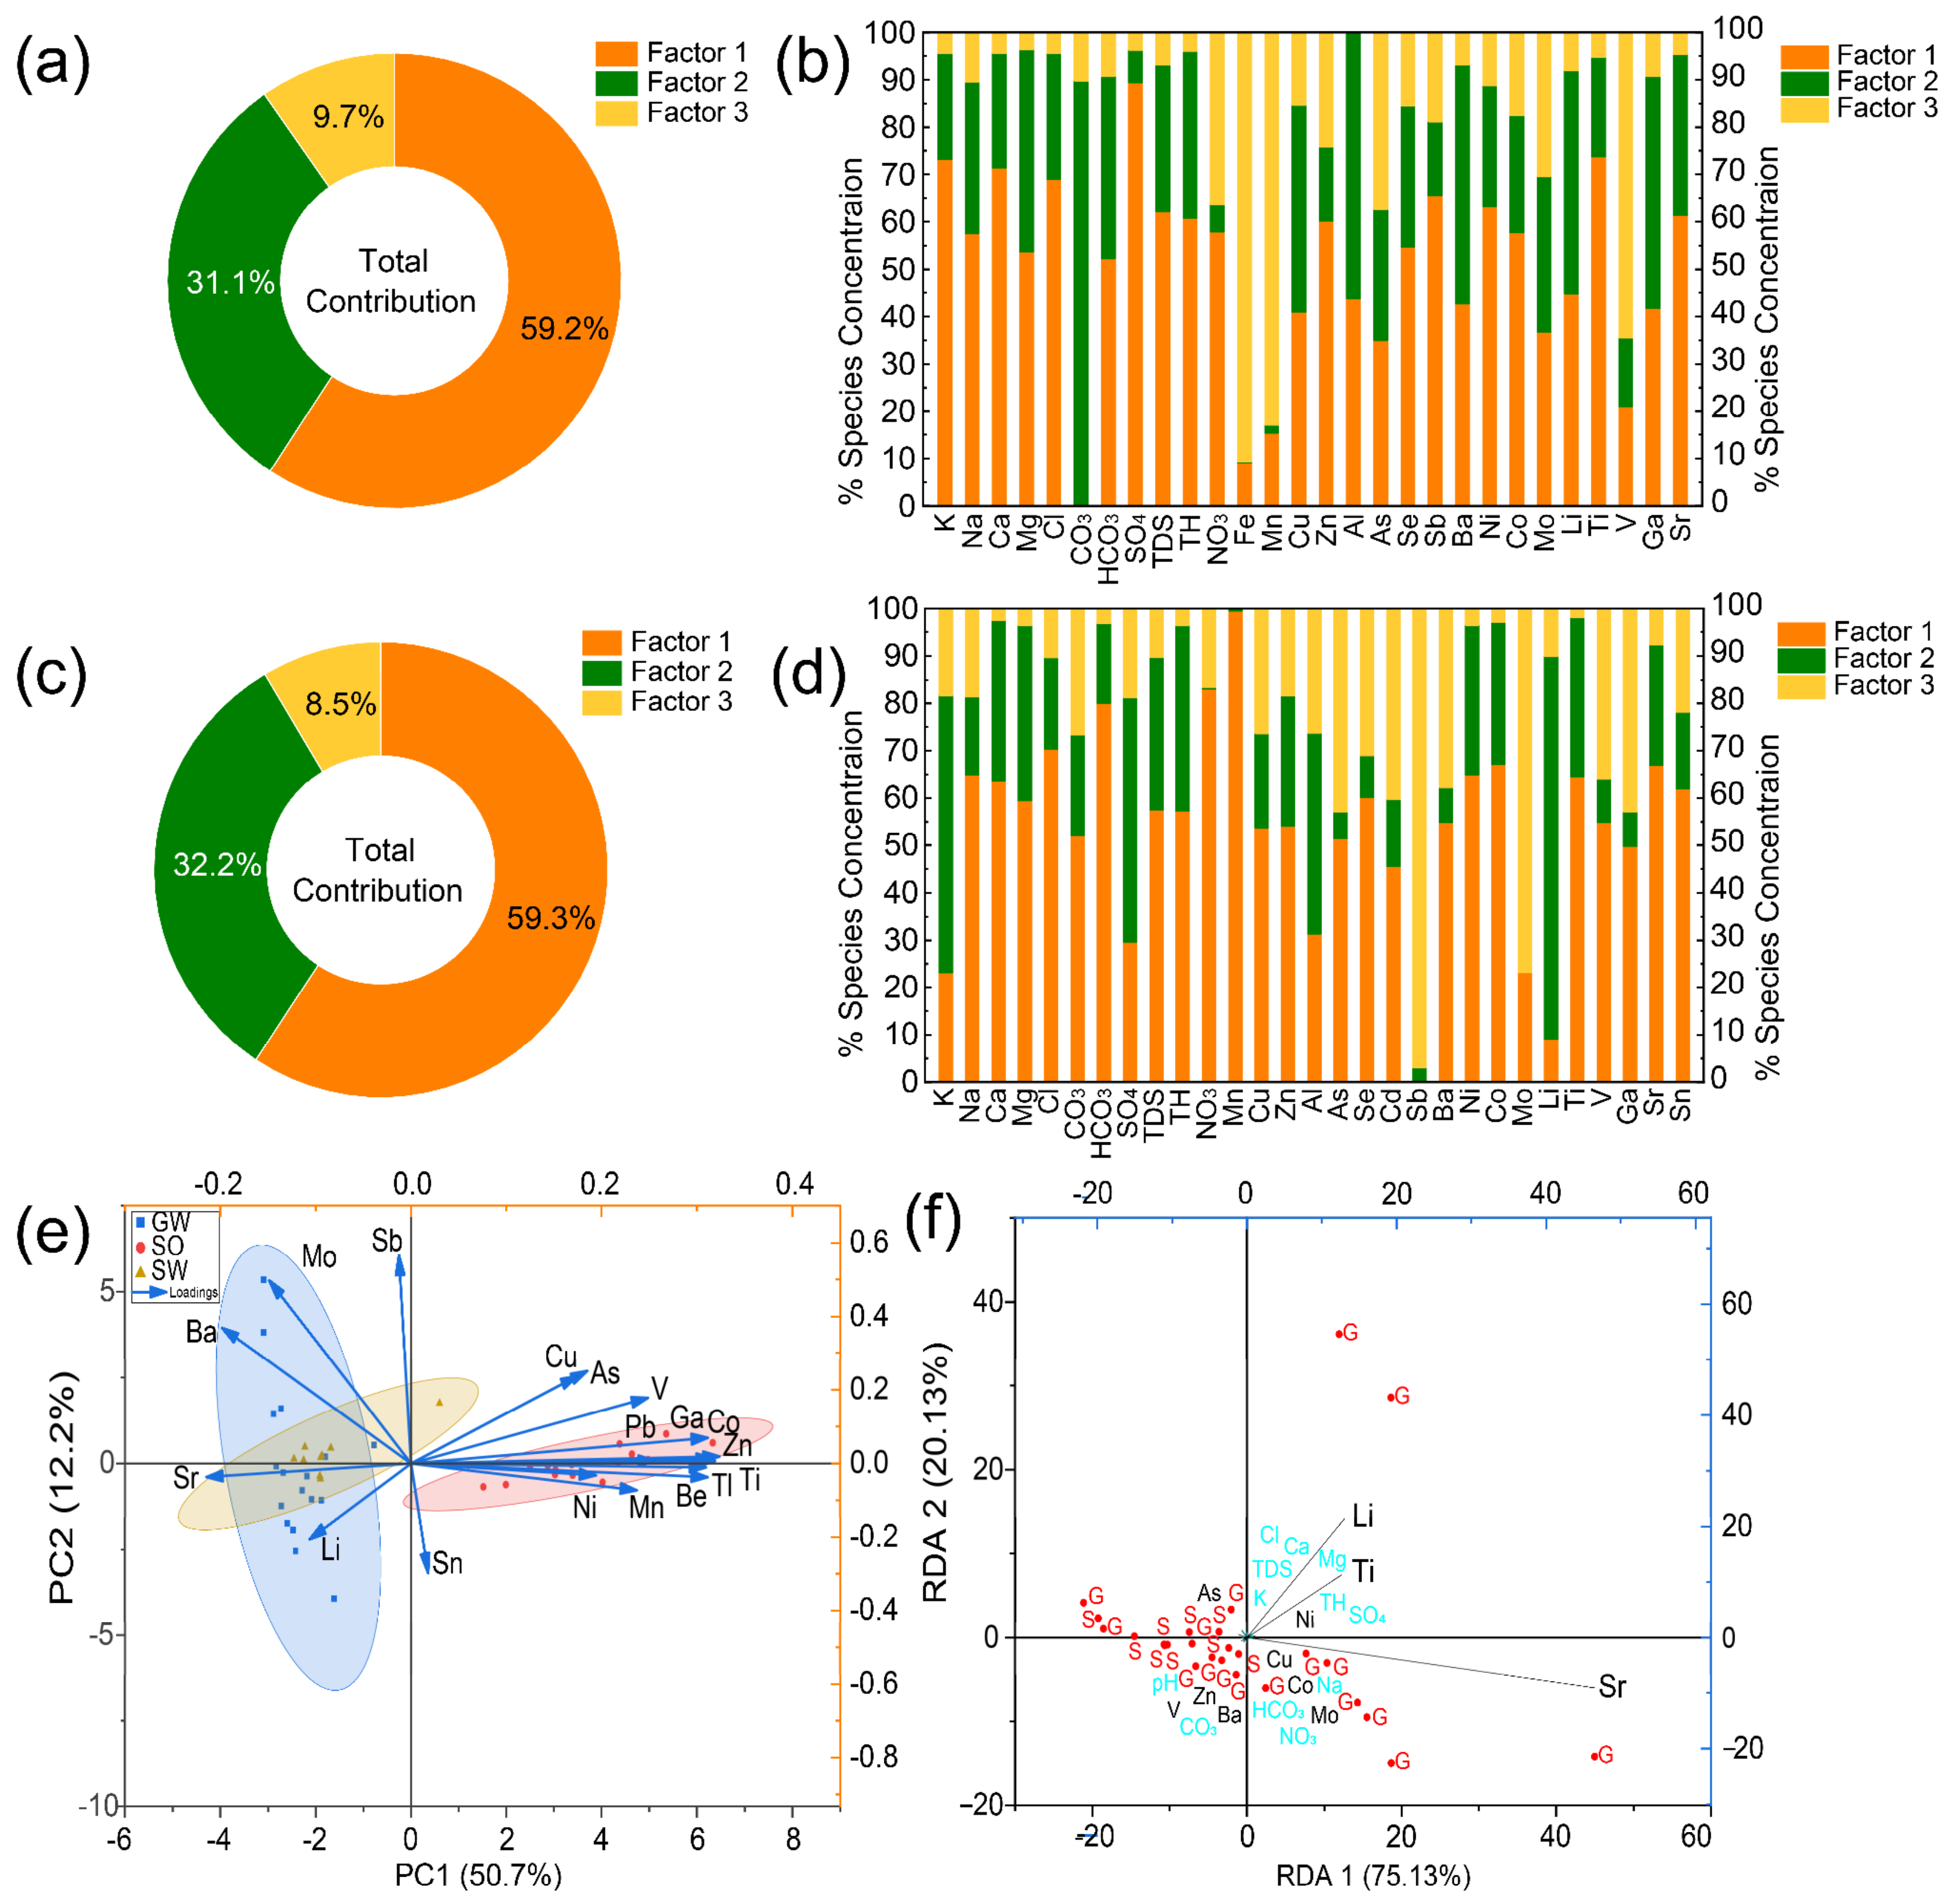
The positive matrix factorization (PMF) model is used to estimate contributions from different sources because it is less susceptible to variations in environmental conditions [49]. The physicochemical parameters, potentially toxic element concentrations, and associated uncertainties from 9 groups of SW samples and 17 groups of GW samples were input into the PMF model. The model was executed 20 times with random starting seeds, and three factors were selected. The results are illustrated in Figure 5. Combining the above analysis with the source apportionment results from the PMF model, it is evident that Factor 1 in surface water predominantly represents natural processes like salt rock dissolution, and mineral weathering, governing the concentrations of hydrogeochemical ions (K, Na, Ca, Mg) and metals (Ti, Sr). Sb, a highly toxic heavy metal, was detected at significantly higher concentrations in surface water than in groundwater. Similarly, Zn levels in surface water markedly exceeded those in groundwater. This phenomenon is attributed to the abundant Sb and Zn mineral resources in the Xilingol League region where sampling sites were located. Sb and Zn are leached into the environment through dissolution in local bicarbonate-dominated waters, leading to surface water contamination. Factor 2 in surface water represents rock weathering processes from natural sources. Ba and Li show high detection rates in SW samples. The weathering of carbonate and silicate minerals such as witherite and lepidolite, as well as clay minerals, along with cation exchange processes, influences the content of metals like Ba and Li [46,47]. Factor 3 in SW samples represents industrial sources such as mining activities. The concentration of Fe in SW is significantly higher than in GW, likely due to leakage recharge. Notably elevated concentrations of Fe and V detected in sample S008 indicate a point source industrial pollution origin.
By conducting Principal Component Analysis (PCA) on the element data in groundwater, surface water and soil, it can be observed that the pollutant distribution in surface water and soil shows a positive correlation, while the pollutant distribution in surface water and groundwater exhibits clustering (Figure 5e). Therefore, surface water acts as an intermediary for pollutants in the soil to enter groundwater. By conducting Redundancy Analysis (RDA) on the water chemistry and element data in surface water and groundwater, it can be observed that the indicator of anthropogenic pollution, nitrate, has a positive correlation with the metal pollutants in groundwater, indicating that the groundwater has indeed been disturbed by human activities (Figure 5f).
Factor 1 in groundwater represents natural processes involving halite dissolution and mineral dissolution. The concentrations of Se and Sr in groundwater are significantly higher than those in surface water, likely suggesting runoff discharge recharge processes. Factor 2 in groundwater represents natural rock weathering processes. Mineral weathering (e.g., lepidolite) and sulfide oxidation primarily influence the concentrations of K, SO42−, Li, Al, etc. Factor 3 in groundwater represents industrial pollution sources from mining activities. The concentrated development of Mo and Sb mining industries in the local area has resulted in anthropogenic pollution sources of these elements.

4.2. Heavy Metal Pollution, Health Risk and Drinking Suitability

4.2.1. Pollution Evaluation of Heavy Metals in Water

Fully understanding the comprehensive pollution caused by heavy metals in surface water and groundwater is essential for regional water environment management. This study employed three methods—the heavy metal pollution index (HPI), Nemerow index (NI), and contamination degree (CD)—to assess the pollution levels of heavy metals in groundwater and surface water, thereby gaining a better understanding of their potential risks. The HPI values of SW samples ranged from 5.86 to 22.09, with an average value of 13.66. According to the HPI classification standards, 4 and 5 SW samples exhibited low and moderate levels of heavy metal pollution, respectively. The NI values ranged from 0.69 to 3.65, with an average of 2.22. According to the NI classification criteria, 1, 3, and 5 SW samples exhibited low, mild, and moderate levels of heavy metal pollution, respectively. The CD values ranged from 2.28 to 11.05, with an average of 5.55. According to the CD classification criteria, 5 and 4 SW samples exhibited low and moderate levels of heavy metal pollution, respectively. The exceedance of Ti in samples S001, S002, S003, and S009, along with the exceedance of V in sample S008, have led to the contamination of surface water in the study area by metal ions from both natural and anthropogenic sources. The results from the three evaluation methods were fairly consistent. Overall, five out of the nine SW samples posed a potential risk to water quality.
As shown in Figure S5, The HPI values for GW samples ranged from 1.38 to 56.66, with an average of 21.20. According to the HPI classification criteria, 7, 6, and 4 GW samples exhibited low, moderate, and moderate-to-high levels of heavy metal contamination, respectively. The NI values ranged from 0.17 to 7.00, with an average of 1.50. According to the NI classification criteria, 9, 6, 1, and 1 GW samples exhibited low, mild, moderate, and severe levels of heavy metal pollution, respectively. The CD values ranged from 0.51 to 16.36, with an average of 4.24. According to the CD classification criteria, 15, 1, and 1 GW samples exhibited low, moderate and significant levels of heavy metal pollution, respectively. The exceedance of Mn and As in samples G003 and G005, combined with the exceedance of Sb in sample G007, has resulted in groundwater contamination by anthropogenically derived metal ions within the study area. Taking into comprehensive consideration the results from the three evaluation methods, approximately 10 out of 17 GW samples posed a risk to water quality.

4.2.2. Health Risk Assessment of Heavy Metals and Nitrate in Water

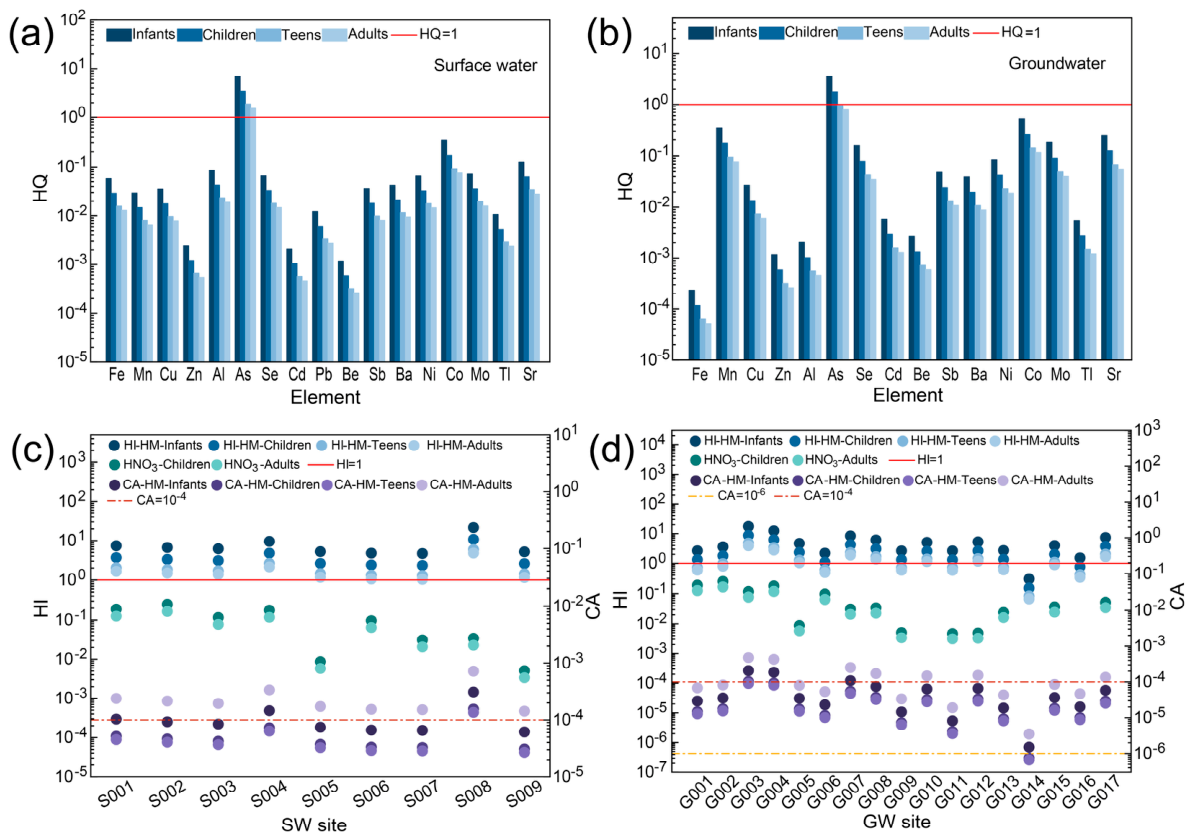
Risks of non-cancer and cancer from drinking water pathways for adults and children were quantified using methods provided by the USEPA. In terms of the non-carcinogenic risk of individual metals (Figure 6a,b), the hazard quotient (HQ) of As in surface water exceeded the threshold value of 1 for all age groups, including infants, children, teens, and adults, while As in groundwater posed risks to infants and children, respectively. The human health risks at each sampling point were evaluated for SW (Figure 6c) and GW samples (Figure 6d). The hazard index (HI) of all metals and nitrate via ingestion was evaluated at each sampling point. As and Cd, classified as known human carcinogens by the International Agency for Research on Cancer (IARC) and the USEPA’s Integrated Risk Information System (IRIS), had their carcinogenic risks evaluated at each sampling point based on concentration levels using carcinogenic risk assessment (CA).
For surface water, the non-carcinogenic risk posed by metals resulted in HI values exceeding the threshold of 1 for infants, children, teens, and adults at all sampling points. The low exceedance rate of nitrate resulted in HI values below the threshold of 1 for both children and adults at all sampling points. The carcinogenic risks of As and Cd exceeded the threshold of 10−4 for adults at all sampling points. For the majority of locations, the CA for infants, children, and teens remained below the threshold. However, at sampling points S001 and S004, the CA values for both adults and infants exceeded the threshold, while at sampling point S008, the CA values for infants, children, teens, and adults all surpassed the threshold, primarily due to the elevated concentration of As.
For groundwater, the elevated exceedance rates of multiple metals resulted in HI values above the threshold of 1 for infants, children, teens, and adults at sites G003, G004, G005, G007, G008, G010, G012, and G017. At site G015, the HI exceeded the threshold for infants, children, and adolescents. Sites G001, G002, G006, G009, G011, and G013 showed HI values above the threshold for infants and children, while at site G016, the HI exceeded the threshold only for infants. In contrast, at site G014, the HI values for all groups (infants, children, teens, and adults) remained below the threshold of 1, indicating a low level of contamination. Similar to surface water, the HI values for nitrate remained below the threshold of 1 for both children and adults at all sampling points. The carcinogenic risks of As and Cd remained below the threshold of 10−4 for infants, children, teens, and adults at the majority of sampling points. However, the CA exceeded the threshold for adults at sites G008, G010, G012, and G017. At sites G004 and G007, the CA values surpassed the threshold for both adults and infants, while at site G003, the threshold was exceeded for adults, infants, and children. These elevated risks were primarily attributed to higher concentrations of As. Simultaneously, the dissolution of surrounding carbonate rocks is accelerated by groundwater with high HCO3 content. Combined with anthropogenic mining activities, this process facilitates the continuous release of metals into groundwater, resulting in potential human health risks.

4.2.3. Drinking Suitability of Groundwater

Groundwater in the study area serves as a drinking water source for local residents. This study evaluated the drinking suitability of groundwater at 17 sampling sites using total dissolved solids (TDS) and total hardness (TH) as indicators. As shown in CC, the TDS results indicate that the majority of groundwater samples in the study area were classified as freshwater (n = 11), with a minority being brackish water (n = 6). 9 sampling sites were classified as soft, medium hard, or hard water, while the TH at 8 sampling sites exceeded the limit for Class III water specified in “Standard for groundwater quality” (GB/T 14848–2017), categorizing them as very hard water. The groundwater samples in the study area exhibited low exceedance rates for heavy metals, demonstrating their suitability for drinking purposes. Based on the combined assessment of TDS and TH, groundwater samples from sites G014 and G016 demonstrated the highest suitability for drinking purposes. Samples from sites G001, G004, G006, G007, G008, G012, and G015 were classified as suitable for direct consumption, whereas groundwater from the remaining sampling sites requires treatment prior to drinking.

5. Conclusions

This study analyzed the hydrogeochemical environment and the distribution characteristics and sources of potentially toxic elements in the Shengli Coalfield study area.
(1) In the study area, the surface water is predominantly of the HCO3-Ca type and the mixed Cl-Ca·Mg type, whereas the groundwater is primarily characterized by the Cl-Na type and the mixed Cl-Ca·Mg type, indicating strong ion exchange processes.
(2) The concentration of potentially toxic elements in the aquatic environment ranged from non-detected to 3285.04 μg/L, with exceeded components primarily including manganese, arsenic, selenium, titanium, and vanadium. Significant spatial variations were observed in the distribution of potentially toxic elements. The concentrations of iron, copper, zinc, aluminum, arsenic, and antimony were significantly higher in surface water than in groundwater, while the concentrations of selenium and strontium were significantly higher in groundwater than in surface water. The sources of potentially toxic elements include rock salt dissolution, mineral dissolution, rock weathering, and mining industrial activities.
(3) The aquatic environment in the study area exhibits comprehensive pollution caused by heavy metals, with more than half of the sampling points showing a moderate pollution level and posing both carcinogenic and non-carcinogenic risks. Groundwater samples from over 50% of the locations require treatment before they are safe for drinking.
(4) The significant interconversion between surface water and groundwater, coupled with natural factors such as the geological genesis of the study area and anthropogenic pollution from industrial activities like mining, collectively contribute to the current state of potentially toxic element contamination in the local aquatic environment.

Supplementary Materials

The following supporting information can be downloaded at https://www.mdpi.com/article/10.3390/w18131604/s1, Figure S1: Graph of heavy metal concentration versus stream distance. Figure S2: The comparison chart of TDS (a), SO42− (b), NO3 (c) and Ni (d) concentrations in national groundwater monitoring stations (GW-N), surface water (SW) and groundwater collected in this study (GW-M), groundwater in the mining area (GW-IM), water leakage in the mining area (GW-LM), groundwater outside the mining area (GW-OM) and soil (SOIL). Figure S3: Metal concentration relationship between SW and GW sample. Figure S4: Correlation between potentially toxic elements and physical and chemical factors in SW (a) and GW (b) samples. Figure S5: Heavy metal pollution evaluation results of SW (a, b, c) and GW (d, e, f) samples. Figure S6: Groundwater drinking suitability. Table S1: Detection methods and detection limits of indicators. Table S2: Exposure factor parameters in health risk assessment model. Table S3: Reference dose of exposure (RfDO) for heavy metals. Table S4: Statistics of characteristic values of hydrochemical indexes. Table S5: Detection frequency, over-standard rate and detection concentration of potentially toxic elements in water samples. Table S6: Origin and context of groundwater samples.

Author Contributions

Conceptualization, R.A. and Y.Z.; methodology, R.A.; software, R.A.; validation, S.L., L.Y. and K.L.; formal analysis, Y.Z.; investigation, R.T.; resources, K.L.; data curation, Y.Z.; writing—original draft preparation, Y.Z.; writing—review and editing, R.A.; visualization, Y.Z.; supervision, Y.F.; project administration, K.L.; funding acquisition, K.L. All authors have read and agreed to the published version of the manuscript.

Funding

This research was funded by Geological Survey Project of China Geological Survey: “Operation of National Underground Water Quality Testing and Quality Control Laboratory”, DD20251300103 and “Construction and Operation of Key Laboratory for Mine Ecological Effects and System Restoration”, grant number DD202513001.

Data Availability Statement

The raw data supporting the conclusions of this article will be made available by the authors on request.

Conflicts of Interest

The authors declare no conflicts of interest.

References

  1. Gao, S.L.; Wang, Z.H.; Wu, Q.X.; Zeng, J. Multivariate statistical evaluation of dissolved heavy metals and a water quality assessment in the Lake Aha watershed, Southwest China. PeerJ 2020, 8, e9660. [Google Scholar] [CrossRef]
  2. Ustaoğlu, F.; Tepe, Y.; Aydin, H. Heavy metals in sediments of two nearby streams from Southeastern Black Sea coast: Contamination and ecological risk assessment. Environ. Forensics 2020, 21, 145–156. [Google Scholar] [CrossRef]
  3. Burakov, A.E.; Galunin, E.V.; Burakova, I.V.; Kucherova, A.E.; Agarwal, S.; Tkachev, A.G.; Gupta, V.K. Adsorption of heavy metals on conventional and nanostructured materials for wastewater treatment purposes: A review. Ecotoxicol. Environ. Saf. 2018, 148, 702–712. [Google Scholar] [CrossRef]
  4. Li, S.Y.; Zhang, Q.F. Spatial characterization of dissolved trace elements and heavy metals in the upper Han River (China) using multivariate statistical techniques. J. Hazard. Mater. 2010, 176, 579–588. [Google Scholar] [CrossRef] [PubMed]
  5. Meng, Q.P.; Zhang, J.; Zhang, Z.Y.; Wu, T.R. Geochemistry of dissolved trace elements and heavy metals in the Dan River Drainage (China): Distribution, sources, and water quality assessment. Environ. Sci. Pollut. Res. 2016, 23, 8091–8103. [Google Scholar] [CrossRef]
  6. Han, G.L.; Song, Z.L.; Tang, Y.; Wu, Q.X.; Wang, Z.R. Ca and Sr isotope compositions of rainwater from Guiyang city, Southwest China: Implication for the sources of atmospheric aerosols and their seasonal variations. Atmos. Environ. 2019, 214, 116854. [Google Scholar] [CrossRef]
  7. Nguyen, T.C.; Loganathan, P.; Nguyen, T.V.; Kandasamy, J.; Naidu, R.; Vigneswaran, S. Adsorptive removal of five heavy metals from water using blast furnace slag and fly ash. Environ. Sci. Pollut. Res. 2018, 25, 20430–20438. [Google Scholar]
  8. Sun, L.; Liu, T.; Duan, L.; Tong, X.; Zhang, W.; Cui, H.; Wang, Z.; Zheng, G. Spatial and temporal distribution characteristics and risk assessment of heavy metals in groundwater of Pingshuo mining area. Environ. Geochem. Health 2024, 46, 141. [Google Scholar] [CrossRef] [PubMed]
  9. Xiao, J.; Wang, L.Q.; Deng, L.; Jin, Z.D. Characteristics, sources, water quality and health risk assessment of trace elements in river water and well water in the Chinese Loess Plateau. Sci. Total Environ. 2019, 650, 2004–2012. [Google Scholar] [CrossRef] [PubMed]
  10. Zeng, J.; Han, G.L.; Yang, K.H. Assessment and sources of heavy metals in suspended particulate matter in a tropical catchment, northeast Thailand. J. Clean. Prod. 2020, 265, 121898. [Google Scholar] [CrossRef]
  11. Sheng, D.R.; Meng, X.H.; Wen, X.H.; Wu, J.; Yu, H.J.; Wu, M. Contamination characteristics, source identification, and source-specific health risks of heavy metal(loid)s in groundwater of an arid oasis region in Northwest China. Sci. Total Environ. 2022, 841, 156733. [Google Scholar] [CrossRef] [PubMed]
  12. Huang, J.L.; Wu, Y.Y.; Sun, J.X.; Li, X.; Geng, X.B.; Zhao, M.L.; Sun, T.; Fan, Z.Q. Health risk assessment of heavy metal(loid)s in park soils of the largest megacity in China by using Monte Carlo simulation coupled with Positive matrix factorization model. J. Hazard. Mater. 2021, 415, 125629. [Google Scholar] [PubMed]
  13. Wang, Z.Y.; Su, Q.; Wang, S.; Gao, Z.J.; Liu, J.T. Spatial distribution and health risk assessment of dissolved heavy metals in groundwater of eastern China coastal zone. Environ. Pollut. 2021, 290, 118016. [Google Scholar] [CrossRef] [PubMed]
  14. Xiao, L.L.; Li, W.; Zhu, C.M.; Yang, S.J.; Zhou, M.; Wang, B.; Wang, X.; Wang, D.M.; Ma, J.X.; Zhou, Y.; et al. Cadmium exposure, fasting blood glucose changes, and type 2 diabetes mellitus: A longitudinal prospective study in China. Environ. Res. 2021, 192, 110259. [Google Scholar] [CrossRef] [PubMed]
  15. Singh, U.K.; Kumar, B. Pathways of heavy metals contamination and associated human health risk in Ajay River basin, India. Chemosphere 2017, 174, 183–199. [Google Scholar] [CrossRef]
  16. Wen, X.H.; Lu, J.; Wu, J.; Lin, Y.C.; Luo, Y.M. Influence of coastal groundwater salinization on the distribution and risks of heavy metals. Sci. Total Environ. 2019, 652, 267–277. [Google Scholar] [CrossRef] [PubMed]
  17. Mukherjee, I.; Singh, U.K.; Singh, R.P.; Anshumali; Kumari, D.; Jha, P.K.; Mehta, P. Characterization of heavy metal pollution in an anthropogenically and geologically influenced semi-arid region of east India and assessment of ecological and human health risks. Sci. Total Environ. 2020, 705, 135801. [Google Scholar] [CrossRef]
  18. Sajjadi, S.A.; Mohammadi, A.; Khosravi, R.; Zarei, A. Distribution, exposure, and human health risk analysis of heavy metals in drinking groundwater of Ghayen County, Iran. Geocarto Int. 2022, 37, 13127–13144. [Google Scholar] [CrossRef]
  19. Wan, D.J.; Song, L.; Mao, X.; Yang, J.S.; Jin, Z.D.; Yang, H.D. One-century sediment records of heavy metal pollution on the southeast Mongolian Plateau: Implications for air pollution trend in China. Chemosphere 2019, 220, 539–545. [Google Scholar] [CrossRef] [PubMed]
  20. Cheng, W.; Lei, S.G.; Bian, Z.F.; Zhao, Y.B.; Li, Y.C.; Gan, Y.D. Geographic distribution of heavy metals and identification of their sources in soils near large, open-pit coal mines using positive matrix factorization. J. Hazard. Mater. 2020, 387, 121666. [Google Scholar] [CrossRef]
  21. HJ 91.2-2022; Technical Specifications for Surface Water Environmental Quality Monitoring. Ministry of Ecology and Environment of the People’s Republic of China: Beijing, China, 2022.
  22. HJ 164-2020; Technical Specifications for Environmental Monitoring of Groundwater. Ministry of Ecology and Environment of the People’s Republic of China: Beijing, China, 2020.
  23. HJ 1315-2023; Soil and Sediment-Determination of 19 Total Metal Elements-Inductively Coupled Plasma Mass Spectrometry. Ministry of Ecology and Environment of the People’s Republic of China: Beijing, China, 2023.
  24. Paatero, P.; Tapper, U. Positive matrix factorization: A non-negative factor model with optimal utilization of error estimates of data values. Environmetrics 1994, 5, 111–126. [Google Scholar]
  25. Qu, L.Y.; Huang, H.; Xia, F.; Liu, Y.Y.; Dahlgren, R.A.; Zhang, M.H.; Mei, K. Risk analysis of heavy metal concentration in surface waters across the rural-urban interface of the Wen-Rui Tang River, China. Environ. Pollut. 2018, 237, 639–649. [Google Scholar] [PubMed]
  26. Vu, C.T.; Lin, C.; Shern, C.-C.; Yeh, G.; Le, V.G.; Tran, H.T. Contamination, ecological risk and source apportionment of heavy metals in sediments and water of a contaminated river in Taiwan. Ecol. Indic. 2017, 82, 32–42. [Google Scholar] [CrossRef]
  27. Sharifi, Z.; Hossaini, S.M.T.; Renella, G. Risk assessment for sediment and stream water polluted by heavy metals released by a municipal solid waste composting plant. J. Geochem. Explor. 2016, 169, 202–210. [Google Scholar] [CrossRef]
  28. GB 3838-2002; Environmental Quality Standards for Surface Water. State Environmental Protection Administration of the People’s Republic of China & General Administration of Quality Supervision, Inspection and Quarantine of the People’s Republic of China: Beijing, China, 2002.
  29. GB/T 14848-2017; Standard for Groundwater Quality. General Administration of Quality Supervision, Inspection and Quarantine of the People’s Republic of China & Standardization Administration of the People’s Republic of China: Beijing, China, 2017.
  30. An, R.; Li, B.; Li, J.; Li, S.P.; Zhu, Q.Y.; Liu, X.Y.; Guo, H.M.; Li, W.P.; Liu, K. Quantifying the vulnerability of karst groundwater to emerging organic compounds in southwest China. Environ. Pollut. 2026, 388, 127374. [Google Scholar] [PubMed]
  31. Wang, L.; Li, Y.; Zhang, Y.P.; Liu, W.; Zhang, H.X. Tracing Sulfate Sources of Surface Water and Groundwater in Liuyang River Basin Based on Hydrochemistry and Environmental Isotopes. Water 2025, 17, 2105. [Google Scholar] [CrossRef]
  32. Wei, S.M.; Zhang, Y.X.; Cai, Z.Z.; Bi, D.W.; Wei, H.H.; Zheng, X.F.; Man, X.B. Evaluation of groundwater quality and health risk assessment in Dawen River Basin, North China. Environ. Res. 2025, 264, 120292. [Google Scholar] [PubMed]
  33. Basnet, N.; Sitaula, S.; Bohara, R.; Bhattarai, S.; Rawal, S.; Uprety, M.P.; Awasthi, M.P.; Varol, M.; Kayastha, S.P.; Pant, R.R. Hydro-chemical characteristics of Biring and Tangting Rivers (Nepal) and evaluation of water quality for drinking and irrigation purposes. Environ. Res. 2024, 261, 119697. [Google Scholar] [CrossRef] [PubMed]
  34. Gibbs, R.J. Mechanisms controlling world water chemistry. Science 1970, 170, 1088–1090. [Google Scholar] [CrossRef] [PubMed]
  35. Saxena, A.; Kumar, M.; Singh, R.; Bahukhandi, K.D. Land use alters the alignment of Arsenic and Chromium co-contamination in the unconsolidated aquifer under reducing environments of the Mid-Gangetic Plains. Sci. Total Environ. 2025, 989, 179816. [Google Scholar] [PubMed]
  36. Yang, Z.Q.; Hu, L.T.; Ma, H.Y.; Zhang, W. Hydrochemical Characteristics of Groundwater and Their Significance in Arid Inland Hydrology. Water 2023, 15, 1641. [Google Scholar] [CrossRef]
  37. Zhang, T.; Wang, P.; He, J.; Liu, D.D.; Wang, M.; Wang, M.G.; Xia, S.B. Hydrochemical Characteristics, Water Quality, and Evolution of Groundwater in Northeast China. Water 2023, 15, 2669. [Google Scholar] [CrossRef]
  38. Faye, S.; Maloszewski, P.; Stichler, W.; Trimborn, P.; Faye, S.C.; Gaye, C.B. Groundwater salinization in the Saloum (Senegal) delta aquifer: Minor elements and isotopic indicators. Sci. Total Environ. 2005, 343, 243–259. [Google Scholar] [CrossRef] [PubMed]
  39. Borrok, D.M.; Lenz, R.M.; Jennings, J.E.; Gentry, M.L.; Steensma, J.; Vinson, D.S. The origins of high concentrations of iron, sodium, bicarbonate, and arsenic in the Lower Mississippi River Alluvial Aquifer. Appl. Geochem. 2018, 98, 383–392. [Google Scholar] [CrossRef]
  40. Zhang, X.Y.; Miao, J.J.; Hu, B.X.; Liu, H.W.; Zhang, H.X.; Ma, Z. Hydrogeochemical characterization and groundwater quality assessment in intruded coastal brine aquifers (Laizhou Bay, China). Environ. Sci. Pollut. Res. 2017, 24, 21073–21090. [Google Scholar] [CrossRef]
  41. Natasha; Bibi, I.; Shahid, M.; Niazi, N.K.; Younas, F.; Naqvi, S.R.; Shaheen, S.M.; Imran, M.; Wang, H.; Hussaini, K.M.; et al. Hydrogeochemical and health risk evaluation of arsenic in shallow and deep aquifers along the different floodplains of Punjab, Pakistan. J. Hazard. Mater. 2021, 402, 124074. [Google Scholar] [CrossRef] [PubMed]
  42. Xiao, Y.; Shao, J.L.; Frape, S.K.; Cui, Y.L.; Dang, X.Y.; Wang, S.B.; Ji, Y.H. Groundwater origin, flow regime and geochemical evolution in arid endorheic watersheds: A case study from the Qaidam Basin, northwestern China. Hydrol. Earth Syst. Sci. 2018, 22, 4381–4400. [Google Scholar] [CrossRef]
  43. Hauke, J.; Kossowski, T. Comparison of Values of Pearson’s and Spearman’s Correlation Coefficients on the Same Sets of Data. Quaest. Geogr. 2011, 30, 87–93. [Google Scholar]
  44. Salifu, M.; Aiglsperger, T.; Hällström, L.; Martinsson, O.; Billström, K.; Ingri, J.; Dold, B.; Alakangas, L. Strontium (87Sr/86Sr) isotopes: A tracer for geochemical processes in mineralogically-complex mine wastes. Appl. Geochem. 2018, 99, 42–54. [Google Scholar]
  45. Gaillardet, J.; Dupré, B.; Louvat, P.; Allègre, C.J. Global silicate weathering and CO2 consumption rates deduced from the chemistry of large rivers. Chem. Geol. 1999, 159, 3–30. [Google Scholar] [CrossRef]
  46. Gou, L.F.; Jin, Z.D.; Galy, A.; Gong, Y.Z.; Nan, X.Y.; Jin, C.Y.; Wang, X.D.; Bouchez, J.; Cai, H.M.; Chen, J.B.; et al. Seasonal riverine barium isotopic variation in the middle Yellow River: Sources and fractionation. Earth Planet. Sci. Lett. 2020, 531, 115990. [Google Scholar] [CrossRef]
  47. Song, Y.L.; Zhang, X.; Bouchez, J.; Chetelat, B.; Gaillardet, J.; Chen, J.B.; Zhang, T.; Cai, H.M.; Yuan, W.; Wang, Z.W. Deciphering the signatures of weathering and erosion processes and the effects of river management on Li isotopes in the subtropical Pearl River basin. Geochim. Cosmochim. Acta 2021, 313, 340–358. [Google Scholar] [CrossRef]
  48. Sun, S.S.; Deng, T.H.B.; Ao, M.; Yang, W.J.; Liu, X.R.; Liu, T.; Zhu, J.M.; Morel, J.L.; Tang, Y.T.; Qiu, R.L. Nickel isotope fractionation during intense weathering of basalt: Implications for Ni output from continental weathering. Geochim. Cosmochim. Acta 2024, 367, 107–122. [Google Scholar]
  49. Zhang, H.; Cheng, S.Q.; Li, H.F.; Fu, K.; Xu, Y. Groundwater pollution source identification and apportionment using PMF and PCA-APCA-MLR receptor models in a typical mixed land-use area in Southwestern China. Sci. Total Environ. 2020, 741, 140383. [Google Scholar] [CrossRef] [PubMed]
Figure 1. An overview map of the study area (a) and distribution of the sampling points (b).
Water 18 01604 g001
Figure 2. Hydrogeological characteristics of surface water and groundwater in the study area: (a) Piper diagram; (b) groundwater Gibbs diagram; (c) groundwater Gibbs diagram; (d) γNa/γCl criterion value diagram; (e) γ(Ca2+ + Mg2+ − HCO3 − SO42−)/γ(Na+ + Cl) criterion value diagram; (f) γ(Ca2+ + Mg2+)/γ(HCO3 + SO42−) criterion value diagram.
Water 18 01604 g002
Figure 3. Comparison of concentrations of potentially toxic elements detected in surface water and groundwater samples.
Water 18 01604 g003
Figure 4. Concentration distribution map of TDS (a), SO42− (b), NO3 (c) and Ni (d) in surface water and groundwater and the concentration changes along the direction of the river flow TDS, SO42−, NO3 and Ni (e).
Water 18 01604 g004
Figure 5. PMF analysis results of surface water (a,b) and groundwater (c,d) samples, PCA results of surface water, groundwater and soil, (e) and RDA results of surface water and groundwater (f).
Water 18 01604 g005
Figure 6. Heavy metal health risk assessment of surface water (a,c) and groundwater (b,d) samples.
Water 18 01604 g006
Disclaimer/Publisher’s Note: The statements, opinions and data contained in all publications are solely those of the individual author(s) and contributor(s) and not of MDPI and/or the editor(s). MDPI and/or the editor(s) disclaim responsibility for any injury to people or property resulting from any ideas, methods, instructions or products referred to in the content.