Article

Development of Integrated Geomorphological and Hydrological GIS Platform for Prospective Dam Site Analysis


1
Department of River and Harbor Engineering, National Taiwan Ocean University, Keelung 202301, Taiwan
2
Geographic Information Research Center, National Taiwan Ocean University, Keelung 202301, Taiwan
3
National Science and Technology Center for Disaster Reduction, New Taipei City 231007, Taiwan
*
Author to whom correspondence should be addressed.
Water 2026, 18(13), 1596; https://doi.org/10.3390/w18131596
Submission received: 16 May 2026 / Revised: 26 June 2026 / Accepted: 29 June 2026 / Published: 1 July 2026

Abstract

Constructing new reservoirs to ensure a reliable water supply in downstream areas and to alleviate overflow flooding along rivers during floods is an urgent task for the authorities. In this study, we developed a GIS platform that integrates a series of watershed geomorphological and hydrological models to assess the suitability of prospective dam sites. The built-in modules include watershed geomorphological analysis, rainfall analysis, flow analysis, surplus water analysis, and reservoir analysis. Using the digital elevation model, users can obtain the reservoir H-A-V curve at a prospective dam site and the upstream watershed’s geomorphological factors. A topography-based hydrological model was used to estimate available water at the dam site, and surplus water was obtained by subtracting existing water demands and/or environmental flow requirements from the available water series. Exceedance probability analysis was then conducted for the surplus water to evaluate the dam site’s feasibility for new water resources development. The system also provides a reservoir’s useful-life evaluation to determine the time required for sediment accumulation to render the reservoir unable to serve its intended purpose. Moreover, for flood control, the platform includes a built-in module for estimating design discharge for different return periods. The planned Pingxi Reservoir site in New Taipei County, Taiwan, is used as an example in this study. Detailed analytical procedures are presented to demonstrate the use of the proposed integrated GIS platform system to assess the adequacy of prospective dam sites for new water resources development.

1. Introduction

Urban growth and climate fluctuations are intensifying the need for water resources and flood management systems. If existing reservoirs cannot provide sufficient storage during droughts, new reservoirs should be constructed to store additional water to compensate for the uneven temporal distribution of rainfall. In conducting a feasibility study for a new reservoir, a large amount of watershed geomorphological and hydrological data, along with the latest water-use information, is required to estimate the surplus water at prospective dam sites. With the ongoing evolution of information technology, the design concept of analysis systems has shifted toward an integrated, Windows-based operating environment that generates tables, graphs, and high-resolution images. The early development of a geographic information system (GIS)- based hydrological platform may be traced back to Steube & Johnston [1], who began applying a GIS to analyze the CN value in the Soil Conservation Service (SCS) formula, thereby simplifying time-consuming data processing. Maidment [2] identified four levels of hydrologic modeling within GIS: hydrologic assessment, hydrologic parameter determination, hydrologic modeling, and linking GIS and hydrologic models, which provides an efficient way to solve complex water resource problems. Building on the Open GIS concept, Feng [3] proposed a preliminary framework for open hydrological modeling that treats analysis modules as separate, pluggable components within the GIS platform. Lee et al. [4] integrated a DEM and the kinematic-wave-based geomorphologic IUH model [5] within a GIS platform, which enables users to extract geomorphologic factors and generate discharge information at any point within the watershed. Grasso et al. [6] developed a web-based, open-source geoinformation tool for estimating flow duration curves using a regional statistical model that relates basin topographic parameters, climatic characteristics, and environmental factors, enabling its application to ungauged basins. As public awareness grows, information on stricter measures and enacted legislation related to water resource use should be readily accessible and easy to understand. Hence, integrating GIS technology with hydrological analyses on a single platform can facilitate the planning, design, and management of water resources projects [7].
Although GIS can provide detailed spatial topographic information, water resource planning in flow-ungauged watersheds remains a significant challenge in hydrology. The most common approach is to transfer information from nearby flow-gauged watersheds with similar characteristics when regional geomorphological and hydrological data are available [8,9,10]. Given that digital elevation datasets and remote sensing images are available worldwide, hydrological model development based on a digital elevation model (DEM) to extract watershed geomorphological characteristics and link them with remote sensing images for land cover classification to determine model parameters has been recognized as a practical approach for hydrological analysis. Physically based models such as TOPOMODEL [11], KW-GIUH [5,12], SWAT [13], HBV [14], and HEC-HMS [15] are readily available to hydrologists. HEC-HMS is initially designed for event-based flood modeling, though it can also perform continuous simulation. KW-GIUH focuses on individual storm simulation. SWAT and HBV are designed explicitly for long-term simulation at daily time steps; they may not be used adequately for individual storm simulation. TOPMODEL may be the appropriate model for both short- and long-term simulations across different countries worldwide [16,17]. The model was initially developed to simulate runoff processes in a small upstream watershed in the United Kingdom [11]. The topographic index, ln(a/tan β), was used to describe gravity-driven water accumulation. The spatial distribution of groundwater-level depth and subsurface runoff discharge can then be estimated using limited topographic information in the watershed. The challenge with applying TOPMODEL is calibrating the model parameters without observed flow data, either by using regional parameters or by calibrating against occasional field observations. Quinn and Beven [18] applied TOPMODEL to simulate watershed runoff and analyzed changes in hydrographs between the wet and dry seasons. Quinn et al. [19] investigated the influence of different topographic indices on the model simulations and used them to calculate partial contributing area ratios during storms. Beven and Freer [20] proposed a dynamic TOPMODEL, in which kinematic-wave routing of subsurface flow is implemented to simulate dynamically variable contributing areas. Vincendon et al. [21] coupled the ISBA land surface model with TOPMODEL, yielding improved simulation results compared with the ISBA model alone. Gao et al. [22] developed a distributed TOPMODEL to incorporate spatial land-management configurations for flood-peak prediction in an upland watershed. Li et al. [23] assessed the performance of two popular uncertainty analysis techniques, generalized likelihood uncertainty estimation and the Bayesian method, to evaluate TOPMODEL parameter uncertainty in flood simulations. Gumindoga et al. [24] used a surface energy balance system and TOPMODEL to estimate soil moisture in Zimbabwe. They validated the estimates against ground-based soil moisture sampling sites, achieving good agreement.
The research mentioned above has shown the successful application of TOPMODEL for runoff prediction. The model relies on topographic information to derive the rainfall-runoff relationship. A more efficient and precise way to perform topographic analysis in the study watershed is to use a DEM to extract topographic factors, thereby reducing labor-intensive work. The merit of TOPMODEL for runoff simulation is that only three parameters need to be calibrated, and it is widely accepted for hydrological analysis by the Taiwan Water Resource Agency, so we chose TOPMODEL for further analysis.
The available water analysis assesses how much water naturally exists in a system before any demands are subtracted and can be used or allocated. Therefore, available water can be simulated using TOPMODEL when flow records are unavailable. Hence, a GIS platform integrated with topographic and hydrological analysis systems would be a convenient tool for water resource assessment [25,26,27]. The required input data for conducting water resources analysis at a prospective dam site include DEM and hydrological datasets. Users can conduct a DEM analysis to obtain geomorphological factors for the upstream watershed of the prospective dam site. In the available water analysis, users can apply TOPMODEL to generate daily flow series from historical rainfall records. The surplus water can then be calculated by considering existing water demands and downstream environmental flow requirements. So, the surplus water assessment focuses on net surplus water—what remains for new users and future development. Hence, the exceedance probability of the surplus water can be estimated to develop the flow duration curve to determine whether the prospective dam site can provide enough water to compensate for the water deficit. Subsequently, based on a water level–area–storage volume (H-A-V) curve, a reservoir analysis is performed to estimate the possible dam height to provide the required water storage capacity. A reservoir useful-life analysis will also be conducted to determine the guaranteed duration of water supply availability and to guide planning for alternative sources or infrastructure as needed.
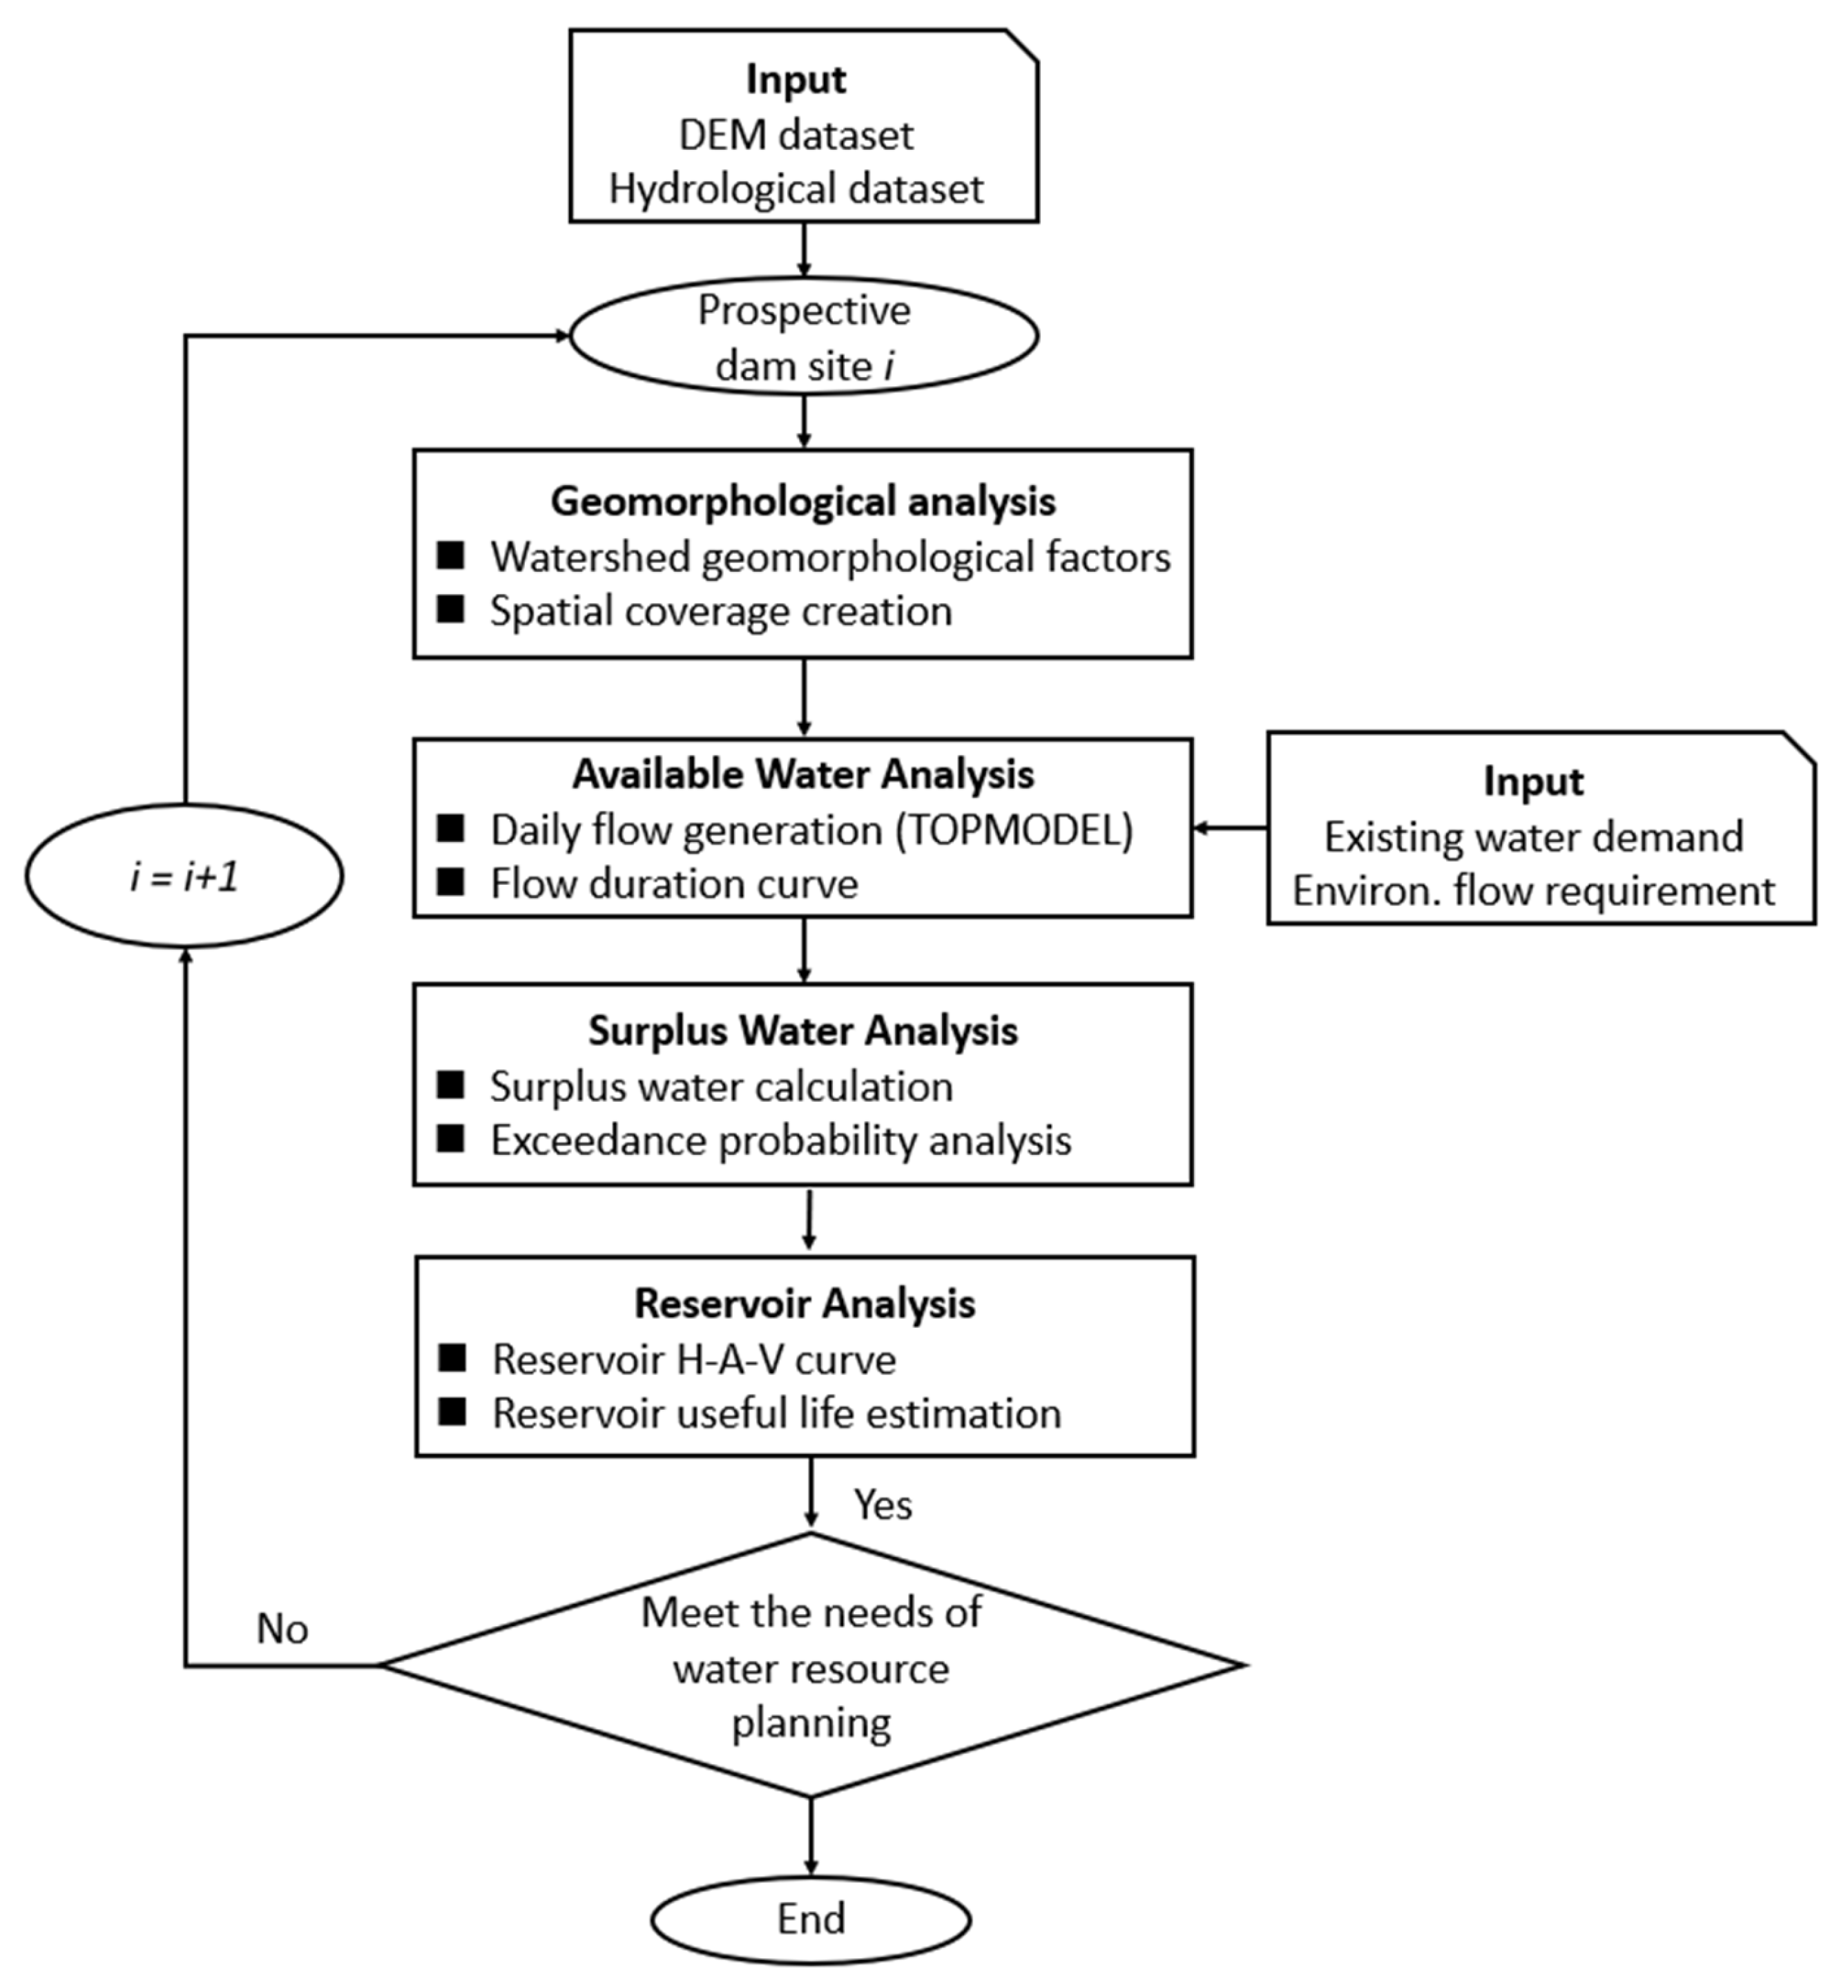
This study presents a GIS platform designed to streamline access to geomorphological and hydrological information required to evaluate the feasibility of prospective dam sites. We outline a systematic procedure for new water resources developments, leveraging the proposed platform to accelerate site assessment. As illustrated in the flowchart in Figure 1, engineers can identify prospective dam sites within the platform and determine the optimal location through a series of analyses considering local geological and hydrological conditions and engineering feasibility. This integrated GIS platform will serve as an efficient and practical tool, enabling engineers to complete the planning phase for prospective dam sites with greater ease and confidence.

2. Analytical Methods

In conducting a feasibility study for a new water resource project, hydrologists often face the challenge of insufficient flow records at prospective dam sites for calibrating model parameters. Since TOPMODEL can be developed solely from watershed topographic characteristics, it is suitable for flow simulation and assessing available water resources at any location in the watershed. To fulfill the topographic information required for performing TOPMODEL, a DEM is used to calculate watershed geomorphological factors and the reservoir H-A-V relationship. The geomorphological and hydrological analysis methods used in this study are described as follows.

2.1. Watershed Geomorphology and Reservoir H-A-V

A DEM is used to facilitate computer interpretation by converting digital elevation datasets for channel and valley descriptions. The main concept of interpretation is to discriminate among the relative attributes of the designated grid and its adjacent grids to determine the flow direction. The upstream contributing area at a control point can be obtained by multiplying the cumulative flow-path number by the DEM grid size. The mainstream in the watershed is subjectively determined; this study calculates the distance from the source point of a 1st-order stream to the watershed outlet. The longest flow path is recognized as the watershed’s mainstream. The grid-average slope is estimated from the central grid point and the surrounding grids whose elevations are lower than the central grid’s. Using the contributing area per unit width and the slope value, the topographic index [11] can be derived for each grid point in the watershed.
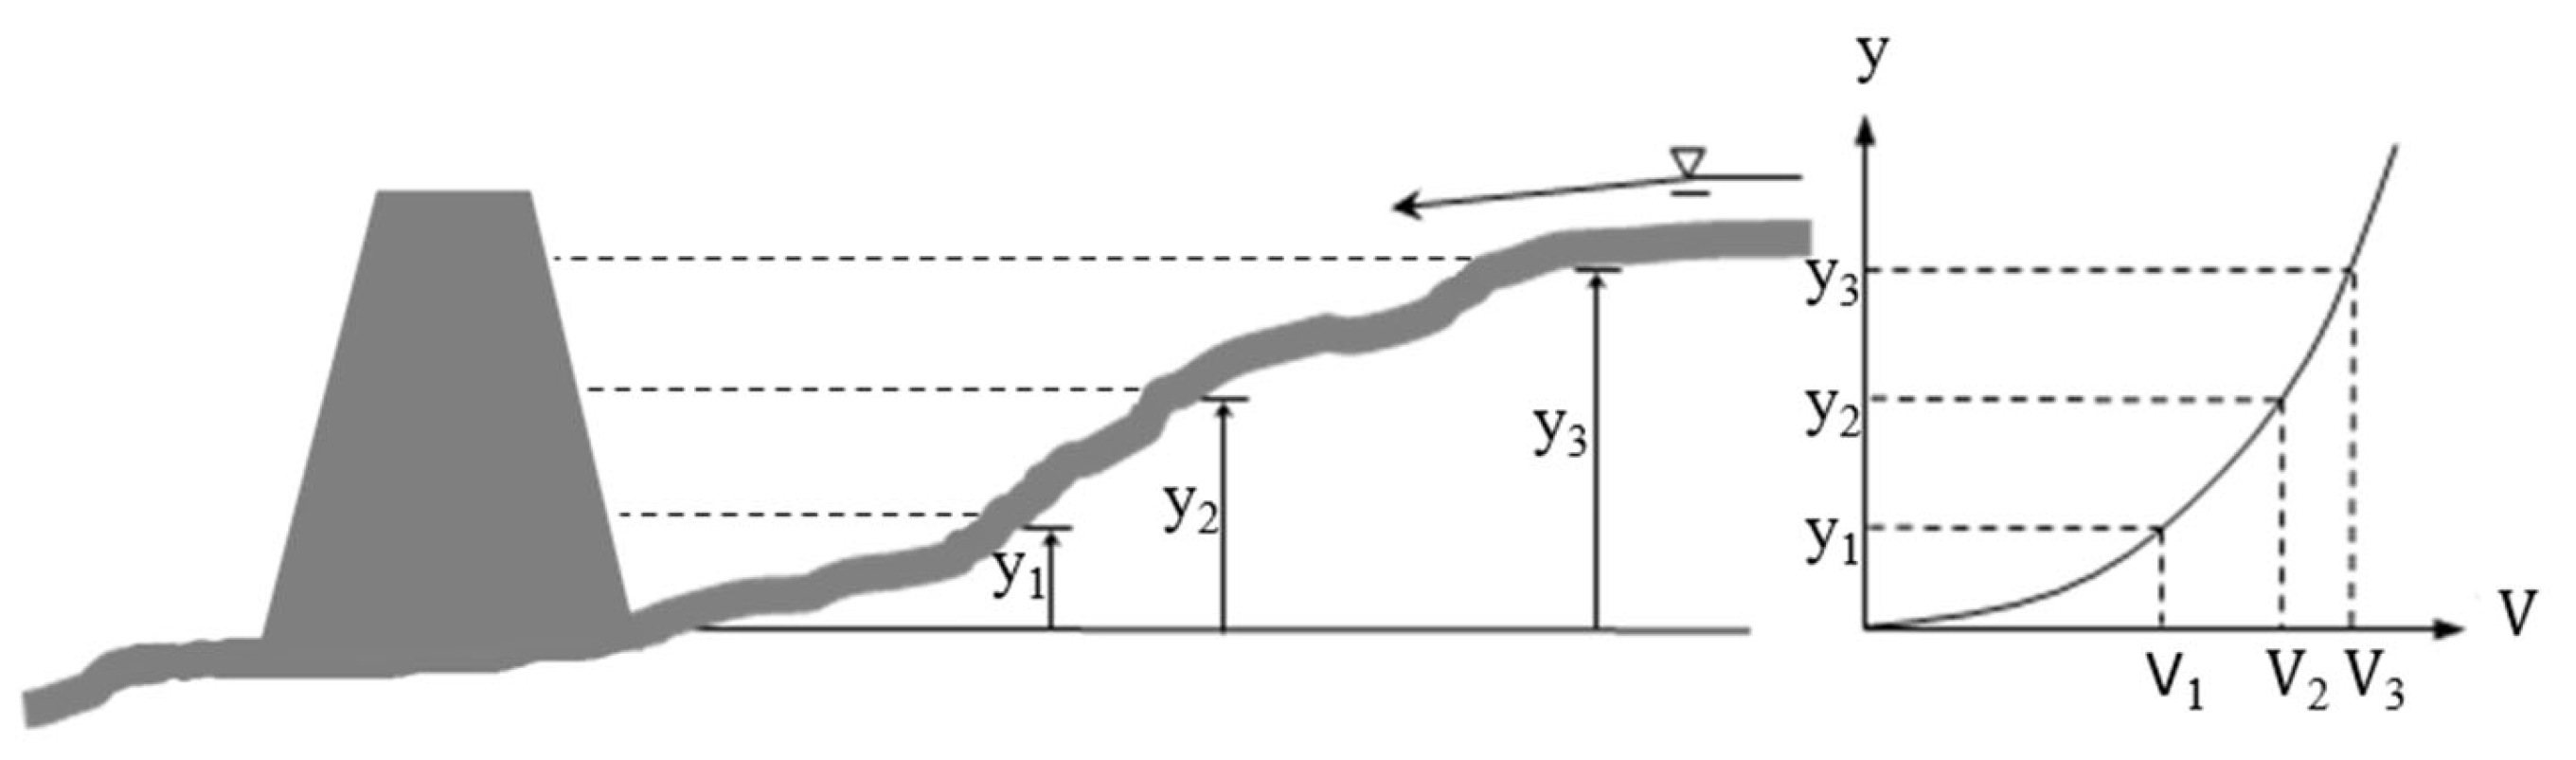
The H-A-V curve for different dam heights at a prospective site can be derived accurately from a high-resolution DEM. As shown in Figure 2, the water surface coverages can be obtained by assigning different water levels from the channel bottom to the dam crest. Consequently, the storage volume of the reservoir for a specified elevation, H, can be estimated by integrating the elevation area function as
V ( H ) = H o H A ( y ) d y
where V H is the storage volume for a specified elevation of H ; A(y) is the elevation area function; and Ho is the elevation of the channel bottom. The elevation-storage function of the prospective reservoir can then be obtained by integrating for different elevations.

2.2. Daily Flow Simulation

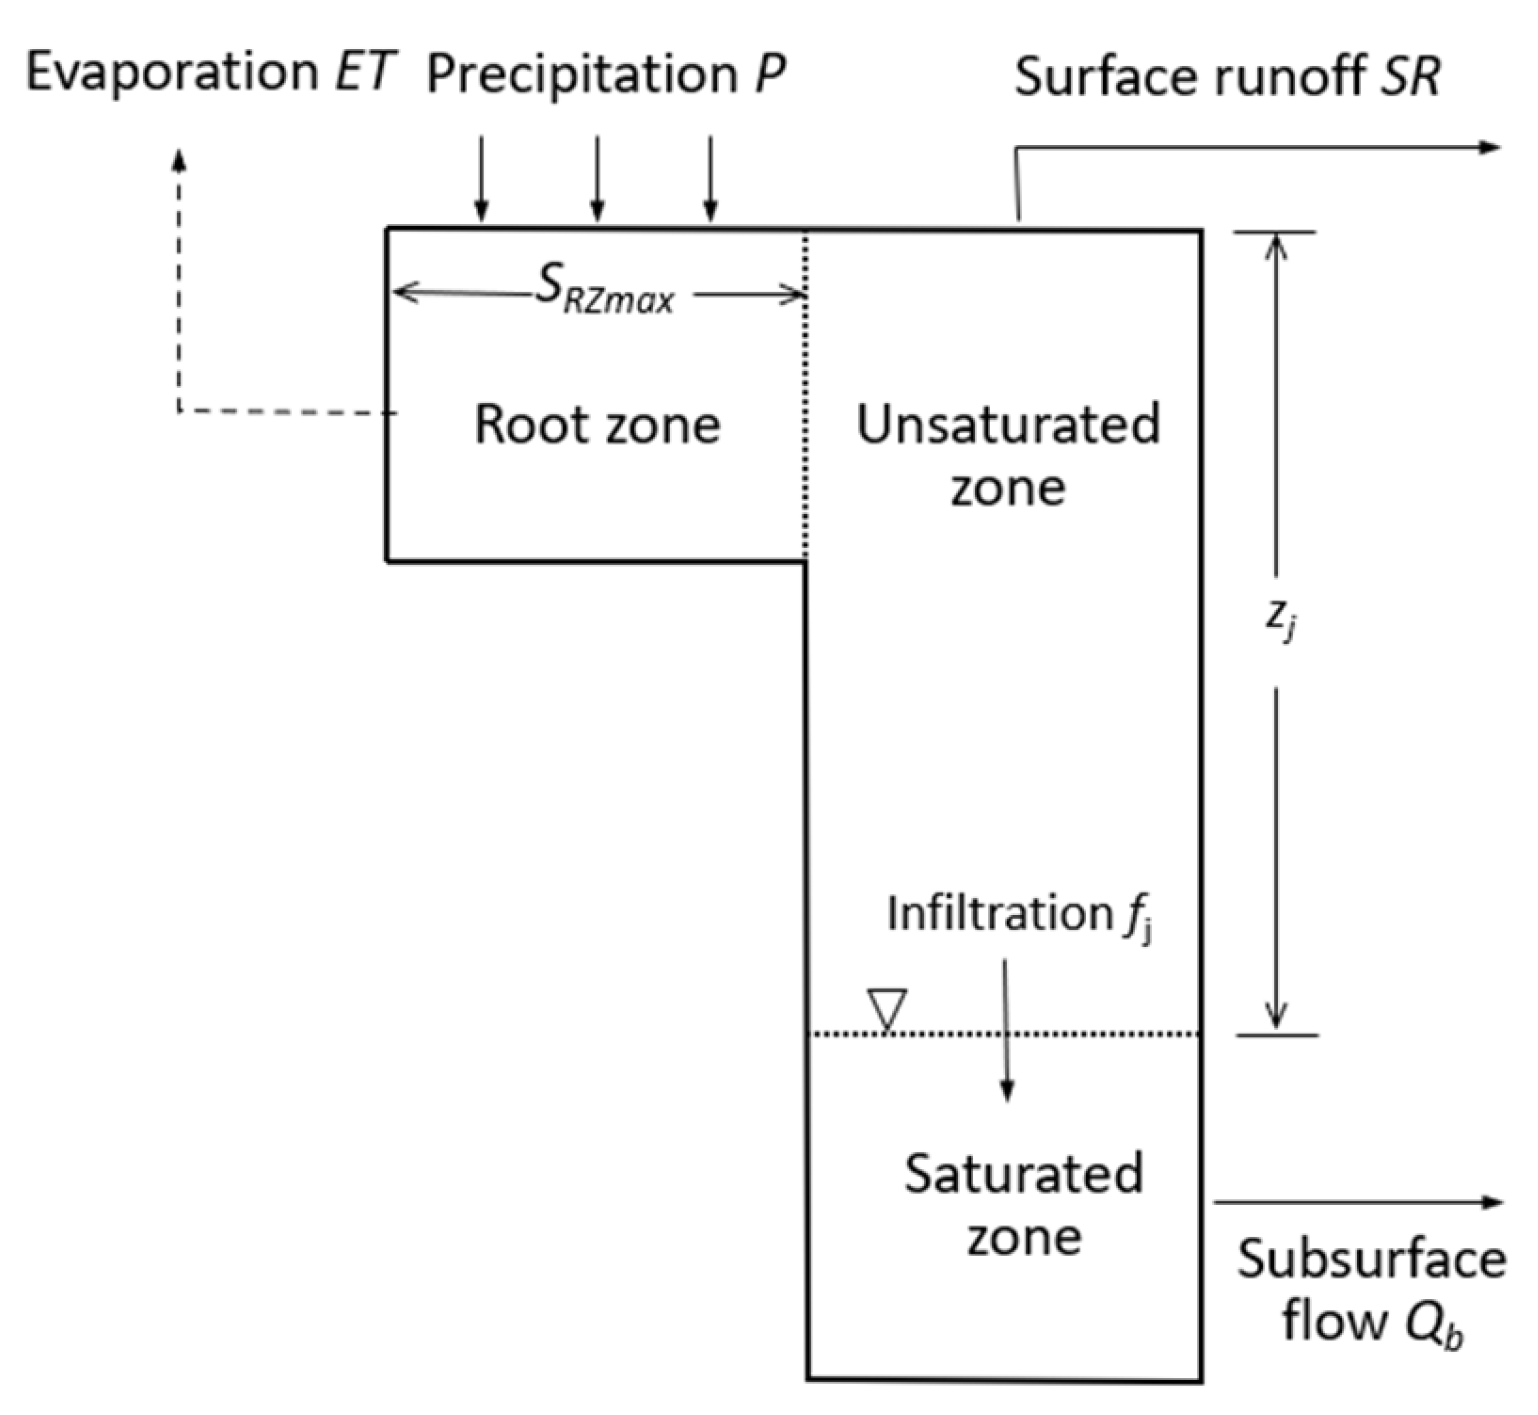
TOPMODEL is used in this study to simulate daily flow series for evaluating available water in the project area. The model was developed by Beven and Kirkby [11] using a topographic index to describe the flow accumulation in the watershed. As shown in Figure 3, the flow in the watershed was divided into a root zone, an unsaturated soil zone, and a saturated soil zone. When a rainstorm occurs, rain falls and infiltrates the root zone. Once the rainwater in the root zone exceeds its maximum storage capacity ( S R Z max ), it moves from the root zone into the unsaturated zone. If rainfall is continuous, the amount of rainwater stored in the unsaturated zone gradually percolates to the saturated zone. As groundwater rises, it reaches the ground surface and forms surface runoff.
In TOPMODEL, the depth from the ground surface to the groundwater table is estimated based on the assumption of exponential decay of hydraulic conductivity with depth, which can be expressed as [11]
K = K 0 exp ( z m )
where K0 is the saturated hydraulic conductivity at the ground surface; z is the depth from the ground surface to the groundwater table at a specified point; and m is a coefficient. The vertical infiltration flux at position j can be expressed as [11]
f j ( t ) = α 0 K 0 exp z j ( t ) m
where α 0 is the effective vertical hydraulic gradient ( α 0 1 ), and K0 is the saturated conductivity. Since a quasi-steady-state configuration of the water table is assumed to be parallel to the local surface slope, the depth to the groundwater table can be expressed as
z j = z ¯ + m λ ln a j tan β j
where z j is the depth from the ground surface to the groundwater table at a specified point j; z ¯ is the average depth of the groundwater table in the watershed; ln a j / tan β j is the topographic index, in which aj is the upstream contributing area per unit contour length of the specified point, and βj is the local slope at point j; and λ is the mean value of the topographic index of the watershed. Hence, the total subsurface flow discharge can be correlated to the average depth of the groundwater table as
Q b ( t ) = Q 0 exp z ¯ ( t ) m
where Q b is the total subsurface flow discharge per unit width, and Q 0 is the discharge per unit width at saturation on unit slope gradient. As shown in Figure 3, the river flow is the summation of the surface return flow and the subsurface flow that drains laterally from the hillslopes. There are three parameters in TOPMODEL: the saturated hydraulic conductivity ( K 0 ), the maximum storage capacity ( S R Z max ), and an exponential decay constant (m). Across the large area, the spatial variability of the three parameters is assumed limited [11]; therefore, we can directly apply the calibrated parameters from nearby flow stations to the project site.

2.3. Surplus Water Estimation at the Dam Site

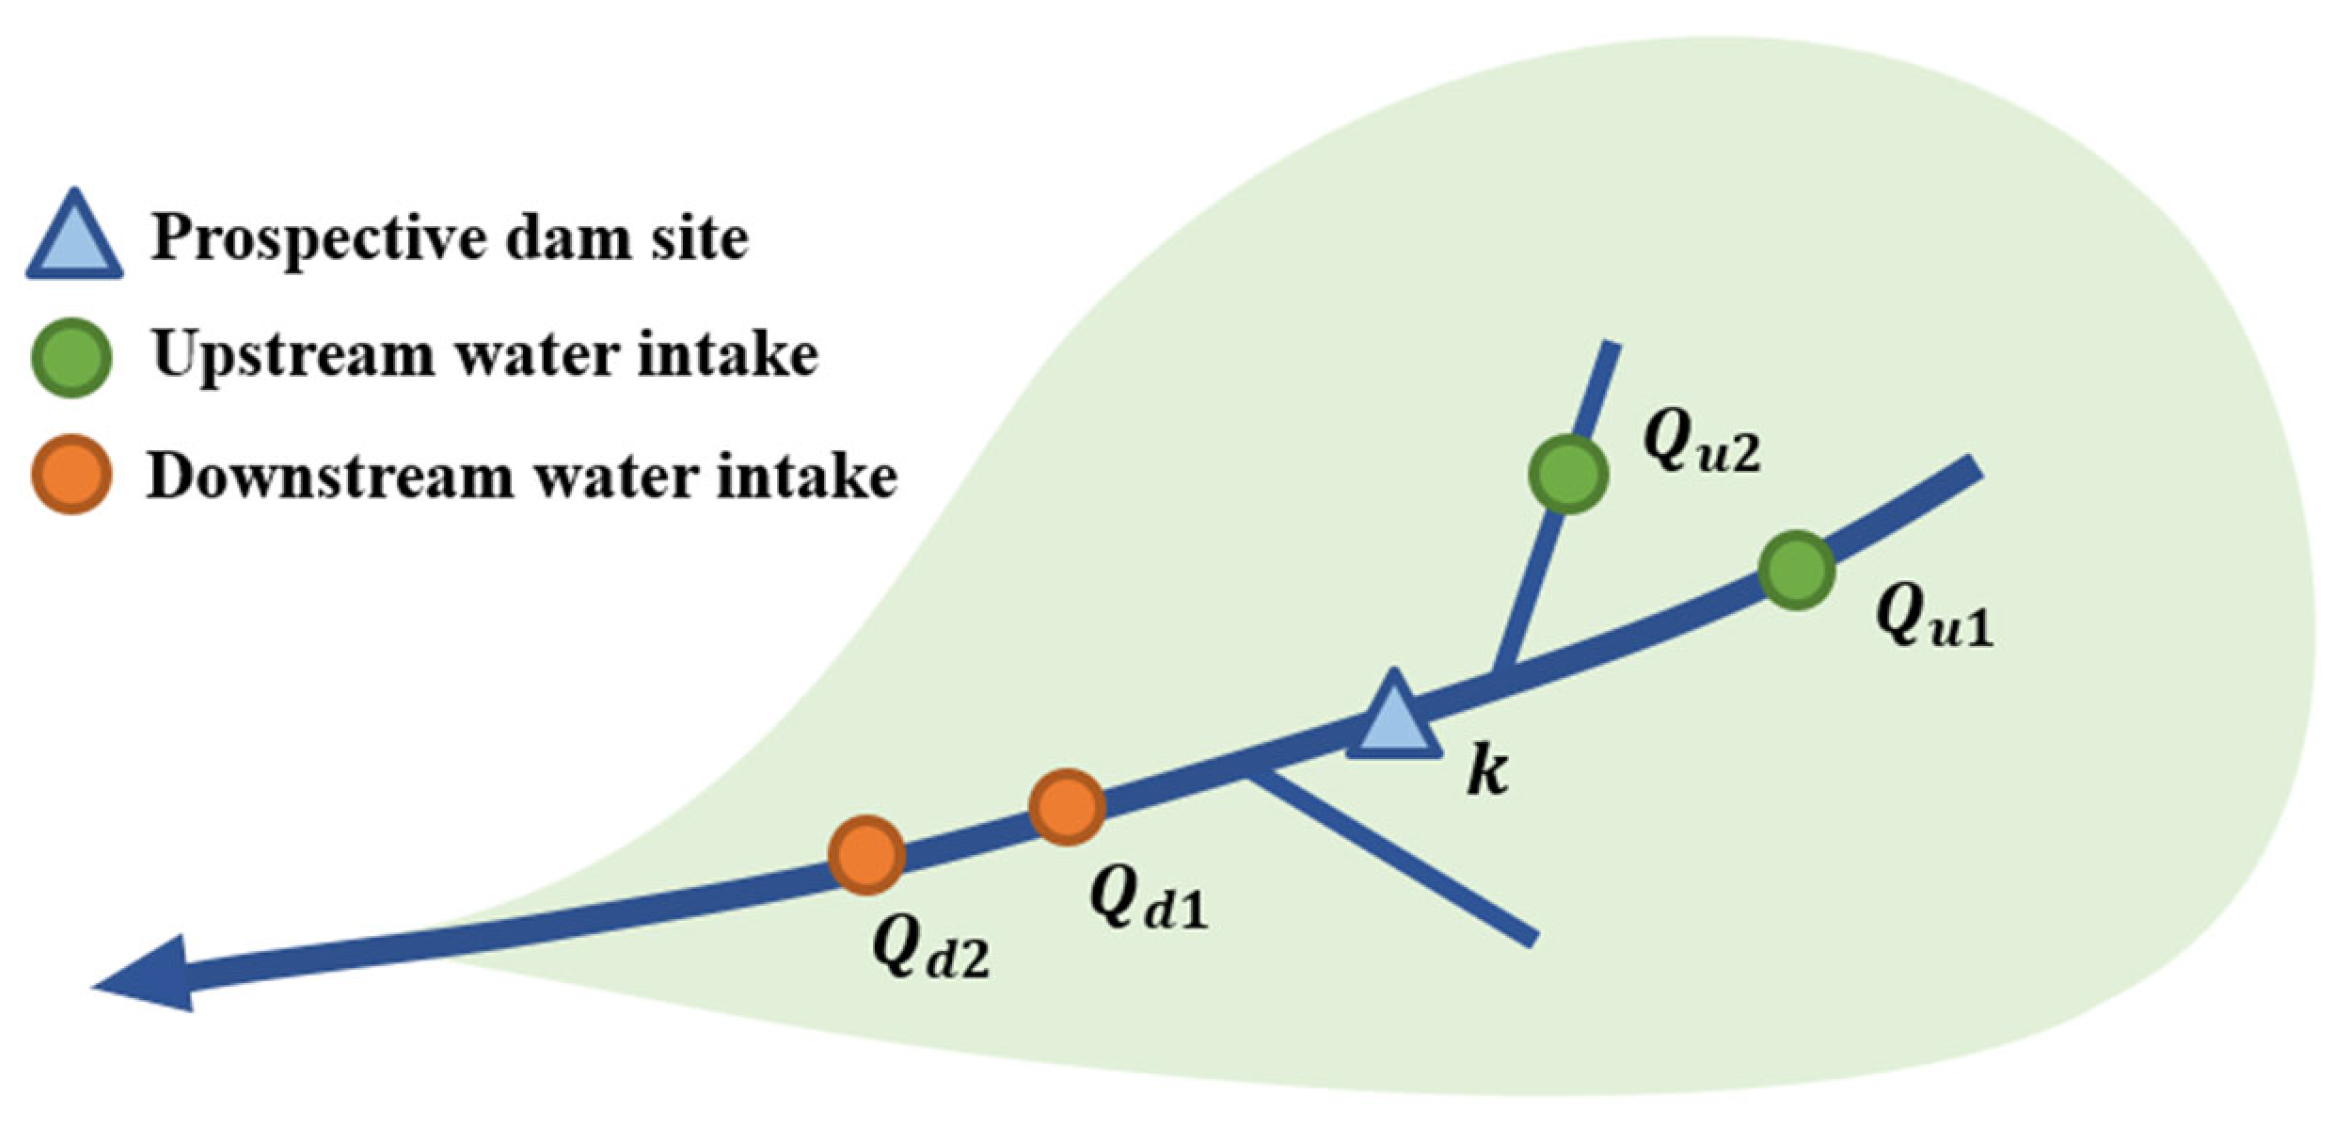
The available water estimated by TOPMODEL represents the natural flow generated through the rainfall-runoff process in the watershed. It needs further assessment to determine how much remaining water in the system can be used or allocated for a new water resource project. When evaluating the remaining water, the flow at the prospective dam site should account for existing upstream and downstream water demands. As shown in Figure 4, k is the location of the prospective dam site, and Q u j & Q d j are the water intakes at the upstream and downstream channel reaches, respectively. If historical flow records are available at the prospective dam site (or near location k), the remaining discharge at the prospective dam site can be estimated by
Q k ( t ) = Q k ( t ) j = 1 M α Q d j ( t )
where Q k ( t ) is the remaining water at the prospective dam site at time t; Q k ( t ) is the recorded flow at location k at time t; Q d j ( t ) is the intake discharge at the downstream location j at time t; M is the number of intakes located in the downstream; and α is the retaining ratio, which represents the ratio of the discharge at the prospective dam site that should be retained for the commitment downstream water users. The retaining ratio at the prospective dam site can be estimated by
α = A k A j
where A k and A j are the lateral inflow collecting areas at location k and location j, respectively. Suppose the flow record is unavailable near the prospective dam site. In that case, the flow series can be estimated using TOPMODEL, along with rainfall records from nearby rain-gauging stations. It should be noted that the flow series generated using TOPMODEL at the prospective dam site is the “natural flow series,” which does not account for water withdrawal from upstream intakes. Hence, the remaining water at the prospective dam site can be estimated as
Q k ( t ) = Q ^ k ( t ) i = 1 N Q u i ( t ) j = 1 M α Q d j ( t )
where Q k ( t ) is the remaining water at the prospective dam site; Q ^ k ( t ) is the discharge estimated by TOPMODEL at the prospective dam site; Q u i ( t ) is the discharge withdrawn at the upstream intakes at location i; Q d j ( t ) is the discharge withdrawn at the downstream intakes at location j; N is the number of intakes located in the upstream; and α is the retaining ratio as shown in Equation (7). Furthermore, when considering water flows required to sustain river ecosystems, especially during low flow periods, a minimum environmental flow is required to maintain habitat in the downstream channel reaches. Consequently, the surplus water for the flow system can be expressed as
Q k ( t ) = Q k ( t ) Q E ,   if   Q k ( t ) > Q E 0 ,                       if   Q k ( t ) Q E
where Q k ( t ) is the surplus water at the prospective dam site, and QE is the environmental discharge.
Given significant fluctuations in the daily-flow series, it is integrated into a monthly-flow series (or a ten-day-flow series for paddy rice irrigation in Taiwan). Hence, the distribution of the monthly-flow (or ten-day-flow) series for a specified exceedance probability can be obtained to support the evaluation of surplus water resources at the prospective dam site.

2.4. Useful Life of Reservoir

When sediments transported by streamflow accumulate in a reservoir, they progressively reduce the reservoir storage capacity. The useful life of a reservoir is defined as the period during which its operational performance becomes significantly compromised—typically recognized when sediment deposits fill 50% of the reservoir’s total capacity. To evaluate the cost-benefit of reservoir construction, it is essential to know the duration of the sediment inflow to fill the reservoir to 50% capacity. Sediment inflow is influenced by climate, soil type, land use, topography, and reservoir operations. If sediment rating curves can be obtained from nearby flow-gauging stations with hydrological and topographical conditions similar to those of the prospective reservoir watershed, this will help estimate the reservoir’s sediment inflow. The suspended sediment rating curve is usually expressed as
Q s = a Q b
where Q s is the suspended sediment discharge (Ton/day), Q is the river flow discharge (m3/s), and a and b are the regression coefficients. According to investigations by the Taiwan Water Resources Planning Institute [28], bedload sediment discharge accounts for about 10% of suspended sediment discharge. Since sediment predominantly enters reservoirs during high-flow periods, a low capacity-to-inflow ratio allows most of this sediment to be discharged downstream. Conversely, a high capacity-to-inflow ratio promotes greater sediment retention within the reservoir. In this platform, we applied the trap efficiencies suggested by Brune [29]. Hence, if the reservoir’s flow duration curve and sediment rating curve are available, we can estimate the annual total sediment volume accumulated in the reservoir and then assess the reservoir’s useful life.

3. Development of the Water Resources Planning Platform

3.1. System Structure

The operation platform was developed using open-source GIS technology. For a specified study area, a DEM dataset was embedded in the platform. The DEM dataset, at 5 m resolution, was generated by the Taiwan Ministry of the Interior in 2006 for the entire island. Relevant spatial coverages, such as roads, land cover, and county boundaries, were also included to help users understand the surrounding environment of the prospective dam site. The platform system was linked to the Water Resources Information Service Platform (WRISP), maintained by the Taiwan Water Resource Agency, which provides rainfall, flow, and sediment discharge records collected from 715 rainfall and 264 flow-gauging stations. Consequently, the client terminal can access the database of raw data from nearby gauging stations once the prospective dam site has been assigned.
We developed the programs for geomorphological and hydrological analyses in Fortran because it is one of the most efficient languages for handling complex and repetitive computations. Users can operate the modules in Quantum GIS (QGIS) through a graphical user interface and link to the database to perform an integrated analysis at the prospective dam site. The databank was built using the open-source PostgreSQL database to store module calculation results and to supplement rainfall and/or flow records. To ensure users are running the latest version, the platform is linked to the web server to check whether the system server has released an updated version of the modules.

3.2. Analytical Modules

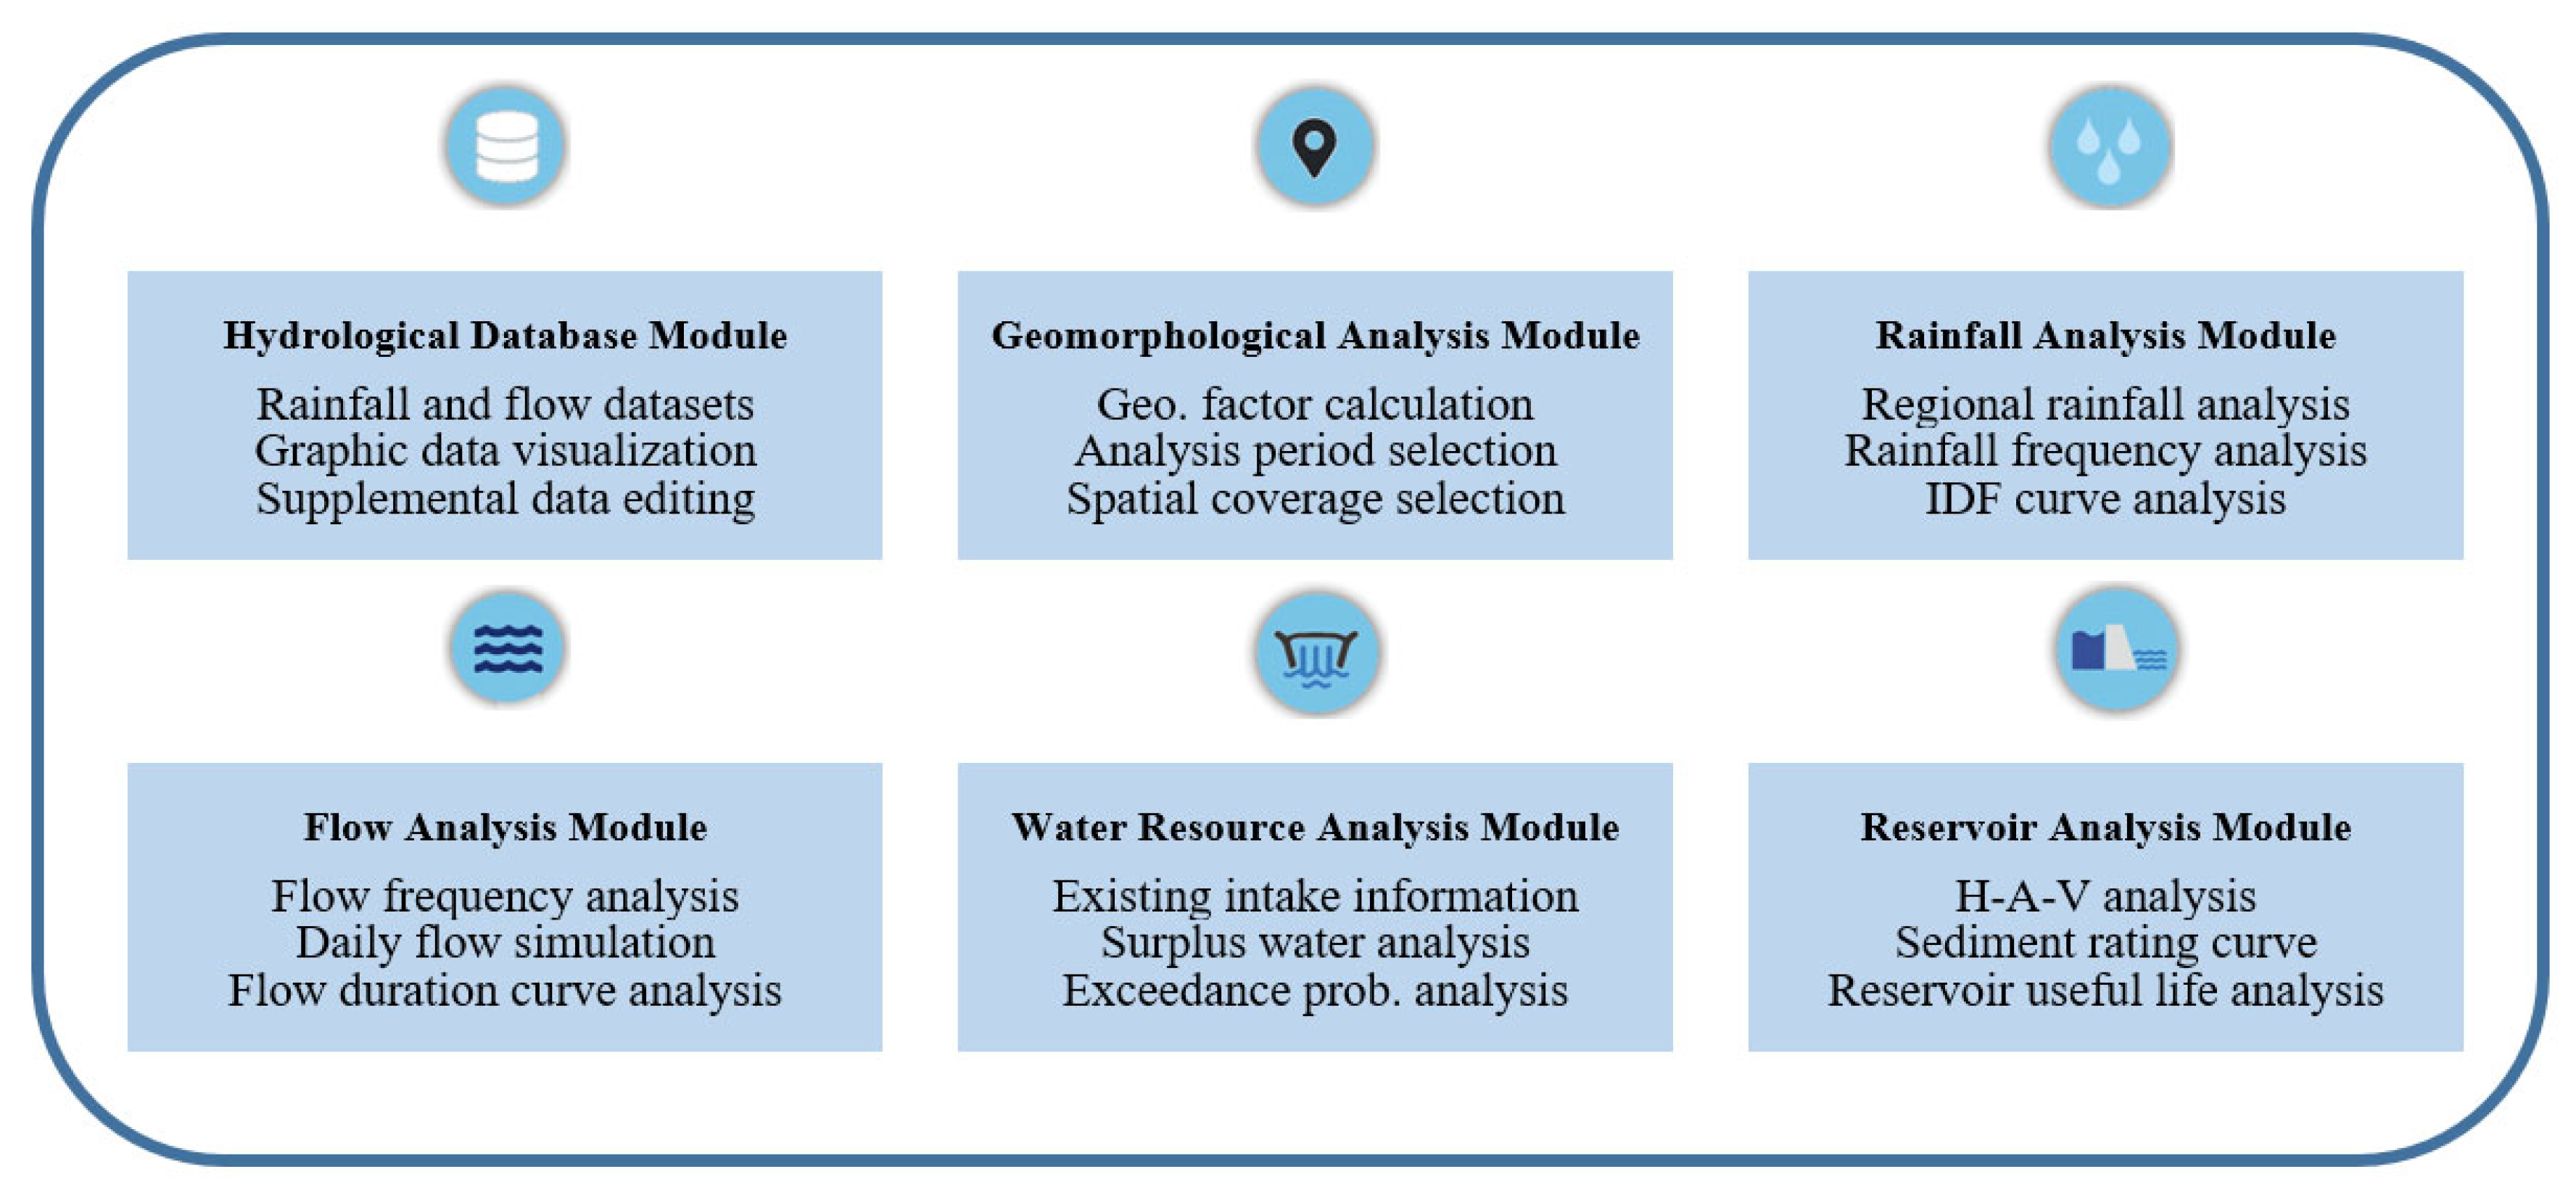
Figure 5 shows the functions embedded in the modules for water resources planning at the prospective dam site. The contents of the modules can be explained as follows.
(1)
Hydrological database
A large amount of rainfall, streamflow, and water-use data is required for water resources planning at the prospective dam site. The platform is designed to connect to the WRISP service, maintained by the Taiwan Water Resources Agency, to access relevant records for analysis. This module provides functions such as graphic data visualization and supplemental data editing. In the data visualization window, users can verify the accuracy of the records and select the desired period for further analysis.
(2)
Geomorphological analysis
The first step in performing the Geomorphological Analysis Module is to assign designated locations (such as rainfall and flow gauging stations, and prospective dam sites) and to select the required analysis periods. Based on the available digital elevation dataset, a DEM is used to facilitate calculations to obtain watershed geomorphologic factors, such as area, slope, stream network, and topographic index. Spatial coverages include rainfall and flow gauging stations, water intakes and dam sites, geological maps, ecological protection zones, national parks, rivers and roads, and county and city boundaries. Since the information on the designated location and selected historical periods is used repeatedly across different modules, it is designed to be temporarily stored in the database and automatically linked for further analyses.
(3)
Rainfall analysis
The Rainfall Analysis Module affords (a) regional average rainfall estimation, (b) rainfall frequency analysis, and (c) intensity–duration–frequency (IDF) analysis. Users can extract available rainfall records from nearby rain-gauging stations. The isohyetal method and Thiessen polygons can be used to estimate the regional average rainfall at the specified dam site. The rainfall frequency analysis function can estimate rainfall depths for various durations under different return-period conditions, using six theoretical distributions, including normal, two-parameter log-normal, three-parameter log-normal, Pearson type-III, log Pearson type-III, and extreme value type-I, to fit the probability distribution of the rainfall records. Users can apply the IDF curve analysis function to obtain the regression parameters of the Horner formula [30], using the six probability distributions mentioned above.
(4)
Flow analysis
The Flow Analysis Module provides flow frequency analysis, daily flow simulation, and flow duration curve analysis. This module can provide daily flow simulations for gauged and ungauged watersheds. The flow frequency analysis function can estimate peak discharge for different return-period conditions based on annual maximum discharge records. The analysis adopts the six probability distributions mentioned above. For flow-gauged locations, historical flow datasets will be collected for analysis. For ungauged target sites, TOPMODEL will be used to generate the daily flow series from the input rainfall series. In considering the uncertainty of the streamflow, the flow duration curve at the dam site would show the percentage of time a given streamflow is equaled or exceeded during a period of record. This can identify critical low-flow periods that storage must supplement, which would be beneficial for a reservoir storage design.
(5)
Water resource analysis
The Water Resource Analysis Module affords (a) existing intake analysis, (b) surplus water analysis, and (c) exceedance probability analysis. The existing intake analysis function automatically generates an attribute table that displays upstream intake volumes and downstream permitted water rights, which will be used to calculate remaining water at the proposed dam site. The surplus flow is designated as the remaining flow while further considering the minimum environmental flow required to maintain the sustainability of the river ecosystem. The exceedance probability of the surplus water can be obtained from the module for either a 10-day or a monthly flow series, which is the most important information for evaluating the feasibility of water resources development at the prospective dam site. Series charts and graphics displayed on screen can be downloaded as Word and/or Excel files for further report editing.
(6)
Reservoir analysis
For a new water resource development, reservoir storage is determined through a systematic analysis that balances water supply, demand, and hydrological variability. The analysis usually starts by identifying all the water uses that the reservoir must serve. Then, streamflow data are collected to conduct, for example, a mass-diagram analysis [31], which is typically used to determine the reservoir’s required active storage for water supply regulation between inflows and demand. Hence, an adequate dam height to meet the required reservoir storage can be determined using the H-A-V curves. The Reservoir Analysis Module includes (a) H-A-V analysis, (b) sediment rating curve analysis, and (c) reservoir useful life analysis. At the prospective dam site, backwater-inundated areas can be generated from a DEM by varying the dam height; then, an H-A-V can be derived. If sediment concentration records are available from nearby flow-gauging stations, a sediment rating curve will be generated to estimate reservoir sediment inflow when combined with reservoir inflow duration data. The useful life of the reservoir can be determined by calculating the time required for sediment accumulation to render the reservoir unable to serve its intended purpose, often defined as the time at which 50% of the initial reservoir capacity is lost to sedimentation. This information would help the planner to evaluate the cost–benefit effect of the prospective dam site.
A user’s guide and a technical support manual can be downloaded from the platform system, and a system link connects to the National Taiwan Ocean University server to check whether an updated version of the platform is available for download.

4. Model Applications and Discussion

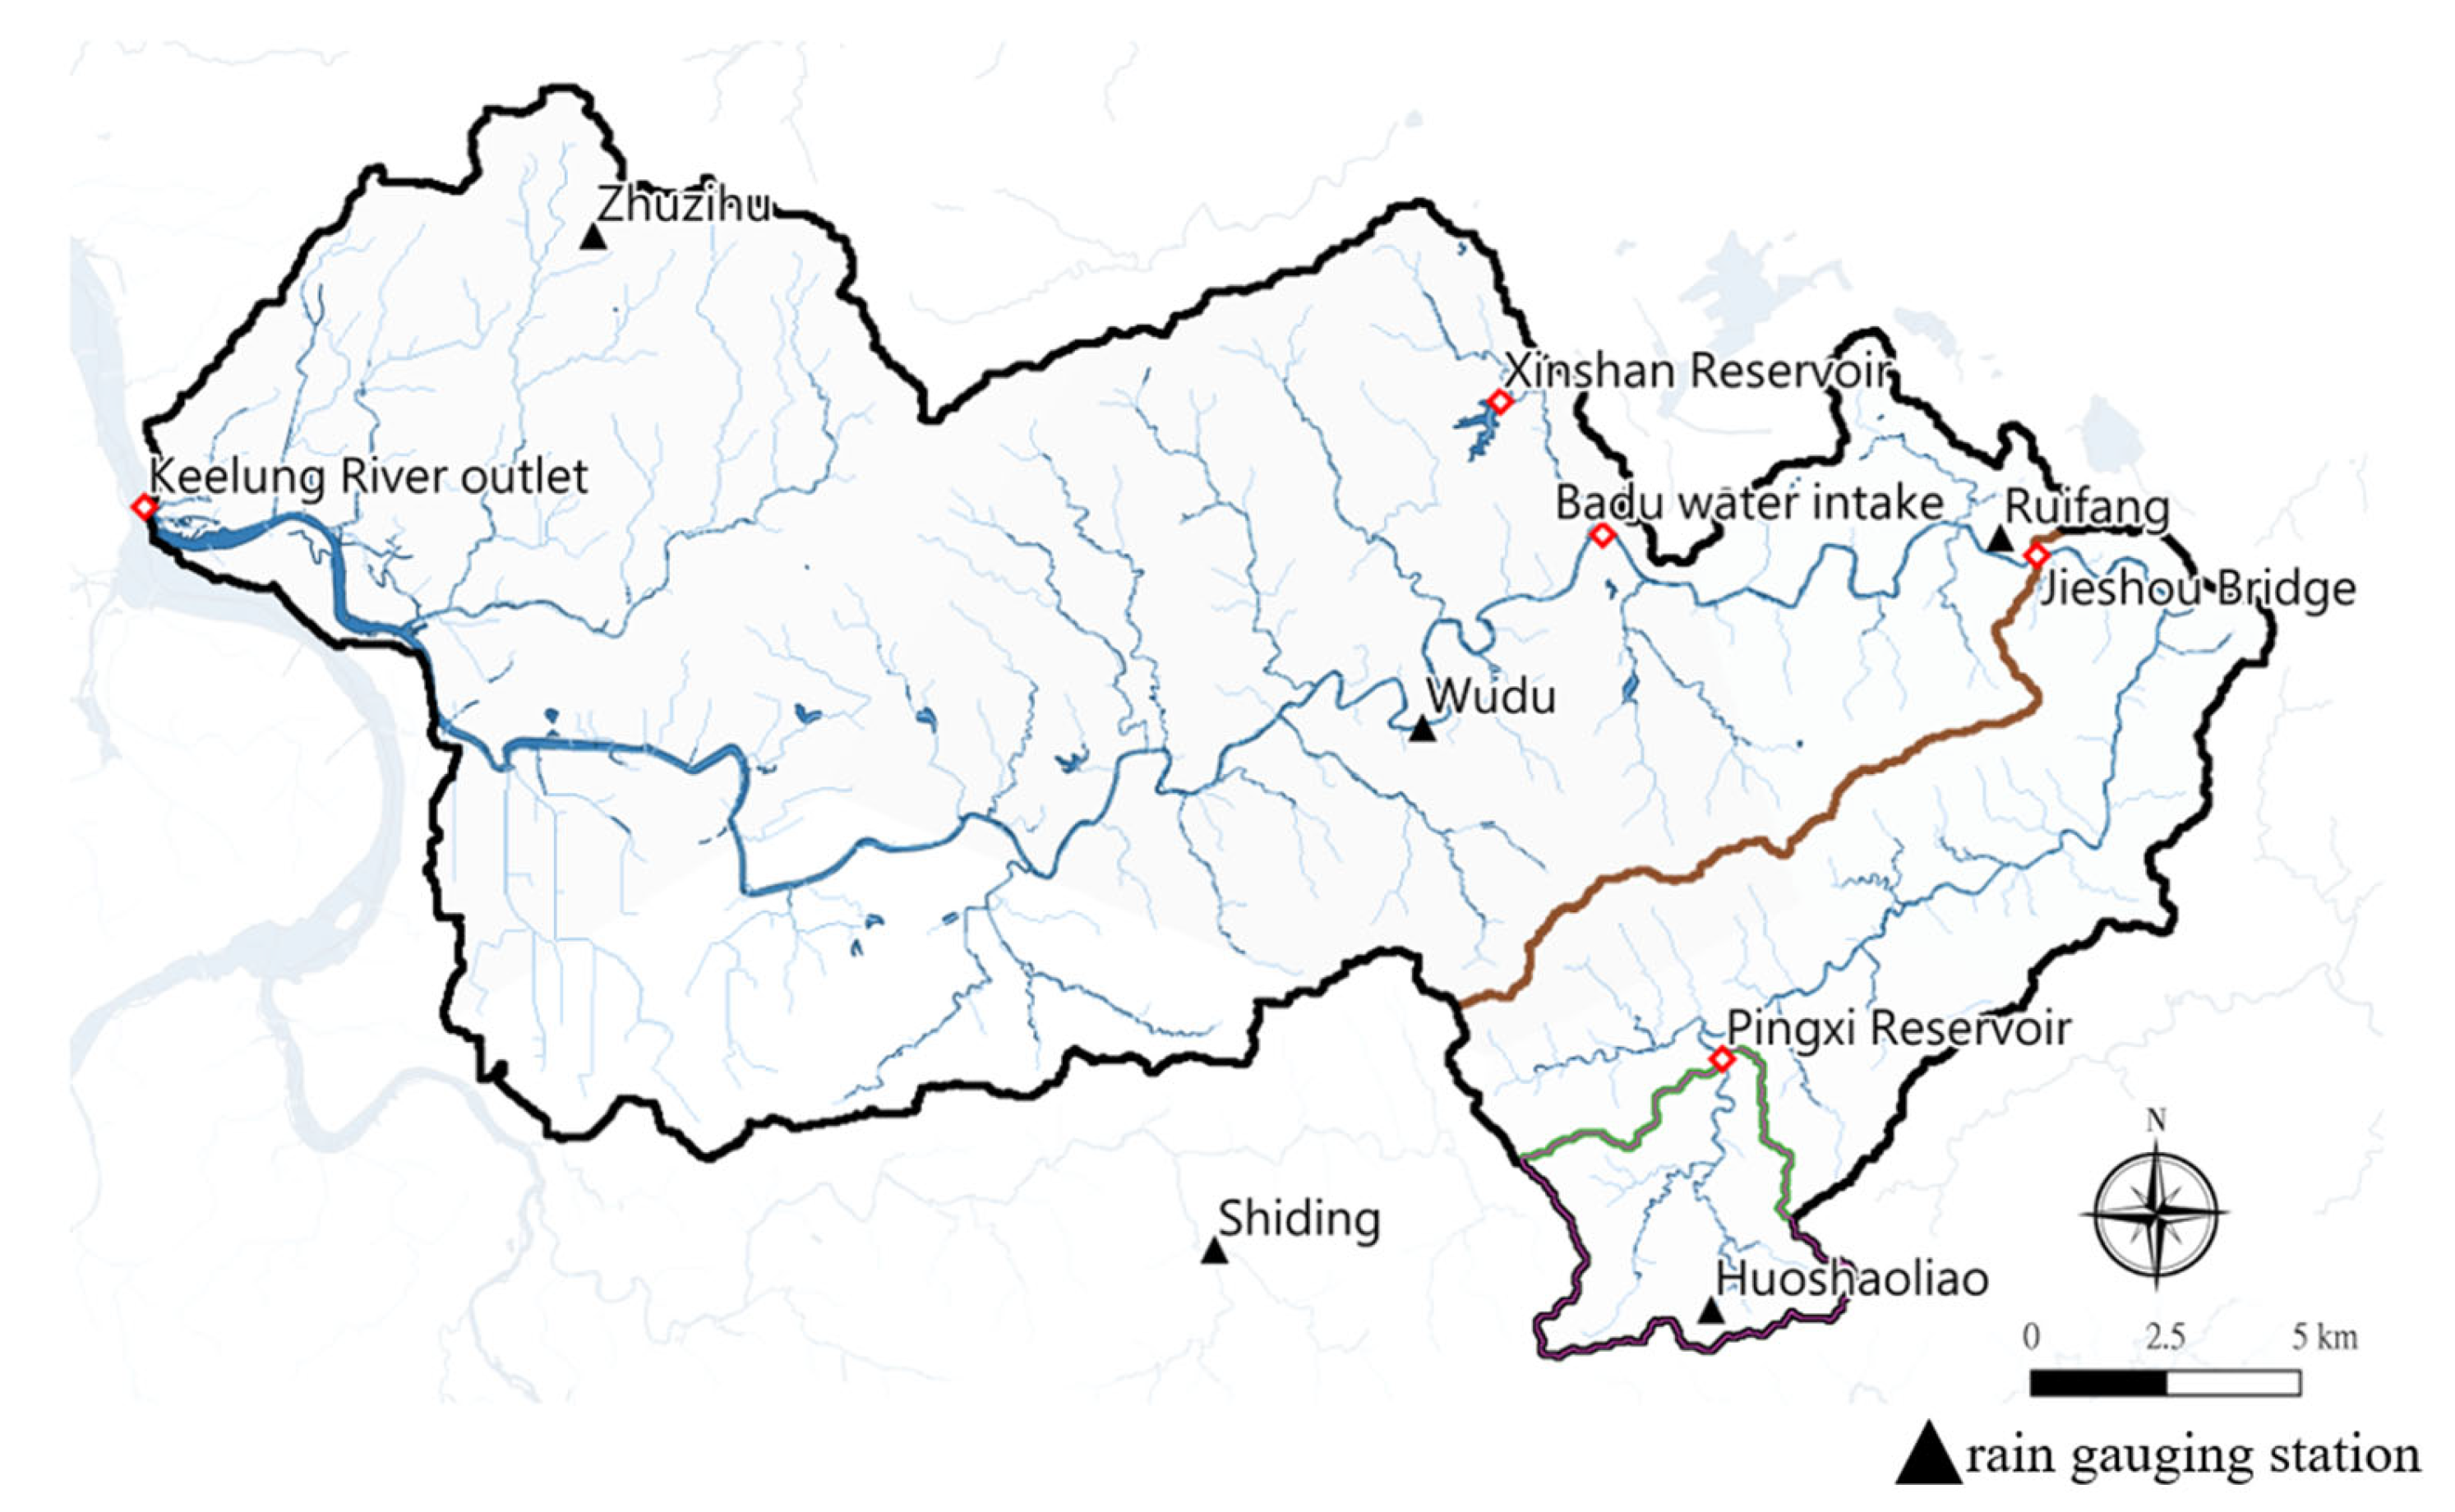
This study uses the prospective Pingxi Reservoir as a test case to evaluate the feasibility of water resources development. The proposed dam site for the Pingxi Reservoir is located in New Taipei City, upstream of the Keelung River. The Keelung River originates near Jingtong in New Taipei City. It flows through Pingxi District, Ruifang District, Keelung City, Xizhi District, and Taipei City, and finally converges with the Tamsui River at Guandu. It is one of the three major tributaries of the Tamsui River system. As shown in Figure 6, Ruifang District, in the upper reaches of the Keelung River, experiences water shortages during droughts, often severely impacting residents’ daily lives and causing widespread public discontent. The domestic water supply in Ruifang is primarily from river water and supplemented by reservoir water. The river water is mainly drawn from the Keelung River’s surface water and treated at the Yuanshan Water Treatment Plant. When the river flow is insufficient during the dry season, the Xinshan Reservoir provides supplementary water. The Xinshan Reservoir is an off-stream reservoir with a water intake at Badu, as shown in Figure 6. Against the backdrop of climate change and the continued growth in industrial water demand in northern Taiwan, water resources development in the upper reaches of the Keelung River is more urgent than ever. Hence, the Pingxi Reservoir is among the most promising solutions to address the water shortage in the upstream of the Keelung River Basin.

4.1. Geomorphological Analysis in the Keelung River Basin

As shown in Figure 6, the Keelung River mainstream is 87 km long and drains an area of 484 square kilometers. In the figure, the brown line represents the boundary of the Jieshou Bridge watershed, while the green line represents the boundary of the Pingxi Reservoir watershed. The watershed geomorphological factors at the Keelung River Basin outlet, Badu water intake, Jieshou Bridge, and the prospective Pingxi Reservoir are shown in Table 1, generated by the Geomorphological Analysis Module in the system platform. There are 5 rain gauging stations (Zhuzihu, Wudu, Shiding, Ruifang, and Huoshaoliao) and 2 flow gauging stations (Wudu and Jieshou Bridge) in the Keelung River Basin.

4.2. Available Water Analysis

TOPMODEL is a rainfall-runoff model mainly based on watershed geomorphological characteristics. Flow records from nearby gauging stations can serve as a good reference for model development in ungauged watersheds. The parameters required to perform TOPMODEL are the hydraulic conductivity, the maximum allowable storage capacity of the root zone, and a constant m that represents the decay of hydraulic conductivity with soil depth. Parameter calibration and model verification can be based on available record data from nearby flow stations.
In this study, hydrological records collected at the Jieshou Bridge, in the upper reaches of the Keelung River, were used to calibrate the model parameters. The upstream part of the Keelung River is mostly hilly and mountainous, with steep slopes. The soil is formed from the weathering of Miocene sandstone and shale (such as the Nangang, Shidi, and Mushan Formations) from the Tertiary period [32]. As shown in Figure 6, the Pingxi watershed (A = 19.25 km2) is located upstream of the Jieshou Bridge watershed (A = 95.94 km2). Almost 99% of the Jieshou Bridge watershed is forest, and only a small township, Ruifang, with an area of 0.65 km2, is situated near the Jieshou Bridge. The soil and land-cover conditions of these two watersheds are similar, and their mean watershed slopes are nearly identical (as shown in Table 1). Hence, it would be acceptable to transfer the parameters calibrated at the Jieshou Bridge to the Pingxi watershed.
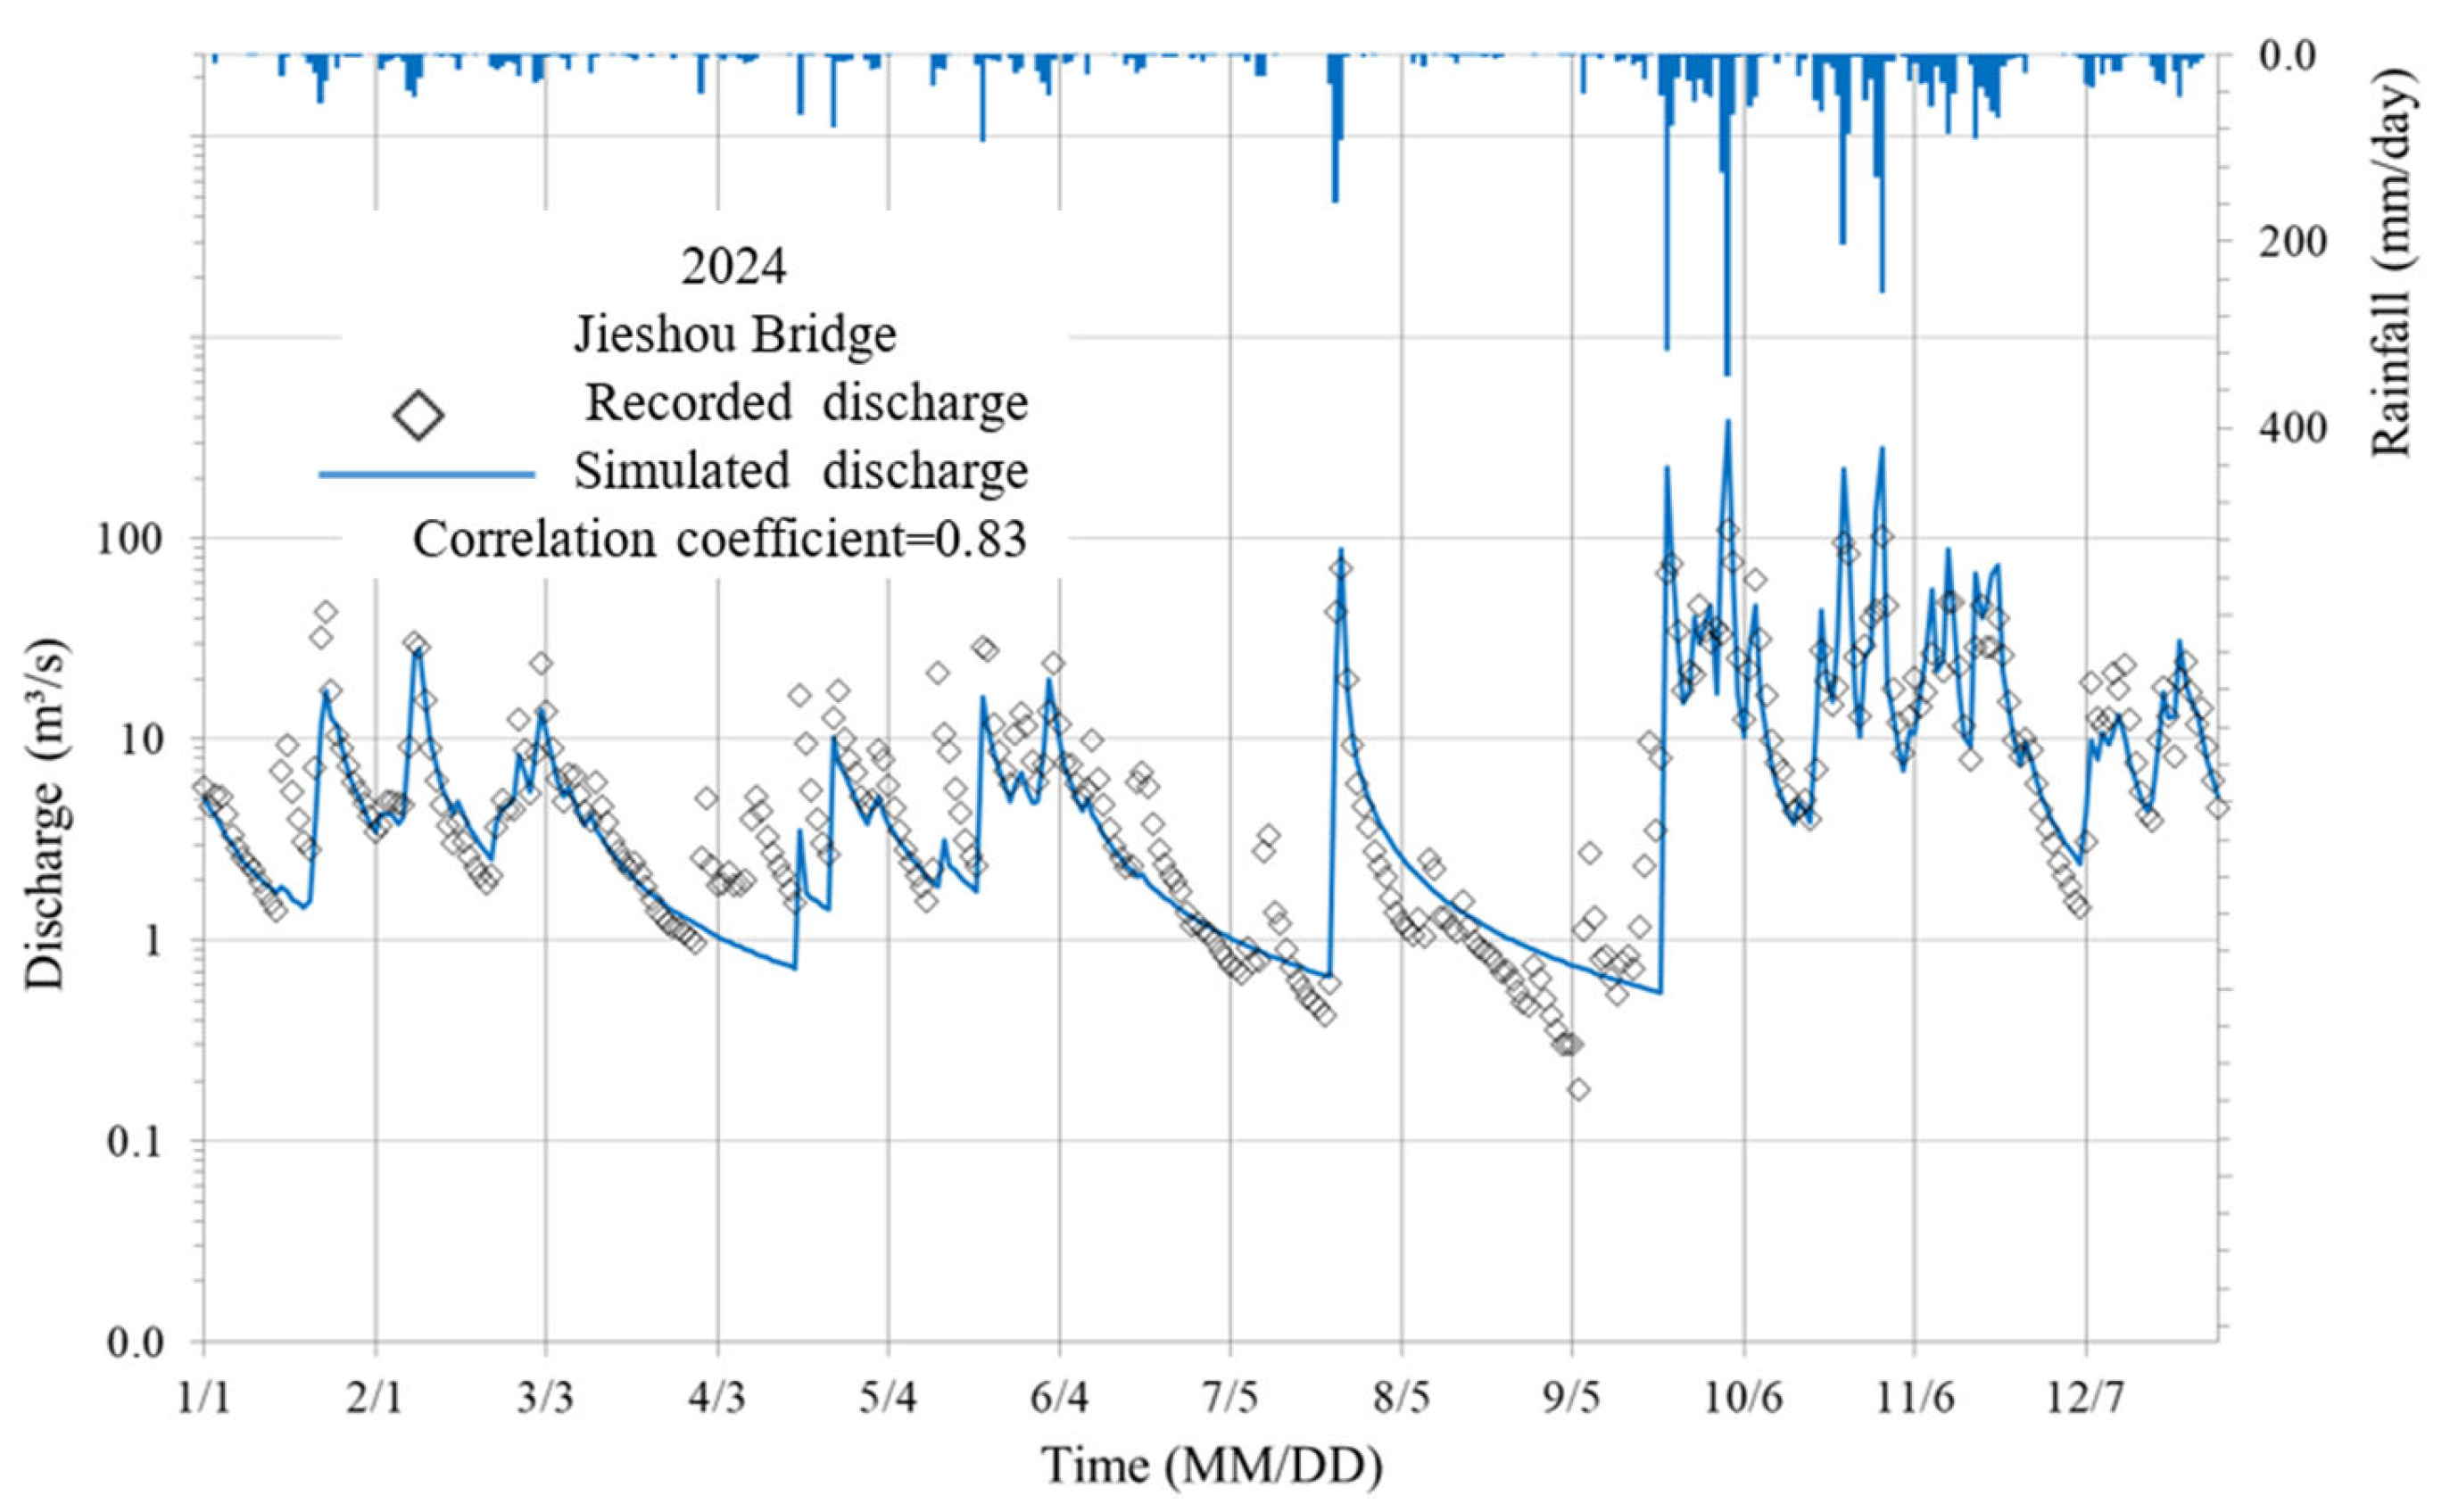
Using the Flow Analysis Module, we applied TOPMODEL to the Jieshou Bridge watershed, where a flow-gauging station has been maintained since 1981. We used rainfall and flow records from 2005 to 2009 to calibrate the model parameters, and records from 2010 to 2024 for model verification. The Pearson correlation coefficient (r), Nash–Sutcliffe efficiency (NSE), root mean square error (RMSE), and percent bias (PBIAS) were used to evaluate TOPMODEL performance. During the calibration period, r = 0.85, NSE = 0.78, RMSE = 8.38 m3/s, and PBIAS = −21.23%. The performance metrics changed to r = 0.84, NSE = 0.73, RMSE = 7.07 m3/s, and PBIAS = −18.81% in the verification period. These metrics have proven the acceptance of TOPMODEL for flow simulation. Figure 7 shows an example daily-flow simulation for 2024 in the Jieshou Bridge watershed, using daily rainfall records from the Wudu, Shiding, Ruifang, and Huoshaoliao stations as input. In this figure, discharge is plotted on a logarithmic scale, making it easier to distinguish both low and high flow values. The timeline (x-axis) in the figure is represented by MM/DD, with each interval being 31 days. The correlation coefficient between the simulation results and the records is 0.83. The results indicate that TOPMODEL is well-suited for rainfall-runoff simulation in this region.
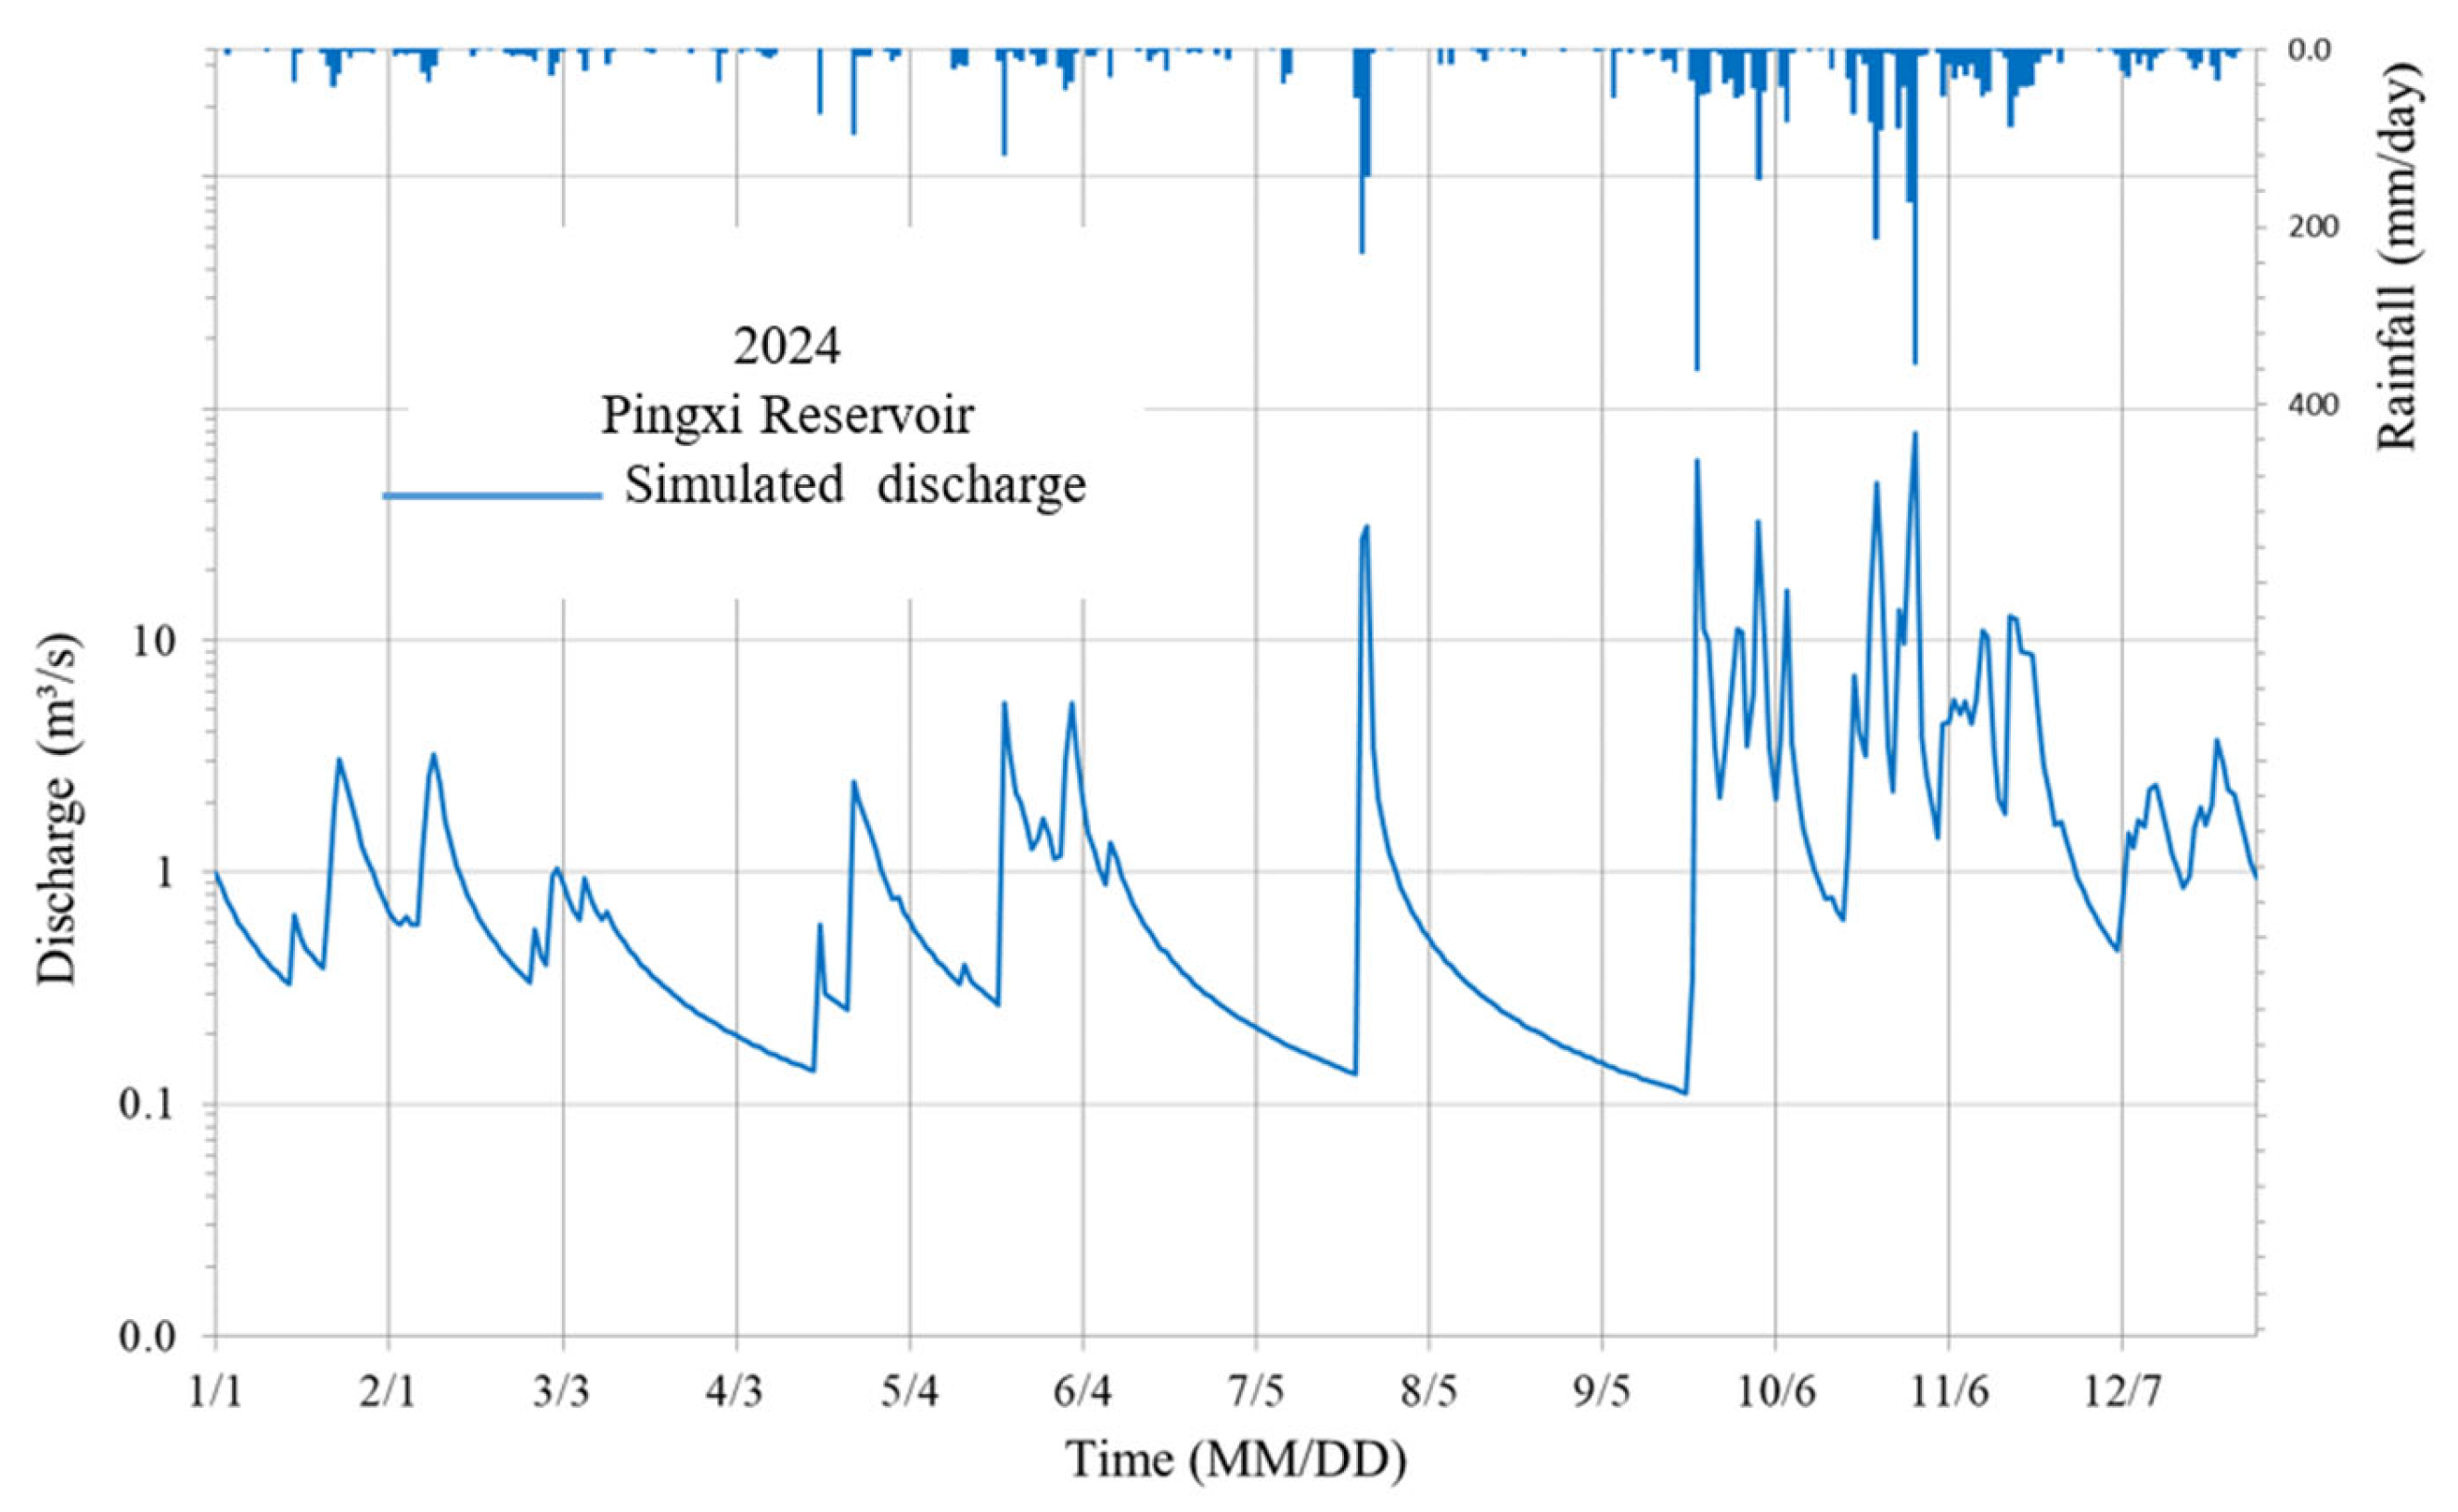
As shown in Figure 6, the prospective dam site is located upstream of the Jieshou Bridge watershed, and both watersheds share a similar watershed mean slope, as shown in Table 1. Hence, it would be promising to use TOPMODEL for runoff simulation at the prospective dam site with parameters calibrated at the Jieshou Bridge. Figure 8 shows an example daily-flow simulation for 2024 at the prospective dam site, using daily rainfall records from Huoshaoliao station as model input. Subsequently, we applied rainfall records from 2010 to 2024 to generate long-term flow series for available water analysis at the prospective dam site.
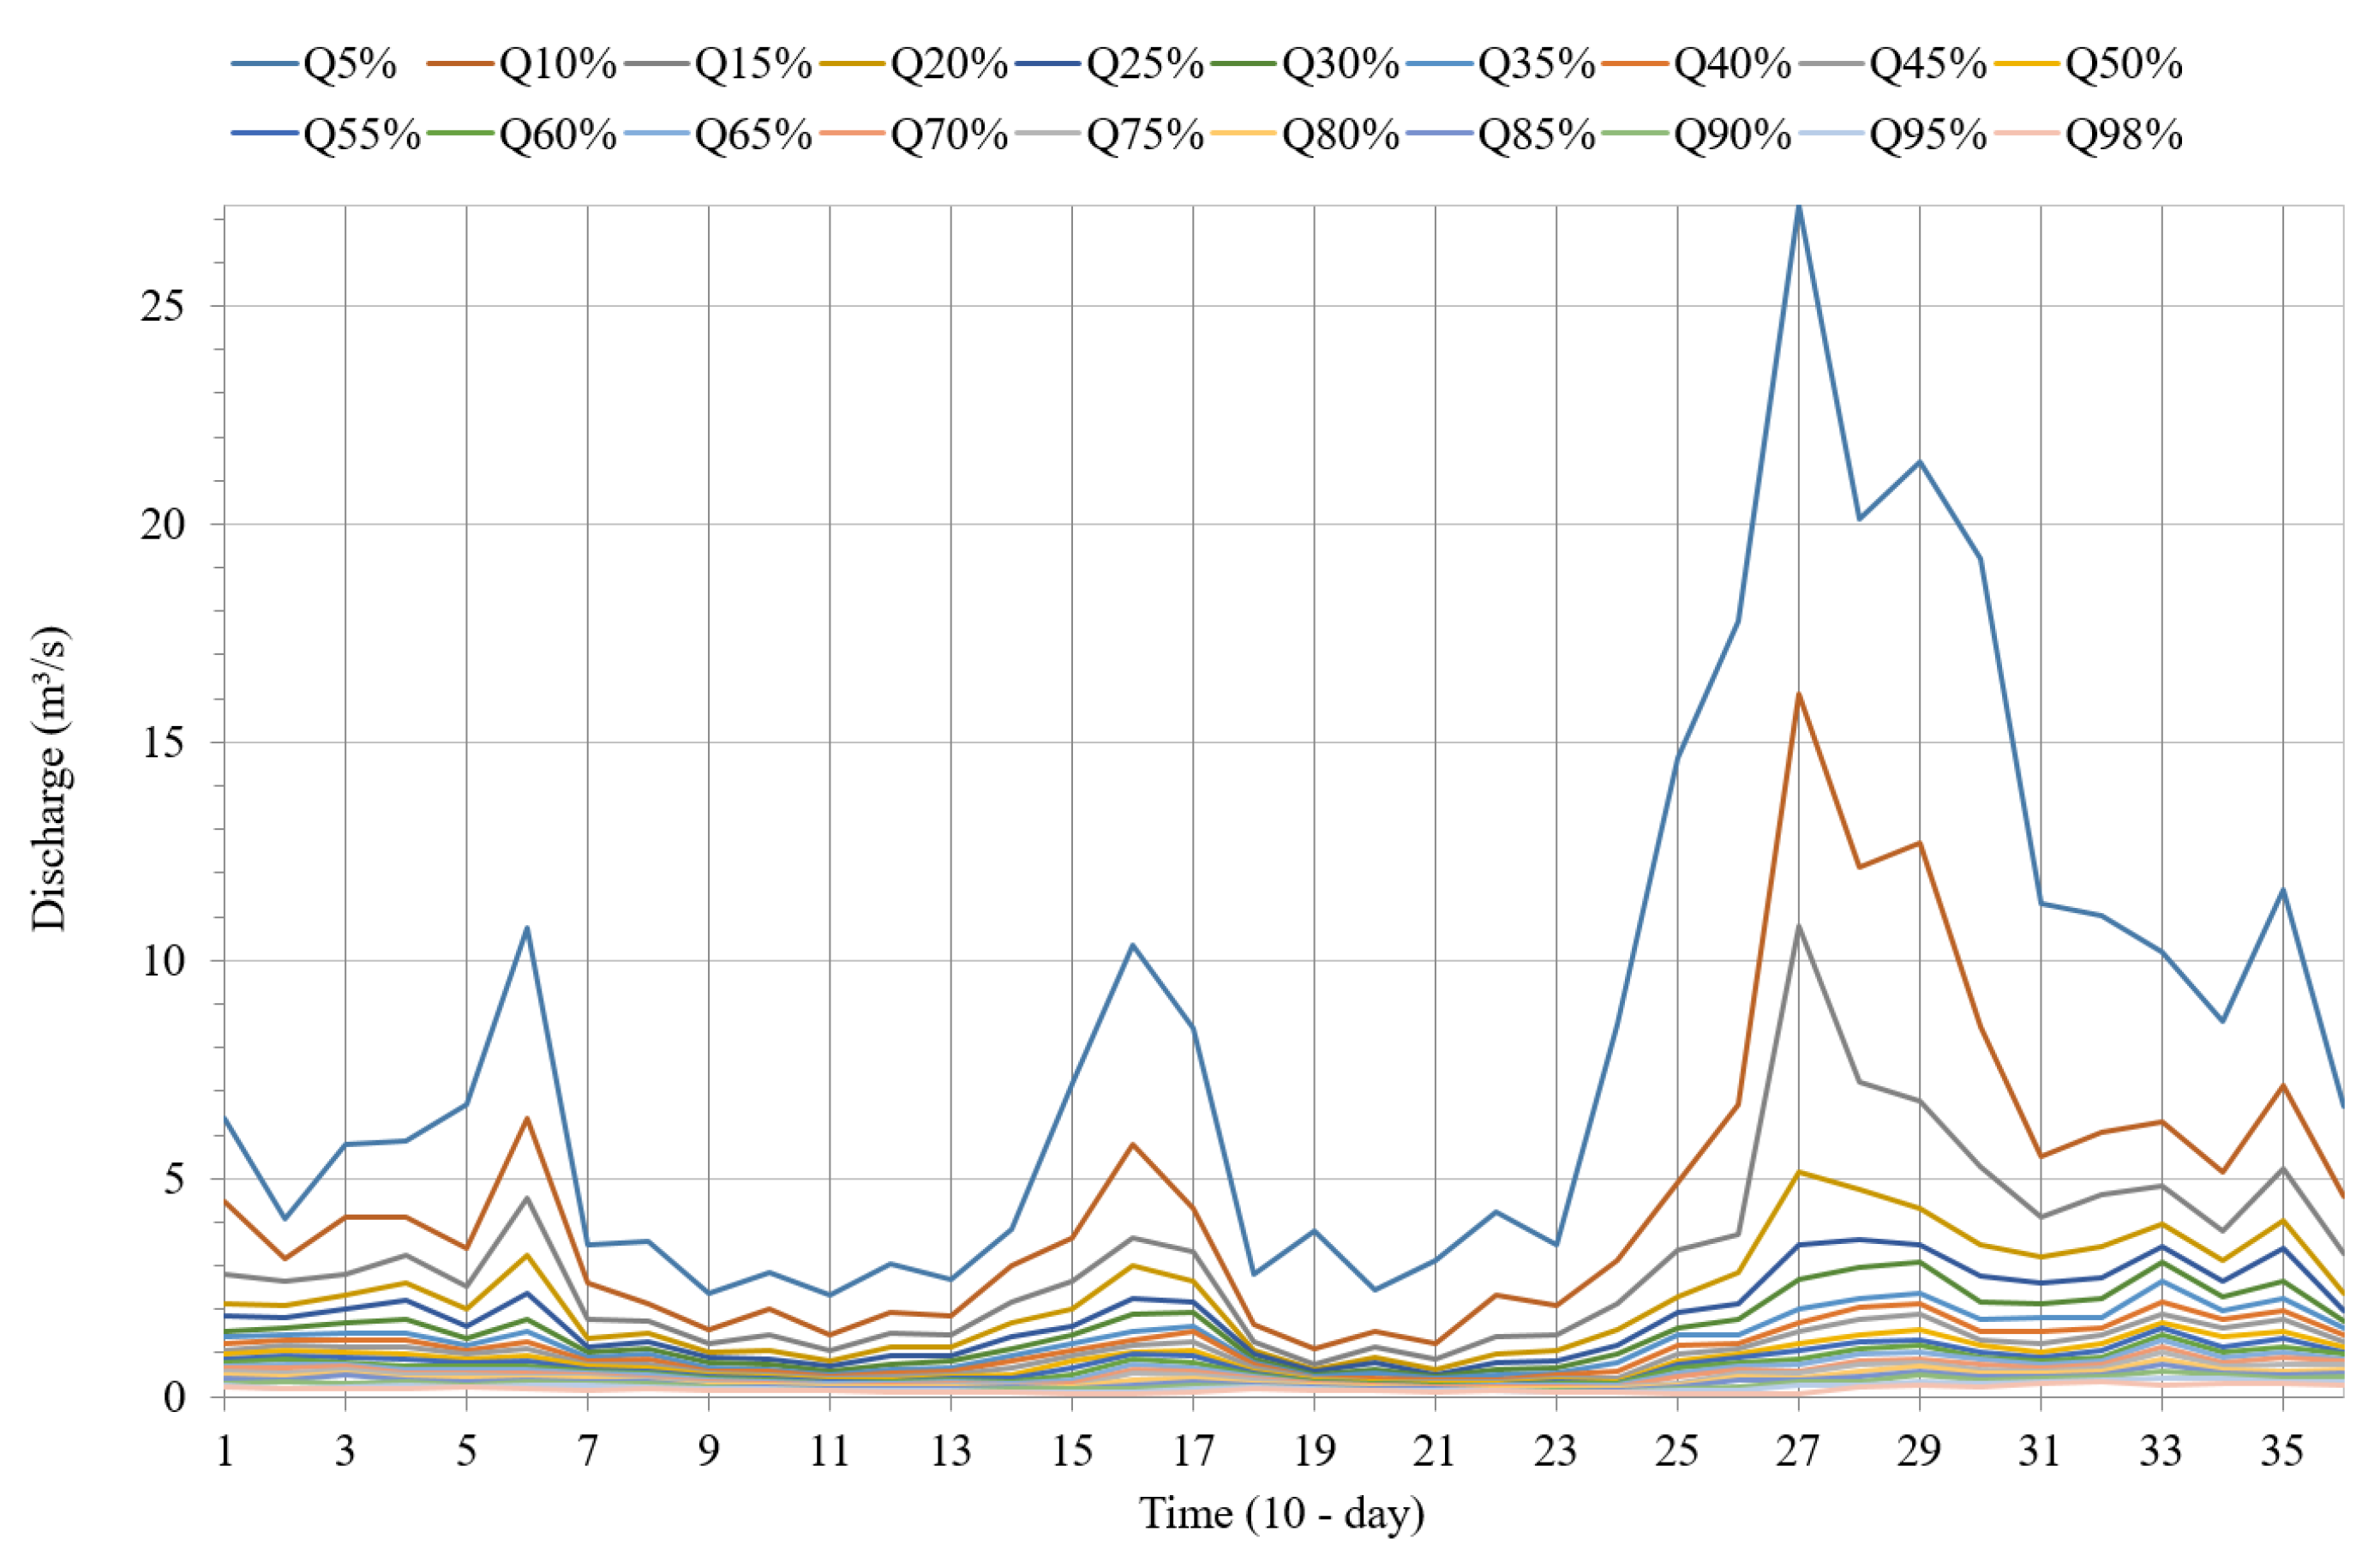
Figure 9 shows the percentile discharge values corresponding to the exceedance probability of the daily flows in each 10-day period based on TOPMODEL simulations. Lines with different colors indicate different exceedance probabilities. The figure shows that the maximum flow peak occurs in late September (the 27th 10-day), when high flow is driven by typhoon rainfall. While the flow peaks in late February (the 6th 10-day) and mid-May (the 16th 10-day), they are likely due to rainfall brought by the northeast monsoon in northern Taiwan during winter and the plum rain season. Information on the exceedance probability of the available flow would provide an important reference for assessing water resource potential at the prospective dam site.

4.3. Surplus Water Analysis

In Figure 8 and Figure 9, the simulation results are natural flow series generated by directly inputting rainfall records into the TOPMODEL. If there is a water intake upstream of the prospective dam site, the simulated natural flow must be adjusted by subtracting the upstream water diversion. Moreover, the rights of existing downstream water users and the environmental flows required for ecological habitats should also be considered. As shown in Figure 6, there is no water intake upstream of the prospective dam site. The Xinshan Reservoir, an off-stream reservoir with a water intake at Badu, and the environmental flow in the downstream channel reach are the only concerns for estimating the surplus water at the prospective dam site.
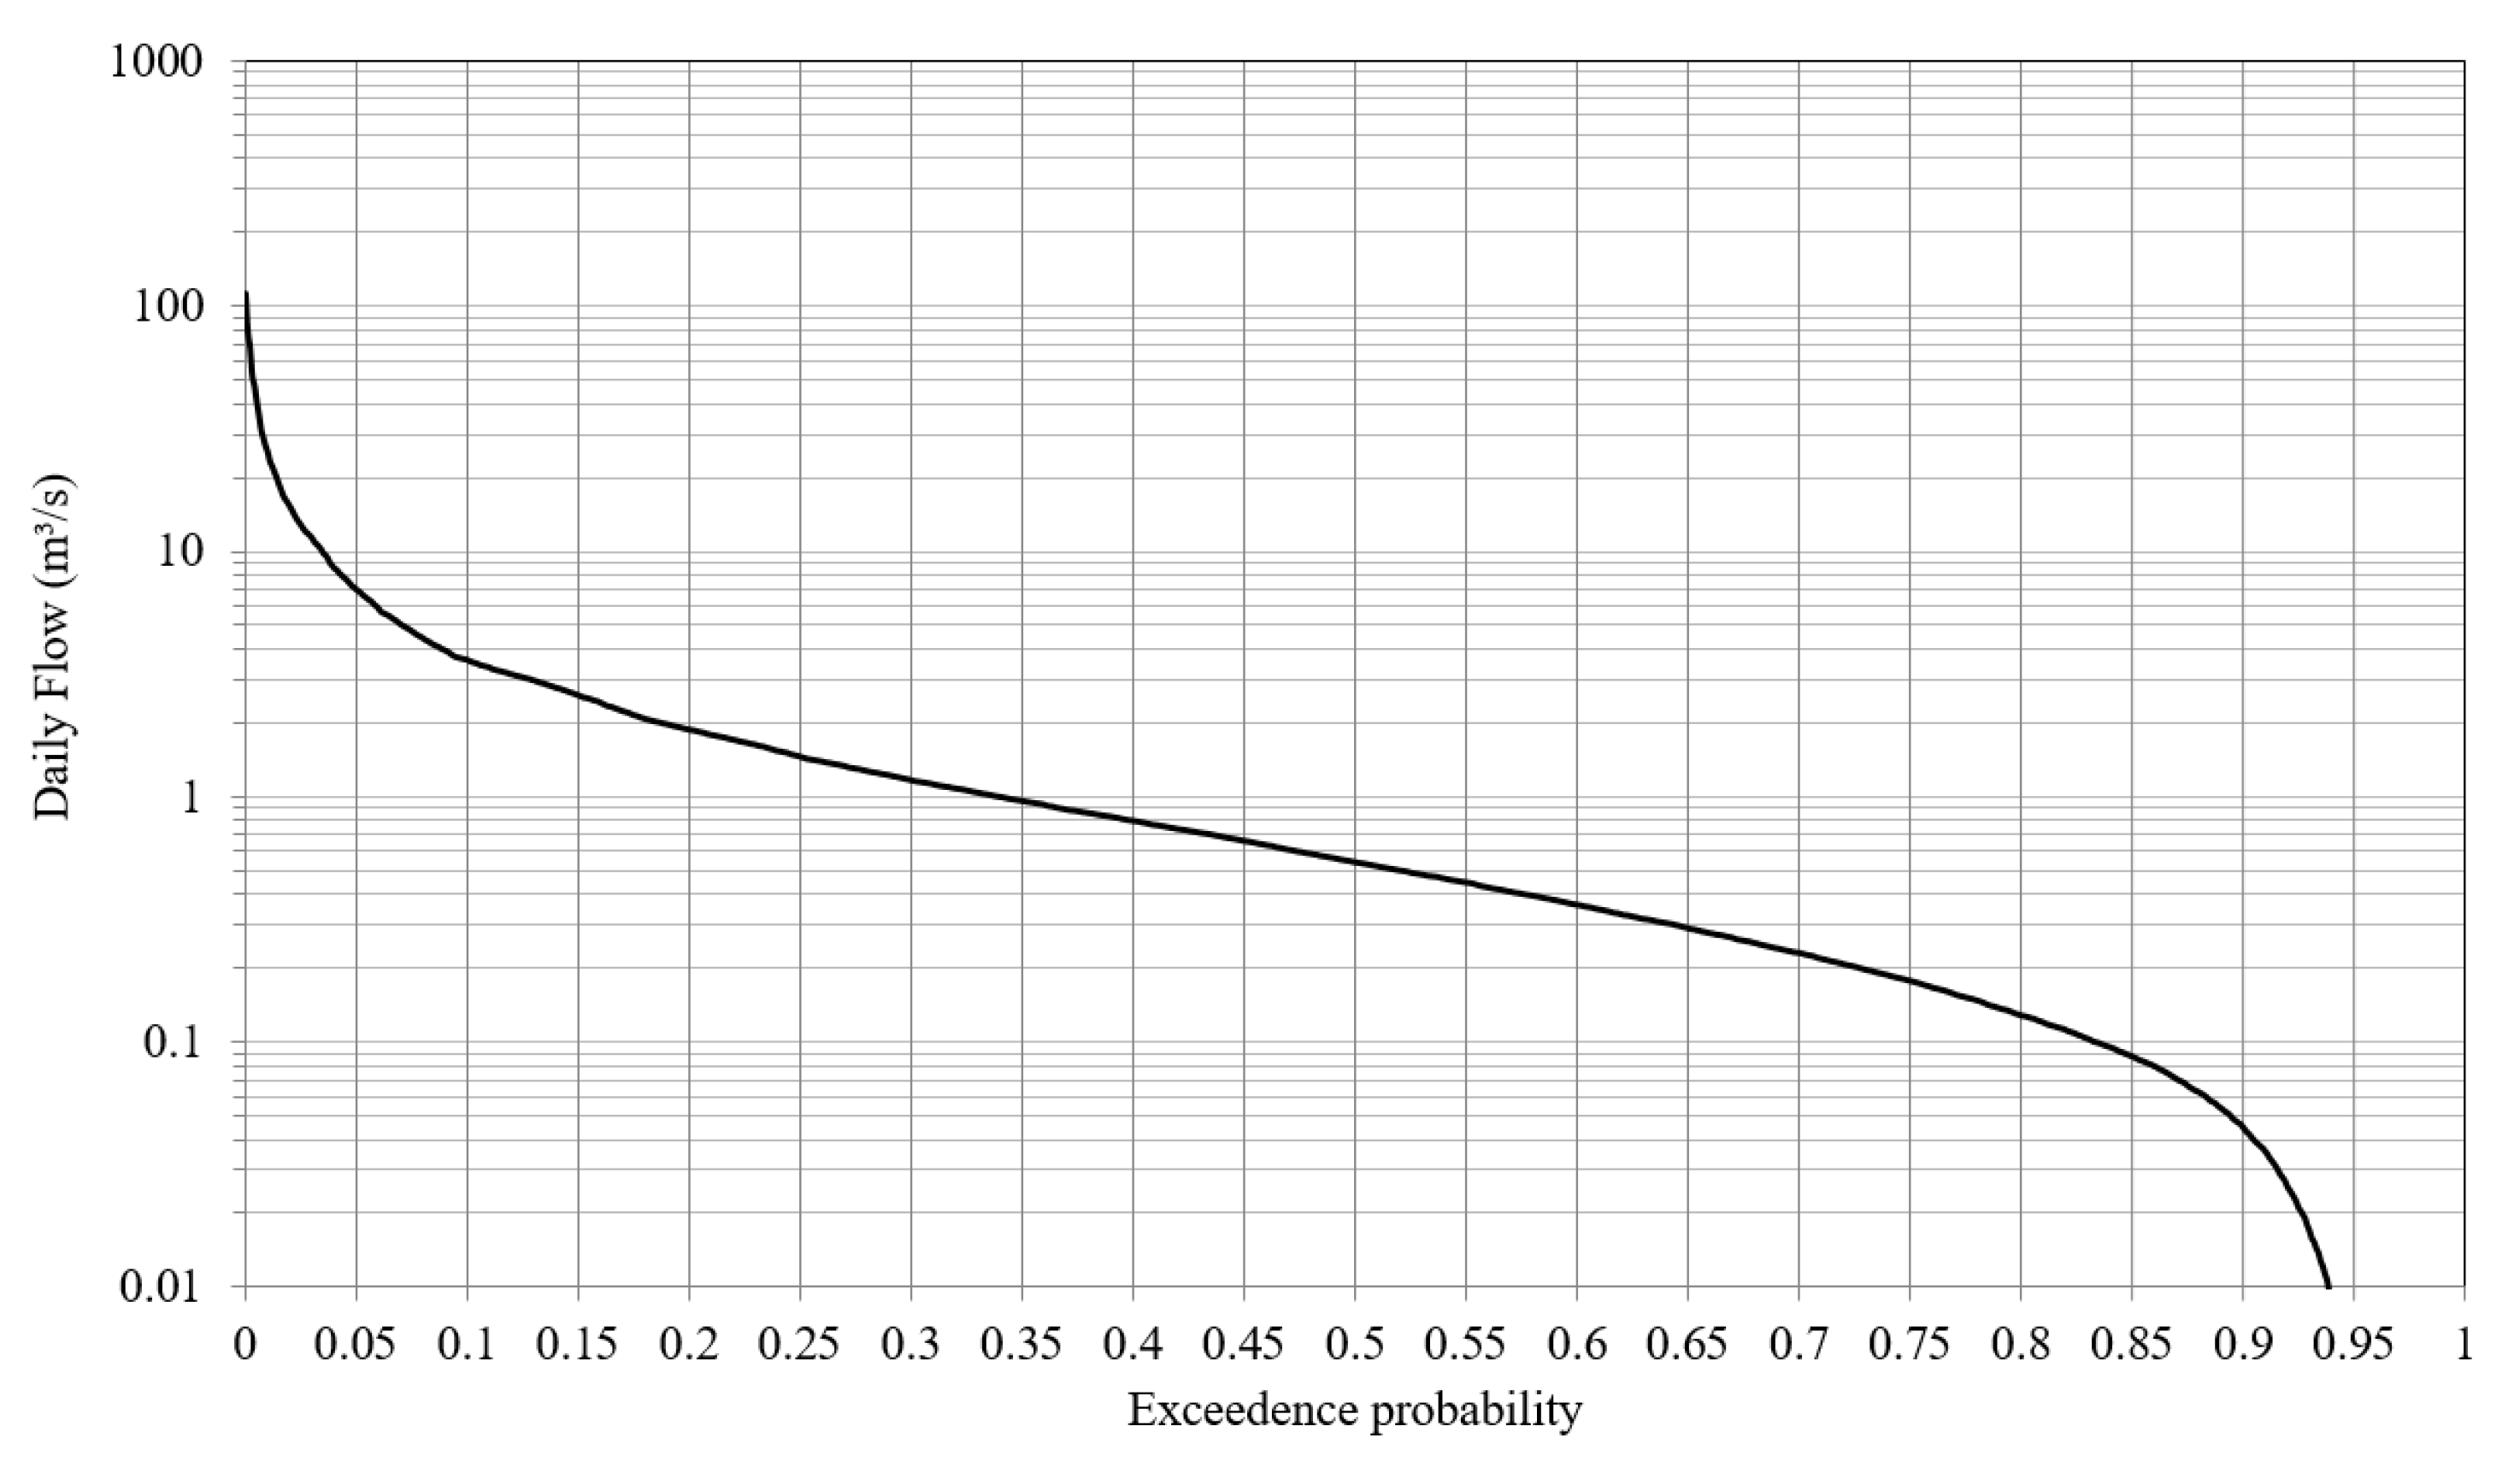
The water withdrawal at the Badu intake is 31,000 m3 per day. Considering that the retaining ratio (Equation (7)) is 0.129, only 3999 m3 per day (or 0.0463 m3/s) needs to be reserved at the prospective dam site. To maintain the suitability of river habitats, the discharge released downstream of the dam should not be lower than the environmental flow. The environmental flow is used to maintain the suitability of river habitats; the discharge released downstream of the dam should not be lower than the environmental flow. Currently, the environmental flow in Taiwan is defined as the daily flow with a 95% exceedance probability, so we adopt Q95% in this study [32]. In this study, we select the larger of the downstream reserved water and the environmental flow for subsequent surplus water analysis of the reservoir. As shown in Table 2, users can apply the Water Resource Analysis Module to estimate the retained flow at the dam site. The natural flow, shown in Figure 9, is adjusted to account for downstream water intake and environmental flow requirements to obtain surplus water. Figure 10 shows the flow duration curve of the surplus water estimated at the prospective dam site for the entire year. The results show that the inflow rate of the available water is 0.83 m3/s at the 50% exceedance probability at the prospective dam site, and the surplus water is 0.54 m3/s, accounting for downstream water intake and environmental flow. Since the water demand in the Ruifang District is only 0.132 m3/s, the 10th River Management Branch intends to build a high dam to compensate for the increasing water demand from industries in the midstream of the Keelung River basin.

4.4. Reservoir Analysis

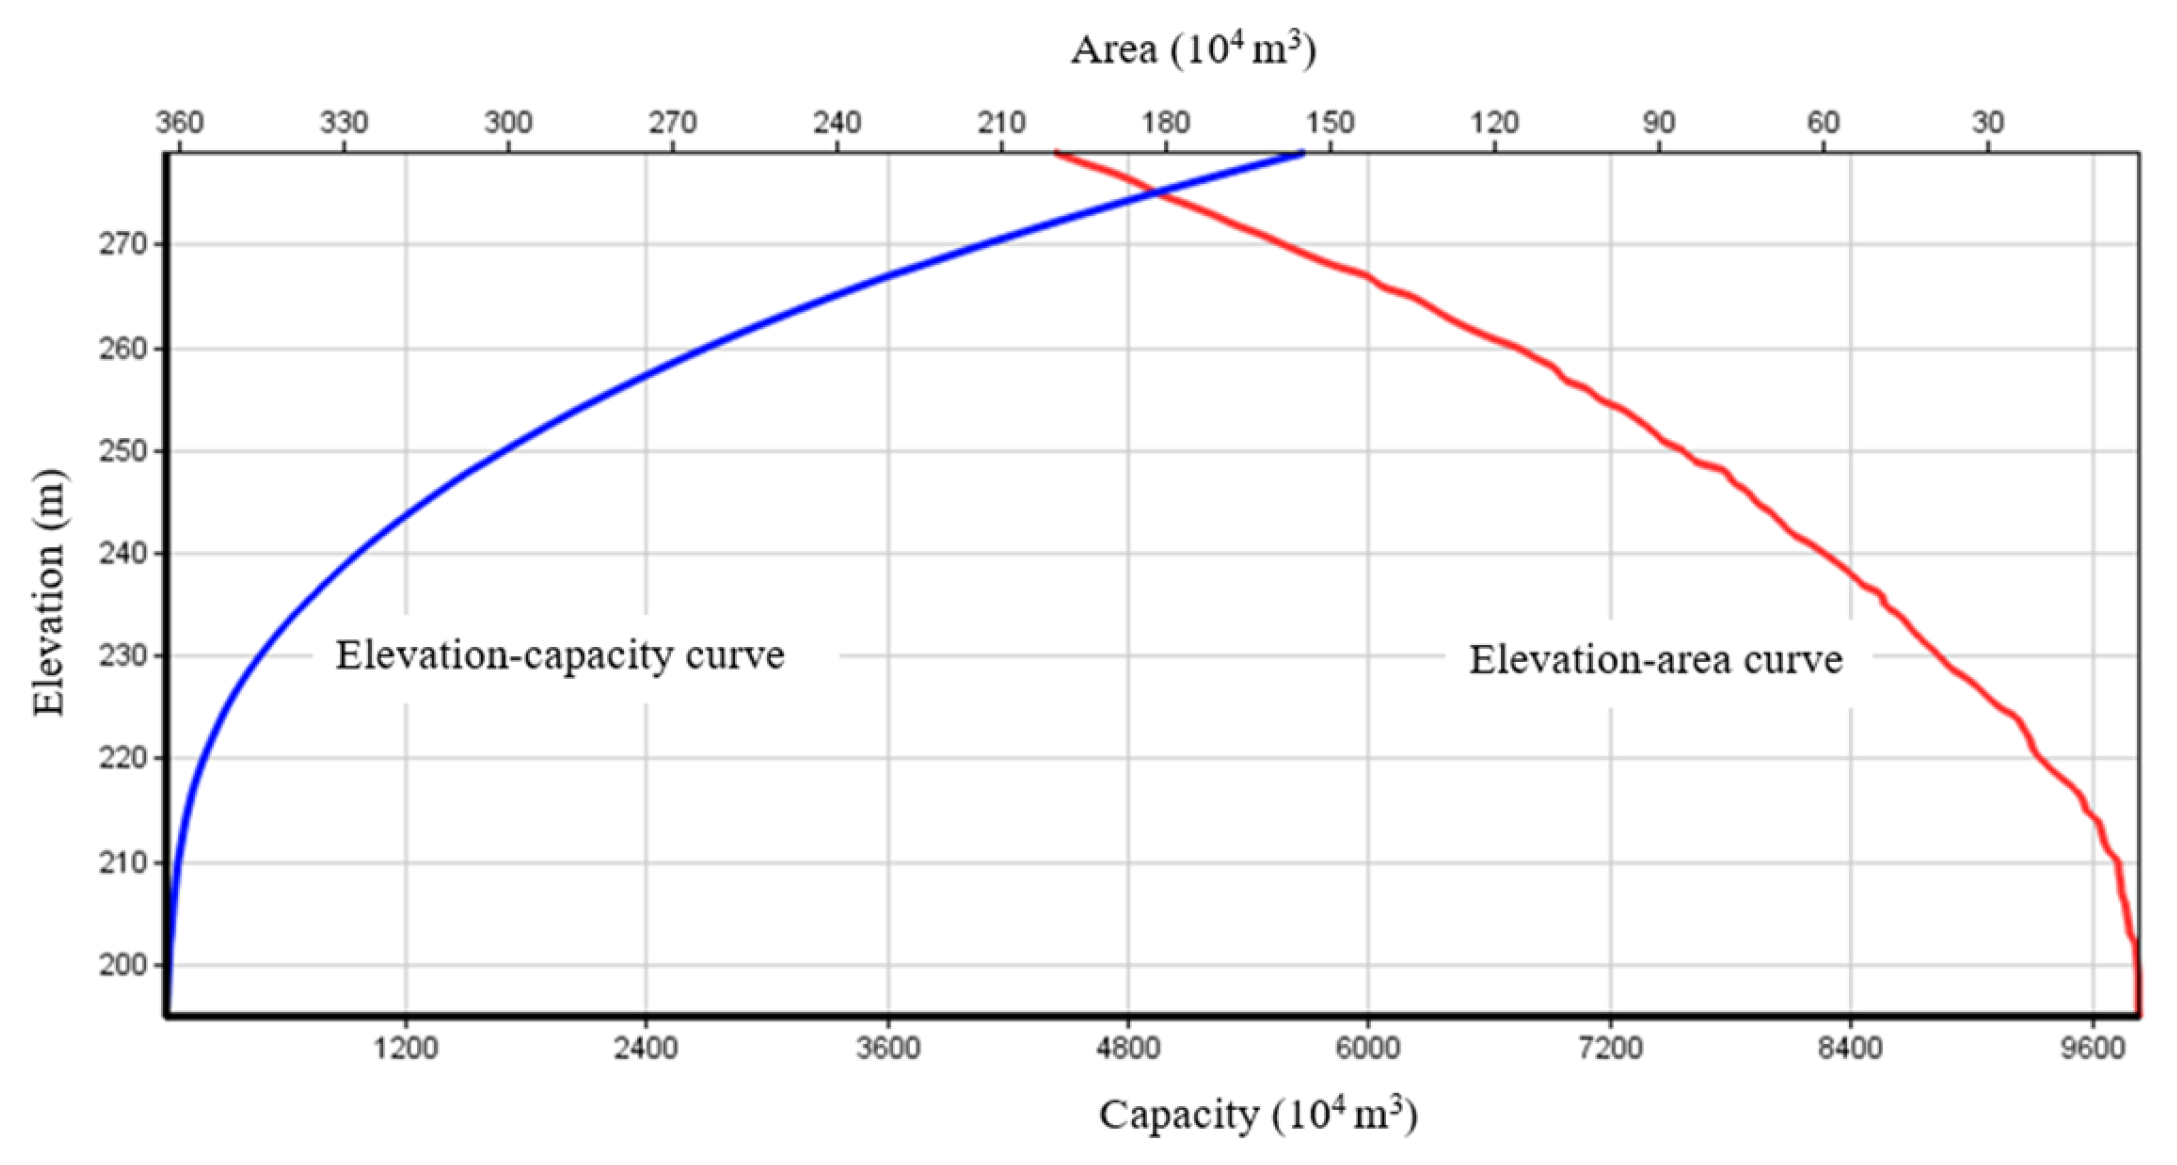
The elevation area curve presents the water surface area at each elevation, which is derived from a topographic contour map or a DEM dataset. The elevation-capacity curve is the cumulative volume of water held below a given elevation, obtained by integrating the elevation area curve upward. As shown in Figure 11 and Table 3, the H-A-V Analysis Function in the Reservoir Analysis Module would provide detailed H-A-V information in graphical and tabular form for the prospective dam site.
Based on flow and sediment discharge records from the Jieshou Bridge gauging station from 1990 to 2024, we applied the Reservoir Analysis Module to derive a sediment rating curve using the least-squares method. The regression relationship between flow discharge and suspended sediment transport rate can be expressed as shown in Equation (10), where a = 0.07 and b = 2.6838. The correlation coefficient for the sediment rating curve regression is 0.87.
Table 4 shows the annual suspended-sediment discharge estimation, which is based on the flow duration curve at the dam site and the suspended-sediment rating curve obtained from the Jieshou Bridge station. In the calculation, the bedload is assumed to be 10% of the suspended load to estimate the total sediment discharge, and the initial reservoir capacity is set to 49.42 × 10 6 m3 according to the H-A-V curve for an 80 m dam height as suggested by the 10th River Management Branch [32]. As shown in Table 4, suspended sediment discharge is relatively low, indicating that the sedimentation would be minor for the prospective reservoir. Table 5 shows the assessment of the useful life of the prospective reservoir using Brune’s capacity-to-inflow ratio [29]. The result shows that over a period of 200 years, only 4.35% of the storage capacity is accumulated by sediment.

5. Conclusions

This study introduces a GIS-based platform to simplify access to geomorphological and hydrological data essential for assessing the feasibility of potential dam sites. Engineers can pinpoint prospective dam sites within the platform interface and identify the most suitable site through a series of analyses that account for local geomorphological and hydrological characteristics as well as engineering practicability. This comprehensive GIS platform will serve as an effective, user-friendly tool, empowering engineers to plan prospective dam sites with greater efficiency and confidence.
The planned Pingxi Reservoir, located in the Keelung River Basin, Taiwan, is used as a case study in this research. A DEM dataset, hydrological records, and existing water demand information were collected as input data for the platform system to conduct a series of analyses. The results show that the surplus water (Q50% = 0.54 m3/s) at the prospective dam site is sufficient to offset the water demand in Ruifang District (=0.132 m3/s). Hence, an 80 m high dam is suggested to store more water to cover the increasing industrial water demand in the midstream of the Keelung River Basin [32]. The assessment of the reservoir’s useful life shows that only 4.35% of the storage capacity is accumulated by sediment over 200 years. Hence, the Pingxi Reservoir appears to be a promising solution to the water shortage problem in Ruifang District and the midstream areas of the Keelung River.

Author Contributions

Conceptualization, K.T.L.; methodology, K.T.L.; software, L.-Y.C., J.-Q.C. and J.-Y.H.; validation, Y.-H.H., M.-C.H. and P.-C.H.; formal analysis, Y.-H.H., M.-C.H. and P.-C.H.; investigation, N.-K.C., C.-W.H., C.-R.L. and C.-M.Y.; data curation, T.-C.C., Y.-T.L. and Y.-H.L. (Yu-Hsun Liao); writing—original draft preparation, K.T.L.; writing—review and editing, K.T.L.; visualization, H.-C.L., Y.-H.L. (You-Huei Lin) and X.T. All authors have read and agreed to the published version of the manuscript.

Funding

This research was funded by the Water Resources Agency in Taiwan, grant number [WRPI 107-11].

Data Availability Statement

Data is contained within the article.

Acknowledgments

The Water Resources Agency in Taiwan supported this project. Financial support from this organization is fully acknowledged.

Conflicts of Interest

The authors declare no conflicts of interest.

References

  1. Steube, M.M.; Johnston, D.M. Runoff volume estimation using GIS Techniques. Water Resour. Bull. 1990, 26, 611–620. [Google Scholar] [CrossRef]
  2. Madiment, D.R. GIS and hydrologic modeling. In Proceedings of the 1st symposium/Workshop on GIS and Environmental Modeling, Boulder, CO, USA, 15–19 September 1991. [Google Scholar]
  3. Feng, C.-C. Open Hydrologic Model for Facilitating GIS and Hydrologic Model Interoperability. In Proceedings of the 4th International Conference on Integrating GIS and Environmental Modeling (GIS/EM4): Problems, Prospects and Research Needs, Banff, AB, Canada, 2–8 September 2000. [Google Scholar]
  4. Lee, K.T.; Chung, Y.-R.; Lau, C.-C.; Meng, C.-C.; Chiang, S. A windows-based inquiry system for design discharge based on geomorphic runoff modeling. Comput. Geosci. 2006, 32, 203–211. [Google Scholar]
  5. Lee, K.T.; Yen, B.C. Geomorphology and kinematic-wave based hydrograph derivation. J. Hydraul. Eng. 1997, 123, 73–80. [Google Scholar]
  6. Grasso, S.; Claps, P.; Ganora, D.; Libertino, A. A web-based open source geoinformation tool for regional water resources assessment. Water Resour. Manag. 2021, 35, 675–687. [Google Scholar]
  7. Girgis, K.; Clouse, N.; Mushe, O.; Morgan, P.; Brooks, T.; Mahmoud, M. The Applications of GIS in Water Resources. In Proceedings of the 2022 International Conference on Computational Science and Computational Intelligence (CSCI), Las Vegas, NV, USA, 14–16 December 2022; pp. 1515–1520. [Google Scholar]
  8. Zhang, W.; Fan, X.; Liu, Y.T.; Wang, S.G.; Chen, B. Spillover risk analysis of virtualwater trade based on multi-regional input–output model—A case study. J. Environ. Manag. 2020, 275, 111242. [Google Scholar]
  9. Pacheco-Vega, R. Policy transfer of environmental policy: Where are we now and where are we going? Examples from water, climate, energy, and waste sectors. In Handbook of Policy Transfer, Diffusion and Circulation; Porto de Oliveira, O., Ed.; Edward Elgar Publishing: Cheltenham, UK, 2021; pp. 386–405. [Google Scholar]
  10. Qi, W.C.; Ma, C.; Xu, H.S.; Chen, Z.F.; Zhao, K.; Han, H. Low impact development measures spatial arrangement for urban flood mitigation: An exploratory optimal framework based on source tracking. Water Resour. Manag. 2021, 35, 3755–3770. [Google Scholar] [CrossRef]
  11. Beven, K.J.; Kirkby, M.J. A physically based variable contributing area model of basin hydrology. Hydrol. Sci. Bull. 1979, 24, 43–69. [Google Scholar] [CrossRef]
  12. Yen, B.C.; Lee, K.T. Unit hydrograph derivation for ungauged watersheds by stream order laws. J. Hydrol. Eng. 1997, 2, 1–9. [Google Scholar] [CrossRef]
  13. Neitsch, S.L.; Arnold, J.G.; Kiniry, J.R.; Williams, J.R.; USDA–ARS, Grassland, Soil and Water Research Laboratory; Blackland Research and Extension Center, Texas AgriLife Research. Soil and Water Assessment Tool Theoretical Documentation Version 2009; Texas Water Resources Institute Technical Report. No. 406; Texas A&M University System: College Station, TX, USA, 2011. [Google Scholar]
  14. Bergström, S.; Lindström, G. Interpretation of runoff processes in hydrological modelling—Experience from the HBV approach. Hydrol. Process. 2015, 29, 3535–3545. [Google Scholar] [CrossRef]
  15. USACE. Hydrologic Modeling System HEC-HMS User’s Manual; Version 4.3; US Army Corps of Engineers, Hydraulic Engineering Center: Davis, CA, USA, 2022.
  16. Scanlon, T.M.; Raffensperger, J.P.; Hornberger, G.M.; Clapp, R.B. Shallow subsurface storm flow in a forested headwater watershed: Observations and modeling using a modified TOPMODEL. Water Resour. Res. 2000, 36, 2575–2586. [Google Scholar] [CrossRef]
  17. Beven, K.J.; Kirkby, M.J.; Freer, J.E.; Lamb, R. A history of TOPMODEL. Hydrol. Earth Syst. Sci. 2021, 25, 527–549. [Google Scholar] [CrossRef]
  18. Quinn, P.F.; Beven, K.J. Spatial and temporal predictions of soil moisture dynamics, runoff variable source areas and evapotranspiration for Plynlimon, mid-Wales. Hydrol. Process. 1993, 7, 425–448. [Google Scholar]
  19. Quinn, P.F.; Beven, K.J.; Lamb, R. The ln(a/tan β) index: How to calculate it and how to use it in the TOPMODEL framework. Hydrol. Process. 1995, 9, 161–182. [Google Scholar]
  20. Beven, K.; Freer, J. A dynamic TOPMODEL. Hydrol. Process. 2001, 15, 1993–2011. [Google Scholar] [CrossRef]
  21. Vincendon, B.; Ducrocq, V.; Saulnier, G.M.; Bouilloud, L.; Chancibault, K.; Habets, F.; Noilhan, J. Benefit of coupling the ISBA land surface model with a TOPMODEL hydrological model version dedicated to Mediterranean flash-floods. J. Hydrol. 2010, 394, 256–266. [Google Scholar] [CrossRef]
  22. Gao, J.; Holden, J.; Kirkby, M. Modelling impacts of agricultural practice on flood peaks in upland watersheds: An application of the distributed TOPMODEL. Hydrol. Process. 2017, 31, 4206–4216. [Google Scholar]
  23. Li, B.; Liang, Z.; He, Y.; Hu, L.; Zhao, W.; Acharya, K. Comparison of parameter uncertainty analysis techniques for a TOPMODEL application. Stoch. Environ. Res. Risk 2017, 31, 1045–1059. [Google Scholar]
  24. Gumindoga, W.; Murwira, A.; Rwasoka, D.T.; Jahure, F.B.; Chikwiramakomo, L. The spatio-temporal soil moisture variation along the major tributaries of Zambezi River in the Mbire District, Zimbabwe. J. Hydrol. Reg. Stud. 2020, 32, 100753. [Google Scholar] [CrossRef]
  25. Huang, B.; Jiang, B. AVTOP: A full integration of TOPMODEL into GIS. Environ. Model. Softw. 2001, 17, 261–268. [Google Scholar]
  26. Li, Z.-J.; Zhang, K. Comparison of three GIS-based hydrological models. J. Hydrol. Eng. 2008, 13, 364–370. [Google Scholar] [CrossRef]
  27. Pan, F.; Peters-Lidard, C.D.; Sale, M.J.; King, A.W. A comparison of geographical information systems–based algorithms for computing the TOPMODEL topographic index. Water Resour. Res. 2004, 40, W06303. [Google Scholar] [CrossRef]
  28. Water Resources Planning Institute. Reference Manual for River Management and Environmental Creation Planning; Water Resources Agency, Ministry of Economic Affairs: Taipei City, Taiwan, 2006. (In Chinese)
  29. Brune, G.M. Trap efficiency of reservoirs. Trans. Am. Geophys. Union 1953, 34, 407–418. [Google Scholar] [CrossRef]
  30. Horner, W.; Flynt, F. Relation between rainfall and runoff from small urban areas. Trans. Am. Soc. Civ. Eng. 1936, 101, 140–183. [Google Scholar] [CrossRef]
  31. Loucks, D.P.; Stedinger, J.R.; Haith, D.A. Water Resource Systems Planning and Analysis; Prentice-Hall: Hoboken, NJ, USA, 1981. [Google Scholar]
  32. The 10th River Management Branch, Taiwan Water Resources Agency. Available online: https://www.wra.gov.tw/wra10en/cl.aspx?n=15624 (accessed on 25 June 2026).
Figure 1. Flowchart of the water resource analysis for prospective dam sites.
Water 18 01596 g001
Figure 2. Scheme of the elevation-storage curve derivation.
Water 18 01596 g002
Figure 3. Scheme of the TOPMODEL structure.
Water 18 01596 g003
Figure 4. Surplus water analysis at the prospective dam site.
Water 18 01596 g004
Figure 5. Module functions of the GIS platform.
Water 18 01596 g005
Figure 6. Hydrological gauging stations in the Keelung River Basin and the prospective Pingxi dam site.
Water 18 01596 g006
Figure 7. Daily-flow simulation at the Jieshou Bridge flow-gauging station.
Water 18 01596 g007
Figure 8. Daily-flow simulation at the prospective dam site (Pingxi).
Water 18 01596 g008
Figure 9. Exceedance probability of the 10-day flow at the prospective dam site (Pingxi).
Water 18 01596 g009
Figure 10. Flow duration curve of the surplus water estimated at the prospective dam site.
Water 18 01596 g010
Figure 11. H-A-V curve for the prospective dam site.
Water 18 01596 g011
Table 1. Geomorphological factors of the study areas.
Watershed OutletArea
(km2)
Mainstream Length
(km)
Mainstream Slope
(m/m)
Watershed Mean Slope
(m/m)
Keelung River Basin484.4386.620.0060.189
Badu water intake148.6640.350.0130.252
Jieshou Bridge95.9428.350.0170.273
Pingxi Reservoir19.258.380.0410.285
Table 2. Retained flow at the prospective dam site (Pingxi).
10-DayReserved for Downstream Water Intake
(m3/s)
Environmental Flow
Q95% (m3/s)
Retained Flow
(m3/s)
10-DayReserved for
Downstream
Water Intake
(m3/s)
Environmental Flow
Q95% (m3/s)
Retained Flow
(m3/s)
10.04630.25430.2543190.04630.16790.1679
20.04630.19660.1966200.04630.13800.1380
30.04630.22800.2280210.04630.12990.1299
40.04630.26240.2624220.04630.13730.1373
50.04630.23980.2398230.04630.11690.1169
60.04630.27640.2764240.04630.09900.0990
70.04630.25870.2587250.04630.14420.1442
80.04630.22140.2214260.04630.12570.1257
90.04630.18510.1851270.04630.25900.2590
100.04630.16690.1669280.04630.27080.2708
110.04630.13970.1397290.04630.35690.3569
120.04630.12920.1292300.04630.29450.2945
130.04630.13000.1300310.04630.35460.3546
140.04630.11630.1163320.04630.38950.3895
150.04630.09860.0986330.04630.44180.4418
160.04630.12230.1223340.04630.40980.4098
170.04630.17520.1752350.04630.34650.3465
180.04630.20680.2068360.04630.32740.3274
Table 3. H-A-V dataset for the prospective Pingxi dam site.
Elevation
(m)
Area
(104 m2)
Capacity
(104 m3)
Elevation
(m)
Area
(104 m2)
Capacity
(104 m3)
1952.248.4024059.68961.81
2002.5620.3424572.161293.52
2054.4840.1325085.441690.77
2106.0867.09255100.642155.44
21511.84116.09260115.682694.08
22020.16193.54265135.043325.10
22527.52308.48270158.244069.52
23038.56472.98275181.284917.12
23548.64692.86280200.165677.57
Table 4. Average suspended sediment inflow at the prospective dam site.
Percent Time
(%)
Interval of Percent Time
(%)
Average Percent Time
(%)
Inflow Discharge
(m3/s)
Suspended Sediment
(ton/day)
Average Inflow Discharge
(m3/s)
Average Suspended Sediment
(ton/day)
0.050.050.025115.36023,946.4930.05811.973
0.10.050.07597.55015,268.1420.0497.634
0.150.050.12576.6607996.5720.0383.998
0.20.050.17570.9606499.0270.0353.250
0.250.050.22562.6004642.4180.0312.321
0.30.050.27554.6903230.6900.0271.615
0.350.050.32551.5202752.3190.0261.376
0.40.050.37549.2902444.1290.0251.222
0.450.050.42545.9702026.9690.0231.013
0.50.050.47542.7601669.0790.0210.835
0.550.050.52540.0101396.3620.0200.698
0.60.050.57537.4301167.6300.0190.584
0.650.050.62535.7201029.9160.0180.515
0.70.050.67533.410860.7510.0170.430
0.750.050.72531.340724.9840.0160.362
0.80.050.77530.110651.1210.0150.326
0.850.050.82528.860581.0870.0140.291
0.90.050.87527.740522.5250.0140.261
0.950.050.92526.860479.2180.0130.240
10.050.97526.200448.2650.0130.224
211.50020.720238.7950.2072.388
312.50013.60077.1420.1360.771
413.50010.23035.9250.1020.359
514.5008.08019.0730.0810.191
1057.5005.5606.9940.2780.350
15512.5003.3501.7960.1670.090
20517.5002.4900.8100.1250.040
25522.5001.9100.3970.0960.020
30527.5001.5600.2310.0780.012
35532.5001.3100.1440.0650.007
40537.5001.1100.0930.0550.005
45542.5000.9600.0630.0480.003
50547.5000.8300.0420.0420.002
55552.5000.7200.0290.0360.001
60557.5000.6300.0200.0310.001
65562.5000.5400.0130.0270.001
70567.5000.4700.0090.0230.000
75572.5000.4000.0060.0200.000
80577.5000.3500.0040.0170.000
85582.5000.3000.0030.0150.000
90587.5000.2500.0020.0120.000
95592.5000.2000.0010.0100.000
97296.0000.1600.0010.0030.000
100398.5000.1000.0000.0030.000
Summation43.411
Table 5. Useful life analysis for Pingxi Reservoir.
Capacity
(104 m3)
Inflow
Discharge
(104 m3)
Capacity-Inflow RatioTrap Efficiency
(%)
Annual Sediment Trapped
(104 m3)
Available Capacity
(104 m3)
Increment Period
(yr)
Years
to Fill
(yr)
49426841.130.72297.041.1349311010
49316841.130.72297.041.1349191020
49196841.130.72297.041.1349081030
49086841.130.72297.041.1348971040
48976841.130.72297.041.1348861050
48866841.130.72297.041.1348741060
48746841.130.72197.041.1348631070
48636841.130.72197.041.1348521080
48526841.130.72197.041.1348401090
48406841.130.72197.041.13482910100
48296841.130.72197.041.13481810110
48186841.130.72197.041.13480610120
48066841.130.72097.041.13479510130
47956841.130.72097.041.13478410140
47846841.130.72097.041.13477310150
47736841.130.72097.041.13476110160
47616841.130.72097.041.13475010170
47506841.130.72097.041.13473910180
47396841.130.71997.041.13472710190
47276841.130.71997.041.13471610200
Disclaimer/Publisher’s Note: The statements, opinions and data contained in all publications are solely those of the individual author(s) and contributor(s) and not of MDPI and/or the editor(s). MDPI and/or the editor(s) disclaim responsibility for any injury to people or property resulting from any ideas, methods, instructions or products referred to in the content.