This section describes the rainfall analysis, the hydraulic model setup and calibration, the hazard–vulnerability–risk assessment workflow, the formulation of structural and non-structural intervention measures, and the residual-risk modeling framework. The complete chain links meteorological forcing to design-level mitigation alternatives, including the cold-front-driven simulation that supported the February 2026 emergency response.
3.1. Rainfall Analysis and Design Storms
Daily precipitation records from 15 IDEAM stations within and surrounding Monteria were used. Records span 1960–2024, with all stations retaining more than 80% data availability after removal of years with more than 20% missing observations [
22]. Consistency was verified through double-mass analysis (coefficient of determination greater than 0.997 for all pairs), and stationarity was assessed via the Mann–Kendall trend test and the U-test for change in the mean. Intensity–Duration–Frequency curves were synthesized following Vargas and Díaz-Granados [
23] for the Caribbean hydrological region, and design storms for return periods of 2.33, 5, 10, 25, 50, and 100 years were generated for use as forcing in the hydrodynamic model.
Table 1 presents the summary statistics for the 15 precipitation stations, including station name, record period, data availability (%), mean and standard deviation of annual maximum 24 h rainfall (mm), skewness, and kurtosis. Data availability across stations ranges from 69.2% (Turipaná, 1960–2024) to 96.4% (California, 1975–2002), with 12 of the 15 stations exceeding 80% availability. The stations with lower data availability (Galán, Turipaná, and Montería with 74.3%, 69.2%, and 71.0%, respectively) were retained in the analysis as the missing data is concentrated in a limited number of years and does not compromise the statistical representativity of the long-term records. Mean annual maximum 24 h rainfall across the network ranges from 83.19 mm (Mocarí) to 96.61 mm (Flor del Sinú), reflecting the spatial variability of extreme precipitation in the region. All stations exhibit positive skewness (mean skewness: 0.772), consistent with extreme-value distributions expected in precipitation frequency analysis. Kurtosis values range from −1.096 (Galán) to 8.124 (Turipaná), with elevated values at Turipaná and Mocarí driven by individual extreme events (210.5 mm and 153.4 mm respectively) that exceed the remaining series by significant margins.
Table 2 presents the corresponding summary statistics for the maximum annual discharge data at the Montería Autónoma limnimetric station (13067020) for the post-Urrá I period (2000–2024), including mean (822.13 m
3/s), standard deviation (89.05 m
3/s), coefficient of variation (0.108), median (820.00 m
3/s), skewness (−0.282), and the fitted Log-Normal distribution parameters (μ_ln = 6.7061, σ_ln = 0.1113). The analysis is restricted to the post-Urrá I hydroelectric dam period (operational since 2000) to ensure hydrologic consistency, as the dam’s regulation fundamentally altered the natural flow regime by attenuating peak discharges. The negative skewness observed in the discharge series reflects this regulatory effect, contrasting with the positive skewness characteristic of unregulated fluvial systems. The Log-Normal distribution provided the best fit to the annual maximum discharge data (Kolmogorov–Smirnov test:
p = 0.95, Dist = 0.099), and these parameters were used to derive the design discharge values presented in the subsequent frequency analysis tables.
3.2. Rain-on-Grid 2D Hydrodynamic Model
The flood model was built in HEC-RAS 6.6 using a fully integrated distributed hydrological–hydrodynamic (Rain-on-Grid) approach in which rainfall is applied directly to each computational cell and the shallow-water equations govern the two-dimensional momentum-conserving routing of runoff and channel flow [
24]. Recent reviews of flood inundation modeling [
25] and rapid 2D flood mapping approaches [
26] confirm the suitability of fully distributed hydrodynamic schemes for such settings. This methodology is particularly suited to the low-gradient, highly interconnected surface drainage of Monteria, where the distinction between overland and channel flow is blurred and empirical unit-hydrograph methods systematically underestimate travel times and flood depths [
10]. The computational mesh was developed from a 20 cm-resolution photogrammetric Digital Terrain Model coupled with detailed bathymetric surveys of the Sinu River and 43 macro-drainage channels. Three mesh refinement levels were tested for mesh-independence: Mesh-A (coarse: 30 m in streets, minimum 1 cell per channel width), Mesh-B (intermediate: 20 m in streets, minimum 1.5 cells per channel width), and Mesh-C (fine: 10 m in streets, more than 2 cells per channel width). Independence was assessed by analyzing the invariance of the outlet hydrograph produced under a constant, spatially uniform rainfall applied over the principal urban sub-catchments; Mesh-C was adopted for all production simulations when the peak discharge and hydrograph shape converged with Mesh-B to within 3%.
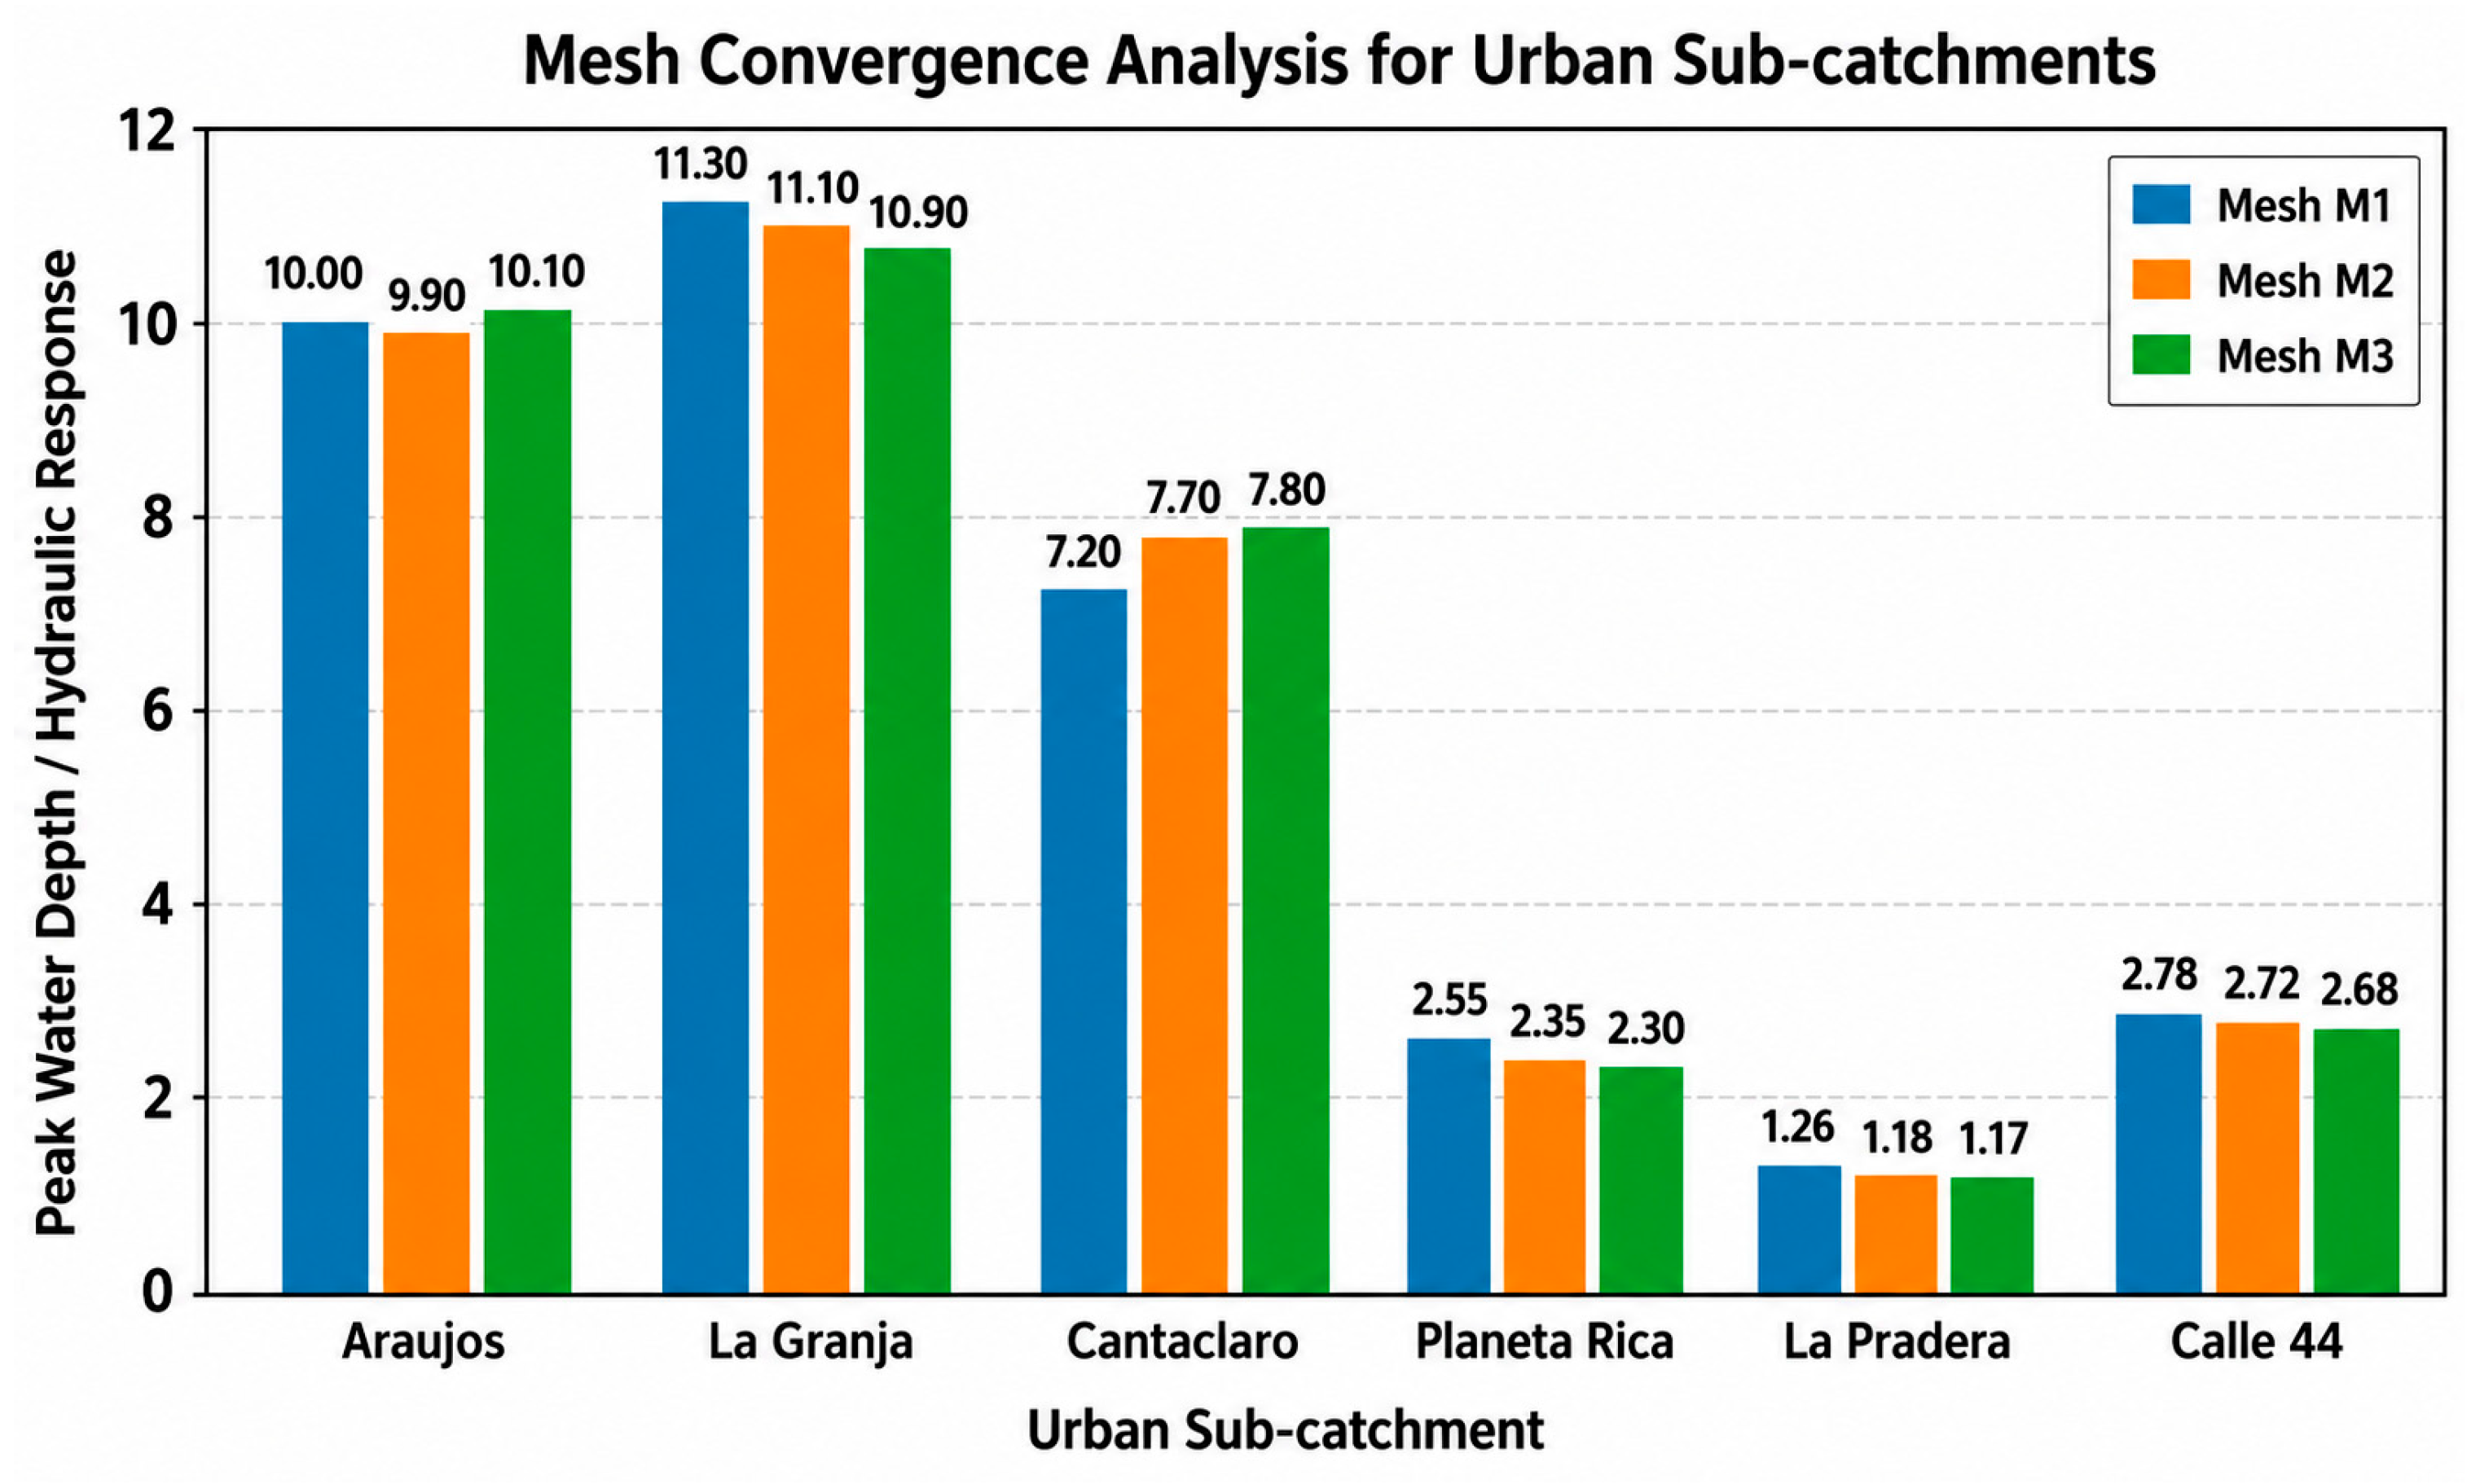
A mesh independence analysis was already performed in the original technical study and has now been explicitly incorporated and clarified in the manuscript. Three computational meshes (M1, M2, and M3) with progressively finer spatial discretization were evaluated. The refinement included street resolution, number of computational cells across channels, and river discretization. Specifically, the river refinement increased from 50 m (>2 cells across the river width) in M1 to 15 m (>10 cells across the river width) in M3, while urban street refinement varied from 15 m to 10 m.
The models were forced using the same uniform rainfall event (10 mm/h during 10 h; total rainfall = 100 mm) and a Sinú River inflow of 837.7 m
3/s, corresponding to a 2.33-year return period event. The analysis compared discharge, velocity, and water levels at the outlet of the Sinú River and urban drainage basins. Additionally, results from an extra hyper-refined mesh (M4), twice as refined as M3, were compared against the standard meshes. The comparison demonstrated limited variation between M3 and M4 results, indicating numerical convergence and confirming that the adopted mesh resolution provides stable hydraulic outputs while maintaining computational feasibility. This clarification has been added to the revised manuscript (
Figure 2).
Surface roughness (Manning’s n) was assigned by land-cover class following Chow [
27]: continuous urban fabric
n = 0.018, discontinuous urban fabric
n = 0.029, and roads
n = 0.017. Runoff was partitioned using the SCS Curve Number method [
28] under antecedent moisture condition CN(III) (wet), consistent with the sequential intense rainfall characteristic of the Caribbean wet season.
A sensitivity analysis of antecedent soil moisture conditions was incorporated to evaluate the influence of SCS Curve Number (CN) assumptions on runoff generation and flood propagation. The hydrological–hydraulic simulations adopted antecedent moisture condition CN(III) (wet conditions), consistent with the sequential intense rainfall events characteristic of the Caribbean wet season in Montería, where soils remain close to saturation for prolonged periods. CN(II) values were initially estimated from land-cover and hydrologic soil group information and subsequently transformed to CN(III) conditions for design-event simulations due to Regional Environmental Authority recommendations. The model was calibrated with 16 liquid gauging records from the Urra I power-plant team (2000–2018) at the Monteria Autonoma limnimetric station. For discharges below 600 m3/s the best-fit Manning’s value was n = 0.055; for peak discharges above 700 m3/s (the range relevant to extreme-event simulation) n = 0.06. The calibrated model was validated against observed water levels along Street 41 for two documented river-overflow events: 23 August 2007 and 17 December 2010, with simulated water levels matching observations with errors below 1%. Urban drainage performance was additionally validated against two intense pluvial events recorded at the Aeropuerto Los Garzones pluviograph: 1 August 2024 and 1 November 2024. Both events generated macro-drainage collapse and were documented through a community survey campaign using ArcGIS Survey123, which collected over 300 georeferenced depth measurements across 12 neighborhoods.
The model’s performance was evaluated using standard goodness-of-fit measures. For the Sinú River calibration dataset (14 measurement records from 2005 to 2018), with a Manning’s coefficient of n = 0.06, the Nash–Sutcliffe efficiency (NSE) was 0.916, the root mean square error (RMSE) was 0.229 m, and the coefficient of determination (R
2) was 0.916. A slight systematic positive bias (mean error = +0.228 m) was identified, attributable to the progressive increase in the channel’s hydraulic conveyance capacity over time, which is conservative and acceptable for flood risk assessment.
Table 3 presents the observed water levels versus simulated ones, annotated with NSE, RMSE, and R
2. Validation against the August 2007 and December 2010 river flooding events yielded absolute water level errors ≤ 3 cm at nine monitoring points along Calle 41 (
Table 4), corresponding to approximately 1.5–2% of the observed flood depths, with NSE = 0.846, RMSE = 2.54 cm, and R
2 = 0.846. The phrase “errors less than 1%” in the original text referred specifically to the percentage difference in water surface elevation at individual measurement points where Manning’s coefficient was optimized for the 2007 and 2010 events independently (e.g., 0.00% error at point 3 on 26 June 2010, with
n = 0.08), prior to the final multi-year calibration.
3.3. Channel Hierarchy and Lateral-Inflow Extraction
For the mitigation analysis, channels were ordered hierarchically: first-order channels receive runoff directly from urban surfaces, while higher-order channels collect and convey lower-order contributions progressively toward the main channel. The nomenclature combines a sub-catchment prefix (e.g., CC for Canta Claro) and ascending numbering: first-order channels CC1, CC2, CC3; second-order channels CC_11, CC_12; third-order channels CC_21, CC_22; up to the outlet channel. Numbering follows a clockwise direction starting from the lower-left corner of the sub-catchment. This system is an adaptation of the Strahler [
29] and Shreve’s [
30] classifications to the particularities of Monteria’s urban drainage and enables a clear database identification of every reach.
The model separates effective precipitation from total precipitation and propagates the excess through the sub-catchment to the macro-drainage channels as lateral inflow. Second-order and higher channels additionally receive the accumulated discharges from upstream reaches, and the lateral contribution of each reach is computed as Q_lat = Q_downstream − Q_upstream. Zero or negative results were interpreted as absence of contribution—due to low runoff, very short reaches, or losses associated with potential overflows. This procedure distinguishes reaches that merely convey flow from those that actively contribute to it, which is essential for prioritizing structural interventions.
3.5. Vulnerability and Risk Assessment
Urban blocks within the POT 2021–2033 risk polygons [
32] were identified through GIS location-selection. Critical facilities (hospitals, schools, public administration, emergency services), classified according to national risk-zoning guidelines [
33], were extracted from the POT base cartography and spatially intersected with the risk polygon. Building-level exposure was characterized by 1465 household surveys (ArcGIS Survey123; 45 neighborhoods; multicriterion geographic quadrant sampling) and 156 commercial-zone interviews.
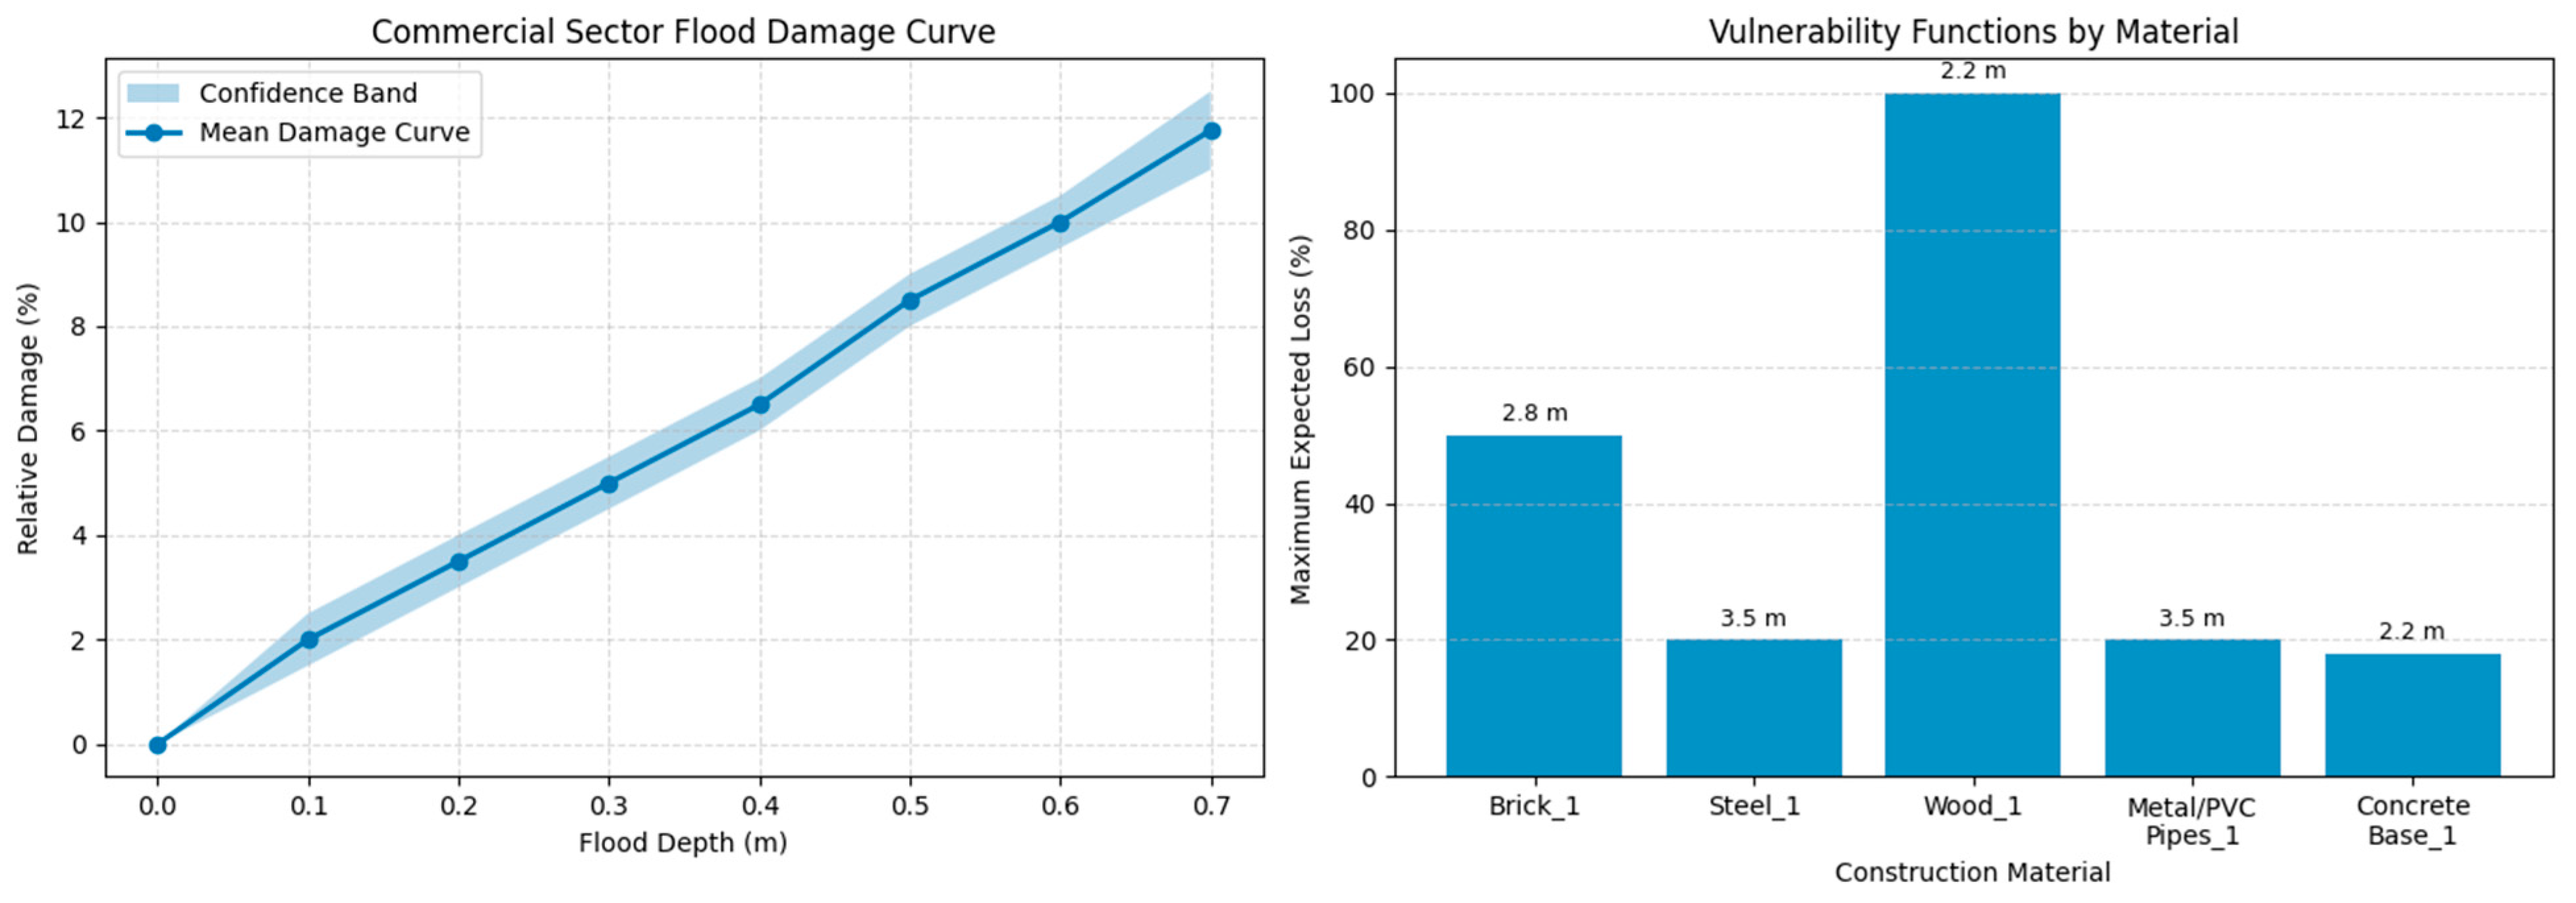
A dual-zone approach was adopted for vulnerability assessment, reflecting the distinct urban typologies within the study area. For the central commercial zone—characterized by mixed-use occupancy and higher-value contents—local depth-damage functions were derived directly from the 156 field interviews. Each respondent reported the maximum water depth experienced during the reference flood event (the 2010–2011 La Niña episode), the structural components damaged (walls, floors, doors), the contents affected (furniture, appliances), and the estimated time to functional recovery. Survey responses were converted into depth-damage pairs by assigning each record to a water-depth class (bins of 5 cm from 0 to 80 cm, and a single class above 80 cm) and estimating the damage as a percentage of replacement value based on the reported extent of structural and content losses. These empirical points were then fitted to the vulnerability function proposed by Cardona [
34], following the formulation of the formulation proposed by Cardona and Ordaz [
35]:
where s
0 is the flood intensity (maximum depth) producing 50% expected loss and ε governs the curve slope. For the commercial zone, the fitted parameters were s
0 = 1.20 m and ε = 2.00. The fitting was performed by least-squares minimization on the binned empirical damage ratios, and the resulting curve was checked for monotonicity and plausibility (damage increasing with depth, near-zero damage below 5 cm).
For the residential neighborhoods and peripheral sectors—predominantly single-story cement-block dwellings—the construction of fully independent local curves was not feasible due to the lower density of damage observations per depth class in individual neighborhoods. Instead, the depth-damage functions developed by Cardona et al. [
36] for the La Mojana Caribbean floodplain were adopted as baseline curves, on the basis that the La Mojana region shares with Montería the same dominant construction typology (unreinforced cement-block walls, concrete or tile flooring), the same hazard regime (slow-rise pluvial ponding with depths up to 1.5 m and velocities below 1 m/s), and comparable socioeconomic conditions. The La Mojana functions were then adjusted to Montería conditions using correction factors derived from the 1465 household survey damage ratios: the observed mean damage at each depth class was compared with the La Mojana prediction, and the s
0 and ε parameters were shifted to minimize the residual between survey observations and the transferred curve, yielding s
0 = 1.50 m and ε = 1.85 for one-story cement-block dwellings.
To reduce noise and avoid non-physical behavior, all fitted functions were reviewed for plausibility, ensuring that damage increased monotonically with depth and that lower depths produced limited loss. The variance of the loss was estimated using the ATC-13 functional form [
37], with Vmax and D
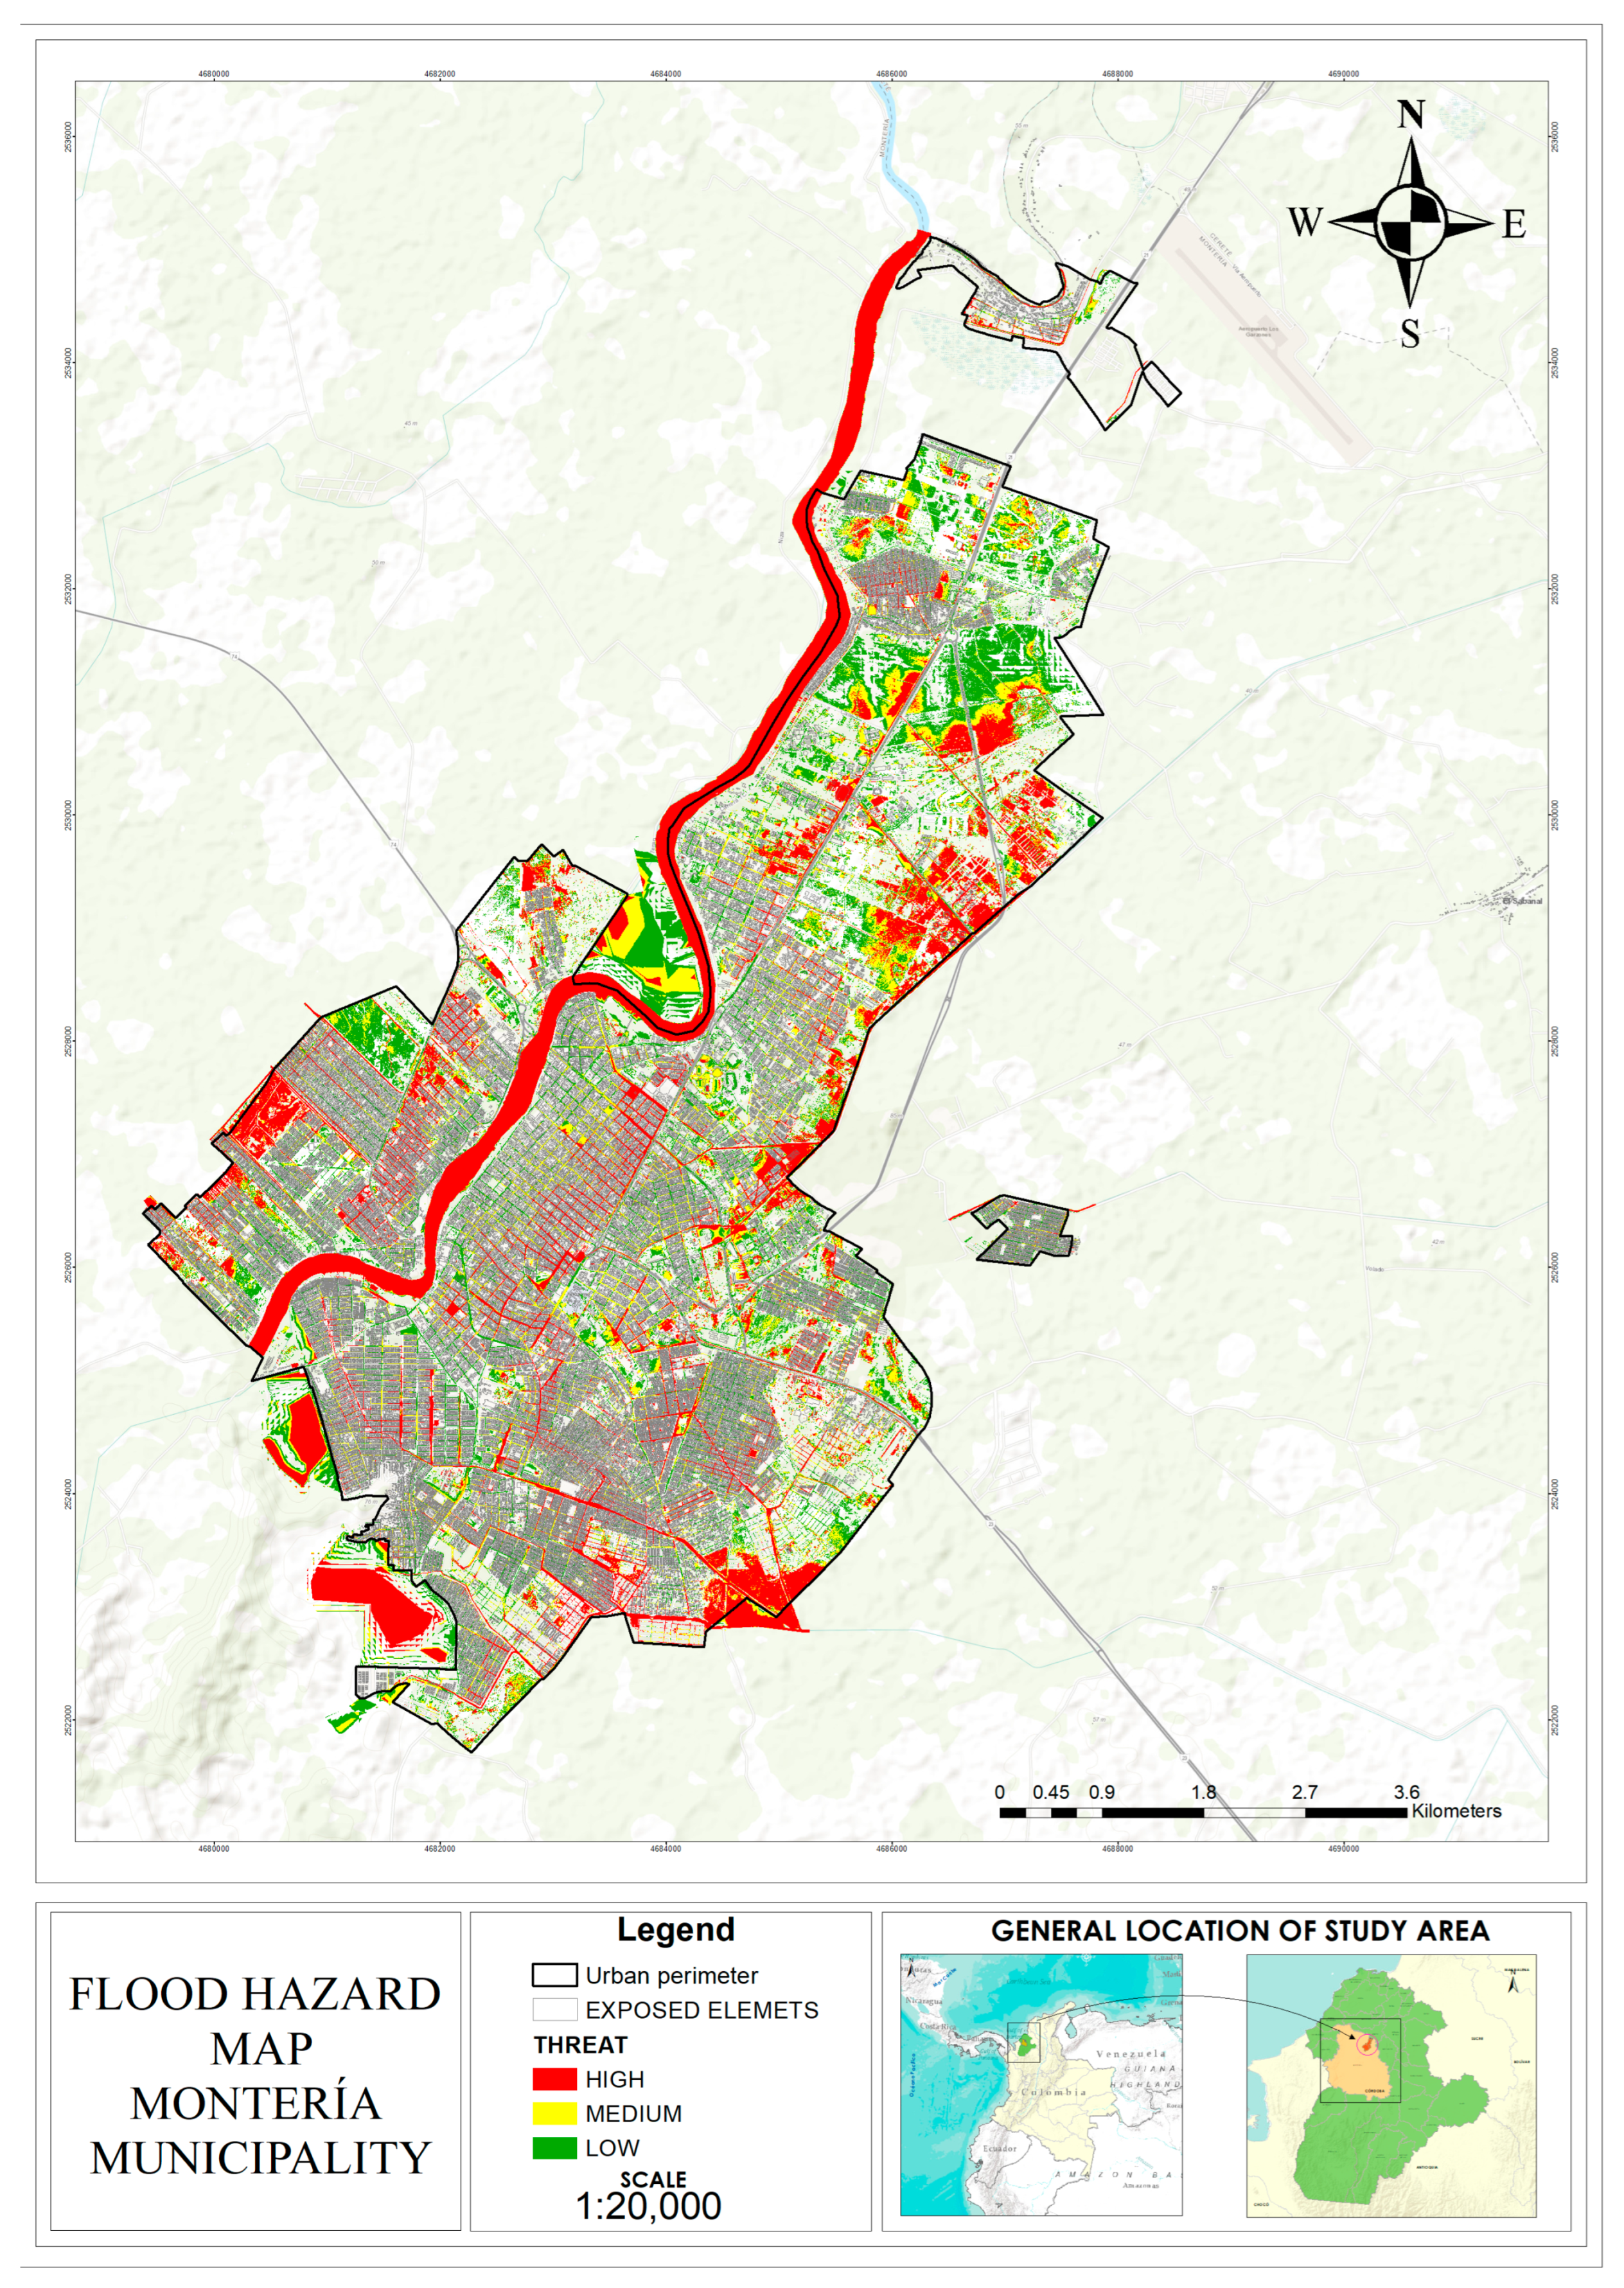
0 parameters consistent with the cement-block structural type. Risk was computed as the convolution of hazard and vulnerability over exposed elements, producing two risk maps—one considering only exposed buildings and another that additionally incorporates road infrastructure as an exposed asset. The economic expression of risk follows Salazar [
4] and Cardona [
34], computing the expected annual loss as the product of the unit damage function, the probability of exceedance of each return-period event, and the number of exposed elements per depth class, consistent with the methodological recommendations for economic flood damage assessment [
38] (
Figure 3).
3.6. Hydraulic Assumptions for Structural Measures
For the definition of structural measures associated with macro-drainage, an integral urban-drainage analysis was carried out for a design event with a 100-year return period, based on two main premises. First, all runoff water that previously ponded in some areas is now assumed to reach the channels—that is, the micro-drainage system is assumed to convey the entire rainfall excess to the macro-drainage—so that the resulting flood patches correspond only to inundations due to macro-drainage overflow. Second, the most critical projected urban-expansion scenario is considered to evaluate its effect under current drainage conditions and under scenarios with mitigation measures implemented, specifically in the Villa Cielo sector where the expansion affects the coverage of the sub-catchment draining to the main collector channel.
Discharge hydrographs extracted from the flood model were used as input to each macro-drainage channel. Since the total volume of the raw hydrographs
is smaller than the excess precipitation volume
because the rainfall-excess volume retained in ponded areas does not reach the channels—the hydrograph Q is multiplied by a correction factor
so that the corrected discharge
where V
0 is the total volume of the raw discharge hydrograph (m
3), computed as the summation of the product of discharge Q (m
3/s) and time step Δt (s) over all time steps; V
e is the total excess precipitation volume (m
3), computed as the summation of effective precipitation P
e (m) multiplied by time step Δt (s) and the contributing area; Fc is the dimensionless volume-conservation correction factor; and Q
c is the corrected discharge (m
3/s) applied to each macro-drainage channel for the structural-measure analysis generates a rainfall volume equal to the total rainfall excess. This volume-conservation correction is essential to prevent systematic underestimation of design discharges in the channel-capacity analysis.
Urban Expansion Scenarios (Villa Cielo)
For the Villa Cielo expansion area, a weighted Curve Number of CN = 75.12 was computed over the 5.27 km
2 polygon under current conditions, in which more than 90% of the surface is covered by forested and weedy pastures (
Table 5). Five prospective land-use scenarios were then defined, ranging from fully discontinuous urbanization (Scenario 1, CN = 77) to fully continuous urbanization (Scenario 5, CN = 89), including intermediate 25/75, 50/50, and 75/25 mixes. Each scenario was evaluated with the SCS method to estimate maximum discharges for several return periods (
Table 6). The resulting direct-runoff hydrographs were propagated through the main collector channel to evaluate how progressive urbanization modifies the hydraulic response of the expansion sector.
3.7. Sinu River Modeling
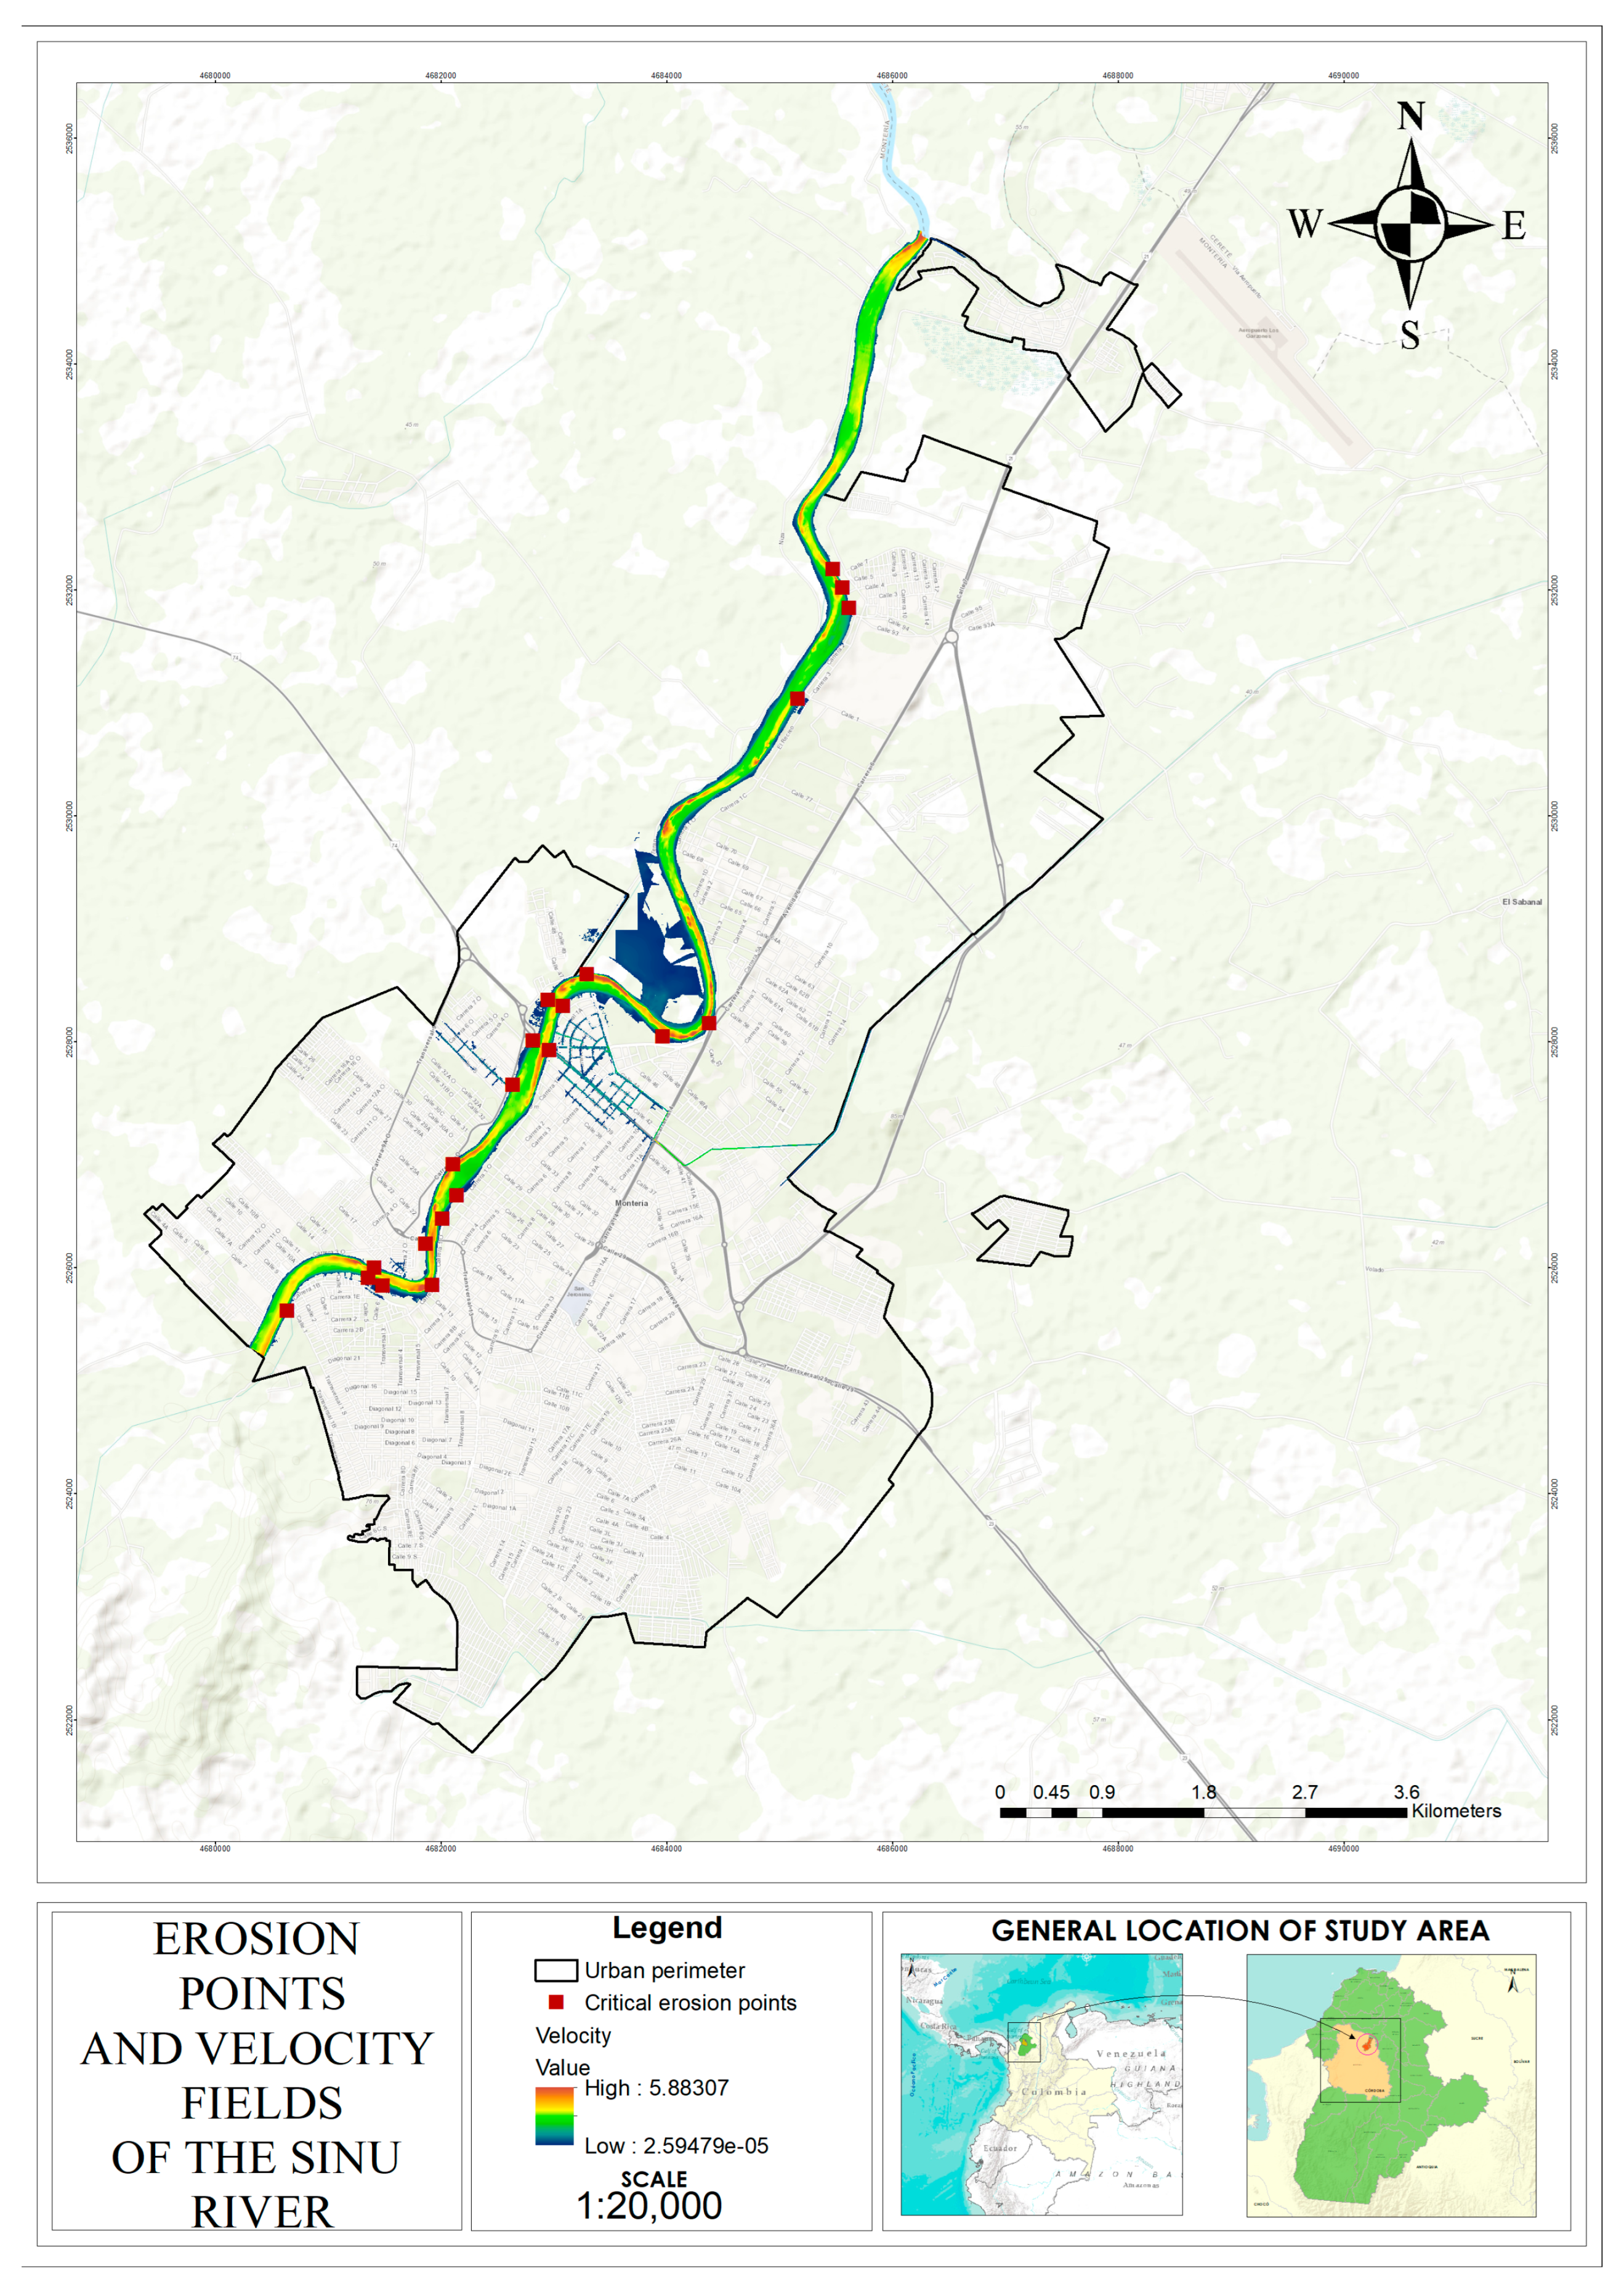
Along the urban reach, the Sinu River presents approximately 17 points of observed fluvial erosion (points of higher shear stress) according to observations by the Regional Environmental Authority (Corporación Autónoma Regional de los Valles del Sinú y del San Jorge, CVS) [
39] and to the hydraulic-modeling results of this consultancy. In these reaches, flow velocity and water force are directed toward the outer bank of the curve, generating intense pressure that undermines and erodes the riverbank material; the inner banks tend to experience lower shear stress and accumulate sediments. Hydraulic modeling shows that, for a 100-year return period, a discharge of 1021 m
3/s causes the Sinu to overflow into its floodplain, generating inundations in the sector and affecting approximately 289 identified properties.
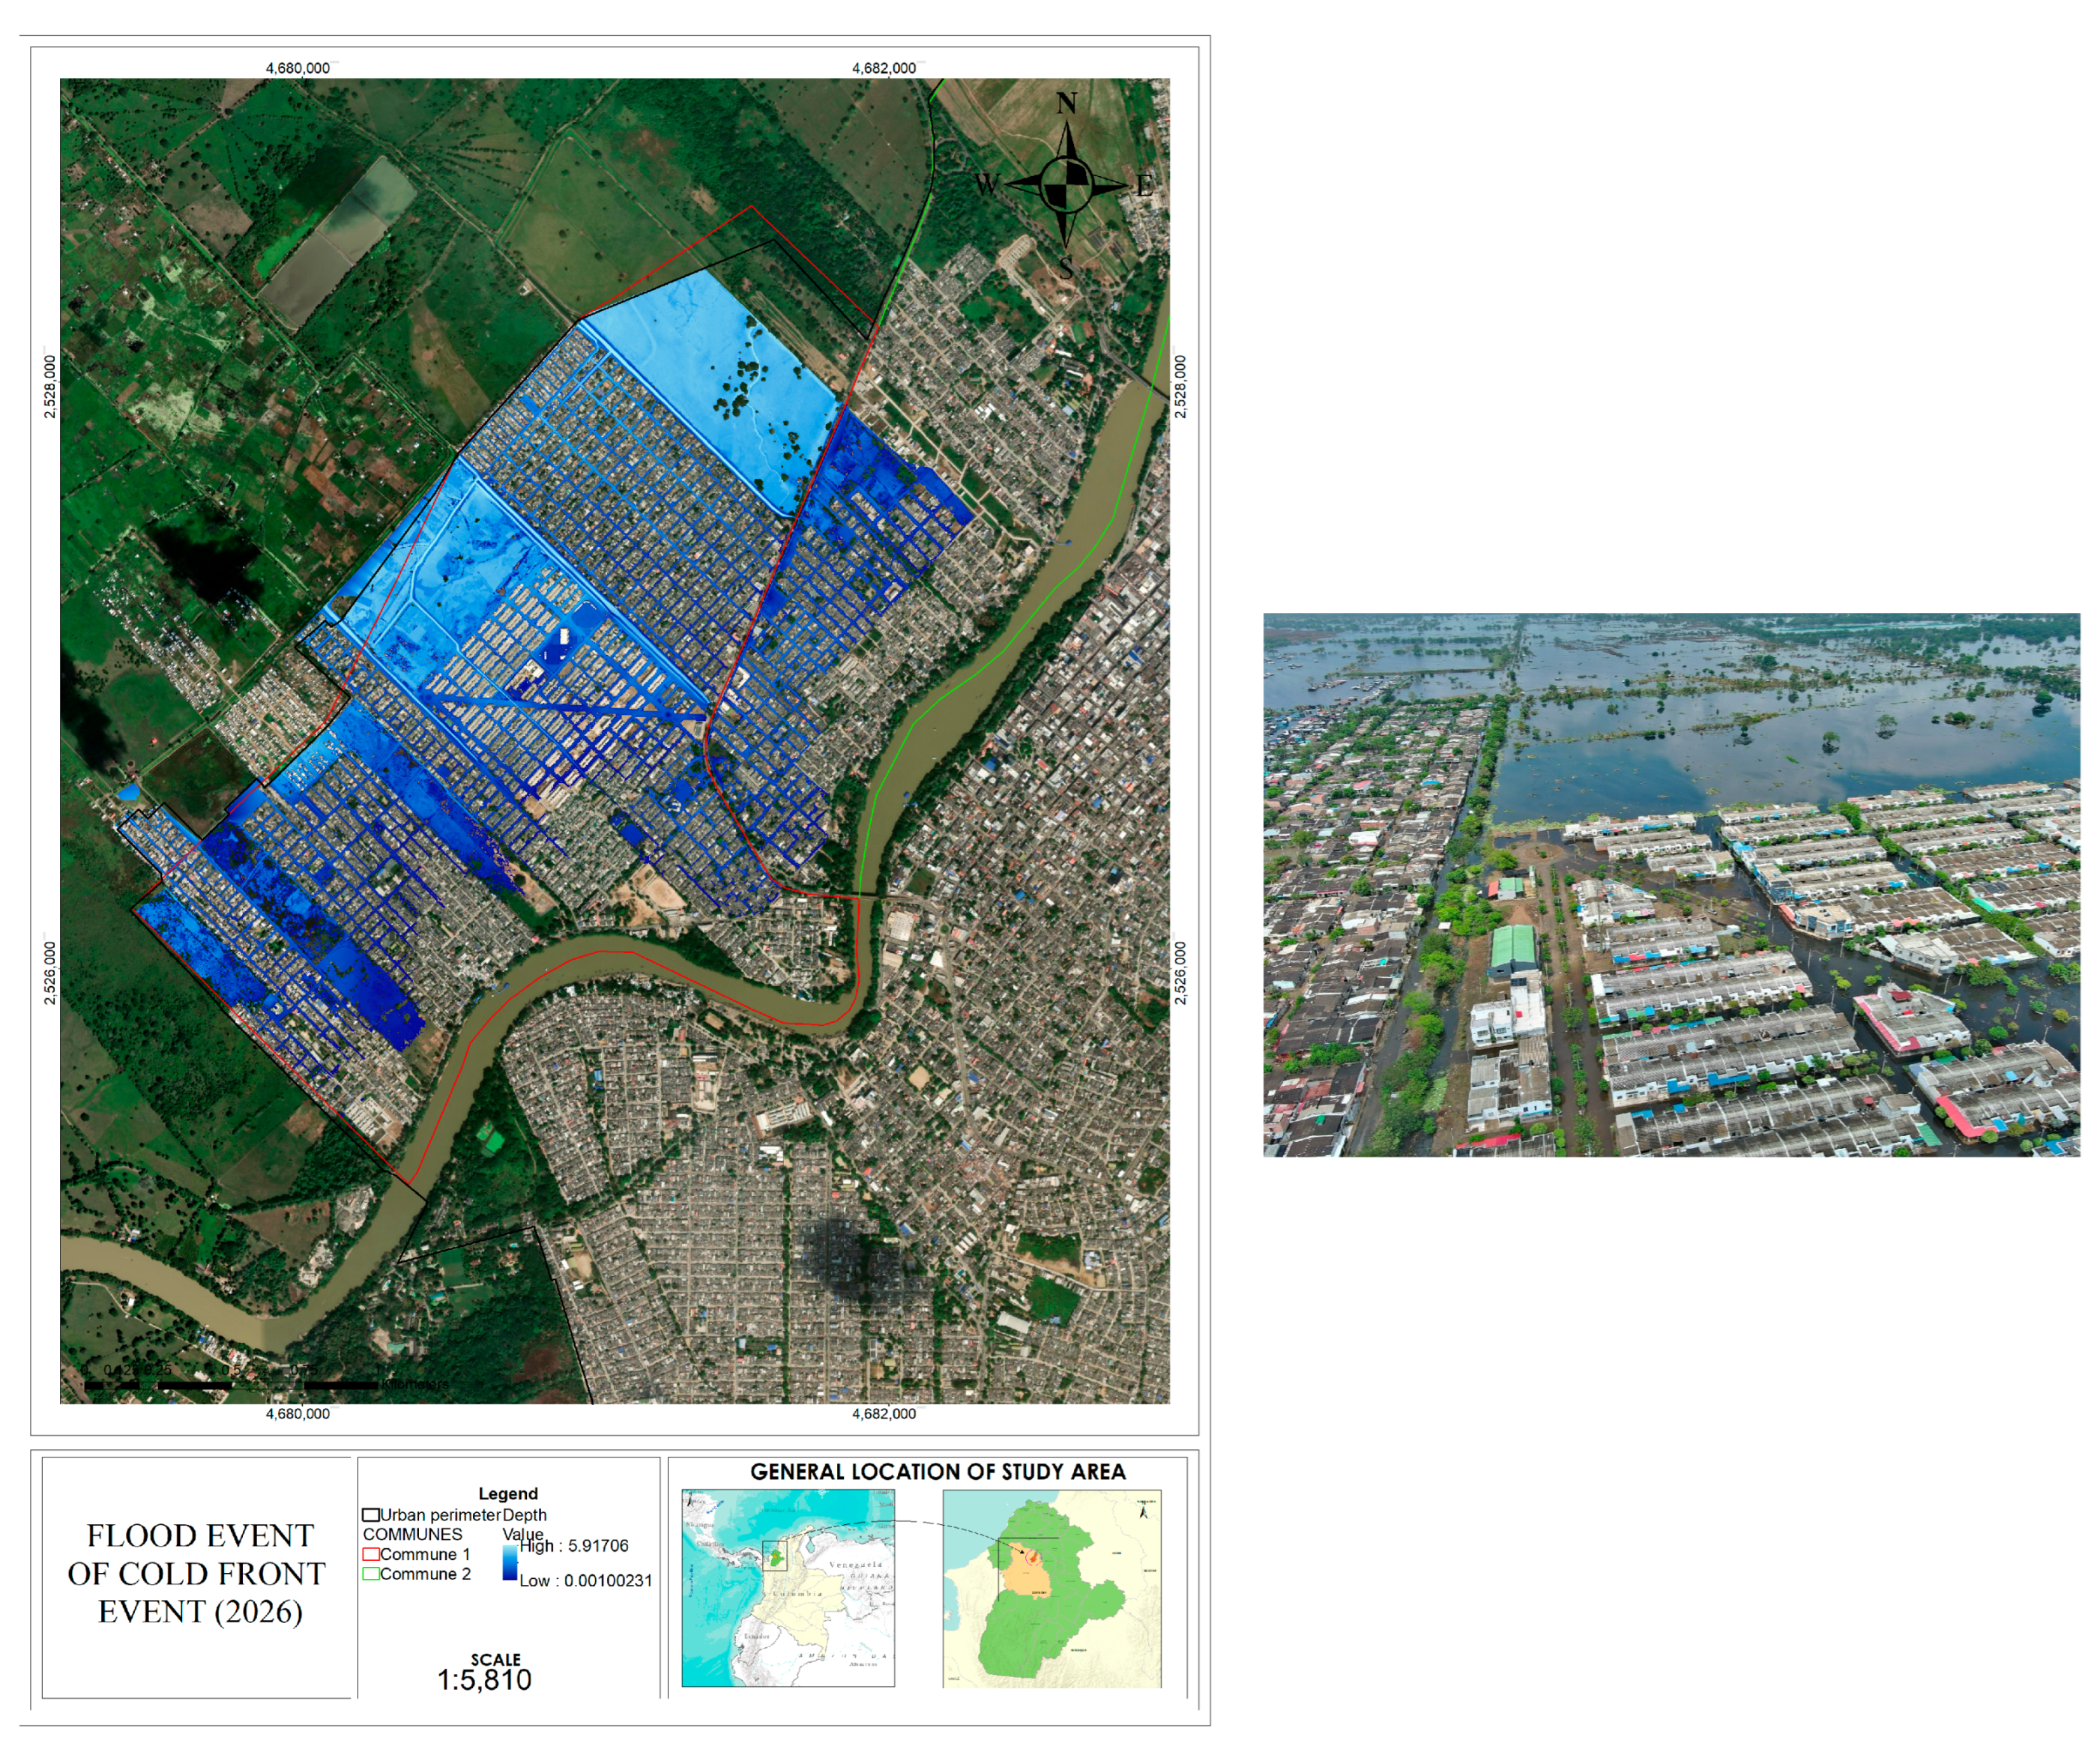
A dedicated cold-front-driven simulation was performed to reproduce the February 2026 emergency scenario on the left bank. Unlike the convective storms that dominate the wet season, cold-front forcing delivers sustained multi-day rainfall that saturates soils and progressively overwhelms the discharge capacity of the La Caimanera sub-catchment. This simulation provided the hydraulic context for the emergency response described in
Section 6 and informed the design basis for the 4300 m perimeter dike and the six pump-station sectors (
Figure 4).



 ,
,