1. Introduction
Water surface variation has become one of the most important environmental challenges globally [
1]. Water surface dynamic assessment and monitoring are important for terrestrial ecosystems and economic development, especially in water-limited arid areas [
2,
3]. Understanding alterations in land use, vegetation, and coastal dynamics is an important pursuit in national and local planning and engineering decisions [
4,
5,
6,
7]. This is the case with the Dead Sea, an endorheic lake of profound geographical and ecological significance. The Dead Sea lies within the Jordan Rift Valley and is a unique geological feature that stretches from the southeastern Anatolian Plateau to the northern Red Sea [
8,
9,
10,
11,
12,
13]. This ancient body of water, formed by the separation of the Asian and African continents during the Miocene era, occupied the lowest point on continental land [
14].
The Dead Sea was characterized by two distinct basins, the shallow southern basin and the deep northern basin, until a turning point in 1976, when the southern basin was desiccated due to a decrease in sea level, reaching a depth of −400 m [
3]. Moreover, until 1953, the water level of the Dead Sea oscillated around a historical high of approximately 392 m below sea level, encompassing an area of 1050 square kilometers [
15,
16,
17,
18,
19,
20]. There are indications that the Dead Sea is experiencing changes, including shrinkage. For example, some studies indicate that the Dead Sea level is declining by approximately 0.7–1 m per year, resulting in a considerable decrease in surface area and volume [
21]. The surface area derived from multi-temporal satellite observations has decreased from about 934 km
2 in 1973 to approximately 640 km
2 by 2004. An example of these studies is that satellite images are valuable in monitoring long-term environmental changes [
22]. Studies such as Al-Khlaifat [
21] and Closson & Djamil [
23] have used remote sensing and Geographic Information Systems (GIS). The study integrated multi-temporal satellite data, such as Landsat and Sentinel imagery, with Interferometric Synthetic Aperture Radar (InSAR) techniques, Digital Elevation Models (DEM), and Light Detection and Ranging (LiDAR) data to analyze spatial and temporal changes with high precision. Generally, Landsat data are used to support continuous monitoring of temporal changes in surface area and water levels. In these studies, images are commonly preprocessed with geometric and radiometric correction methods before extracting water-body boundaries. Next, different methods of spatial analysis (e.g., overlay analysis) could be used to measure land-use changes experienced in each period. In that context, several researchers have integrated field measurements, e.g., GPS-based water-level observations, with satellite-derived results to calibrate long-term monitoring data.
At the same time, advanced image processing technology, combined with mathematical modeling, has also been used to improve the understanding of its dynamics. Image processing techniques (edge detection, thresholding, segmentation, and color-based extraction) are employed to determine the water surface border from satellite imagery and to calculate it. Most of these methods involve converting images to grayscale or binary form to segment the region of interest and calculate the area from pixel measurements. Nevertheless, these approaches may be vulnerable to noise and image degradation. In addition to these, a variety of hydrological and mathematical models that use water or energy balance equations have been developed to estimate changes in water levels based on inflow volume, evaporation rates, and other geographic factors. Though these models reflect coherent physical understanding, they often rely on simplifying assumptions and poorly represent spatial details.
Recent evidence confirms that the Dead Sea is undergoing significant environmental changes, particularly a continuous rate of shrinkage. Several studies have reported declines in water levels at rates of approximately 0.7 to 1.5 m per year, resulting in substantial reductions in surface area and volume [
13,
19,
24,
25,
26,
27]. Nevertheless, previous research has documented varying, sometimes inconsistent, results regarding the magnitude, rate, and spatial patterns of these changes. These discrepancies are primarily attributed to differences in data sources, analytical methodologies, and temporal coverage, as illustrated by studies by Al-Khlaifat [
21] and Closson and Djamil [
23]. In addition, long-term observations indicate that the Dead Sea level has decreased by approximately 39 m over the past few decades [
13,
26]. Given these variations and uncertainties in reported findings, the use of remotely sensed data has become increasingly important for providing consistent, accurate, and long-term monitoring of the Dead Sea’s spatial extent and dynamics. The reliability of surface area estimation is crucial for a better understanding of the long-term trends affecting the Dead Sea. Over recent decades, we have gained unprecedented insights into Earth’s surface through satellite imagery, revealing the complex physical and biological phenomena that shape the global environment [
22,
28]. In the current era of continuous monitoring, satellite data represents a highly valuable resource, providing a continuous stream of information about the Earth’s surface [
29,
30,
31,
32,
33,
34]. This invaluable resource enables us to identify the mechanisms shaping life conditions on our planet, encompassing diverse phenomena, such as global weather patterns, tectonic activities, surface vegetation dynamics, ocean currents, polar ice fluctuations, and pollution patterns [
35,
36,
37]. With an extensive database of remote sensing imagery spanning historical and contemporary periods, we can determine the spatiotemporal patterns of environmental elements and the profound impacts of human activities over past decades, enabling the quantification of critical parameters, such as water levels, surface area, and rates of decline [
38,
39,
40,
41].
The primary goal of this research is to conduct a comprehensive examination and continuous monitoring of the intricate variations in the Dead Sea’s water levels. Specifically, this study sought to provide a comprehensive assessment of the recent Dead Sea surface area and water level and to apply advanced modeling techniques to generate predictive simulations of the Dead Sea’s surface area over the coming years, providing a historical view, current situation, and predictive projections. This is important because countries bordering the Dead Sea face socio-economic implications from this ecological transformation; therefore, it is necessary to identify and explain the mechanisms driving this transformation, identify hotspots changing, and provide a futuristic view of trends in the Dead Sea’s extent. Based on the results, stakeholders and decision-makers receive actionable insights to address the challenges posed by this environmental transformation.
The principal original contributions of the present study that distinguishes it from previous research are as follows: (1) the longest continuous remote sensing-based record of the Dead Sea surface area, covering 51 years from 1971 to 2022; (2) application of the CA-Markov model for creating spatially explicit projections of geographic extent up to 2034 and 2050 in semi-automated execution (the first study to estimate progression based on such environmental indices); (3) integration of observed and projected climate data under two future emissions scenarios of Representative Concentration Pathway (RCP) 4.5 and 8.5 to put the fate of a declining Dead Sea into a regional climate change context; (4) quantification of correlations between surface area, water level and temperature using robust non-parametric statistical methods, whereby two factors were identified as driving forces towards geo-spatial changes, alongside empirical field evidence describing landscape scale geomorphological retreat through orthophoto-graphic documentation complemented by cross-sectional profiling linking quantitative metrics with visible manifestations on the ground-scale. Collectively, these form a system that further enriches the understanding of Dead Sea development trends and translates this information into spatial products for practical use by decision-makers and other end-users in the riparian states.
2. Methodology
2.1. Study Area
The Dead Sea is the Earth’s lowest point on the surface, at an elevation of approximately 434 m below mean sea level (bmsl). It is renowned as the saltiest lake, with a salinity of approximately 365 g per liter (gpl) [
13,
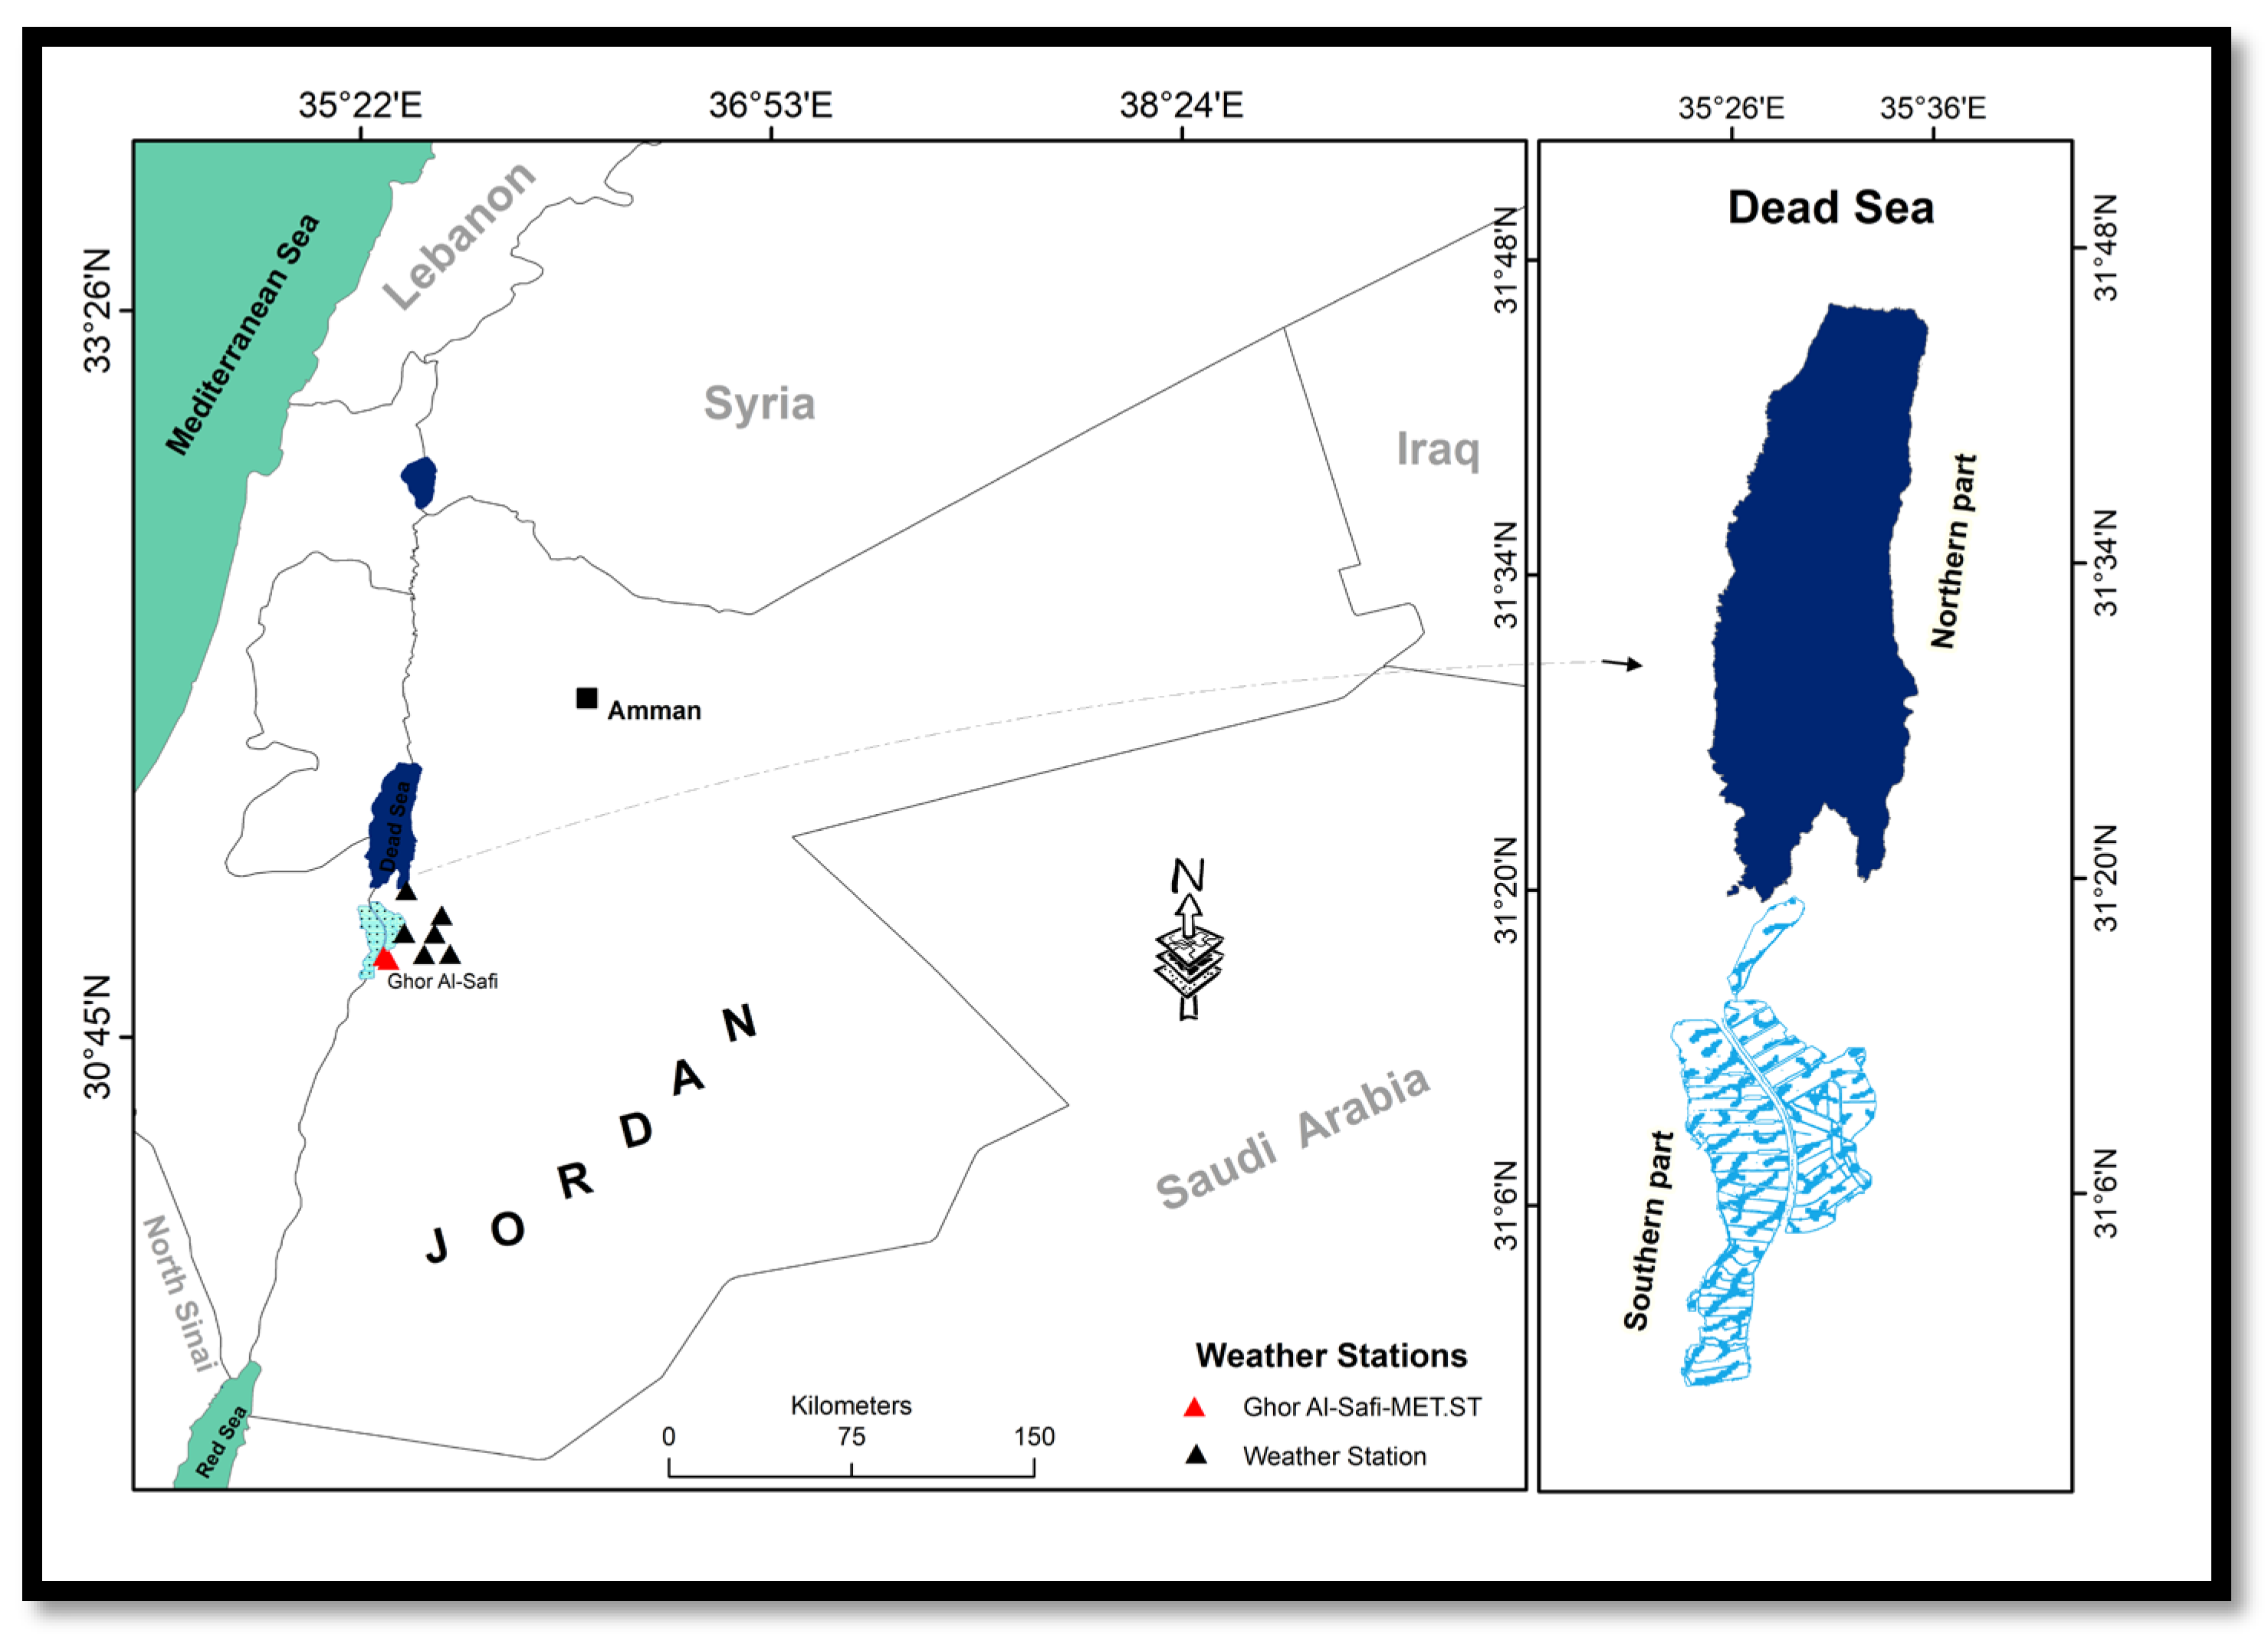
42]. Geographically, the sea is at 31°20′ N, 35°30′ E, as shown in
Figure 1. The eastern and western shores of the Dead Sea are bordered by large fault escarpments, which are integral parts of the African-Syrian rift system. The valley slopes gently upward to the north along the Jordan River and southward along the Wadi Araba River [
43]. Significantly, its shores are the lowest terrestrial shores on Earth [
44].
Consequently, it is the world’s deepest hypersaline lake [
3,
19,
25]. The primary northern basin of the Dead Sea spans 50 km in length and a width of 15 km at its widest point [
17,
27]. This region is characterized as arid, with average rainfall ranging from 50 to 100 mm (mm) [
19]. In terms of freshwater inflow, the Jordan River contributes approximately 60%, while groundwater accounts for approximately 25% [
13]. Moreover, it is crucial to note that the Dead Sea has been consistently shrinking, with a retreat rate of up to 1 m per year [
20]. Additionally, the water surface level of the Dead Sea has declined continuously over the last three decades, exceeding 1 m [
43,
45].
2.2. Data Collection and Image Processing
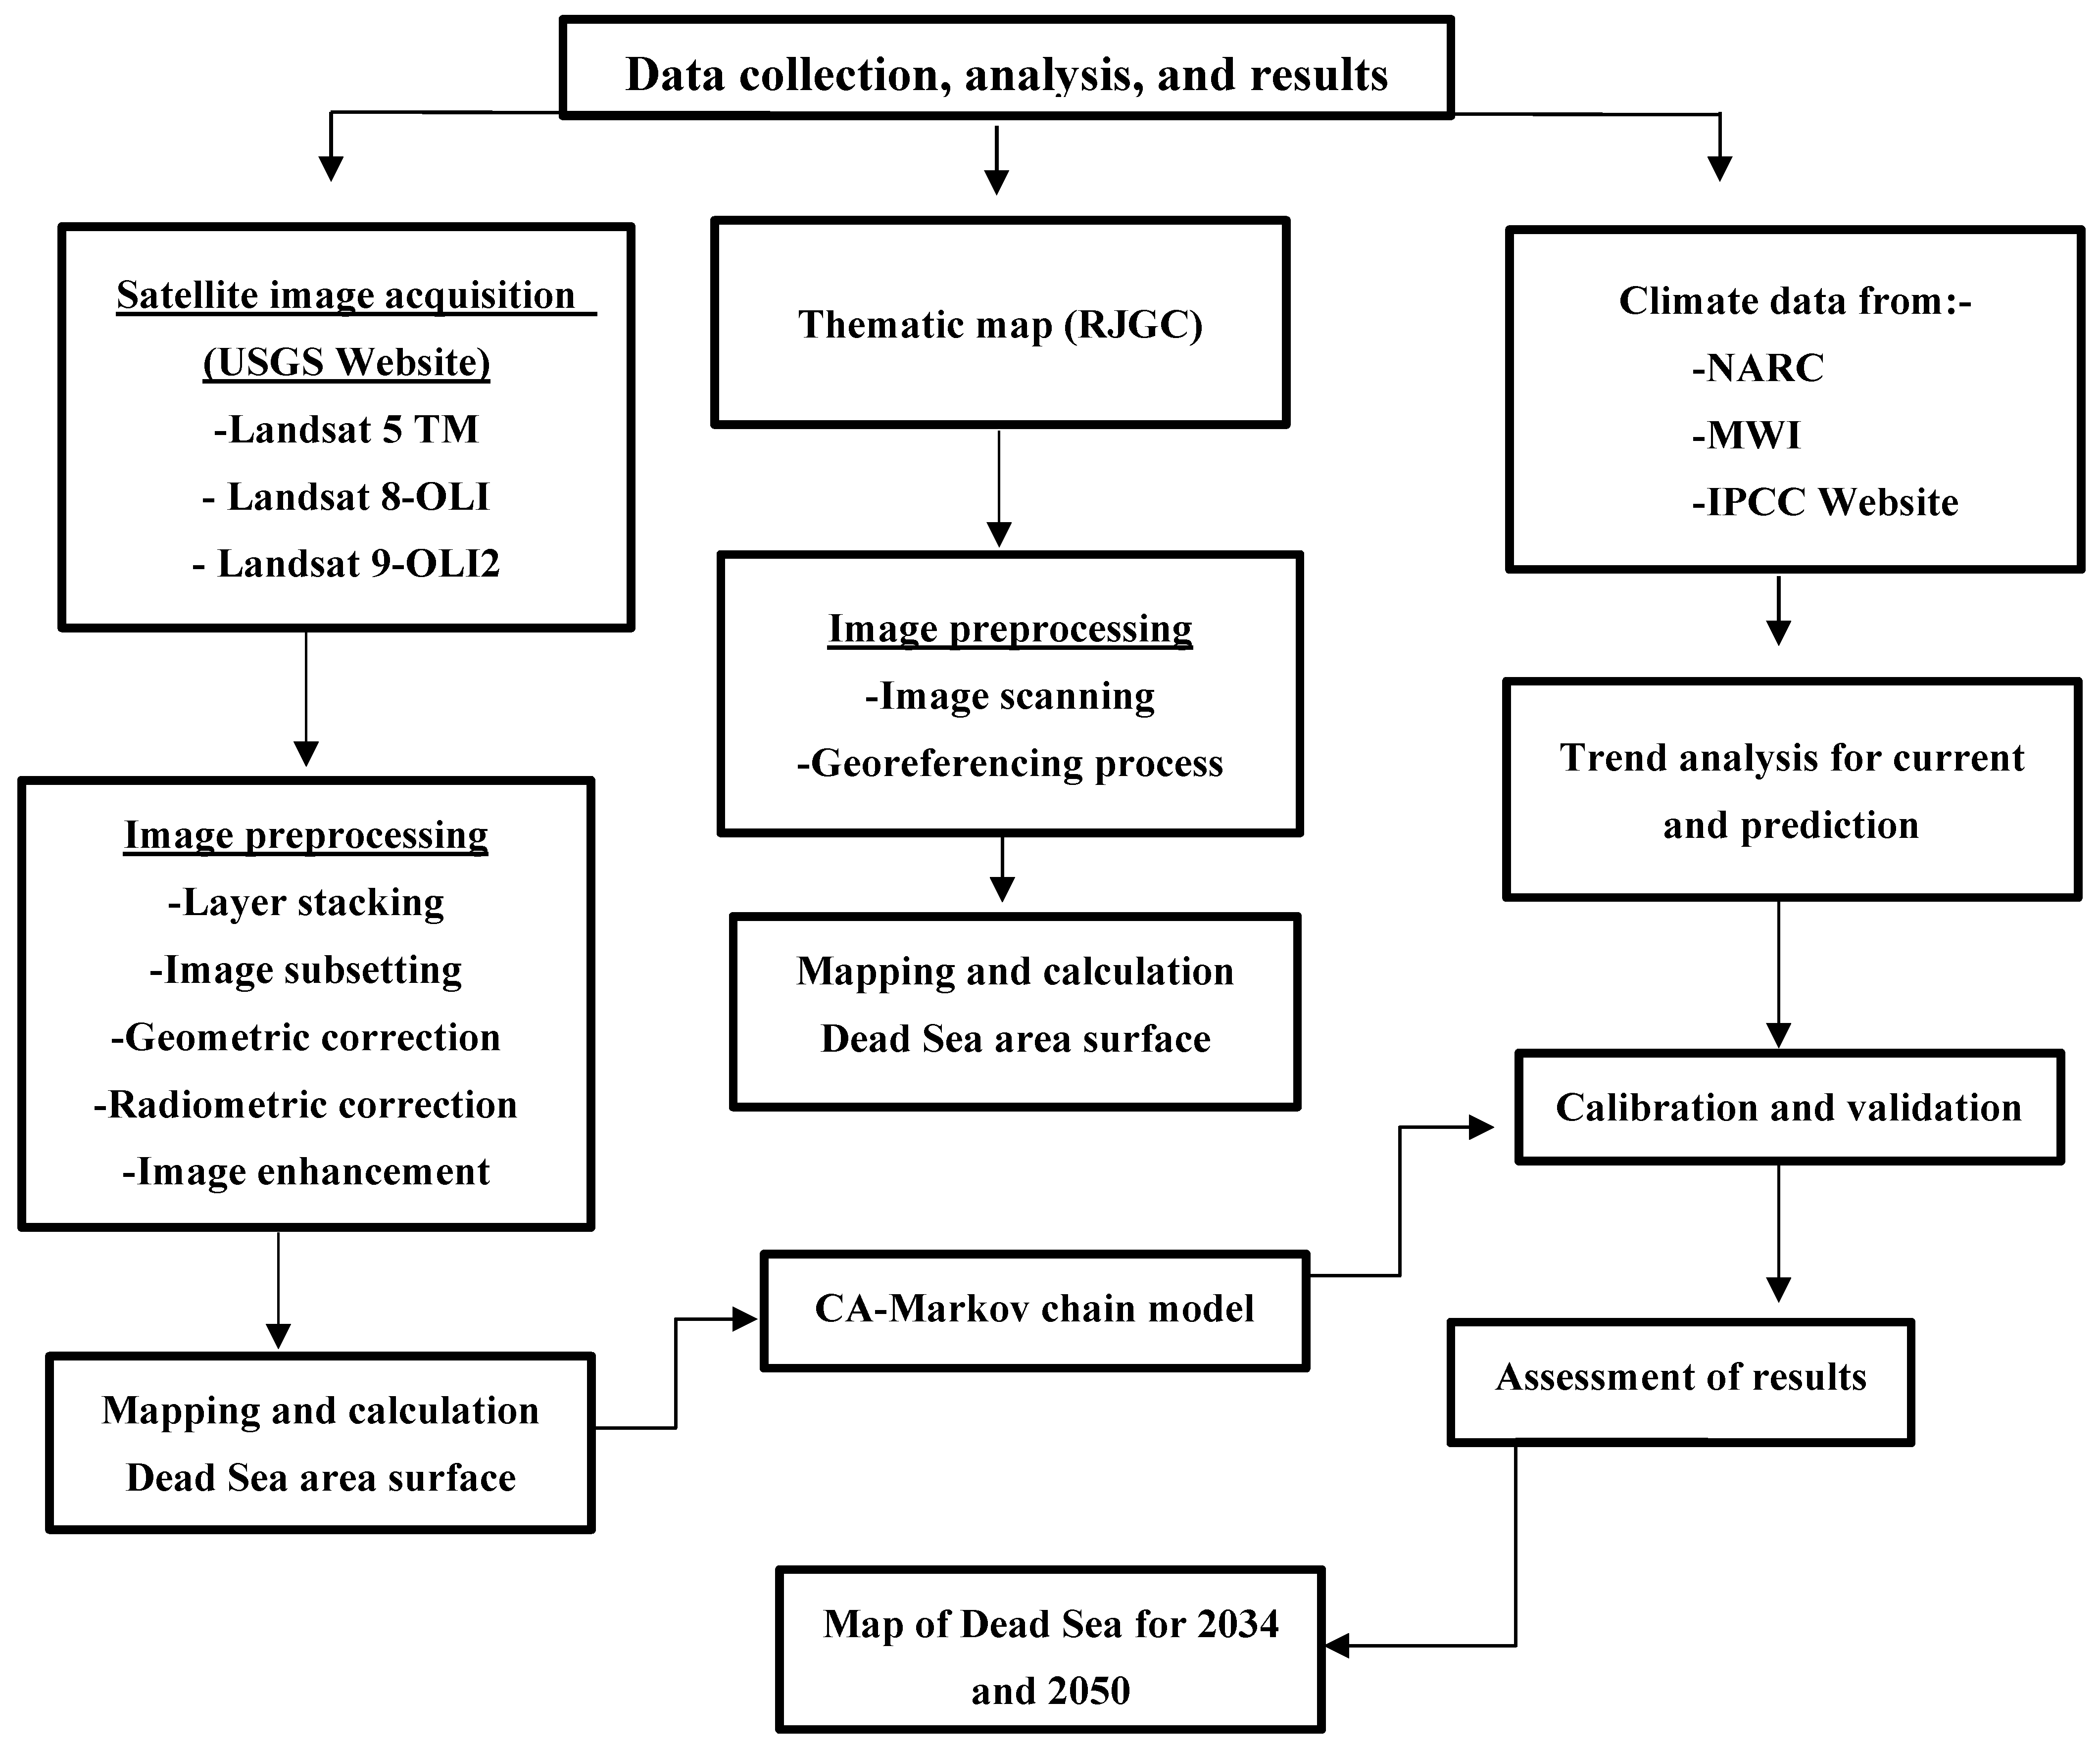
This research involved three distinct phases: data collection, image processing, and accuracy assessment, as shown in
Figure 2. For this study, thematic maps and satellite images from Landsat 5TM, Landsat 8 OLI, and Landsat 9 OLI2 were obtained and downloaded from the Royal Jordanian Geographic Center (RJGC) and the United States Geological Survey (USGS) official website, accessible via the link (
https://glovis.usgs.gov/app, accessed on 10 February 2023). Concurrently, weather data sources included data obtained from the Ministry of Water and Irrigation (MWI), the National Center of Atmospheric Research (NCAR) official website, and the IPCC website. The schematic diagram below outlines the principal steps of data collection and assessment (
Figure 2).
A hard copy of the thematic map, scaled at 1:250,000 for the year 1971, was procured from RJGC. Subsequently, the map underwent scanning, and geometric correction was performed using the intersecting lines within the map’s coordinate system. Simultaneously, satellite imagery from Landsat 5 TM, Landsat 8 OLI, and Landsat 9 OLI2 were acquired from the USGS website during the data processing phase. These images were combined and clipped to match the study area’s boundaries. The TM and OLI images comprised multiple bands, each characterized by distinct wavelengths, as detailed in
Table 1.
2.3. Change Detection Analysis
Remote sensing data were retrieved from the United States Geological Survey (USGS), comprising Landsat 5, 8, and 9. Subsequently, band matching was performed to obtain the true-color composition based on the band arrangement of each sensor (
Table 1). The present study investigated surface area changes using multi-temporal satellite imagery to assess alterations in surface area over a specific period (1984–2022) surrounding the Dead Sea. Satellite images from Landsat 5 TM, Landsat 8 OLI, and Landsat 9 OLI–2 were downloaded from the USGS database. Images taken during a full-time period were selected to minimize seasonality.
All satellite images were preprocessed through a series of steps, including band matching, geometric correction, cropping, and spatial alignment (image registration) to achieve spatial consistency across the years in which the images were captured. Using ArcGIS Pro 3.0, data were projected to a common coordinate reference system and spatially cropped across the study area.
Using satellite-derived spectral properties of the Dead Sea water surface, the sea surface was delineated using the manually drawn method “Digitizing”. After extracting the water-surface boundaries from each satellite image, the vector layers of the sea surface were used to calculate the Dead Sea surface area for each study year. In addition, a temporal analysis was performed on these extracted areas, allowing for a calculation of retreat rates and the magnitude of change in water surface area over the period studied.
For this purpose, spatial analysis tools in ArcGIS software were used to assess spatial and temporal differences among the surface area boundaries. We performed overlay analysis across different land-use categories and time periods using the Combine and Intersect tools. The Tabulate Area was also used to compute the area for each category and create change matrices showing how much land changed from one category to another in the study period.
Finally, the magnitude of change was determined as the numerical difference in area for each category across years, along with its corresponding percentage change, to evaluate rates of spatial and temporal transformation. The results from the maps and statistical tables were used to analyze the relationship between changes in the surface area of the Dead Sea and within it and future trends (2034–2050), as predicted by the Markov matrix.
Using the processed images, change detection was performed on the produced images from 1984, 1994, 2004, 2014, and 2022. Subsequently, the manually drawn maps served a dual purpose: validating the model and generating the anticipated maps for the years 2034 and 2050. Furthermore, we converted the digital maps to raster format using ArcMap 10.8.1. The change detection analysis involved estimating surface area and water level. In accordance with [
46], the approach for calculating and estimating the watershed’s volume involved conceptualizing it as a basin. This volume can be determined by establishing a plane along its rim and its curved inner surface. To achieve this, a capping surface was constructed by connecting a set of points along the divide, while the inner surface was represented by the modern topography derived from the digital elevation model (DEM). Essentially, the volume calculation depends on the disparity between the cap elevation and the topography.
2.4. Climate Data
The Dead Sea lacks an outlet due to rapid evaporation, which is particularly evident in the hot desert climate and is therefore prone to climate-mediated evaporation. In the context of this study, average temperature data spanning 1975 to 2021 were sourced from the Ministry of Water and Irrigation and the National Agricultural Research Center (NARC). Simultaneously, climate projections covering the period from 2022 to 2050 were retrieved from the IPCC website, using the Global Spectral Model (GSM), with its organization presented in a microscale format. To analyze average temperature, we employed both the Mann‐Kendall rank trend test and linear regression, comparing the observed data with future scenarios under RCP 4.5 and RCP 8.5.
2.5. CA-Markov Model
The Markov model provides a theoretical framework and integrates stochastic processes centered on transition probability matrices, facilitating prediction and optimal control [
47,
48,
49]. Within this context, the digital map of the study area is an illustrative tool for visualizing recent changes in spatial data over time. Moreover, the Markov model governs spatial dynamics via transition probabilities. Where the probability of transition from state i to state j is:
In the Markov chain process, Pij represents the probability of transition from class i to class j, where nij is the number of cells that changed from class i to class j during the observation period, and Σj nij is considered the total number of cells originally belonging to class i.
In mathematical terms, the transition probability
is the probability that a cell is currently in class
will be in class
at the next time step.
where X
t is the state of land-use class at time (t), and X
t+1 is considered the state at the next time. The stochastic matrix (P) in the transition probability matrix can be formulated based on stochastic processes [
50,
51].
Each row in this matrix (P) represents the transition probabilities from a given state to all possible states . Where (n) is the number of possible states, and the sum of probabilities in each row is equal to 1 according to the equation . The CA-Markov model determines how much change should occur in the land-use class (through transition probabilities), while the Cellular Automata (CA) component determines where the changes occur spatially using neighborhood rules and suitability maps. Thus, the CA-Markov prediction can be conceptually written as , where Lt represents the land-use map at a specific time t, P is the transition probability matrix, N represents the neighborhood effects, S is the suitability factor, and f is a CA allocation function. This combination allows CA-Markov models to predict both the quantity and spatial distribution of future land-use changes. Thus, CA-Markov can project both the extent and the location of land-use change. The CA-Markov model was initially implemented on the full land-use maps for this investigation, followed by a masking step post-processing to specify the Dead Sea water body. First, the binary mask was used to exclude all non-water classes; therefore, the base runoff number from now on reflects only the area extent of the water surface.
2.6. CA-Model Validation
Model validation and assessment are essential steps in evaluating the reliability of predictive models, particularly when comparing simulated outputs with observed data. In this study, Kappa statistics were used to assess the performance of the CA-Markov model in simulating and predicting changes in the Dead Sea surface area [
52]. Specifically, three Kappa indices were applied: Kno, Klocation, and Kquantity. These indices measure the level of agreement between observed and simulated maps, where Kno evaluates overall model accuracy, Klocation assesses the accuracy of spatial allocation, and Kquantity measures the agreement in predicted quantities [
53]. The use of these indices enables robust model validation by ensuring it accurately reproduces historical changes before being used for future projections. As shown in
Table 2, higher Kappa values (closer to 1) indicate strong agreement and high model reliability, while lower values indicate reduced accuracy [
54,
55].
According to Omar et al. [
56], the kappa statistic method was adopted and calculated via Equations (4)–(6).
In this context, P(x) denotes the level of information at the medium grid cell, while N(f) indicates the absence of information. High consistency is denoted by (T(i)), and H(x) represents the information at the medium layer level. Furthermore, the ideal grid cell-level information, considering heterogeneity or minimal consistency in layer-level information, is represented by the K(x) mean.
3. Results and Discussion
3.1. Changes in the Surface Area
Since the late 1970s, the Dead Sea has been divided into two distinct basins: the northern basin, considered the Dead Sea itself, and the southern basin, which now consists of evaporation pools used by the Israeli and Jordanian mineral industries [
13,
57,
58,
59,
60]. Construction of these evaporation pools commenced in the late 1960s on both sides of the border. Subsequently, these facilities actively extract water from the northern basin to facilitate mineral extraction via evaporation [
43,
45,
61]. This industrial operation is a significant contributor to the negative water balance in the northern basin, as research indicates a deficit of 250 to 330 million cubic meters per year [
62]. Consequently, since this period, it has become preferable to distinguish between the two segments, with particular focus on the northern region, given the transformation of the southern part into artificial basins [
43,
63].
The regression analysis was conducted using only the values derived in this study, while values from previous studies (shown in red) were included for comparison, as shown in
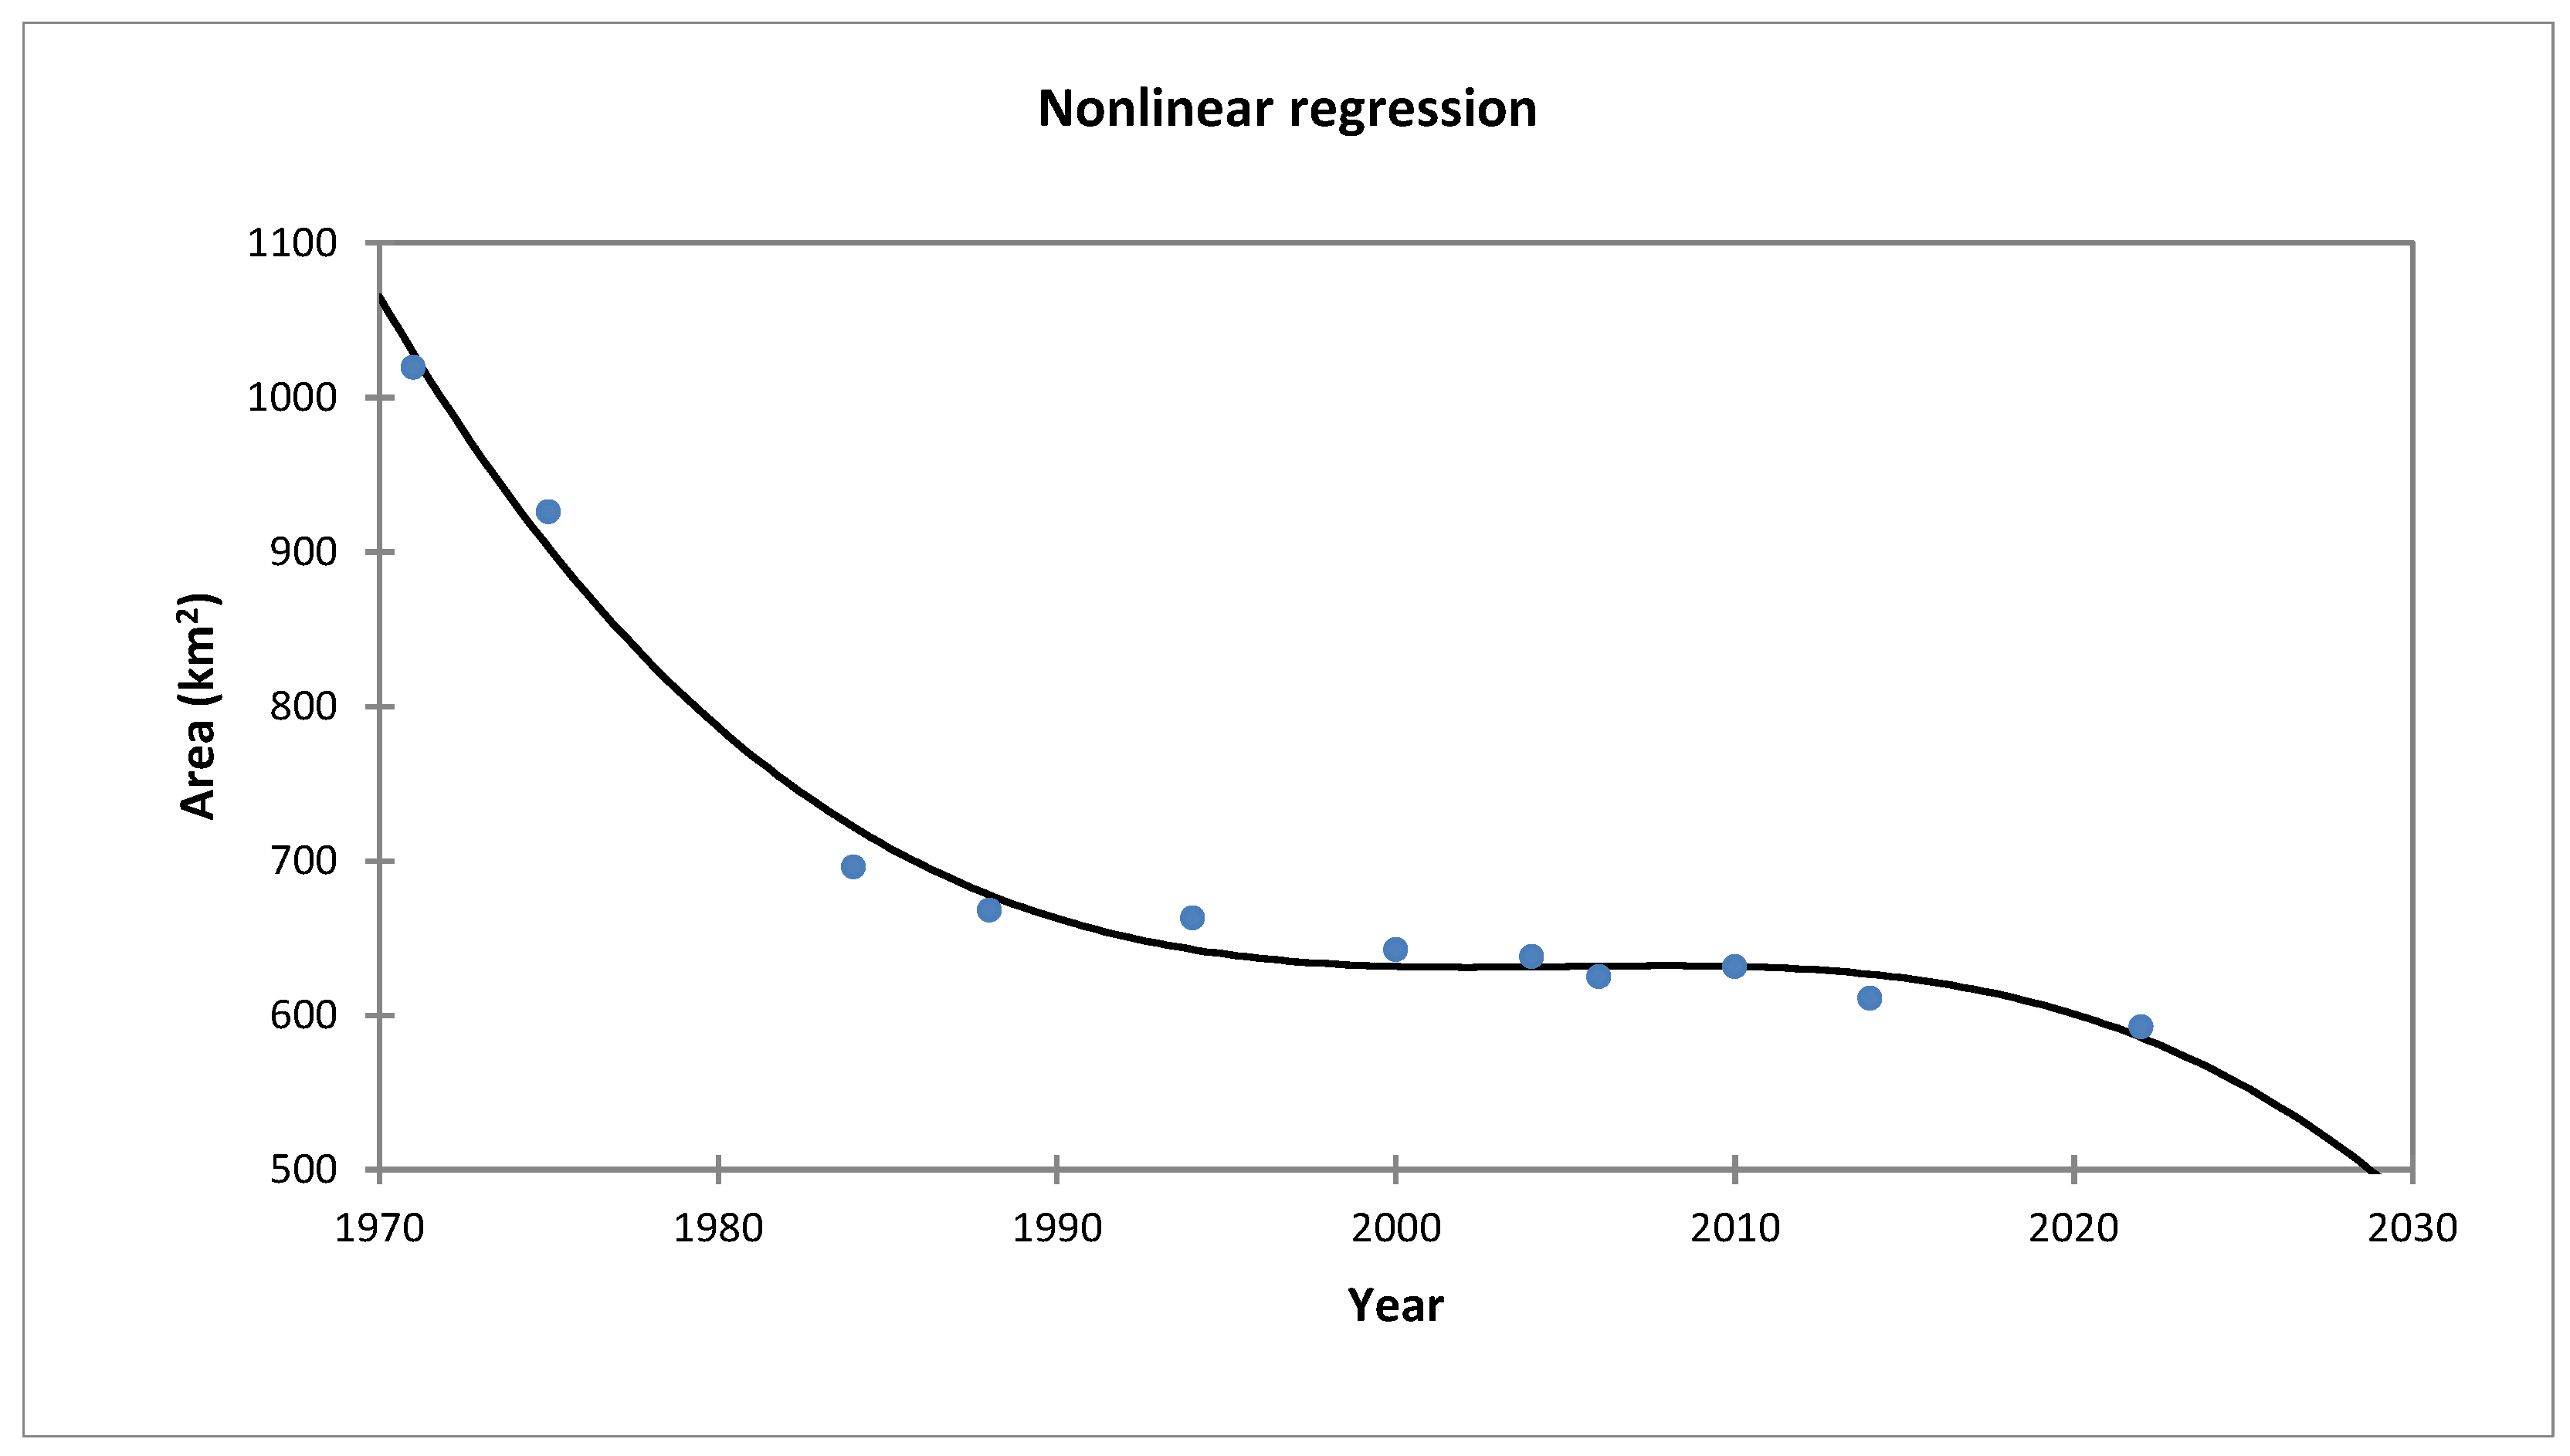
Table 3, which presents the exact numerical values used in the regression analysis. The values derived from the 1971 topographic map and satellite imagery during the study period indicate a shrinkage of the Dead Sea area from 1971 to 2022. Data from previous studies, shown in red, also confirm this shrinkage. The nature and pattern of this shrinkage appear nonlinear and cannot be determined solely from the table. Therefore, the relationship indicates that the overall trend was consistent and decreased over time, as shown in
Figure 3. Specifically, it is evident that the area of the northern region decreased by approximately 14.2% from 1984 to 2022. Importantly, this reduction trend was nonlinear, with an associated R
2 value of 0.98.
The regression analysis was conducted using only the values derived in this study, while values from previous studies (shown in red) were included for comparison purposes only.
The primary driver of this decline is the construction of dams at the outlets of reefs and valleys on both sides, which historically replenished the Dead Sea, and this is exacerbated by the region’s limited water resources [
43,
63]. Over the past three decades, decision-makers in the water sector have implemented significant measures to bolster Jordan’s water security and address the persistent water deficit. Furthermore, Jordan has been dealing with the Syrian refugee crisis, which has further strained its water resources [
42]. Some previous studies showed a slight increase in the Dead Sea’s area in 1992 and 2010, driven by rainfall exceeding the average in 1992. Additionally, in 2010, the amount used in the industry and the amount of inflow released from the Jordan River were greater [
24,
27].
In pursuit of a well-structured vision for the future, Jordan has adopted a National Water Strategy, a comprehensive framework guided by a dual-pronged approach encompassing water demand management and water supply management [
64]. This strategy emphasizes the imperative of enhanced water resource management, with a strong focus on ensuring the sustainability of current and future water-use practices. As shown in
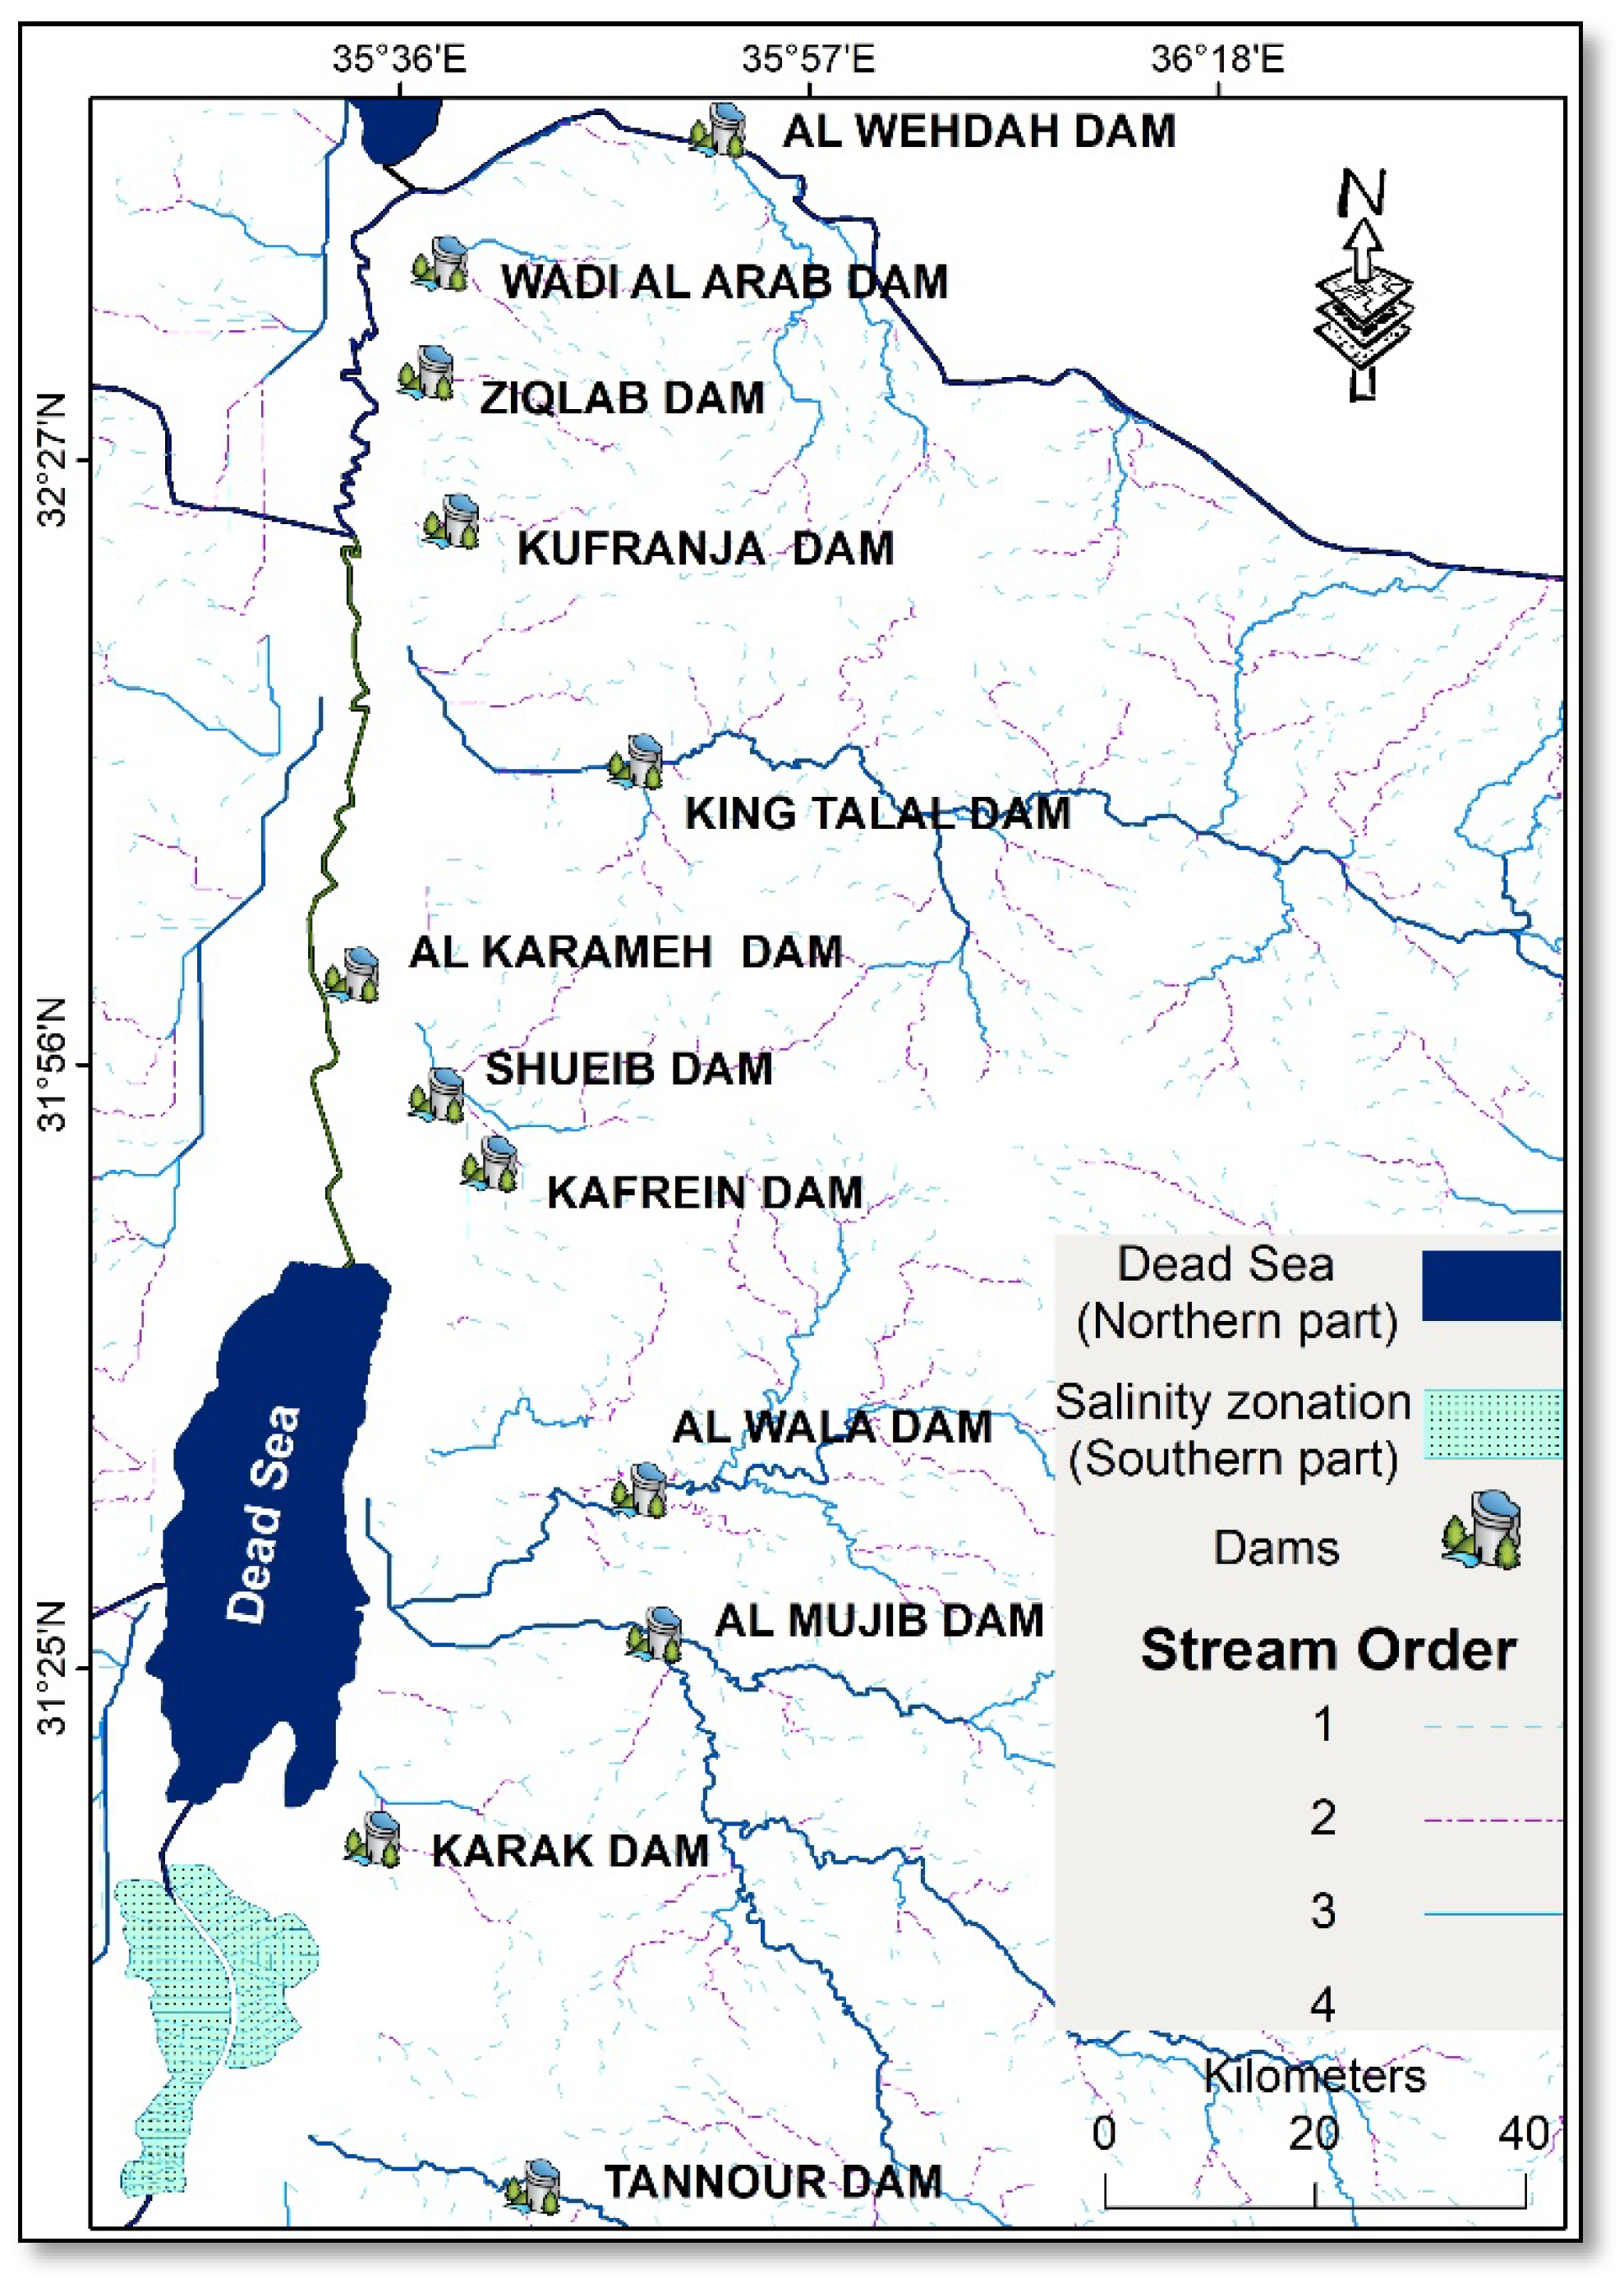
Figure 4, 13 dams have been constructed in Jordan over the past 6 decades, with a cumulative capacity of approximately 335.3 million cubic meters (MCM). Among these dams, the prominent King Talal Dam, located on the Zarqa River and listed in
Table 4, has a total capacity of 75 MCM. Additionally, the Unity Dam (Al Wihdeh) on the Yarmouk River, shared between Jordan and Syria, has a total reservoir capacity of 110 MCM. These dams, excluding the Karamah Dam on Wadi Mallaha, are strategically positioned alongside wadis, with their outlets directed toward the Jordan River Valley (JRV). They serve as reservoirs for flood and base flows, playing a crucial role in regulating and distributing water for irrigation [
65,
66].
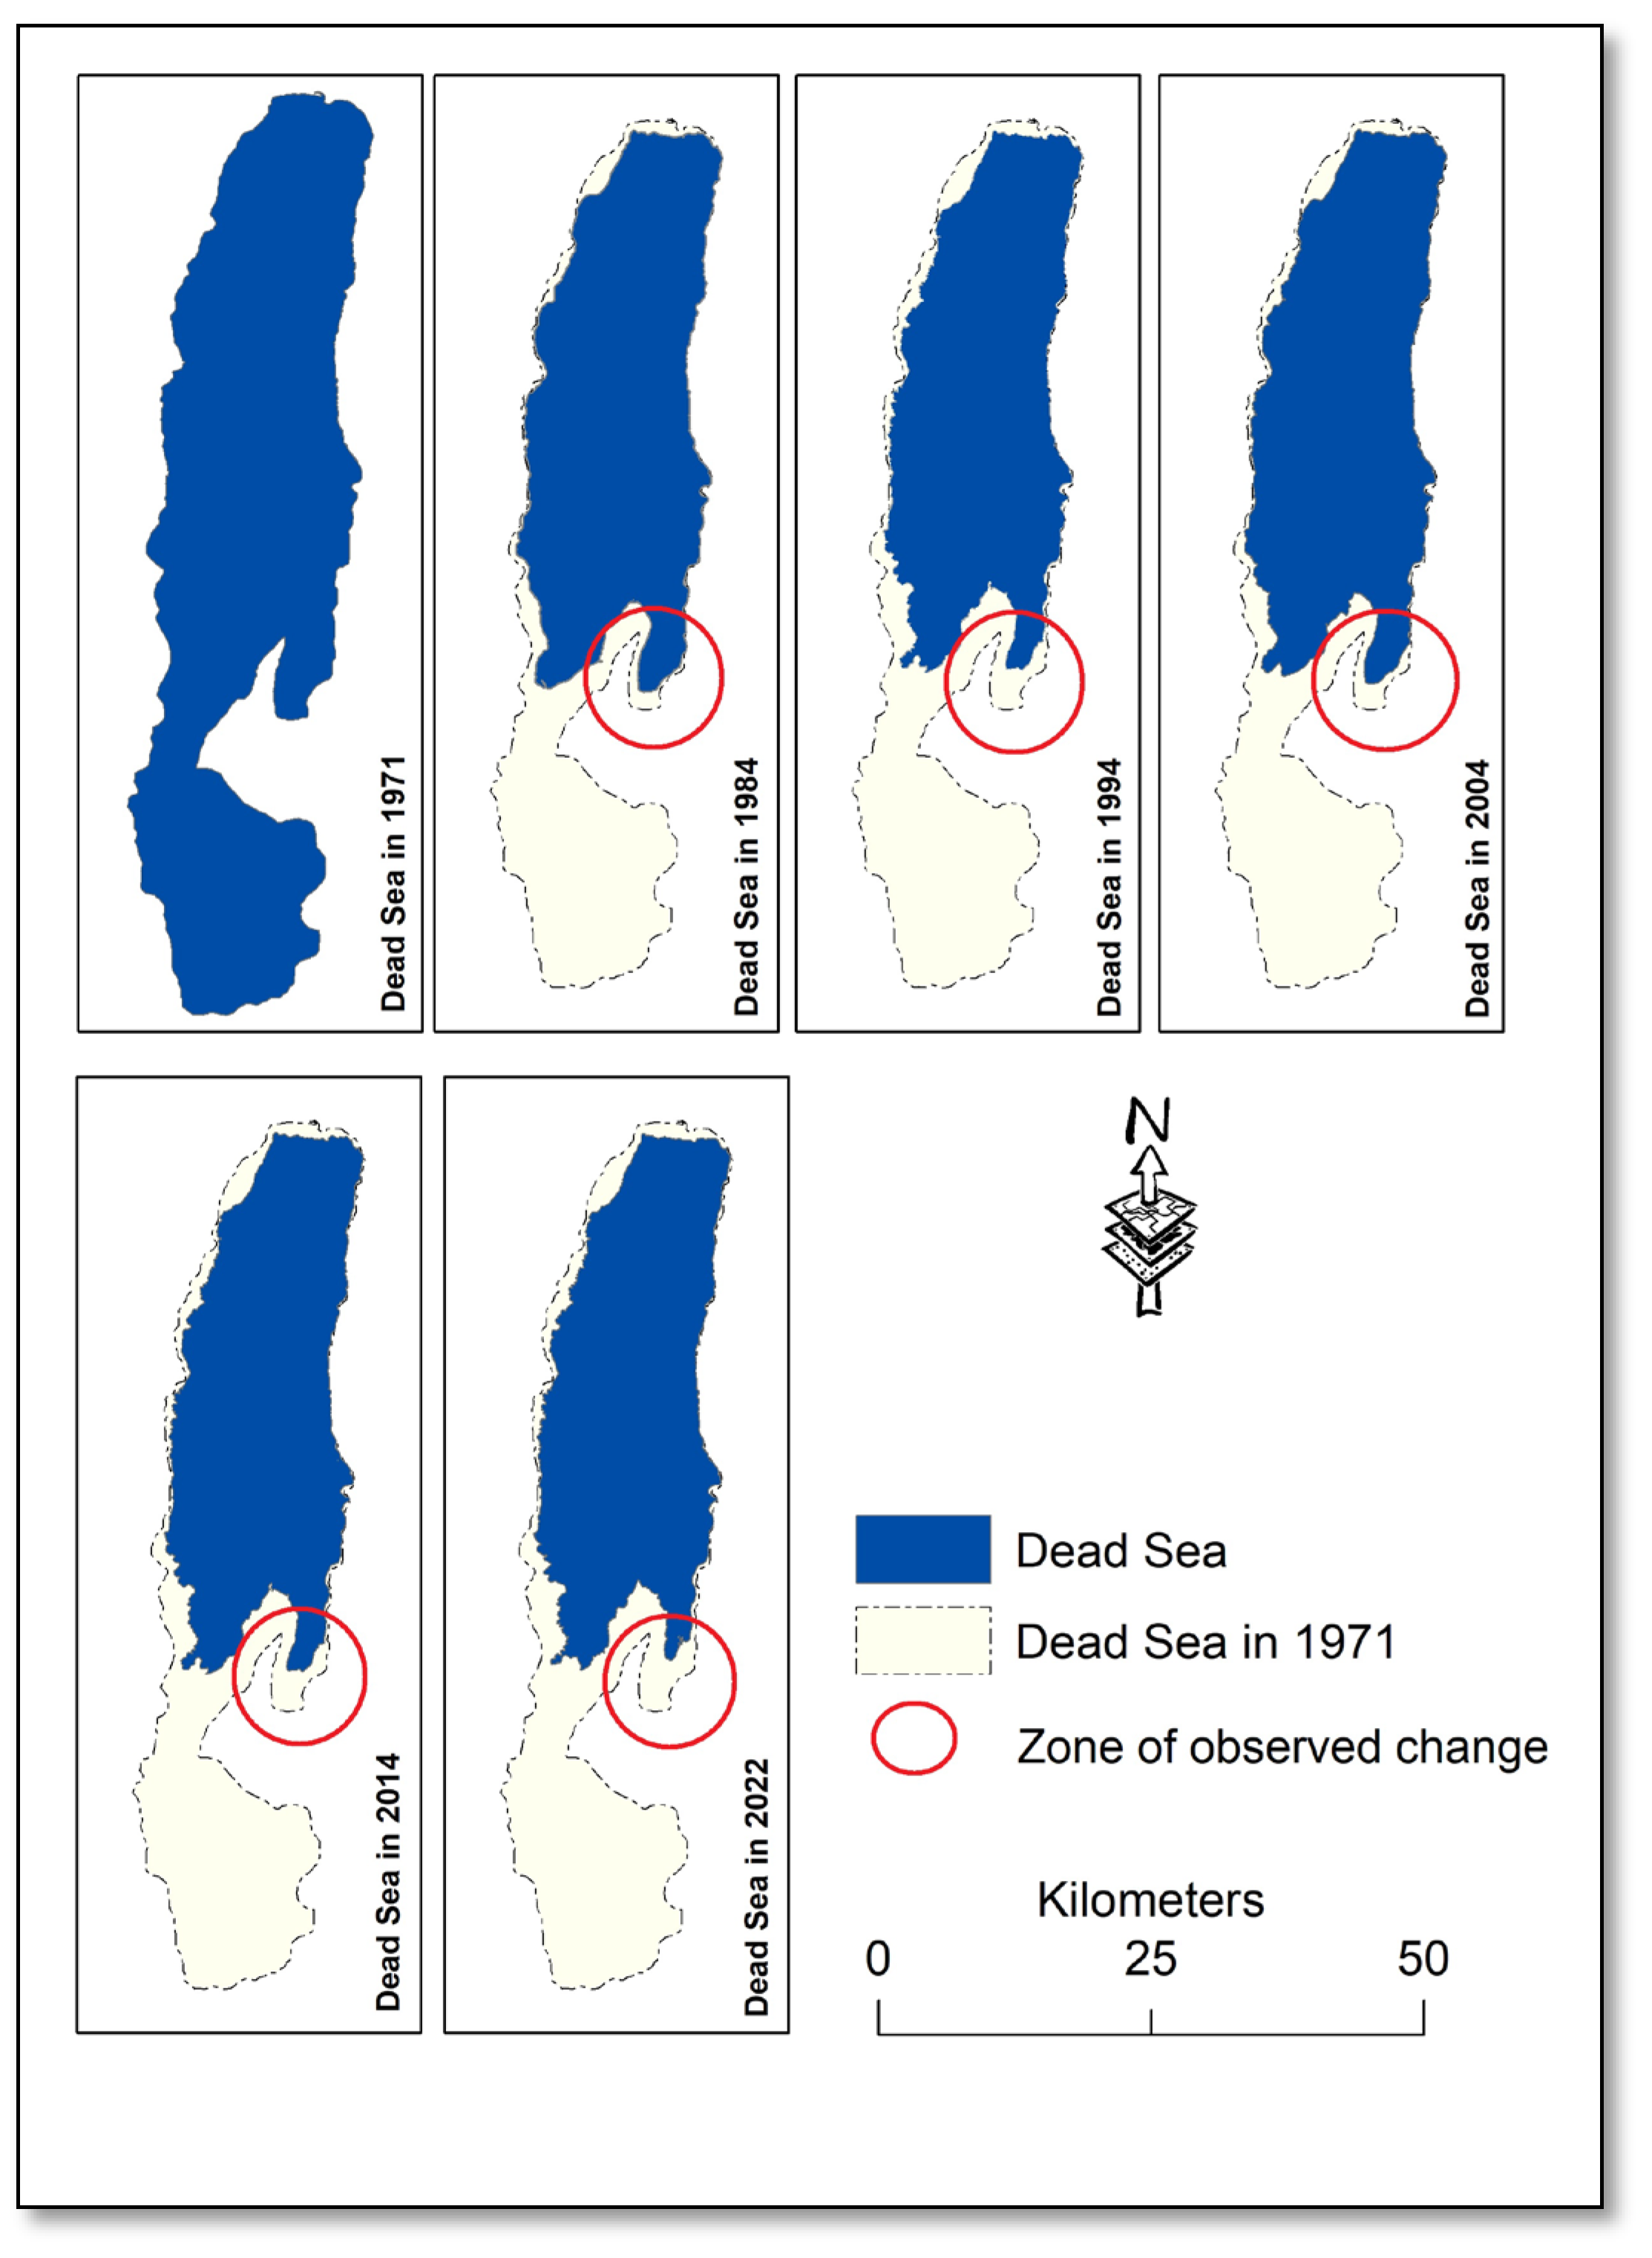
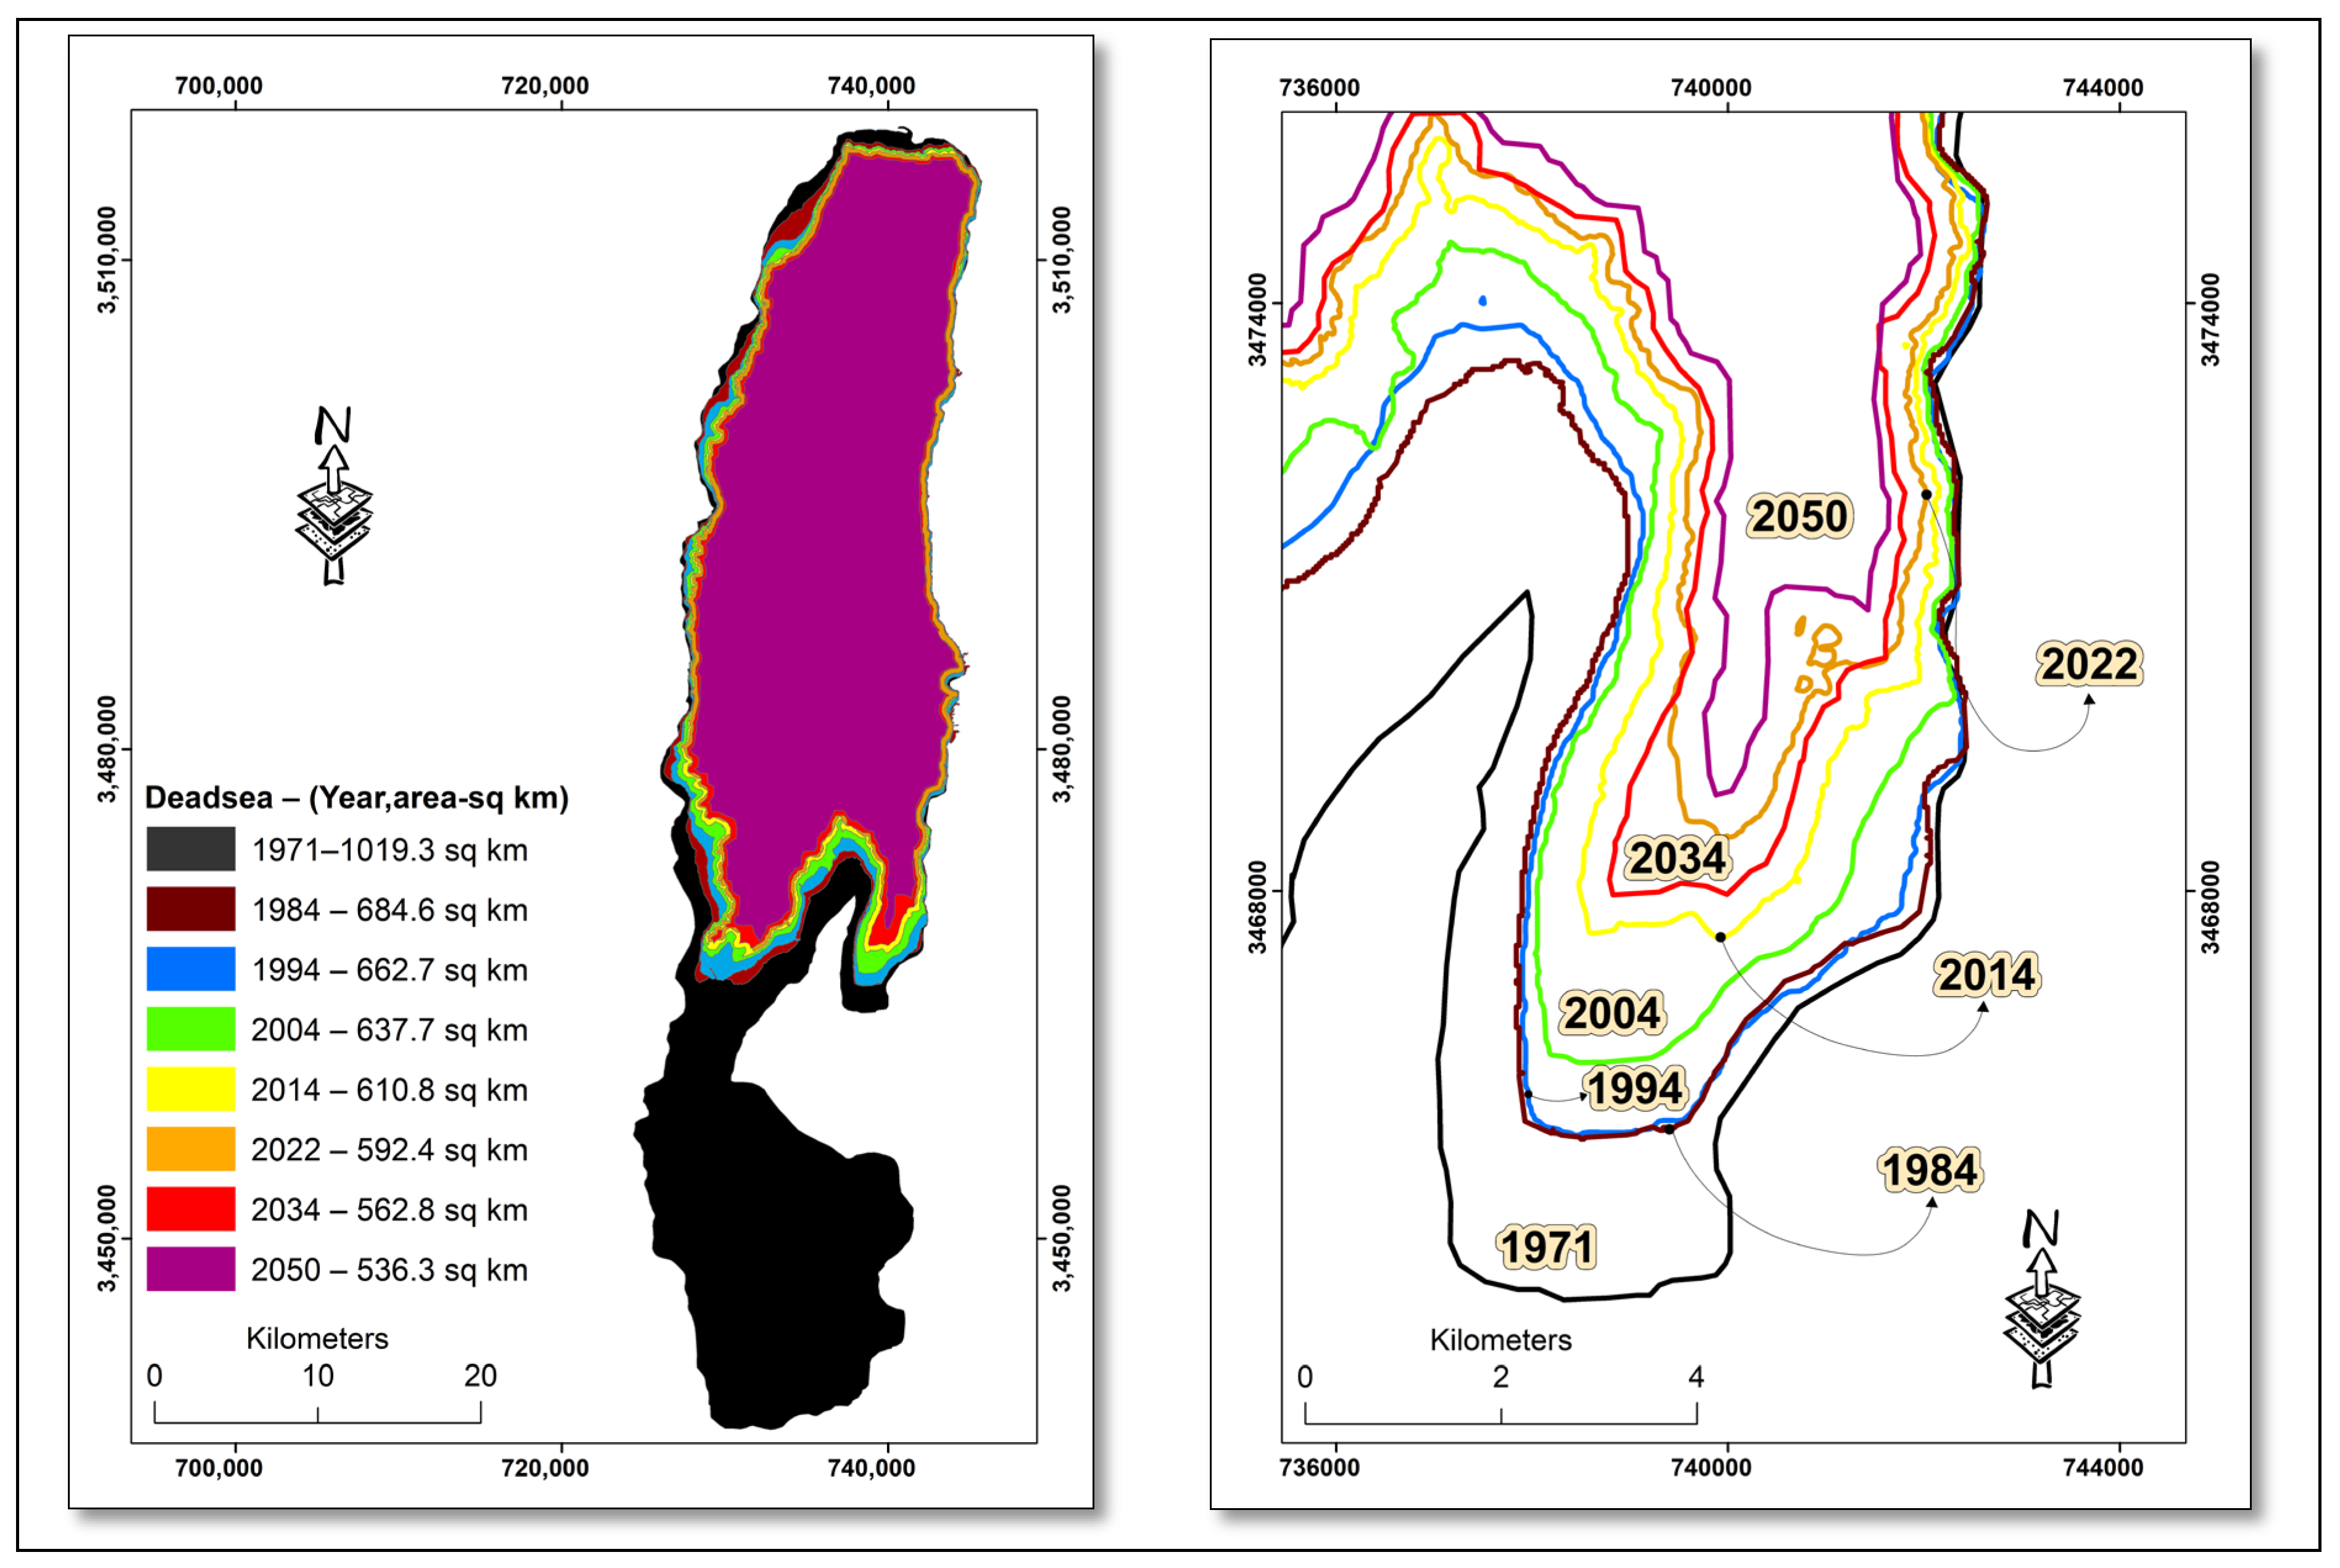
A discernible transformation is observed in the eastern shores of the southern portion of the Dead Sea, delineated within the red circle in
Figure 5. This alteration in bathymetry in the southern expanse of the sea has become more pronounced as the area has shrunk. The changes in the surface area of the Dead Sea over various time phases are also depicted in
Figure 5. The examination of surface area alterations spans five distinct time series: (1971–1984), (1984–1994), (1994–2004), (2004–2014), and (2014–2022), as shown in
Table 5. In broad terms, the rate of change in the Dead Sea area fluctuates by as much as −3.94%. Notably, the period from 1971 to 1984 was excluded from the analysis due to the separation of the northern part from the southern part, as discussed earlier.
3.2. Model Validation
Table 6 presents the validation procedure for the CA-Markov model, comparing predicted and observed surface area values. The validation was carried out using a stepwise temporal approach. Specifically, historical data from 1994–2004 were used as input (training data) to simulate the surface area for 2014. The predicted value was then compared with the observed surface area for 2014 to evaluate the model’s performance. Similarly, data from 2004–2014 were used to predict the surface area for 2022, and the predicted values were compared with the observed data for that year. The degree of agreement between predicted and observed values was assessed using the Kappa statistic. Based on the data presented in the table, the kappa statistics indicate a high degree of agreement between the simulated and observed Dead Sea surface levels, with only minor discrepancies. Specifically, Location and K-overall reach 0.98 and 0.96, respectively. Furthermore, kappa indices of agreement were used to validate potential changes in the maps, which enabled evaluation of the model’s accuracy using the kappa statistic before predicting the Dead Sea’s surface area for 2034 and 2050. Consequently, the model is considered reliable and dependable for predicting future changes in the surface area of various features.
3.3. Effect of Climate Change on the Dead Sea
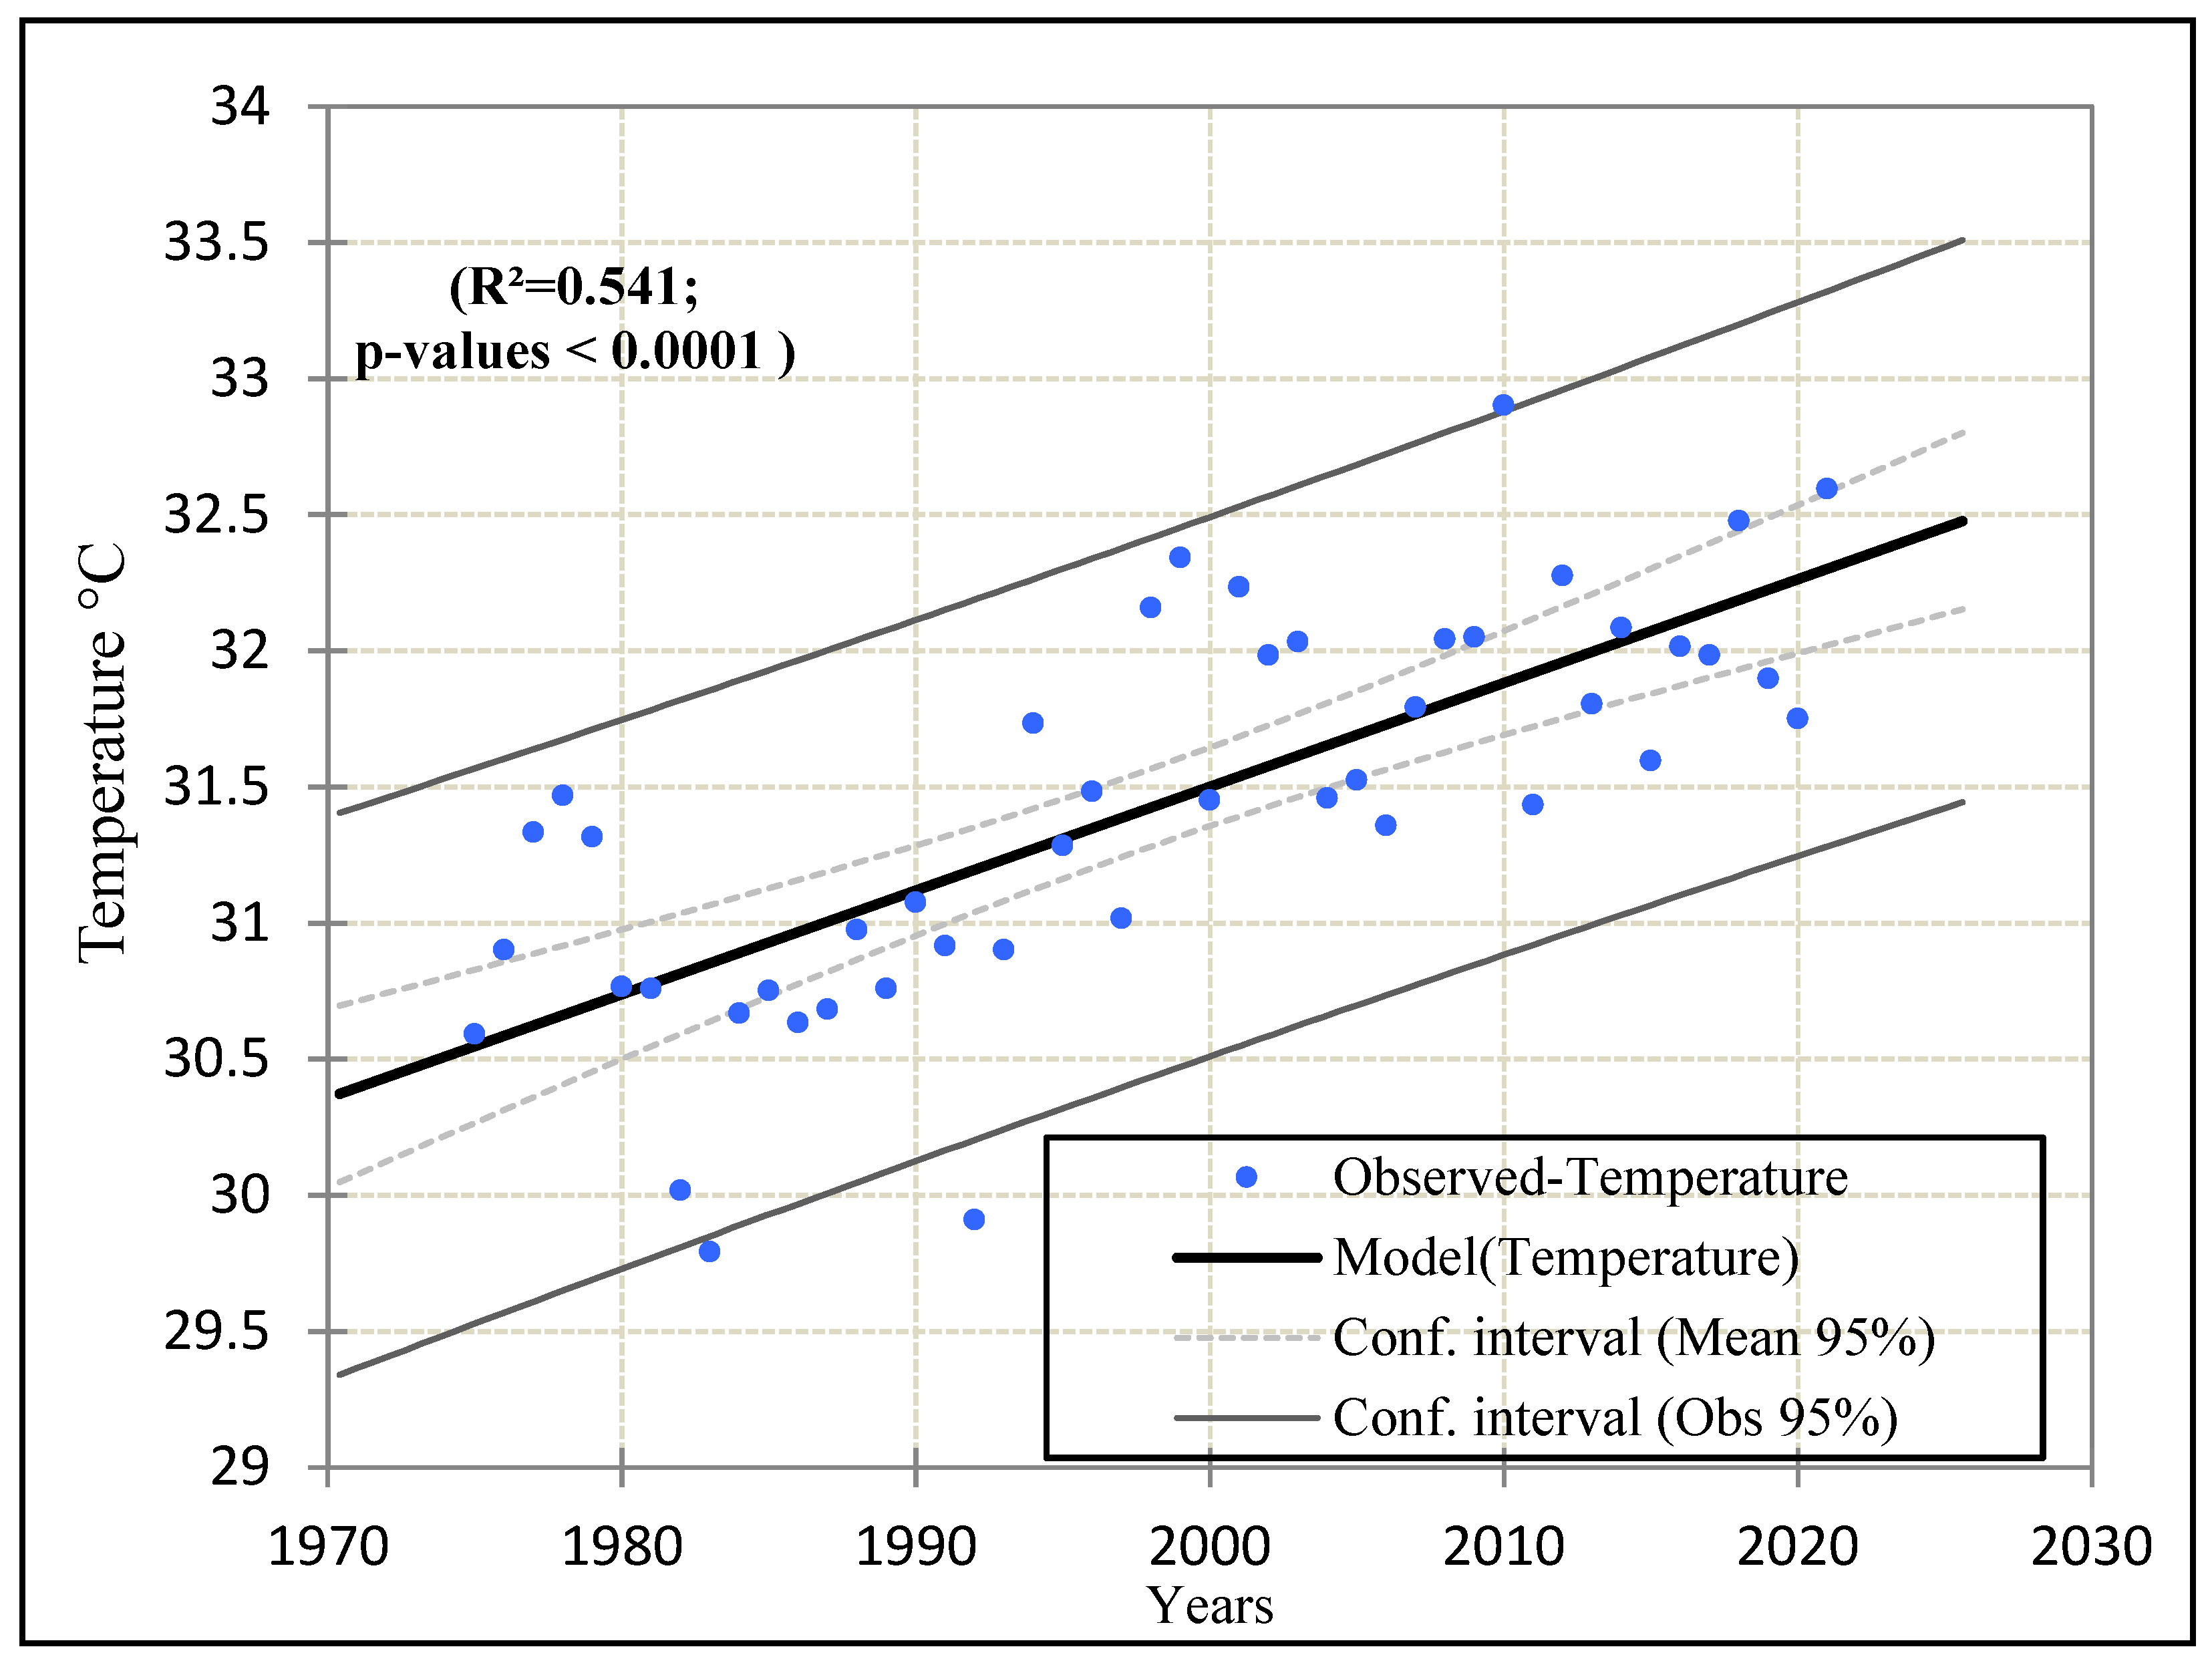
To identify the factors contributing to the decline in the surface area of the Dead Sea, our investigation used meteorological data, specifically examining the annual averages of rainfall and temperature spanning all years from 1971 to 2022. These data were sourced from the Ghor Al-Safi station. Notably, our analysis revealed a pronounced and statistically significant increase in annual temperatures from 1971 to 2022, as evidenced by an R
2 value of 0.541 and a
p-value less than 0.0001, as shown in
Figure 6. Furthermore, our findings indicate a temperature increase of 0.67 °C over the past six decades, amplifying the observed heightened rates of evaporation in the Dead Sea, as shown in
Table 5. Some studies suggest that annual evaporation increased from 7% in the 1960s to 12% in the 2000s [
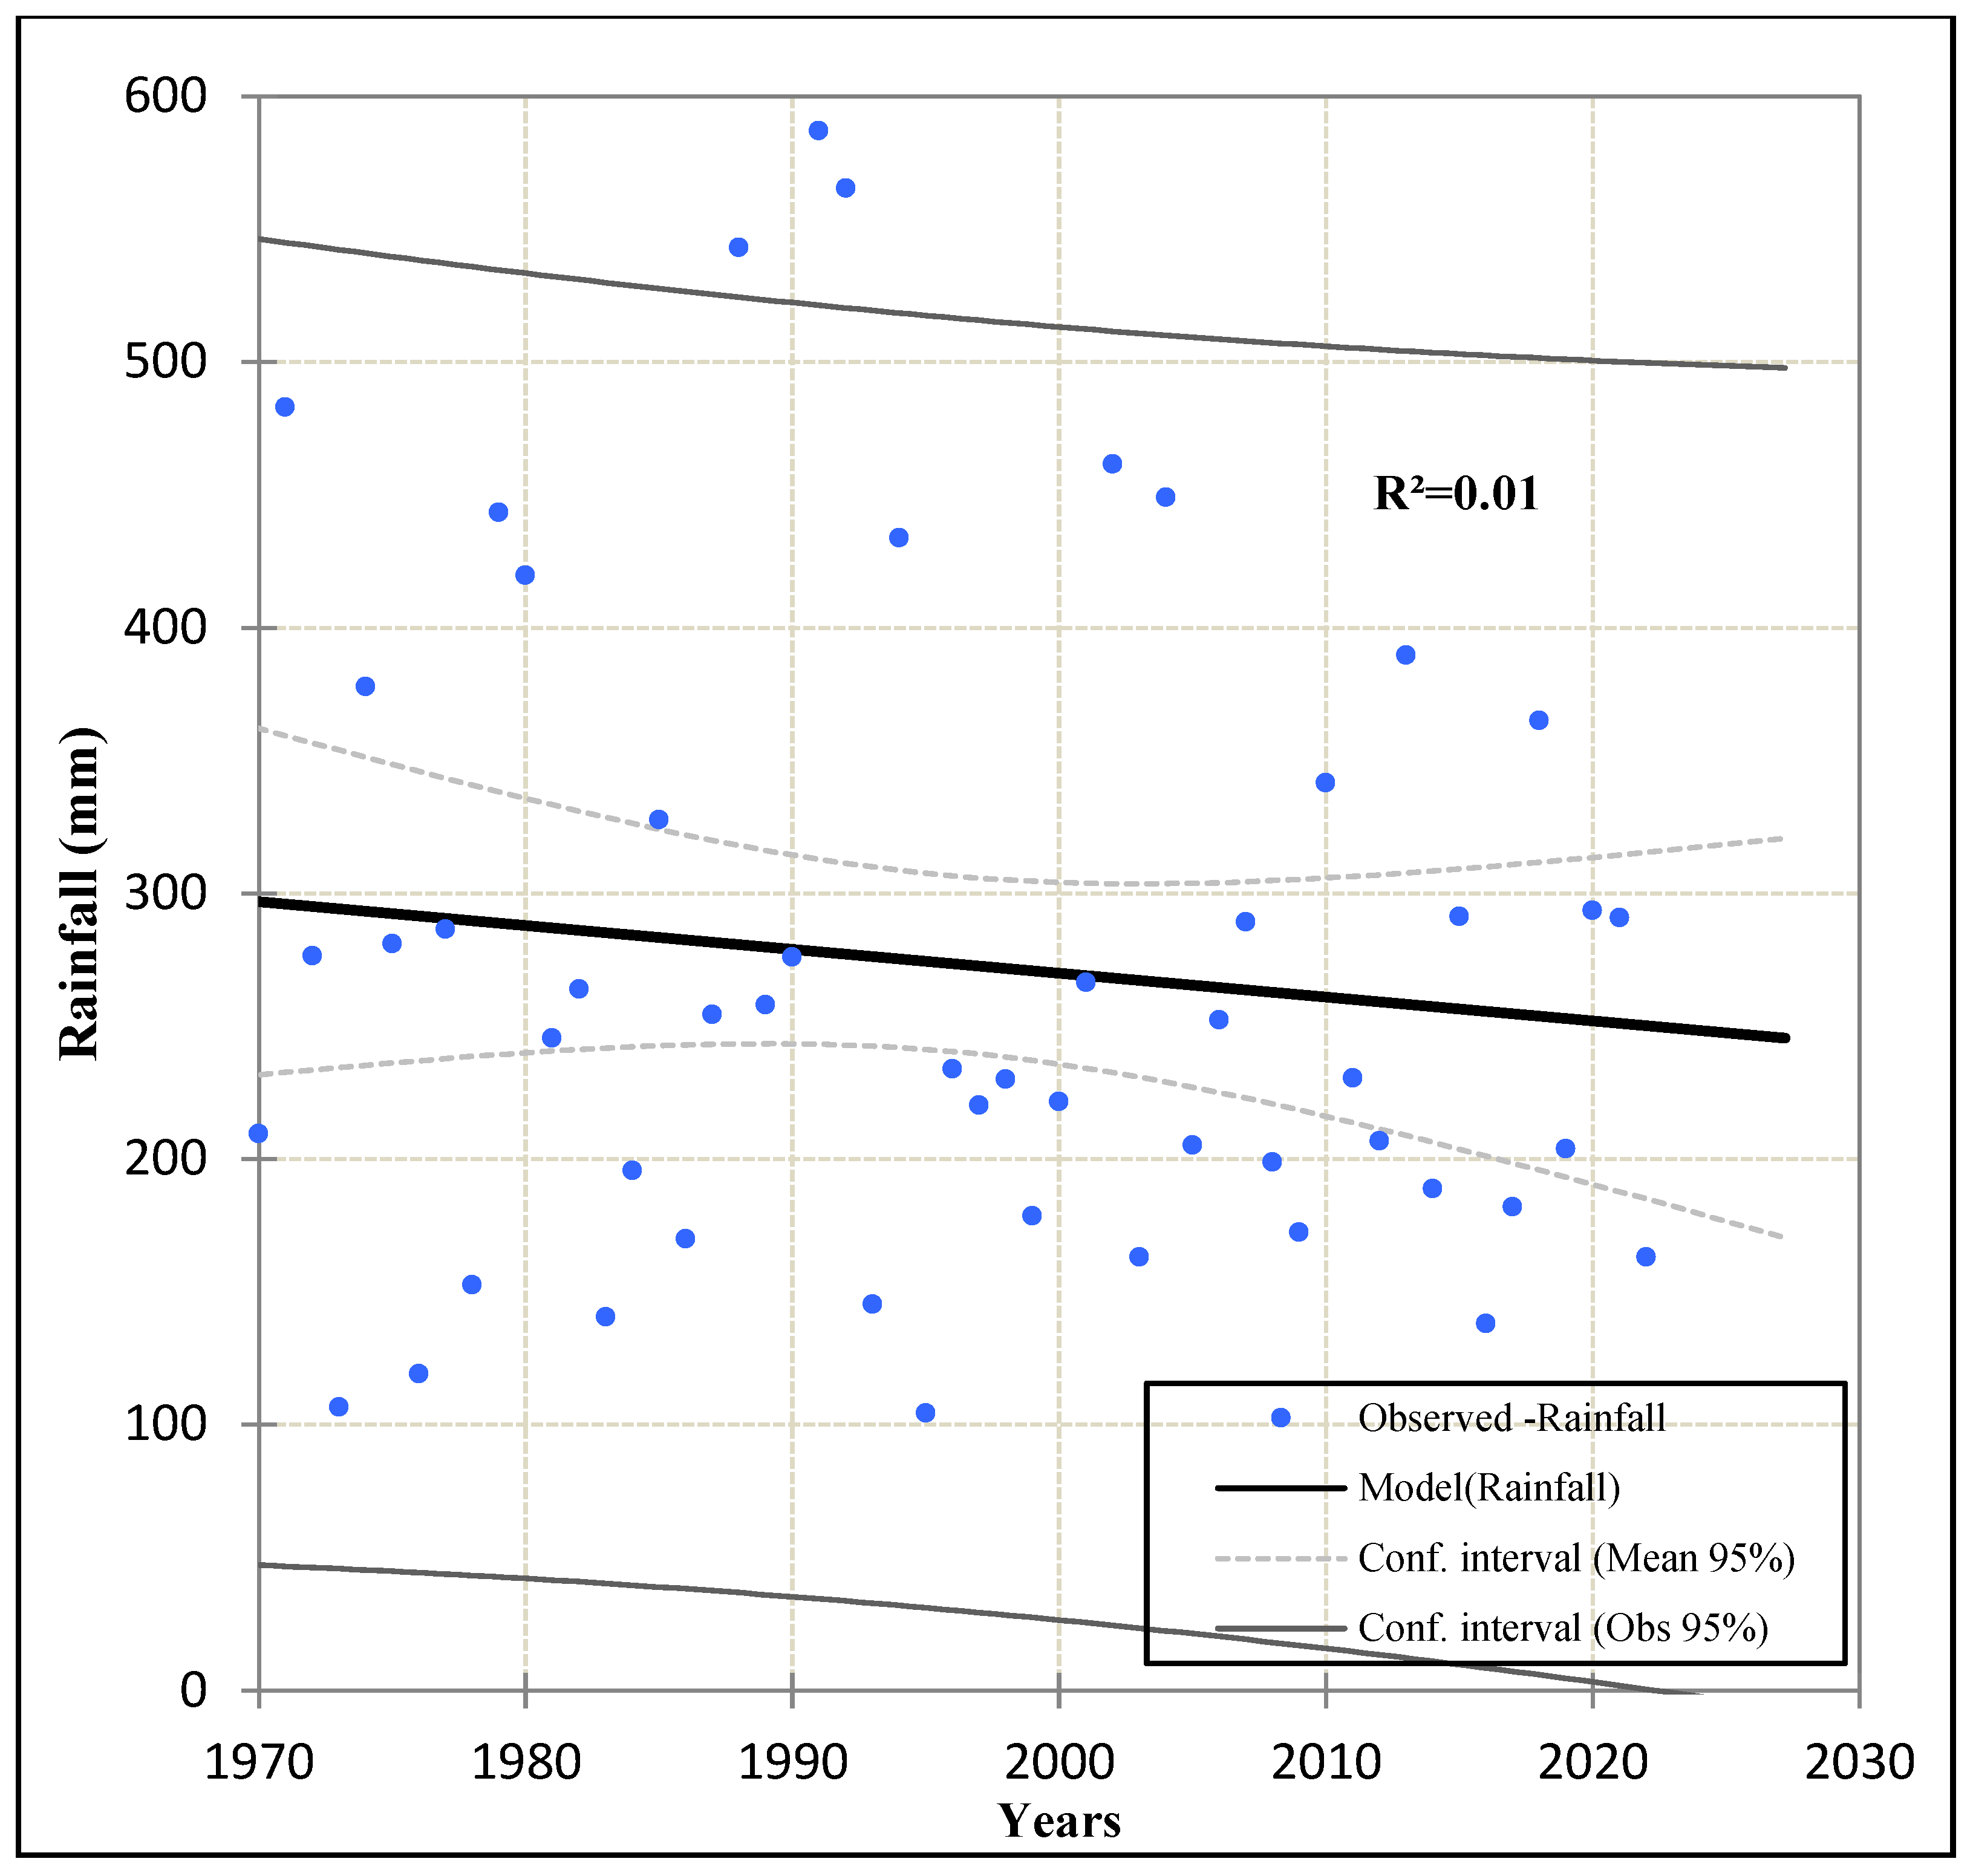
67]. Conversely, the analysis of rainfall data yielded no discernible trend, as indicated by an R
2 value of 0.013. Nevertheless,
Figure 7 shows a decline in the rainfall data, with Sen’s slope measuring −0.81 during the 1971 to 2022 period. Hence, our study underscores the substantial influence of climatic conditions on the behavior of water bodies. This behavior emerges as a result of the balance between inflowing water from the tributary area and direct precipitation, with water evaporation acting as a subtractive factor.
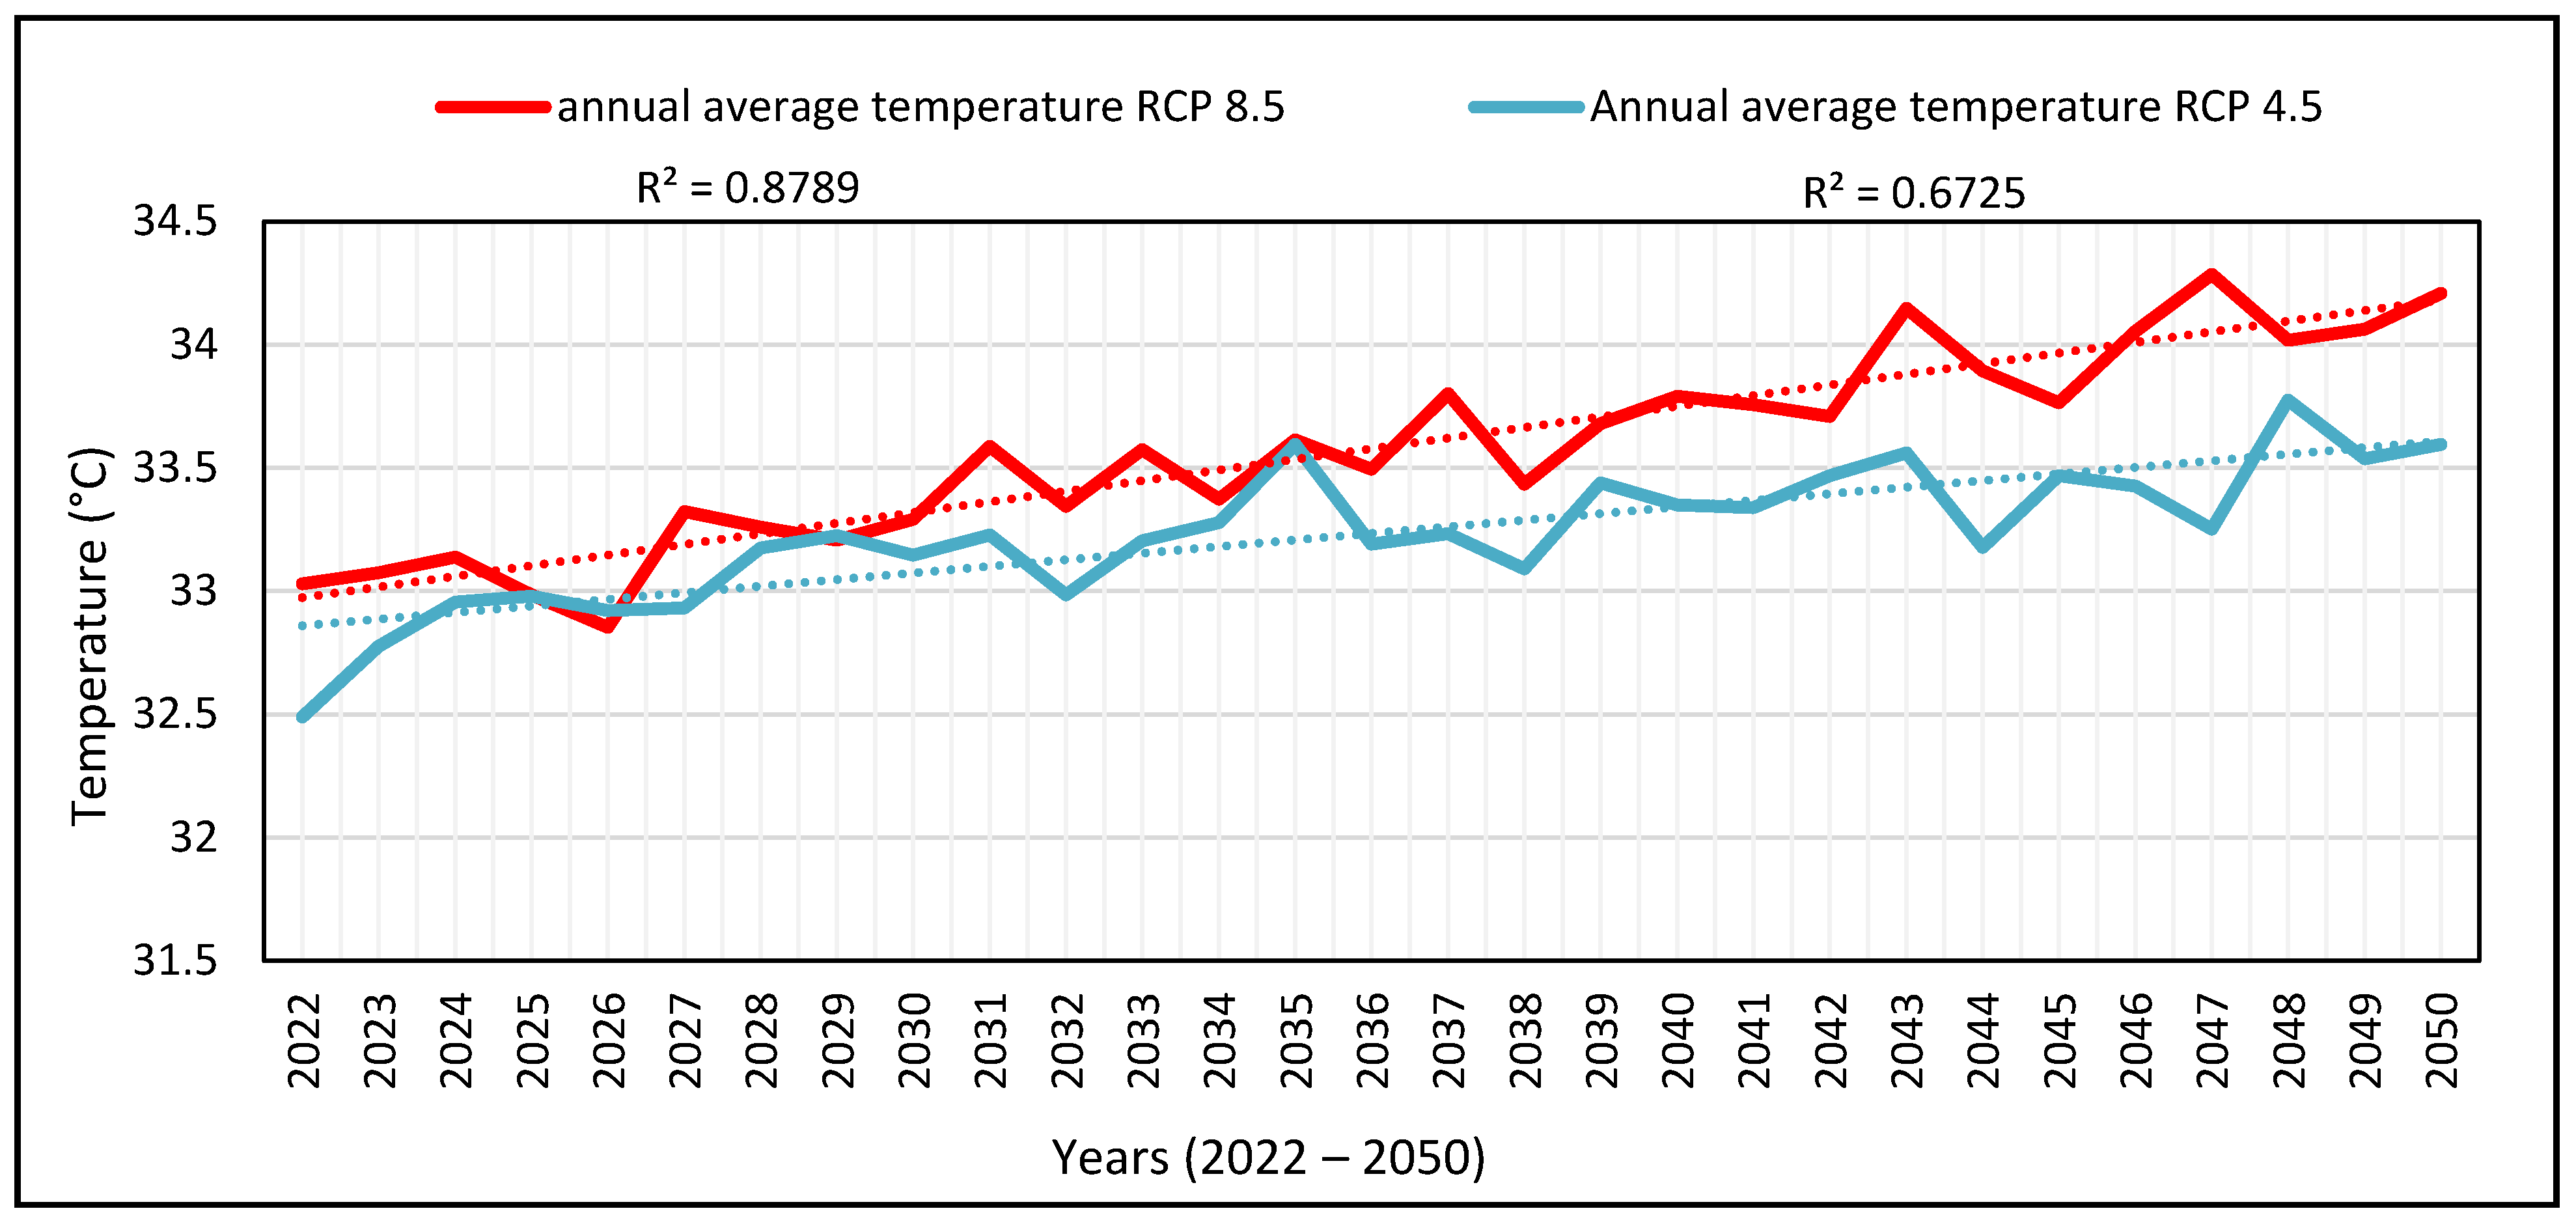
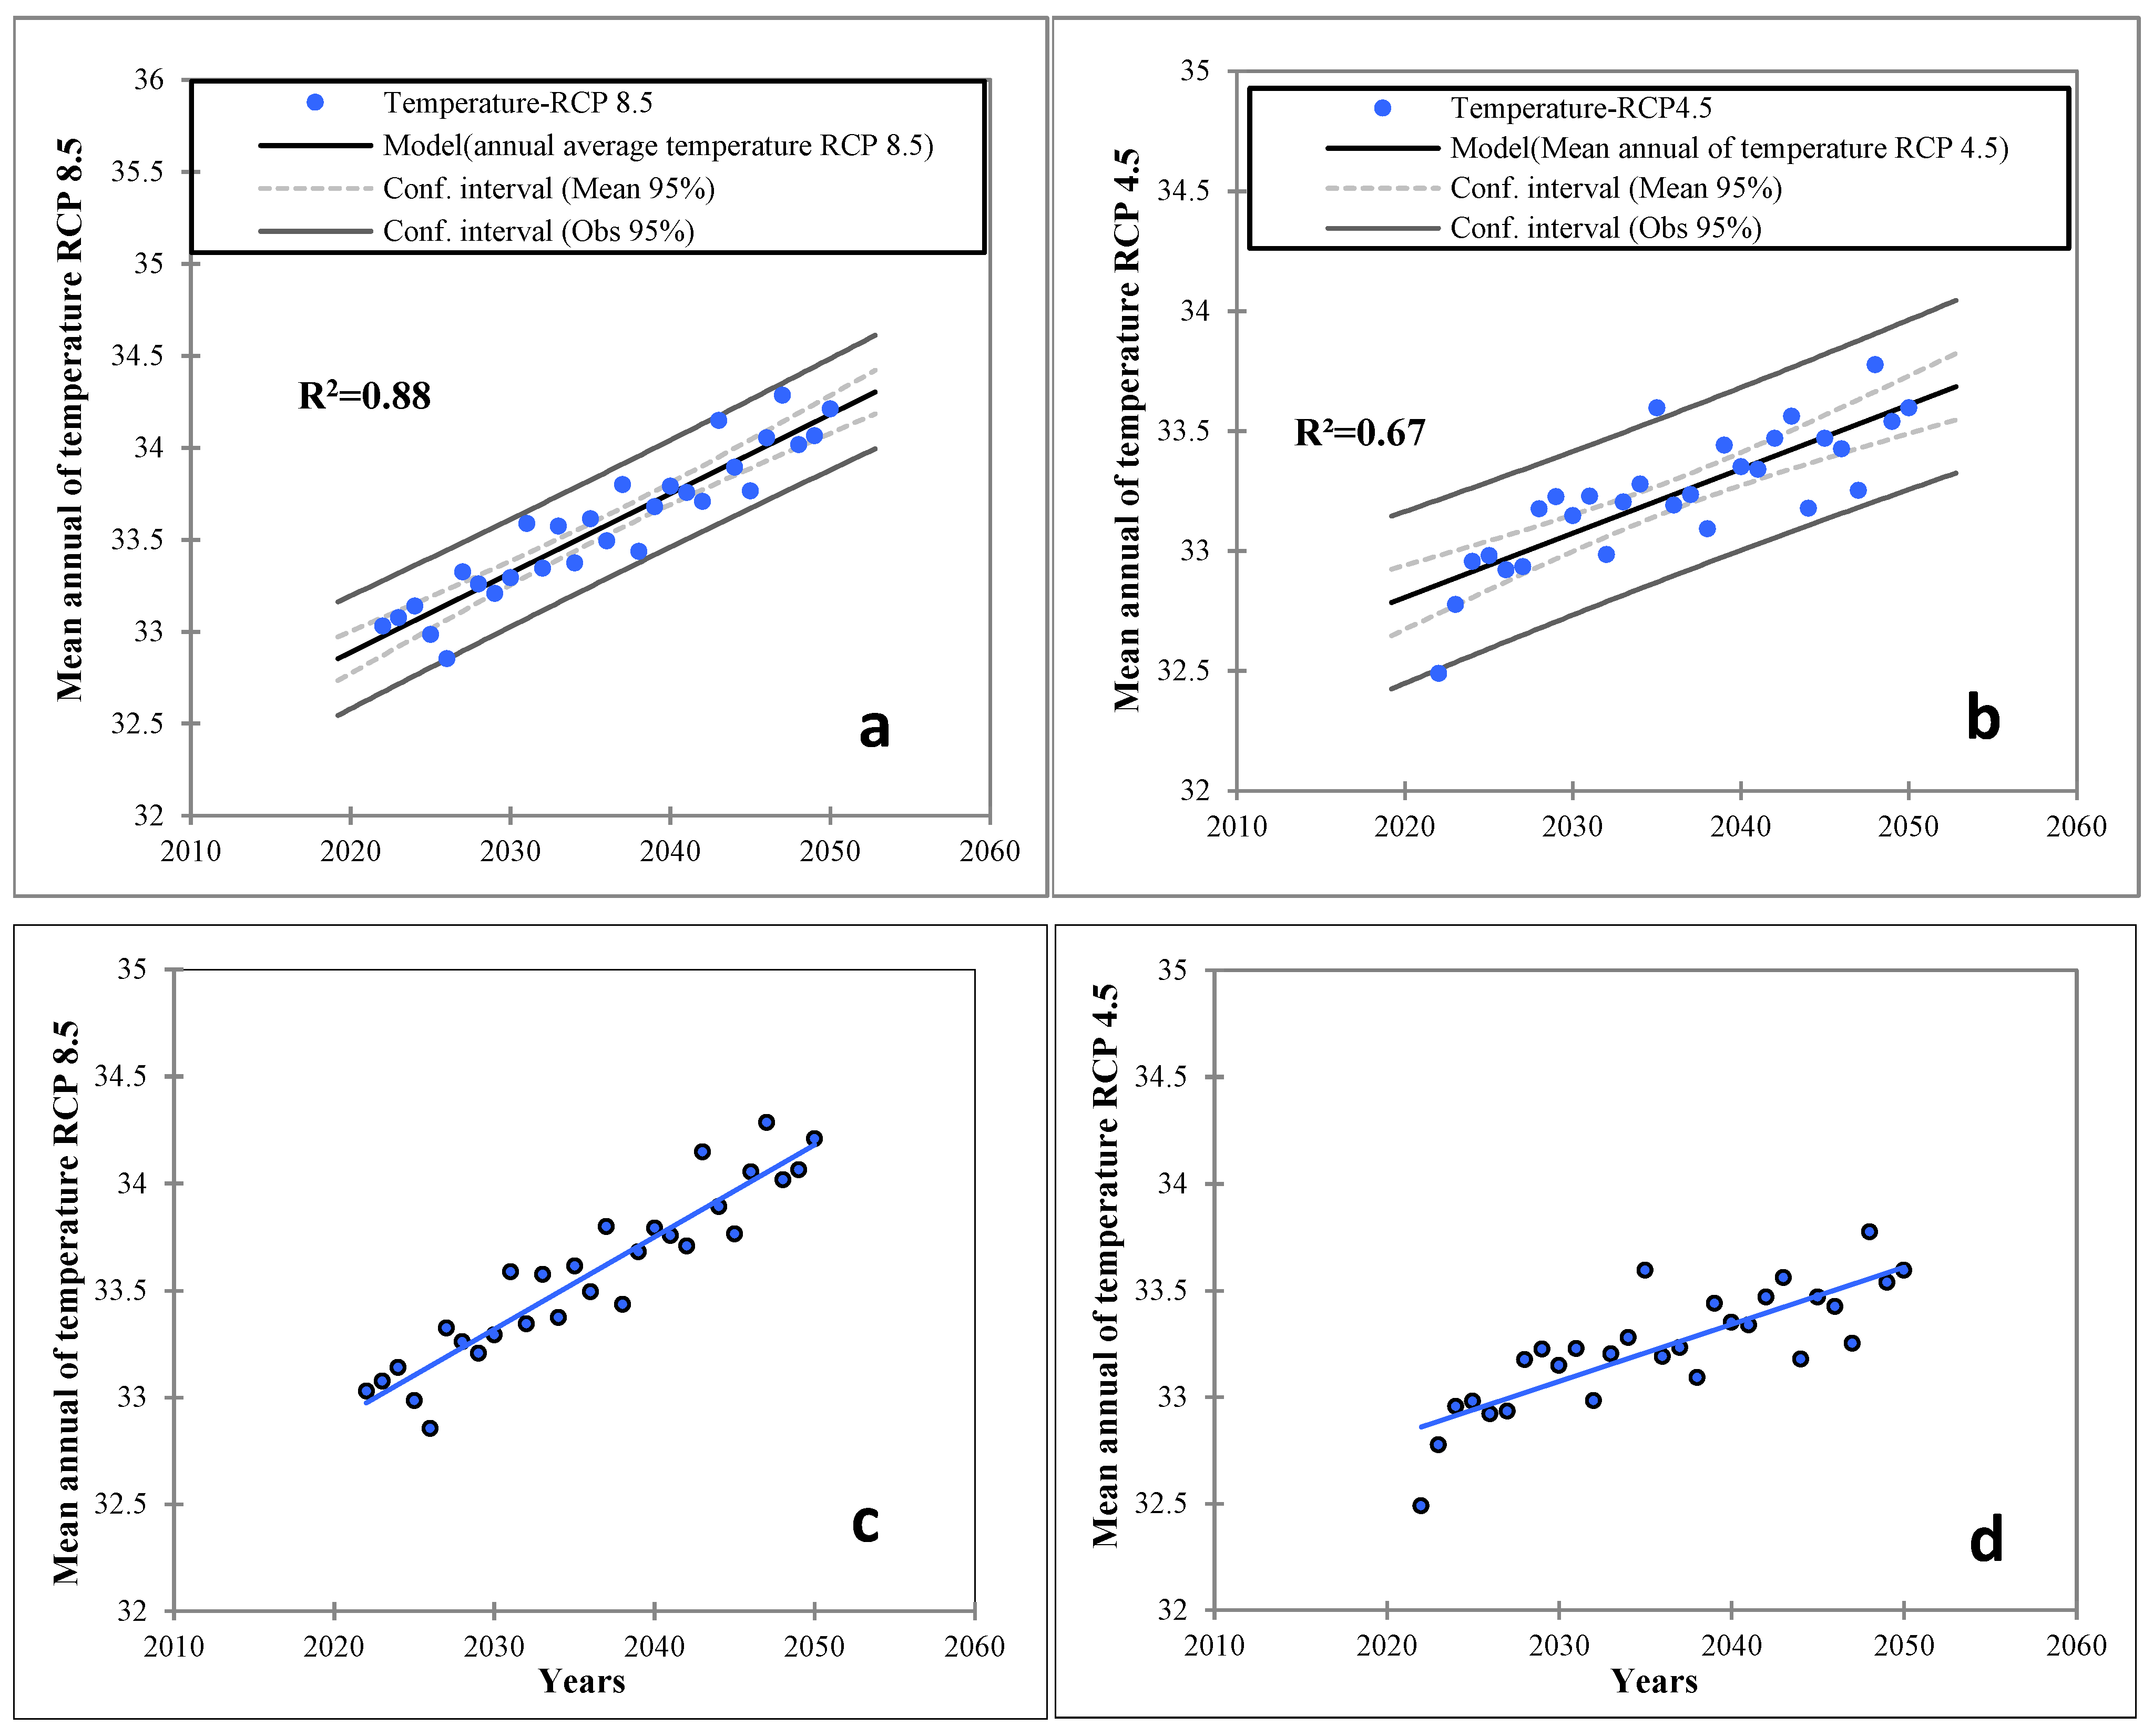
The process of identifying and evaluating the principal climate change-related hazards involved a comprehensive analysis of historical extreme events and trends. Additionally, based on climate modeling techniques derived from dynamic downscaling conducted within the African region under the Coordinated Regional Climate Downscaling Experiment (CORDEX) Domain framework. The temperature projections spanning from 2022 to 2050 are shown in
Figure 8. These projections were generated using RCPs 4.5 and 8.5, allowing us to assess future scenarios relative to reference historical data spanning 1971 to 2022. Notably, despite the number of available models, only two, namely, CSIRO MK3 and HADGEM1 [
68], are consistent with those utilized in the Jordan Second Assessment. Consequently, the Jordanian Second National Report incorporates these two models alongside the ECHAM50M. This selective approach was adopted because the outputs of these three general circulation models (GCMs) are highly relevant to geographic data points within Jordan [
69].
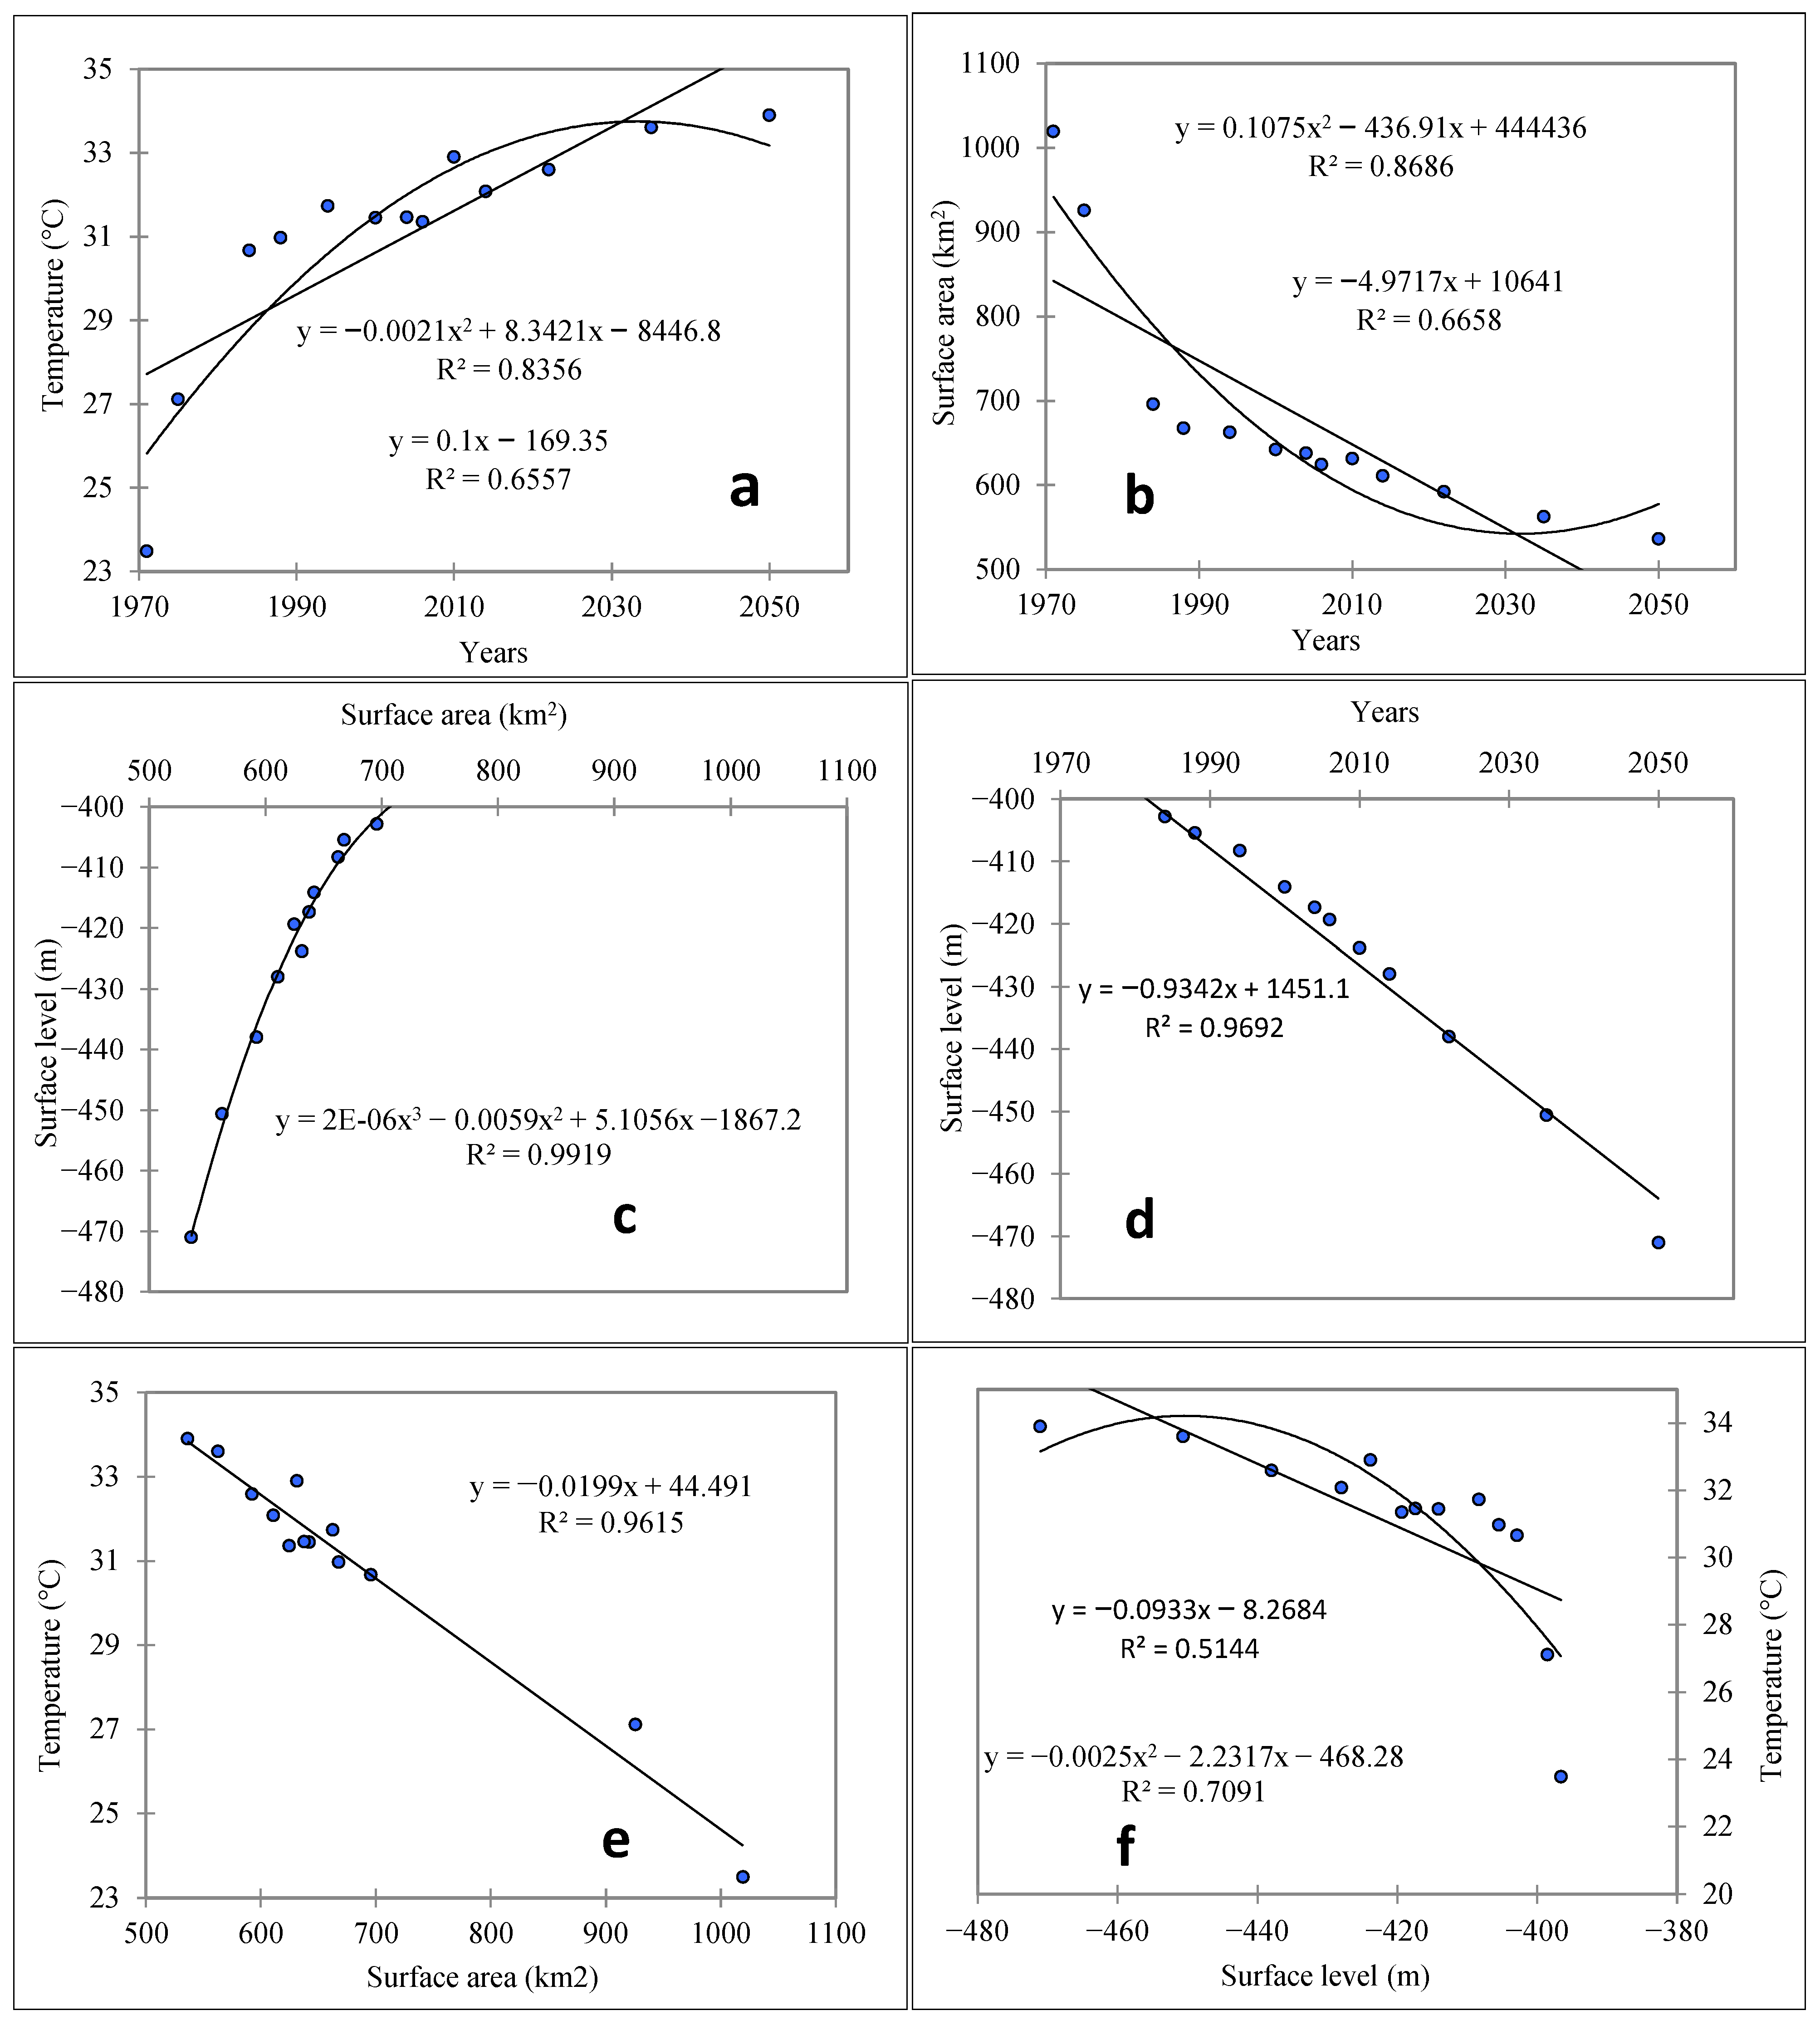
Figure 9 shows that the linear regression and Mann‐Kendall trend analyses reveal a significant upward trend in annual temperature over the next three decades. The rate of increase is estimated at 1.1 °C for RCP 4.5 and 1.2 °C for RCP 8.5, with corresponding coefficients of determination (R
2) of 0.67 (
p-value < 0.0001) and 0.88 (
p-value < 0.0001), respectively. In the context of investigating the impact of climatic change on the Dead Sea, the temperature variable becomes the central focus, as shown in
Table 7. Following the application of Mann‐Kendall analysis, an inverse correlation between temperature and the surface area of the Dead Sea was established, with an R
2 value of 0.5, a correlation coefficient (r) of −0.71, and a
p-value of less than 0.003. Notably, the catchment areas of the Yarmouk Basin, Amman-Zarqa Basin, and Mujib Basin have a vital role in replenishing the Dead Sea, serving as its primary tributaries. However, the presence of dams at the outlets of these tributaries has resulted in a reduction in recharge, as previously mentioned. Therefore, when examining the climatic component, specifically rainfall, it is imperative to consider these three watersheds, which collectively account for nearly half of the land area of the Hashemite Kingdom of Jordan.
Intensive human water consumption, exemplified by Israel’s transfer of 420 MCM/year from the Upper Jordan River to the Negev via the National Water Carrier, is the primary factor impacting the dramatic recession of the Dead Sea. Regression analysis, as shown in
Figure 4 with an R
2 value of 0.988, supports this assertion by demonstrating the high degree of fit between a third-degree polynomial and the observed decline in water levels [
43].
3.4. Future Projections of the Dead Sea Surface Area
Dead Sea surface area projections for 2034 and 2050 were generated using the CA-Markov chain model (
Figure 10). The analysis of transition-class probabilities for these years revealed a potential decrease in the Dead Sea’s surface area of 5% to 9.5%. Moreover, previous research has indicated a significant decrease in annual rainfall, at a rate of 1.2 mm per year until 2100 [
63,
69,
70]. Additionally, rising annual temperatures are expected to increase evaporation rates, consequently impacting the Dead Sea’s salinity, which has reached 34%, one of the highest recorded levels in water bodies. Regarding the Dead Sea’s water level, numerous studies have corroborated its continuous decline, exceeding 1 m annually [
13,
26,
69,
71]. This decline has triggered an ongoing ecological crisis, primarily attributable to human activities. The principal factors contributing to the retreat of the Dead Sea include the diversion of water from the Jordan River and its tributaries and the operation of mineral extraction industries on both sides of the Dead Sea. These activities have resulted in irreversible harm to the natural environment, infrastructure, and tourism.
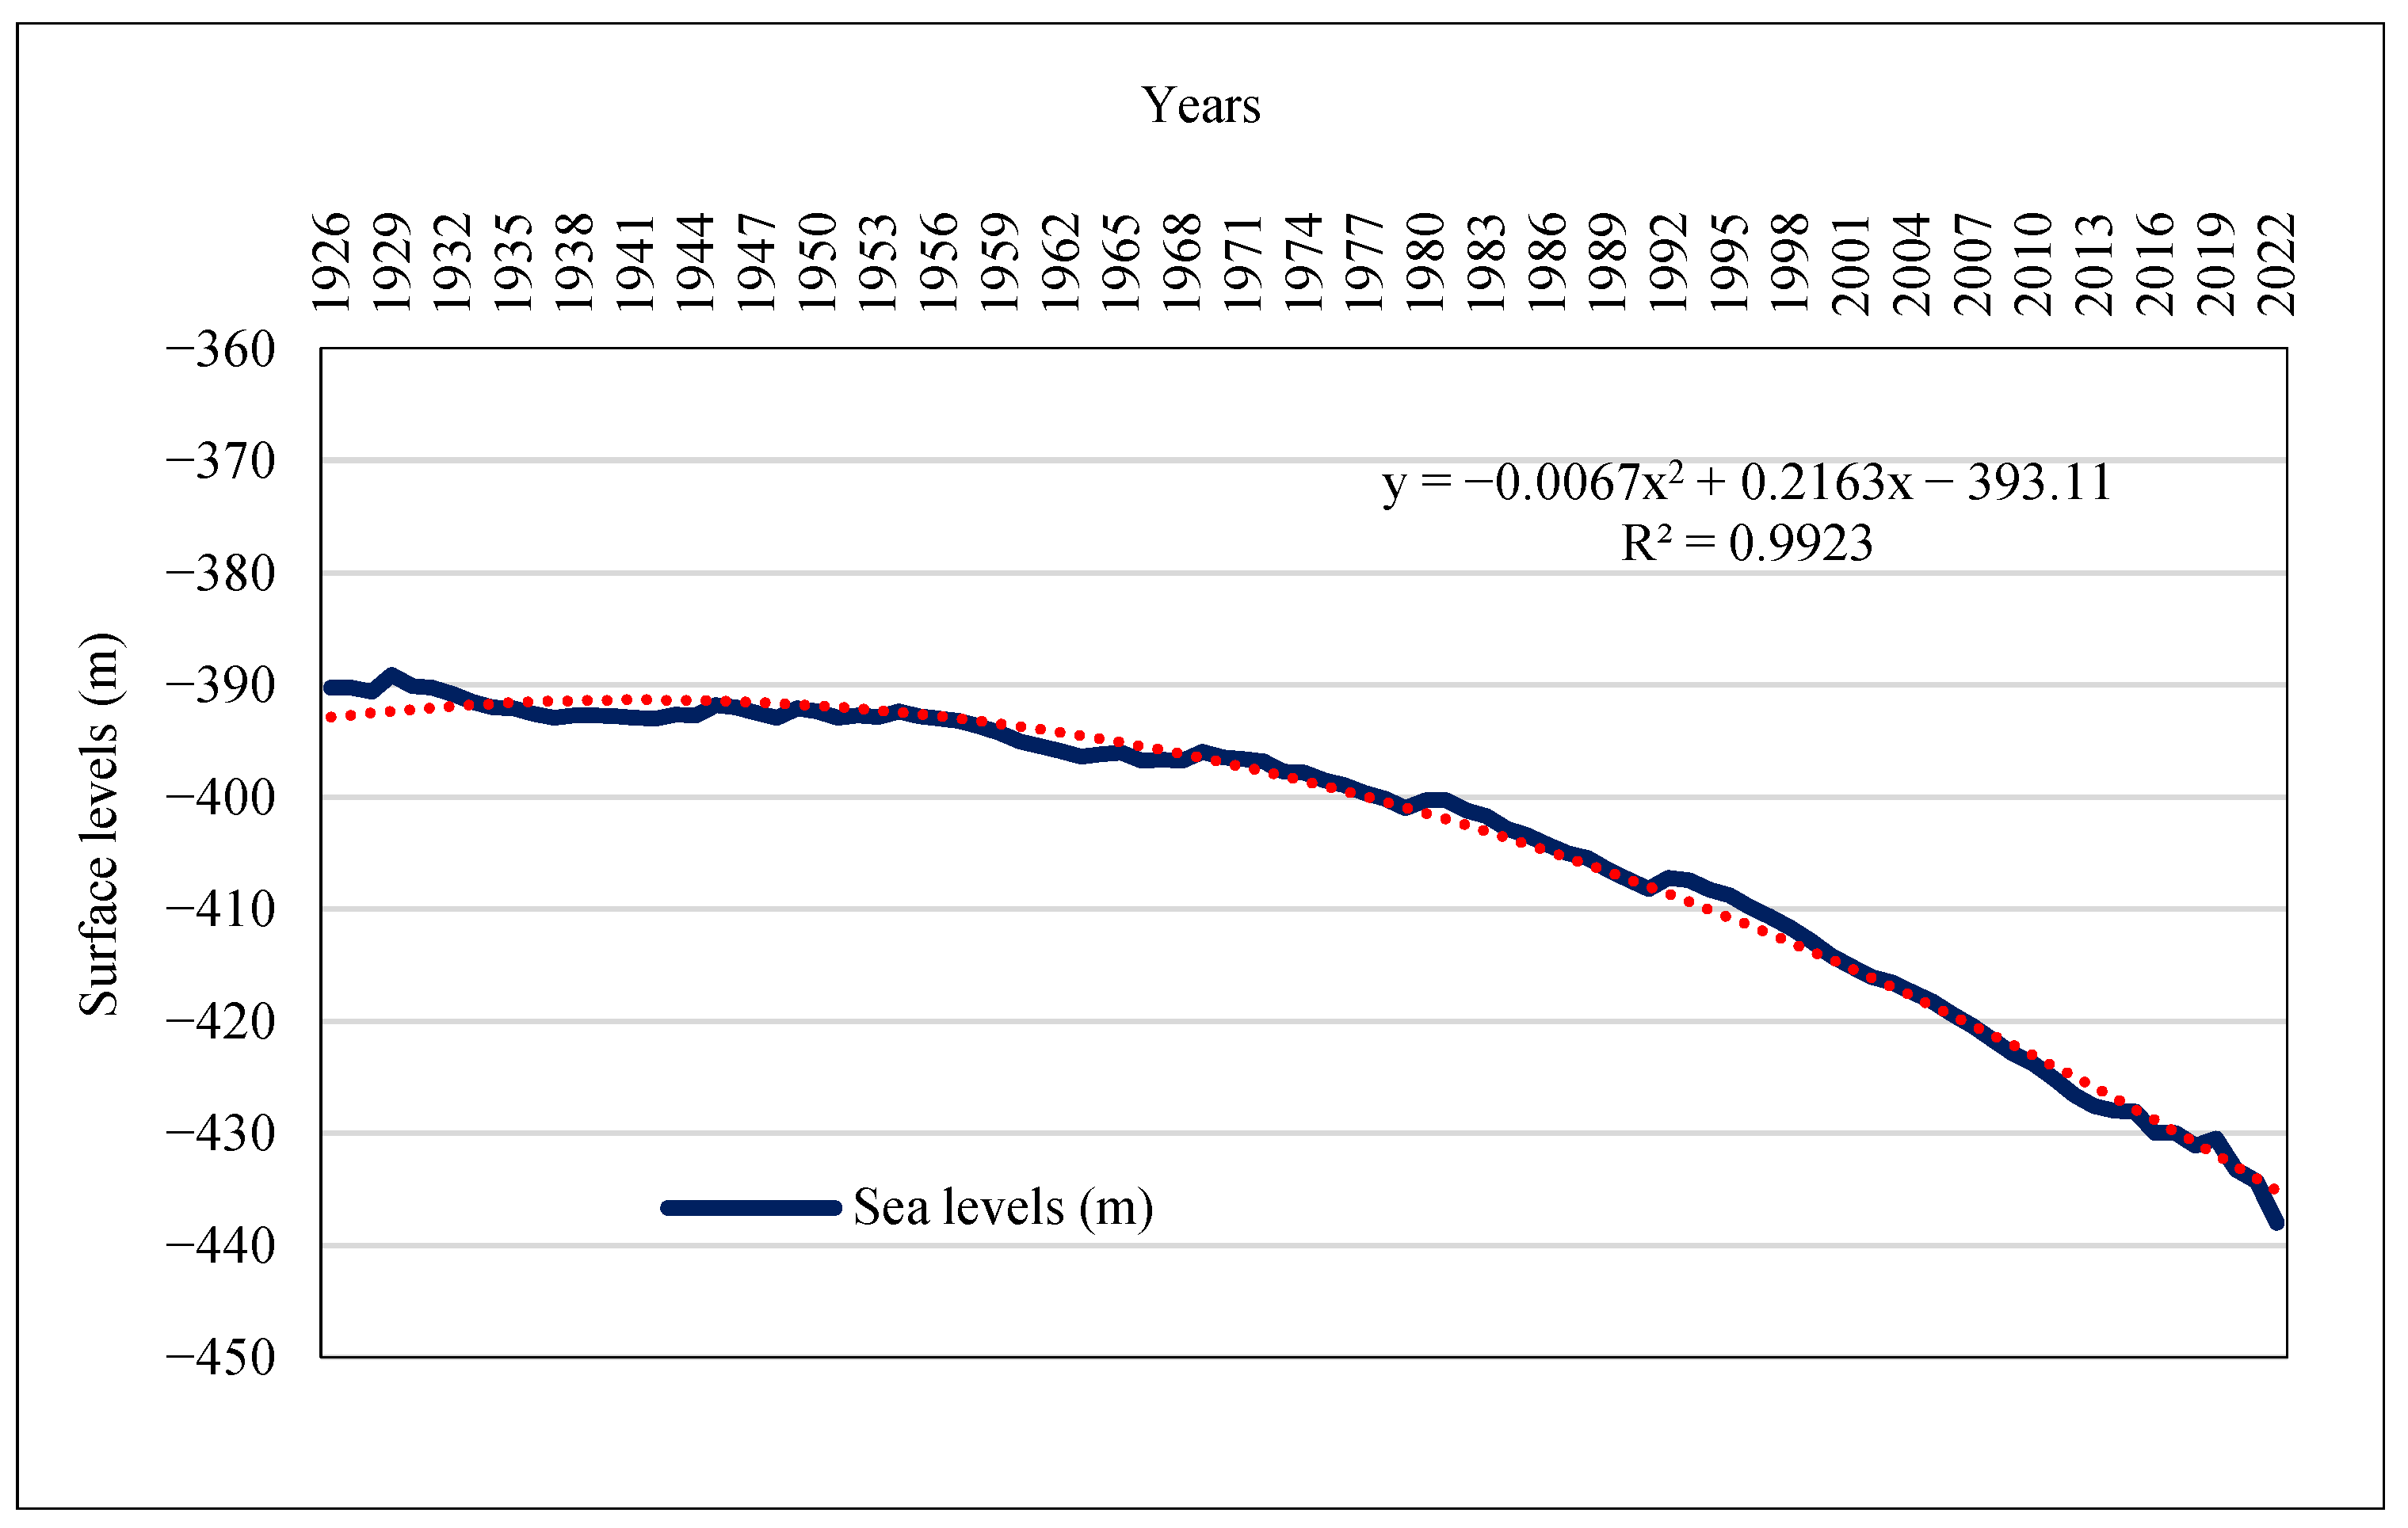
The prediction of the future Dead Sea level is a complex task requiring rigorous analysis. Sea level data spanning from 1926 to 2022, obtained from MWI [
42], were thoroughly examined. Through a regression analysis, a second-degree polynomial relationship was established, as shown in
Figure 11, resulting in an R
2 value of 0.99 and indicating the representativeness of the derived equation. Subsequently, this equation was applied to project the Dead Sea surface levels for 2034 and 2050.
To establish the relationships among the surface area, water level, and temperature of the Dead Sea, this study conducted Kendall’s statistical and regression analyses, and the results are summarized in
Table 8. Notably, it is evident that there is an inverse correlation between surface area and water levels over time. Conversely, there is a direct relationship between increasing temperature and time, as illustrated in
Figure 12. For the time spans from 2022 to 2034 and from 2022 to 2050, the sea level is expected to decrease by approximately 12.63 m and 33 m, respectively, and the surface area is expected to decrease by approximately 562.8 square kilometers and 536.3 square kilometers, respectively. These findings underscore the significant inverse relationships among surface area, water level, and temperature, as evidenced by R
2 values of 0.63 and 0.67, respectively. Notably, the relationship between the water level and temperature exhibited nonlinearity, with an R
2 value of 0.71. It is worth highlighting that from 2022 to 2050, the mean annual temperature is expected to increase by at least 1 °C.
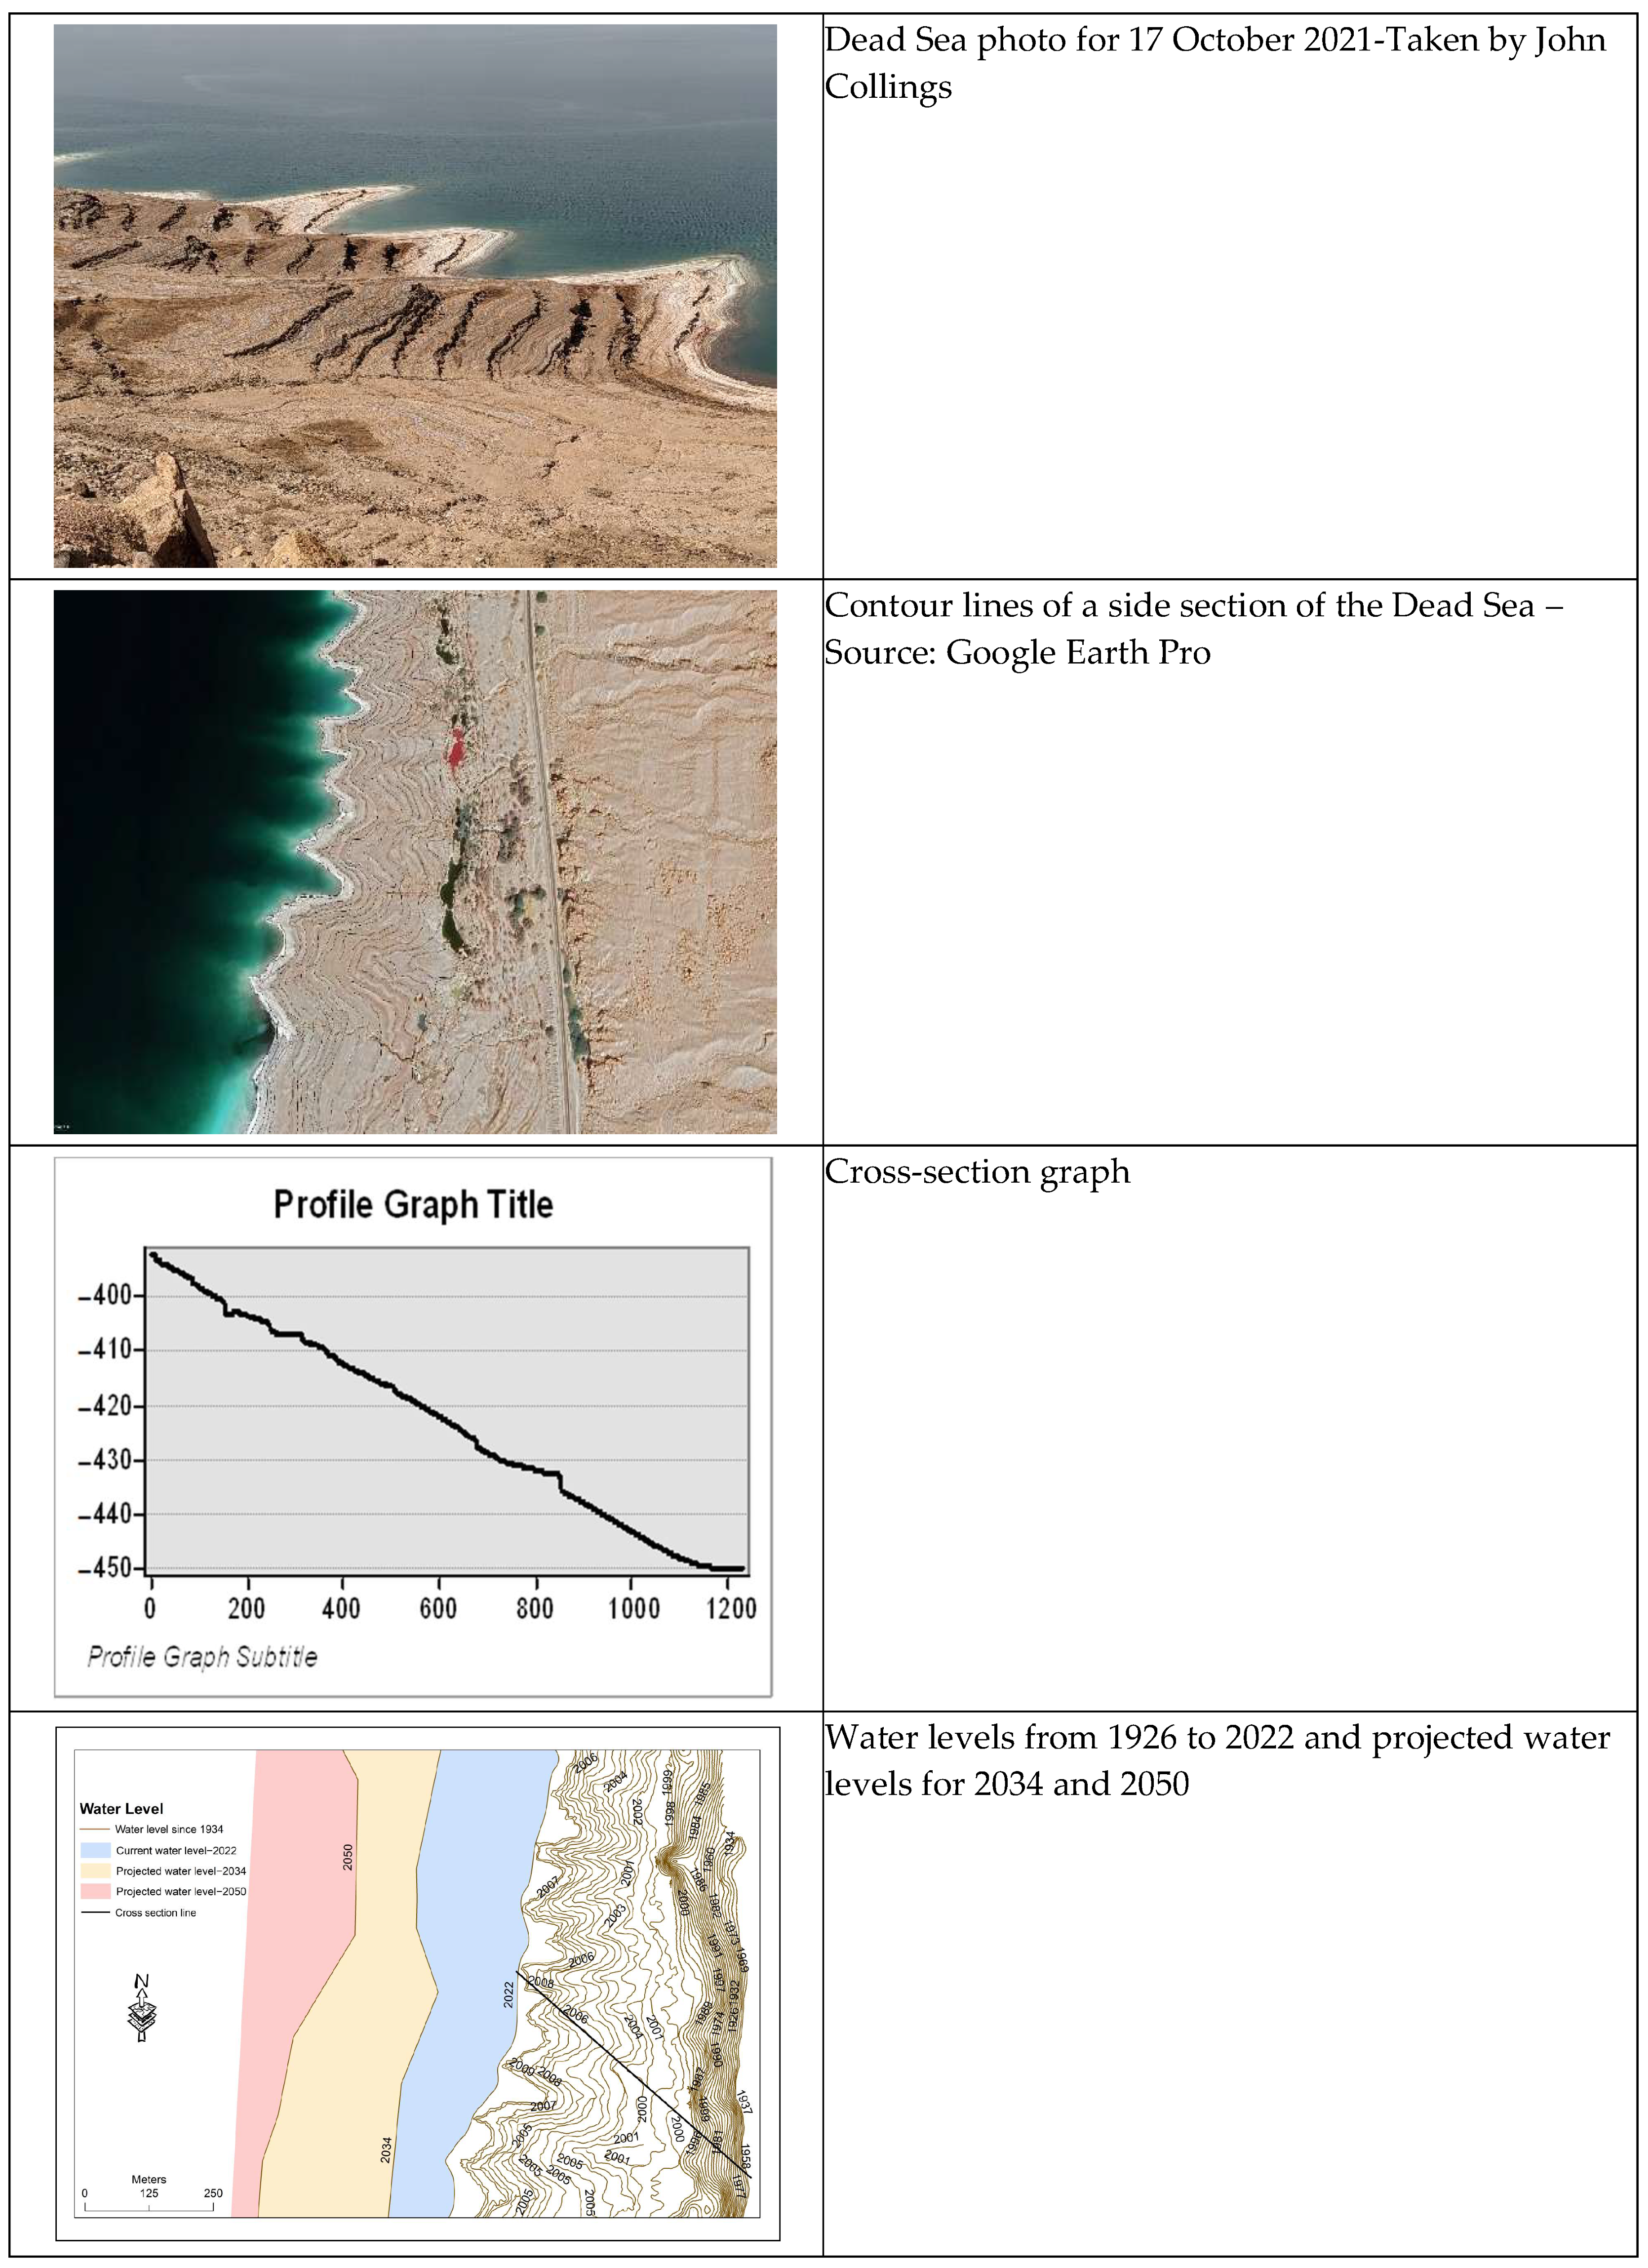
The orthophotography from a series of coastal cliffs along the Dead Sea shoreline clearly shows the degree of decline in the level of the Dead Sea. The distances between individual cliffs were digitized and mapped on Google Earth Pro (2024) (
Figure 13). Although we see the shape of the gradient occurring at the edges of the Dead Sea as a potential natural experiment for cliff formation, this indicates many differences among the actual processes, rates, and magnitudes between these cliffs and other cliffs that occur along seas and oceans.
The use of GIS is considered to be an effective tool in determining coastal areas and the limits of low water levels through the surface forms that later appear on the coastal borders, which are considered to be a multidimensional natural hazard, especially as sinkholes, as they have spatial dimensions [
70]. In addition, it is important to support spatial decision-making by building multicriteria models to identify areas that could experience a future decrease in surface water levels. Coastal boundaries have been created to show the extent of the decline in the surface water level of the Dead Sea since 1926, in addition to a possible decrease in 2034 and 2050.
4. Discussion
Due to climatic changes, the Dead Sea experienced several fluctuations during the Holocene. The recent and substantial decline in the Dead Sea’s water level, particularly since 1970, is primarily attributed to large-scale developments, including dam construction that captures freshwater inflows critical to the Dead Sea and extensive mineral extraction in its southern basin. This disruption has led to a pronounced imbalance between water inflows and the evaporation rate, resulting in a significant and rapid decrease in water levels. Estimates indicate that the surface level of the Dead Sea has dropped by over 30 m since the early 20th century. Predictive models suggest that, by 2034, the Dead Sea level will likely decline to approximately −450.6 m, with a further decrease to −471 m expected by 2050. Concurrently, the lake’s surface area is projected to shrink by 30 km2 by 2034 and by 56 km2 by 2050. This accelerated reduction in water levels has already led to various adverse environmental and socio-economic consequences.
Several previous studies have extensively investigated the decline of the Dead Sea water level and its associated environmental impacts using a variety of approaches, including field measurements, hydrological analyses, remote sensing, GIS, and numerical modeling. Salameh and El-Naser [
16] highlighted the critical imbalance between inflows and evaporation and emphasized the urgent need for restoration strategies to halt the ongoing decline. Abu Ghazleh et al. [
18] quantified the rapid shrinkage of the Dead Sea and proposed large-scale water transfer projects as possible mitigation measures. Ghatasheh and Faris [
72] and El-Hallaq and Habboub [
27] employed remote sensing and GIS techniques to monitor temporal variations in the Dead Sea surface area and water level, demonstrating the effectiveness of satellite imagery in detecting long-term changes. Al-Husban and Almanasyeh [
26] further linked water level decline to land-use and land-cover changes within the basin, emphasizing the influence of human interventions on hydrological processes.
In addition, Lensky and Dante [
71] documented the accelerated rate of recession of the Dead Sea and attributed much of the decline to anthropogenic water diversions and industrial activities. Kishcha et al. [
32] investigated thermal characteristics and surface temperature trends over the Dead Sea, revealing significant warming patterns that may contribute to enhanced evaporation rates. More recently, Oroud [
63] assessed the future fate of the Dead Sea under ongoing climatic and hydrological pressures and suggested that continued decline could dramatically alter the lake’s morphology and ecological functioning. Similarly, Tierney et al. [
13] examined long-term hydroclimatic variability affecting the Dead Sea Basin and demonstrated the importance of climate fluctuations in regulating water balance.
The findings of the present study are generally consistent with those reported in previous investigations, confirming the continued decline in both surface area and water level. Specifically, the magnitude of surface area reduction observed in this study is comparable to estimates reported by Ghatasheh et al. [
25] and El-Hallaq and Habboub [
27], although slightly higher due to the extended temporal coverage up to 2022. Similarly, the projected water-level decline of approximately 33 m by 2050 is in close agreement with projections by Oroud [
63], confirming the persistence of the negative water balance under current management conditions.
However, unlike some earlier studies that emphasized rainfall variability as a primary driver, the present findings indicate a relatively weak relationship between rainfall and surface area changes. This suggests that anthropogenic factors, particularly upstream water diversion and industrial extraction activities, play a more dominant role than previously assumed. These results therefore not only corroborate earlier findings but also refine the relative importance of controlling factors, highlighting the increasing influence of human interventions in recent decades. However, this study contributes additional value by integrating multi-decadal remote sensing observations, climate change projections (RCP4.5 and RCP8.5), and CA-Markov spatial modeling to provide future scenarios for both surface area and water levels up to 2050. The strong statistical relationships identified among temperature increases, reductions in surface area, and water-level declines provide further evidence that the future sustainability of the Dead Sea will depend on addressing both anthropogenic water withdrawals and climate-induced increases in evaporation.
The shrinking surface area of the sea has resulted in the formation of sinkholes along its shores, posing threats to human infrastructure, agriculture, and tourism. Furthermore, the Dead Sea’s high salt content has made it a unique natural phenomenon, and this popular tourist attraction is becoming increasingly concentrated as the water level decreases. This increased salinity can have various environmental implications, affecting ecosystems and potentially altering the balance of marine life. In summary, while the specific impacts of climate change on the Dead Sea are not fully understood, it is clear that the changing climate and human activities have contributed to the sea’s declining water level. Addressing these challenges requires a comprehensive approach that considers local and global factors, emphasizing sustainable water management and climate change mitigation efforts.
This study underscores the critical role of remote sensing in environmental monitoring and management. By analyzing data spanning multiple decades, researchers have elucidated long-term trends that would be challenging to discern through ground-based observations alone. This longitudinal perspective is crucial for understanding the cumulative impacts of human activities on sensitive ecosystems like the Dead Sea. Moreover, the study highlights the interconnectedness of regional water management policies and their global environmental repercussions. The Dead Sea’s decline is not merely a local issue but a symptom of broader challenges related to water scarcity and geopolitical tensions in the Middle East. Remote sensing offers policymakers a clear, data-driven basis for implementing sustainable water management strategies to mitigate further environmental degradation. Furthermore, the paper’s results underscore the urgency of international cooperation and innovation in water resource management. The Dead Sea’s unique ecosystem and cultural significance necessitate concerted efforts to reverse its decline. Remote sensing technologies provide a non-invasive, cost-effective means to monitor progress toward conservation goals and assess the effectiveness of restoration initiatives.
The study’s findings also prompt reflections on the socio-economic impacts of the Dead Sea’s shrinking surface area. Local communities dependent on the sea for tourism and mineral extraction face significant economic challenges. Understanding these socio-economic dynamics is crucial for devising inclusive strategies that balance conservation with sustainable development, ensuring equitable outcomes for all stakeholders. Lastly, the paper underscores the role of remote sensing in fostering interdisciplinary research collaborations. By integrating satellite imagery data with hydrological models and socio-economic analyses, researchers can develop holistic approaches to tackle complex environmental issues, such as the Dead Sea’s decline. This interdisciplinary framework is essential for generating actionable insights and informing evidence-based policies that safeguard natural resources and support regional stability.
5. Conclusions
This study provides a comprehensive assessment of the ongoing environmental degradation of the Dead Sea, driven by a complex interplay of anthropogenic water diversions, industrial mineral extraction, and climate-induced evaporation. By integrating multi-decadal remote sensing data, CA-Markov spatial modeling, and future climate projections (RCP 4.5 and RCP 8.5), the research offers critical insights into the lake’s future trajectory. Projections indicate an alarming and ongoing recession; by 2050, the water level is expected to plummet to approximately −471 m, accompanied by a reduction in surface area of 56 km2. The strong statistical correlation between rising temperatures and declining water levels underscores the profound impact of global climate change on this already fragile basin.
It has been demonstrated that mathematical modeling of level and area fluctuations is a useful method for predicting area changes. The probability analysis of transition classes indicated a projected decrease in the Dead Sea’s surface area of 5% to 9.5% by mid-century. By analyzing sea-level data for the period 1926–2022, a second-order polynomial regression model with a very high coefficient of determination (R2 = 0.99) was derived, indicating high accuracy in representing the historical downward trend and suggesting its reliability for predicting water levels in 2035 and 2050. Hydro-climatic Dynamics and Correlation Analysis: The results highlight the intersection of climatic factors with human activities. The statistical correlation (Kendall’s coefficient) indicates a strong inverse relationship between surface area and water level, on the one hand, and time, on the other. Conversely, a direct correlation was observed between rising temperatures and time, with the average temperature expected to increase by at least 1 °C by 2050.
However, based on the above findings, the Dead Sea’s future trajectory faces complex challenges that extend beyond the ongoing water deficit. These challenges include physical and hydrological constraints that could alter the rate of decline over time. Among the most prominent constraints are increasing salinity with declining water levels, which may modify evaporation rates and water properties, and the influence of basin bathymetry on the relationship between surface area and water level. Furthermore, future inflows from the Jordan River and adjacent basins, together with human interventions such as water transfer projects or reductions in industrial withdrawals, could either accelerate or slow the projected decline. Therefore, forecasting the future of the Dead Sea requires integrating climatic, hydrological, bathymetric, and human factors into more comprehensive dynamic models, rather than relying solely on the statistical extrapolation of historical trends.
These temperature changes, coupled with a 1.2 mm annual decrease in rainfall, will exacerbate evaporation rates and increase salinity, which is already among the highest globally (34%). Geomorphological Analysis and Coastal Hazards: The study revealed tangible physical effects of sea-level drop, documenting the gradation of coastal slopes using aerial imagery and Google Earth Pro. It is estimated that the sea level will drop by 12.63 m by 2034, bringing the total drop to approximately 33 m by 2050. This vertical retreat will expose large areas of land and alter surface features, thereby increasing the risk of sinkholes as a multidimensional natural hazard that threatens the geological stability of coastal areas. Geographic Information Systems and Decision Support: The study concludes that the importance of integrating Geographic Information Systems (GIS) with multicriteria models lies in identifying areas most at risk in the future. The digitization of coastal boundaries from 1926 to future projections for 2034 and 2050 provides a crucial analytical tool to support spatial decision-making. The study emphasizes that these transformations are not merely morphological changes but an ongoing environmental crisis that requires data-driven interventions to mitigate irreversible damage to vital infrastructure and economic sectors.
The severe environmental and socio-economic ramifications of this rapid shrinkage are already evident. The proliferation of coastal sinkholes and extreme hypersalinity presents imminent threats to local infrastructure, agriculture, tourism, and the region’s unique ecological balance. Furthermore, the socio-economic vulnerabilities of local communities reliant on the Dead Sea underscore the need to balance environmental conservation with sustainable economic development.
Ultimately, this study underscores the indispensable role of satellite imagery and interdisciplinary modeling in providing non-invasive, long-term environmental monitoring. The decline of the Dead Sea transcends local boundaries, manifesting as a broader geopolitical and water-scarcity challenge in the Middle East. Mitigating further degradation necessitates urgent international cooperation, evidence-based regional water management policies, and holistic restoration initiatives that address both local anthropogenic pressures and global climate change.






 ,
,