Article

Seasonal Variation in Elements in River Water and Reassessment of Environmental Impact in the Bor Mining Area, Eastern Serbia


by
Dragana Adamović Marković
1,*,
Nicoleta Sorina Nemeș
2,
Sanela Vasiljević
1,
Maria Mihailescu
2,
Ivan Svrkota
1,
Lidija Kalinović
1 and
Daniel Kržanović
1
1
Mining and Metallurgy Institute Bor, Alberta Ajnštajna 1, 19210 Bor, Serbia
2
Research Institute for Renewable Energies, The Polytechnic University of Timișoara, Gavril Musicescu Street 138, 300774 Timișoara, Romania
*
Author to whom correspondence should be addressed.
Water 2026, 18(12), 1414; https://doi.org/10.3390/w18121414
Submission received: 30 April 2026 / Revised: 4 June 2026 / Accepted: 5 June 2026 / Published: 9 June 2026
(This article belongs to the Section Water Quality and Contamination)

Abstract

This study evaluates the impact of long-term mining activities on stream surface waters in the Danube Basin in eastern Serbia. Seasonal variations in water chemistry were investigated during three hydrological periods to assess current contamination levels and temporal changes following recent environmental protection measures. The highest element concentrations were recorded during the autumn low-flow period. In contrast, the lowest concentrations occurred during the snowmelt season, indicating a strong influence of seasonal hydrological conditions on contaminant distribution. In streams located downstream of mining facilities, element concentrations were additionally controlled by anthropogenic inputs associated with mining activities. Elevated concentrations of SO42− (1054 mg/L), Cu (393 µg/L), and Mn (2064 µg/L) were detected compared with background values characteristic of non-contaminated streams (e.g., SO42−~100 mg/L, Cu~20 µg/L, and Mn~20 µg/L). Recent environmental protection measures, including the neutralization of mining wastewater before discharge into rivers, have substantially reduced contamination levels. Compared with historical periods when untreated wastewater was directly discharged into river systems, concentrations of Fe, As, Cu, and Mn decreased by approximately 2650-, 900-, 740-, and 6-fold, respectively. In contrast, sulfate concentrations remained relatively unchanged, indicating persistent mining-related pollution and suggesting sulfate as a reliable indicator of contamination in similar mining environments. Overall, the results demonstrate partial recovery of the aquatic system and improved water quality over time; however, elevated concentrations of SO42−, Mn, and Cu indicate ongoing environmental impacts of mining activities and highlight the need for long-term environmental monitoring and management.

1. Introduction

The study area is located within the Bor copper mining region in Eastern Serbia. Mining in this region has played a significant role in the history of European civilization [1,2,3,4]. Modern and organized mining activities in Bor began in 1903, when a French company opened the mine [5,6]. After World War II, the mining company became state-owned [7]. The enterprise remained under state ownership until December 2018, when a Chinese company acquired it. Mining operations continue today, and the industry remains the main economic activity in this part of the country [7,8].
Although mining represents an important economic pillar in the study area, the environment surrounding the Bor mining complex and public health have suffered severe consequences from mining activities, as is the case in many mining regions worldwide [9,10,11,12]. Environmental pollution in the vicinity of Bor has been extensively documented, with numerous studies reporting contamination of air, soil, groundwater, and surface water in Eastern Serbia. Šerbula et al. (2021) identified air pollution in the Bor area as an environmental hotspot in Serbia [13]. Research on the sources of air pollution in the study area indicates that industrial dust, copper smelter emissions, and tailings dust contribute most significantly to environmental degradation [14]. Polluted air contains heavy metals and arsenic, which pose serious risks to human health [14,15,16,17]. Elevated concentrations of heavy metals in plants further indicate substantial soil contamination [18,19,20]. In addition, groundwater contamination with sulfates and potentially toxic elements associated with mining activities has also been reported [21,22].
Extensive investigations of surface waters in Eastern Serbia have revealed high levels of contamination downstream from mining sites. Surface waters directly affected by mining activities contain extremely high concentrations of heavy metals and arsenic, accompanied by very low pH values (approximately 2) [23,24]. Surface water systems are highly sensitive to anthropogenic pressures, particularly those related to mining operations. The release of potentially toxic elements, such as iron, copper, manganese, arsenic, and sulfates, can substantially alter river water chemistry and pose serious risks to aquatic ecosystems and human health. Therefore, continuous water monitoring and contamination risk assessment are essential for protecting the local population from waterborne health hazards. Various approaches have been developed to assess surface water quality and the environmental impacts of anthropogenic activities. Among them, Water Quality Index (WQI) methods are widely used because they integrate multiple physicochemical parameters into a single indicator, enabling easier interpretation of spatial and temporal variations in water quality. Previous studies have successfully applied indices such as the Iranian Water Quality Index (IRWQI) to evaluate changes in river water quality at sequential monitoring stations and to identify areas affected by anthropogenic pressures [25]. These approaches provide useful tools for water resource management and environmental assessment. However, in mining-affected river systems, detailed analyses of individual chemical parameters remain essential due to the complex behavior of potentially toxic elements and strong seasonal variations in contaminant transport.
A combination of natural processes and anthropogenic influences controls spatial and temporal variations in river water quality. Hydrological conditions, including precipitation, snowmelt, river discharge, and seasonal dilution effects, strongly affect the transport, mobility, and concentration of dissolved elements in surface waters. In mining-affected environments, spatial variations in water chemistry are additionally influenced by the proximity of pollution sources, wastewater discharge, tailings deposits, and geochemical interactions between contaminated water and surrounding geological materials. Previous studies have demonstrated that sequential monitoring along river systems provides valuable insight into the dynamics of pollutant transport and the identification of contamination hotspots [26]. Furthermore, temporal analyses are essential for understanding seasonal fluctuations in pollutant concentrations and evaluating the effectiveness of environmental remediation measures.
Adamović et al. (2021) suggested that implementing appropriate countermeasures, including artificial neutralization of wastewater from metallurgical facilities and reducing wastewater discharge from flotation tailings and overburden deposits, could significantly improve river water quality in the Bor mining area [24]. Following the change in company ownership, wastewater management practices were modified, and acidic wastewater began to be neutralized before discharge into the river system. These changes were introduced in early 2022, when smelter operations were temporarily suspended, and a wastewater neutralization plant was constructed.
Such remediation measures may substantially alter the hydrochemical characteristics of mining-affected rivers over time. However, the extent of contamination is not constant and may vary considerably depending on seasonal hydrological conditions. Therefore, long-term monitoring and comparisons between periods of intensive pollution and periods following environmental improvements are essential for evaluating the effectiveness of remediation measures and understanding recovery processes in aquatic systems affected by mining activities.
Despite the extensive body of research addressing environmental pollution in the Bor mining region, several important knowledge gaps remain. Most previous studies were conducted during periods of intensive mining-related pollution and before the implementation of recent wastewater treatment and neutralization measures introduced after 2022. Consequently, there is still insufficient information regarding the current status of river water quality under the new environmental management regime. Furthermore, limited attention has been paid to seasonal variations in water chemistry following the implementation of remediation measures, despite the strong influence of hydrological conditions on contaminant mobility and dilution. In addition, comparative assessments between historical periods of severe contamination and recent environmental conditions remain scarce. Therefore, the recovery potential and current ecological state of mining-affected river systems in the Bor region remain poorly understood. For this reason, the present study aims to investigate seasonal variations in selected chemical parameters of river water, evaluate the current status of contamination in a mining-affected river system, and assess temporal changes in river water pollution following recent environmental management improvements. Particular emphasis is placed on comparing historical data from periods of severe contamination with recent measurements reflecting improved environmental conditions. The findings of this study are expected to contribute to a better understanding of aquatic ecosystem recovery processes and provide a scientific basis for future water quality management strategies in mining-affected regions.

2. Materials and Methods

2.1. Study Area

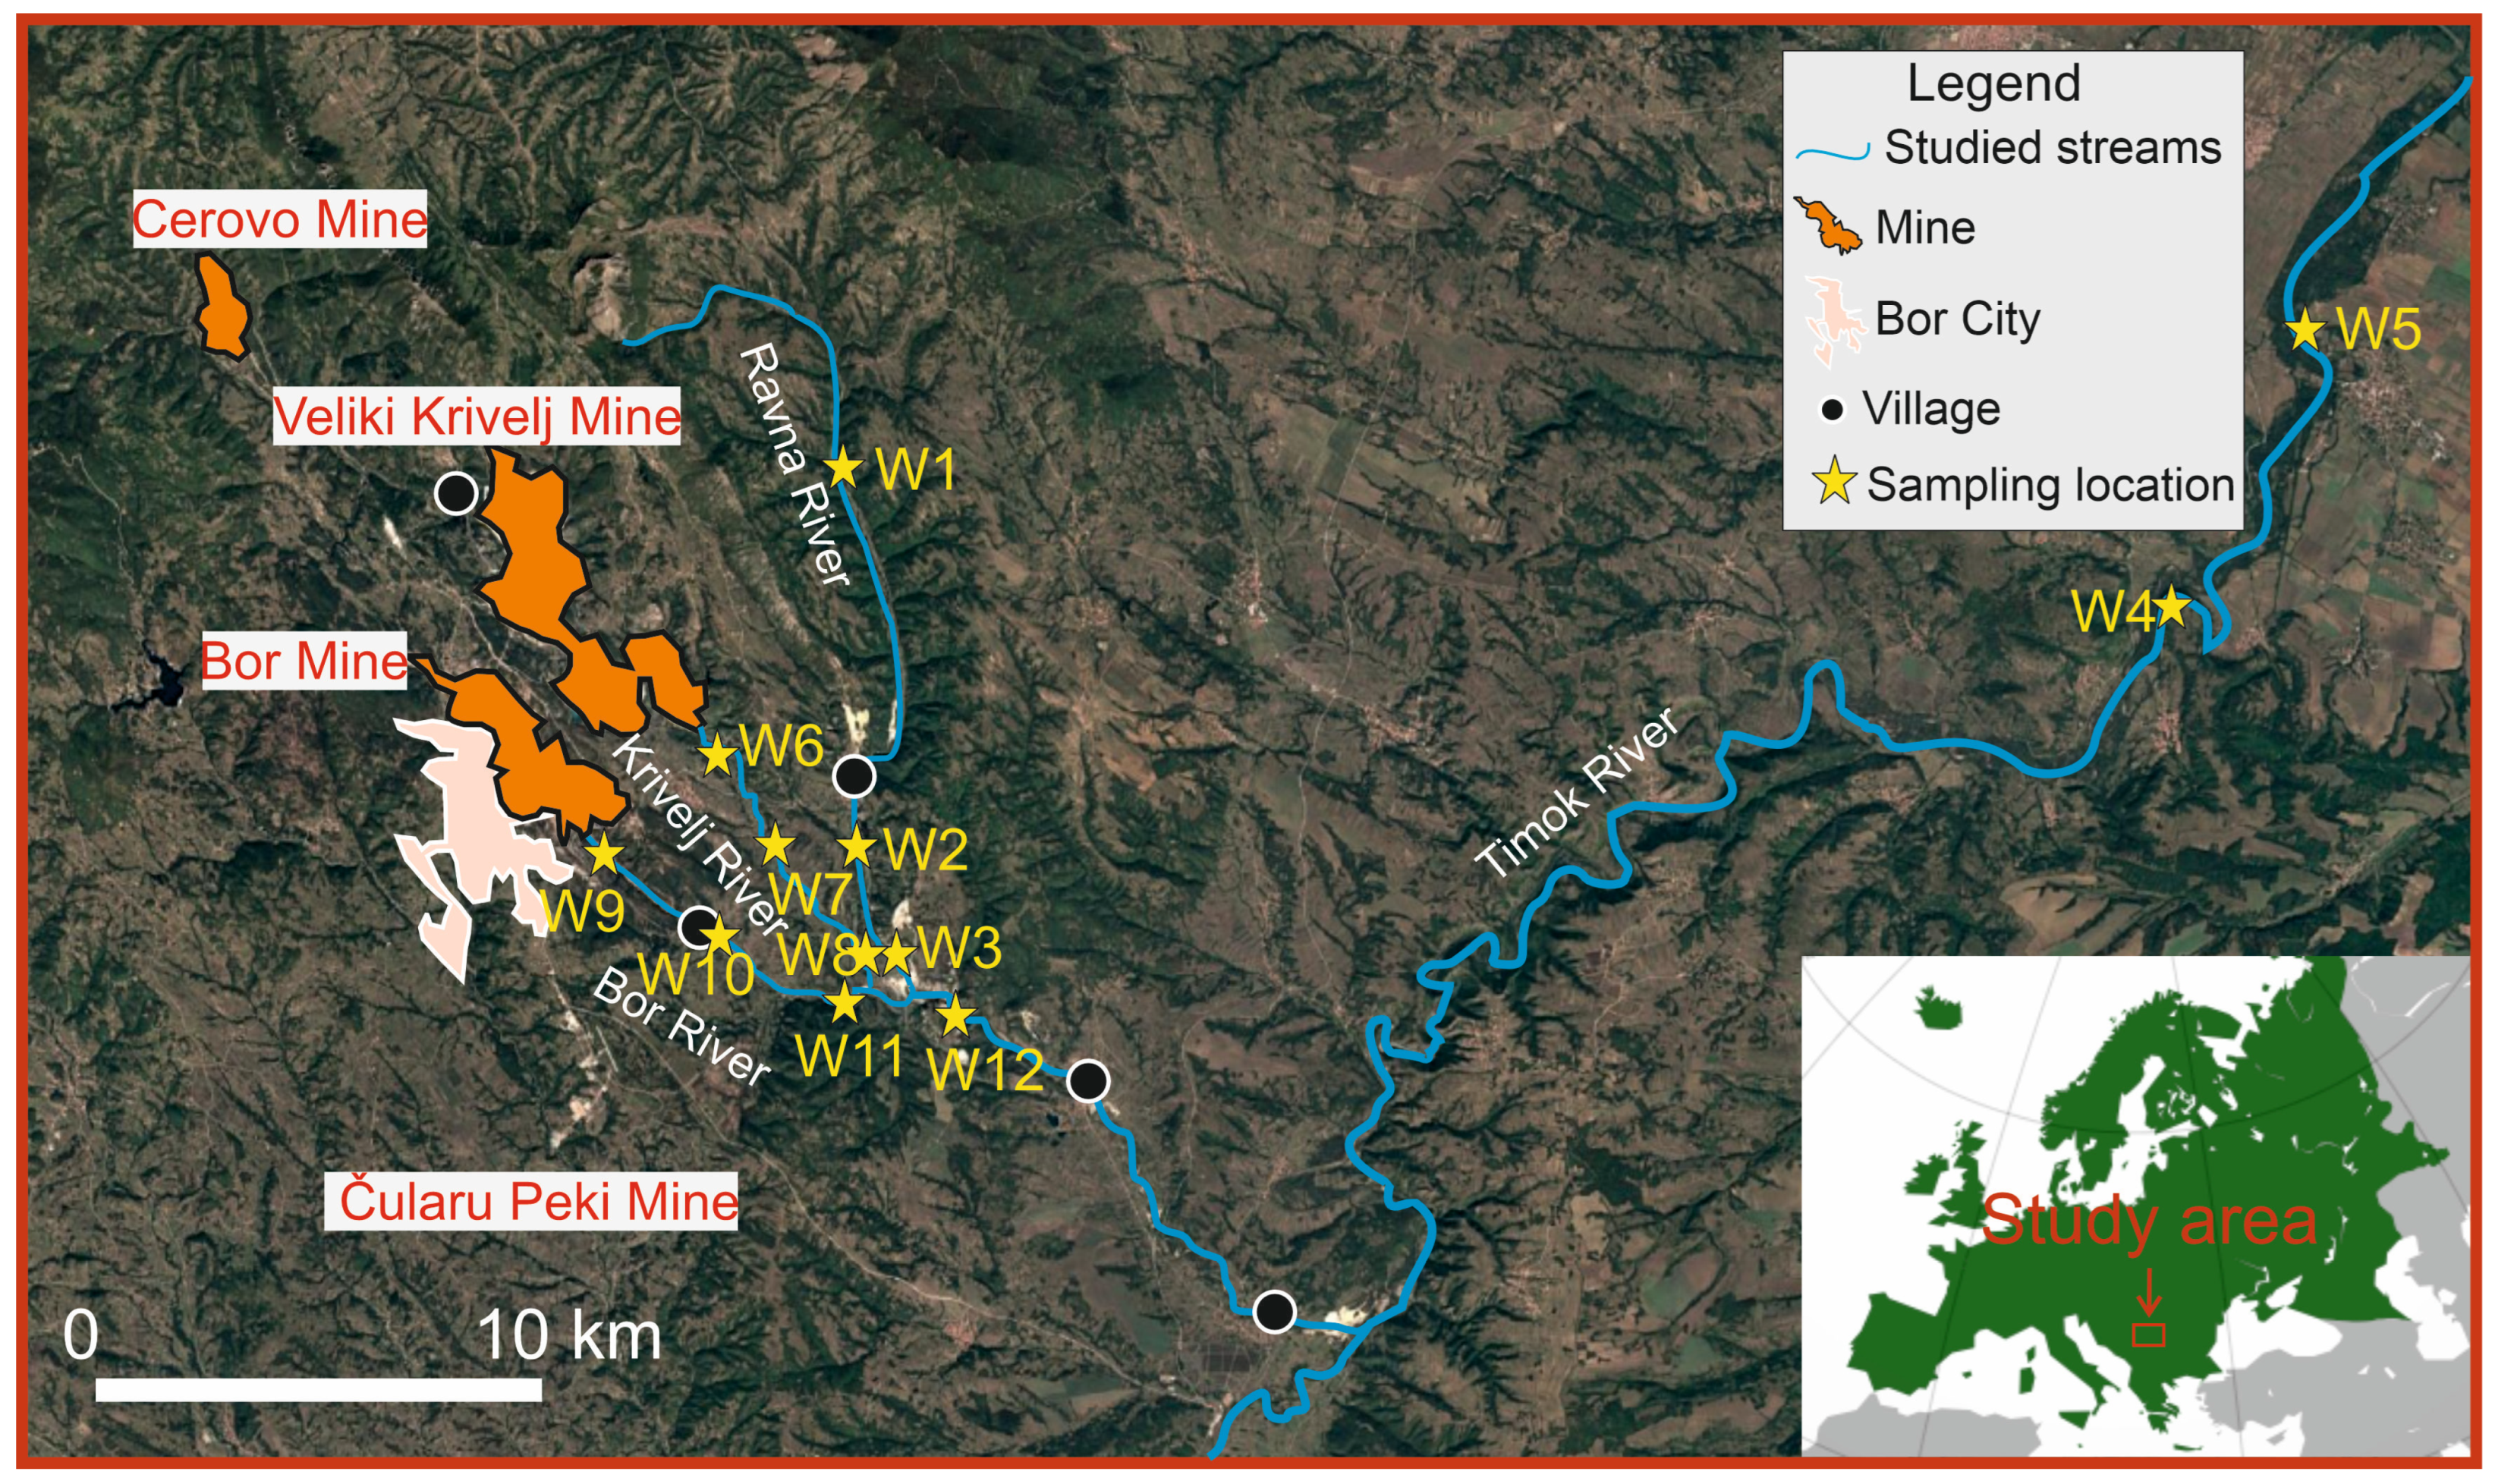
The study area is located in Eastern Serbia, on the Balkan Peninsula in south-eastern Europe. Mountain terrains characterize the zone. From the geological point of view, Eastern Serbia belongs to the Carpathian-Balkan belt, which is one of the world’s oldest mining areas [27]. The geological setting of the study area has been previously presented by Adamović et al. (2022) [21]. Several mines are located in this area, among which are the Bor and Veliki Krivelj mines (Figure 1). The Bor and Veliki Krivelj mines host porphyry copper deposits. The Bor mine has been operating continuously for more than 120 years. In the vicinity of the Bor mine, on the very edge of the Bor City, there are mining facilities, including a smelter. It is known that these mines have hurt the environment for several decades, making the air, riverbed sediments, and water among the most polluted in this part of Europe [28,29,30,31].
Downstream from the mines, rivers receive wastewater from mining activities. Water from the Bor mine and its facilities flows into the Bor River. Until a few years ago, wastewater from the Veliki Krivelj mine flowed into the Krivelj River. Today, that water has been diverted and also flows into the Bor River. The Krivelj River’s bed still exists and receives water primarily from precipitation. The Bor and Krivelj rivers join approximately 10 km downstream of the wastewater discharge point, forming the Bela River. After 500 m of confluence, the Ravna River, which flows from an unpolluted environment, flows into the Bela River. The Bela River later flows into the Timok River, one of the Danube River’s larger tributaries (Figure 1). Rivers in the study area exhibit their highest average flows in March and April, during the snow-melting season, and their lowest flows in September and October, which is characteristic of rivers in Central Europe’s rain-snow regime [32,33].

2.2. Sampling and Analysis

For this study, twelve locations were selected (W1–W12). The sampling sites are shown in Figure 1. Samples were collected on three occasions: in June and July 2025, in October and November 2025, and at the end of February 2026. These campaigns represented the summer, autumn, and winter seasons, respectively. The winter sampling was conducted during late winter, under snowmelt conditions in the catchment. The total number of surface water samples collected in the study area was 32 because sampling was not possible at locations W4 and W5 in the summer and at locations W7 and W8 in the autumn. The water samples are grouped into three categories, i.e., river water flowing from the mountain area without mining activities (W1, W2, W3), water of the Timok River, a tributary of the Danube River and the receiving water body for the Bela River located downstream the mines (W4, W5), and river water samples from the mining area (W6, W7, W8, W9, W10, W11, W12) (Figure 1). By sampling water in these different areas, it will be possible to present results for two environments: background concentrations of parameters in river water and concentrations of the same parameters in polluted river water.
Surface water samples were collected from the selected sampling locations in accordance with ISO 5667-6 for river and stream water sampling [34]. Before sampling, polyethylene bottles were thoroughly cleaned and rinsed with a diluted solution of ultrapure nitric acid. Samples intended for metal and arsenic analysis were acidified on-site to prevent precipitation. All samples were stored at 4 °C and transported to the laboratory under cooled conditions, in accordance with the ISO 5667-3 recommendations for sample preservation, handling, and storage prior to chemical analysis [35].
During the field survey, in situ measurements of pH, electrical conductivity, and water temperature were conducted. As well as the coordinates of sampling sites using GPS. pH and electrical conductivity (EC) were measured using a hand-held pH/EC meter (914 pH/conductometer, Metrohm, Herisau, Switzerland).
Chemical analyses, including Ion Chromatography (IC), Inductively Coupled Plasma Optical Emission Spectrometry (ICP-OES), and Inductively Coupled Plasma-Mass Spectrometry (ICP-MS), were performed in the laboratory of the Mining and Metallurgy Institute Bor, Serbia. Non-acidified water samples were analyzed for anions (SO42−, Cl, NO3) using Ion Chromatography (940 Professional IC Vario MagIC, Metrohm, Herisau, Switzerland). The samples used for the determination of major elements (Na, K, Mg, Ca) and trace elements (Cu, As, Fe, Mn, Zn, Cd) were acidified by adding concentrated ultrapure nitric acid, and then analyzed by Inductively Coupled Plasma Optical Emission Spectrometry (ICP-OES, Agilent 5800, Santa Clara, CA, USA) and inductively coupled plasma-mass spectrometry (ICP-MS, Perkin Elmer NexION 1000, Shelton, Washington, DC, USA), respectively. Blanks were run to verify that conditions were clean and uncontaminated. Certified reference materials were used to verify the accuracy of the results. The accuracies for all measured parameters were estimated to be within ±5%. In this way, precise and satisfactory results are ensured.
Historical data from 2015 were obtained from a previous monitoring campaign. Although comparable sampling and analytical methodologies were applied, the analyses were conducted in a different accredited laboratory. The analytical procedures used in 2015 were characterized by different limits of detection (LODs) and an analytical accuracy of ±4%.
Statistical analysis of the data was performed using the paired t-test. The paired t-test is a parametric statistical method used to evaluate whether the mean difference between two dependent datasets differs significantly from zero. This statistical method is suitable for repeated measurements from the same sampling sites over time. The paired t-test is widely used in environmental and hydrochemical studies to assess changes in water quality parameters between different monitoring periods [36]. A paired t-test was applied because the samples were collected from the same sampling locations during two different monitoring periods, thereby forming naturally related pairs of observations [37]. This approach allows the comparison of temporal changes while minimizing the influence of spatial variability between sampling sites. Differences were considered statistically significant at p < 0.05. In addition, the percentage reductions in selected parameters were calculated to quantify the magnitude of changes between the investigated periods using the standard reduction formula. All statistical analyses were performed using Excel (Professional Plus 2021, Version 2108).

3. Results

3.1. Characteristics of River Water

A summary of the physical and chemical parameters, including pH, EC, sulfate, and trace element concentrations in river water samples, is presented in Table 1. For the purposes of determining the type of surface water, in addition to the mentioned parameters, Na, K, Mg, Ca, and Cl were analyzed from the samples collected in the winter season.
The river water collected in the Ravna River (W1, W2, W3) flowing through the unpolluted area was transparent and odorless. The water sampled in the Timok River (W4, W5) had the same properties as the water in the Ravna River. The river water collected from the Krivelj River (W6, W7, W8) was also colorless and odorless, but unlike the Ravna River and Timok River, it contained an orange precipitate in the upper course (W6). On the other hand, the color of the Bor River (W9, W10, W11) ranged from brown to grey. At the same time, the Bela River (W12) was achromatic grey. The color of the Bor and Bela rivers did not change throughout the seasons.
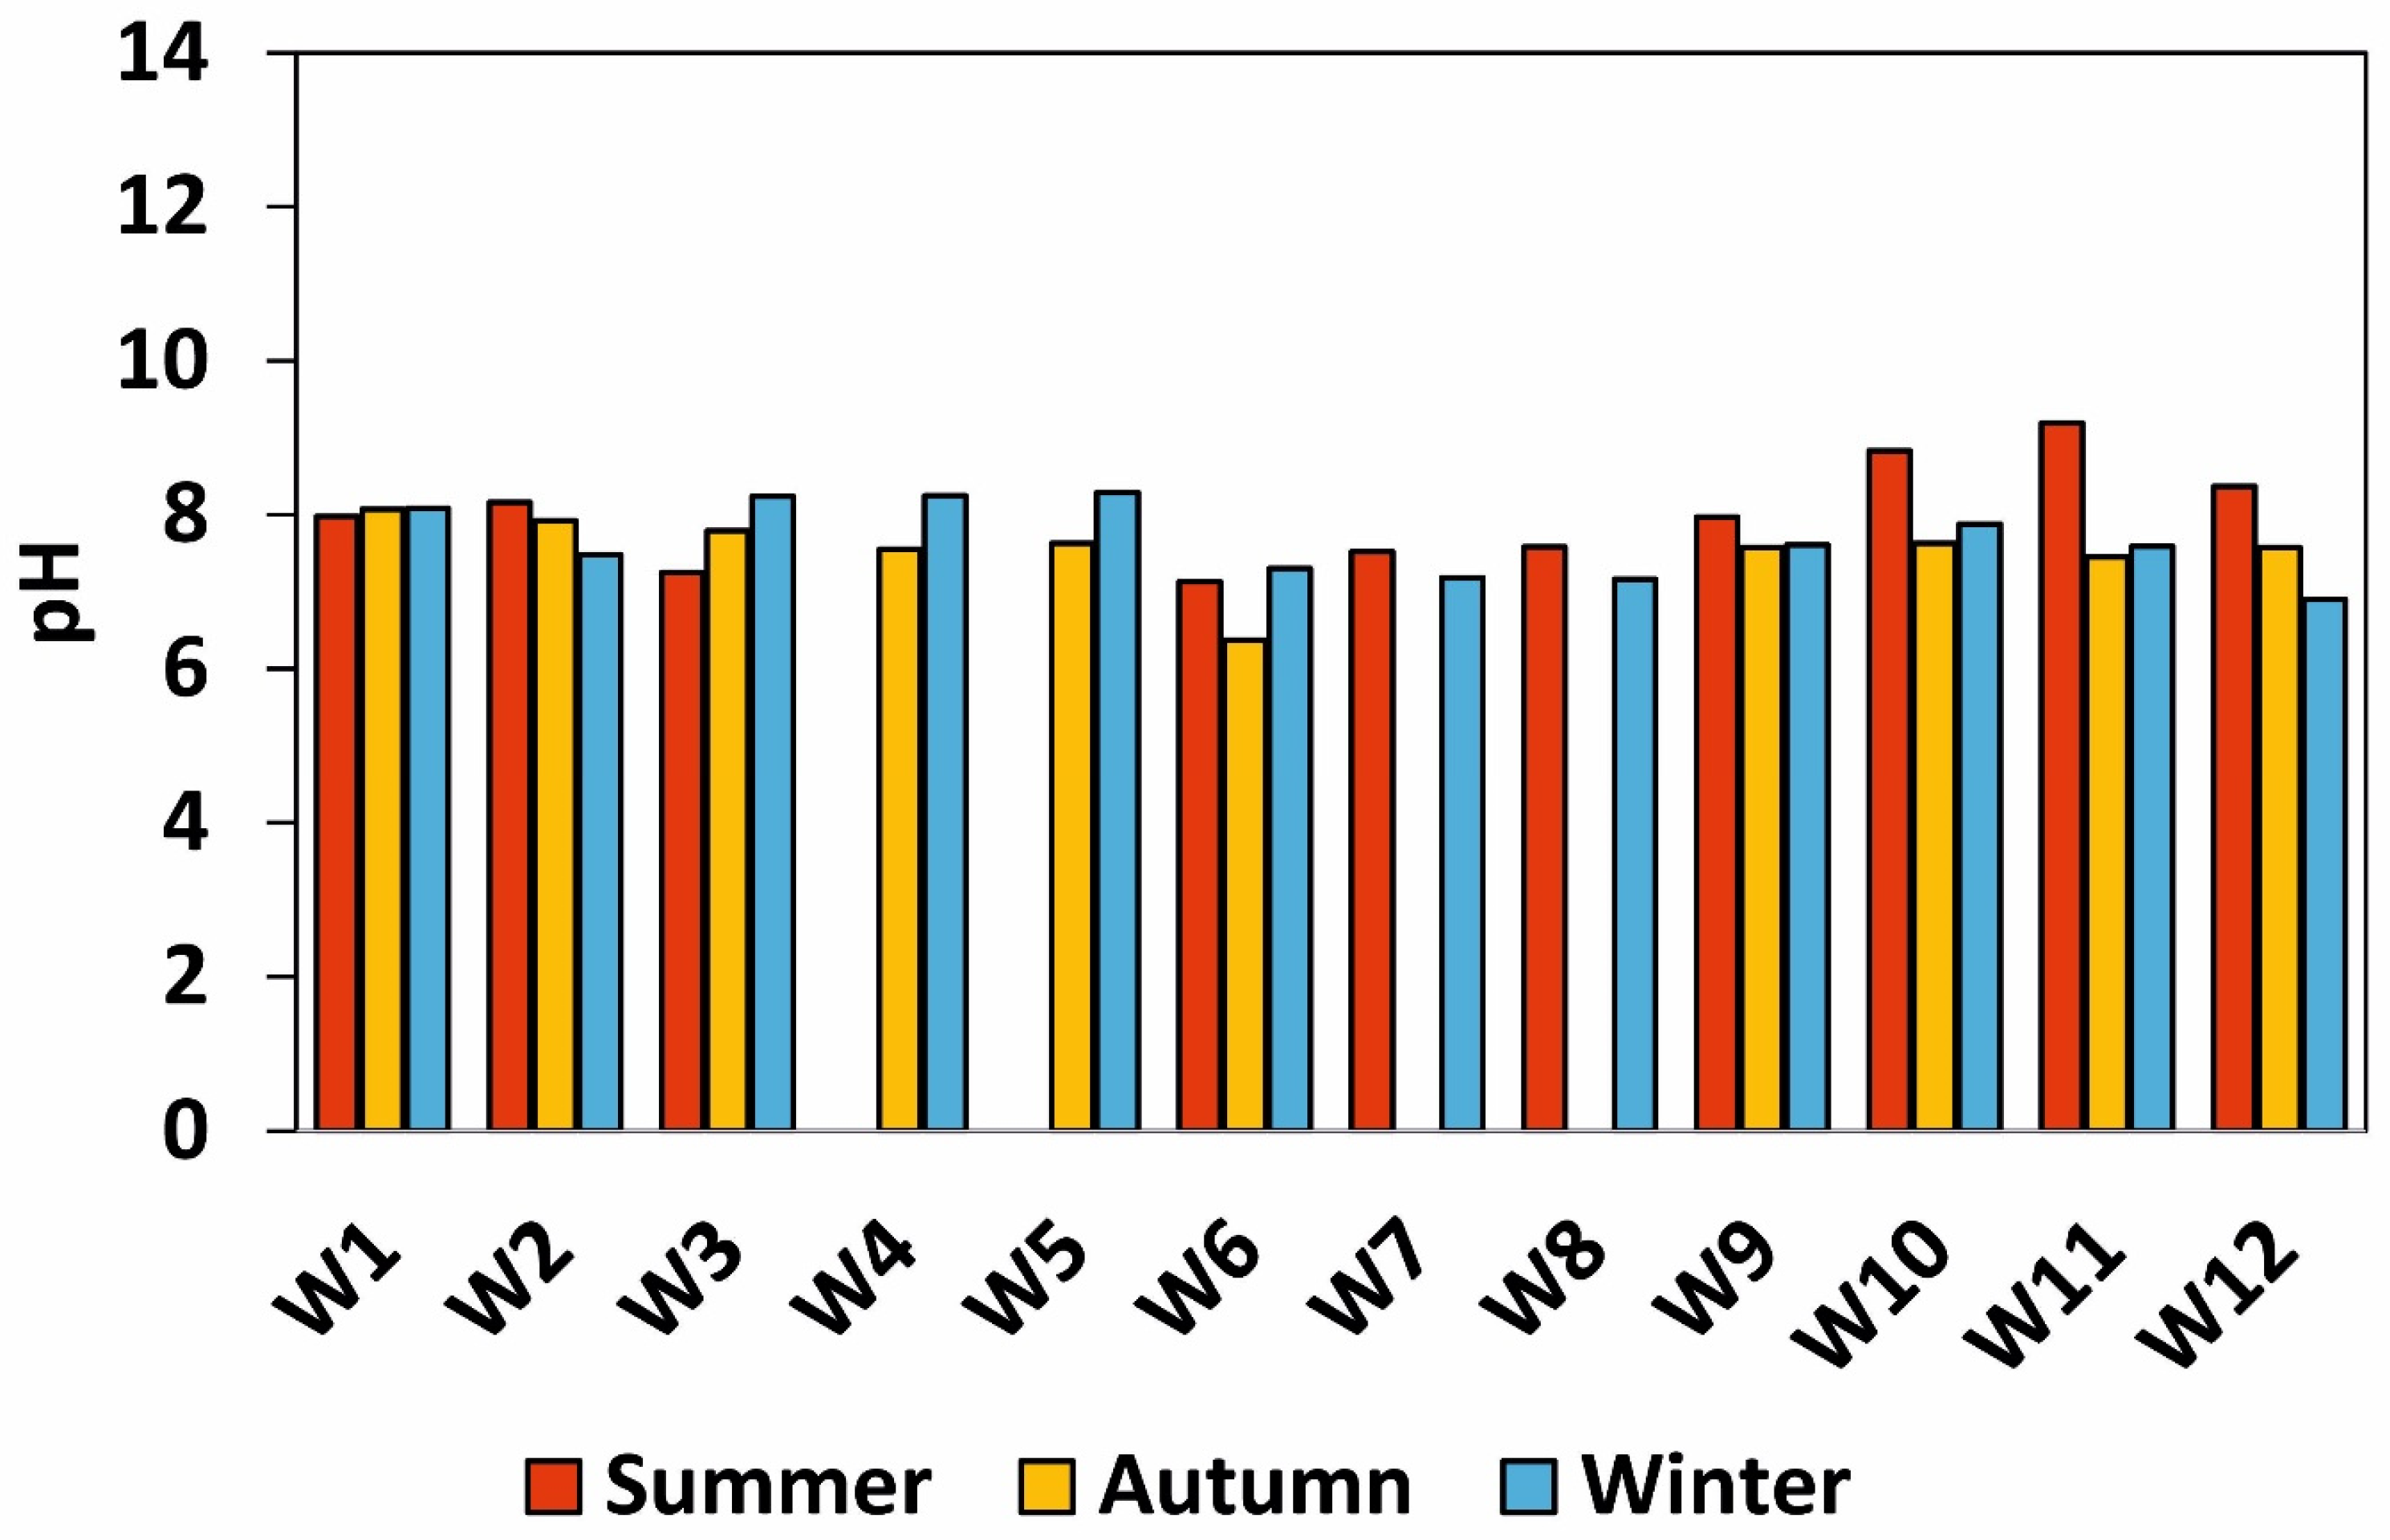
The pH value of the river water in the study area varied from 7.13 to 9.19 in the summer season, from 6.37 to 8.07 in the autumn season, and from 6.90 to 8.29 in the winter season (Figure 2). The pH value measured in the Bor River (W10 and W11) during the field work in the summer season exceeds 8.5, which places this water in the fifth category prescribed in the Regulation on Limit Values of Pollutants in Surface Waters [38]. Although the pH of the Krivelj River (W6) in autumn was below 6.50 (6.37), the water was still in the fifth category. During the winter season, the pH values did not exceed the limits that would classify the water as bad.
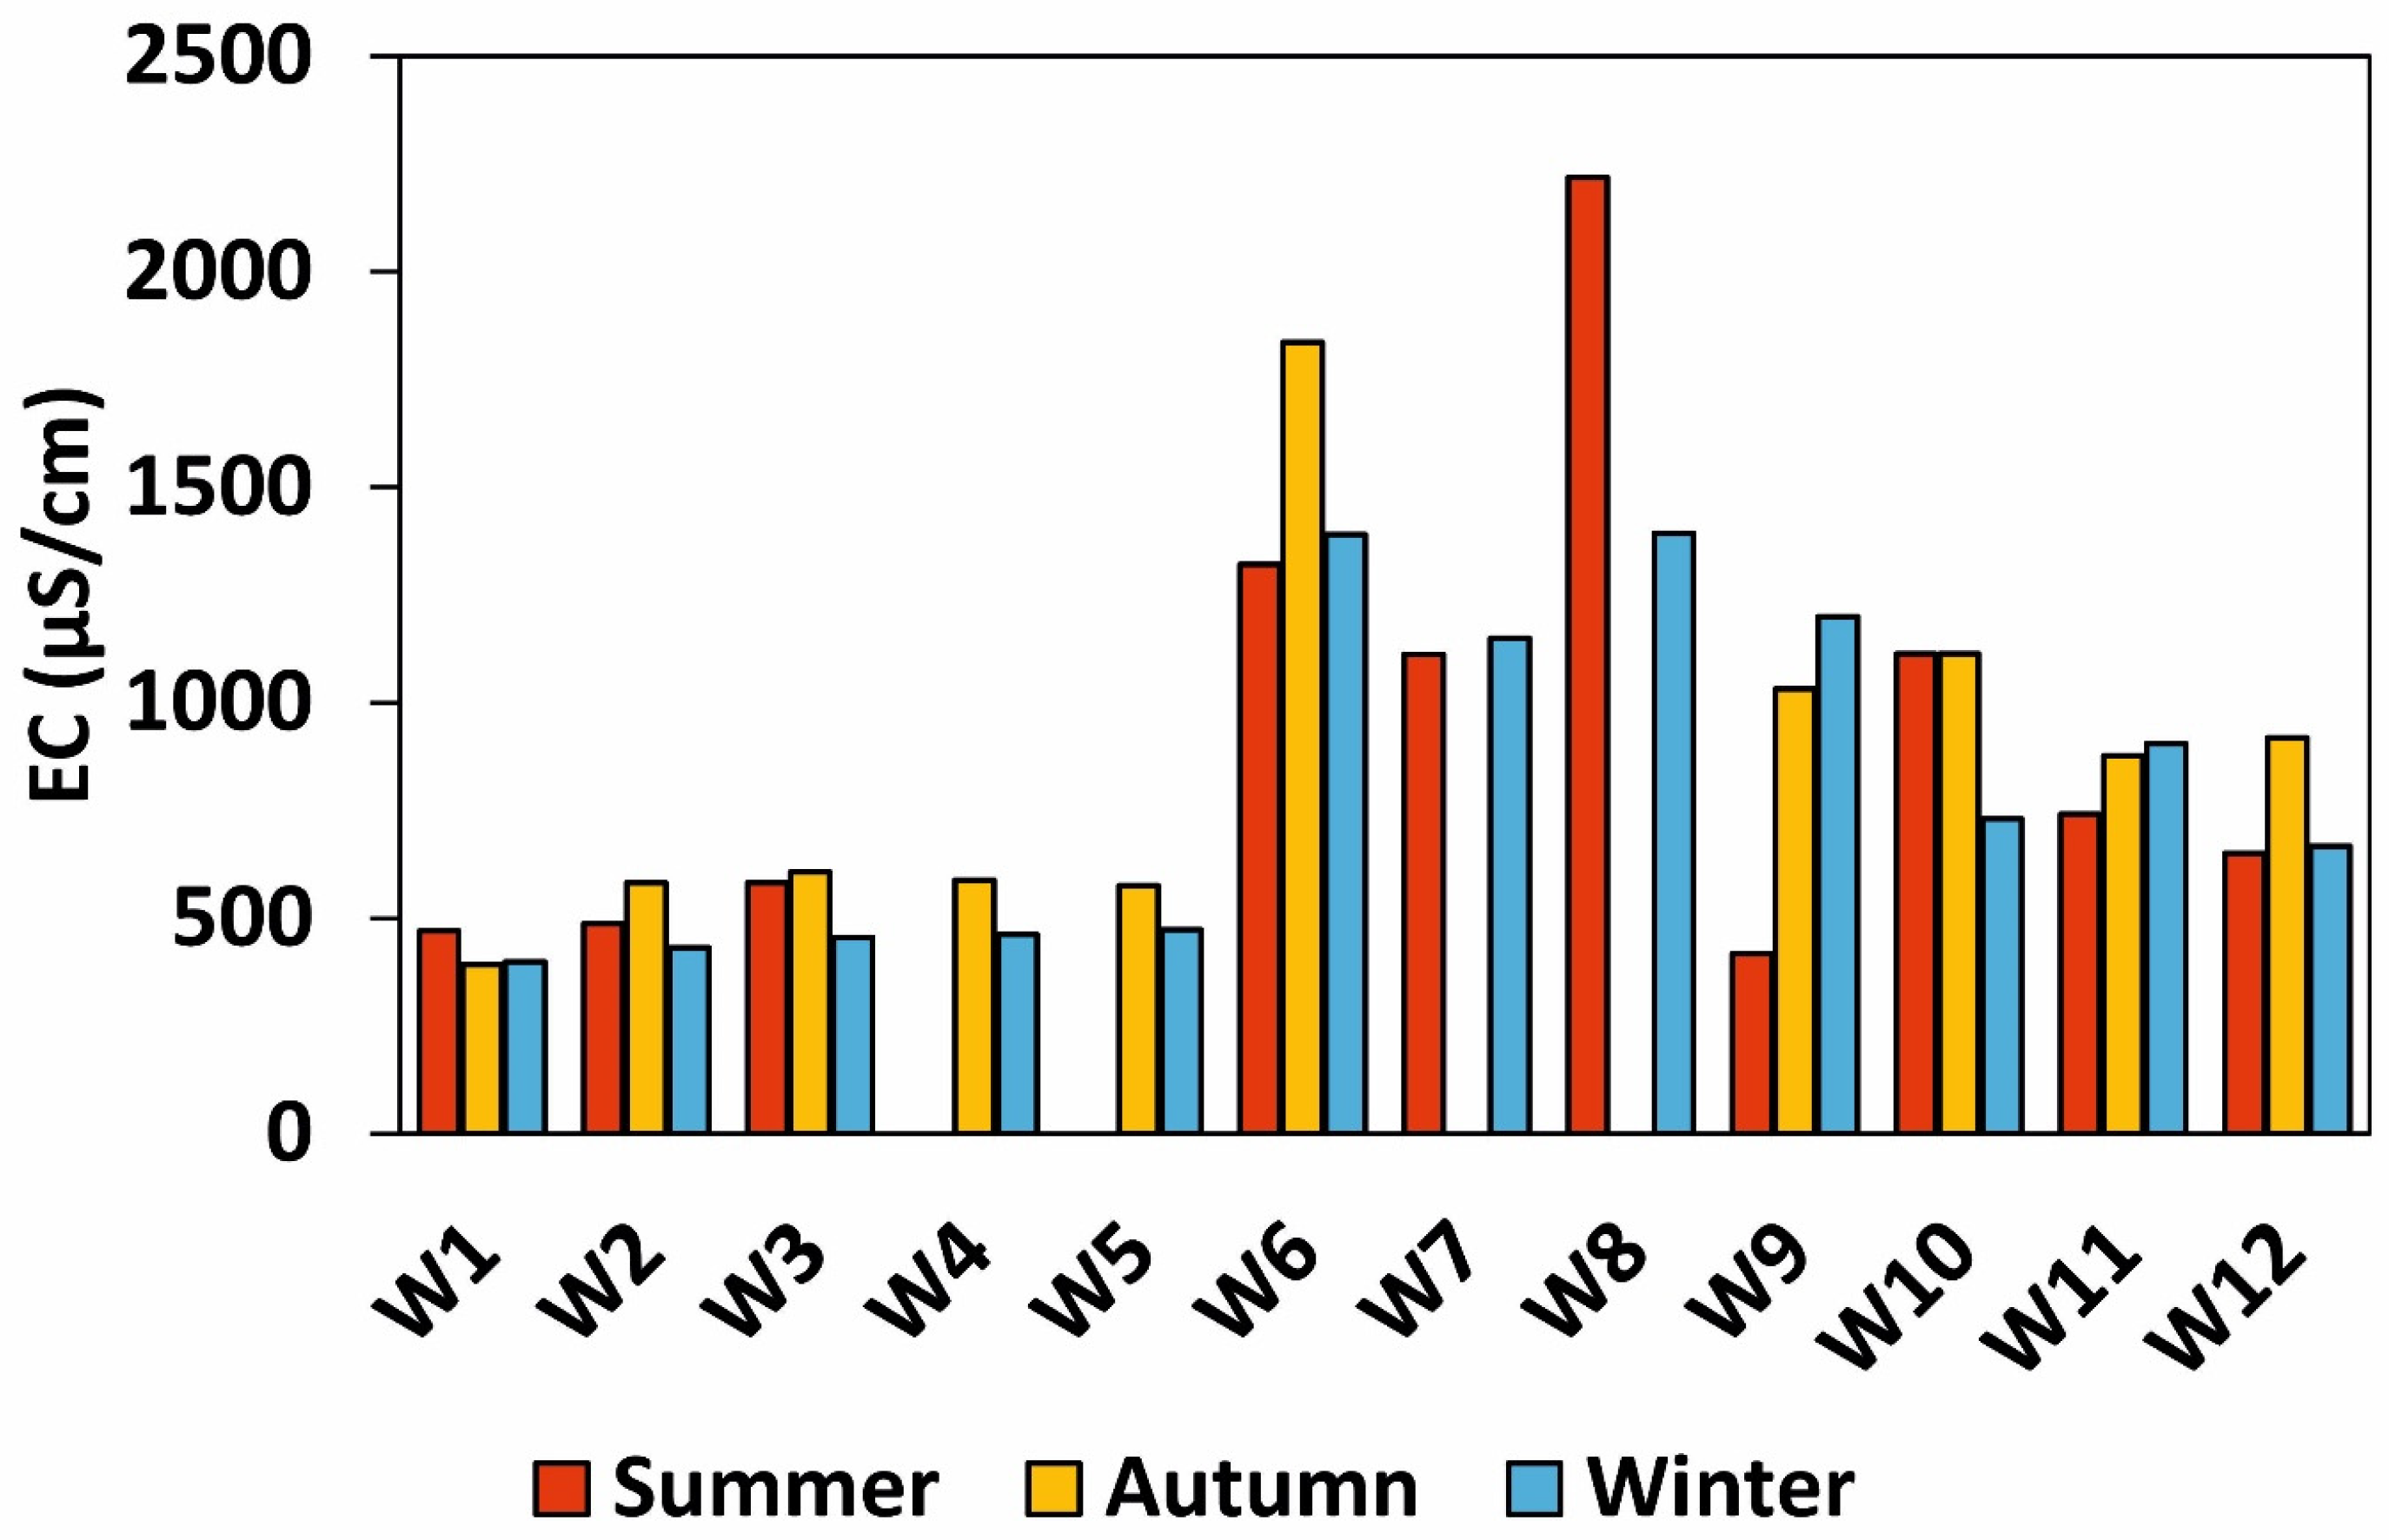
The electric conductivity (EC) of analyzed samples ranged from 418 µS/cm to 2219 µS/cm in the summer season, from 392 µS/cm to 1836 µS/cm in the autumn season, and from 399 µS/cm to 1393 µS/cm in the winter season (Figure 3). These results indicate moderate to high levels of mineralization.

3.2. Sulfate and Trace Elements Concentrations

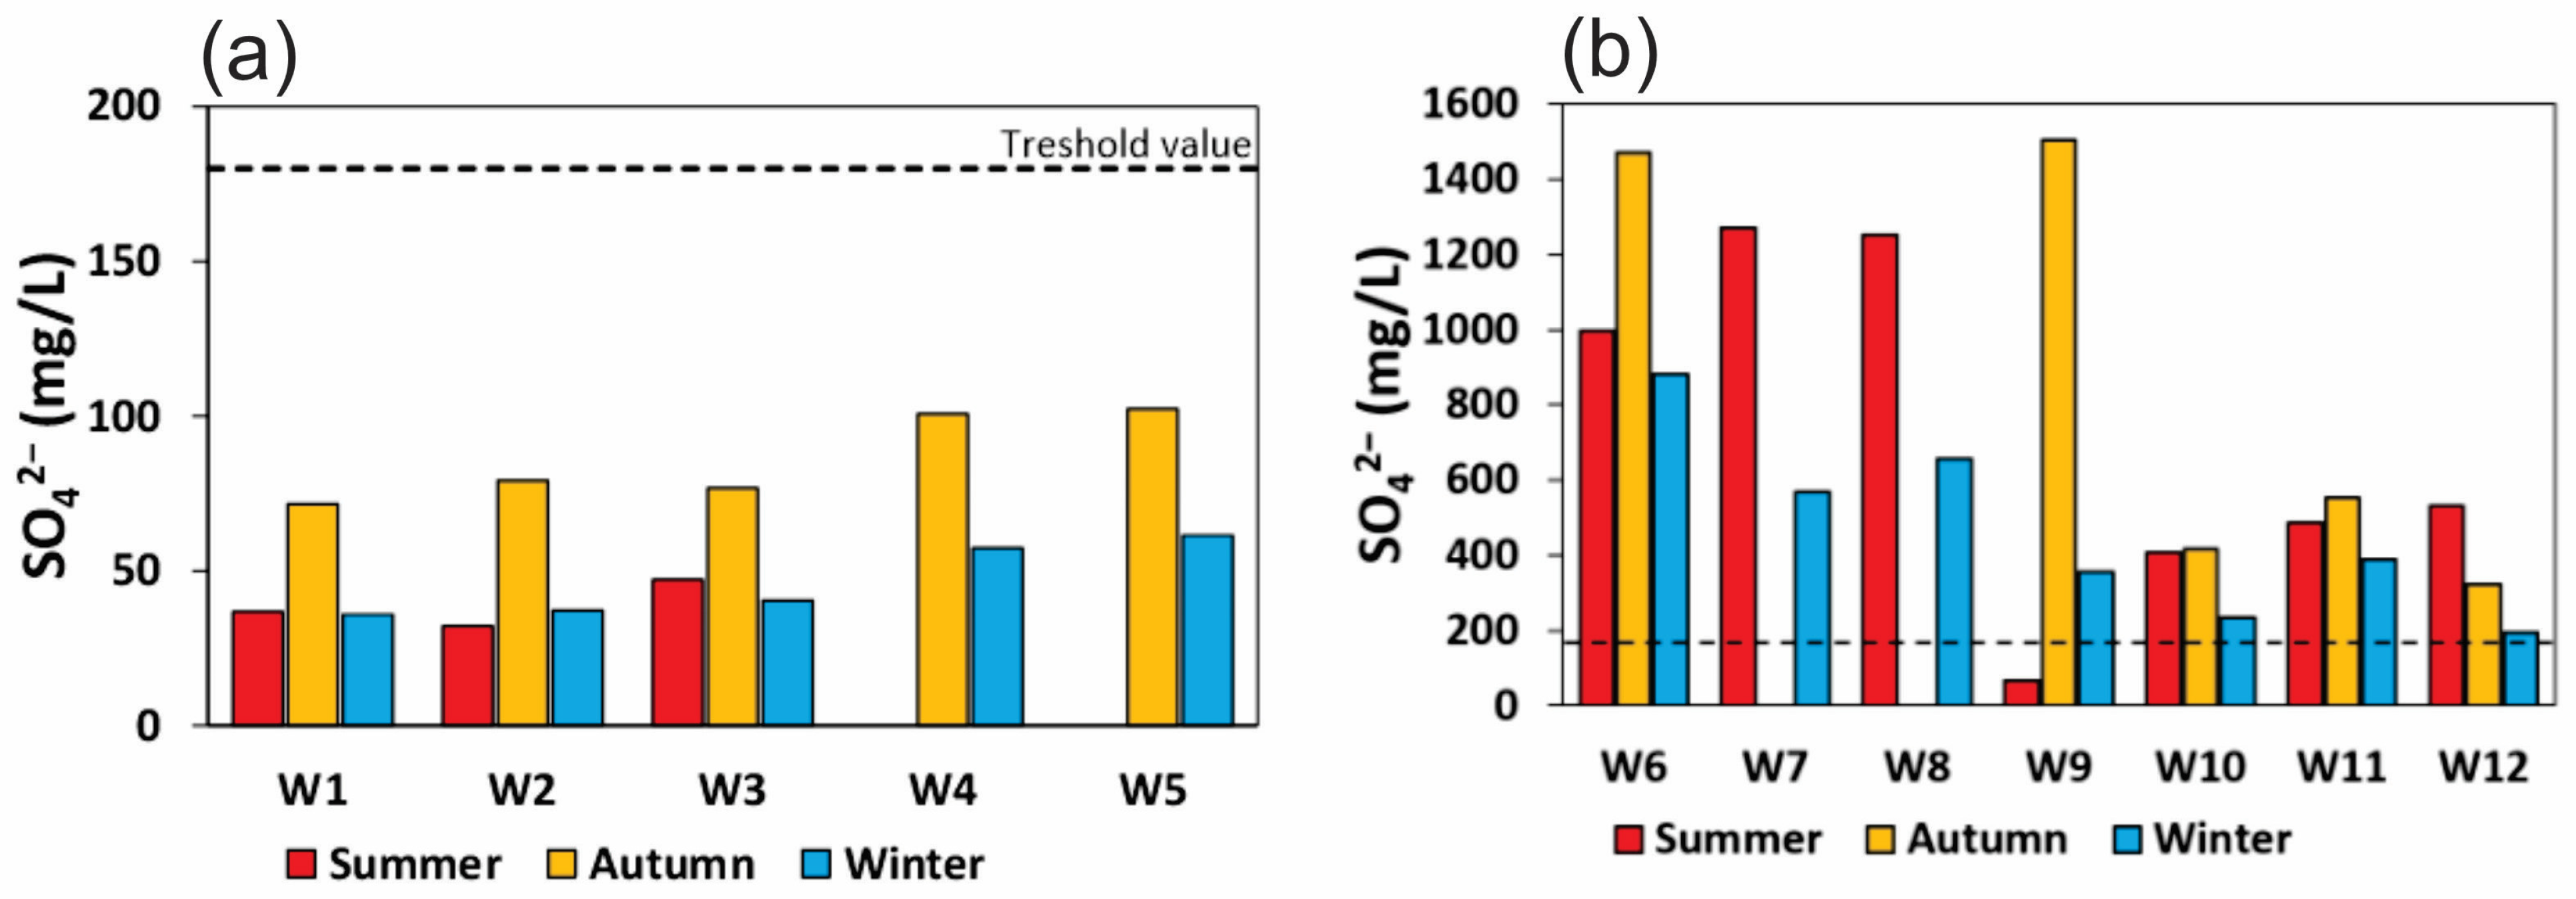
River water samples collected in an unpolluted area by mining activities were characterized by low sulfate (SO42−) concentrations ranging from 32 mg/L to 47 mg/L during the summer season, from 72 mg/L to 102 mg/L during the autumn season, and from 36 mg/L to 62 mg/L during the winter season (Figure 4a). On the other hand, water samples collected in rivers that are directly influenced by mine wastewater had a higher SO42− concentrations, ranging from 65 mg/L to 1272 mg/L in the summer season, from 418 mg/L to 1504 mg/L in autumn season, and from 194 mg/L to 881 mg/L in winter season (Figure 4b).
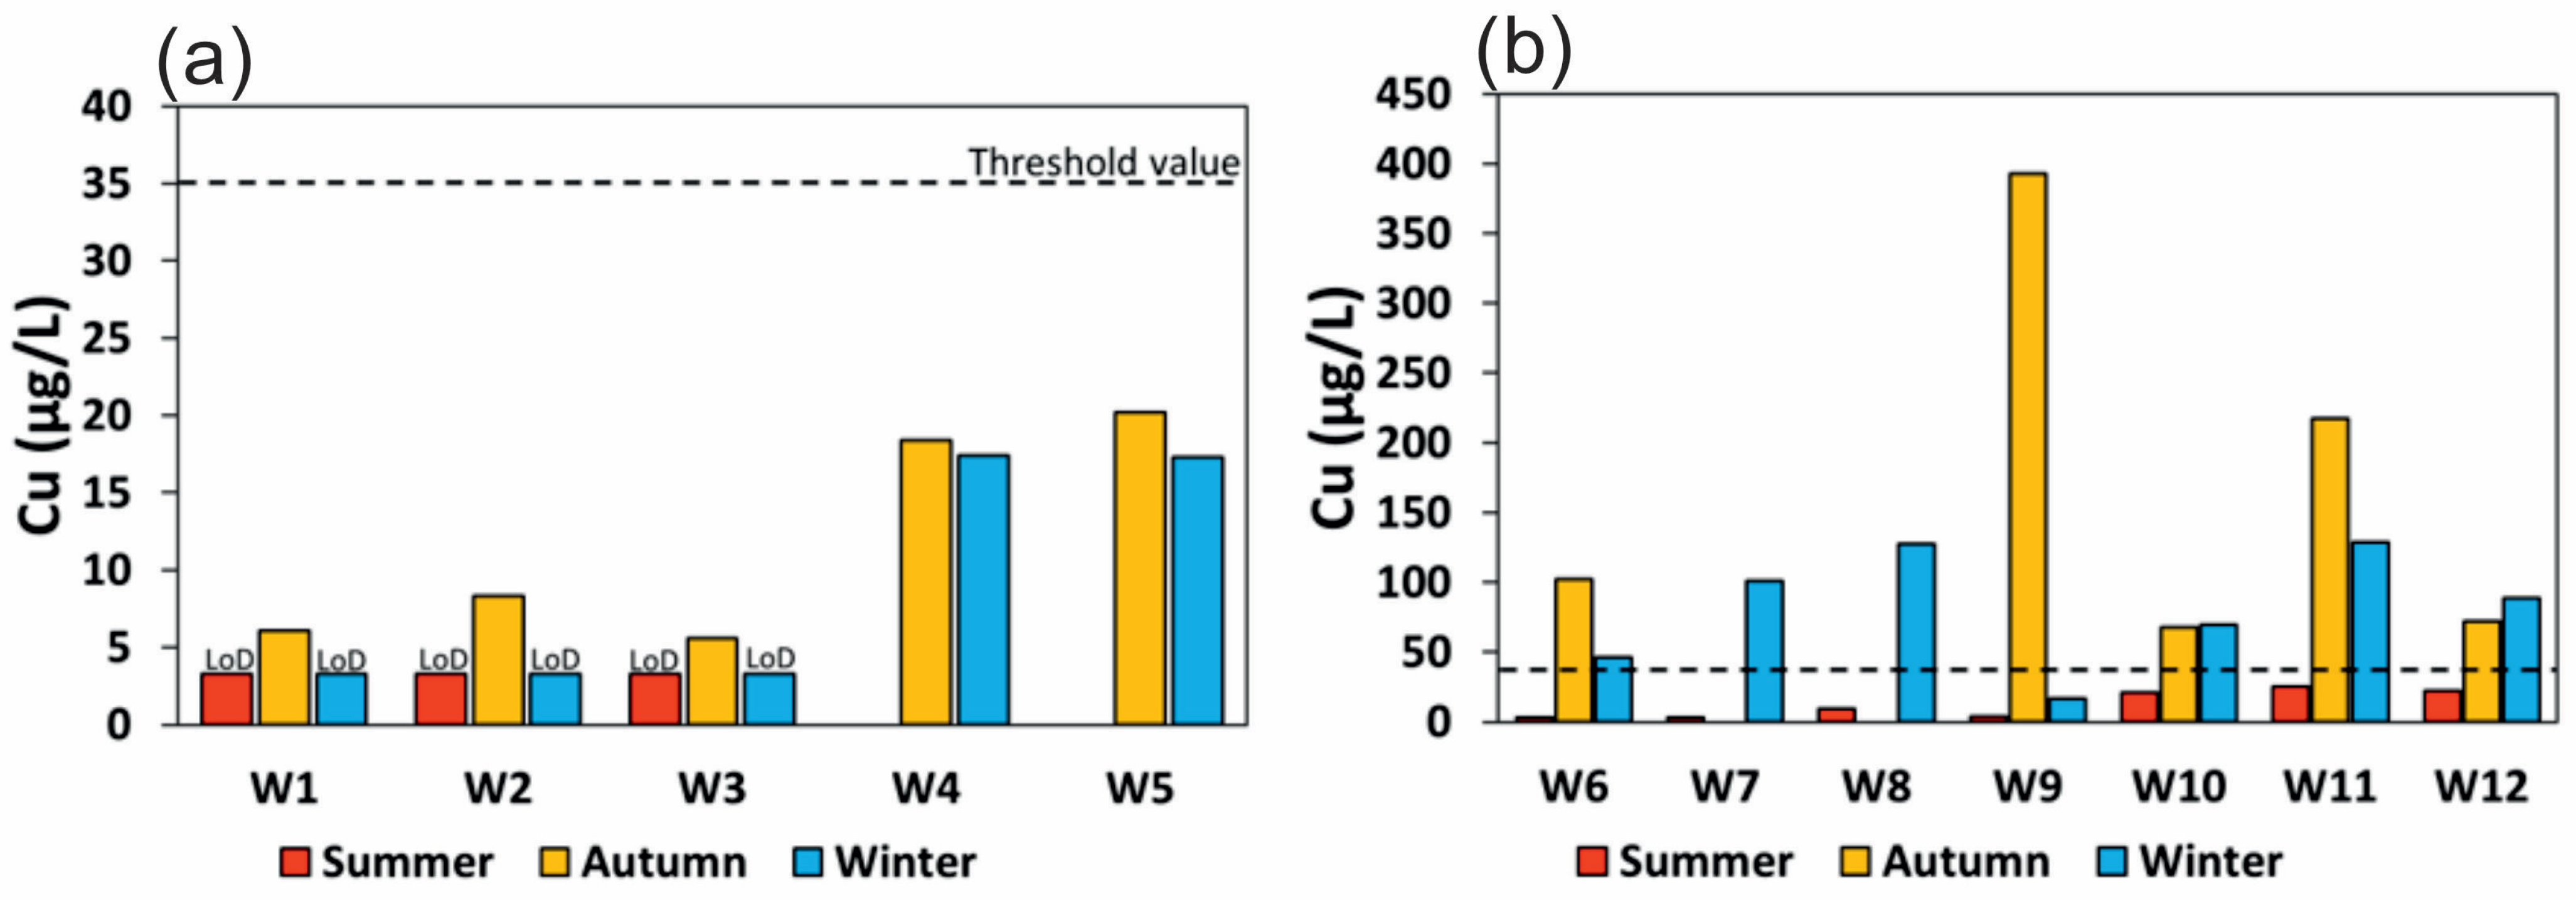
Regarding trace elements in areas without mining activity, concentrations are lower than in the area downstream of the mines (Figure 5, Figure 6 and Figure 7). Copper concentrations in unpolluted river water in the study area during the summer season were below the instrument’s detection limit, whereas in river water downstream of the mines, copper concentrations ranged from below detection to 25 µg/L. In the autumn season, copper concentrations ranged from 5.6 µg/L to 20 µg/L in the unpolluted area, and from 72 µg/L to 393 µg/L in the polluted area. During the winter season, copper concentrations in unpolluted river water ranged from below detection limit to 17.4 µg/L and from 16.4 µg/L to 129 µg/L in polluted river water (Figure 5).
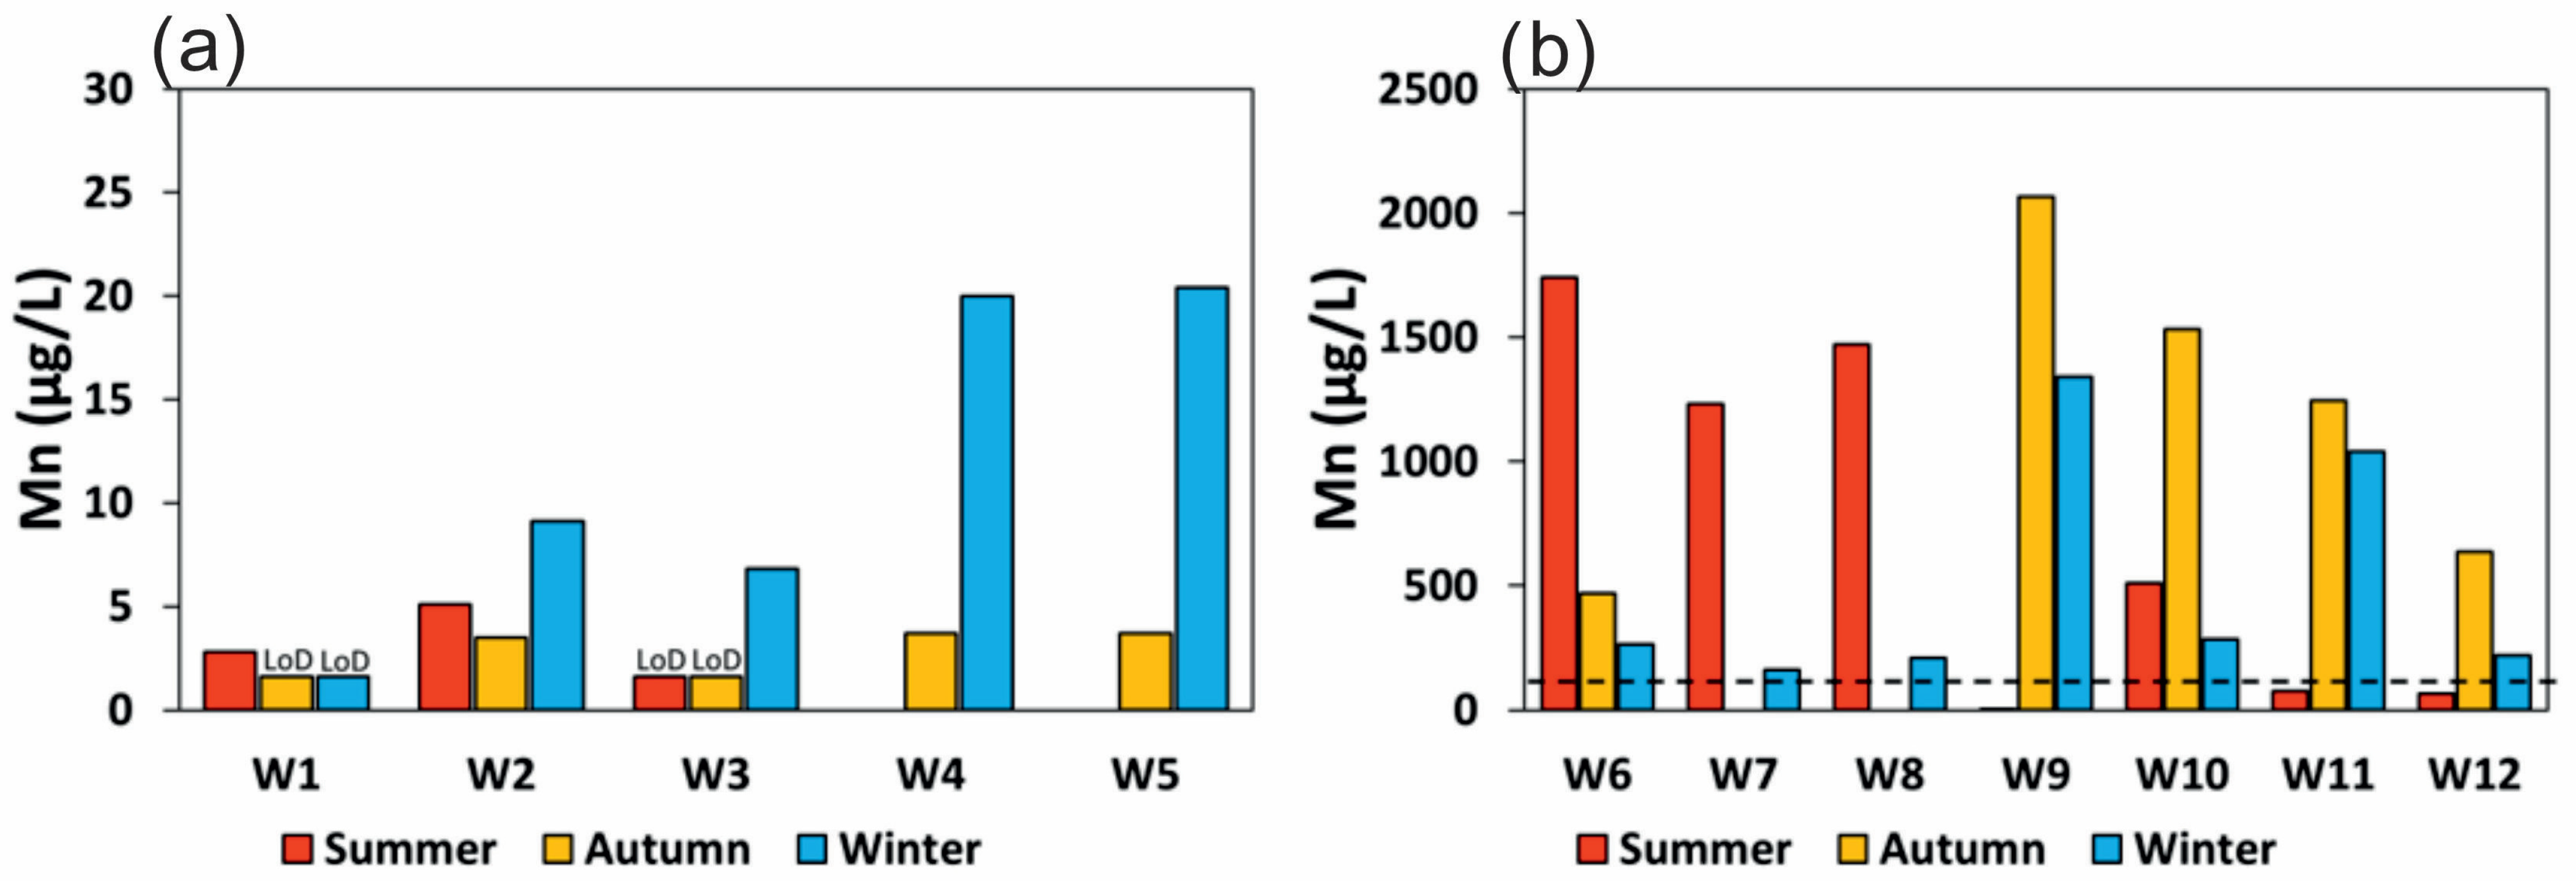
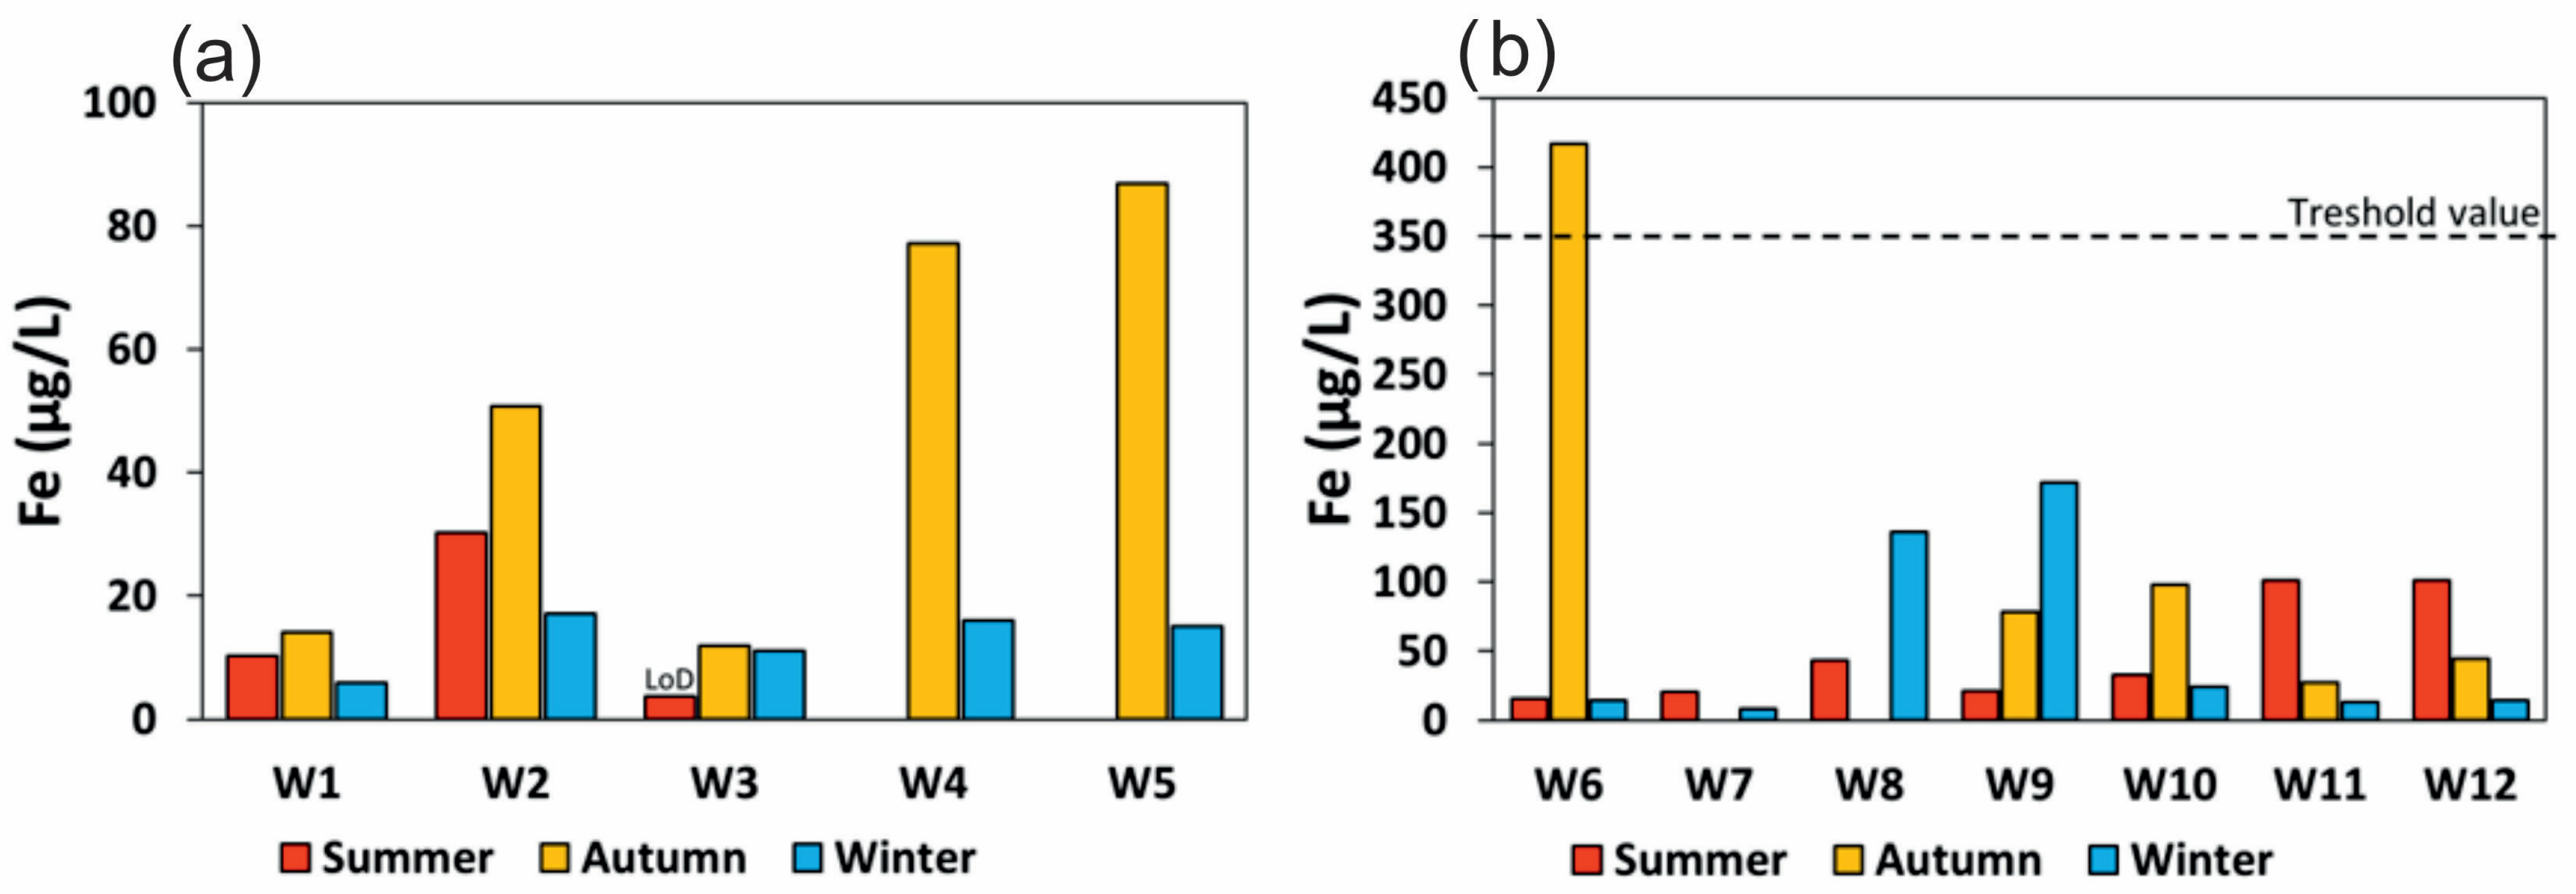
Manganese concentrations in unpolluted river water ranged from below detection limit to 5.1 µg/L in the summer season, from below detection limit to 3.7 µg/L in the autumn season, and from below detection limit to 20 µg/L in the winter season (Figure 6a). In polluted river water, manganese concentrations were significantly higher with a range from 4.2 µg/L to 1741 µg/L in the summer season, from 470 µg/L to 2064 µg/L in the autumn season, and from 161 µg/L to 1342 µg/L in the winter season (Figure 6b). Concentrations of iron in river water collected outside the mining area ranged from below detection limit to 30 µg/L in the summer season, from 12 µg/L to 87 µg/L during the autumn season, and from 5.9 µg/L to 17.1 µg/L µg/L in the winter season.
The concentrations of iron did not differ significantly between water samples from polluted rivers affected by mining activities and those from outside the zone of influence of mining activities, with values up to about 172 µg/L (Figure 7). An exception was observed for river water collected in the upper course of the Krivelj River (W6) in autumn, with a measured iron concentration of 417 µg/L. This is the same location where the orange precipitate was observed, and it has a lower pH than other water samples.
Regarding arsenic concentrations, no clear spatial difference was observed between impacted and less impacted sites. In most samples, arsenic concentrations were below the detection limit (<2.1 µg/L), while measurable values remained low (≤7 µg/L). This indicates that arsenic is largely immobilized or present in low-dissolved forms under the current hydrochemical conditions, suggesting a weaker response to recent mining-related inputs than to other investigated elements.

4. Discussion

4.1. Seasonal Variation in Elements in River Water

A review of earlier investigations and sample analyses revealed that sulfates, copper, manganese, iron, and arsenic are present in the study area’s water [39,40,41,42]. Therefore, their seasonal variations were monitored.
The river water samples collected in the area without mine-related pollution had the same characteristics, providing a clear picture of seasonal variations. The analyzed parameters reached the highest values during the dry autumn season and the lowest during winter (Figure 4, Figure 5, Figure 6 and Figure 7), reflecting the influence of seasonal hydrological conditions. The elevated concentrations during the dry season can be attributed to reduced river flow, which limits dilution and enhances the accumulation of dissolved elements. Increased discharge during precipitation and snowmelt periods enhances dilution, resulting in lower concentrations [43,44,45]. The observed seasonal variability in element concentrations reflects the effects of hydrological conditions.
For samples collected downstream of the mine, the highest concentrations were also recorded during the dry period. However, seasonal variations were less consistent than those observed in unpolluted streams. Variations were particularly pronounced at locations W6 and W9, situated near wastewater discharges from mining facilities. Manganese concentrations in the Krivelj River exhibited distinct seasonal patterns, with maximum values recorded in summer. In the Bor River, manganese concentrations decreased from upstream to downstream (Figure 6). The largest iron variations were observed at location W6, where orange ferric precipitates indicate the influence of historical mining pollution (Figure 7b). The observed orange coloration is due to the formation of ferric hydroxides from the hydrolysis of trivalent iron in mine water. These results show that, in addition to hydrological conditions, variations in element concentrations in polluted waters are influenced by anthropogenic factors. Higher concentrations detected during the low-flow period suggest limited river dilution capacity, allowing accumulation of elements originating from mining activities. The observed hydrochemical patterns are not unique to the Bor mining region but are characteristic of many mining-impacted catchments worldwide, where contaminant transport is strongly influenced by seasonal hydrological conditions and wastewater management practices. Similar seasonal enrichment of dissolved metals during low-flow periods has been reported in mining-impacted catchments affected by acid mine drainage and metallurgical activities [46,47,48]. Therefore, the obtained results contribute to a broader understanding of seasonal contaminant dynamics in mining-affected river systems.

4.2. Current Status of Contamination in a Mining-Affected River System

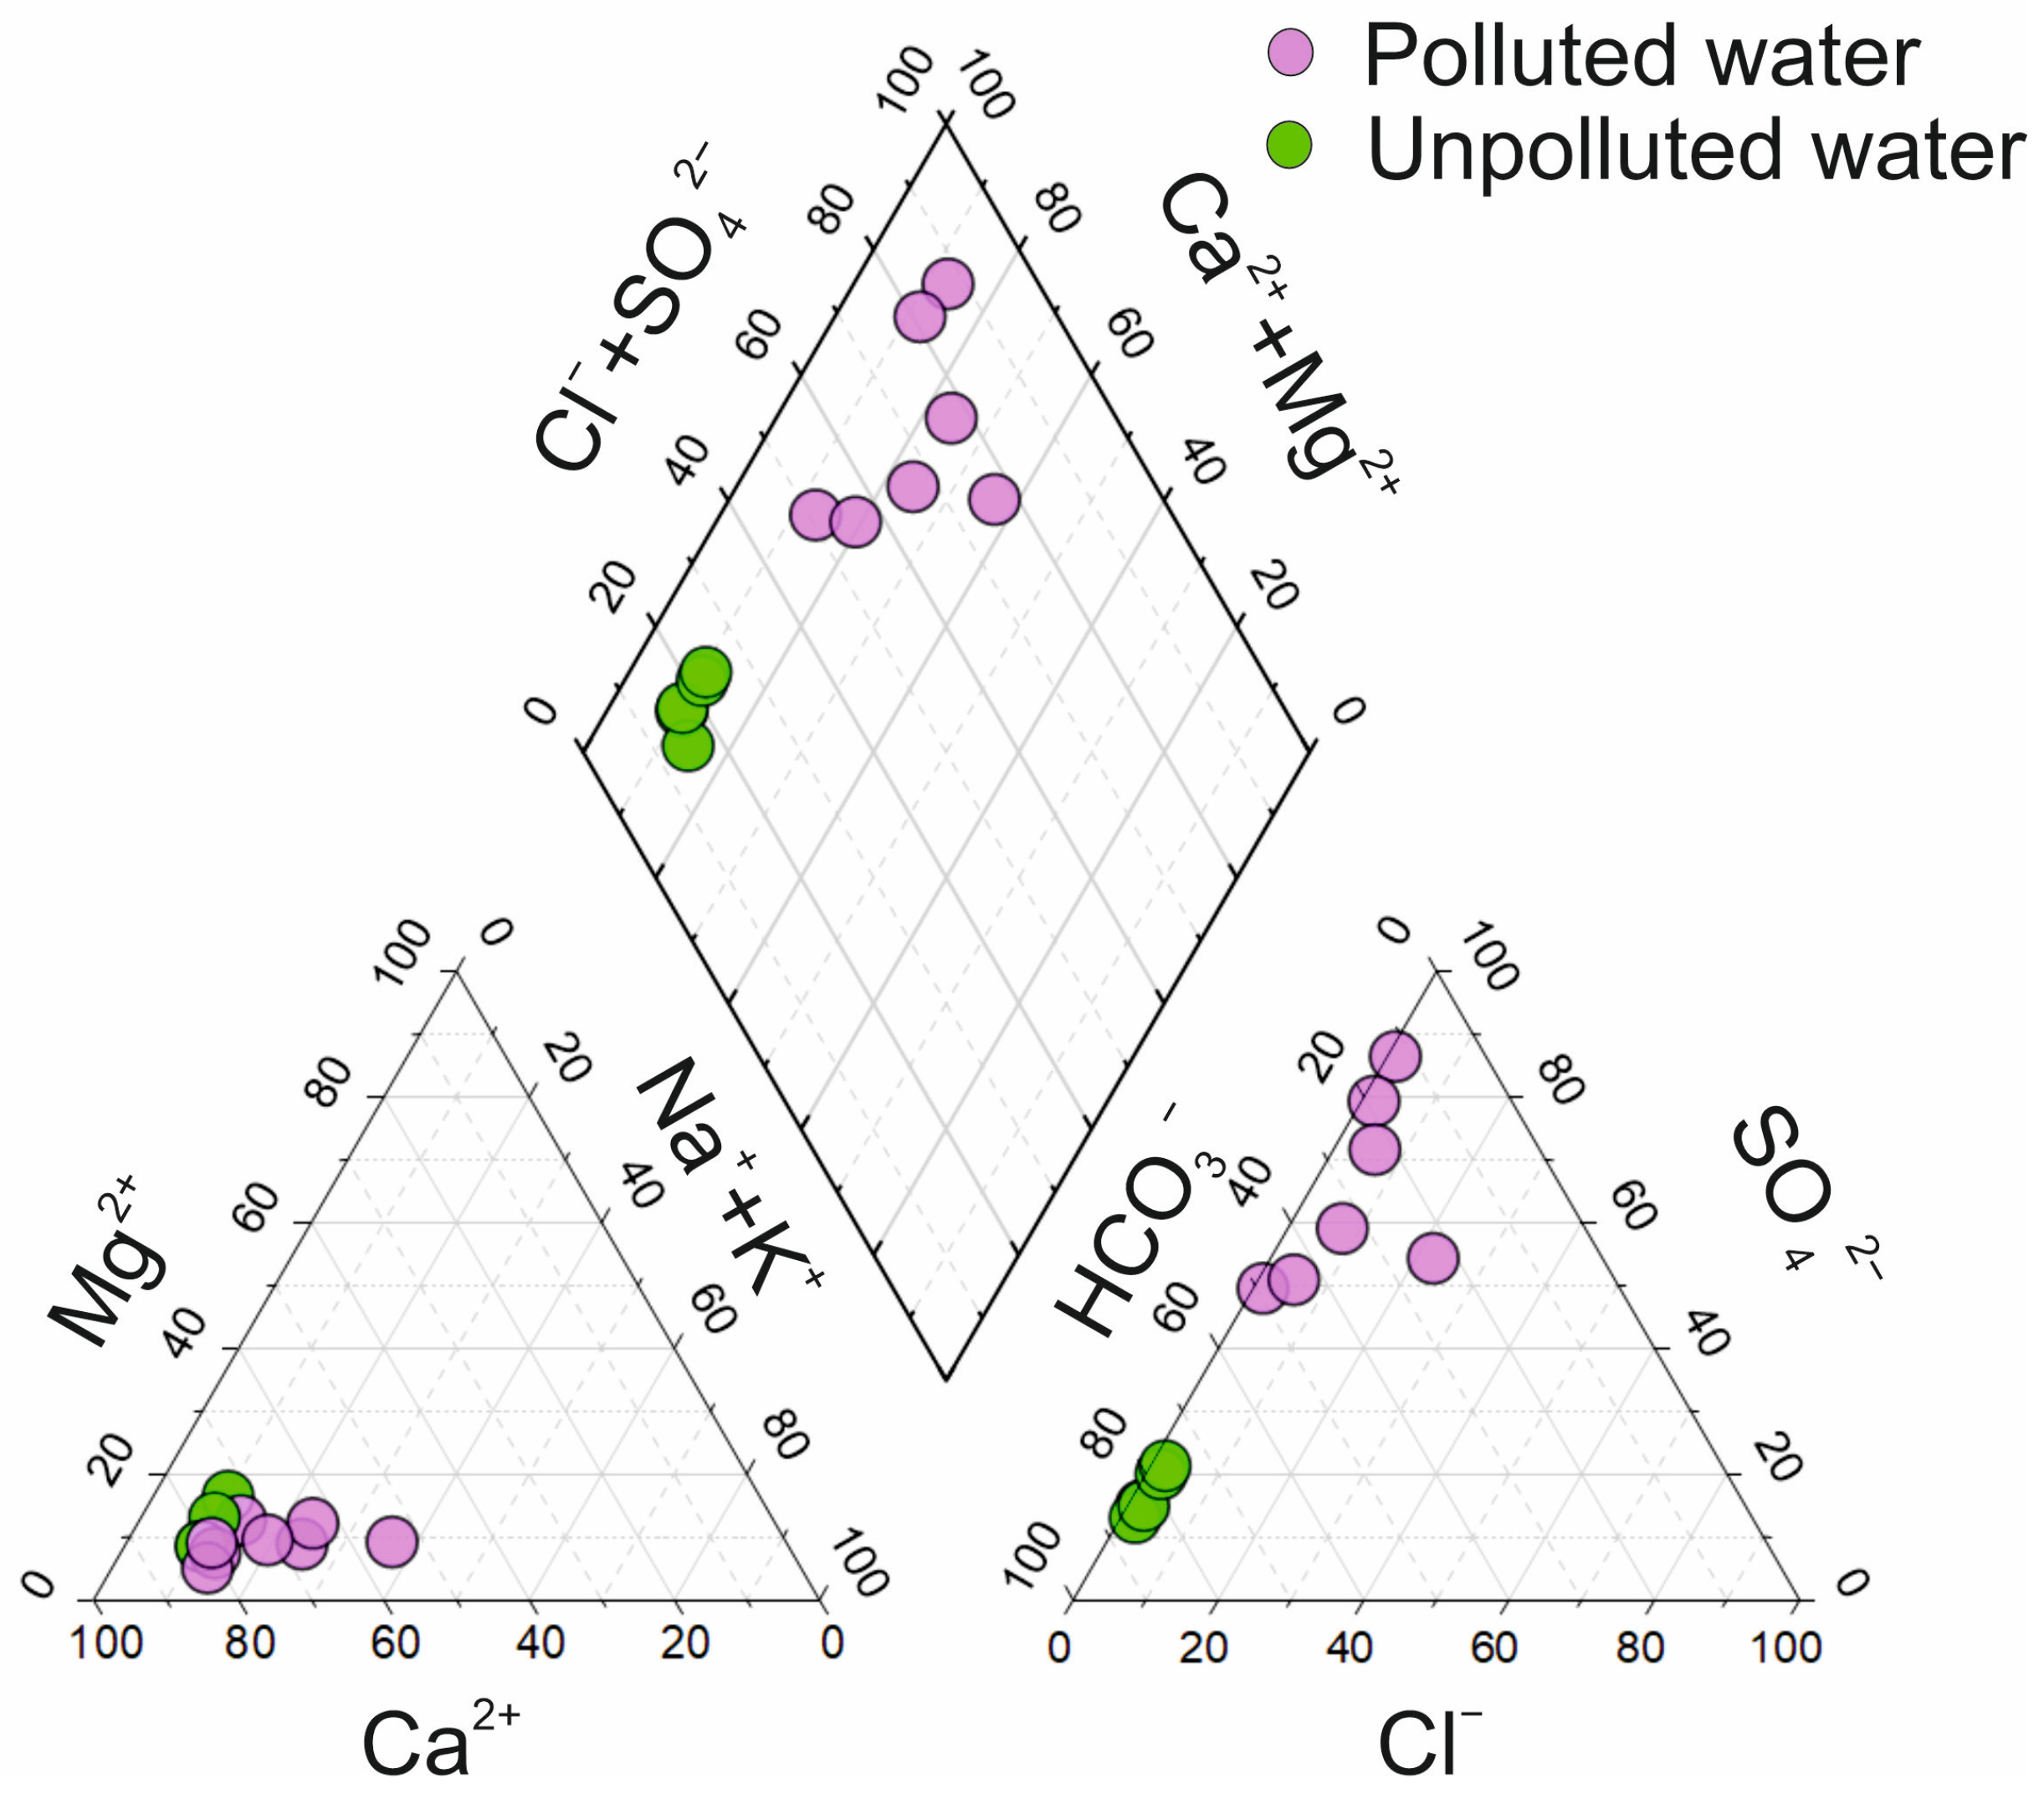
For determining the type of water, a Piper diagram was plotted. Water from the unpolluted area was classified as a Ca-Mg-HCO3 water type (Figure 8). This water type is consistent with the geological setting of the study area [49,50,51]. In contrast, downstream waters were classified as the Ca-Mg-SO4 type, indicating disturbance of the natural hydrochemical balance. The presence of two distinct water types clearly indicates pollution; therefore, the results obtained were compared with Serbian regulations for surface water quality and with background values for pollutants that occur in surface water in the study area [24,38].
pH and electrical conductivity (EC) are widely recognized indicators of water quality and have been extensively used to assess and model the impacts of mining activities [52,53,54]. The pH values measured in the river water samples did not indicate significant contamination. In contrast, electrical conductivity differed between sites located outside the influence of mining activities and those within the mining-affected zone (Figure 3). Elevated EC values observed downstream of mining areas suggest an increased concentration of dissolved ions associated with mining-related contamination. Therefore, pollutant concentrations were further evaluated against region-specific geochemical threshold values established for the study area in a previous study [24]. These threshold values for surface water pollutants were determined in 2021 using the Sinclair method [24,55,56]. They represent the boundary between natural background concentrations and concentrations influenced by anthropogenic activities, thereby providing a basis for distinguishing mining-related impacts from natural geochemical variability.
Concentrations of SO42−, Cu, Mn, and Fe in unpolluted river water (W1, W2, W3, W4, and W5) were below threshold values (Figure 4, Figure 5, Figure 6 and Figure 7), so all of the determined concentrations belong to background concentrations, indicating the absence of significant anthropogenic influence in this part of the study area. Moreover, all of these waters are classified as having excellent or good ecological status [38]. Waters classified in these classes can be used for drinking purposes with prior treatment by filtration and disinfection.
River water samples collected from the Krivelj River (W6, W7, and W8), Bor River (W9, W10, and W11), and from the Bela River (W12), which are affected by mining activities, had elevated concentrations of SO42−, Cu, and Mn compared to background levels. Compared to threshold values, the observed concentrations significantly exceed expected geogenic values, indicating a clear anthropogenic influence. Regarding iron, it is notable that, except for one location during the autumn period, all concentrations were within natural levels (Figure 7b). In previous years, iron was among the elements with the highest concentrations in the research area. Previous studies reported extremely elevated iron concentrations in the study area during untreated wastewater discharge [23,24]. Current concentrations are substantially lower, indicating a reduction in the environmental impact of mining activities. The highest exceedances of the threshold were observed for sulfate and manganese (Figure 4 and Figure 6). According to Serbian surface water quality regulations [38], these waters are classified as Class V, indicating poor ecological status and unsuitable conditions for water use. Copper concentrations also exceeded the threshold value in the autumn and winter seasons (Figure 5). Field observations and analytical results indicate that, despite the implementation of environmental protection measures, contamination persists in the investigated river system. The applied approach, combining seasonal monitoring, threshold-based assessment, and hydrochemical characterization, proved effective in identifying contamination hotspots and distinguishing natural background conditions from anthropogenic influences. Such a methodology can be successfully applied in other mining-affected regions where long-term pollution and remediation processes coexist.

4.3. Differences in River Water Pollution over Time

Over time, the mining company has made changes to protect the environment, so in 2022, purification of mine wastewater began. Before that, mining and metallurgical wastewater from the Bor mining complex was discharged directly into the Bor River without adequate treatment, resulting in severe contamination of surface waters [57,58]. River water pollution was very high for decades, and the pH was acidic, reaching pH = 2 [23]. Concentrations of Fe, Cu, Mn, and As in the Bor River were approximately 300,000 µg/L, 52,000 µg/L, 8200 µg/L, and 2900 µg/L, respectively. Surface water pollution from mining activities reached the Danube River, about 100 km from the source [24].
To determine whether there is a difference in river water pollution before the start of wastewater neutralization (2015) and after its start (2025), statistical verification of the results was conducted. For statistical analysis, a dataset from seven locations (W4, W5, W7, W8, W10, W11, W12) was selected, ranging from the mine to the confluence of the Timok River and the Danube River. Statistical analysis included a paired t-test and a reduction calculation [59,60]. The results of the statistical analysis are shown in Table 2. Due to the limited number of sampling locations, the results of inferential statistical analyses should be interpreted with caution. Therefore, percentage reduction was additionally used to quantify changes in contaminant concentrations between the investigated periods. Results show that contaminant concentrations in river water from the Bor mining area to the Danube River were significantly reduced (Table 2). The observed reductions indicate that wastewater neutralization measures have substantially decreased the direct input of contaminants into the river system. The concentration reduction reached up to 100% for iron (W12, Table 2). Copper and arsenic concentrations were also substantially reduced.
The results indicate a substantial reduction in pollution intensity. River water that was previously acidic now exhibits a near-neutral pH. If the concentrations of elements at location W10 before and after the implementation of wastewater neutralization from mining activities are considered, iron concentrations decreased by approximately 2650-fold, arsenic by about 900-fold, copper by about 740-fold, and manganese by a factor of 6. In an earlier study, it was estimated that 69,000 tons of iron, 42 tons of arsenic, 910 tons of copper, and 187 tons of manganese were transported annually through polluted rivers [24]. As a result of the substantial decrease in element concentrations, the annual transport of pollutants has also been significantly reduced.
Sulfate concentrations were the least reduced, remaining high in the river water downstream from the mines. Sulfate concentrations are about 10 times the threshold, indicating that pollution, although reduced, remains present. Given that sulfate concentrations have remained constant over time, sulfate can serve as a good indicator of surface water pollution in the study area. Manganese may also serve as a useful indicator of mining-related contamination.
The present results confirm previous assumptions proposed by Adamović et al. (2021) that implementation of appropriate environmental protection measures could significantly improve river water quality in the study area [24]. The results further suggest that the influence of mining-related pollution on the Danube River has substantially decreased compared to previous years, indicating considerable improvement in surface water quality.
Several factors should be considered when interpreting the obtained results. Seasonal hydrological variability, differences in river discharge, and the heterogeneous distribution of historical mining contamination may influence the spatial and temporal distribution of dissolved elements. In addition, the limited number of monitoring campaigns constrains the assessment of short-term fluctuations in water chemistry. Nevertheless, the selected monitoring design captured the main seasonal conditions characteristic of the study area and enabled comparison with historical datasets collected under similar environmental conditions.

5. Conclusions

In the study area, a geochemical investigation of river water was conducted to reassess the environmental impact of long-term mining activities. Historical mining practices and insufficient environmental protection had a strong negative influence on surface water quality. In recent years, wastewater neutralization has been introduced before discharge into the river system, prompting a reassessment of environmental conditions. Seasonal variations in water chemistry were observed, with the highest element concentrations recorded during the autumn low-flow period and the lowest during the snowmelt period, indicating a strong influence of hydrological conditions alongside anthropogenic inputs.
River water exhibited near-neutral pH; however, elevated concentrations of sulfates, copper, and manganese relative to background levels confirm ongoing anthropogenic contamination. Increased electrical conductivity downstream of mining areas further reflects the influence of mining-related processes and changes in water chemistry. These parameters proved to be reliable indicators of environmental disturbance. Comparison with historical data indicates an overall improvement in water quality following the implementation of wastewater treatment measures. However, elevated levels of SO42−, Mn, and Cu demonstrate the persistence of mining impacts.
The findings highlight the importance of continuous monitoring of key physicochemical parameters, including pH, electrical conductivity, sulfates, and trace elements, to track ongoing environmental changes. Effective environmental management in mining-affected regions requires not only monitoring but also the implementation and enforcement of water permits, regulatory discharge limits, and compliance control mechanisms. In this context, integrated river basin management is essential for achieving long-term improvements in water quality. Integrating scientific monitoring results into environmental permitting systems can significantly enhance regulatory effectiveness and support evidence-based decision-making.
Future research should focus on long-term trends in water quality recovery and on assessing ecosystem responses to implemented remediation measures to understand the resilience of mining-impacted river systems better and to support sustainable water resource management strategies.

Author Contributions

Conceptualization, D.A.M.; methodology, D.A.M.; software, D.A.M.; validation, D.A.M. and S.V.; formal analysis, D.A.M. and S.V.; investigation, D.A.M., S.V., I.S. and L.K.; resources, D.A.M., S.V. and D.K.; data curation, S.V.; writing—D.A.M.; writing—review and editing, N.S.N., M.M. and D.K.; visualization, D.A.M.; supervision, D.K.; project administration, N.S.N. and D.K.; funding acquisition, D.K. and N.S.N. All authors have read and agreed to the published version of the manuscript.

Funding

This research was funded by the RORS00063 project from Interreg-IPA Romania-Serbia Programme, financed by the European Union and co-financed by the partner states in the Programme.

Data Availability Statement

The original contributions presented in this study are included in the article. Further inquiries can be directed to the corresponding author.

Acknowledgments

This work has been done as a part of the Project RORS00063—“Environmental risk assessment from mining activities as a result of tailings storage in the cross-border area Romania–Serbia—ERA-MIN_RO-SRB” in Interreg-IPA Romania-Serbia Program, financed by the European Union and co-financed by the partner states in the Program.

Conflicts of Interest

The authors declare no conflicts of interest.

References

  1. Ciobanu, C.L.; Cook, N.J.; Stein, H. Regional settings and geochronology of the late cretaceous Banatitic magmatic and Metallogenic Belt. Miner. Depos. 2002, 37, 541–567. [Google Scholar] [CrossRef]
  2. Popov, P.; Berza, T.; Grubić, A.; Ioane, D. Late Cretaceous Apusene-Banat-Timok, Srednogorie (ABTS) Magmatic and Metallogenic belt in the Carpathian-Balkan orogen. Geol. Balc. 2002, 32, 145–163. [Google Scholar]
  3. Mao, J.; Pirajno, F.; Lehmann, B.; Luo, M.; Berzina, A. Distribution of porphyry deposits in the Eurasian continent and their corresponding tectonic settings. J. Asian Earth Sci. 2014, 79, 576–584. [Google Scholar] [CrossRef]
  4. Gallhofer, D.; von Quadt, A.; Peycheva, I.; Schmid, S.M.; Heinrich, C.A. Tectonic, magmatic, and metallogenic evolution of the Late Cretaceous arc in the Carpathian-Balkan orogen. Tectonics 2015, 34, 1813–1836. [Google Scholar] [CrossRef]
  5. Šerbula, S.M.; Antonijević, M.M.; Milosević, N.M.; Milić, S.M.; Ilić, A.A. Concentration of particulate matter and arsenic in Bor (Serbia). J. Hazard. Mater. 2010, 181, 43–51. [Google Scholar] [CrossRef] [PubMed]
  6. Šerbula, S.; Stanković, V.; Živković, D.; Kamberović, Z.; Georgievski, M.; Kalinović, T. Characteristics of wastewater streams within the Bor copper mine and their influence on pollution of the Timok River, Serbia. Mine Water Environ. 2016, 35, 480–485. [Google Scholar] [CrossRef]
  7. Milijašević, D.; Milanov, A.; Brankov, J.; Radovanović, M. Water quality assessment of the Borska Reka River using the WPI (water pollution index) method. Arch. Biol. Sci. 2011, 63, 819–824. [Google Scholar] [CrossRef]
  8. Panias, D. Consequences of environmental issues on sustainability of metal industries in Europe: The case study of Bor. J. Metall. 2006, 4, 239–250. [Google Scholar]
  9. Martinez-Oviedo, A.; Monterrubio-Martinez, E.; Tuxpan-Vergas, J. Assessing the water contaminants in San Luis Potosí and its effects on its inhabitants: An interdisciplinary study on environmental contamination and public health. J. Hazard. Mater. 2024, 464, 132828. [Google Scholar] [CrossRef]
  10. Ustaoğlu, F.; Yüksel, B.; Tepe, Y.; Aydın, H.; Topaldemir, H. Metal pollution assessment in the surface sediments of a river system in Türkiye: Integrating toxicological risk assessment and source identification. Mar. Pollut. Bull. 2024, 203, 116514. [Google Scholar] [CrossRef]
  11. Mosalem, A.; Redwan, M.; Abdel Moneim, A.A.; Rizk, S. Implication of the Mining Activities on the Hydrogeochemical Imprints and Quality Assessment of the Groundwater in Wadi Asal and Wadi Queih, Red Sea Area, Egypt. Water Res. 2024, 51, 1076–1096. [Google Scholar]
  12. Ruiz Cánovas, C.; Macías, F.; Olías, M. Hydrogeochemical behavior of an anthropogenic mine aquifer: Implications for potential remediation measures. Sci. Total Environ. 2018, 636, 85–93. [Google Scholar] [CrossRef] [PubMed]
  13. Šerbula, S.M.; Milosavljević, J.S.; Kalinović, J.V.; Kalinović, T.S.; Radojević, A.A.; Apostolovski Trujić, T.L.; Tasić, V.M. Arsenic and SO2 hotspot in South-Eastern Europe: An overview of the air quality after the implementation of the flash smelting technology for copper production. Sci. Total Environ. 2021, 777, 145981. [Google Scholar] [CrossRef]
  14. Kovačević, R.; Radović, B.; Manojlović, D.; Urošević, T.; Apostolovski-Trujić, T.; Tasić, V.; Jovašević-Stojanović, M. Determinin the PM10 Pollution Sources near the Copper Smelter in Bor, Serbia. Atmosphere 2024, 15, 1498. [Google Scholar] [CrossRef]
  15. Kovačević, R.; Janošević-Stojanović, M.; Tasić, V.; Milošević, N.; Petrović, N.; Stanković, S.; Matić-Besarabić, S. Preliminary analysis of level of arsenic and other metallic elements in PM10 sampled near copper smelter Bor (Serbia). Chem. Ind. Chem. Eng. Q. 2010, 16, 269–279. [Google Scholar] [CrossRef]
  16. Radović, B.; Tasić, V.; Kovačević, R.; Apostolovski-Trujić, T.; Manojlović, D.; Cocić, M.; Urošević, T. Chemical Composition of PM10 in a Classroom near the Copper Smelter in Bor, Serbia. Atmosphere 2024, 15, 920. [Google Scholar] [CrossRef]
  17. International Agency for Research on Cancer. List of Classifications. Available online: https://monographs.iarc.who.int/agents-classified-by-the-iarc/ (accessed on 10 February 2026).
  18. Filimon, M.N.; Caraba, I.V.; Popescu, R.; Dumitrescu, G.; Verdes, D.; Petculescu Ciochina, L.; Sinitean, A. Potential ecological and human health risks of heavy metals in soils in selected copper mining areas-a case study: The Bor area. Int. J. Environ. Res. Public Health 2021, 18, 1516. [Google Scholar] [CrossRef]
  19. Petrović, J.V.; Alagić, S.C.; Milić, S.M.; Tošić, S.B.; Bugarin, M.M. Chemometric characterization of heavy metals in soils and shoots of the two pioneer species sampled near the polluted water bodies in the close vicinity of the copper mining and metallurgical complex in Bor (Serbia): Phytoextraction and biomonitoring contexts. Chemosphere 2021, 262, 127808. [Google Scholar] [CrossRef]
  20. Simonović, D.; Kržanović, D.; Kovačević, R.; Steharnik, M.; Stanković, S.; Urošević, D.; Krstić, V. Assessment of Cu and As in Wheat (Triticum aestivum L.) and Arable Land in the Vicinity of Bor (Serbia): Implications for Food Safety and Human Health. Plants 2026, 15, 631. [Google Scholar] [CrossRef]
  21. Adamović, D.; Ishiyama, D.; Kawaraya, H.; Ogawa, Y.; Stevanović, Z. Geochemical characteristics and estimation of groundwater pollution in catchment areas of Timok and Pek Rivers, Eastern Serbia: Determination of early-stage groundwater pollution in mining areas. Groundw. Sustain. Dev. 2022, 16, 100719. [Google Scholar] [CrossRef]
  22. Vesković, J.; Bulatović, S.; Miletić, A.; Tadić, T.; Marković, B.; Nastasović, A.; Onjia, A. Source-specific probabilistic health risk assessment of potentially toxic elements in groundwater of a copper mining and smelter area. Stoch. Environ. Res. Risk Assess. 2024, 38, 1597–1612. [Google Scholar] [CrossRef]
  23. Đorđievski, S.; Ishiyama, D.; Ogawa, Y.; Stevanović, Z. Mobility and natural attenuation of metals and arsenic in acidic waters of the drainage system of Timok River from Bor copper mines (Serbia) to Danube River. Environ. Sci. Pollut. Res. 2018, 25, 25005–25019. [Google Scholar] [CrossRef] [PubMed]
  24. Adamović, D.; Ishiyama, D.; Đorđievski, S.; Ogawa, Y.; Stevanović, Z.; Kawaraya, H.; Sato, H.; Obradović, L.; Marinković, V.; Petrović, J.; et al. Estimation and comparison of environmental impacts of acid mine drainage-bearing river water in the Bor and Majdanpek porphyry copper mining areas in Eastern Serbia. Resour. Geol. 2021, 71, 123–143. [Google Scholar] [CrossRef]
  25. Irani, T.; Mostafazadeh, R.; Mousavi Moghanjoghi, S. Changes in water quality condition at sequential monitoring stations based on IRWQI along the Little Zab River in Northwestern Iran. Sci. Rep. 2025, 15, 29583. [Google Scholar] [CrossRef]
  26. Kaushal, S.S.; Maas, C.M.; Mayer, P.M.; Newcomer-Johnson, T.A.; Grant, S.B.; Rippy, M.A.; Shatkay, R.R.; Leathers, J.; Gold, A.J.; Smith, C.; et al. Longitudinal stream synoptic monitoring tracks chemicals along watershed continuums: A typology of trends. Front. Environ. Sci. 2023, 11, 1122485. [Google Scholar] [CrossRef]
  27. Lips, A.L.W.; Herrington, R.J.; Stein, G.; Kozelj, D.; Popov, K.; Wijbrans, J.R. Refined timing of porphyry copper formation in the Serbian and Bulgarian portions of the Cretaceous Carpatho-Balkan belt. Econ. Geol. 2004, 99, 601–609. [Google Scholar] [CrossRef]
  28. Dimitrijević, M.; Kostov, A.; Tasić, V.; Milošević, N. Influence of pyrometallurgical copper production on the environment. J. Hazard. Mater. 2009, 164, 892–899. [Google Scholar] [CrossRef]
  29. Pejović, M.; Bajat, B.; Gospavić, Z.; Saljnikov, E.; Kilibarda, M.; Cakmak, D. Layer-specific spacial prediction of a concentration in copper smelter vicinity considering the terrain exposure. J. Geochem. Explor. 2017, 179, 25–35. [Google Scholar] [CrossRef]
  30. Milijašević Joksimović, D.; Gavrilović, B.; Lović Obradović, S. Application of the water quality index in the Timok River Basin (Serbia). J. Geogr. Inst. Cvijic 2018, 68, 333–344. [Google Scholar] [CrossRef]
  31. Nemeş, N.S.; Kržanović, D.; Stojanović, M.; Negrea, A.; Negrea, P.; Muntean, C. Establishing a baseline for environmental risk assessment: A systematic review of the disposal of mining tailings in the crossborder region Romania-Serbia. J. Trace Elem. Med. Biol. 2026, 93, 127802. [Google Scholar] [CrossRef]
  32. Republic Hydrometeorological Service of Serbia. Annual Bulletin for Serbia the Year 2024. Division for Climate Monitoring and Climate Forecast, Department of National Center for Climate Change, Development of Climate Models and Disaster, Risk Assessment (in Serbian) 2025. Available online: https://www.hidmet.gov.rs/data/klimatologija/eng/2024.pdf (accessed on 15 April 2026).
  33. Republic Hydrometeorological Service of Serbia. Annual Bulletin for Serbia the Year 2025. Division for Climate Monitoring and Climate Forecast, Department of National Center for Climate Change, Development of Climate Models and Disaster, Risk Assessment (in Serbian) 2026. Available online: https://www.hidmet.gov.rs/data/klimatologija/eng/2025.pdf (accessed on 15 April 2026).
  34. ISO 5667-6:2014; Water Quality-Sampling-Part 6: Guidance on Sampling of Rivers and Streams. International Organization for Standardization: Geneva, Switzerland, 2014.
  35. ISO 5667-3:2018; Water Quality-Sampling-Part 3: Preservation and Handling of Water Samples. International Organization for Standardization: Geneva, Switzerland, 2018.
  36. Nedecor, G.W.; Cochran, W.G. Statistical Methods, 8th ed.; Iowa State University Press: Ames, IA, USA, 1989. [Google Scholar]
  37. Zar, J.H. Biostatistical Analysis, 5th ed.; Pearson Education: Upper Saddle River, NJ, USA, 2010. [Google Scholar]
  38. Republic of Serbia. Regulation on Limit Values for Pollutants in Surface Water and Groundwater and Sediments, and the Deadlines for Their Achievement. Serbian Official Gazette 50, 1 (in Serbian). 2012. Available online: http://www.pravno-informacioni-sistem.rs/SlGlasnikPortal/eli/rep/sgrs/vlada/uredba/2012/50/1/reg (accessed on 20 March 2026).
  39. Ishiyama, D.; Kawaraya, H.; Sato, H.; Obradović, L.; Blagojević, B.; Petrović, J.; Gardić, V.; Stevanović, Z.; Shibayama, A.; Masuda, N.; et al. Geochemical characteristics of mine drainage water and river water in Bor mining area, Serbia: Results of study in 2011. In Scientific and Technical Reports of Graduate School of Engineering and Resource Science; Akita University: Akita, Japan, 2012; Volume 33, pp. 41–49. Available online: http://hdl.handle.net/10295/2121 (accessed on 20 March 2026).
  40. Osenyeng, O.; Ishiyama, D.; Đorđievski, S.; Adamović, D.; Ogawa, Y. Environmental risk assessment of the contamination of river water and sediments from the Bor mining area, East Serbia―Secondary Cu enrichment at the reservoir site. Resour. Geol. 2023, 73, e12314. [Google Scholar] [CrossRef]
  41. Atanacković, N.; Dragišić, V.; Stojković, J.; Papić, P.; Živanović, V. Hydrochemical characteristics of mine waters from abandoned mining sites in Serbia and their impact on surface water quality. Environ. Sci. Pollut. Res. 2013, 20, 7615–7626. [Google Scholar] [CrossRef]
  42. Gardić, V.R.; Petrović, J.V.; Đurđevac-Ignjatović, L.V.; Kolaković, S.R.; Vujović, S.R. Impact assessment of mine drainage water and municipal wastewater on the surface water near the City of Bor. Hem. Ind. 2015, 69, 165–174, (In Serbian with English abstract). [Google Scholar] [CrossRef]
  43. Butler, B.; Ranville, J.; Ross, P. Observed and modeled seasonal trends in dissolved and particulate Cu, Fe, Mn, and Zn in a mining-impacted stream. Water Res. 2008, 42, 3135–3145. [Google Scholar] [CrossRef] [PubMed]
  44. Hammoumi, D.; Al-Aizari, H.S.; Alaraidh, I.A.; Okla, M.K.; Assal, M.E.; Al-Aizari, A.R.; Moshab, M.S.; Chakiri, S.; Bejjaji, Z. Seasonal Variations and Assessment of Surface Water Quality Using Water Quality Index (WQI) and Principal Component Analysis (PCA): A Case Study. Sustainability 2024, 16, 5644. [Google Scholar] [CrossRef]
  45. Liang, B.; Han, G.; Liu, M.; Li, X.; Song, C.; Zhang, Q.; Yang, K. Spatial and Temporal Variation of Dissolved Heavy Metals in the Mun River, Northeast Thailand. Water 2019, 11, 380. [Google Scholar] [CrossRef]
  46. Olías, M.; Nieto, J.M.; Sarmiento, A.M.; Cerón, J.C.; Cánovas, C.R. Seasonal water quality variations in a river affected by acid mine drainage: The Odiel River (South West Spain). Sci. Total. Environ. 2004, 333, 267–281. [Google Scholar] [CrossRef]
  47. Moreno-González, R.; Ruiz-Cánovas, C.; Olías, M.; Macías, F. Seasonal variability of extremely metal rich acid mine drainages from the Tharsis mines (SW Spain). Environ. Pollut. 2020, 259, 113829. [Google Scholar] [CrossRef]
  48. Cánovas, C.R.; Olías, M.; Nieto, J.M.; Sarmiento, A.M.; Cerón, J.C. Hydrochemical characteristics and seasonal influence on the pollution by acid mine drainage in the Odiel river Basin (SW Spain). Appl. Geochem. 2009, 24, 697–714. [Google Scholar] [CrossRef]
  49. Stevanović, Z.; Jemcov, I.; Milanović, S. Management of karst aquifers in Serbia for water supply. Environ. Geol. 2007, 51, 743–748. [Google Scholar] [CrossRef]
  50. Petrović, T.; Zlokolica-Mandić, M.; Veljković, N.; Vidojević, D. Hydrogeological conditions for the forming and quality of mineral waters in Serbia. J. Geochem. Explor. 2010, 107, 373–381. [Google Scholar] [CrossRef]
  51. Vasić, L.; Živojinović, D.; Rajaković-Ognjanović, V. Hydrochemical changes and groundwater grouping data by multivariate statistical methods within one karst system: Recharge-discharge zone (Eastern Serbia case study). Carbonates Evaporites 2020, 35, 15. [Google Scholar] [CrossRef]
  52. Aluwong, K.C.; Hashim, M.H.M.; Ismail, S.; Shehu, S.A. Modeling pH changes and electrical conductivity in surface water as a result of mining activities. Nauk. Visnyk Natsionalnoho Hirnychoho Universytetu 2024, 1, 122–129. [Google Scholar] [CrossRef]
  53. Tiwari, R.C. Assessment of Water Pollution through Its Electrical Conductivity and pH Measurement. Asian J. Water Environ. Pollut. 2009, 6, 99–103. [Google Scholar] [CrossRef]
  54. Ribeiro de Sousa, D.N.; Mozeto, A.A.; Carneiro, R.L.; Fadini, P.S. Electrical conductivity and emerging contaminant as markers of surface freshwater contamination by wastewater. Sci. Total Environ. 2014, 484, 19–26. [Google Scholar] [CrossRef]
  55. Sinclair, A.J. Selection of threshold in geochemical data using probability graphs. J. Geochem. Explor. 1974, 3, 129–149. [Google Scholar] [CrossRef]
  56. Sinclair, A.J. A fundamental approach to threshold estimation in exploration geochemistry: Probability plots revisited. J. Geochem. Explor. 1991, 41, 1–22. [Google Scholar] [CrossRef]
  57. Marinković, V.; Obradović, L.; Bugarin, M.; Stojanović, G. The impact of polluted wastewater on water quality of the Bor river and surrounding groundwater. Min. Metall. Eng. Bor 2014, 3, 33–40. [Google Scholar] [CrossRef]
  58. Marković, R.; Marjanović, V.M.; Stevanović, Z.; Gardić, V.; Petrović, J.; Kovačević, R.; Štirbanović, Z.; Friedrich, B. Importance of Changes in the Copper Production Process through Mining and Metallurgical Activities on the Surface Water Quality in the Bor Area, Serbia. Metals 2024, 14, 649. [Google Scholar] [CrossRef]
  59. Helsel, D.R.; Hirsch, R.M.; Ryberg, K.R.; Archfield, S.A.; Gilroy, E.J. Statistical Methods in Water Resources; U.S. Geological Survey Techniques and Methods, Book 4, Chapter A3; U.S. Geological Survey: Reston, VA, USA, 2020; 458p. [Google Scholar] [CrossRef]
  60. Bao, J.; He, J.; Hu, N.; Xiong, H.; Chen, Y.; Huang, L. Removal characteristics of heavy metals from polluted river water purified by hybrid constructed wetlands. Sci. Total. Environ. 2025, 959, 178162. [Google Scholar] [CrossRef] [PubMed]
Figure 1. Study area showing rivers, sampling locations, mines, and Bor City.
Water 18 01414 g001
Figure 2. Seasonal variation in pH in river water samples collected at sites W1–W12.
Water 18 01414 g002
Figure 3. Seasonal variation in electrical conductivity in river water samples collected at sites W1–W12.
Water 18 01414 g003
Figure 4. Seasonal variation in sulfate concentrations in (a) unpolluted river water and (b) polluted river water. The dashed line represents the region-specific geochemical threshold value for sulfates in the river water of the study area.
Water 18 01414 g004
Figure 5. Seasonal variation in copper concentrations in (a) unpolluted river water and (b) polluted river water. The dashed line represents the region-specific geochemical threshold value for copper in the river water of the study area.
Water 18 01414 g005
Figure 6. Seasonal variation in manganese concentrations in (a) unpolluted river water and (b) polluted river water. The dashed line represents the manganese region-specific geochemical threshold in the river water of the study area.
Water 18 01414 g006
Figure 7. Seasonal variation in iron concentrations in (a) unpolluted river water and (b) polluted river water. The dashed line represents the region-specific geochemical threshold value for iron in the river water of the study area.
Water 18 01414 g007
Figure 8. Piper diagram showing water types.
Water 18 01414 g008
Table 1. Composition of river water samples.
pHEC
µS/cm
SO42−
mg/L
Cu
µg/L
Fe
µg/L
Mn
µg/L
As
µg/L
LOD 0.103.33.71.62.1
W1Summer7.9847036.7<3.310.32.8<2.1
Autumn8.0739271.66.114.1<1.62.2
Winter8.0839935.9<3.35.9<1.62.4
W2Summer8.1648732.1<3.330.25.1<2.1
Autumn7.9258279.28.350.83.5<2.1
Winter7.4843137.2<3.317.19.12.2
W3Summer7.2558247.1<3.3<3.7<1.6<2.1
Autumn7.7960776.75.611.9<1.62.2
Winter7.4845640.5<3.311.16.82.2
W4Summern.d.n.d.n.d.n.d.n.d.n.d.n.d.
Autumn7.5558810118.477.23.74.1
Winter8.2546257.317.416.020.0<2.1
W5Summern.d.n.d.n.d.n.d.n.d.n.d.n.d.
Autumn7.6357610220.286.93.73.7
Winter8.2943461.517.315.020.4<2.1
W6Summer7.131321998<3.315.31741<2.1
Autumn6.3718361472102417470<2.1
Winter7.30139088146.513.9262<2.1
W7Summer7.5211121272<3.320.31231<2.1
Autumnn.d.n.d.n.d.n.d.n.d.n.d.n.d.
Winter7.1811505691018.2161<2.1
W8Summer7.58221912539.243.11470<2.1
Autumnn.d.n.d.n.d.n.d.n.d.n.d.n.d.
Winter7.161393657128136208<2.1
W9Summer7.9741865.33.520.74.26.9
Autumn7.571033150439378.22064<2.1
Winter7.61120035716.417213423.3
W10Summer8.83111340620.932.45104.1
Autumn7.63111341967.798.015313.2
Winter7.8873123469.624.1284<2.1
W11Summer9.1974248725.310177.04.8
Autumn7.4587755221726.91246<2.1
Winter7.599053891291271039<2.1
W12Summer8.3765153121.910164.04.2
Autumn7.5798132372.344.6635<2.1
Winter6.9066719488.314.3219<2.1
Notes: LOD—limit of detection; n.d.—no data; W1, W2, W3—river water from a non-polluted area; W4, W5—river water of the Timok River, a tributary of the Danube River, receiving water from mining activities; W6 to W12—river water from the mining area.
Table 2. The results of a difference in river water pollution by statistical analysis.
SO42−
Reduction, %
Cu
Reduction, %
Fe
Reduction, %
Mn
Reduction, %
As
Reduction, %
W1025.1799.8799.9683.6199.89
W1172.1999.5199.9796.3499.17
W746.1099.7399.9898.3497.88
W839.1799.5799.9097.0796.32
W1266.6799.77100.0097.3199.77
W439.3990.8197.5890.2443.84
W545.9586.4064.4284.3838.71
p-value0.0040.0070.130.0030.83
Disclaimer/Publisher’s Note: The statements, opinions and data contained in all publications are solely those of the individual author(s) and contributor(s) and not of MDPI and/or the editor(s). MDPI and/or the editor(s) disclaim responsibility for any injury to people or property resulting from any ideas, methods, instructions or products referred to in the content.