Article

Development of a Conceptual Hydrogeological Model Based on Geological Mapping and Stable Isotopes: A Case Study of Šmarna Gora, Slovenia


1
Geological Survey of Slovenia, Dimičeva ulica 14, 1000 Ljubljana, Slovenia
2
Croatian Geological Survey, Milana Sachsa 2, 10 000 Zagreb, Croatia
3
JP VOKA SNAGA, Vodovodna cesta 90, 1000 Ljubljana, Slovenia
*
Author to whom correspondence should be addressed.
Water 2026, 18(12), 1386; https://doi.org/10.3390/w18121386
Submission received: 21 April 2026 / Revised: 28 May 2026 / Accepted: 3 June 2026 / Published: 6 June 2026
(This article belongs to the Special Issue Application of Isotope Geochemistry in Hydrological Research)

Abstract

Small decentralized water supply systems are often sensitive to local pollution and require a clear understanding of recharge conditions and the hydrodynamics within the water resource catchment. This study develops a conceptual hydrogeological model for the Šmarna Gora area based on geological mapping, long-term monitoring of chemical parameters, and stable isotope analyses (δ18O, δ2H) of precipitation and groundwater. The study was initiated in response to rising pollutant concentrations in the drinking water. Estimates of transit time (TT) and mean residence time (MRT) were used to characterize recharge, mixing processes, and differences between the SG and ZAVRH wells, the existing and alternative water supply wells. Isotope data show that the aquifer is predominantly recharged during colder periods and that Mediterranean air masses have become an increasingly important source of precipitation, suggesting a shift in precipitation patterns. The results indicate that SG has longer TT (6–8 months) and MRT (up to 1–2 years). In contrast, ZAVRH shows shorter TT and MRT (4–6 months), and lower pollutant concentrations. The hydrogeological regime in the catchment of the ZAVRH well is characterized by a dynamic, fast-flowing system with limited storage and more intensive dilution of contaminants by infiltrating water, whereas the catchment of the SG well functions as a deeper and more buffered aquifer with prolonged groundwater residence and a more direct hydraulic linkage to the contaminant source. The findings distinguish two hydrogeological regimes and provide a basis for planning water supply solutions and protection measures.

1. Introduction

Carbonate aquifers are an important source of drinking water, supplying nearly 10% of the global population [1]. Compared to karstified limestone aquifers, dolomitic aquifers generally constitute a smaller proportion of carbonate aquifer systems. In Slovenia, carbonate rocks cover nearly half of the national territory [2], while dolomite outcrops account for approximately 8% of the surface area [3]. Despite their relatively limited extent, dolomite aquifers play an important role in water supply, primarily due to their more stable discharge regimes, longer groundwater residence times, and higher storage capacity [4,5]. These characteristics make dolomitic formations a more drought-resilient and sustainable water resource [6].
Stable isotopes of oxygen (δ18O) and hydrogen (δ2H) are widely applied natural tracers in hydrogeological investigations of karst and carbonate aquifers. The isotopic composition of groundwater primarily reflects the isotopic signal of precipitation, which is governed by climatic factors such as temperature, altitude, seasonality, and moisture source [7,8,9]. In karst environments, δ18O and δ2H are particularly valuable for characterizing recharge conditions, identifying recharge areas, and estimating groundwater residence times [10,11,12]. Due to their largely conservative behavior during underground flow, stable isotopes enable the assessment of groundwater mixing processes and the differentiation between rapid conduit flow and slower diffuse infiltration, which are key features of karst aquifer dynamics [12,13]. Moreover, the application of stable isotopes contributes significantly to the evaluation of aquifer vulnerability and the sustainable management of drinking water resources, especially in small and sensitive water supply systems [11,13].
Ensuring a safe and reliable drinking water supply is a complex task that depends on technology, the historic development of settlements, socioeconomic conditions, and local environmental conditions, particularly hydrogeological conditions [14]. The evolution of water infrastructure has been shaped by urbanization and industrialization, leading to a predominant reliance on centralized drinking water supply systems. Centralized systems offer important benefits, including economies of scale, standardized water quality control, professional operation and monitoring, and improved redundancy through interconnected distribution networks [15]. However, in sparsely populated regions, remote settlements, and small communities, centralized supply may be economically inefficient or technically infeasible due to high capital costs for transmission infrastructure and maintenance burdens. In such cases, decentralized water supply systems can provide viable alternatives, offering advantages such as shorter distribution routes, local operational flexibility, and reduced infrastructure demands [16,17]. These systems, however, often face limitations linked to inadequate community-based capacities, ineffective system operation, and their increased exposure to external pressures such as climatic events [15,18]. Effective decision-making for decentralized water supply solutions therefore requires not only technological and economic assessment but also robust environmental and hydrogeological evaluation. Information on groundwater vulnerability, recharge characteristics, anthropogenic pressures, and contaminant pathways is essential for determining the long-term sustainability of small water systems and for selecting appropriate protection measures [19].
Šmarna Gora is the smallest public water supply system in the Municipality of Ljubljana, situated at one of its highest elevations. Due to challenges in maintaining compliance with drinking water standards at the Šmarna Gora (SG) well, alternative solutions are being considered, including replacing the SG well with the ZAVRH well or extending the central water supply network to this area.
This study aims to determine the recharge area of the SG well, the dynamics of groundwater, and the residence time of rainwater or potential contaminants from the surface at the top of Šmarna Gora to reach the SG and ZAVRH wells. The study is a synthesis of geological mapping and hydrogeological data interpretation, with a focus on stable isotope analysis. Isotope-based indicators are used to identify recharge conditions, evaluate groundwater mixing, and assess differences in transit time and mean residence time between the two wells. This integrated approach supports the identification of distinct groundwater flow regimes, assessment of aquifer vulnerability, and assurance of water supply sustainability.

2. Materials and Methods

2.1. Study Area

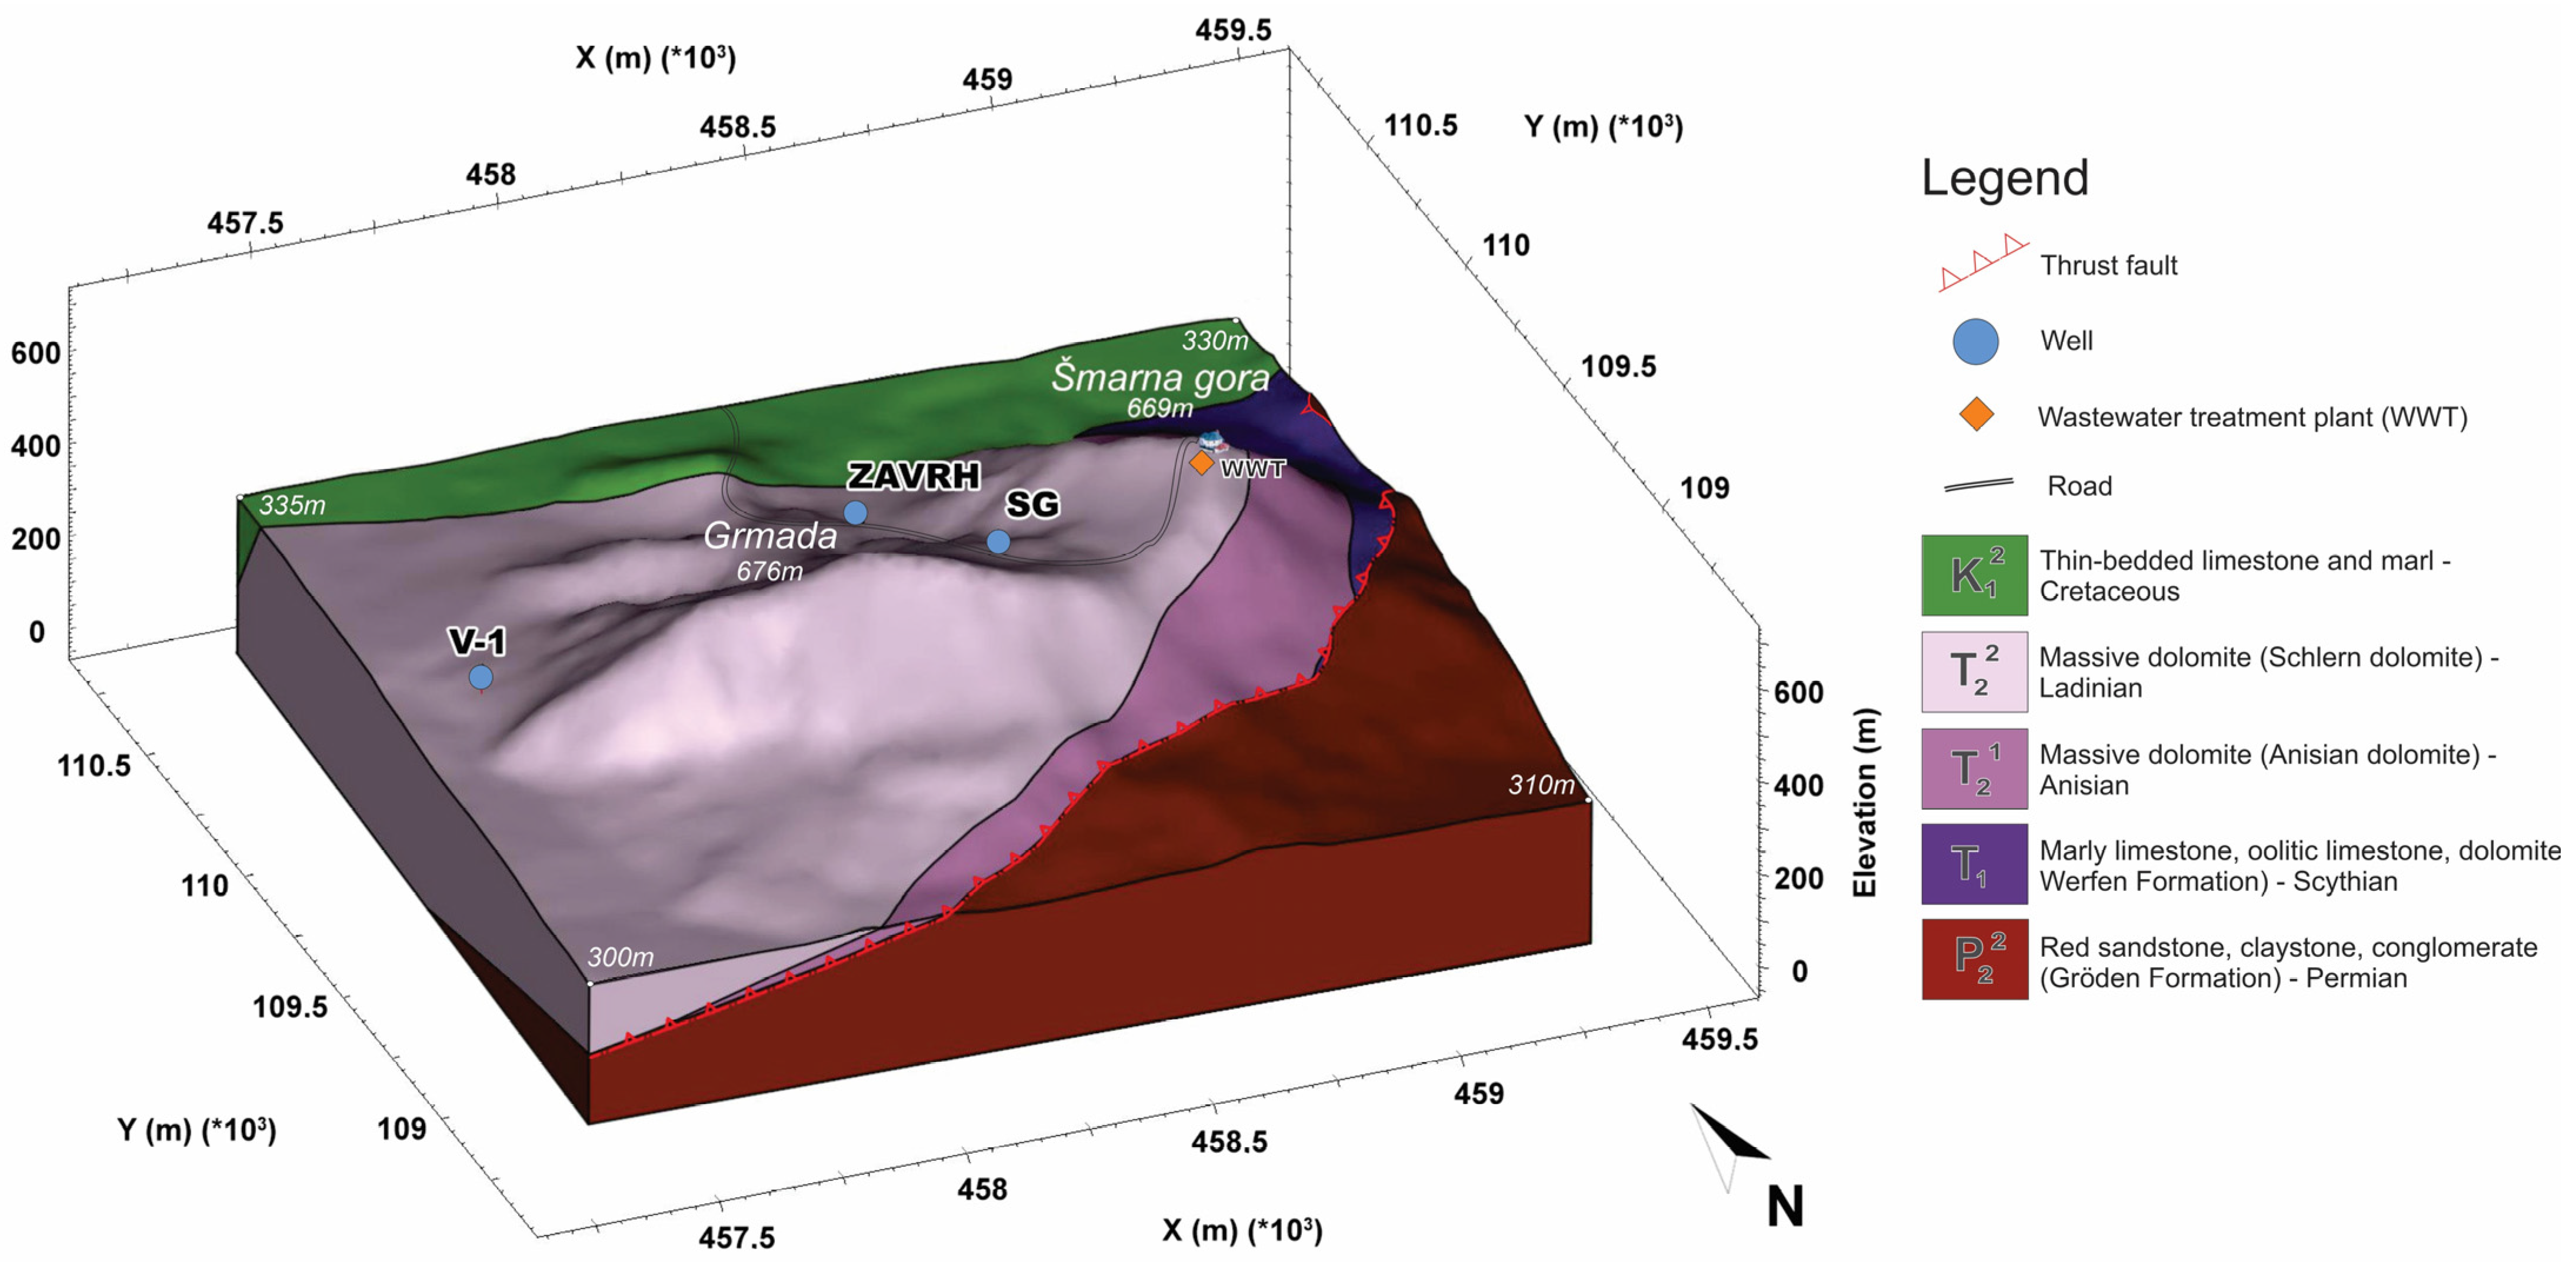
Šmarna Gora is a hill near Ljubljana, the capital of Slovenia (Figure 1). It is a popular hiking destination with a restaurant, a church and a few houses at the summit. Tourism and agriculture are the main economic activities in the area. The drinking water supply system on Šmarna Gora was put into operation in 2008. Three boreholes were drilled with the aim of supplying drinking water (Figure 2). The main borehole characteristics provided by VO-KA SNAGA—Water Supply Public Utility Company are summarized in Table 1. Based on the borehole logs, all three wells (SG, ZAVRH, and V-1) were drilled entirely within dolomite.
The water supply system consists of a production well with a submersible pump, a disinfection unit, a water reservoir and an additional pumping station for supplying drinking water from the reservoir to the top of the hill. A telemetry system enables remote operation and monitoring. The water supply network is 800 m long, and the annual pumping volume averages 1600 m3. The main user of drinking water is the restaurant at the top of the hill. Before the construction of the drinking water system, water supply relied on rainwater collected from roofs and on tanker deliveries. The main threat to drinking water quality is wastewater from the restaurant. The small wastewater treatment plant at the top of Šmarna Gora provides partial treatment, and the effluent is discharged into the subsurface. Activities initiated at the end of 2021 resulted in a system upgrade, leading to improved nitrogen and phosphorus removal and the implementation of UV disinfection of the treated effluent.

Geological Setting

Šmarna Gora is a solitary hill, 669 m high, in the central part of the Ljubljana Basin, where the flat terrain lies at an elevation of approximately 300 m above sea level, corresponding to the level of the Sava River in this area. Detailed geological mapping [20] has revealed that the lower parts of its southern and eastern slopes consist of soft Paleozoic rocks, which result in gentle slopes (Figure 2). The higher slopes are steeper due to their dolomite composition. A thrust fault separates the overlying block from the underlying one. The position of the thrust contact between the upper and the lower thrust units of the hill can only be interpreted from surface contacts, as no borehole has reached the contact and no geophysical investigations have been conducted. The thrust plane dips approximately 20 degrees northward [20]. The underlying block is composed of claystone, sandstones, and conglomerates from the Permo-Carboniferous (P, C) and Gröden (P22) formations. The overlying block is composed of Triassic and Cretaceous dolomites and limestone, with an erosional unconformity between the Triassic and Cretaceous units. These layers dip to the west and west-northwest. Fracture zones within the dolomite have a predominant northeast–southwest orientation.
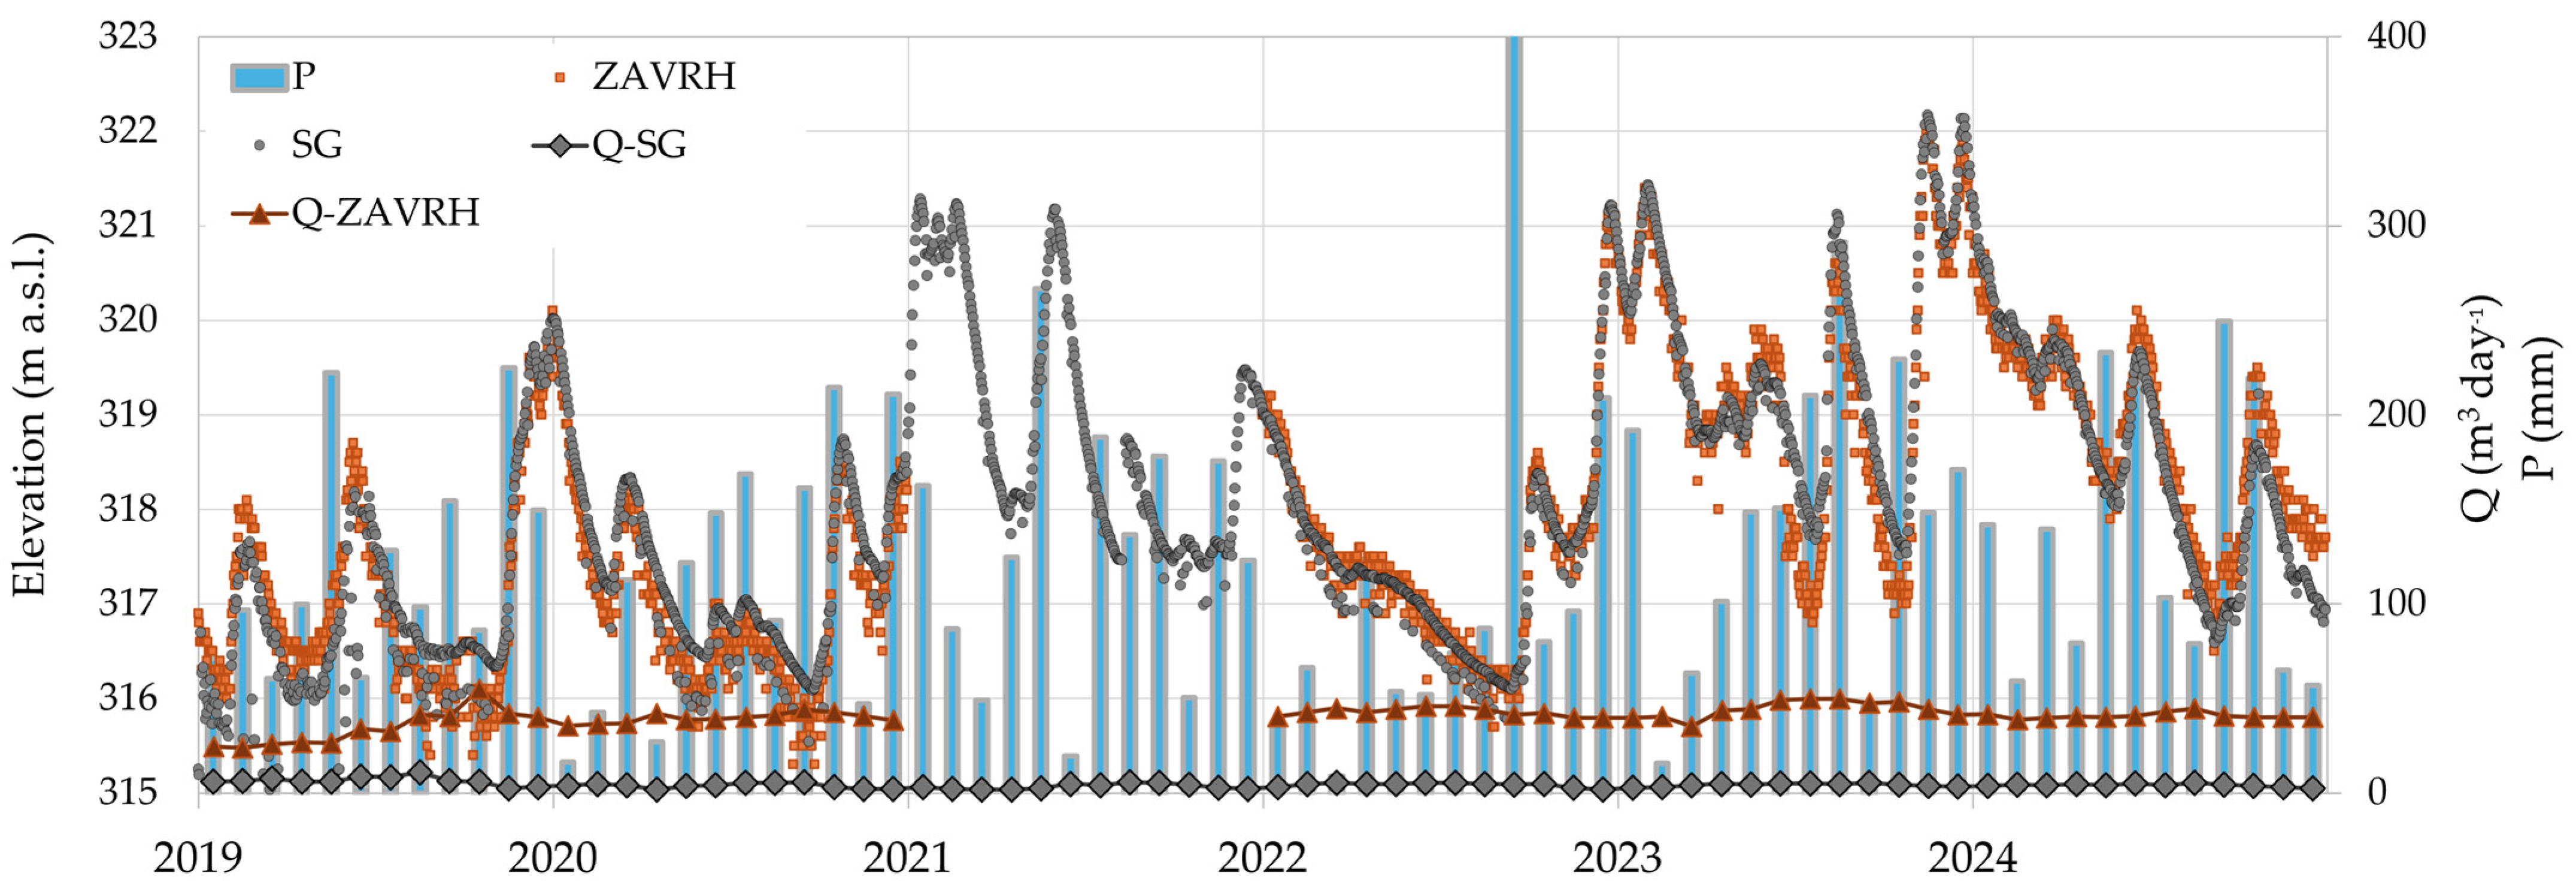
Groundwater levels in wells SG and ZAVRH, approximately 500 m apart, were continuously monitored for approximately six years (Figure 3). For borehole V-1, only one measurement was recorded on 28 February 2020, indicating a groundwater level elevation of 314 m a.s.l. The groundwater-level measurements at well ZAVRH were unavailable during this period due to monitoring technical limitations. Pumping rates from both wells were relatively constant over the observed period, averaging 4.47 m3 day−1 at well SG and 40.47 m3 day−1 at well ZAVRH. These relatively low and stable pumping rates do not show an evident influence on groundwater level fluctuations, which are primarily controlled by hydrological conditions driven by precipitation dynamics (Figure 3).

2.2. Groundwater Sampling and Analysis

Chemical-parameter monitoring was carried out in accordance with the provisions of the national Drinking Water Regulation [21]. The chemical parameters of the water at well SG have been monitored monthly, and data are available for the period of 2010–2025 [22]. Water temperature was measured together with electrical conductivity in pumped groundwater during chemical sampling. During this period, chemical-parameter measurements were also performed at the ZAVRH well, although the sampling frequency and data set are more limited compared with the SG well.
To evaluate temporal trends in selected chemical parameters, a non-parametric Mann–Kendall trend test was applied. To reduce the influence of uneven sampling frequency and potential serial correlation, the analysis was performed on annual median values. Where changes in trend behavior were suggested by the data, the Mann–Kendall test was applied separately to selected sub-periods. Trend magnitude was estimated using Sen’s slope, and statistical significance was evaluated at a significance level of α = 0.05.
Qualitative analysis of volatile and semi-volatile organic compounds, conducted in 2019 using passive sampling, liquid–liquid extraction, gas chromatography, and mass spectrometry, confirmed the presence of trace compounds characteristic of urban environments. These included plasticizers, cosmetics and fragrances, UV absorbers, dyes, and antimicrobials [21].

2.3. Stable Isotope Analyses

Rainwater and groundwater samples for stable isotope analyses (δ18O and δ2H) were collected over a four-year period (2021–2024). Groundwater samples were collected using a submersible pump, while rainwater samples were collected with a precipitation collector installed near the wellhead of the SG well (Figure 2). In total, 81 rainwater samples and 86 groundwater samples from the SG well were collected at approximately monthly intervals. At the ZAVRH well, sampling began later (in April 2022), and 50 samples were collected in total. To estimate cumulative rainfall height, daily precipitation data from the nearest meteorological station (Šentvid) of the national monitoring network [23] were used.
Groundwater and rainwater samples were analyzed in the Slovenian Geological Survey laboratory using the Picarro L2130-i laser isotope analyzer (Picarro, Santa Clara, CA, USA) [24], which applies wavelength-scanned cavity ring-down spectroscopy (WS-CRDS) to determine the isotopic composition of δ18O and δ2H in water samples. The results are expressed as δ values (‰), representing the relative difference in isotopic composition between the sample and the reference standard. The measurements were normalized using reference materials USGS45 and USGS47, which have defined isotopic compositions. To independently verify measurement repeatability and assess potential memory effects, the laboratory reference material W-998, calibrated to the VSMOW-SLAP scale, was used. Each water sample was measured six times; however, the first four measurements were discarded due to the memory effect. The final isotopic composition of each sample was therefore calculated as the mean of the fifth and the sixth measurements. Statistical analyses of stable isotope and hydrochemical data were performed using the R 4.6.0 programming environment [25]. Lag-correlation analysis was applied to evaluate and verify the calculated transit time (TT) and mean residence time (MRT) by analyzing the temporal relationship between precipitation events and chloride concentrations in groundwater. The local meteoric water line (LMWL) was determined using three linear regression approaches, including two recommended by the IAEA: ordinary least squares regression (OLSR) and reduced major axis (RMA) regression. In addition, a precipitation-weighted least squares regression (PWLSR) method, which incorporates precipitation amounts into the calculation [26], was applied.
The deuterium excess (d-excess) was calculated for each sample according to the Dansgaard formula [8]:
d-excess (o/oo) = δ2H − 8 δ18O.
The observed seasonal and interannual groundwater-level responses (Figure 3) to precipitation and recharge events imply active groundwater circulation and limited storage of very old water. In aquifers with residence times exceeding several years, hydraulic signals are typically strongly attenuated due to mixing and large storage volumes, which was not observed in this case. The method described by Kralik (2015) [27] was applied to calculate the groundwater mean residence time (MRT). Because precipitation showed clear seasonal isotope patterns (e.g., heavier isotopes in summer, lighter in winter), the amplitudes of these variations were compared between precipitation and groundwater. Over time, as recharge water moves through the unsaturated and saturated zones, mixing reduces the amplitude of the seasonal signal in groundwater. The MRT is calculated using the ratio of the seasonal amplitude in groundwater (b) to that in precipitation (a) over several years, applying the formula:
MRT = (1/2 π) × √(1 /(b/a)2) − 1 (years).
However, transit time (TT) and MRT are related but not identical. TT refers to the travel time distribution of individual water parcels from recharge to discharge, while MRT is the average of all those transit times. In simple flow systems, they can be similar, but in systems with strong mixing, MRT may differ significantly from the dominant TT. TT was also estimated from seasonal variations in stable isotopes in precipitation and groundwater. The amplitude of the isotope signal in groundwater (b) is compared to that in precipitation (a) to determine the damping effect caused by mixing and dispersion along the flow path [27,28]. For a well-mixed (exponential) model, TT is given by
TT = 1⁄ω √((b/a)2) − 1,
where ω = 2π yr−1, corresponding to an annual cycle [28].
For systems influenced by dispersion, the dispersion model was applied, incorporating a Péclet number (Pe) to account for longitudinal dispersion. This model relates b/a to TT through
b/a = exp (Pe/2 (1 − √(√(1 + (4ωTT/Pe)2 + 1)/2))).

3. Results and Discussion

3.1. Physicochemical Parameters

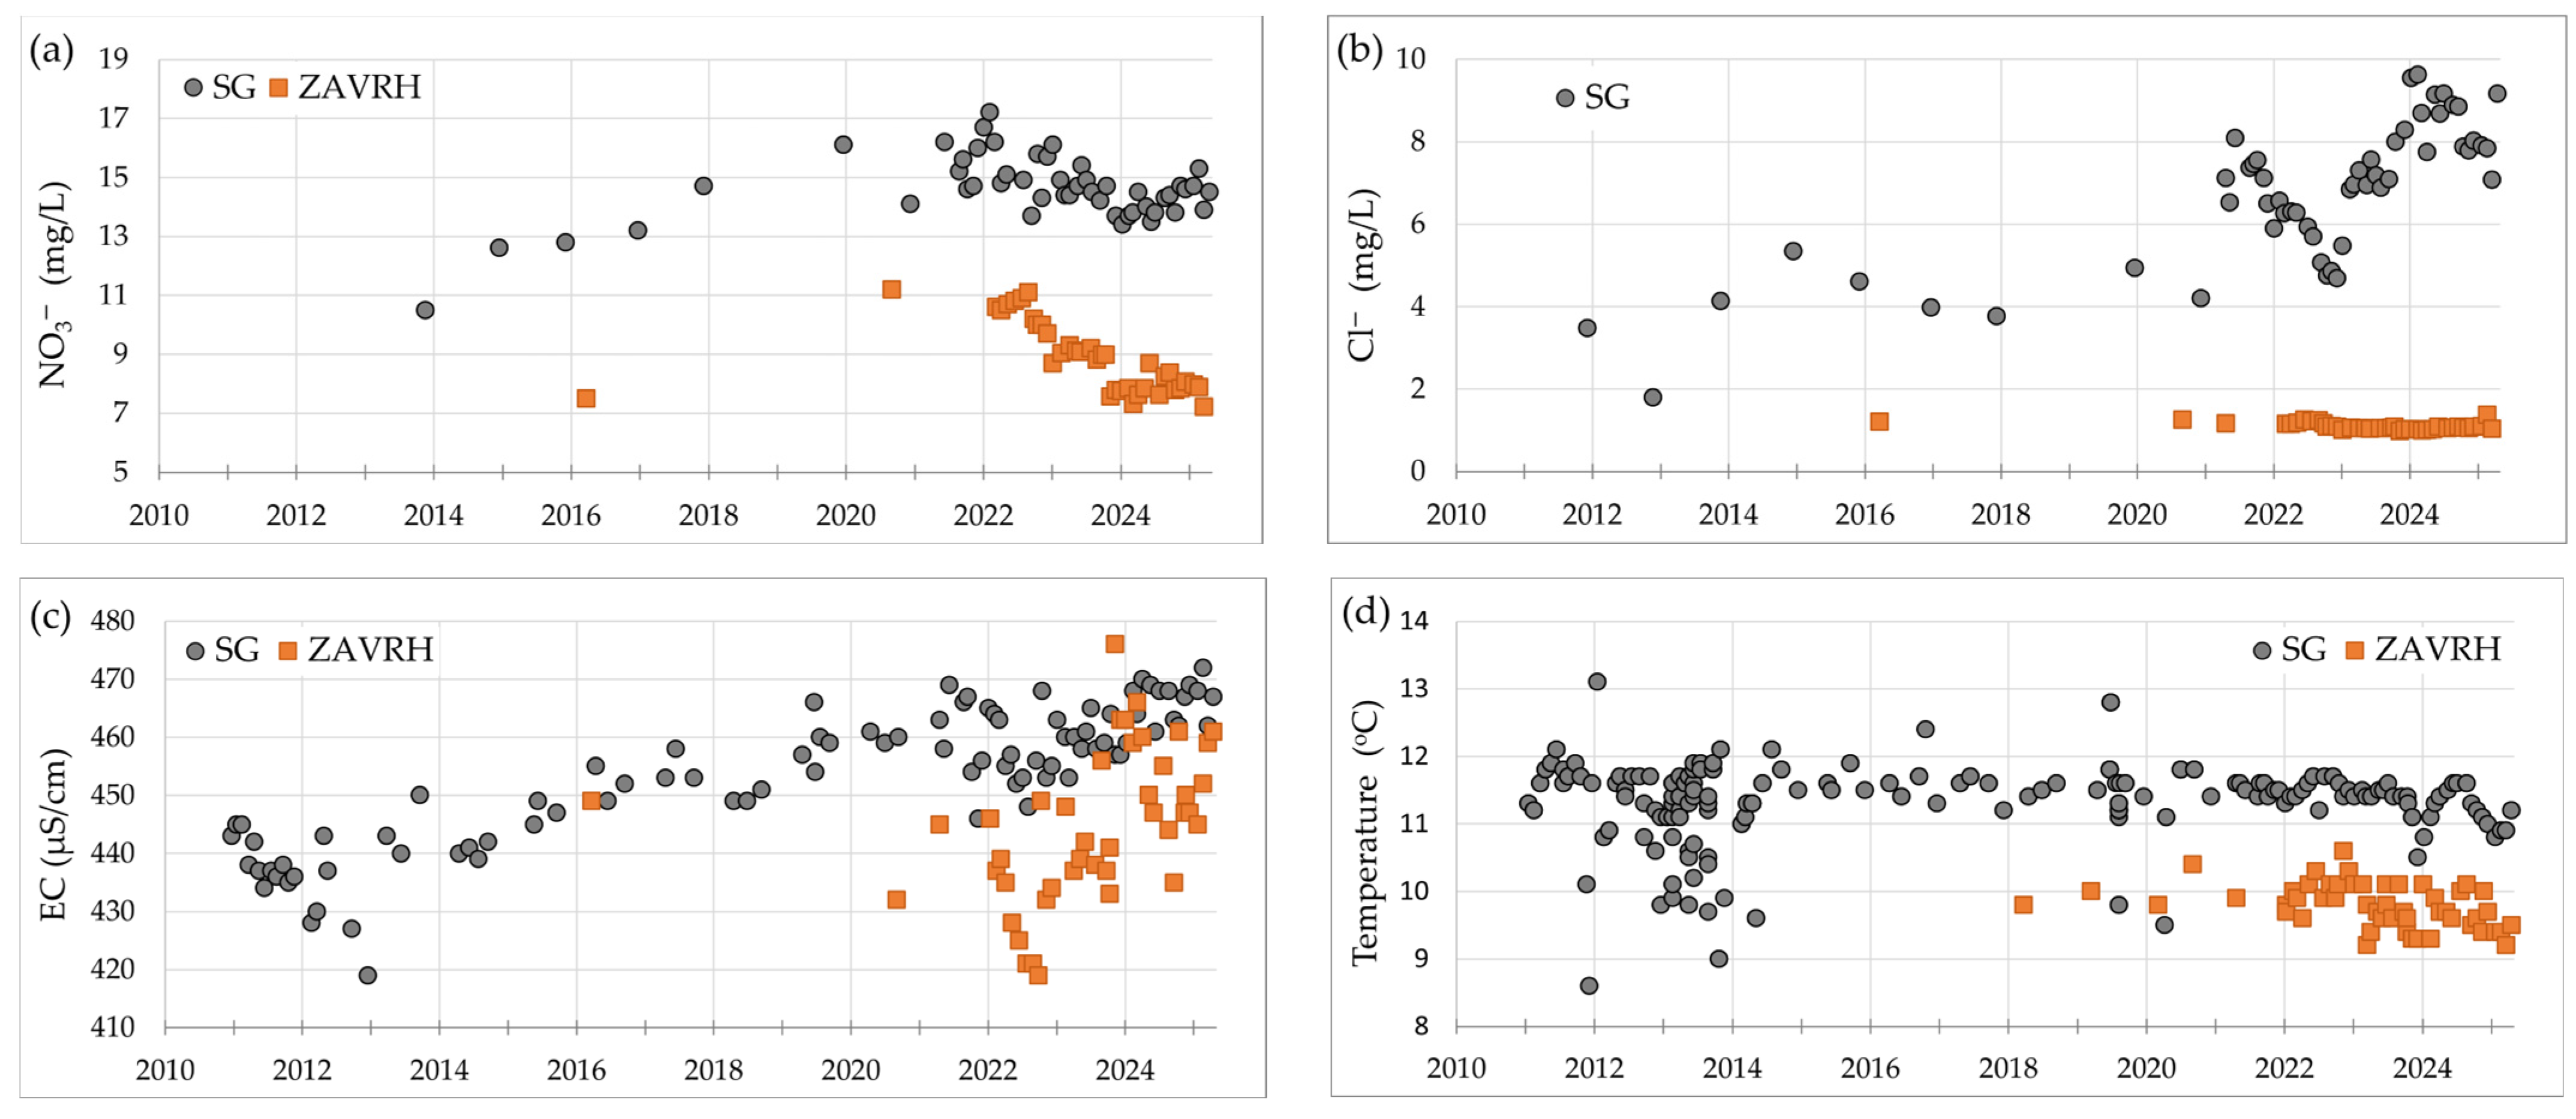
Drinking water parameters measured between 1 January 2010 and 1 May 2025 remained within regulatory limits. However, an increasing trend was observed in the SG well for several basic parameters, including nitrate and chloride concentrations and electrical conductivity (Figure 4a–c).
Nitrate concentrations at SG generally increased until 2019, with a statistically significant upward trend and a Sen’s slope of +0.9 mg/L yr−1 (Figure 4a). After 2019, nitrate concentrations began to decrease, although no statistically significant monotonic trend was detected for this later period. This temporary decrease may be related to reduced visitor activity and restaurant closure during the COVID-19 pandemic, as well as upgrades to the wastewater treatment plant and improved nitrogen removal efficiency. Despite concentrations remaining well below the drinking water limit of 50 mg/L [21], the observed trends indicate potential anthropogenic influence and increasing pollutant input. Measurements at ZAVRH are less frequent but consistently lower, by approximately 4 mg/L, and show a similar general temporal pattern with a non-significant decreasing tendency in recent years (Sen’s slope ≈ −0.6 mg/L yr−1).
Chloride concentrations at SG also showed a statistically significant long-term increasing trend, despite temporal fluctuations, reaching values close to 9 mg/L in 2024 (Figure 4b), with a Sen’s slope of approximately +0.3 mg/L yr−1. In contrast, chloride concentrations at ZAVRH remained below 2 mg/L throughout the observation period, indicating a high degree of dilution of wastewater effluent and no clear temporal trend.
Electrical conductivity at SG showed a statistically significant long-term increase, with values generally rising toward 470 μS/cm in recent years (Figure 4c) and a Sen’s slope of approximately +1.6 μS/cm yr−1. Measurements at ZAVRH between 2020 and 2025 were on average around 30 μS/cm lower than those at SG. Although a weak increasing tendency is visible, the available data set is too limited to confirm a statistically significant monotonic trend.
Temperature values remained relatively stable at both wells. The median groundwater temperature at SG was approximately 11.5 °C and at ZAVRH around 10.0 °C (Figure 4d). The apparent temperature difference between the wells may indicate longer groundwater residence time at SG. However, because temperature measurements were taken at the well outlet and groundwater travel time to the surface differs between the deeper SG well and the shallower ZAVRH well, the available data do not allow a firm interpretation.
During the observation period, the concentrations of calcium and magnesium at SG remained stable, averaging 57 mg/L and 32 mg/L, respectively, with no systematic trends visible [22]. The median pH at SG showed a slight decrease, from 7.7 in 2011 to 7.6 in 2024, while at ZAVRH, the median pH in 2024 was slightly lower, at 7.4.

3.2. Stable Isotopes

Measured stable isotope δ18O values for precipitation varied from −1.94 to −15.49‰, with a mean value of −8.13‰. δ2H values for precipitation varied from −13.5 to −155.6‰, with a mean value of −53.2‰ [29]. The lowest values are measured during the cold periods, while more positive values are measured in warm periods. The measured stable isotope δ18O and δ2H values were also weighted by the amount of accumulated precipitation since the last sampling, revealing differences. These weighted δ18O values varied from −4.44‰ to −26.3‰ with a mean value of −8.62‰, while weighted δ2H ranged from −15.5‰ to −115.6‰ with a mean value of −56.3‰.
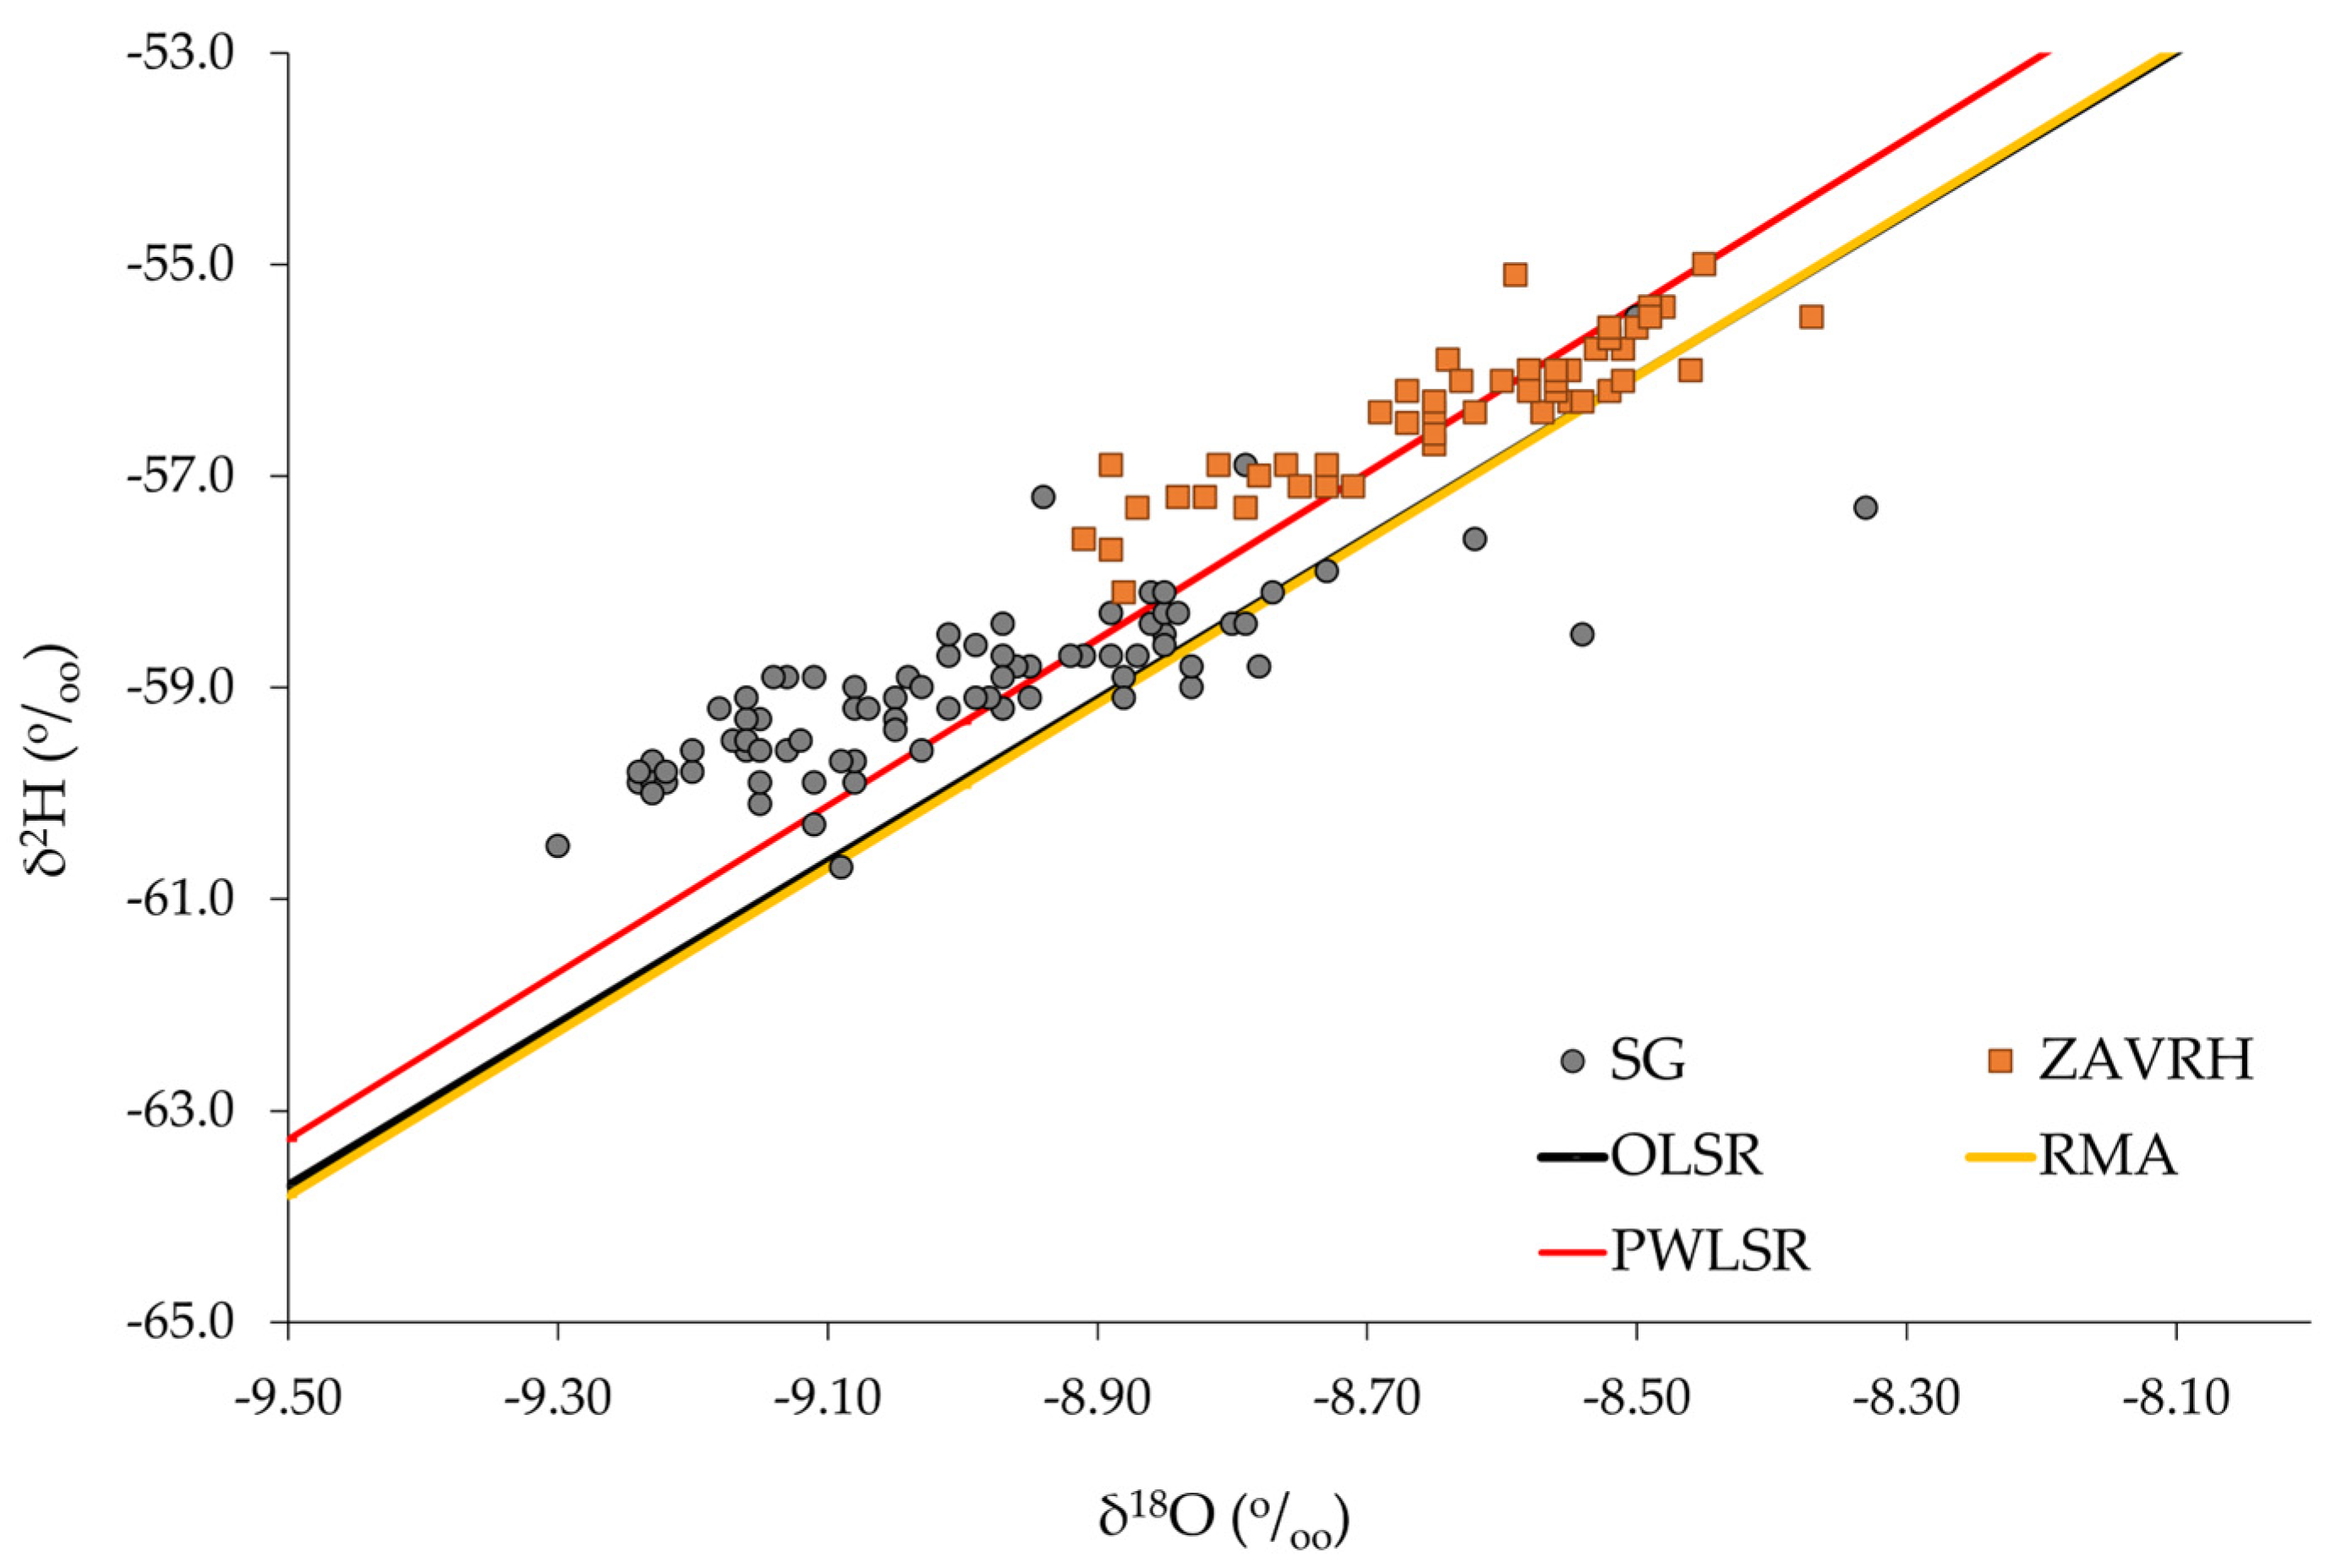
Figure 5 shows the calculated LMWLs for the monitored period, based on 81 samples and using different calculation approaches:
OLSR δ2H = (7.66 ± 0.13) δ18O + (9.06 ± 1.16).
RMA δ2H = (7.75 ± 0.13) δ18O + (9.82 ± 1.15).
PWLSR δ2H = (7.89 ± 0.11) δ18O + (11.68 ± 1.03).
The slopes of all three lines are similar, with LMWLPWOLSR having a slightly steeper slope and a higher intercept. The first two LMWLs (LMWLOLSR and LMWLRMA) are close to that of the Ljubljana Reaktor line [30]. The d-excess indicates the influence of Atlantic air masses. Nevertheless, the influence of Mediterranean air masses in the study area was observed during the autumn and winter months (Figure 6). Precipitation from Mediterranean air masses is characterized by a higher d-excess compared to that from Atlantic air masses. In addition, weighted values are higher than non-weighted ones. Generally, based on the lines from Vreča et al. [30,31], the d-excess is higher. There are several reasons for this: the Šmarna Gora rain sampler is located at a higher altitude than the rain sampler at Reaktor and, potentially more importantly, previous regional studies have suggested changes in dominant precipitation patterns and moisture source contributions over time [32,33]. Increased influence of Mediterranean-derived air masses in the continental part has been reported, particularly during colder periods when northern and western air masses would typically prevail [32,33]. Our observations are consistent with these reported regional tendencies. This change in atmospheric patterns could serve as a useful basis for determining the mean residence time (MRT) and transit time (TT) of the monitored groundwater.
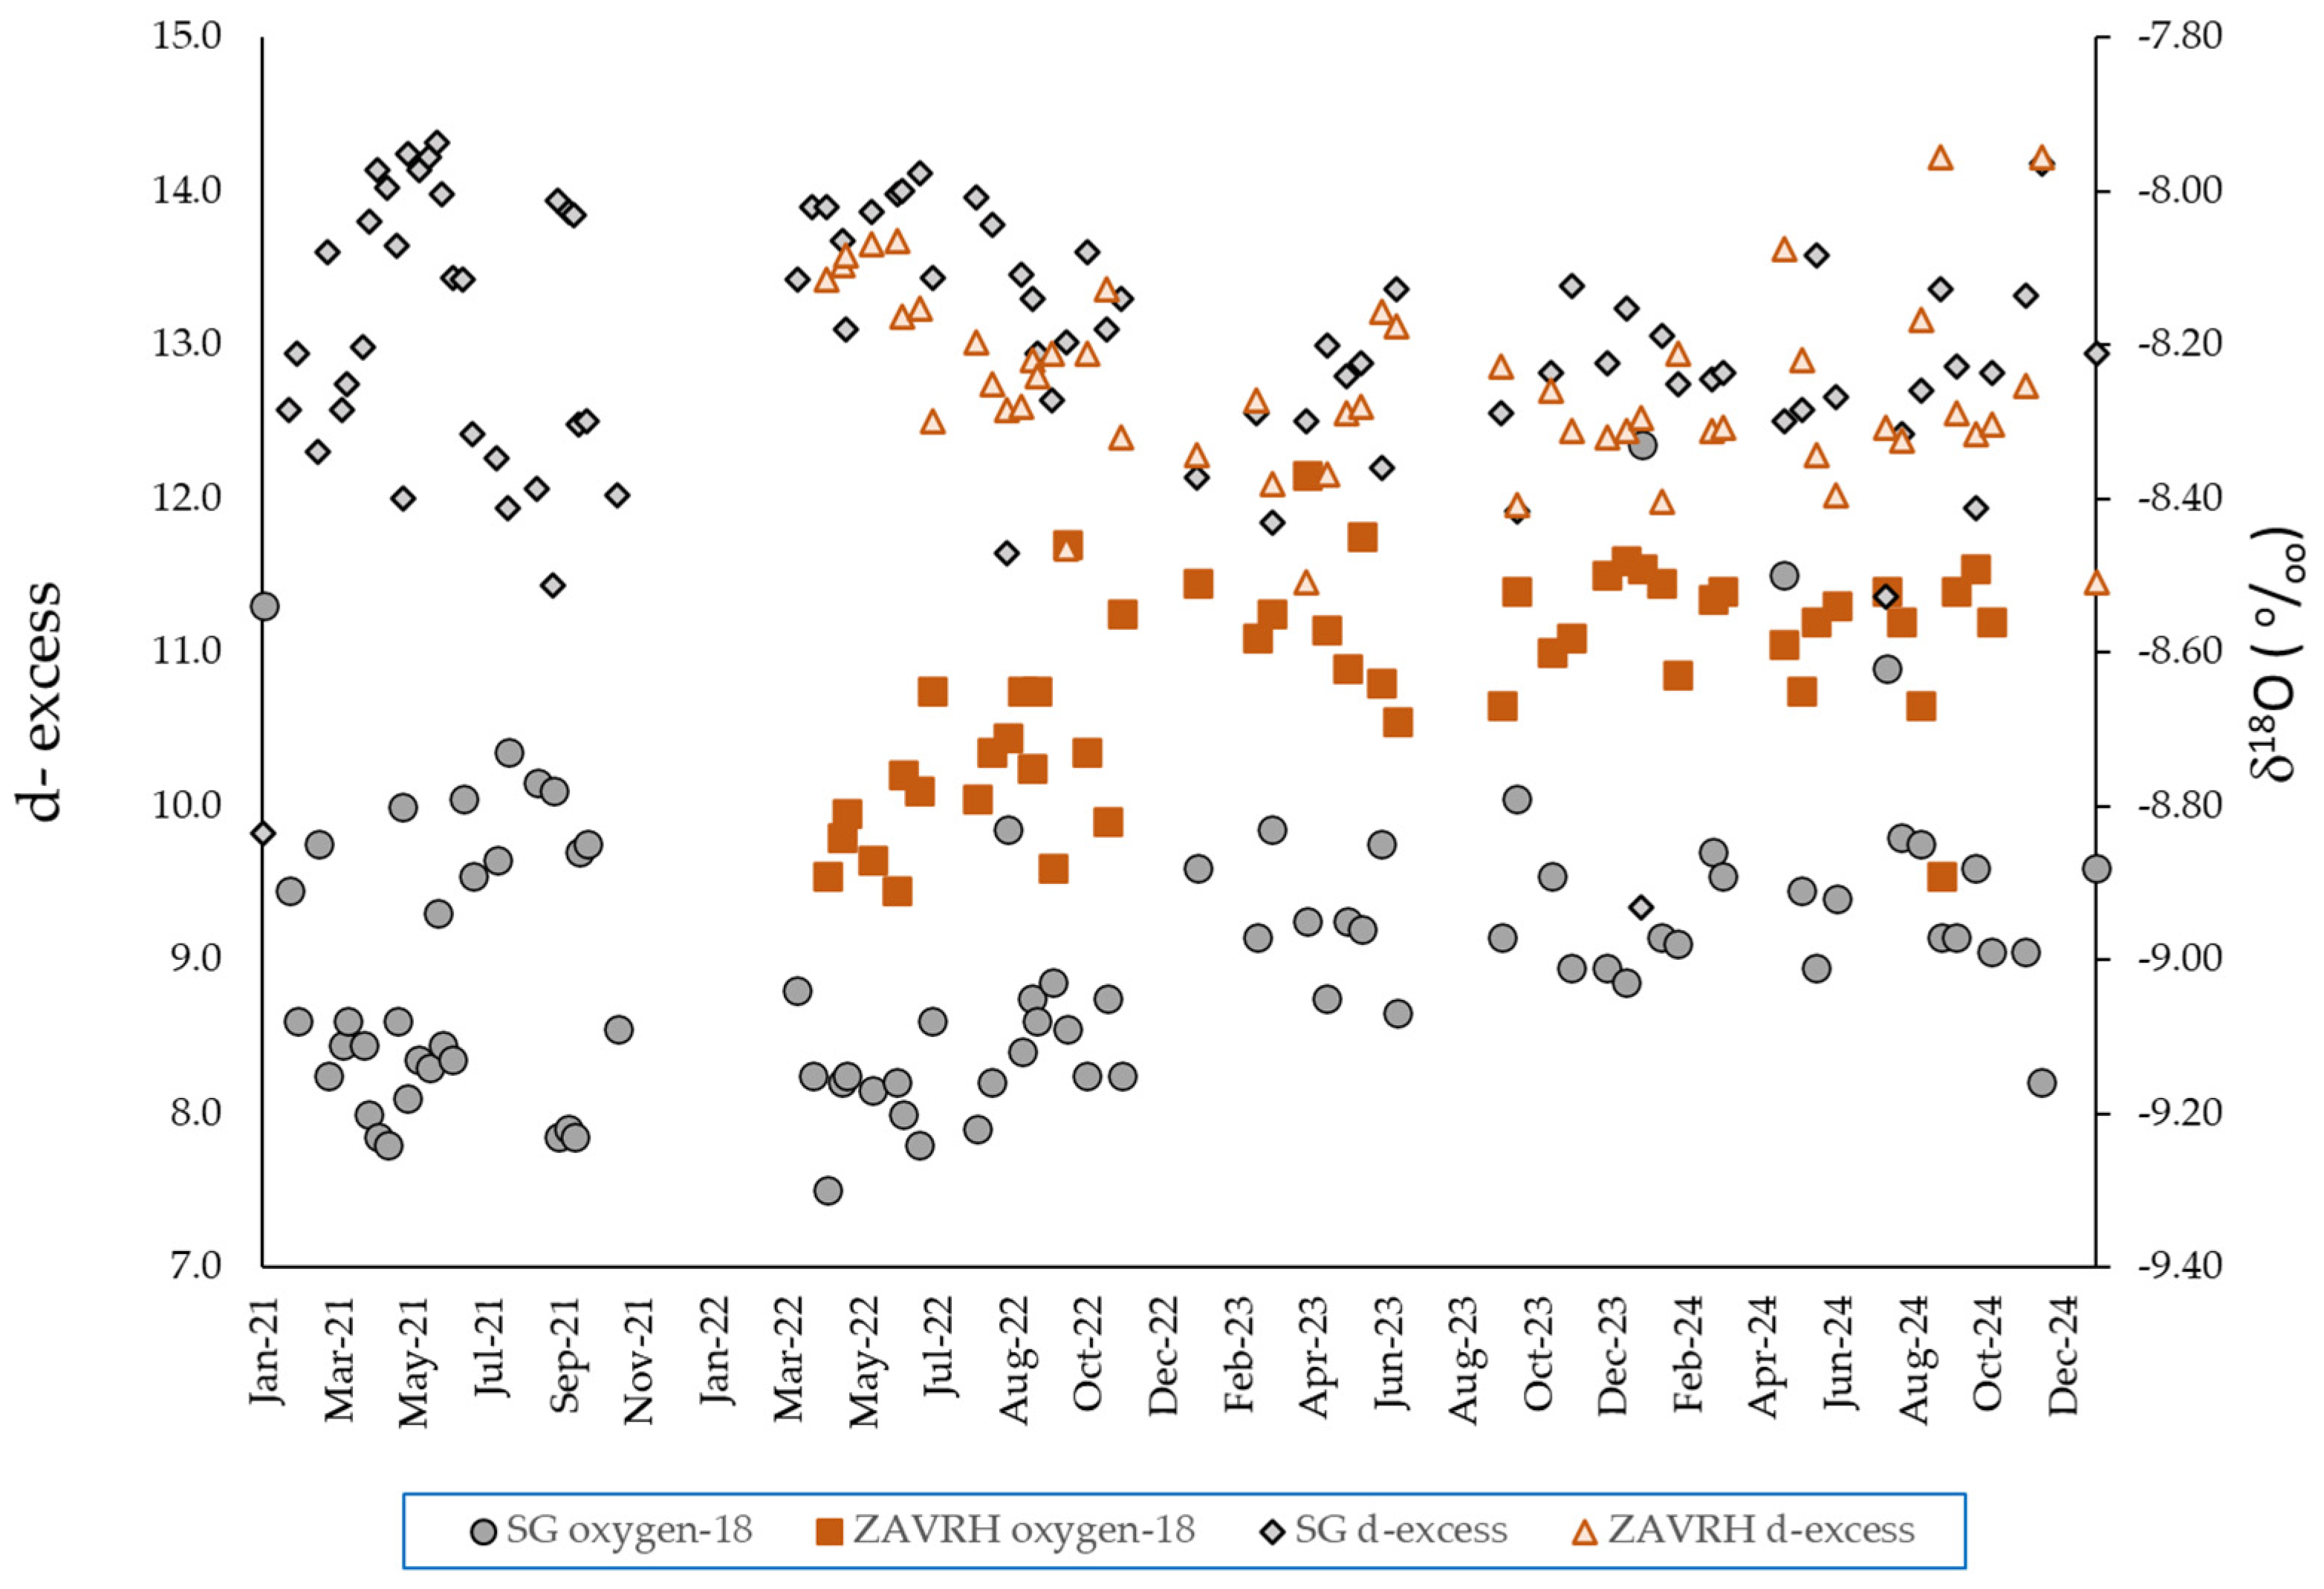
In Figure 6, a separation can be observed between the measured isotope values in groundwater at wells SG and ZAVRH. The ZAVRH values are slightly more positive, while the SG values are more negative, indicating differences in TT and MRT. Measured stable isotope δ18O values for SG varied from −8.33 to −9.30 ‰, with a mean value of −9.00‰. δ2H values for precipitation varied from −55.5 to −60.7‰, with a mean value of −59.0‰ [29]. At ZAVRH, δ18O values varied from −8.37 to −8.91 ‰, with a mean value of −8.64‰ and δ2H values varied from −55.0 to −58.1‰, with a mean value of −56.5‰ [29].
During the monitored period, the d-excess values at well ZAVRH consistently exceeded 11 (Figure 6), indicating that aquifer recharge predominantly occurs during colder periods. A similar pattern is observed in groundwater samples from well SG, confirming the influence of winter and early spring precipitation on groundwater recharge. However, slightly lower d-excess values are observed at SG compared to ZAVRH on two occasions in winter.
Comparing d-excess with δ2H and δ18O values, locations share similar recharge conditions and moisture sources, but differ in subsurface processes. The more depleted isotopic composition and dispersed d-excess at SG indicate a greater contribution of older or seasonally influenced recharge and enhanced mixing along longer flow paths. In contrast, the less negative and more stable isotopic values and d-excess at ZAVRH reflect faster groundwater circulation and a more direct response to recent precipitation, with limited mixing effects, reflecting less interaction between waters of different ages.
The calculated TT and MRT values further support the isotopic interpretation and highlight differences between the two sites. At ZAVRH, both TT and MRT are estimated between 4 and 6 months, indicating a faster groundwater response and a strong connection to recent precipitation, which is also reflected in the higher variability of electrical conductivity. The shorter residence time suggests rapid flow through shallow subsurface pathways, with minimal isotopic mixing or delay. These results are consistent with the higher d-excess values and the isotopic composition, which closely reflects recent meteoric input.
At SG, the TT ranges from 6 to 8 months, while the MRT extends up to 1–2 years, indicating a slower and more complex groundwater system. The longer residence times and enhanced mixing of flow components result in a more homogenized isotopic signal. The lower d-excess values observed at this site support this interpretation, reflecting a greater contribution of older and mixed groundwater.
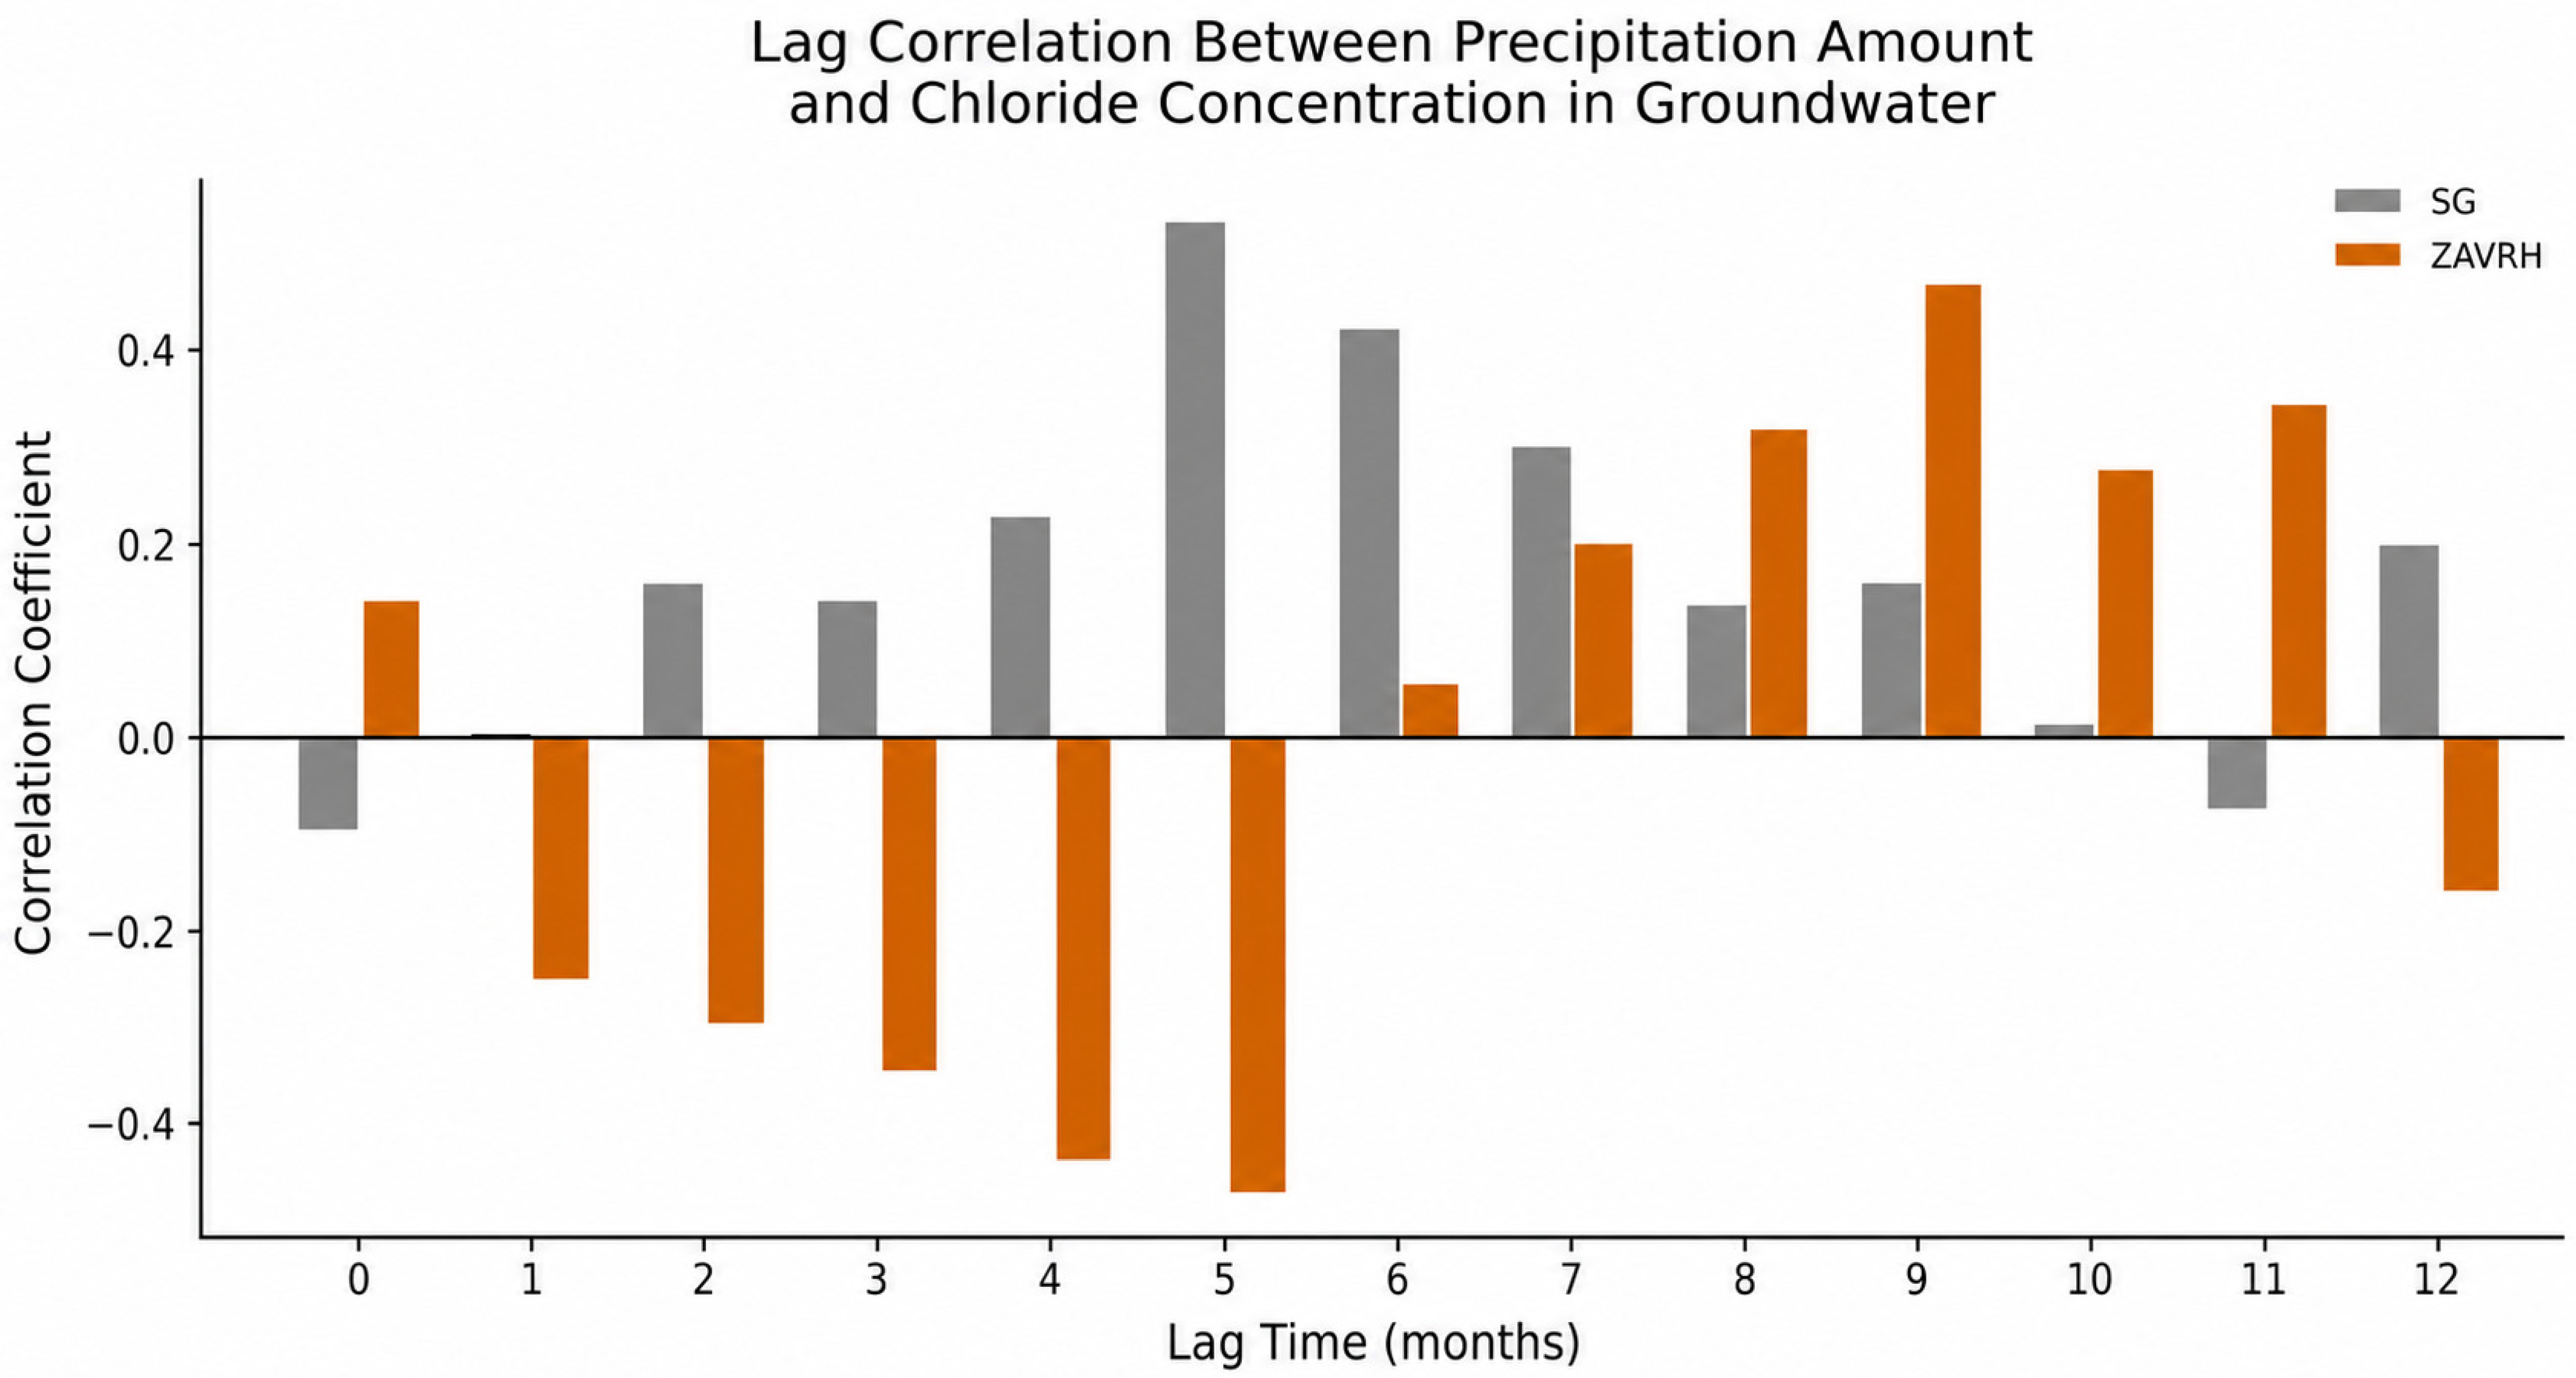
To further verify groundwater residence characteristics, a lag-correlation analysis was performed between precipitation and groundwater chloride concentrations. Chloride was used as a conservative tracer because its variations primarily reflect recharge and transport processes rather than chemical reactions. SG showed the highest positive correlations at intermediate lag times (5–6 months), indicating delayed recharge response, slower groundwater turnover, and longer residence times (Figure 7). In contrast, ZAVRH exhibited greater temporal variability and stronger fluctuations in correlation values, reflecting a more dynamic recharge regime and faster groundwater flow processes. These findings are consistent with the isotope-based TT and MRT estimates and indicate two contrasting hydrogeological regimes: a deeper and more buffered aquifer system at SG, and a more dynamic system with limited storage at ZAVRH. Results reveal two distinct hydrogeological regimes: ZAVRH represents a dynamic, fast-flowing system with limited storage, whereas SG functions as a deeper, more buffered aquifer with prolonged groundwater residence and stronger mixing processes.

3.3. Hydrogeological Conceptual Model

The hydrogeological characteristics of the Šmarna gora area are controlled by the structural setting and the lithological properties of the rocks. The carbonate rocks of the overthrust block, composed predominantly of massive dolomite (Schlern Formation), form a fissured aquifer. In the underlying block, low-permeability clastic rocks (P–C formations) form the aquifer basement. The thrust, which represents the lower boundary of the aquifer, dips northwards at an angle of approximately 20°. Fracture zones within the dolomite have a predominant northeast–southwest orientation and may locally act as barriers to groundwater flow.
Groundwater recharge occurs through the infiltration of precipitation, which then flows through a network of fissures into the deeper parts of the dolomitic aquifer. The density of these fissures is higher in the shallower parts, which are more susceptible to weathering. It is assumed that during intense rainfall, the transmissivity of fissures in the deeper part of the aquifer may be exceeded, leading to overflow of infiltrating water that emerges as springs above the groundwater level. Springs are more common in the southern part of the hill. The water in the permanent springs mainly originates from the carbonate aquifer. Numerous occasional small springs, which occur after rainfall, are fed by surface and near-surface flows in the Permian and Permo-Carboniferous rocks.
In the central part of the study area, the groundwater level is approximately 250 m beneath the surface. The predominant direction of groundwater flow in the carbonate aquifer is to the west. The hydraulic gradient is approximately 3 ‰. However, this estimate is uncertain due to the limited number and accuracy of available measurements. The elevation and natural fluctuation of the groundwater level in the SG and ZAVRH wells are almost identical (Figure 3), which confirms that they belong to the same aquifer.

4. Conclusions

The hydrogeological setting and observed trends in groundwater chemical parameters indicate that the wastewater treatment plant at the summit of Šmarna Gora is the most probable source of contamination affecting the SG and ZAVRH wells. The temporal evolution of nitrate concentrations, together with similar but less pronounced changes in electrical conductivity, supports this interpretation. Contaminant concentrations at the ZAVRH well have historically been lower than at SG. The results of this study suggest that this favorable situation is primarily due to the hydrogeological position of the wells, as the groundwater flow paths do not directly link the identified contaminant source with the ZAVRH well. Isotope analyses further suggest a more dynamic and fast-flowing groundwater system within the ZAVRH well catchment. More intensive recharge and the associated dilution may therefore contribute to the lower concentrations of chemical parameters (e.g., nitrate and chloride) observed in the ZAVRH well. However, faster groundwater circulation also implies increased vulnerability, as contaminants introduced at the surface may reach the well rapidly with limited attenuation.
For the ZAVRH well to become a viable alternative and long-term source for the local drinking water supply, a reduction in contaminant inputs from existing sources, together with effective protection of its recharge area from new pressures, is required. In this context, the establishment of drinking water protection zones is recommended as a preventive measure to reduce the risk of contamination.

Author Contributions

Conceptualization, M.J. and T.M.; methodology, M.J. and T.M.; formal analysis, M.J. and T.M.; investigation, M.J. and T.M.; resources, M.J. and B.J.; data curation, M.J. and B.J.; writing—original draft preparation, M.J. and T.M.; writing—review and editing, M.J., B.J. and T.M.; visualization, M.J. and T.M.; supervision, M.J.; project administration, M.J. and B.J.; funding acquisition, M.J. and B.J. All authors have read and agreed to the published version of the manuscript.

Funding

This research was funded by the Slovenian Research and Innovation Agency through the program Groundwaters and Geochemistry (P1-0020), the project InnoGeoPot (N1-0347), and COST Action WATSON CA19120.

Data Availability Statement

The original data of the isotopic composition of precipitation and groundwater presented in the study are available in Zenodo at https://doi.org/10.5281/zenodo.19625480.

Acknowledgments

The authors greatly acknowledge Bogomir Celarc for geological mapping and interpretations, Katja Koren Pepelnik, Elvira Colmenarejo Calero, Tinkara Kepic and Aljaž Cigler for isotope analyses, and Dejan Šram, Simon Mozetič, and Nika Pišek Szillich for their assistance in preparing the figures.

Conflicts of Interest

Author Brigita Jamnik was employed by the company JP VOKA SNAGA. The remaining authors declare that the research was conducted in the absence of any commercial or financial relationships that could be construed as a potential conflict of interest.

References

  1. Stevanović, Z. Karst waters in potable water supply: A global scale overview. Environ. Earth Sci. 2019, 78, 662. [Google Scholar] [CrossRef]
  2. Gostinčar, P.; Stepišnik, U. Extent and spatial distribution of karst in Slovenia. Acta Geogr. Slov. 2023, 63, 111–129. [Google Scholar] [CrossRef]
  3. Verbovšek, T. Variability of Double-Porosity Flow, Interporosity Flow Coefficient λ and Storage Ratio ω in Dolomites. Water 2024, 16, 1072. [Google Scholar] [CrossRef]
  4. Abiye, T.A. Groundwater Recharge and Circulation in Dolomitic Aquifer Located in Semi-Arid Region: Evidence from the δ18O and δ2H Record, South Africa. Geosciences 2023, 13, 250. [Google Scholar] [CrossRef]
  5. Hilberg, S.; Schneider, J.F. The Aquifer Characteristics of the Dolomite Formation a New Approach for Providing Drinking Water in the Northern Calcareous Alps Region in Germany and Austria. Water Resour. Manag. 2011, 25, 2705–2729. [Google Scholar] [CrossRef]
  6. Higgins, O.D. Development of a drought-resilient water supply from dolomitized limestones of the Irish Midlands. Q. J. Eng. Geol. Hydrogeol. 2024, 57, qjegh2023-043. [Google Scholar] [CrossRef]
  7. Clark, I.D.; Fritz, P. Environmental Isotopes in Hydrogeology, 1st ed.; CRC Press: Boca Raton, FL, USA, 1997. [Google Scholar]
  8. Dansgaard, W. Stable isotopes in precipitation. Tellus 1964, 16, 436–468. [Google Scholar] [CrossRef]
  9. Gat, J.R. Oxygen and Hydrogen Isotopes in the Hydrologic Cycle. Annu. Rev. Earth Planet. Sci. 1996, 24, 225–262. [Google Scholar] [CrossRef]
  10. Goldscheider, N.; Chen, Z.; Auler, A.S.; Bakalowicz, M.; Broda, S.; Drew, D.; Hartmann, J.; Jiang, G.; Moosdorf, N.; Stevanovic, Z.; et al. Global distribution of carbonate rocks and karst water resources. Hydrogeol. J. 2020, 28, 1661–1677. [Google Scholar] [CrossRef]
  11. Sappa, G.; Vitale, S.; Ferranti, F. Identifying Karst Aquifer Recharge Areas using Environmental Isotopes: A Case Study in Central Italy. Geosciences 2018, 8, 351. [Google Scholar] [CrossRef]
  12. Siegel, L.; Goldscheider, N.; Petitta, M.; Xanke, J.; Andreo, B.; Bakalowicz, M.; Barberá, J.A.; Bouhlila, R.; Burg, A.; Doummar, J.; et al. Distribution, threats and protection of selected karst groundwater-dependent ecosystems in the Mediterranean region. Hydrogeol. J. 2023, 31, 2231–2249. [Google Scholar] [CrossRef]
  13. Doctor, D.H.; Alexander, E.C.; Petrič, M.; Kogovšek, J.; Urbanc, J.; Lojen, S.; Stichler, W. Quantification of karst aquifer discharge components during storm events through end-member mixing analysis using natural chemistry and stable isotopes as tracers. Hydrogeol. J. 2006, 14, 1171–1191. [Google Scholar] [CrossRef]
  14. Grigg, N.S. Water Distribution Systems: Integrated Approaches for Effective Utility Management. Water 2024, 16, 524. [Google Scholar] [CrossRef]
  15. Arora, M.; Malano, H.; Davidson, B.; Nelson, R.; George, B. Interactions between centralized and decentralized water systems in urban context: A review. WIREs Water 2015, 2, 623–634. [Google Scholar] [CrossRef]
  16. Garrido-Baserba, M.; Sedlak, D.L.; Molinos-Senante, M.; Barnosell, I.; Schraa, O.; Rosso, D.; Verdaguer, M.; Poch, M. Using water and wastewater decentralization to enhance the resilience and sustainability of cities. Nat. Water 2024, 2, 953–974. [Google Scholar] [CrossRef]
  17. Stoler, J.; Jepson, W.; Wutich, A.; Velasco, C.A.; Thomson, P.; Staddon, C.; Westerhoff, P. Modular, adaptive, and decentralised water infrastructure: Promises and perils for water justice. Curr. Opin. Environ. Sustain. 2022, 57, 101202. [Google Scholar] [CrossRef]
  18. Machado, A.V.M.; Oliveira, P.A.D.; Matos, P.G. Review of Community-Managed Water Supply—Factors Affecting Its Long-Term Sustainability. Water 2022, 14, 2209. [Google Scholar] [CrossRef]
  19. Maryati, S.; Firman, T.; Humaira, A.N.S. A sustainability assessment of decentralized water supply systems in Bandung City, Indonesia. Util. Policy 2022, 76, 101373. [Google Scholar] [CrossRef]
  20. Celarc, B. Geological map of Šmarna gora, 1:5000. In Geological Mapping of the Area of Šmarna Gora; Janža, M., Celarc, B., Šram, D., Eds.; Report No. 631-325/2020; Geological Survey of Slovenia: Ljubljana, Slovenia, 2020. [Google Scholar]
  21. Drinking Water Regulation-Uredba o Pitni Vodi (ULRS No. 61/23). Available online: https://pisrs.si/pregledPredpisa?id=URED8706 (accessed on 20 November 2025).
  22. JP VOKA SNAGA. Archive of Drinking Water Test Laboratory Reports. Available online: https://www.vokasnaga.si/informacije/kaksno-vodo-pijemo/lokalni-vodovodni-sistemi-laboratorijska-porocila/smarna-gora (accessed on 10 September 2025).
  23. Slovenian Environment Agency (ARSO). Archive of Meteorological Data. Available online: https://meteo.arso.gov.si/met/sl/app/webmet/ (accessed on 30 April 2025).
  24. Picarro. L2130-i Isotope and Gas Concentration Analyzer. Available online: https://www.picarro.com/environmental/products/l2130i_isotope_and_gas_concentration_analyzer (accessed on 15 October 2025).
  25. Venables, W.N.; Smith, D.M.; Team, R.C. An Introduction to R: Notes on R—A Programming Environment for Data Analysis and Graphics, Version 4.5.1; Network Theory: Bristol, UK, 2025; p. 97. [Google Scholar]
  26. Hughes, C.E.; Crawford, J. A new precipitation weighted method for determining the meteoric water line for hydrological applications demonstrated using Australian and global GNIP data. J. Hydrol. 2012, 464–465, 344–351. [Google Scholar] [CrossRef]
  27. Kralik, M. How to Estimate Mean Residence Times of Groundwater. Procedia Earth Planet. Sci. 2015, 13, 301–306. [Google Scholar] [CrossRef]
  28. Maloszewski, P.; Zuber, A. Lumped Parameter Models for the Interpretation of Environmental Tracer Data; International Atomic Energy Agency: Vienna, Austria, 1996; pp. 9–58. [Google Scholar]
  29. Janža, M.; Marković, T.; Jamnik, B.; Koren, K.; Colmenarejo Calero, E.; Kepic, T.; Ciglar, A.; Bizjak, N. Isotopic Composition of Precipitation and Groundwater from the Šmarna Gora Area (2021–2024) [Data Set]. Zenodo. 2026. Available online: https://zenodo.org/records/19625480 (accessed on 17 April 2026).
  30. Vreča, P.; Krajcar Bronić, I.; Leis, A.; Demšar, M. Isotopic composition of precipitation at the station Ljubljana (Reaktor), Slovenia —Period 2007–2010. Geologija 2014, 57, 217–230. [Google Scholar] [CrossRef]
  31. Vreča, P.; Krajcar Bronić, I.; Horvatinčić, N.; Barešić, J. Isotopic characteristics of precipitation in Slovenia and Croatia: Comparison of continental and maritime stations. J. Hydrol. 2006, 330, 457–469. [Google Scholar] [CrossRef]
  32. Marković, T.; Karlović, I.; Perčec Tadić, M.; Larva, O. Application of Stable Water Isotopes to Improve Conceptual Model of Alluvial Aquifer in the Varaždin Area. Water 2020, 12, 379. [Google Scholar] [CrossRef]
  33. Kern, Z.; Hatvani, I.G.; Czuppon, G.; Fórizs, I.; Erdélyi, D.; Kanduč, T.; Palcsu, L.; Vreča, P. Isotopic ‘Altitude’ and ‘Continental’ Effects in Modern Precipitation across the Adriatic–Pannonian Region. Water 2020, 12, 1797. [Google Scholar] [CrossRef]
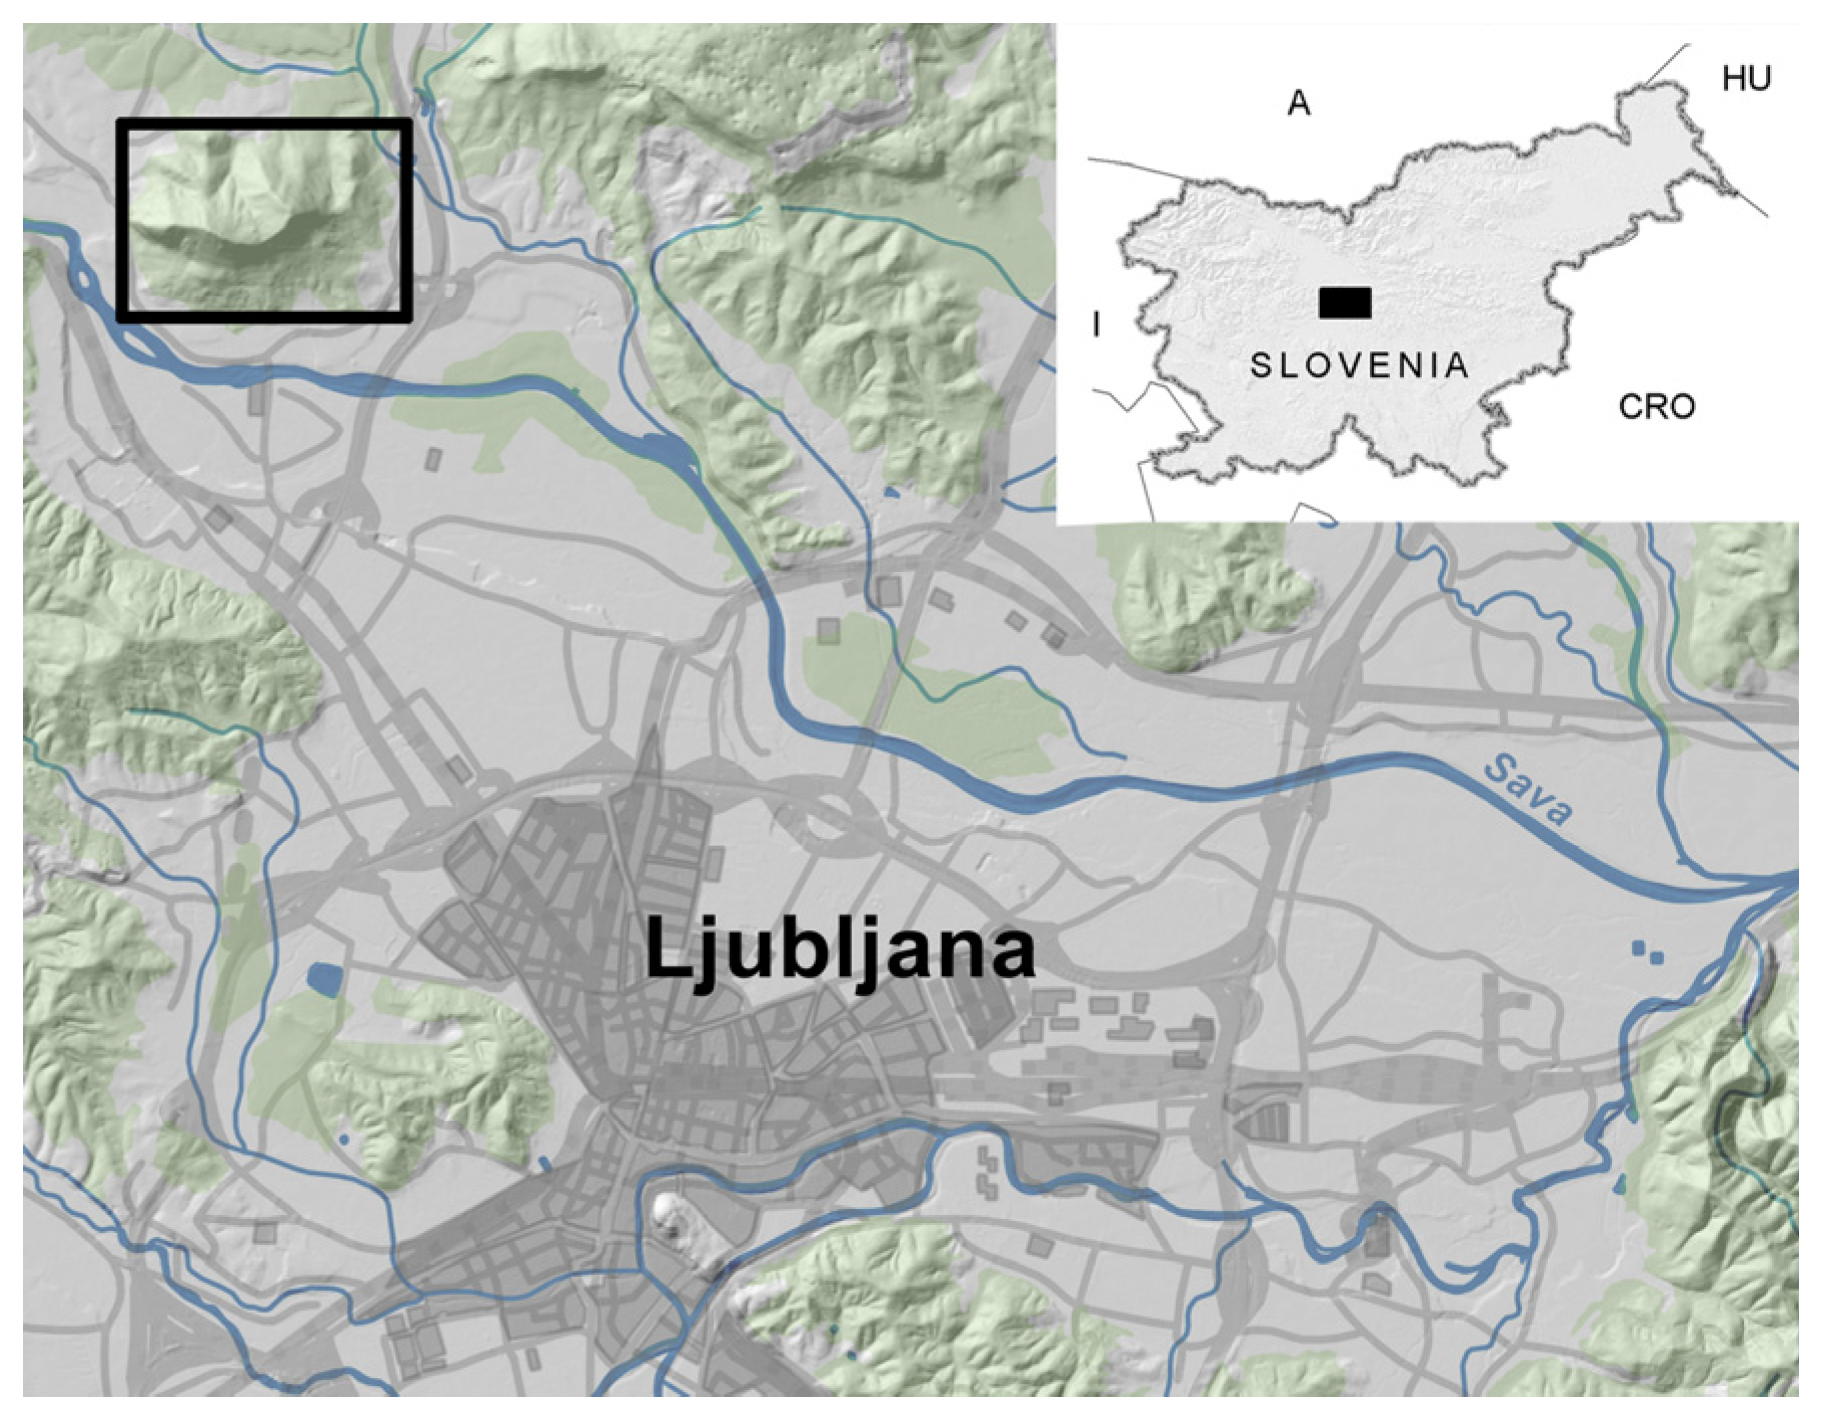
Figure 1. Study area indicated by the black rectangle.
Water 18 01386 g001
Figure 2. The 3D geological model of the Šmarna Gora area showing lithological units, the interpreted thrust plane (after Celarc, 2020 [20]), and the locations of wells SG, ZAVRH, and V-1.
Water 18 01386 g002
Figure 3. Groundwater levels in wells SG and ZAVRH, with average monthly pumping rates (Q) and cumulative monthly precipitation (P) from the Šentvid meteorological station.
Water 18 01386 g003
Figure 4. Concentrations of (a) nitrate and (b) chloride, (c) electrical conductivity, and (d) temperature measured in wells SG (gray circles) and ZAVRH (orange squares).
Water 18 01386 g004
Figure 5. Isotopic composition of groundwater in wells SG and ZAVRH and the local meteoric water lines, determined using ordinary least squares regression (OLSR), reduced major axis (RMA) regression, and precipitation-weighted least squares regression (PWLSR).
Water 18 01386 g005
Figure 6. Distribution of d-excess in groundwater samples from wells SG (gray circles) and ZAVRH (orange squares).
Water 18 01386 g006
Figure 7. Lag-correlation between precipitation amount and groundwater chloride concentrations.
Water 18 01386 g007
Table 1. Borehole specifications.
Borehole NameElevation (m a.s.l.)Depth (m)Screened Depth Interval (m)
SG 569313286–304
ZAVRH380200140–150, 160–170, 180–190
V-136515075–120
Disclaimer/Publisher’s Note: The statements, opinions and data contained in all publications are solely those of the individual author(s) and contributor(s) and not of MDPI and/or the editor(s). MDPI and/or the editor(s) disclaim responsibility for any injury to people or property resulting from any ideas, methods, instructions or products referred to in the content.