Article

Seasonal Variation of Turbidity in the Huayang Lake Group and Its Coupling Mechanisms Driven by Water Level and Wind Field


1
School of Resources and Environmental Engineering, Anhui University, Hefei 230039, China
2
Guangdong Key Laboratory of Water and Atmospheric Pollution Prevention and Control, South China Institute of Environmental Sciences, Ministry of Ecology and Environment, Guangzhou 510655, China
3
Susong County Ecological Environment Branch of Anqing City, Anqing 246500, China
4
Institute of Intelligent Machines, Hefei Institutes of Physical Science, Chinese Academy of Sciences, Hefei 230031, China
*
Authors to whom correspondence should be addressed.
Water 2026, 18(11), 1316; https://doi.org/10.3390/w18111316
Submission received: 23 April 2026 / Revised: 25 May 2026 / Accepted: 27 May 2026 / Published: 29 May 2026
(This article belongs to the Section Water Resources Management, Policy and Governance)

Abstract

Drawing on continuous multi-year monitoring data (2019–2024) from the Huayang Lake Group, we constructed a water level–wind speed–turbidity coupling model to decode the driving mechanisms behind the lake’s seasonal turbidity variations. We identified a distinct “turbid-winter, clear-summer” dynamic, primarily governed by the interplay between water level fluctuations and wind-driven mixing. Crucially, the study established quantitative thresholds for high-turbidity events: the combination of water levels below 12.0 m and wind speeds exceeding 5 m/s triggers a sharp surge in turbidity, reaching 300–480 NTU. Sensitivity analyses from the validated model indicate that every 1 m drop in water level corresponds to an average turbidity increase of 40–60 NTU, whereas a 1 m/s increase in wind speed adds 30–50 NTU. In contrast, maintaining water levels above 15.0 m significantly strengthens vertical water column stability, effectively buffering against wind-induced sediment resuspension. Additionally, significant seasonal variations in calibrated model parameters further corroborated the amplifying effect of low water levels and strong wind-waves on resuspension during winter and spring. Ultimately, this study proposes a novel dual-parameter early warning mechanism and provides practical guidance for non-flood season water level management, offering vital insights for the ecological conservation of Yangtze-connected shallow lakes.

1. Introduction

Large shallow lakes are pivotal components of freshwater ecosystems, and their water quality dynamics are intrinsically linked to regional ecological security and sustainable development. Shallow lakes are generally defined as water bodies with a mean water depth of less than 5–6 m, and in limnological standards for the middle and lower Yangtze River floodplain, they are universally defined as lakes with a mean water depth ≤ 5 m. Turbidity, a primary indicator of water clarity, not only reflects the concentration of suspended matter but also serves as a sensitive parameter for evaluating a lake’s water quality status, ecosystem health, and anthropogenic impacts. Elevated turbidity can trigger a cascade of ecological consequences, including the degradation of submerged macrophyte communities, the exacerbation of eutrophication, and an increased risk of harmful algal blooms [1,2,3]. It is well documented that wind waves can significantly enhance bottom shear stress, and once the shear stress exceeds the critical threshold for sediment incipient motion, massive sediment resuspension will be induced [4,5,6]. On a seasonal scale, turbidity in large shallow lakes exhibits significant spatiotemporal heterogeneity, a dynamic feature governed by natural hydrological processes like precipitation and temperature, as well as the lake’s intrinsic physical characteristics such as depth, area, and morphology [7,8]. Elucidating these seasonal turbidity patterns is therefore crucial for revealing the response mechanisms of lake ecosystems to climate change and human activities, and for providing a scientific basis for the precise implementation of water quality management, eutrophication control, and ecological restoration projects [9,10].
Sediment resuspension, primarily driven by wind-wave disturbance, is a fundamental process that causes significant fluctuations in suspended particulate matter concentration, thereby altering turbidity and water transparency. This process not only modifies the optical properties of the water column but also influences the growth and habitat of aquatic organisms—from vegetation to plankton—by mediating biogeochemical fluxes, such as nutrient release and migration, at the sediment-water interface [11,12]. It is well-established that sediment resuspension is initiated when the bottom shear stress, induced by hydrodynamic forces, exceeds a critical threshold determined by sediment particle composition. The magnitude of this shear stress is predominantly controlled by wind-generated waves, whose intensity is governed by key variables including wind speed, direction, fetch, and water depth [13,14,15]. This complex interplay of dynamic interactions ultimately shapes the material cycling and energy flow within shallow lake ecosystems.
The pivotal role of wind-wave action in driving sediment resuspension in large shallow lakes is well-documented. Laboratory flume experiments have been used to establish critical shear stress models for sediment incipient motion, confirming that wind-wave action dominates the flux of resuspended sediment [16,17,18]. For instance, relevant research conducted on Lake Taihu by Qin et al. [5]. demonstrated that wind speed exerts remarkable effects on wave and flow dynamics, and wave disturbance serves as the predominant driving factor under strong wind conditions. The study determined that sediment resuspension starts at the wind speed threshold of 4 m/s, and extensive resuspension phenomena take place when wind speed exceeds 6.5 m/s. These critical values are only applicable to local environmental characteristics including water depth, wind fetch and terrain conditions, and cannot be regarded as universal criteria for all lake waters. Subsequent numerical simulations by Liu et al. [19] further corroborated the strong correlation between wind speed and turbidity, successfully reproducing the sharp increase in sediment concentration during storm events. Similarly, simulation studies on suspended matter distribution in Lake Taihu by Pang et al. [20] showed that both resuspension and internal nutrient loading are highly sensitive to wind speed, exhibiting a seasonal pattern that peaked in summer. Collectively, this body of research underscores that the interplay between wind-wave disturbance and seasonal water level variations is a key driver of sediment resuspension and turbidity changes in shallow lakes.
The interconnected lake systems in the middle and lower reaches of the Yangtze River represent critical wetland ecosystems in China, providing a suite of ecosystem services, including acting as ecological buffers, conserving water resources, and maintaining biodiversity. The health of these systems is thus integral to regional ecological security [21]. However, research on the seasonal turbidity dynamics within these complex lake groups has been hampered by several challenges, including a scarcity of long-term, continuous monitoring data, the complexity of multi-factor interactions, and insufficient quantitative analysis of regional disparities [22]. The Huayang Lake Group (comprising Longgan, Daguan, Huang, and Bo Lakes) is a key component of this water network, situated on the north bank of the Yangtze River. Its hydrological regime is governed by the combined effects of Yangtze River flows, regional precipitation, and anthropogenic regulation, resulting in significant seasonal and spatial heterogeneity. To address the existing research gaps, this study utilizes comprehensive hydrometeorological and water quality data from 2019 to 2024 to systematically analyze the seasonal turbidity patterns in the Huayang Lake Group. By developing and analyzing a coupled water level–wind speed–turbidity model, we aim to elucidate the driving mechanisms of these seasonal variations. The findings are intended to provide a robust scientific basis for enhancing hydrological regulation, ecological protection, and sustainable management of river-lake systems in the middle and lower Yangtze River basin.

2. Materials and Methods

2.1. Study Area Overview

The Huayang Lake Group is situated on the north bank of the middle and lower Yangtze River, spanning Hubei and Anhui provinces (29°52′–30°18′ N, 115°55′–116°35′ E). The lake system’s total drainage area is 5511 km2, encompassing several administrative regions, including Huangmei County and Wuxue City in Hubei Province, as well as Susong, Taihu, and Wangjiang Counties in Anhui Province. As a naturally river-connected lake system and a key flood storage and detention area for the Yangtze River, the Huayang Lake Group fulfills the dual crucial functions of maintaining regional ecological balance and ensuring flood control security [23]. The group is centered on four major lakes—Longgan, Daguan, Huang, and Bo Lakes—which are interconnected by an intricate network of inlets and channels, forming a hydrologically cohesive ecosystem (Figure 1).
The lakes within the group are characteristically shallow, rendering them highly sensitive to wind-wave disturbances (Table 1). For instance, at a water level of 15.00 m, Longgan Lake has a surface area of 316.2 km2, a maximum depth of 4.58 m, and an average depth of just 3.78 m. The topography of the basin exhibits a distinct north–south gradient. The northern region consists of the southern foothills of the Dabie Mountains, which serves as the primary upstream catchment area with major tributaries such as the Xinxian, Erlang, and Liangting Rivers. In contrast, the southern part is a low-lying alluvial plain of the Yangtze River. The Huayang River’s main stream serially connects the multiple lakes before ultimately discharging into the Yangtze River through the Huayang Sluice, creating a unique hydrological pattern of “river-lake” interaction.

2.2. Data Sources

The dataset for this study comprised hydrological (water level), meteorological (wind speed and direction), and a suite of water quality parameters, including turbidity (NTU), pH, dissolved oxygen (DO), chlorophyll-a (Chl-a), permanganate index (CODMn), ammonia nitrogen (NH3-N), total phosphorus (TP), and total nitrogen (TN). The data spans a continuous six-year period from 1 January 2019 to 31 December 2024. Water level data were sourced from the Xiagang Hydrological Station, meteorological data from the Susong Meteorological Station, and water quality data from three automated floating monitoring platforms located within the lake group (Figure 1). All water quality measurements were conducted on surface water (at a depth of 0.5 m), with turbidity, pH, DO, and Chl-a measured in situ using calibrated optical probes.
To ensure the representativeness of the water quality data, one automated monitoring platform was arranged for each of the three main lakes (Longgan, Daguan, and Huang Lakes). This placement was designed to capture average water quality conditions characteristic of the entire lake while minimizing interference from nearshore zones or tributary inlets.
Restricted by monitoring conditions, only Xiacang hydrological station serves as the observation site for Longgan Lake. The gentle terrain and uniform hydrodynamic state of the lake enable data from this single site to reflect overall water quality characteristics. Wind data sourced from a station at least 15 km away is also applicable, as flat landform keeps regional wind field relatively stable.
While acknowledging the limitations of single-point monitoring in fully characterizing spatial heterogeneity, the comparative analysis across these three distinct lakes provides a robust basis for revealing seasonal patterns at the broader lake-group scale. Future research could further enhance model prediction accuracy for localized areas by increasing the spatial density of sampling.

2.3. Research Methods

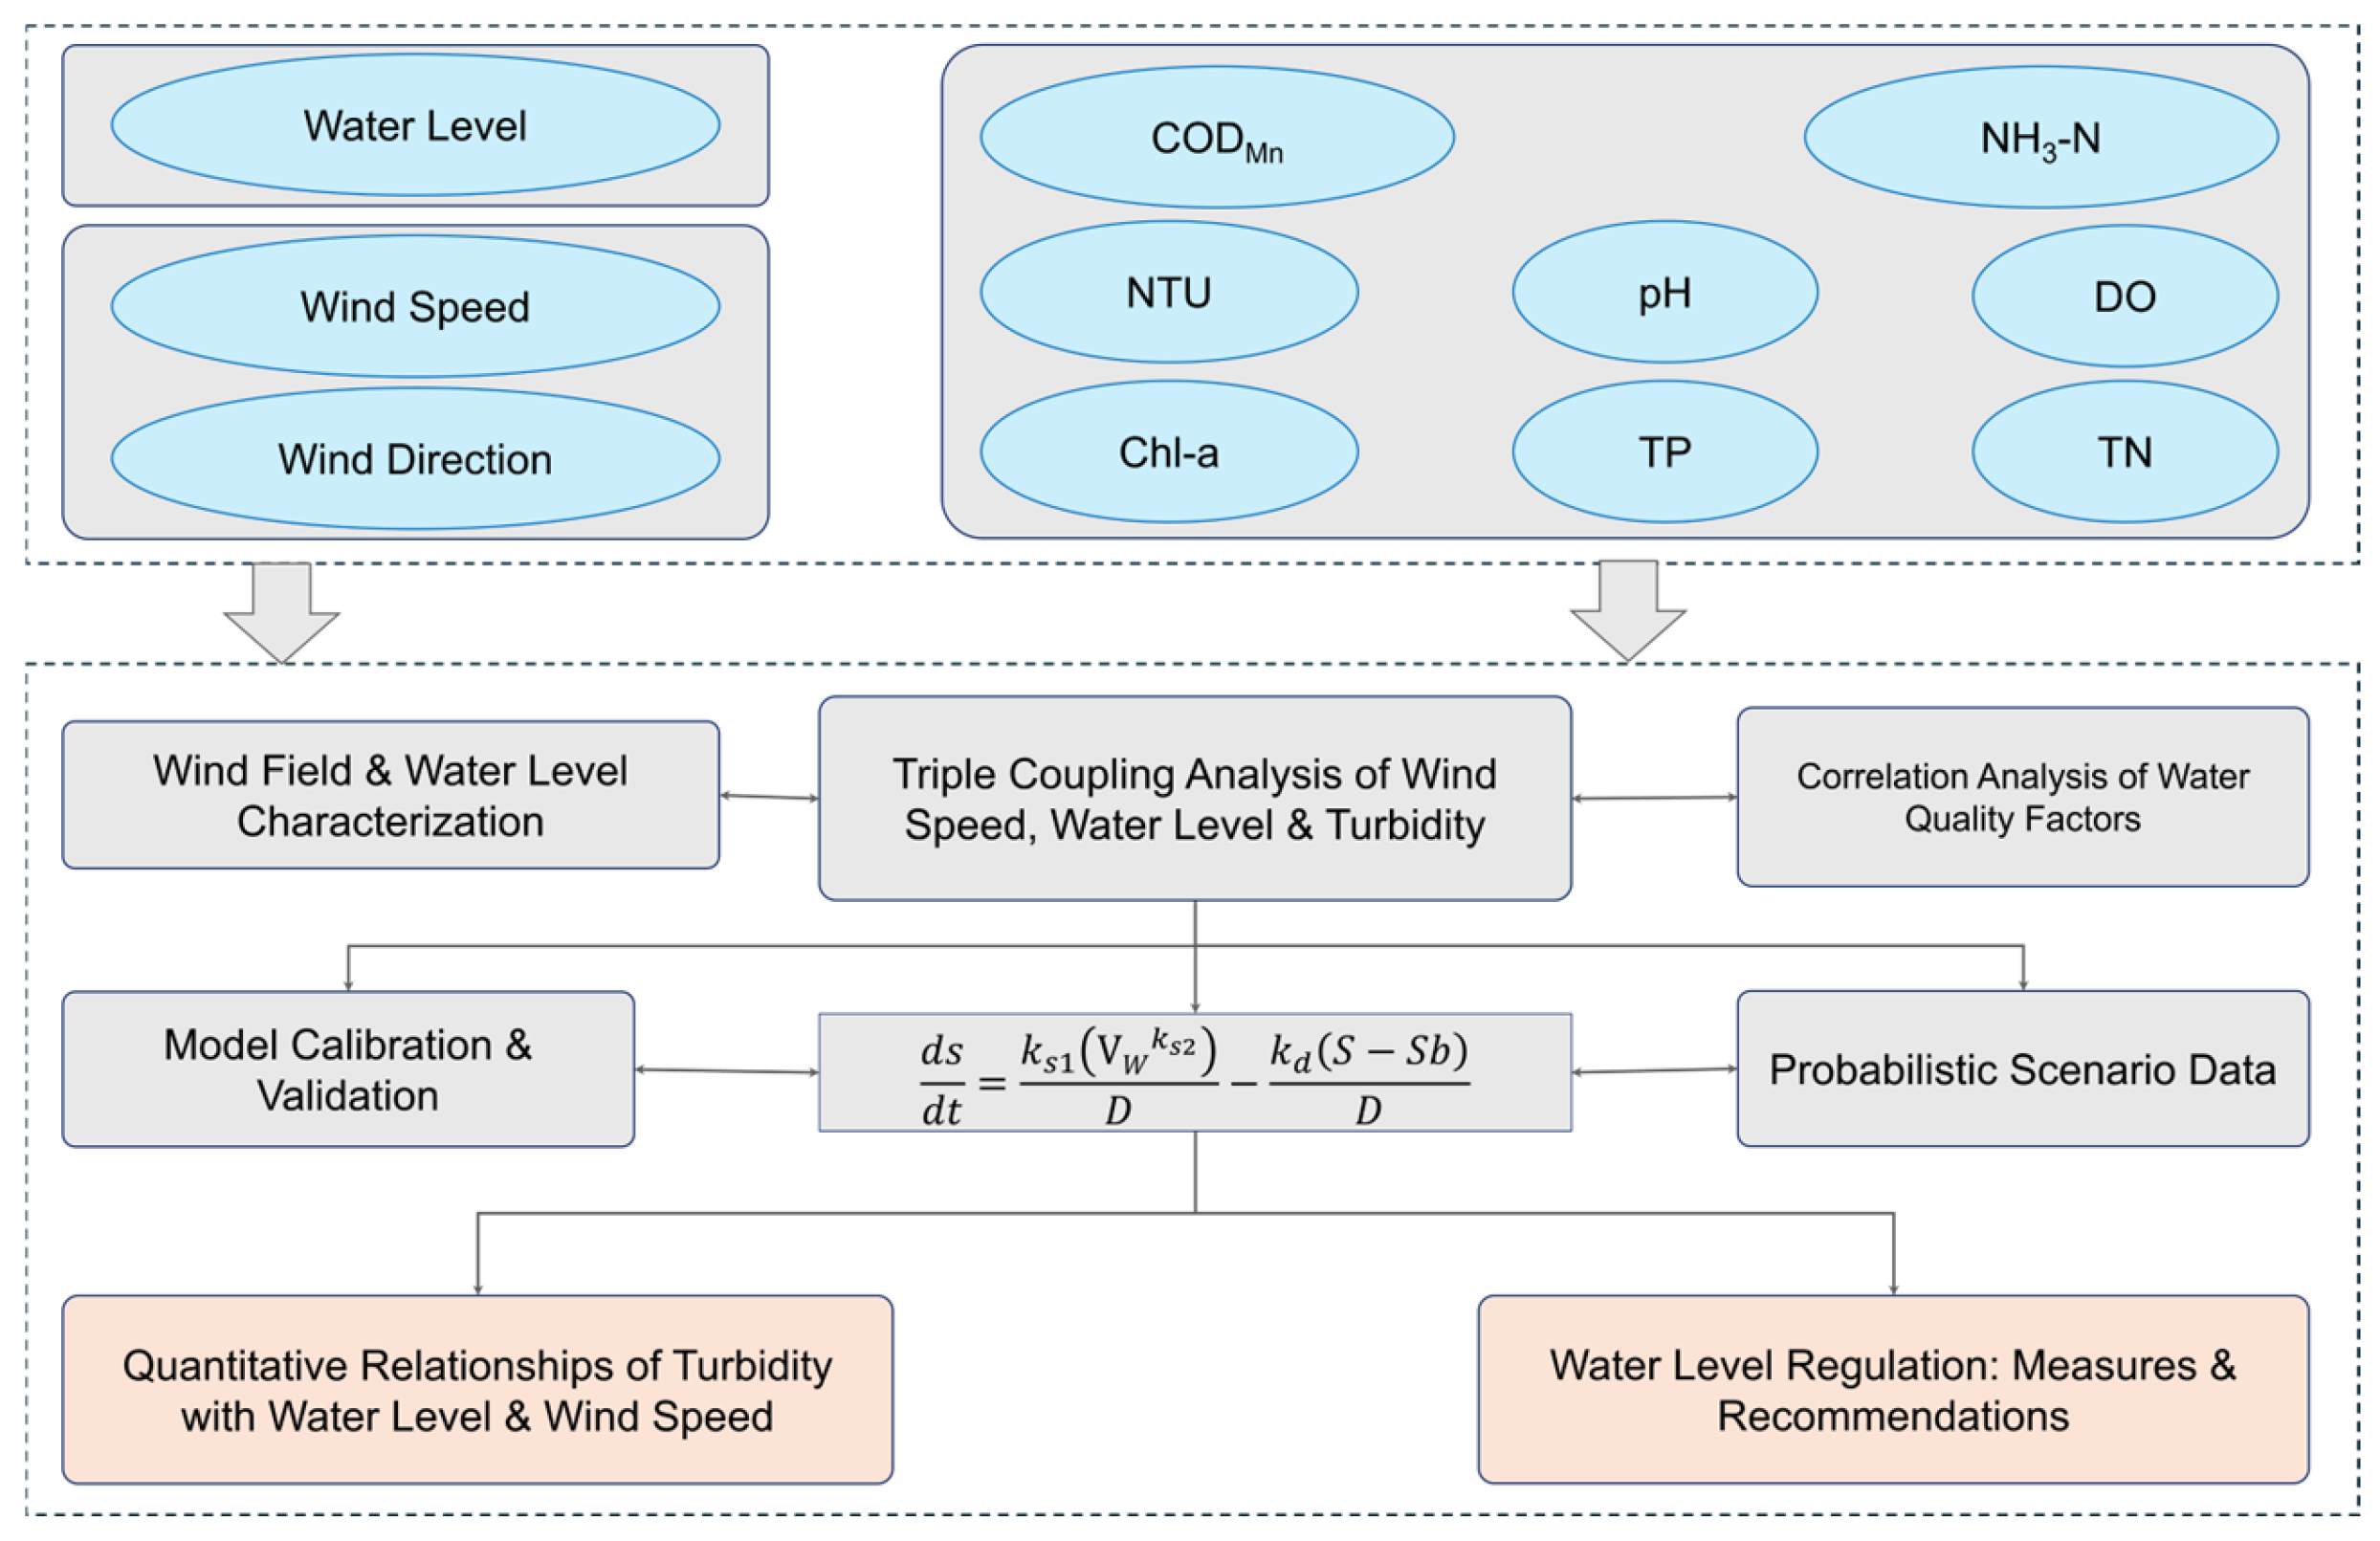
This study investigates the seasonal dynamics of turbidity and its driving mechanisms within the Huayang Lake Group, focusing on the coupled effects of water level and wind fields. Our methodological framework follows a systematic progression: (1) data acquisition, (2) statistical characterization, (3) model development and validation, (4) scenario analysis, and (5) formulation of management strategies (Figure 2). Initially, we compiled a comprehensive dataset of hydrological (water level), meteorological (wind speed, wind direction), and water quality parameters (NTU, pH, DO, Chl-a, CODMn, NH3-N, TP, TN). We then analyzed the probability distributions of wind and corresponding water level variations to establish a baseline. A ternary coupling analysis was performed to reveal the combined effects of wind speed and water level on turbidity across different seasons, while correlation analysis clarified the relationship between turbidity and other water quality indicators. Building on these empirical findings, a mechanistic numerical model for sediment resuspension was developed to quantify the distinct contributions of water level and wind disturbance. The model was rigorously calibrated and validated against measured data to ensure its reliability. Finally, the validated model was used to simulate turbidity responses under various typical and extreme hydro-climatic scenarios (e.g., high water level–strong wind combinations). These simulations established quantitative relationships that inform the development of targeted water level regulation strategies, providing critical decision support for the ecological management of the lake group.
This study adopted the semi-empirical sediment resuspension model developed by Kristensen et al. [24] to quantify turbidity dynamics. The model conceptualizes the net change in turbidity as a balance between two opposing processes: a resuspension term and a settling term. The resuspension term defines the rate at which sediment is entrained from the lakebed into the water column, driven primarily by wind-wave action, and thus exhibits a strong positive correlation with wind speed. Conversely, the settling term describes the gravitational deposition of suspended particulate matter, a rate influenced by both the physical properties of the particles (e.g., size distribution, density) and the hydrodynamic conditions of the water column, such as turbulence intensity [25]. To enhance the model’s practical applicability and directly utilize our field data, we used measured turbidity (NTU) as a proxy for suspended particulate matter concentration. This substitution is justified by the strong empirical relationship between the two parameters, allowing for an effective integration of measured turbidity data into the model framework. The specific form of the model is as follows:
d S d t = k s 1 V w k s 2 D k d S S 0 D
In the above equation, S denotes turbidity (NTU), and S0 represents the background turbidity (NTU), which is set by default to the minimum turbidity value measured in the dataset. Vw is the wind speed at the water surface, kd is the effective settling velocity (m/s), and D is the water depth (m). ks1 is the suspension capacity coefficient, reflecting the sensitivity of sediment resuspension to wind speed, while ks2 is the wind speed response exponent (dimensionless), describing the nonlinearity of the resuspension rate in response to wind speed. Both ks1 and ks2 are determined through calibration and optimization against the measured data.
After calibration of the model parameters, the model can be applied to scenario design for specific management objectives. Simulation data are then generated based on the probability distribution characteristics of wind speed and water level. Probability distribution estimation of wind speed and water level is a statistical approach used to infer the occurrence probabilities of hydrometeorological events from historical observations, including the identification of appropriate distribution types and the estimation of their parameters. Commonly used distributions include the normal, log-normal, and Pearson type III distributions. The Pearson type III distribution is an asymmetric, unimodal, positively skewed distribution, with one finite end and the other extending to infinity. Mathematically, it is a form of the gamma distribution, and its probability density function is given as follows:
f x = β α Γ ( α ) x a 0 α 1 e β x a 0
In this equation, Γ(α) denotes the gamma function of α. The parameters α, β, and a0 represent the shape, scale, and location parameters of the Pearson type III distribution, respectively, where α > 0 and β > 0. The parameters of the distribution function can be estimated from three statistical descriptors, namely the population mean ( x ¯ ), coefficient of variation (Cv), and coefficient of skewness (Cs), as follows:
α = 4 C s 2 β = 2 x ¯ C v C s a 0 = x ¯ 1 2 C v C s
Based on the fitted Pearson type III distributions of wind speed and water level for different seasons, 500 water level–wind speed scenario datasets were randomly generated from the probability distribution model for turbidity simulations.

3. Results

3.1. Characteristics of Turbidity, Hydrometeorological and Water Quality Factors

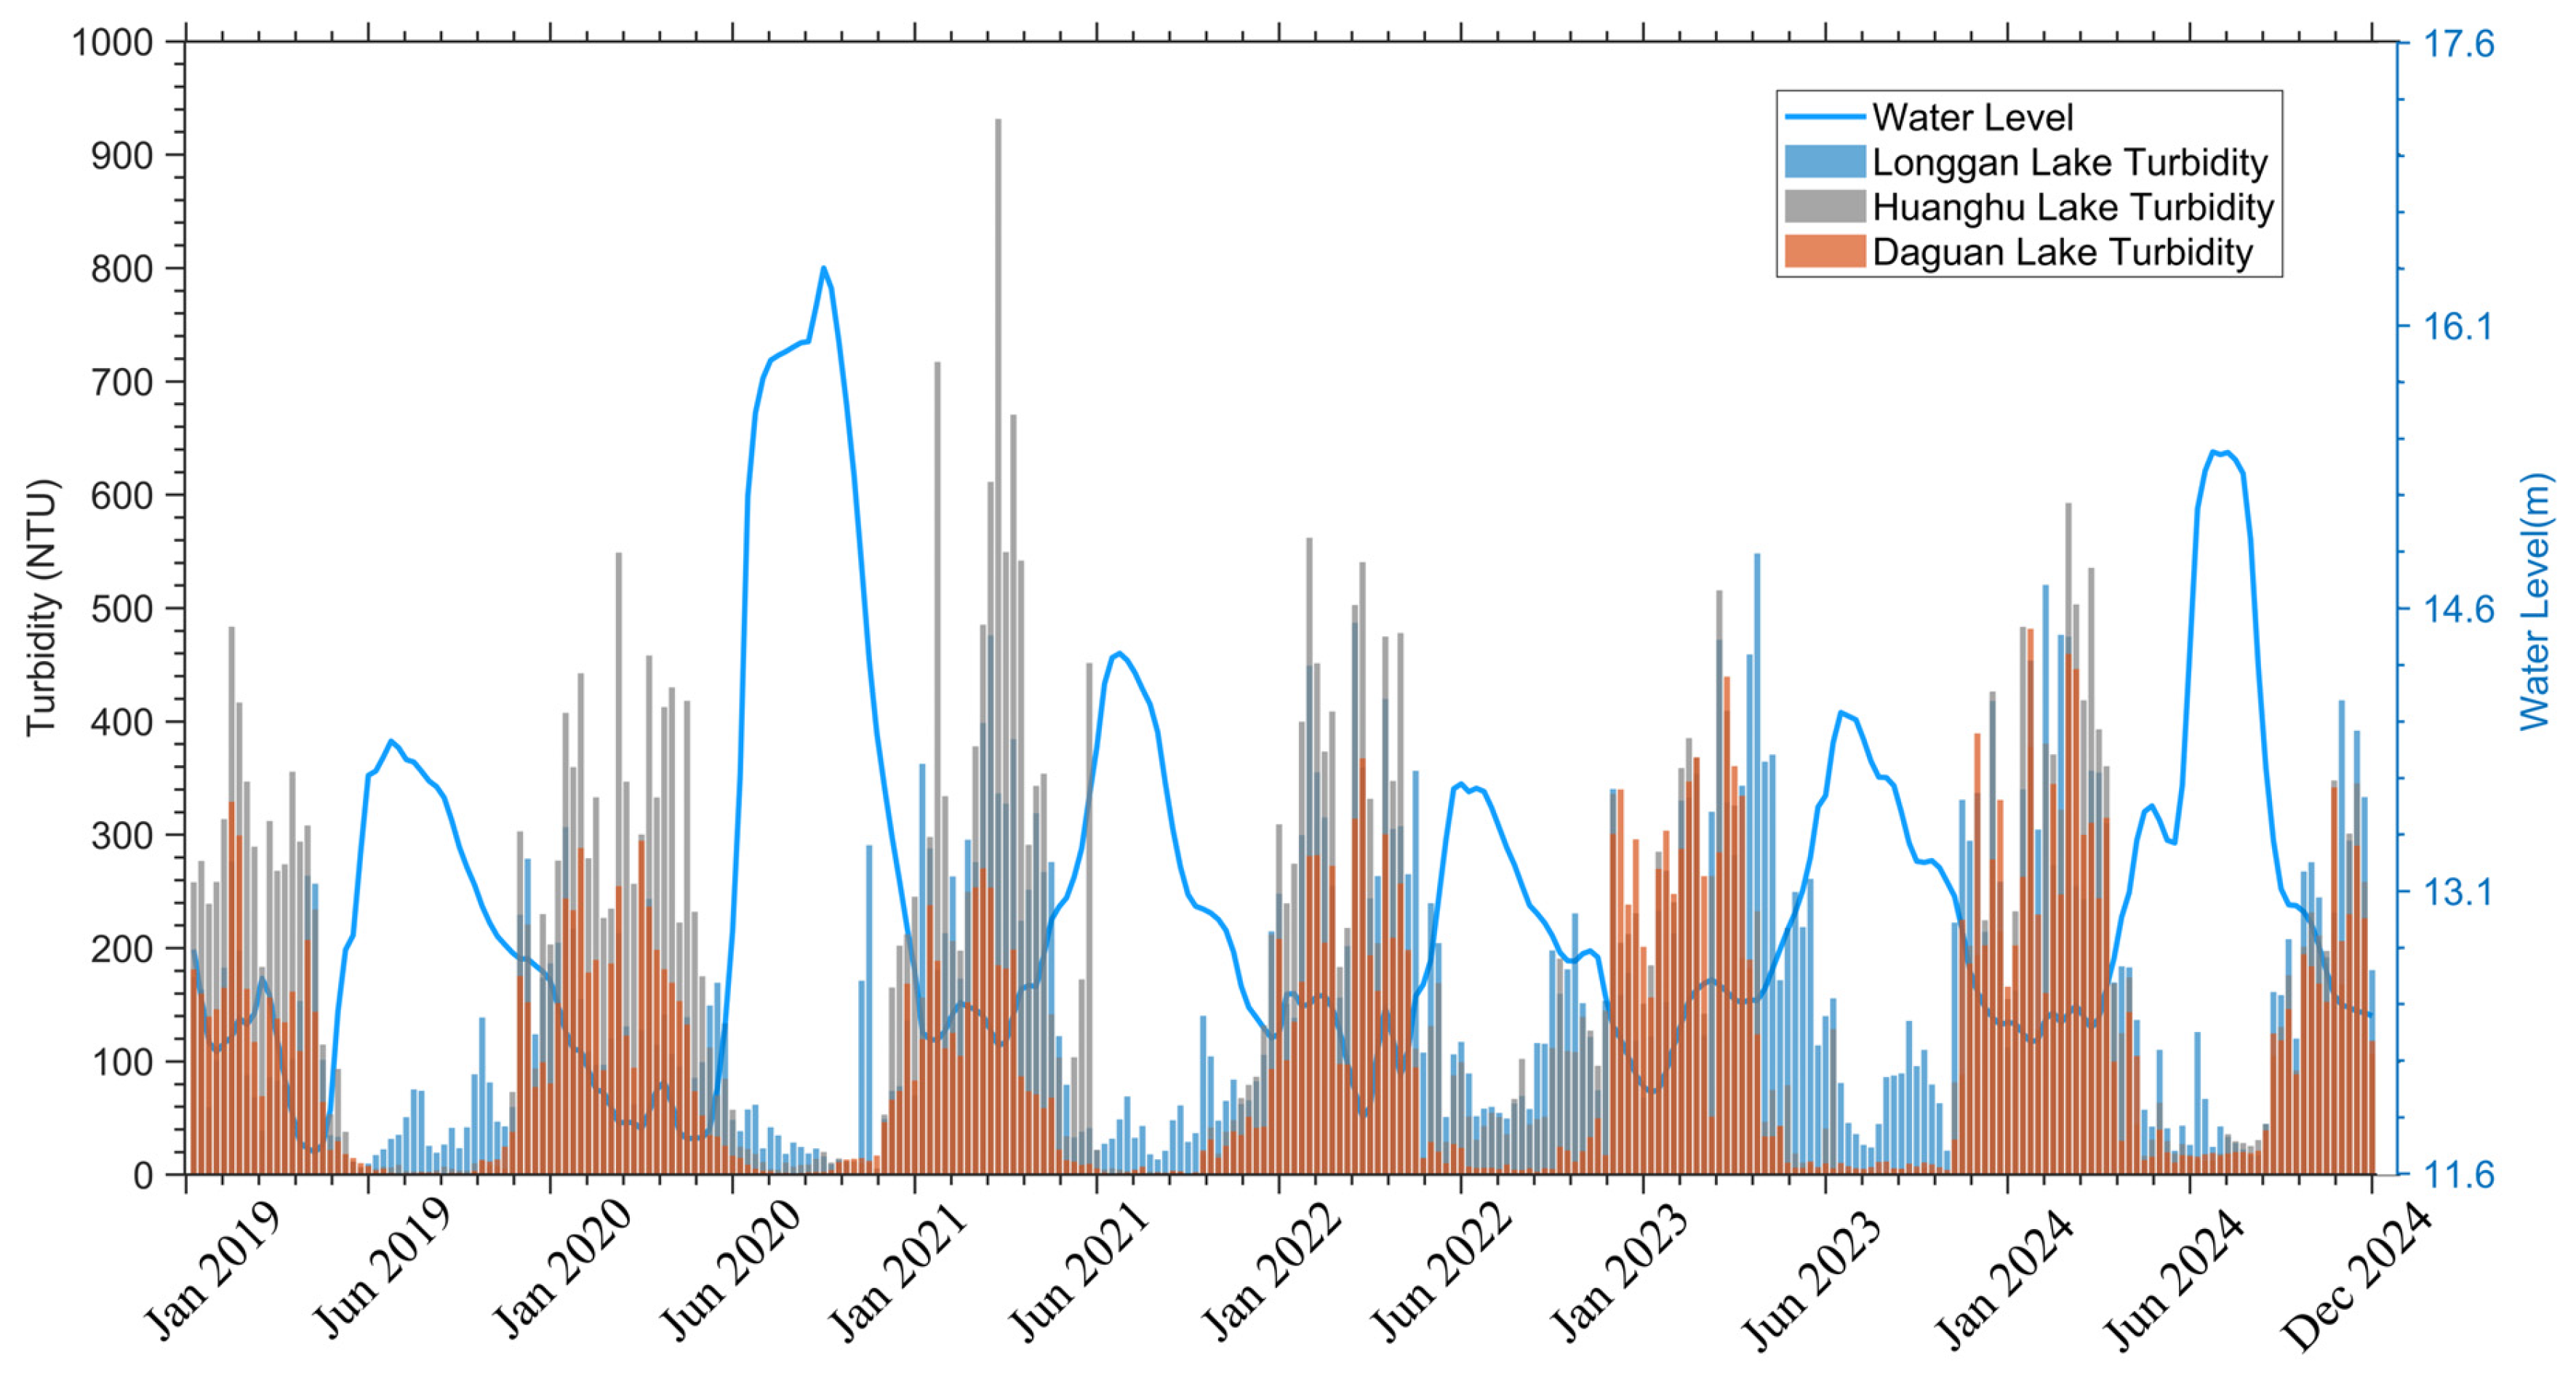
Based on the time-series analysis of water level and turbidity monitoring data for the Huayang Lake Group from 2019 to 2024 (Figure 3), both water level and turbidity exhibited clear seasonal variation patterns. Specifically, water levels remained relatively high during the flood season (June–September), with mean values ranging from 13.5 to 15.5 m, whereas they declined during the dry season (December–March of the following year) to 12.1–12.8 m, with the lowest levels generally occurring in January and February. A particularly notable feature of turbidity variation was that all three lakes remained in a high-turbidity state from November to February of the following year. During this period, turbidity ranged from 200 to 400 NTU in Longgan Lake and from 200 to 350 NTU in Daguan Lake, while Huang Lake showed the highest turbidity levels, reaching 300–450 NTU. The maximum turbidity in the entire study period was recorded in Huang Lake in February 2020. In contrast, turbidity decreased markedly during the flood season (June–September), ranging from 10 to 30 NTU in Longgan Lake, 50 to 150 NTU in Daguan Lake, and 5 to 25 NTU in Huang Lake. This characteristic pattern of “high turbidity in winter and low turbidity in summer” was mainly driven by the combined effects of hydrological regulation in the middle and lower reaches of the Yangtze River, the seasonal distribution of precipitation, and wind-induced disturbance. Specifically, higher water levels during the flood season, together with the dilution effect of rainfall runoff, contributed to lower turbidity. In contrast, during the dry season, reduced precipitation and declining water levels, coupled with stronger wind-driven sediment resuspension, resulted in elevated turbidity.
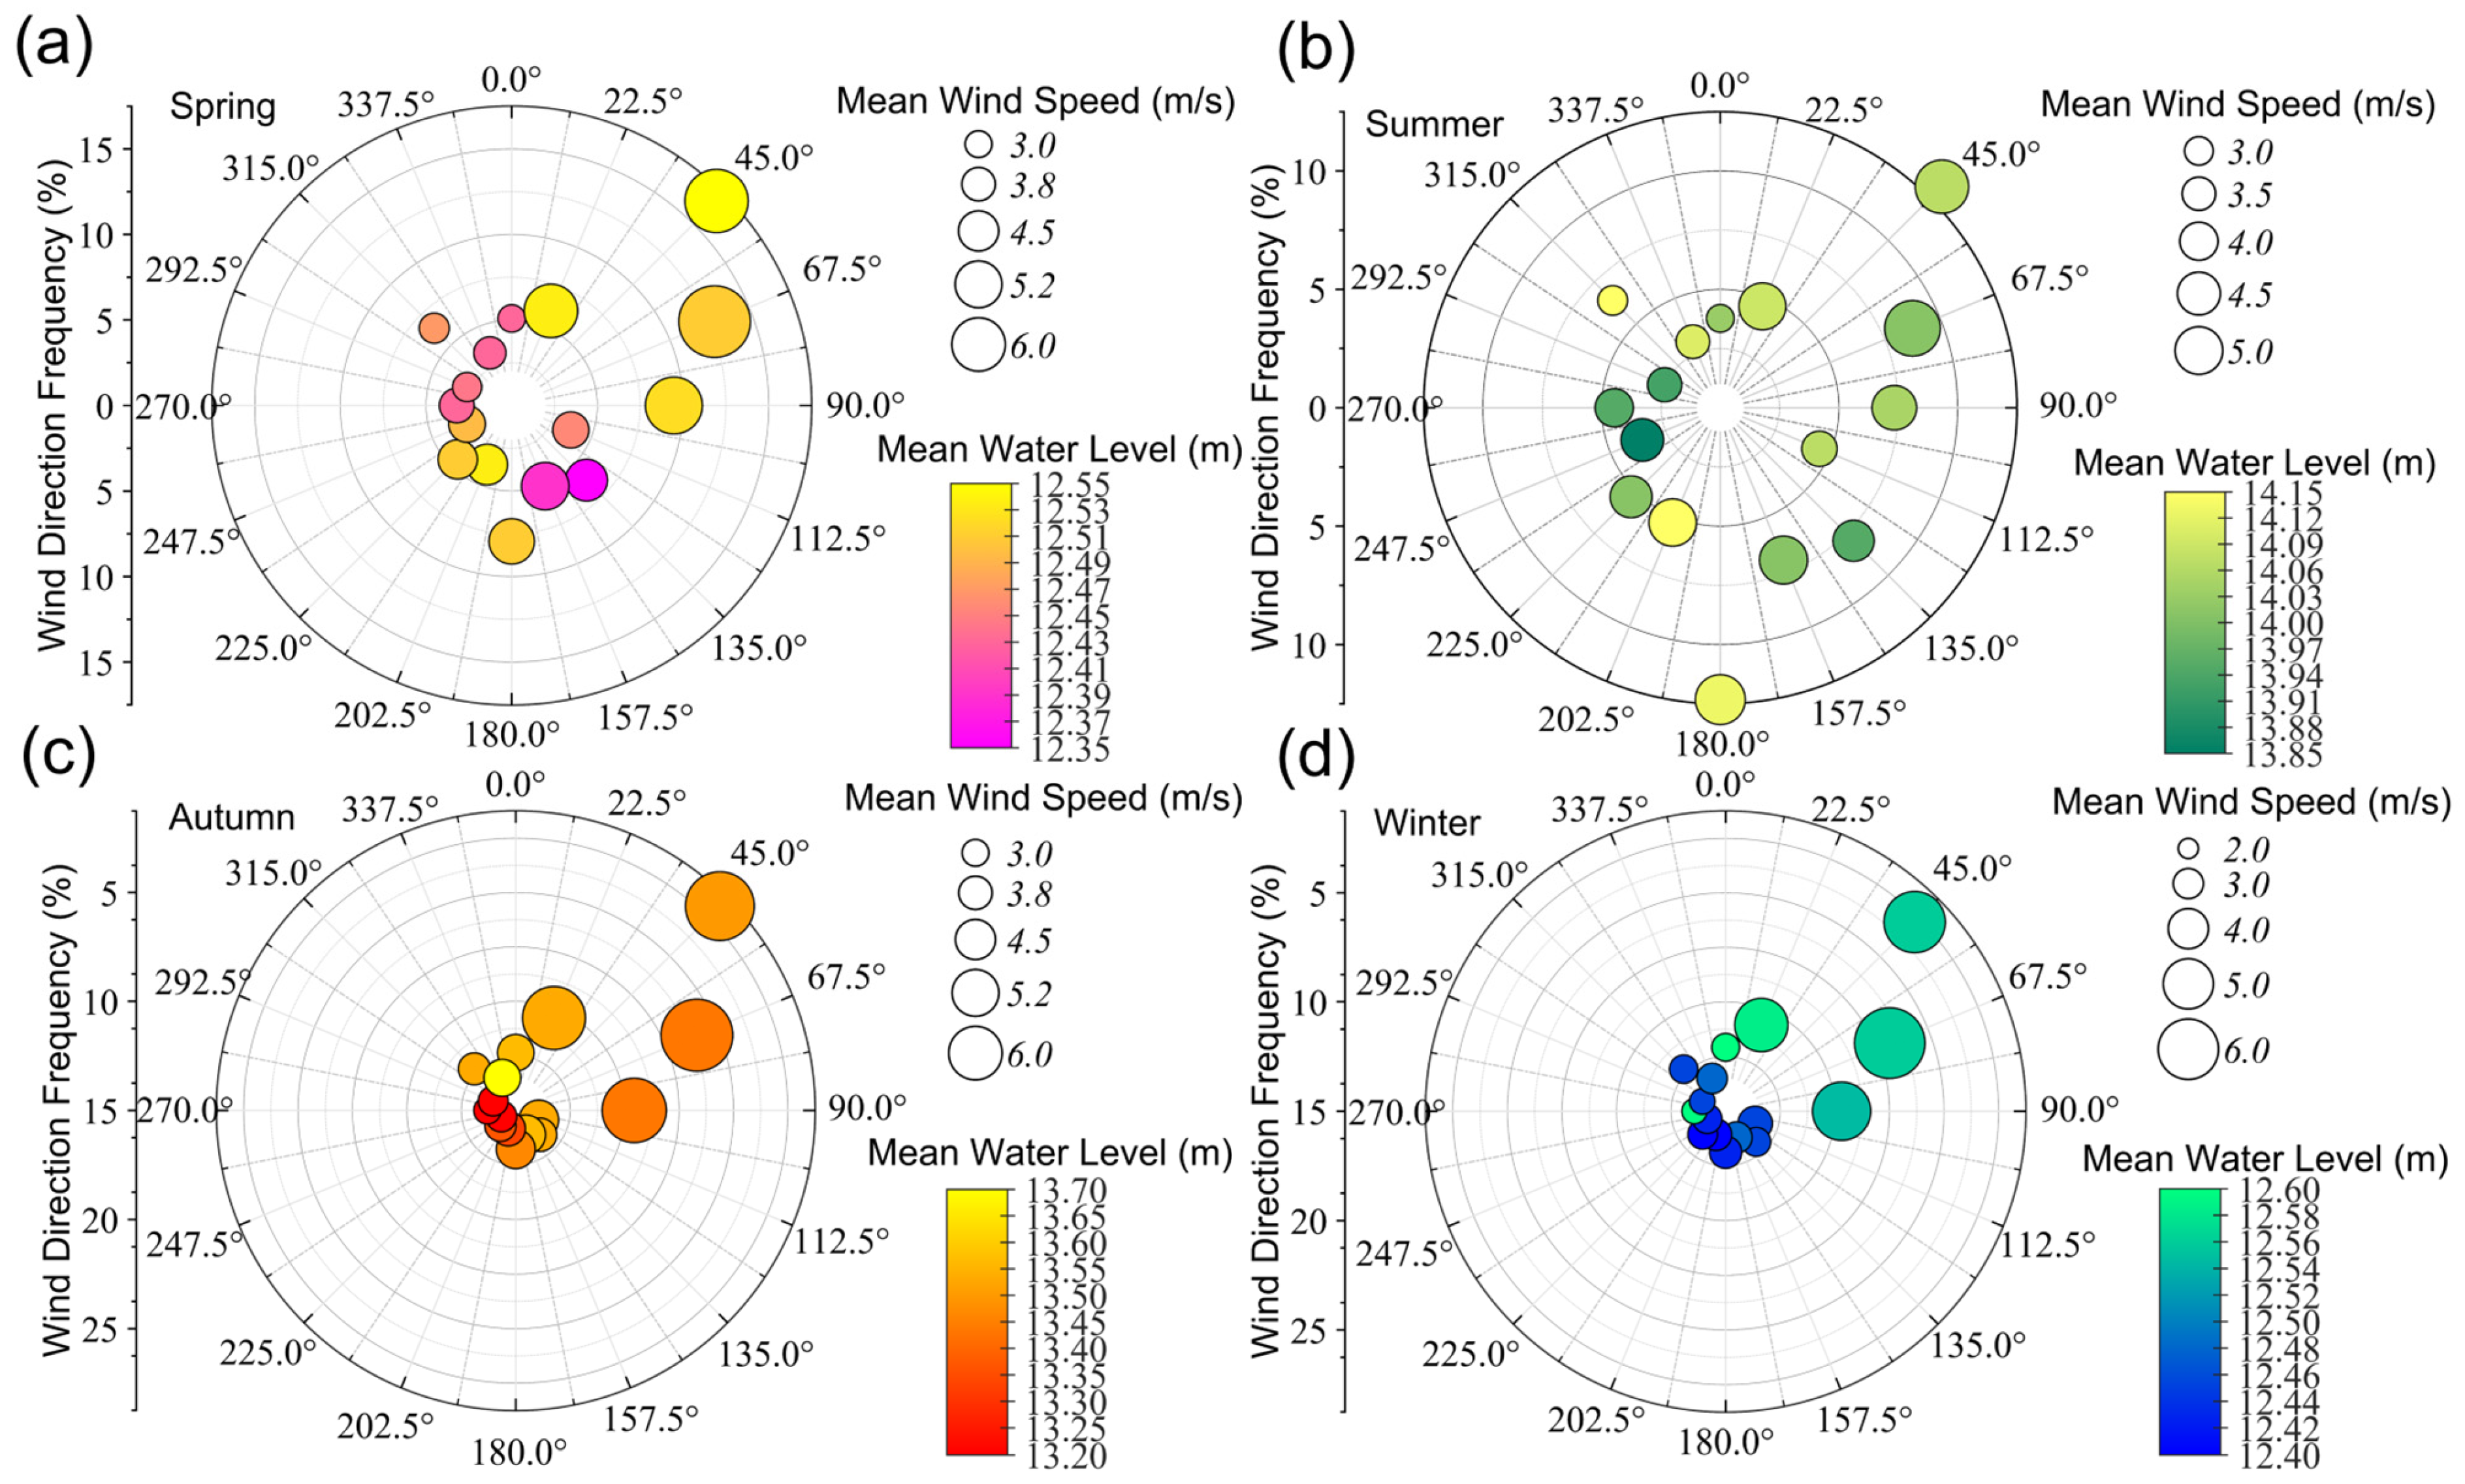
Based on the integrated analysis of wind speed, wind direction, and water level monitoring data, the seasonal frequency distributions of wind speed and wind direction, together with the corresponding water level characteristics, were plotted (Figure 4). The meteorological and hydrological conditions of the study area exhibited pronounced seasonal variability. In spring, the prevailing wind direction was northeasterly (45°), with an occurrence frequency of 16.91% and a mean wind speed of 4.79 m/s. During this period, the average water level remained relatively stable within the range of 12.43–12.53 m, indicating comparatively stable hydrological conditions. In summer, the prevailing wind direction shifted to easterly and southeasterly winds, with mean wind speeds ranging from 2.12 to 4.26 m/s, while the water level increased markedly to 14.00–14.10 m, reflecting the combined hydrological effects of a weakened monsoon and increased precipitation during the flood season. Autumn showed typical monsoon transition characteristics, with the frequency of northeasterly winds increasing substantially to 26.52%, the mean wind speed reaching an annual maximum of 5.22 m/s, and the water level declining to 13.46–13.68 m. In winter, the wind field characteristics were generally similar to those in autumn, whereas the water level further decreased to 12.45–12.53 m, reflecting the hydrological conditions of the cold and dry season. Overall, the study area exhibited distinct seasonal prevailing wind patterns, with northeasterly winds dominating throughout the year. The seasonal variation in mean water level reached 1.65 m, while that in mean wind speed reached 2.15 m/s, highlighting the strong seasonal coupling between meteorological forcing and hydrological processes.
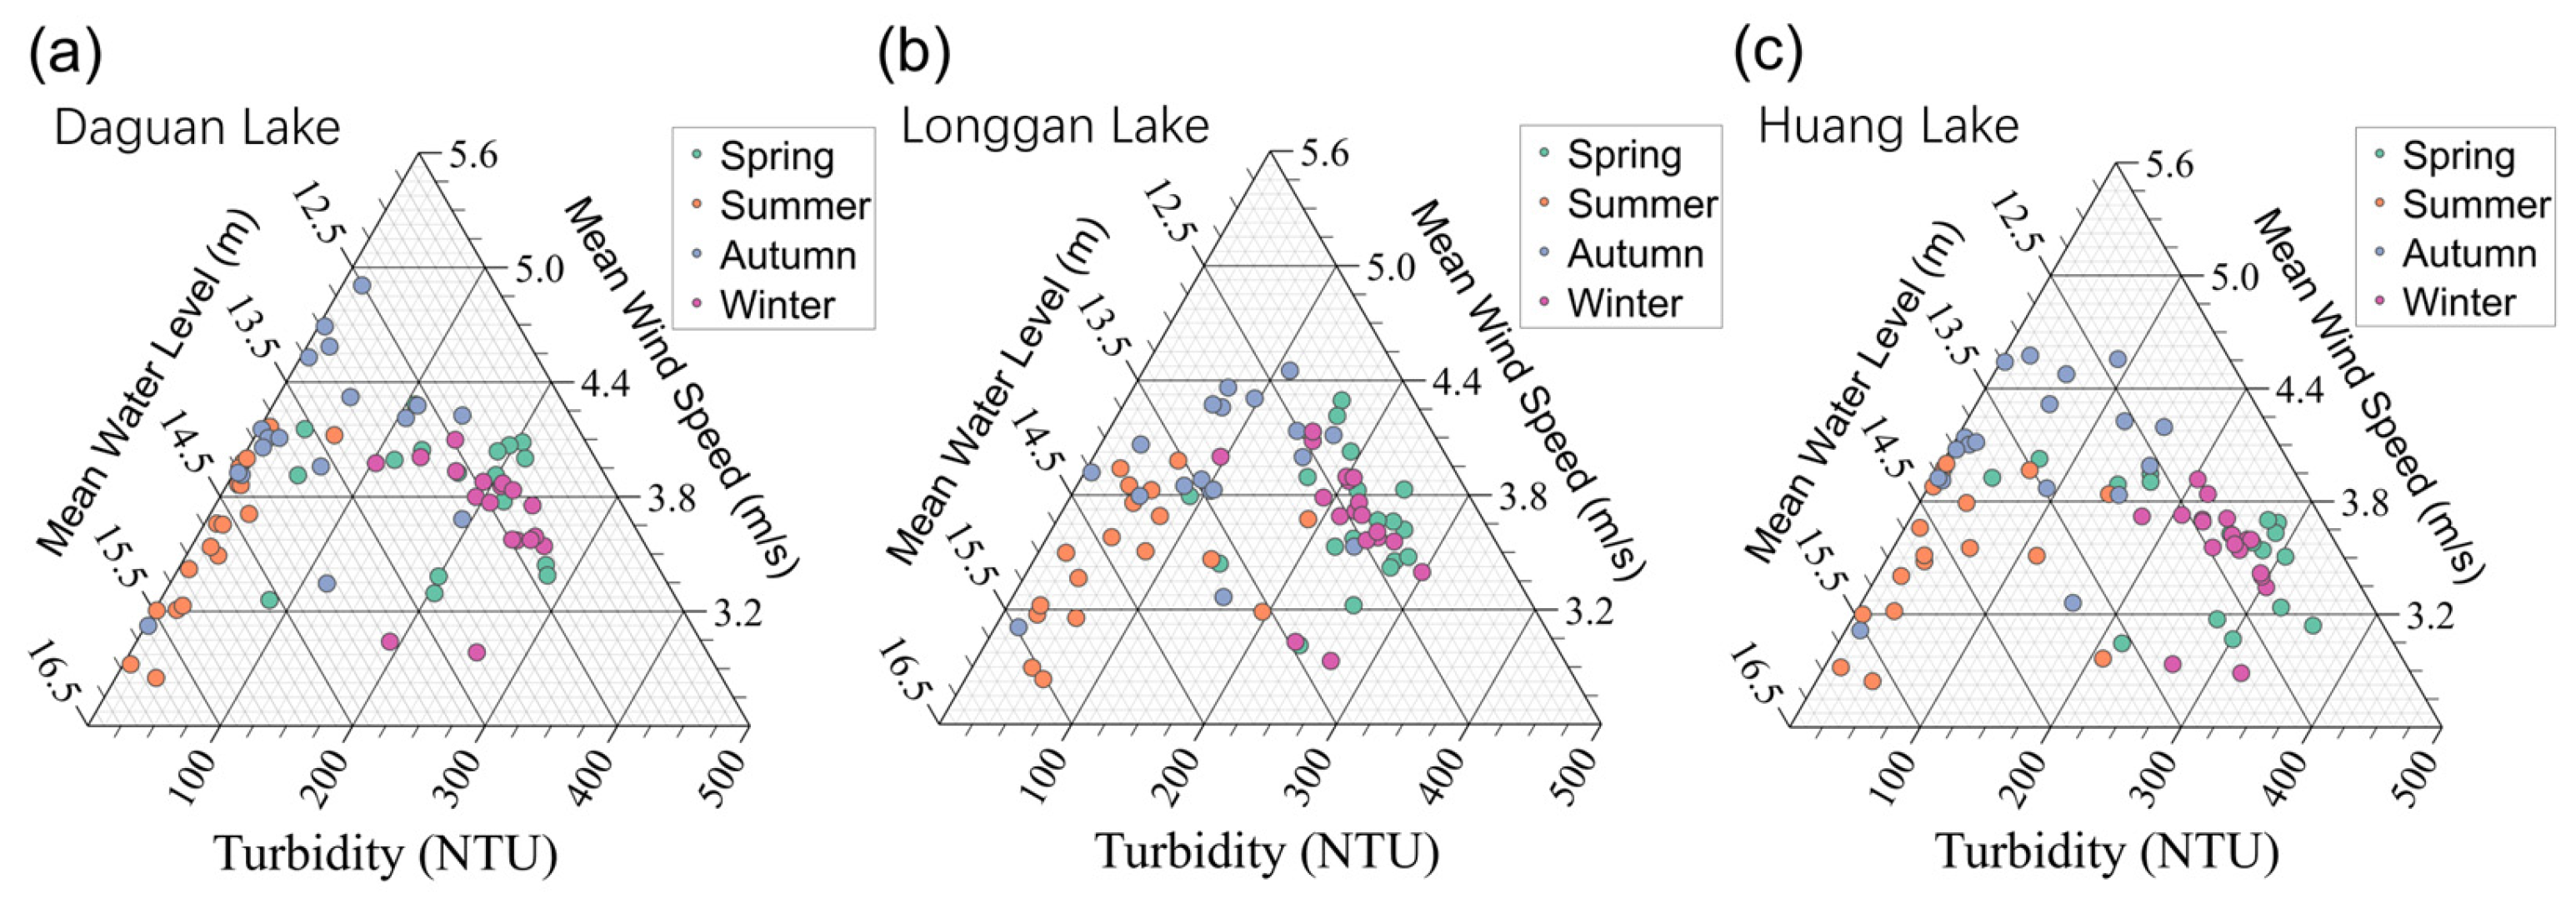
The characteristics of the wind speed–water level–turbidity coupling system under different seasonal conditions are presented in Figure 5. During summer and autumn, water levels were generally higher than 13.5 m, and the effect of wind speed on turbidity was markedly weakened. When the water level reached 15.35 m, turbidity in all three lakes remained low even at a wind speed of 3.91 m/s, with Daguan Lake exhibiting the lowest turbidity. This value was substantially lower than that observed under low-water-level conditions at a comparable wind speed. This pattern can be explained by two mechanisms. First, elevated water levels suppress the vertical transfer of wind-induced turbulence by enhancing the vertical stability of the water column. Second, the larger water volume exerts a dilution effect on suspended solids. Notably, a typical combination of “high wind speed–low turbidity” was observed during this period. For example, when the wind speed reached 4.68 m/s and the corresponding water level was 15.84 m, turbidity in all three lakes still remained low, indicating that the high-water-level conditions during the flood season formed a natural suppressive effect on turbidity.
In contrast, during winter and spring, water levels were mostly below 12.5 m, and wind speed showed a clear positive relationship with turbidity. Under conditions of a wind speed of 4.07 m/s and a water level of 12.09 m, turbidity in all three lakes exceeded 150 NTU, with Huang Lake reaching 408.56 NTU. Under these conditions, the lower water level not only reduced water volume, but also intensified wind-wave disturbance of bottom sediments by weakening the stability of water column stratification. When the water level further declined to 11.88 m, even a moderate wind speed of 3.38 m/s was sufficient to increase turbidity in Longgan Lake to 104.94 NTU, indicating the presence of an amplifying mechanism linking wind disturbance, water level decline, and turbidity response during the dry season. These seasonal differences essentially reflect the regulatory role of hydrological conditions in controlling the threshold for sediment resuspension, with low-water-level environments substantially reducing the critical shear stress required to initiate sediment suspension.
Overall, seasonal fluctuations in water level significantly altered the response relationship between wind forcing and lake turbidity. This pronounced seasonal hydrological–turbidity rhythm provides an important scientific basis for lake ecological management and water quality early warning.
Turbidity is not only an important indicator of the sensory quality of water, but also a key factor influencing the dynamics of total phosphorus in aquatic systems. It interacts with the phosphorus cycle through multiple pathways, including physical adsorption, light limitation, and biological feedback mechanisms. Management practices in typical eutrophic lakes in China, such as Lake Taihu and Lake Chaohu, have clearly demonstrated that long-term and effective water quality improvement requires the simultaneous implementation of turbidity control and phosphorus load reduction.
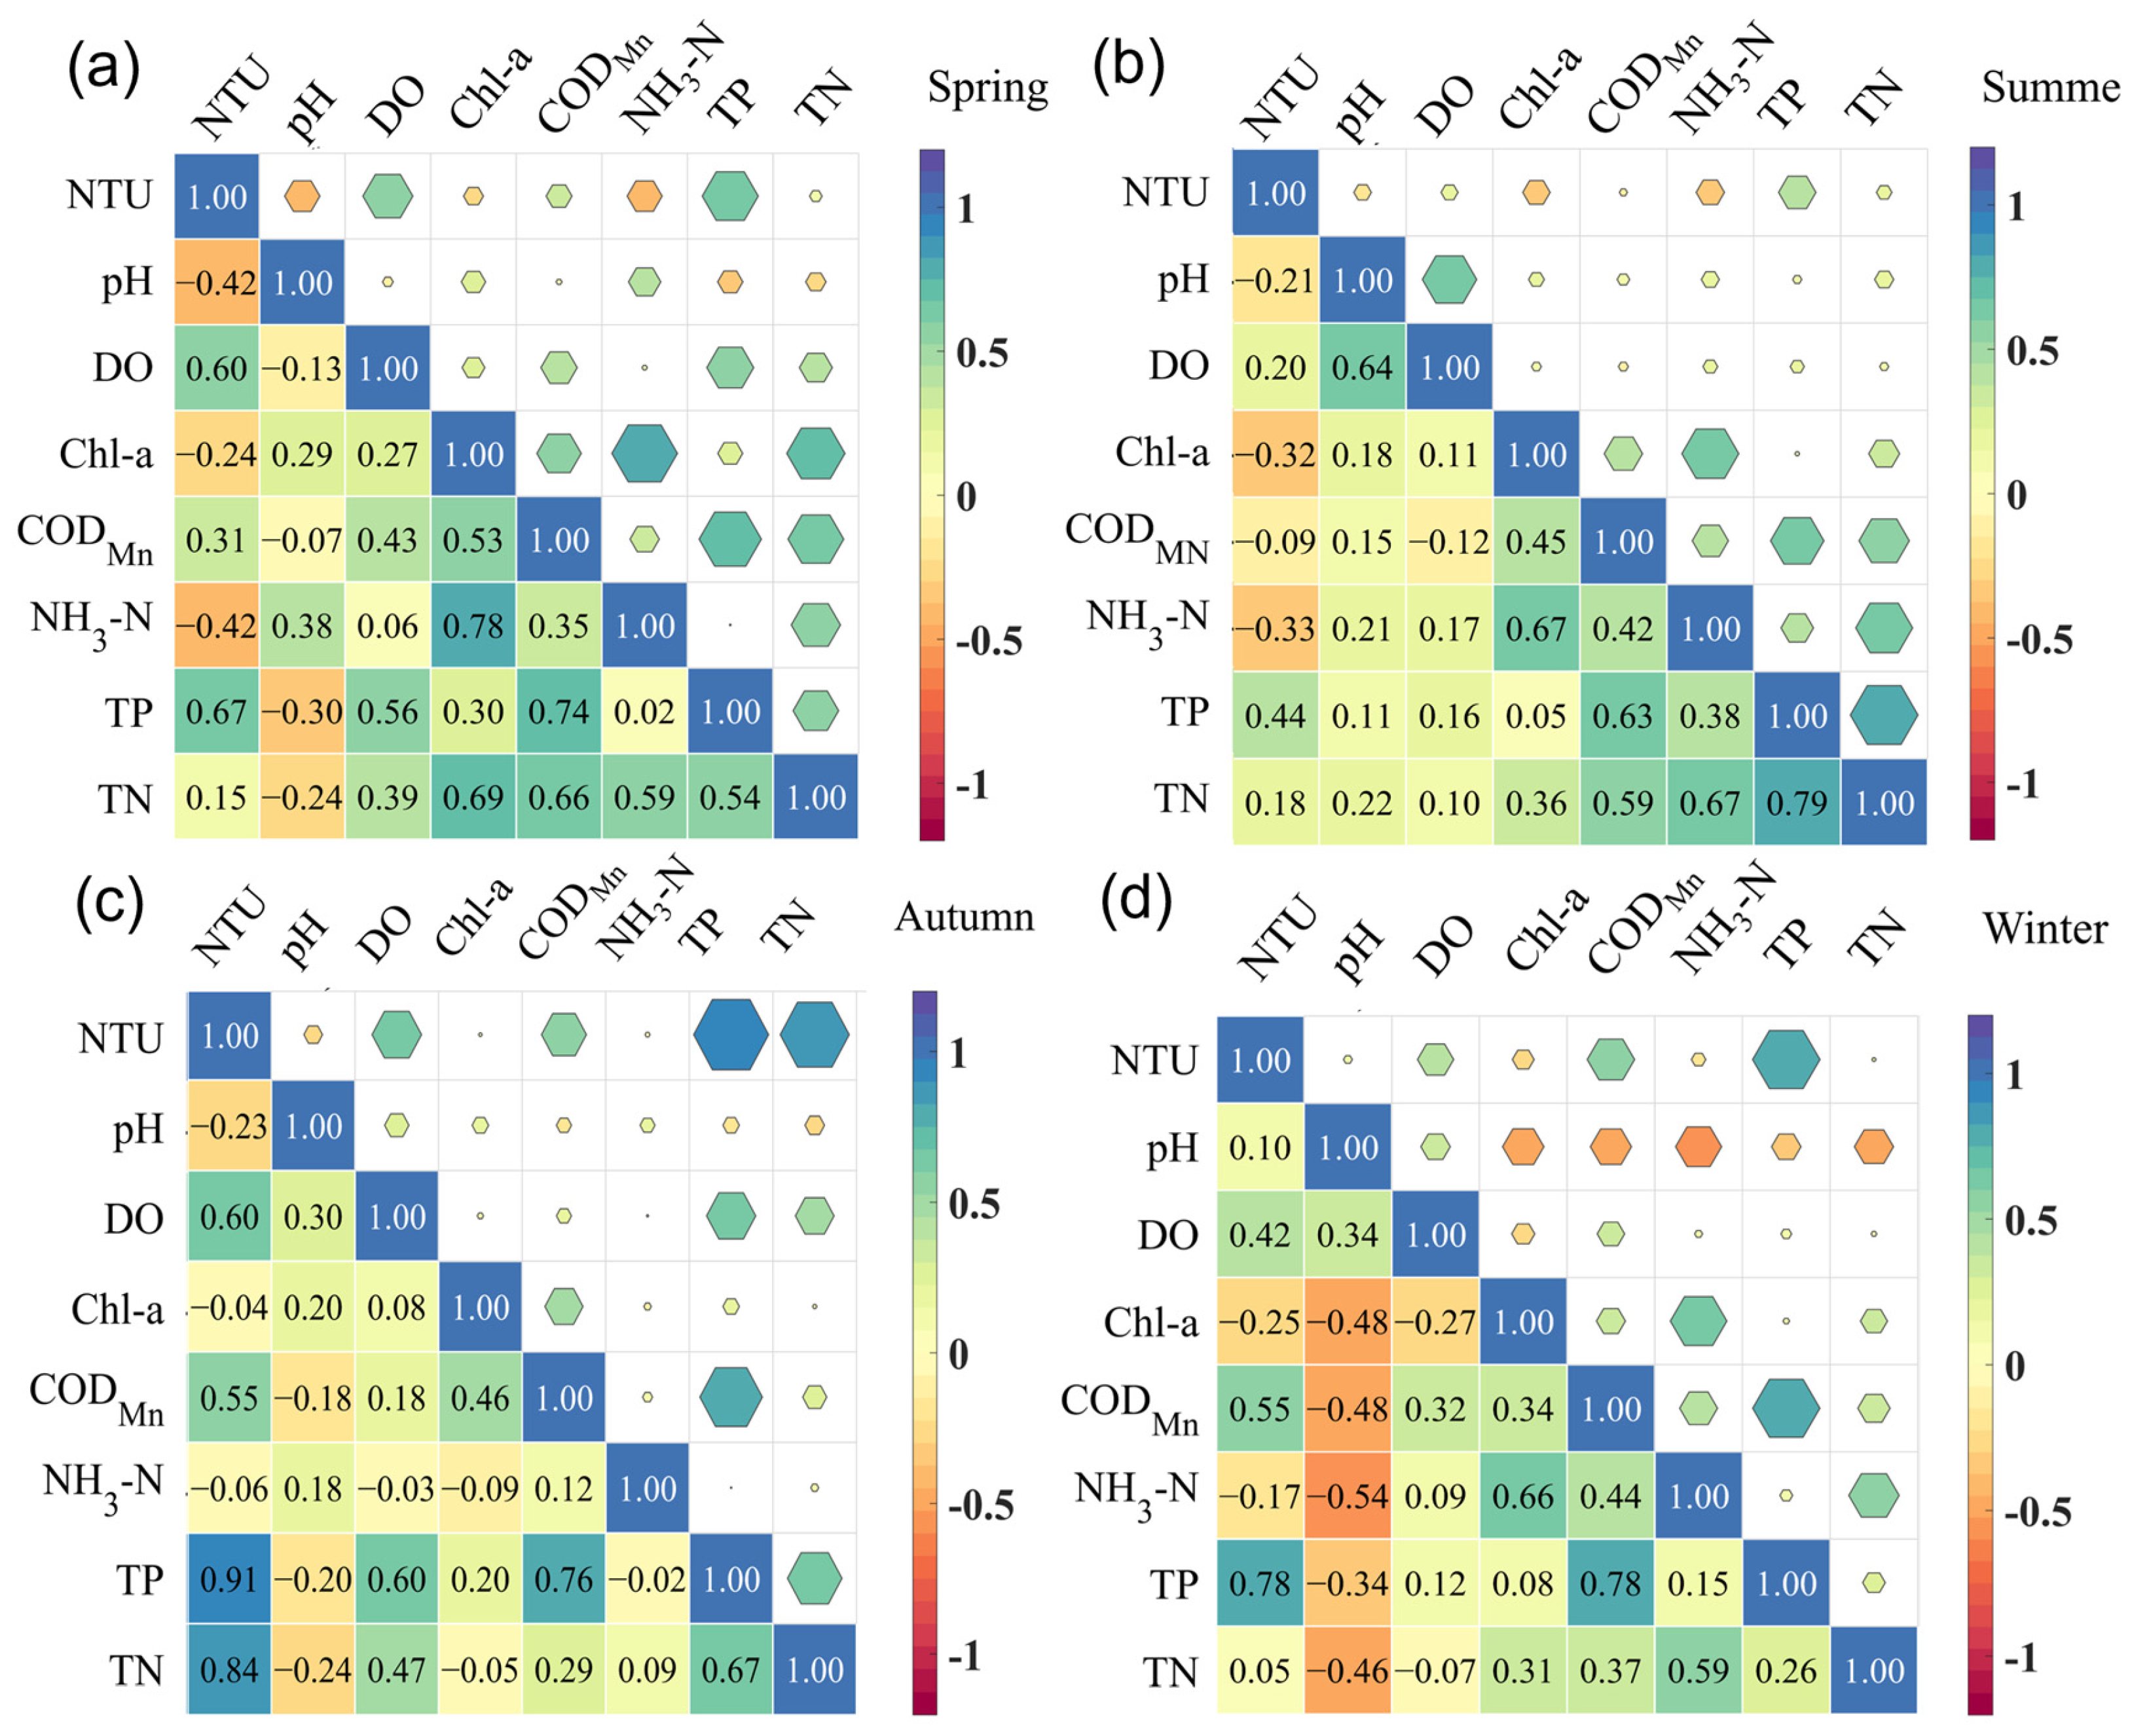
Figure 6 presents the heatmap analysis of the correlation coefficient matrix based on the seasonal average water quality values of the three lakes. As shown in the figure, turbidity was positively correlated with total phosphorus in all seasons, with the strongest correlation observed in autumn, followed by winter and spring, and the weakest correlation in summer. The particularly strong positive correlation in autumn suggests that, as water levels gradually decline, enhanced disturbance of bottom sediments promotes sediment resuspension, thereby causing a simultaneous increase in turbidity and particulate phosphorus concentrations. In addition, turbidity also showed significant positive correlations with total nitrogen (TN), permanganate index (CODMn), dissolved oxygen (DO), and other water quality indicators, further indicating that the association between organic pollution and turbidity became more pronounced in autumn.

3.2. Model Construction and Parameter Calibration & Validation

Parameter calibration and validation are essential steps in model development. In this study, data segmentation and usage were clearly defined: continuous monitoring data from 2019 to 2022 were used for model calibration; independent data from 2023 to 2024 were used for model validation; and all validated data covering 2019–2024 were used for subsequent scenario simulation, threshold identification, and driving mechanism analysis. The calibrated and validated datasets cover complete seasonal hydrological events, including high-water-level events in wet seasons and low-water-level and strong-wind events in dry seasons, ensuring the model’s applicability across various hydrological conditions.
Common statistical indicators for evaluating model fitting and predictive performance include the mean absolute error (MAE), mean absolute percentage error (MAPE), root mean square error (RMSE), and coefficient of determination (R2). The formulas for these evaluation metrics are given as follows:
M A E = 1 n i = 1 n y i y ^ i
M A P E = 100 % n i = 1 n y i y ^ i y i ,
R M S E = 1 n i = 1 n y i y ^ i 2 ,
R 2 = 1 i = 1 n ( y i y ^ i ) 2 i = 1 n ( y i y ¯ ) 2
In the above equations, yi represents the observed value, ŷᵢ represents the model-predicted value, and ȳ denotes the mean of the observed values.
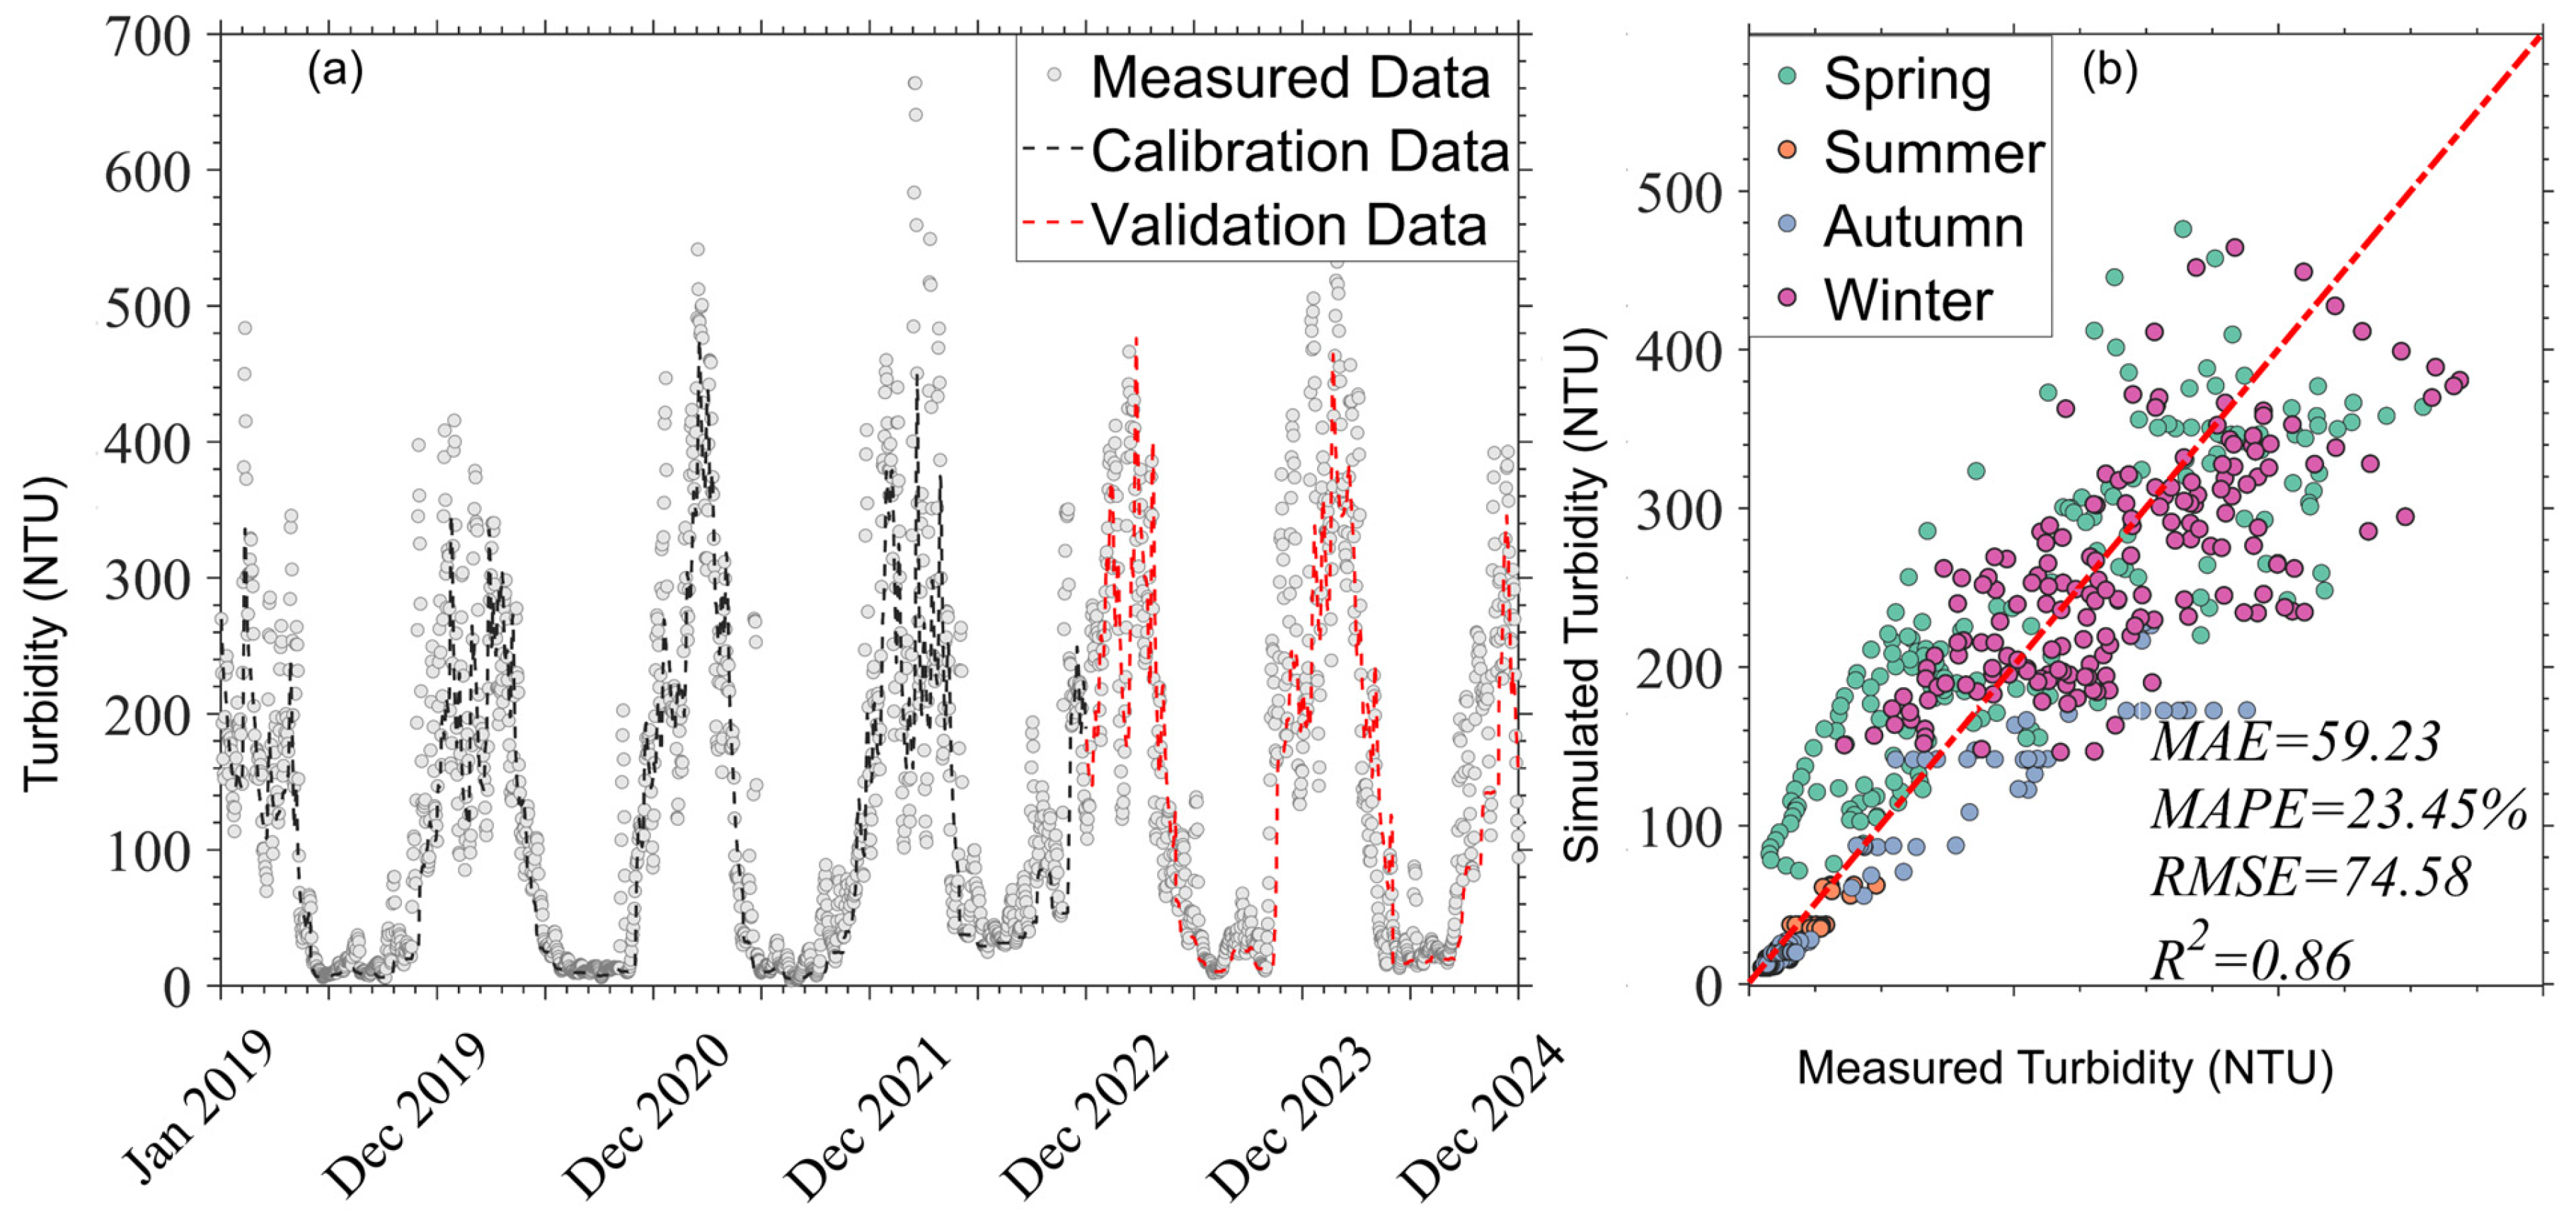
Figure 7 presents the results of model calibration and validation. As shown in the figure, the simulated trends were generally consistent with the observed data. The model yielded an MAE of 59.23, a MAPE of 23.45%, an RMSE of 74.58, and an R2 of 0.86. These performance metrics indicate that the model achieved satisfactory overall accuracy and was able to capture the main fluctuation characteristics of the observed data. The calibrated parameter values are listed in Table 2. The calibration results further show that ks1, ks2, and kd varied substantially among seasons, suggesting that the dynamics of sediment resuspension exhibit pronounced seasonal differences.
Specifically, ks1, which is positively associated with suspension capacity, showed relatively high values in winter and spring (14.30 and 14.14, respectively), but much lower values in summer and autumn (0.13 and 0.23, respectively). This pattern indicates that low water levels and stronger wind-wave disturbance in winter and spring substantially enhanced sediment resuspension. Similarly, ks2, the wind speed response index, was also higher in winter and spring (2.00 and 2.20, respectively) than in summer and autumn (1.80 and 1.95, respectively), suggesting that wind forcing was translated more efficiently into sediment resuspension during the low-water-level seasons. In contrast, the settling velocity kd was higher in summer and autumn (1.49 and 1.22 m/s, respectively) and lower in winter and spring (0.11 and 0.10 m/s, respectively), indicating that particles settled more readily and that the water column remained relatively stable during summer and autumn. Overall, these seasonal parameter variations provide important quantitative evidence for understanding seasonal patterns of sediment transport and turbidity dynamics.

3.3. Scenario Simulation Results Analysis

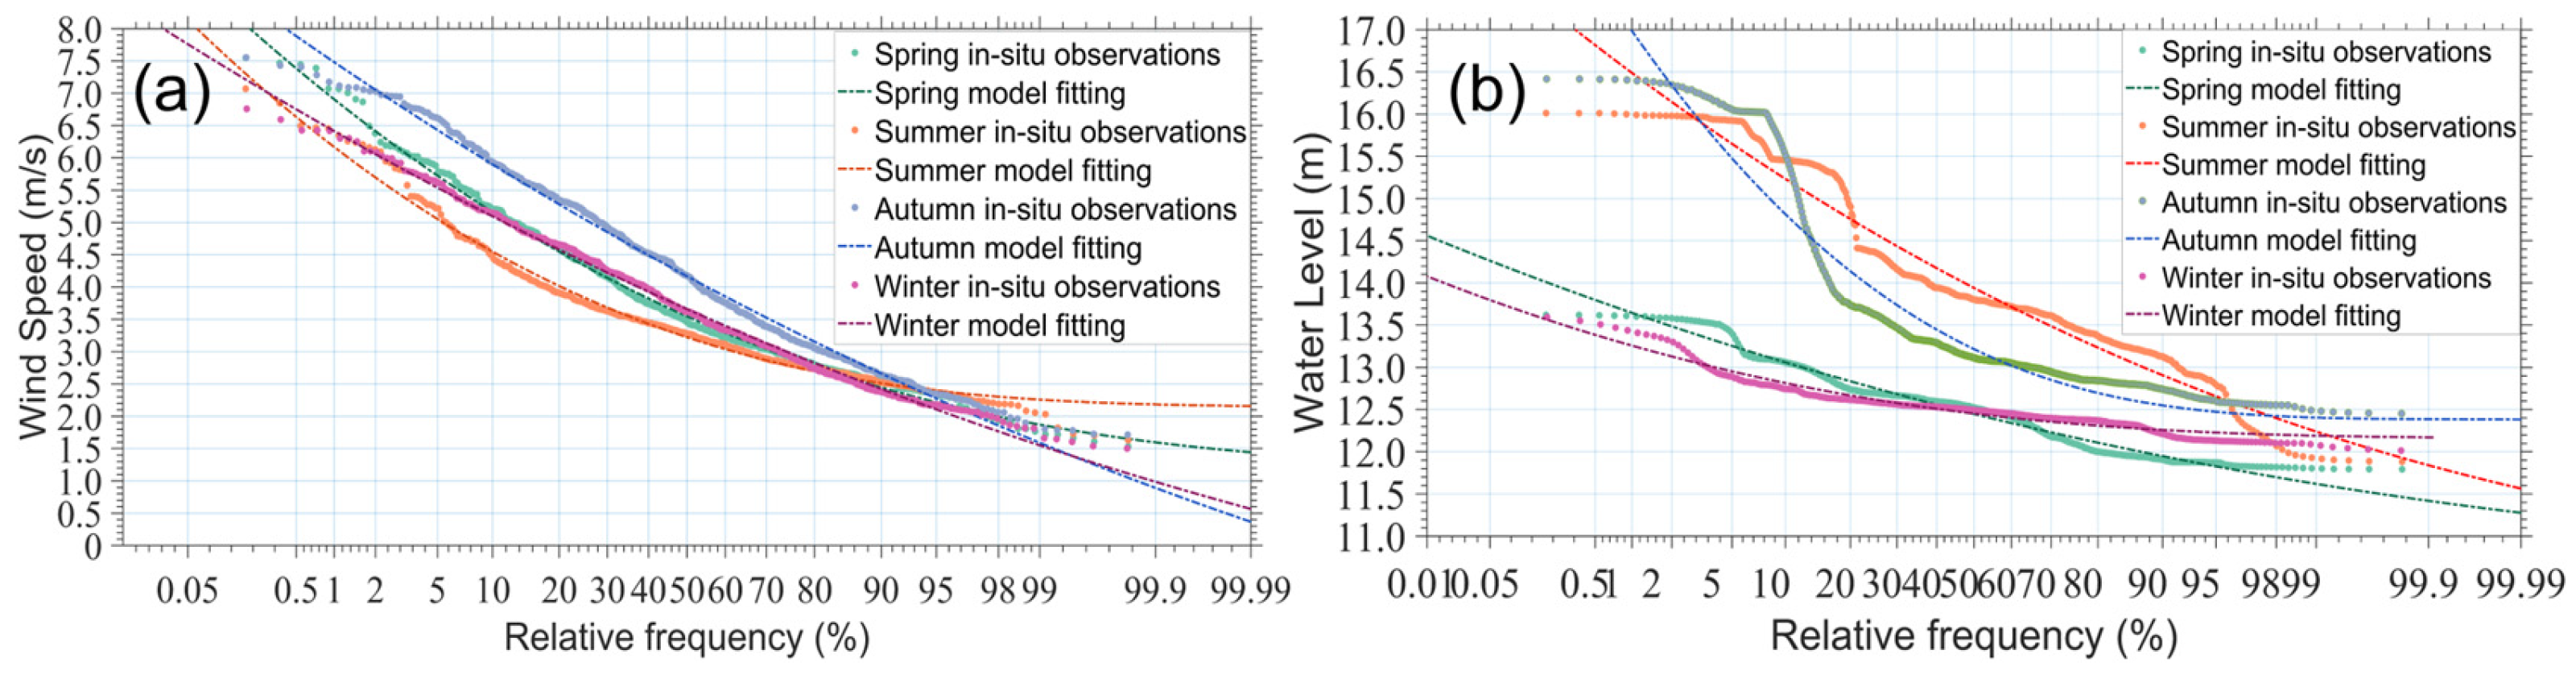
Figure 8 shows the fitted Pearson type III (P-III) probability distributions of wind speed and water level in different seasons. The results indicate that the probability distribution patterns of wind speed were generally similar among seasons, whereas the probability distributions of water level showed pronounced seasonal differences. Based on these seasonal distribution models, 500 sets of water level–wind speed scenario data were randomly generated and used as inputs for turbidity simulation with the established model.
It should be noted that the above scenario generation assumes the independence of water level and wind speed. In natural conditions, certain correlation exists between these two hydrometeorological variables, especially in extreme events such as winter storms, when low water levels and strong winds often occur simultaneously. Since the random sampling is based on univariate probability distributions, the generated scenarios cannot fully reflect the actual joint probability characteristics of water level and wind speed, which may lead to slight deviations in reproducing the frequency and intensity of extreme turbidity events. However, the randomly combined scenarios still cover most of the typical hydrometeorological conditions in the study area, including the strong disturbance events with concurrent low water level and high wind speed. Given that the core objective of this study is to reveal the response mechanism and critical thresholds of turbidity to different water level–wind speed combinations rather than accurately predict the occurrence probability of extreme events, this scenario analysis method is reasonable and feasible to support the core conclusions of this research.
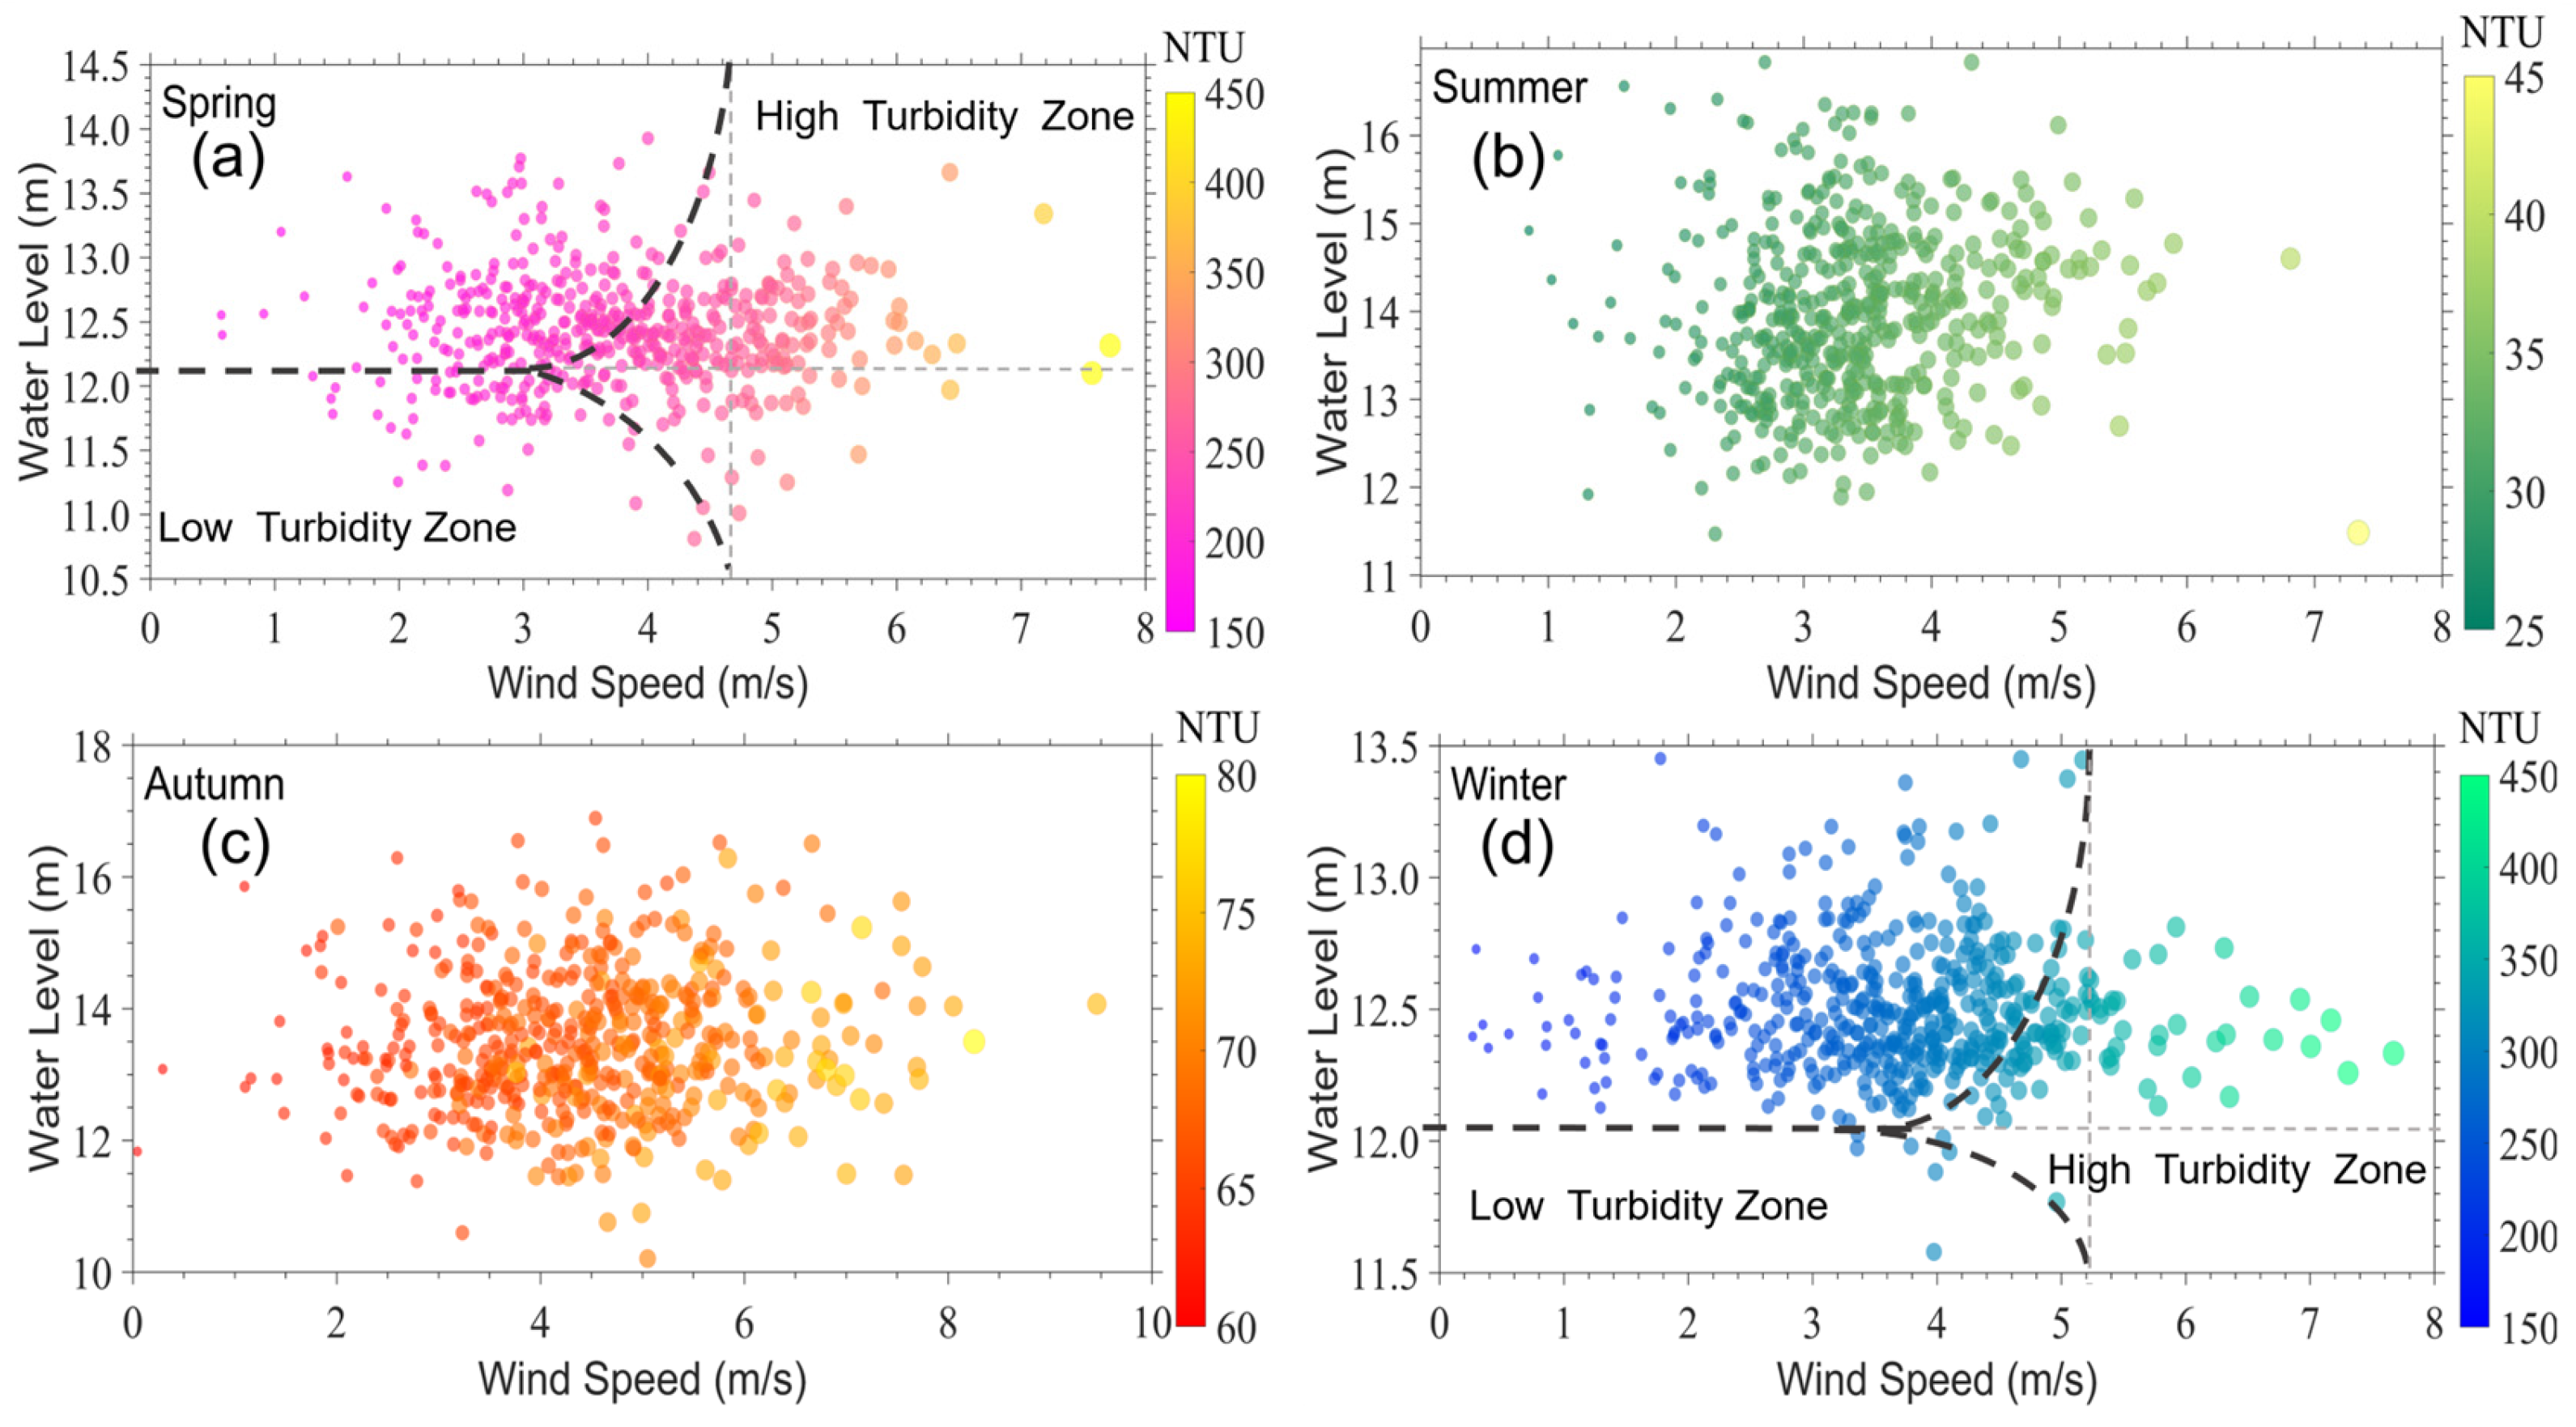
Figure 9 presents the simulation results of wind speed, water level, and the corresponding turbidity under different seasonal conditions. The results indicate clear seasonal differences in turbidity, with higher simulated values in winter and spring and lower values in summer and autumn, the lowest occurring in summer. Specifically, under winter and spring conditions, when the water level was below 12.0 m and wind speed exceeded 5 m/s, turbidity increased sharply to 300–450 NTU. In the simulated dataset, when wind speed reached 7.72 m/s and water level was 12.32 m, turbidity increased to 480 NTU, demonstrating the strong effect of high wind speeds on bottom sediment resuspension. When the simulated water level remained within the range of 12.0–13.0 m, wind speed showed a moderate positive relationship with turbidity, with most turbidity values concentrated between 200 and 280 NTU.
In contrast, summer and autumn were characterized by relatively high water levels, generally above 13.0 m. In particular, when the water level exceeded 15.0 m, turbidity decreased markedly to around 30 NTU, indicating that high water levels can effectively suppress sediment resuspension. Notably, even under the specific combination of a water level of 14.07 m and a mean wind speed of 9.46 m/s, turbidity remained as low as 74.35 NTU, further highlighting the strong resistance of high-water-level conditions to wind-induced disturbance.
Overall, turbidity dynamics exhibited pronounced seasonal characteristics. Low water levels combined with strong wind events in winter and spring constituted high-risk conditions for increased turbidity and deterioration of water quality, and therefore require particular attention in monitoring and early warning. By contrast, during summer and autumn, hydrometeorological conditions were relatively balanced, and favorable turbidity and water quality conditions were maintained under the stabilizing influence of high-water levels.

4. Discussion

4.1. Physical Mechanisms of the Dual Water-Level Thresholds and Verification of Regional Specificity

The two critical water-level thresholds identified in this study, namely the 12.0 m triggering threshold and the 15.0 m safety threshold, essentially reflect two key nodes in the vertical attenuation of wind-wave energy in shallow lakes. When the water level falls below 12.0 m, the vertical depth of the water column is insufficient to dissipate wave energy effectively, allowing wave orbital motion to directly affect bottom sediments and causing bottom shear stress to increase exponentially as water depth decreases. By contrast, when the water level exceeds 15.0 m, the vertical stratification stability of the water body is substantially enhanced. Even under extreme wind conditions of 9.46 m/s, wave energy is unlikely to be transmitted to the lake bed, thereby forming a natural turbidity barrier. This finding goes beyond the conventional understanding based solely on wind speed thresholds, and confirms that water level is a prerequisite variable controlling sediment resuspension in shallow lakes, with an influence even stronger than that of wind speed itself. Quantitative results showed that turbidity increased by an average of 40–60 NTU for every 1 m decrease in water level, whereas it increased by only 30–50 NTU for every 1 m/s increase in wind speed.
Comparison with similar lakes in the middle and lower reaches of the Yangtze River further suggests that the thresholds identified in this study have strong regional specificity. For example, previous research in Meiliang Bay of Lake Taihu showed that large-scale sediment resuspension could be triggered when wind speed exceeded 4 m/s [17], whereas the critical wind speed in the Huayang Lake Group was 5 m/s. This difference is primarily attributable to differences in mean water depth. The average water depth of the Huayang Lake Group is greater than that of Lake Taihu, meaning that stronger wind forcing is required to generate sufficient bottom shear stress to initiate sediment movement. This result further indicates that ecological water-level thresholds must be determined based on the hydromorphological characteristics of individual lake systems, rather than being directly transferred from other regions.

4.2. Asymmetric Regulation by Wind Direction and Seasonal Coupling Effects

The seasonal prevailing wind patterns identified in this study reveal an asymmetric regulatory effect of wind direction on sediment resuspension, a mechanism that is often overlooked in single-factor analyses. The Huayang Lake Group is generally oriented along a northeast–southwest axis, which is highly consistent with the annual prevailing northeasterly winds. As a result, northeasterly winds can produce a longer effective fetch and greater wave energy than other wind directions under the same wind speed conditions.
Field observations revealed an apparently contradictory phenomenon: although water levels in autumn were higher than those in winter and spring, turbidity still remained relatively high and did not decline in proportion to the increase in water level. The main reason is that the frequency of northeasterly winds in autumn reached the annual maximum (26.52%), while mean wind speed also peaked (5.22 m/s), such that the enhanced fetch effect offset part of the suppressive effect of higher water levels. Spatial differences among sub-lakes further support this mechanism. Huang Lake, which is elongated and lacks shelter along the northeast direction, was particularly sensitive to northeasterly winds, with winter turbidity reaching 300–450 NTU, markedly higher than that in Longgan Lake (200–400 NTU) and Daguan Lake (200–350 NTU). In contrast, lake bays weakened by topographic shelter showed substantially lower resuspension intensity than open-water areas under the same wind forcing. The current one-dimensional model assumes a spatially uniform wind field across the entire lake system and does not account for the coupled effects of wind direction and lake basin morphology, which is likely one of the major causes of simulation bias in local lake areas.
It should be emphasized that the above understanding of the asymmetric regulation effect of wind direction is a qualitative conclusion based on long-term observation and statistical analysis, rather than a quantitative result simulated by the numerical model. The adopted one-dimensional model assumes a spatially uniform wind field and does not include wind direction as an input parameter; thus, it cannot quantitatively simulate or numerically characterize the asymmetric influence of wind direction on sediment resuspension. This limitation is further explicitly stated in Section 4.6 (Research Limitations and Future Perspectives).

4.3. Applicability Boundaries and Sources of Error in the One-Dimensional Semi-Empirical Model

The Peter Kristensen one-dimensional semi-empirical model adopted in this study showed satisfactory performance at the lake-group scale. Validation results yielded MAE = 59.23, MAPE = 23.45%, RMSE = 74.58, and R2 = 0.86, indicating that the model was able to reproduce the seasonal dynamics and overall variation trends of turbidity with relatively high accuracy. However, the model still has clear boundaries of applicability.
The main limitation of the model lies in its inability to represent the horizontal spatial heterogeneity of turbidity. First, the model assumes complete mixing of the water body and therefore neglects the effects of lake basin morphology and hydraulic connectivity. The Huayang Lake Group consists of several sub-lakes connected by channels, with substantial differences in water depth, surface area, and sediment properties. As a result, different lake zones may respond differently to the same hydrodynamic forcing. For example, Huang Lake exhibited considerably higher turbidity than Longgan Lake under similar water level and wind speed conditions, whereas the one-dimensional model can only provide a lake-wide average turbidity and cannot capture such spatial differences. Second, the model does not account for the spatial heterogeneity of wind fields or for topographic sheltering effects. In the study area, surrounding hills and embankments may block local wind fields, producing significant differences in wind speed between sheltered bays and open-water areas. Previous studies have shown that three-dimensional numerical models can more accurately simulate the spatial distribution of wind fields and hydrodynamic processes, thereby improving the accuracy of turbidity prediction [26,27].
The calibrated parameters further reveal the seasonal applicability boundary of the model. The suspension capacity coefficient ks1 reached 14.14 and 14.30 in spring and winter, respectively, but was only 0.13 and 0.23 in summer and autumn. Similarly, the settling velocity kd was 1.49 and 1.22 m/s in summer and autumn, but only 0.10 and 0.11 m/s in winter and spring. These pronounced seasonal differences indicate that the one-dimensional model must be calibrated separately for each season to maintain satisfactory accuracy. The use of a single annual parameter set would likely result in substantially larger simulation errors.
Despite these limitations, the one-dimensional semi-empirical model still has considerable practical value. Owing to its limited number of parameters and high computational efficiency, it can rapidly simulate turbidity dynamics using routine monitoring data, making it particularly suitable for regional-scale water quality early warning and management decision-making.

4.4. Ecological Effects of Turbidity–Nutrient Coupling and Eutrophication Risk

The “high turbidity in winter and low turbidity in summer” pattern identified in this study exhibited a marked asymmetric coupling relationship with nutrient concentrations, and this coupling was mainly controlled by seasonal differences in sediment resuspension intensity. Such coupling is a key process regulating eutrophication risk in the lake system. Based on the analysis shown in Figure 6, total phosphorus (TP) displayed the most stable coupling with turbidity, with positive correlations observed in all seasons and correlation coefficients ranging from 0.44 to 0.91. The permanganate index (CODMn) was positively correlated with turbidity in spring, autumn, and winter (0.31–0.55), but showed a weak negative correlation in summer (−0.09). Total nitrogen (TN) exhibited a strong positive correlation with turbidity only in autumn (0.84), whereas correlations in other seasons were weak (0.06–0.18). Overall, the coupling strength followed the order: autumn > winter > spring > summer, which was highly consistent with the seasonal pattern of sediment resuspension intensity.
The core reason for these differences is that sediment resuspension regulates different nutrient fractions to different extents. In autumn, both the frequency and intensity of northeasterly winds reached annual maxima, leading to the strongest sediment resuspension and the large-scale release of particulate phosphorus and organic nitrogen. Consequently, turbidity showed very strong correlations with TP and TN, with coefficients of 0.91 and 0.84, respectively. In winter, although water levels were lowest and resuspension remained strong, turbidity was still strongly correlated with TP (0.78), whereas the correlation with TN weakened because low temperature suppressed the mineralization of organic nitrogen. In summer, high water levels suppressed sediment resuspension, and nutrient dynamics were dominated instead by nonpoint-source inputs and algal metabolism, resulting in weaker correlations between turbidity and nutrients and a weak negative relationship between turbidity and CODMn.
This coupling mechanism directly shapes the pattern of eutrophication development in the lake system, forming a complete “release–accumulation–outbreak” chain. Nutrients released during the autumn peak resuspension period are not fully utilized by algae and therefore accumulate into winter. Continued resuspension in winter further replenishes the nutrient pool, and the accumulated nutrients in spring then support algal proliferation and bloom development. This pattern is consistent with observations reported for other shallow lakes in China and elsewhere [28,29,30,31]. Sediment resuspension is therefore a key driver of internal phosphorus release and elevated nutrient background levels during autumn and winter in the Huayang Lake Group, directly aggravating eutrophication risk. Accordingly, eutrophication control should move beyond the traditional focus on summer algal blooms alone and instead shift prevention efforts forward to autumn and winter, when optimization of water-level regulation and suppression of wind-wave disturbance could reduce sediment resuspension at the source and thereby limit the material basis for spring blooms.

4.5. Hydrological Trade-Offs and Management Implications

As a typical gate-regulated river-connected lake system linked to the Yangtze River, the Huayang Lake Group’s hydrological regime is jointly controlled by Yangtze River water levels, catchment precipitation, and artificial sluice operations, leading to inherent trade-offs between flood control safety and ecological water demand. This conflict is particularly prominent in winter and spring, when the lake needs to reserve sufficient flood storage capacity while maintaining ecologically suitable water levels. The 12.0 m ecological water level threshold determined in this study provides a quantitative reference for refined water level regulation, yet its practical implementation faces obvious contradictions. Maintaining water levels above 12.0 m can effectively suppress sediment resuspension and stabilize water quality but reduces the lake’s flood storage capacity. Conversely, excessive water discharge for flood risk reservation may drop water levels below 12.0 m, triggering severe turbidity outbreaks and water quality degradation. Moreover, the increasing frequency of extreme droughts and strong wind events in the middle and lower Yangtze River basin further intensifies this contradiction, bringing new challenges for the adaptive management of river-connected lake systems under climate change.
Accordingly, targeted hierarchical management strategies are proposed for the study area. First, the existing water quality early warning system should be upgraded to a three-level graded warning framework that integrates water level, wind speed, and wind direction to achieve precise risk prediction and targeted management responses. Second, under the premise of ensuring flood control safety, sluice regulation schemes in winter and spring should be optimized to sustain water levels above 12.5 m and reduce sediment resuspension risk. Third, spatially differentiated management should be implemented, with priority given to aquatic vegetation restoration in wind-disturbed open lake areas to enhance sediment stabilization and wave attenuation.

4.6. Research Limitations and Future Perspectives

This study systematically clarifies the seasonal driving mechanisms of turbidity dynamics and identifies key ecological water-level thresholds for the Huayang Lake Group; however, several limitations should be acknowledged. The one-dimensional model adopted in this study assumes a spatially uniform wind field and does not account for wind direction effects, topographic sheltering, or spatial hydrodynamic heterogeneity, thereby limiting its ability to quantify asymmetric resuspension processes and simulate spatial turbidity variability among sub-lakes. In addition, each sub-lake is represented by only a single central monitoring station, which cannot fully capture fine-scale spatial differences in turbidity caused by shoreline morphology, tributary inflows, and localized hydrodynamic conditions. The use of meteorological data from stations located outside the lake area may also introduce minor deviations from actual lake-surface wind conditions. Furthermore, the water level–wind speed scenarios generated in this study are based on the assumption of statistical independence between the two variables, without considering their natural covariation, which may introduce uncertainties in the simulation of extreme high-turbidity events. The current modeling framework also does not incorporate potentially important factors such as aquatic vegetation coverage, spatial variability in sediment properties, and frequent river–lake water exchange processes.
Ultimately, multi-objective water-level regulation strategies will be explored to better coordinate flood control, water resource management, and ecological protection, thereby providing practical support for the management of river-connected shallow lakes in the Yangtze River basin.

5. Conclusions

Based on the comprehensive analysis of hydrometeorological and water quality data from the Huayang Lake Group during 2019–2024, together with simulations conducted using the established water level–wind speed–turbidity coupling model, the following conclusions can be drawn:
First, turbidity exhibited a typical seasonal pattern of “high turbidity in winter and low turbidity in summer”. Turbidity generally reached 200–450 NTU in winter (December to February of the following year), but declined to around 30 NTU in summer (June to August). This seasonal rhythm was mainly driven by annual water level fluctuations of up to 2.5 m and by seasonal changes in wind field characteristics. Model simulations further showed that when the water level fell below 12.0 m and wind speed exceeded 5 m/s, turbidity increased sharply to 300–480 NTU. In contrast, when the water level exceeded 15.0 m, turbidity could still be maintained at a relatively low level of 74.35 NTU even under a wind speed of 9.46 m/s.
Second, when the water level exceeded 15.0 m, the vertical stability of the water body was enhanced and its resistance to wind-induced disturbance increased substantially. The simulation results indicate that a water level of 12.0 m and a wind speed of 5 m/s represent two critical thresholds for sediment resuspension in the lake system. The simultaneous occurrence of water levels below this threshold and wind speeds above this threshold therefore constitutes a high-risk condition for turbidity deterioration.
Third, the model quantitatively demonstrated that turbidity increased by approximately 40–60 NTU for every 1 m decrease in water level, and by approximately 30–50 NTU for every 1 m/s increase in wind speed. These results provide an operational quantitative basis for ecological regulation of the lake group. Based on the simulation results, a dual-parameter management and early warning framework integrating water level and wind speed can be established. Specifically, when the water level falls below 12.0 m and the forecasted wind speed exceeds 5 m/s, emergency water quality response measures should be initiated. At the same time, winter and spring water level regulation strategies should be optimized by integrating water quality protection objectives with hydrological scheduling requirements.

Author Contributions

Conceptualization, B.W. and W.W.; methodology, D.L. and J.J.; investigation, Z.F., S.S. and X.S.; resources, S.S. and X.S.; data curation, Z.F. and J.D.; formal analysis, B.W.; validation, D.L.; visualization, J.D.; writing—original draft preparation, B.W.; writing—review and editing, B.W., W.W. and J.J.; supervision, W.W. and J.J.; funding acquisition, W.W. and J.J. All authors have read and agreed to the published version of the manuscript.

Funding

This research was funded by the National Key Research and Development Program of China (grant number: 2023YFC3207503) and the Second Phase Joint Research Project for Yangtze River Ecological and Environmental Protection and Restoration (grant number: 2022-LHYJ-02-0504-05).

Data Availability Statement

The data that support the findings of this study are available from the corresponding authors upon reasonable request.

Conflicts of Interest

The authors declare no conflicts of interest.

References

  1. Phillips, G.; Willby, N.; Moss, B. Submerged macrophyte decline in shallow lakes: What have we learnt in the last forty years? Aquat. Bot. 2016, 135, 37–45. [Google Scholar] [CrossRef] [Scilit]
  2. Wang, J.Q.; Song, Y.Z.; Xue, Y. Research progress on climate-change-induced eutrophication of water bodies. Water Resour. Prot. 2022, 38, 145–155. [Google Scholar] [CrossRef]
  3. Matos, T.; Martins, M.S.; Henriques, R.; Goncalves, L.M. A review of methods and instruments to monitor turbidity and suspended sediment concentration. J. Water Process Eng. 2024, 64, 105624. [Google Scholar] [CrossRef] [Scilit]
  4. Yao, X.Y.; Liu, X.W.; Zhou, Y.C.; Zhang, L.; Zhou, Z.X.; Zhang, Y.P. The influence of wind-induced sediment resuspension and migration on raw water turbidity in Lake Taihu, China. Environ. Sci. Pollut. Res. 2022, 29, 84487–84503. [Google Scholar] [CrossRef] [Scilit]
  5. Qin, B.Q.; Hu, W.P.; Gao, G.; Luo, L.C.; Zhang, J.S. Dynamic mechanism of sediment suspension and a conceptual model for internal nutrient release in Lake Taihu. Chin. Sci. Bull. 2003, 48, 1822–1831. [Google Scholar] [CrossRef]
  6. Ding, W.H.; Zhao, J.X.; Qin, B.Q.; Wu, T.F.; Zhu, S.L.; Li, Y.; Xu, S.K.; Ruan, S.P.; Wang, Y. Exploring and quantifying the relationship between instantaneous wind speed and turbidity in a large shallow lake: Case study of Lake Taihu in China. Environ. Sci. Pollut. Res. 2021, 28, 16616–16632. [Google Scholar] [CrossRef] [Scilit]
  7. Lecrivain, N.; Clement, B.; Dabrin, A.; Seigle-Ferrand, J.; Bouffard, D.; Naffrechoux, E.; Frossard, V. Water-level fluctuation enhances sediment and trace metal mobility in lake littoral. Chemosphere 2021, 264, 128451. [Google Scholar] [CrossRef] [Scilit]
  8. Qu, S.; Wang, J.J.; Yuan, Y. Time-lag response of turbidity to wind speed in Meiliang Bay, Lake Taihu. Chin. Environ. Sci. 2023, 43, 3141–3149. [Google Scholar] [CrossRef]
  9. Deng, S.Q.; Tian, Z.H.; Bai, T.; Xie, S.; Li, W.K.; Gu, H.H. Multi-temporal remote sensing analysis of water turbidity variation in Lake Liangzi. J. Yangtze River Sci. Res. Inst. 2025, 42, 97–102,119. [Google Scholar] [CrossRef]
  10. Zhou, Q.; Wang, J.R.; Tan, L.Q.; Feng, L.; Li, J.; Xing, Q.G. Remotely sensed water turbidity dynamics and its potential driving factors in Wuhan, an urbanizing city of China. J. Hydrol. 2021, 593, 125893. [Google Scholar] [CrossRef] [Scilit]
  11. Wan, J.; Yuan, X.Y.; Ye, H.M.; Yang, X.F.; Tao, L. Phosphorus fractions and bioavailability in sediments of different inflowing rivers of Lake Hongze. Chin. Environ. Sci. 2020, 40, 4568–4579. [Google Scholar] [CrossRef]
  12. Qin, B.Q. Shallow-lake limnology and eutrophication control of Lake Taihu. J. Lake Sci. 2020, 32, 1229–1243. [Google Scholar] [CrossRef] [Scilit]
  13. Bu, M.S.; Li, Y.P.; Wei, J.; Tang, C.Y. The Influence of Ship Waves on Sediment Resuspension in the Large Shallow Lake Taihu, China. Int. J. Environ. Res. Public Health 2020, 17, 7055. [Google Scholar] [CrossRef] [Scilit]
  14. Zhu, G.W.; Qin, B.Q.; Zhang, Y.L.; Li, Y.; Zhu, M.Y.; Xu, H.; Zhang, Y.B. Seventy-year variation of phosphorus concentration in Lake Taihu and future control strategy. J. Lake Sci. 2021, 33, 957–973. [Google Scholar] [CrossRef] [Scilit]
  15. Chen, F.; Zhang, C.; Brett, M.T.; Nielsen, J.M. The importance of the wind-drag coefficient parameterization for hydrodynamic modeling of a large shallow lake. Ecol. Inform. 2020, 59, 101106. [Google Scholar] [CrossRef] [Scilit]
  16. Luo, W.G.; Han, Y.C.; Pan, Y.; Lu, J.; Zhao, J.X. Quantifying wind-induced turbulence and wave energy in a shallow lake: Insights from a large-scale indoor physical model of Lake Taihu. Phys. Fluids 2025, 37, 085196. [Google Scholar] [CrossRef] [Scilit]
  17. Tong, Y.L.; Liang, T.; Wang, L.Q.; Tian, S.H. Characteristics of nitrogen release from Lake Dongting sediments under variable water level and velocity in the two-way annular flume. J. Lake Sci. 2016, 28, 59–67. [Google Scholar] [CrossRef] [Scilit] [PubMed]
  18. Fan, C.X. Progress and prospects of sediment-water interface research in lakes. J. Lake Sci. 2019, 31, 1191–1212. [Google Scholar] [CrossRef] [Scilit]
  19. Liu, X.H.; Huang, W.R. Modeling sediment resuspension and transport induced by storm wind in Apalachicola Bay, USA. Environ. Model. Softw. 2009, 24, 1339–1341. [Google Scholar] [CrossRef] [Scilit]
  20. Pang, Y.; Yan, R.R.; Yu, Z.B.; Li, Y.P.; Li, R.L. Study on sediment resuspension-settling and internal loading under wind-wave action. Environ. Sci. 2008, 29, 2456–2464. [Google Scholar] [CrossRef]
  21. Zhang, Y.L.; Zhang, Y.B.; Qin, B.Q.; Zhu, G.W. Evolution process and driving factors of ecological space of lakes in the middle-lower Yangtze River basin. Environ. Sustain. Dev. 2019, 44, 33–36. [Google Scholar] [CrossRef]
  22. Li, Y.Y.; Shen, F.; Chen, S.Y.; Wei, X.D. Long-term turbidity retrieval and analysis of inland rivers and lakes based on XGBoost. Chin. J. Environ. Eng. 2024, 18, 398–408. [Google Scholar] [CrossRef]
  23. Zhu, W.W.; Yang, Z.J.; Fan, Z.Y.; Guo, W.Y. Impact of water level fluctuation on water quality in the Huayang Lakes. J. Shanghai Marit. Univ. 2024, 46, 144–152. [Google Scholar] [CrossRef]
  24. Kristensen, P.; Søndergaard, M.; Jeppesen, E. Resuspension in a shallow eutrophic lake. Hydrobiologia 1992, 228, 101–109. [Google Scholar] [CrossRef] [Scilit]
  25. Guo, C.; He, Q.; Guo, L.C.; Wang, X.Y. Experimental study on the effect of turbulence on flocculent settling of cohesive fine sediment. J. Sediment Res. 2019, 44, 18–25. [Google Scholar] [CrossRef]
  26. Zhao, Q.H.; Chen, S.Q.; Chen, S.Y. Response of water turbidity to wind speed/direction and their temporal cumulative effects: A case study of Gonghu Bay, Lake Taihu. J. Lake Sci. 2018, 30, 1587–1598. [Google Scholar] [CrossRef] [Scilit]
  27. Zou, R.; Wu, Z.; Zhao, L.; Chen, Y.H.; Yu, Y.H.; Liu, Y. Three-dimensional numerical simulation of nutrient flux balance in lakes. J. Lake Sci. 2017, 29, 819–826. [Google Scholar] [CrossRef] [Scilit]
  28. Cui, K.; Xing, B.; Li, Y.C.; Zhu, R.; Gao, X.Z.; Cheng, X.; Sun, D.Z.; Huang, K. Source Identification and Control of Eutrophication in Large Shallow Freshwater Lakes: A Case Study of Lake Taihu. Water 2025, 17, 2370. [Google Scholar] [CrossRef] [Scilit]
  29. Wu, Q.L.; Zhang, K.; Chen, H.; Jiang, F.Y.; Lin, Z.; Zhou, Z.Z. Seasonal dynamics and spatial distribution of chlorophyll-a in the Huayang Lake–river cluster. J. Hydroecol. 2019, 40, 66–72. [Google Scholar] [CrossRef]
  30. Zhu, G.W.; Shi, K.; Li, W.; Li, N.; Zou, W.; Guo, C.X.; Zhu, M.Y.; Xu, H.; Zhang, Y.L.; Qin, B.Q. Annual forecasting of cyanobacterial blooms in Lake Taihu: Methodology and discussion. J. Lake Sci. 2020, 32, 1421–1431. [Google Scholar] [CrossRef] [Scilit]
  31. Rollwagen-Bollens, G.; Lee, T.; Rose, V.; Bollens, S.M. Beyond Eutrophication: Vancouver Lake, WA, USA as a Model System for Assessing Multiple, Interacting Biotic and Abiotic Drivers of Harmful Cyanobacterial Blooms. Water 2018, 10, 757. [Google Scholar] [CrossRef] [Scilit]
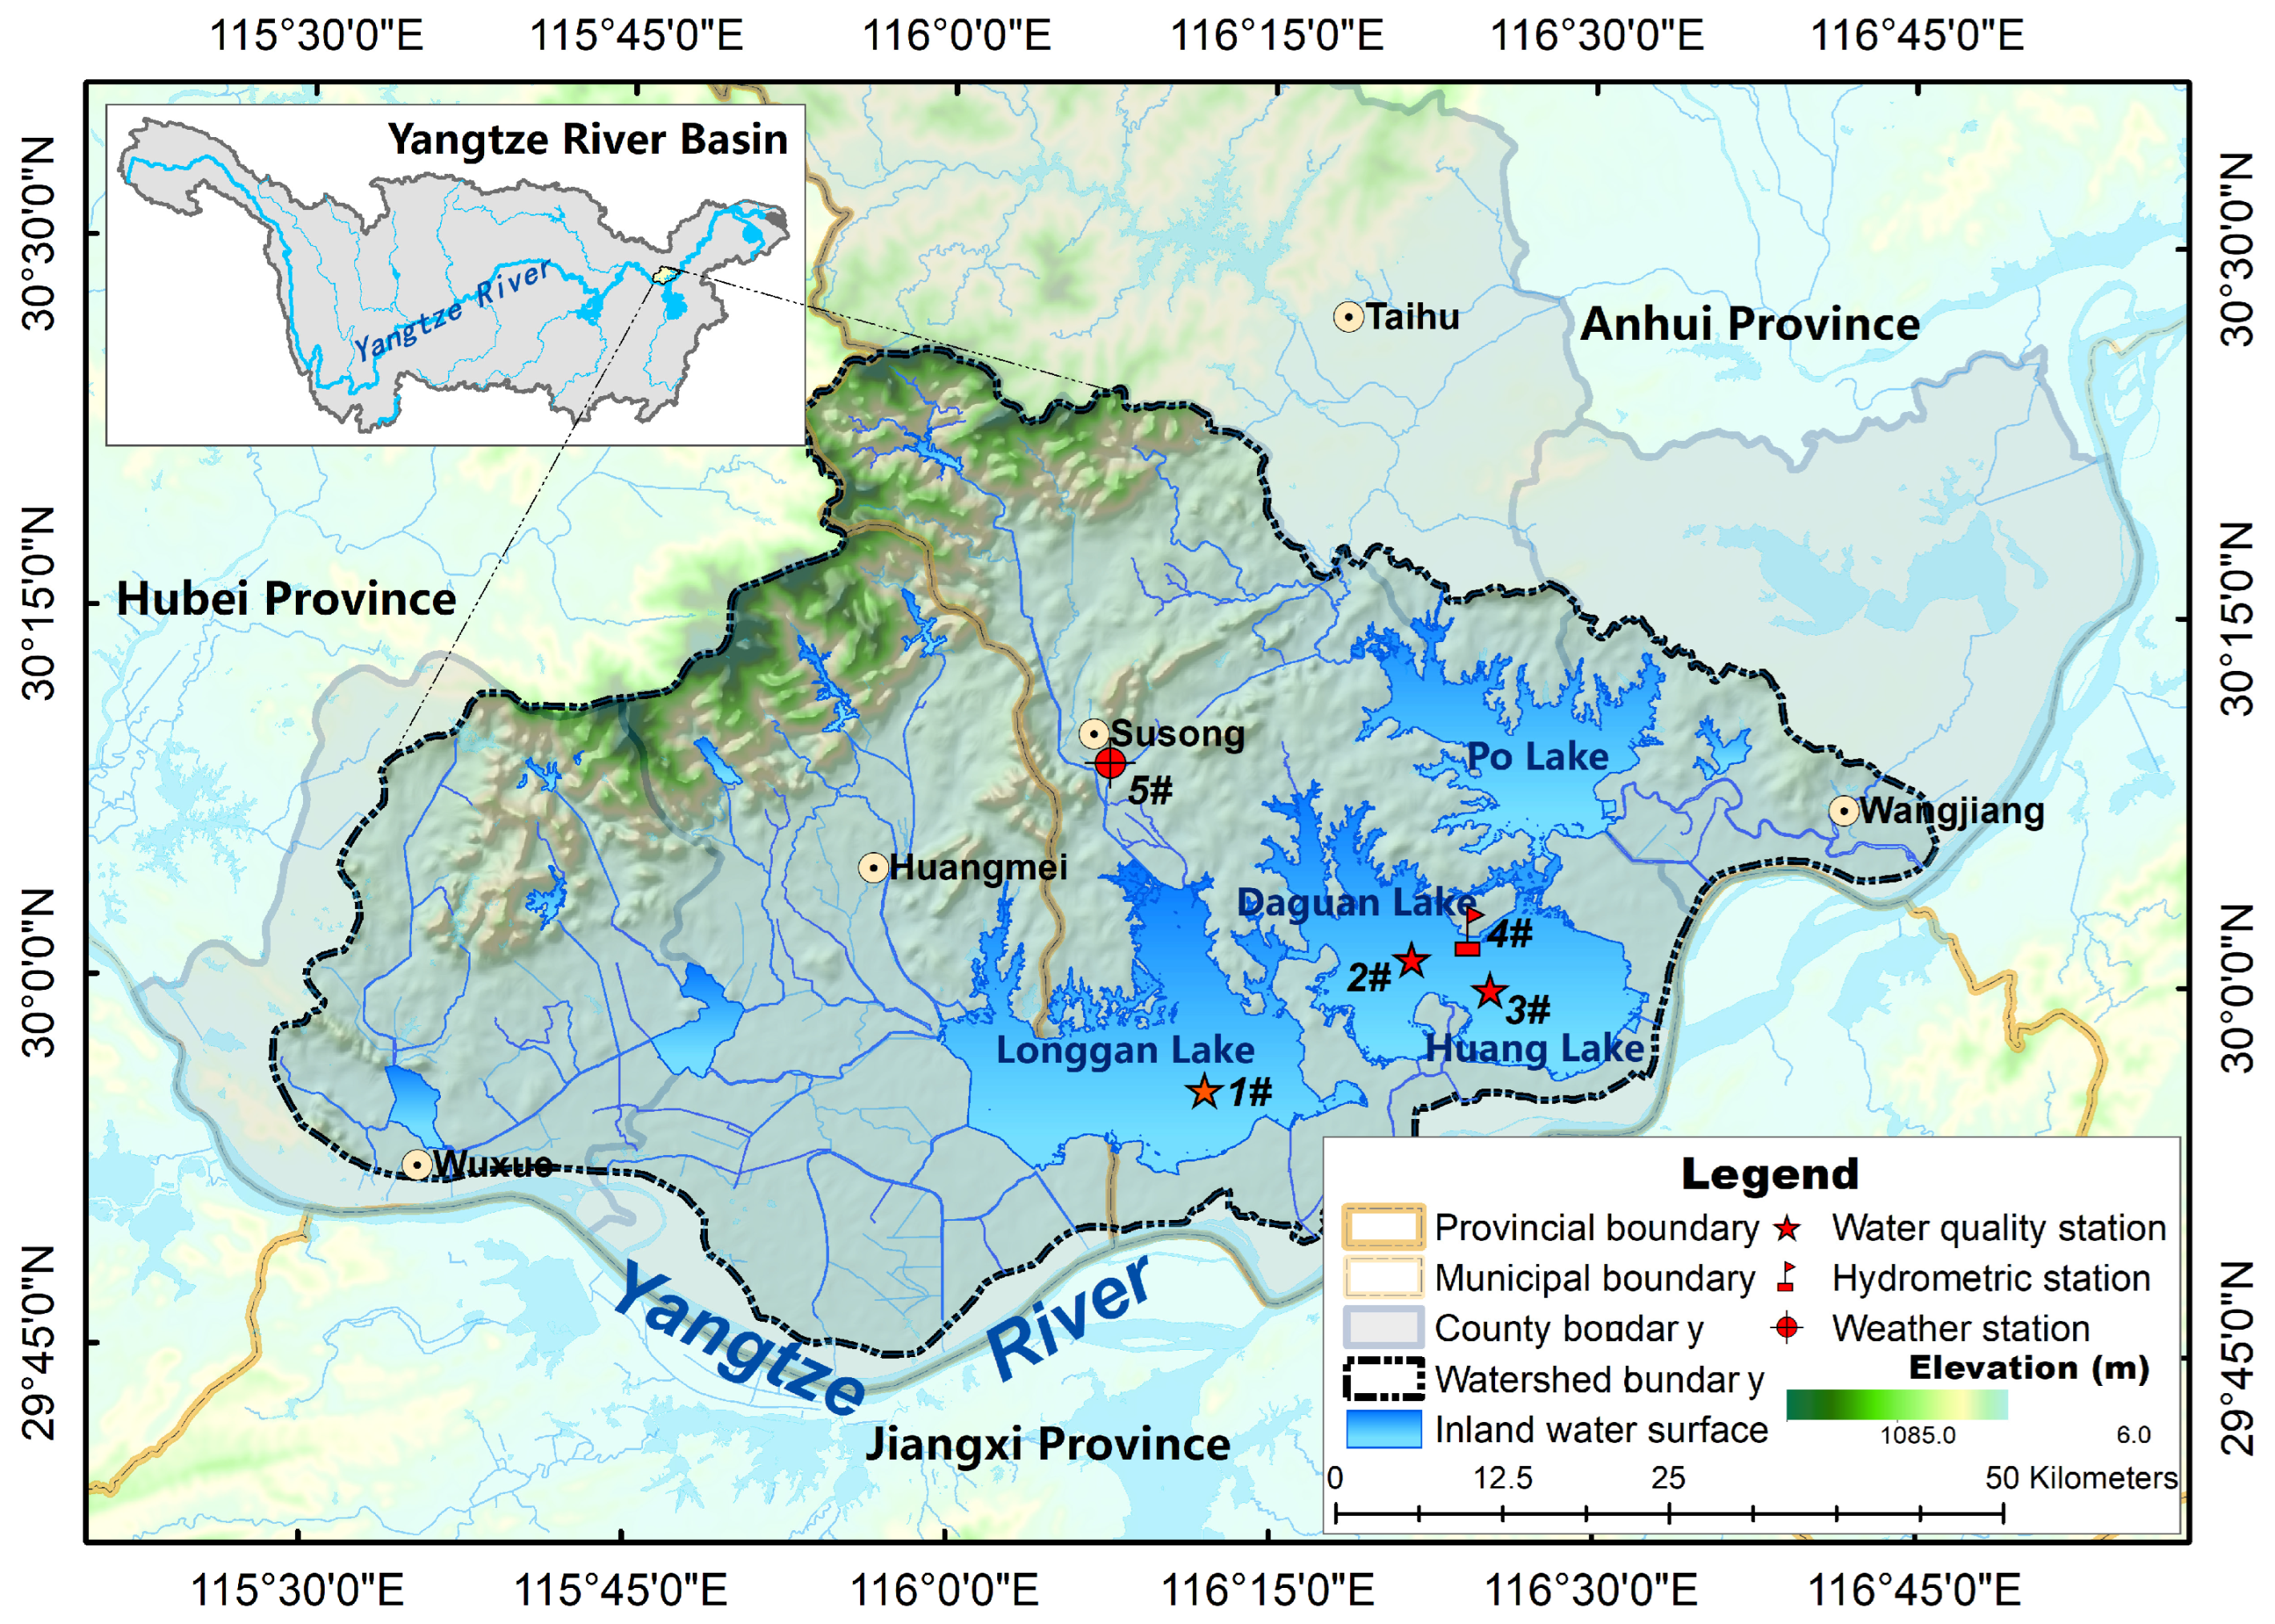
Figure 1. Map of hydro-meteorological stations in the Huayang lake group basin.
Water 18 01316 g001
Figure 2. Turbidity seasonal changes and water level-wind coupling mechanism: Technical flowchart.
Water 18 01316 g002
Figure 3. Time series chart of water level and turbidity in the Huayang Lake Group.
Water 18 01316 g003
Figure 4. Seasonal variations in wind speed, direction frequency, and corresponding water level statistics. (a) Spring; (b) Summer; (c) Autumn; and (d) Winter. All wind rose plots use the radial axis to represent wind direction frequency, circle size to denote mean wind speed, and color gradient to indicate mean water level.
Water 18 01316 g004
Figure 5. Seasonal ternary coupling relationships among wind speed, water level, and turbidity across three sub-lakes. (a) Daguan Lake; (b) Longgan Lake; and (c) Huang Lake. All ternary plots display three environmental variables (mean wind speed, mean water level, and turbidity), with colored dots representing different seasons (spring, summer, autumn, and winter).
Water 18 01316 g005
Figure 6. Seasonal correlation heatmaps of water quality indicators. (a) Spring correlation heatmap; (b) Summer correlation heatmap; (c) Autumn correlation heatmap; and (d) Winter correlation heatmap. All heatmaps display Pearson correlation coefficients between water quality indicators (e.g., TP, TN, CODMn, DO), with color gradients ranging from −1 (red, negative correlation) to 1 (blue, positive correlation).
Water 18 01316 g006
Figure 7. Calibration and validation performance of the turbidity simulation model. (a) Time series comparison of measured turbidity against calibration and validation simulations; and (b) Scatter plot of measured versus simulated turbidity. In panel (a), open circles represent measured turbidity, the black dashed line denotes calibration simulations, and the red dashed line represents validation simulations. In panel (b), colored points indicate seasonal groups, and key performance metrics (MAE, MAPE, RMSE, and R2) are provided to quantify model accuracy.
Water 18 01316 g007
Figure 8. Seasonal P-III distribution fitting for wind speed and water level. (a) Wind speed (m/s) distribution fitting; and (b) Water level (m) distribution fitting. In both panels, colored dots represent seasonal in situ observations, and dashed lines denote the corresponding P-III model fitting curves for spring, summer, autumn, and winter.
Water 18 01316 g008
Figure 9. Seasonal simulation results of wind speed, water level, and turbidity. (a) Spring; (b) Summer; (c) Autumn; and (d) Winter. All panels show simulated relationships between wind speed (x-axis), water level (y-axis), and turbidity (color gradient).
Water 18 01316 g009
Table 1. Lake group monitoring station observation factor information.
Station IDStation Name (Type)LongitudeLatitudeMonitored ParametersSampling Interval
1#Longgan Lake (Water Quality Station)116°14′ E29°56′ NNTU, pH, DO, Chl-a1 h
CODMn, NH3-N, TP, TN4 h
2#Daguan Lake (Water Quality Station)116°36′ E30°02′ NNTU, pH, DO, Chl-a1 h
CODMn, NH3-N, TP, TN4 h
3#Huang Lake (Water Quality Station)116°45′ E29°59′ NNTU, pH, DO, Chl-a1 h
CODMn, NH3-N, TP, TN4 h
4#Xiacang (Hydrological Station)116°24′ E30°2′ NWater Level1 d
5#Susong (Meteorological Station)116°08′ E30°10′ NWind Speed, Wind Direction1 h
Table 2. Seasonal parameter calibration results.
ParameterSpringSummerAutumnWinter
ks114.140.130.2314.30
ks22.201.801.952.00
kd0.101.491.220.11
Disclaimer/Publisher’s Note: The statements, opinions and data contained in all publications are solely those of the individual author(s) and contributor(s) and not of MDPI and/or the editor(s). MDPI and/or the editor(s) disclaim responsibility for any injury to people or property resulting from any ideas, methods, instructions or products referred to in the content.