Article

Development of an Electronic Tongue-Based Taste Index for Process Monitoring and Anomaly Detection in Drinking Water Treatment


1
Korea Institute of Civil Engineering and Building Technology, 283 Goyangdae-Ro, Ilsanseo-Gu, Goyang-si 10223, Republic of Korea
2
Department of Civil and Environmental Engineering, Korea University of Science & Technology, 217 Gajung-Ro, Yuseong-Gu, Daejeon 34113, Republic of Korea
*
Author to whom correspondence should be addressed.
Water 2026, 18(11), 1305; https://doi.org/10.3390/w18111305
Submission received: 1 April 2026 / Revised: 23 May 2026 / Accepted: 25 May 2026 / Published: 28 May 2026
(This article belongs to the Special Issue Advanced Data Analytics for Water Quality and Public Health)

Abstract

Taste is a critical yet under-monitored parameter influencing consumer trust in drinking water. Despite its importance, conventional systems rarely quantify taste objectively for operational management. This study introduces a novel sensor-based Taste Index (TI), developed using a potentiometric electronic tongue (E-tongue) with seven ion-selective electrodes, to enable continuous, quantitative evaluation of taste stability across treatment and distribution systems. Multivariate analyses, including principal component analysis and partial least squares discriminant analysis, characterized treatment-dependent variations and spatial heterogeneity. The TI was defined as the normalized Euclidean distance from the final treated water reference (TI = 0.00). Results showed raw water at TI = 1.00, while a temporary increase to TI = 0.38 post-ozonation indicated the formation of taste-active byproducts. Notably, distribution samples with TI > 0.4 precisely corresponded to areas with documented aesthetic complaints. This research presents the first application of a sensor-derived TI for proactive taste monitoring. By enabling early anomaly detection and process tracking, the TI supports data-driven, consumer-centered water management. Its scalability and real-time applicability position it as a practical tool for smart water infrastructure and enhanced operational control.

1. Introduction

Continuous quality assurance from water sources to points of use is essential for safeguarding drinking water safety [1,2]. Beyond regulatory compliance, aesthetic water quality parameters, particularly taste and odor, are important determinants of consumer acceptance and trust in drinking water systems [3]. Recent studies have highlighted that even minor deviations in sensory attributes can trigger consumer complaints and undermine confidence in tap water, despite meeting physicochemical standards. Even when drinking water satisfies physicochemical standards, minor deviations in sensory attributes can trigger consumer complaints and reduce public confidence in tap water.
Conventional water quality assessments primarily rely on chemical analyses, which are limited in capturing subtle and integrated variations in taste [4]. Because taste results from complex interactions among multiple inorganic and organic constituents, individual chemical parameters do not always represent the sensory perception experienced by consumers. Therefore, sensor-based approaches, particularly electronic tongues (E-tongues), have been increasingly explored as complementary tools for objective taste-related water quality assessment. An E-tongue is not a single-analyte-specific sensor, but a multisensor system composed of low-selective or partially selective sensor arrays coupled with chemometric data processing. Its analytical capability arises from cross-sensitive electrochemical response patterns that are interpreted using pattern recognition or multivariate analysis methods [5]. The E-tongue is a multichannel sensor system based on electrochemical techniques, including potentiometry, coulometry, and voltammetry [6]. In addition, other sensing principles such as amperometry and impedance spectroscopy have also been applied in electronic tongue systems, each offering distinct advantages in sensitivity, selectivity, and application scope. The system functions by sensing taste-relevant compounds through an integrated array of physical and chemical sensors, which generate electrochemical outputs. These signals are then processed using multivariate techniques, including principal component and discriminant analyses, to extract meaningful patterns from the data [7,8,9]. The E-tongue is particularly sensitive to subtle differences in taste that are often undetectable using conventional chemical analyses. Due to this sensitivity, it has been applied in various fields, including taste simulation, corrosion and wastewater monitoring, and the quality assessment of food and beverages. Previous electrochemical E-tongue studies have demonstrated its use for classification, quantification, and signal deconvolution in complex liquid matrices [10]. Recent advances have also shown that selective recognition materials, such as molecularly imprinted polymers, can still exhibit cross-responses in complex matrices and benefit from chemometric interpretation within an E-tongue framework [11]. Thus, E-tongues should be regarded as a mature electrochemical sensing strategy rather than a newly introduced sensing concept [5,11]. More recently, the technology has shown potential as a water quality monitoring tool owing to its low cost, rapid control capability, and fast analysis performance [8,12].
The use of electronic tongues for assessing taste in drinking water has been explored in numerous previous studies. Earlier research primarily focused on the classification of water types or correlation with specific chemical parameters. For example, Sipos et al. (2012) employed an electronic tongue to evaluate mineral water samples [13], while Martínez-Máñez et al. (2005) demonstrated the classification of different water sources [14]. More recently, Gutiérrez-Capitán et al. developed an electronic tongue based on electrochemical microsensors, including ISFET-based sensors, conductivity, redox potential, and amperometric electrodes, for the organoleptic analysis of drinking water. Their study demonstrated that electronic tongue responses could classify synthetic water samples according to taste/smell descriptors and could be correlated with taste-panel-based hedonic and ranking tests using PLS regression [15]. In addition, Legin et al. applied a potentiometric multisensor system to the rapid evaluation of surface and waste waters, showing that electronic tongue systems can support integral water quality and safety assessment beyond drinking water classification [16]. More recent studies have extended these approaches by integrating chemometric models to quantify ionic compositions and improve discrimination performance [17,18]. Taken together, these studies mainly reported static water classification, mineral or source water discrimination, organoleptic prediction using taste-panel data, and integral quality screening of surface or waste waters. However, they have rarely converted sensor responses into an interpretable index for tracking taste stability across sequential drinking water treatment processes and distribution networks.
To address this gap, this study proposes a Taste Index (TI) derived from multichannel E-tongue responses. The novelty of this work lies in translating multidimensional potentiometric E-tongue signals into a single reference-based index that can be used to track taste stability and detect anomalies across drinking water treatment and distribution systems. Unlike previous E-tongue studies focused mainly on static classification or organoleptic prediction, the proposed TI provides an interpretable process-monitoring metric for sequential treatment stages and distribution network samples. The TI quantifies the relative deviation of each sample from a reference water condition, thereby representing taste stability and abnormality in numerical form. This concept is inspired by operational water quality indices such as the Langelier Saturation Index (LSI) and Ryznar Stability Index (RSI), which quantify scale formation and corrosion potential, and extends the index-based framework to aesthetic water quality assessment [4].
In this study, E-tongue responses and conventional water quality parameters were analyzed across drinking water treatment stages and distribution network sampling points. The proposed TI was used to track taste-related changes during treatment, identify localized deviations in the distribution system, and evaluate its potential as a sensory-substitute indicator for operational water quality monitoring. To further examine the applicability of the method to diverse drinking water matrices, eleven commercially available bottled waters were analyzed using the same approach. By converting multidimensional E-tongue responses into a single interpretable TI, this study provides a practical framework for linking sensor-based taste assessment with operational decision-making in drinking water systems. The proposed approach can support early detection of taste-related deviations, complement conventional physicochemical monitoring, and contribute to proactive, consumer-centered drinking water management.

2. Materials and Methods

2.1. System Configuration and Sensor Calibration of the Electronic Tongue

The electronic tongue system used in this study (a-ASTREE, Alpha MOS, Toulouse, France) is equipped with an autosampler capable of analyzing up to 16 samples. It consists of seven sensors defined by Alpha MOS (AHS, PKS, CTS, NMS, CPS, ANS, and SCS), which combine chemical field-effect transistor (ChemFET) technology with potentiometric detection. The electronic tongue measures the potential differences generated by each of the seven sensors in response to the chemical characteristics of the samples. The sensing mechanism of the E-tongue is based on the generation of cross-sensitive potentiometric responses at the sensor–solution interface. When a water sample contacts the ChemFET-based sensor array, ions and taste-related chemical constituents interact with partially selective sensor surfaces or sensing membranes, producing changes in interfacial potential. These potential shifts are not interpreted as the response of a single compound-specific sensor; rather, they represent a collective electrochemical fingerprint generated by the seven sensors. In complex drinking water matrices, the measured responses can be influenced by ion activity, ionic strength, pH, adsorption/desorption at the sensing membrane, diffusion-layer effects, and mixed interactions among inorganic ions, DOM, and residual disinfectants. Therefore, the observed potentiometric shifts were interpreted as composite interfacial responses that may include quasi-Nernstian ion-activity effects, mixed-potential contributions, and coupled adsorption/desorption or diffusion-layer processes, rather than ideal Nernstian responses to individual analytes. Reference electrode and sensor drift were minimized through daily calibration, periodic blank and quality control measurements, exclusion of unstable initial readings, and averaging of the final stable responses. For future real-time applications, time-resolved correction strategies such as baseline tracking, moving-window normalization, and kinetic feature extraction should be incorporated. The resulting multidimensional response pattern is then used for multivariate statistical analysis and subsequent TI calculation to quantify deviations from the reference water condition. An electronic tongue system, including the sensor array and measurement configuration, is shown in Figure 1.
Before analysis, the E-tongue was calibrated daily using standard taste reference solutions. Each sample was measured ten times, with an approximately 2-min measurement and a 1-min rinse cycle. To minimize stabilization effects and random noise, initial readings were excluded and the final three stable responses were averaged. Measurement reliability was confirmed by maintaining the relative standard deviation (RSD) below 5% and periodically analyzing blank and quality control samples.
To assess the response characteristics of the seven sensors in the electronic tongue, reference solutions corresponding to the five fundamental taste modalities were prepared following established methodologies. Although glutamate or monosodium glutamate is the conventional umami standard in human sensory evaluation, L-arginine was used here as an amino-acid-based umami-related reference compound following established E-tongue calibration protocols [19,20]. Therefore, the L-arginine response was interpreted as a sensor response to an amino acid taste-related stimulus rather than as a direct substitute for glutamate-based human umami perception. Each substance was diluted to concentrations of 0.1, 0.5, 1, 2, 5, 10, and 20 mg/L using reagents with purity higher than 99%. Table 1 summarizes the compounds used for each taste attribute.

2.2. Sample Characterization and Analytical Methods

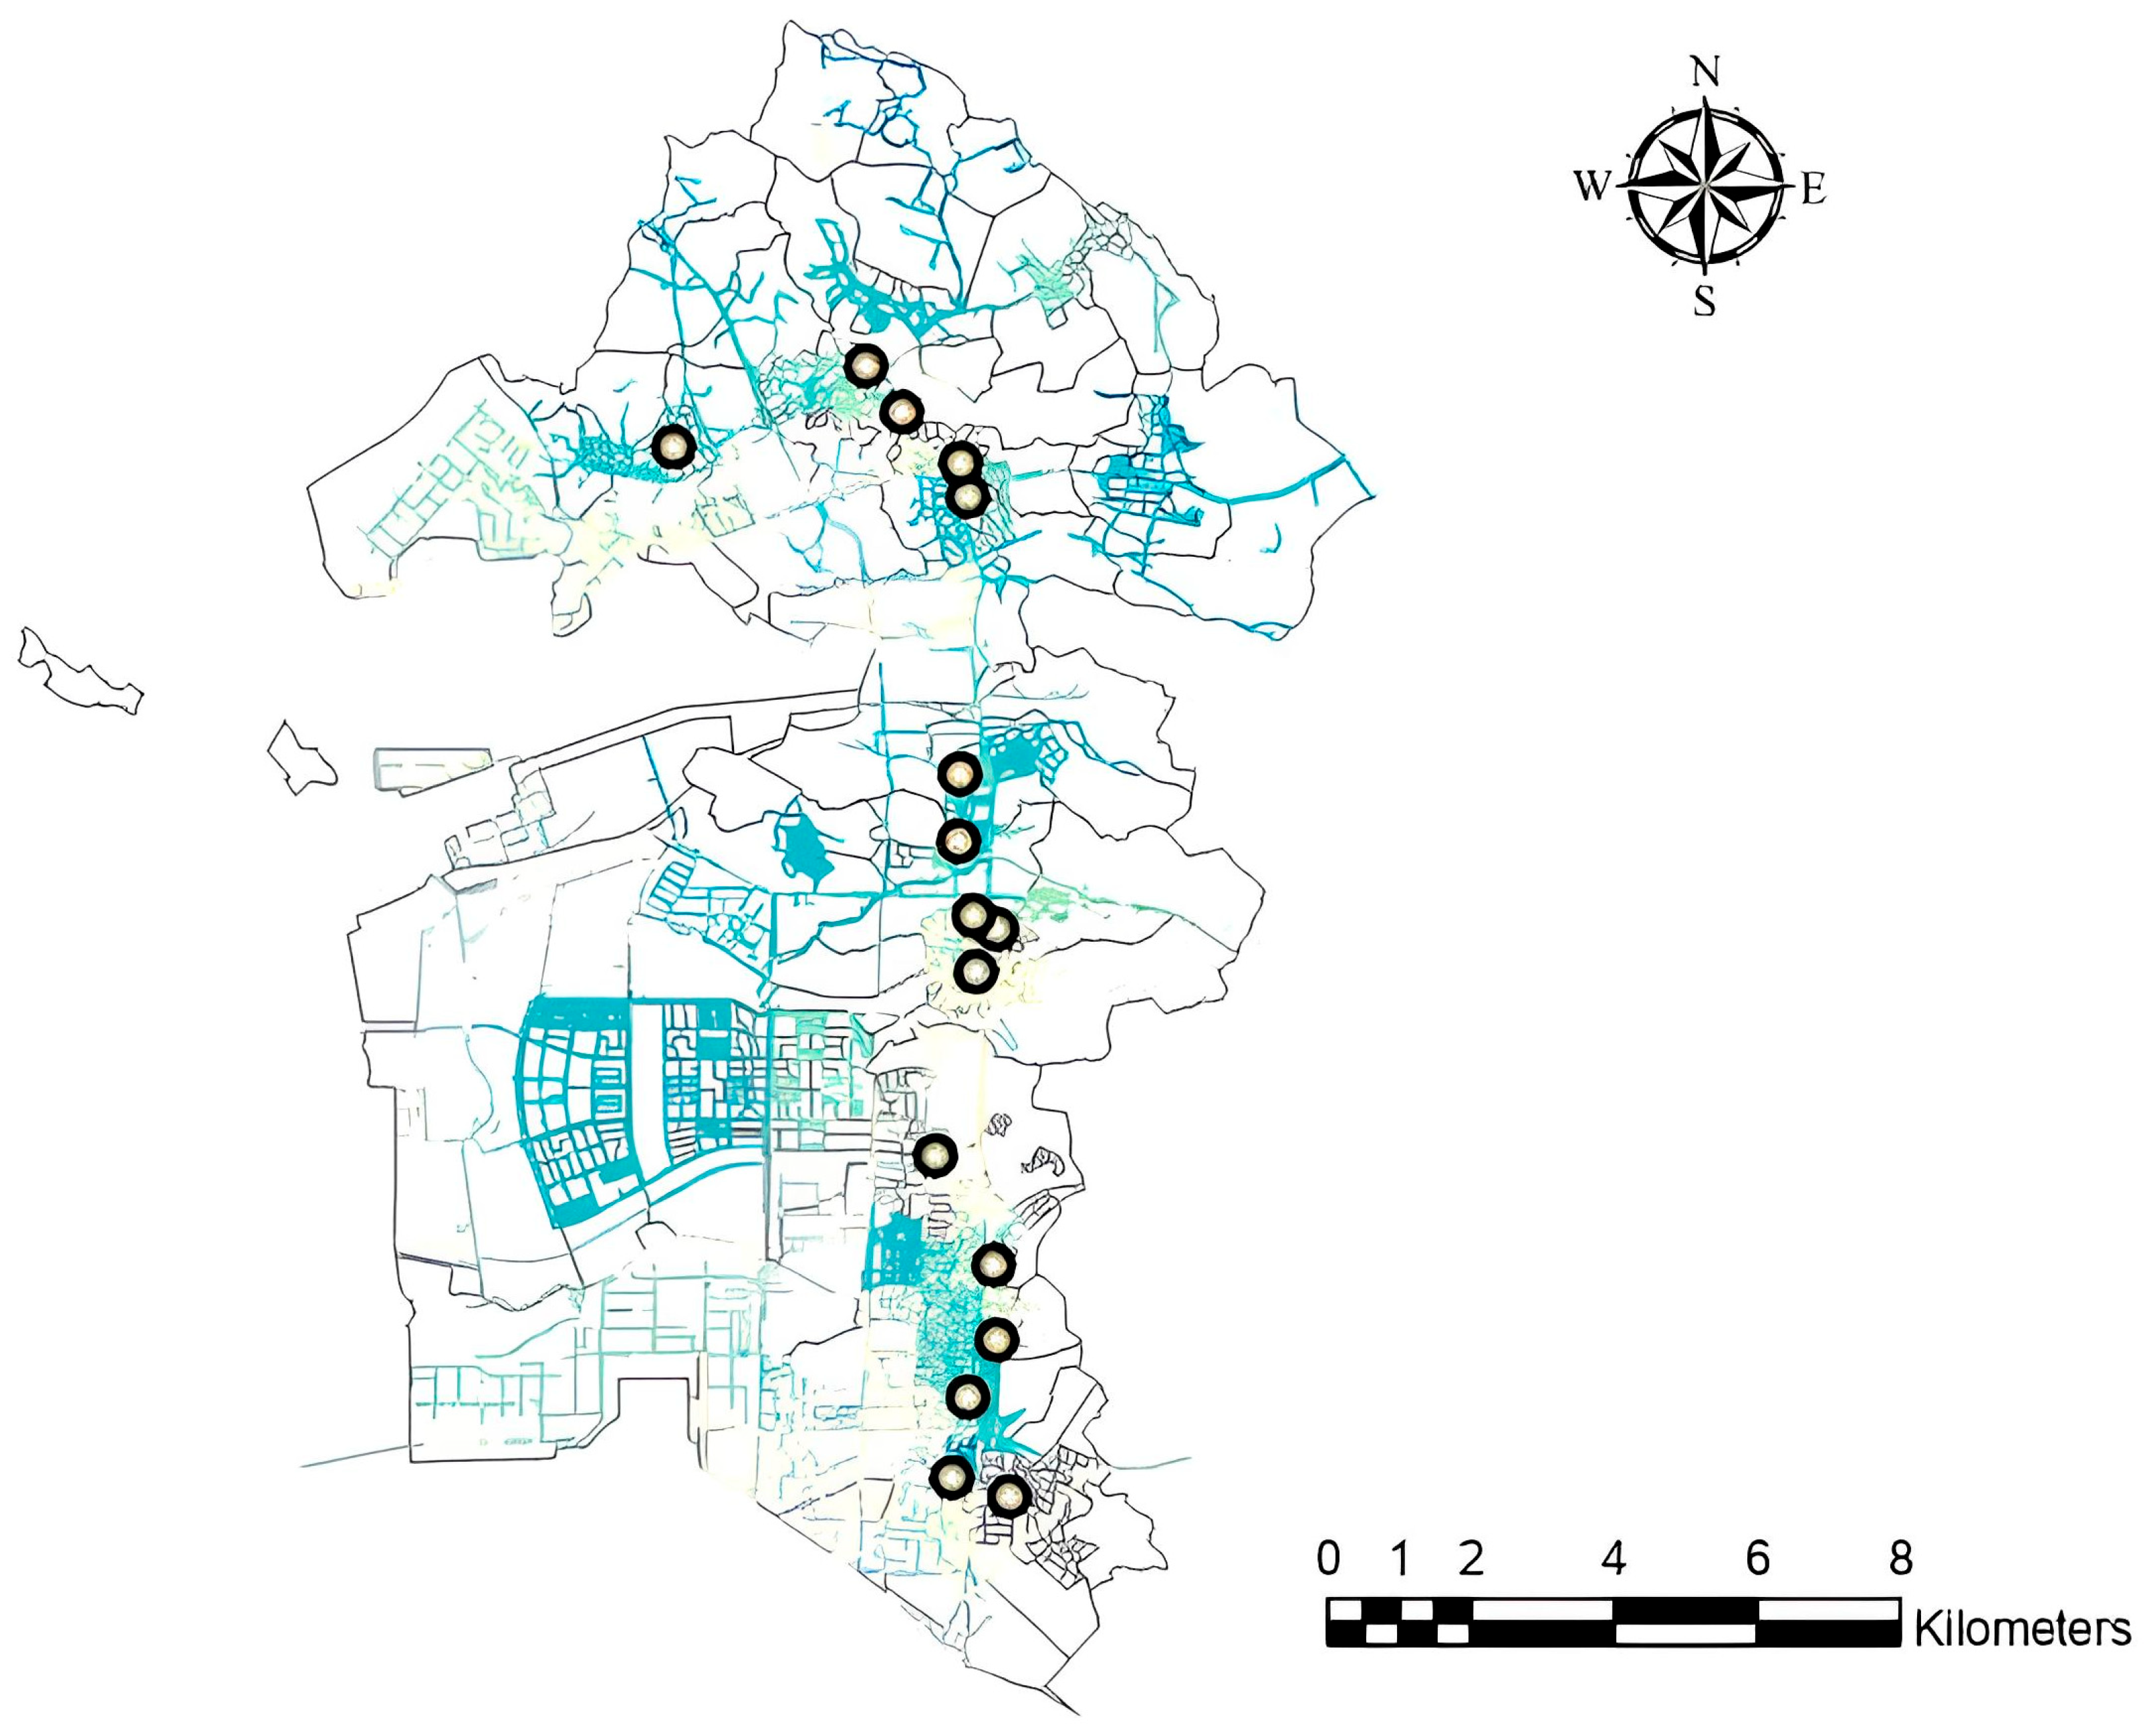
For application to real-water matrices, samples were collected from the drinking water treatment and distribution system of the G Water Treatment Plant in I City, Republic of Korea (Figure 2). Raw was collected from the source-water intake before coagulation; Floc/Sed was collected after the coagulation–sedimentation process; Filter was collected after filtration; GAC was collected after granular activated carbon treatment; O3 was collected after ozonation; BAC was collected after biologically activated carbon treatment; and Final was collected after final disinfection immediately before the treated water entered the distribution network. These samples were selected to represent the major unit processes from source water intake to finished water production. Their physicochemical characteristics were measured to support the interpretation of E-tongue responses across the sequential treatment stages.
For the distribution system, samples were collected from 16 locations, denoted as P1–P16, within I City. These P1–P16 locations are distribution-network sampling points that receive treated water from the B Water Treatment Plant (Figure 2). The distribution sampling points were selected to capture possible changes in water quality after treated water entered the supply network, including effects related to water age, residual disinfectant decay, and infrastructure-related interactions. The measured physicochemical characteristics of the treatment process samples were used to support the interpretation of E-tongue responses. Additionally, eleven commercially available drinking waters (DW1–DW11) were analyzed to examine the broader applicability of the TI to diverse drinking water matrices. The bottled water samples were used as an independent validation set to assess whether the proposed TI could differentiate drinking water matrices with different mineral compositions.
All physicochemical parameters were measured following standard analytical procedures or manufacturer-recommended protocols using calibrated instruments. Because taste-related E-tongue responses can be influenced by inorganic ions, dissolved organic matter (DOM), residual disinfectants, and turbidity, key water quality parameters were analyzed to support the interpretation of taste variation across treatment and distribution stages [21,22,23]. The measured parameters included total organic carbon (TOC), UV254, residual chlorine, pH, total dissolved solids (TDS), turbidity, major anions, and major cations. TOC was measured using a TOC analyzer (TOC-VCPH, Shimadzu, Kyoto, Japan). Residual chlorine was determined using DPD reagent with a UV-vis spectrophotometer (DR5000, HACH, Loveland, CO, USA), which was also used for UV254 analysis. pH and TDS were measured using a pH/TDS meter (ORION STAR A221, Thermo Scientific, Waltham, MA, USA), and turbidity was measured using a turbidimeter (2100N, HACH, Loveland, CO, USA). Anions (F, Cl, Br, NO3-N, SO42−) and cations (Na+, K+, Mg2+, Ca2+) were quantified using ion chromatography (ICS-3000, Thermo Scientific, Waltham, MA, USA).

2.3. Normalization and Multivariate Statistical Analysis

The data-analysis pipeline consisted of raw signal acquisition, preprocessing, feature extraction, feature selection, and model input construction. Raw time-dependent potentiometric responses from the seven E-tongue sensors were first recorded during each measurement. Unstable initial readings were excluded, and the final three stable responses were averaged as steady-state features. These seven steady-state sensor responses were then normalized and used as the final input matrix for the subsequent multivariate analyses and TI calculation. Feature selection and interpretation were performed using VIP scores and Pearson correlation analysis. Although this study used steady-state outputs, future work should incorporate transient features, such as response slope, stabilization time, and drift rate, to better link electrochemical response kinetics with steady-state taste-index outputs [24].
Principal component analysis (PCA) was employed as the primary multivariate technique to reduce data dimensionality while preserving the essential structure of the dataset. PCA transforms correlated sensor responses into a set of uncorrelated variables, or principal components (PCs), ordered by the proportion of total variance they explain. This projection into a lower-dimensional space facilitates the identification of dominant patterns and visual differentiation of sample groups. While nonlinear dimensionality reduction techniques, such as kernel PCA (KPCA) and kernel entropy component analysis (KECA), have gained attention for capturing complex nonlinearities, PCA was selected for this study due to its superior robustness, interpretability, and suitability for the structured sensor datasets typical of E-tongue applications [25]. However, PCA was used primarily for visualization and initial clustering rather than complete deconvolution of overlapping ionic responses. Therefore, VIP analysis and Pearson correlation analysis were additionally applied to support the interpretation of interfering sensor responses in mixed water matrices.
Furthermore, PCA provides a direct linkage between original sensor responses and the derived components, which is critical for practical process monitoring. To evaluate sensor sensitivity and classification performance, partial least squares discriminant analysis (PLS-DA) was applied. This supervised method integrates the dimensionality reduction in PLS with the discriminatory power of linear discriminant analysis (LDA). Sensor-specific contributions were quantified using Variable Importance in Projection (VIP) scores, where a value exceeding 1.0 indicates a significant contribution to sample discrimination [26]. This VIP-based approach effectively identifies the key sensors driving taste differentiation, thereby enhancing the interpretability of the classification outcomes [27,28].
The Pearson correlation coefficient (r) was used to quantify the strength and direction of linear associations between sensor responses and water quality parameters. An r value of 1 denotes a perfect positive correlation, 0 indicates no linear relationship, and −1 represents a perfect negative correlation [29]. In this study, r values were calculated between each sensor and water quality variable to eliminate redundancy among sensors with similar response characteristics, thereby improving analytical efficiency. In general, ∣r∣ ≥ 0.5 is considered to reflect a moderate or stronger interpretable correlation [29]. When combined with VIP scores, r values help to identify variables that significantly contribute to sample classification and taste differentiation driven by water quality [30].
To further distinguish taste profiles across different treatment stages, hierarchical cluster analysis (HCA) was conducted as a complementary tool to PCA. HCA reveals latent clustering structures and potential outliers by providing hierarchical relationships among samples that may not be fully captured in two-dimensional PCA score plots [31]. In this study, Ward’s linkage method based on Euclidean distance was employed to minimize within-cluster variance. The distance calculation was performed using the scores of the first two principal components (PC1 and PC2) according to Equation (1) [32].
d p , q = ( q 1 p 1 ) 2 + ( q 2 p 2 ) 2 + + ( q n p n ) 2 = i = 1 n ( q i p i ) 2
q i , p i represent the principal component scores (e.g., PC1, PC2, etc.) of the two samples being compared, and n denotes the number of principal components considered.

2.4. Method for Calculating the Taste Index Score

The TI is a metric designed to quantify taste deviations from a reference water quality using multidimensional sensor response data [33]. Its formulation was inspired by principles of multivariate outlier detection and quality index assessment frameworks [34,35]. Existing indices, such as the Water Stability Index (WSI), which integrate physical and chemical parameters for comprehensive water quality evaluation, also informed the development of the TI [36].
The TI was calculated as the Euclidean distance between the normalized sensor response vector of each sample and that of the reference sample (Equation (2)). A lower TI indicates greater similarity to the reference taste profile, whereas a higher TI indicates a larger deviation [37]. In this study, final treated water was used as the reference condition (TI = 0), and TI > 0.4 was used as a site-specific operational threshold based on the observed TI distribution and recorded aesthetic quality concerns.
E d = i = 1 k ( x i y i ) 2
In Equation (2), x i represents the ith sensor response value of the sample under evaluation, while y i denotes the corresponding sensor response value of the reference sample and k is the number of E-tongue sensors.

3. Results

3.1. Sensor Sensitivity Evaluation for Basic Taste Substances

To evaluate the taste sensitivity and classification performance of electronic tongue sensors, five basic taste substances were prepared at concentrations of 0.1, 0.5, 1, 2, 5, 10, and 20 mg/L. These included citric acid (sour), sodium chloride (salty), glucose (sweet), caffeine (bitter), and L-arginine (umami). The objective was to assess sensor responses to different taste stimuli and to identify sensors that respond selectively to specific taste modalities. All measurements were performed in repeated trials, and the reported results represent averaged values from stable sensor responses to ensure reproducibility. The sensor data were analyzed using multivariate techniques, including PCA, PLS-DA, and LDA, to evaluate the discriminative capacity of the system and quantify the contribution of each sensor (Table 2) [19,20].
For sourness, the E-tongue clearly discriminated citric acid across the full concentration range of 0.1–20 mg/L, with PC1 explaining 94.59% of the variance and the main responsive sensors identified as CTS, NMS, CPS, and SCS, reflecting a strong potentiometric response to hydrogen ion activity (H+) [38]. For saltiness, NaCl was distinguishable above 2 mg/L, with CTS, NMS, CPS, and SCS again exceeding the VIP threshold and the LDA model showing high classification performance. For sweetness, glucose was discriminated only at higher concentrations, mainly through AHS, PKS, and CPS, suggesting weaker potentiometric interactions between non-ionic organic compounds and the sensor surfaces. For bitterness, caffeine was clearly identified only at 10–20 mg/L, with AHS and PKS showing dominant contributions. Lastly, L-arginine was consistently distinguishable across 0.1–20 mg/L, primarily through AHS, NMS, and SCS responses. Overall, these results indicate that the E-tongue system exhibits differential sensitivity across taste modalities, with stronger responses to ionic or charged compounds than to neutral organic compounds, providing a baseline for interpreting sensor signals in complex real-water matrices [39]. The five taste reference substances were used to characterize the baseline responsiveness of the E-tongue sensors under controlled conditions. In real drinking water matrices, however, sensor responses reflect integrated electrochemical patterns influenced by background ions, DOM, residual disinfectants, and overall matrix composition. Therefore, the responses observed in treatment and distribution samples were interpreted as sensor-inferred taste-related patterns rather than direct representations of specific human-perceived taste modalities.

3.2. PCA Results

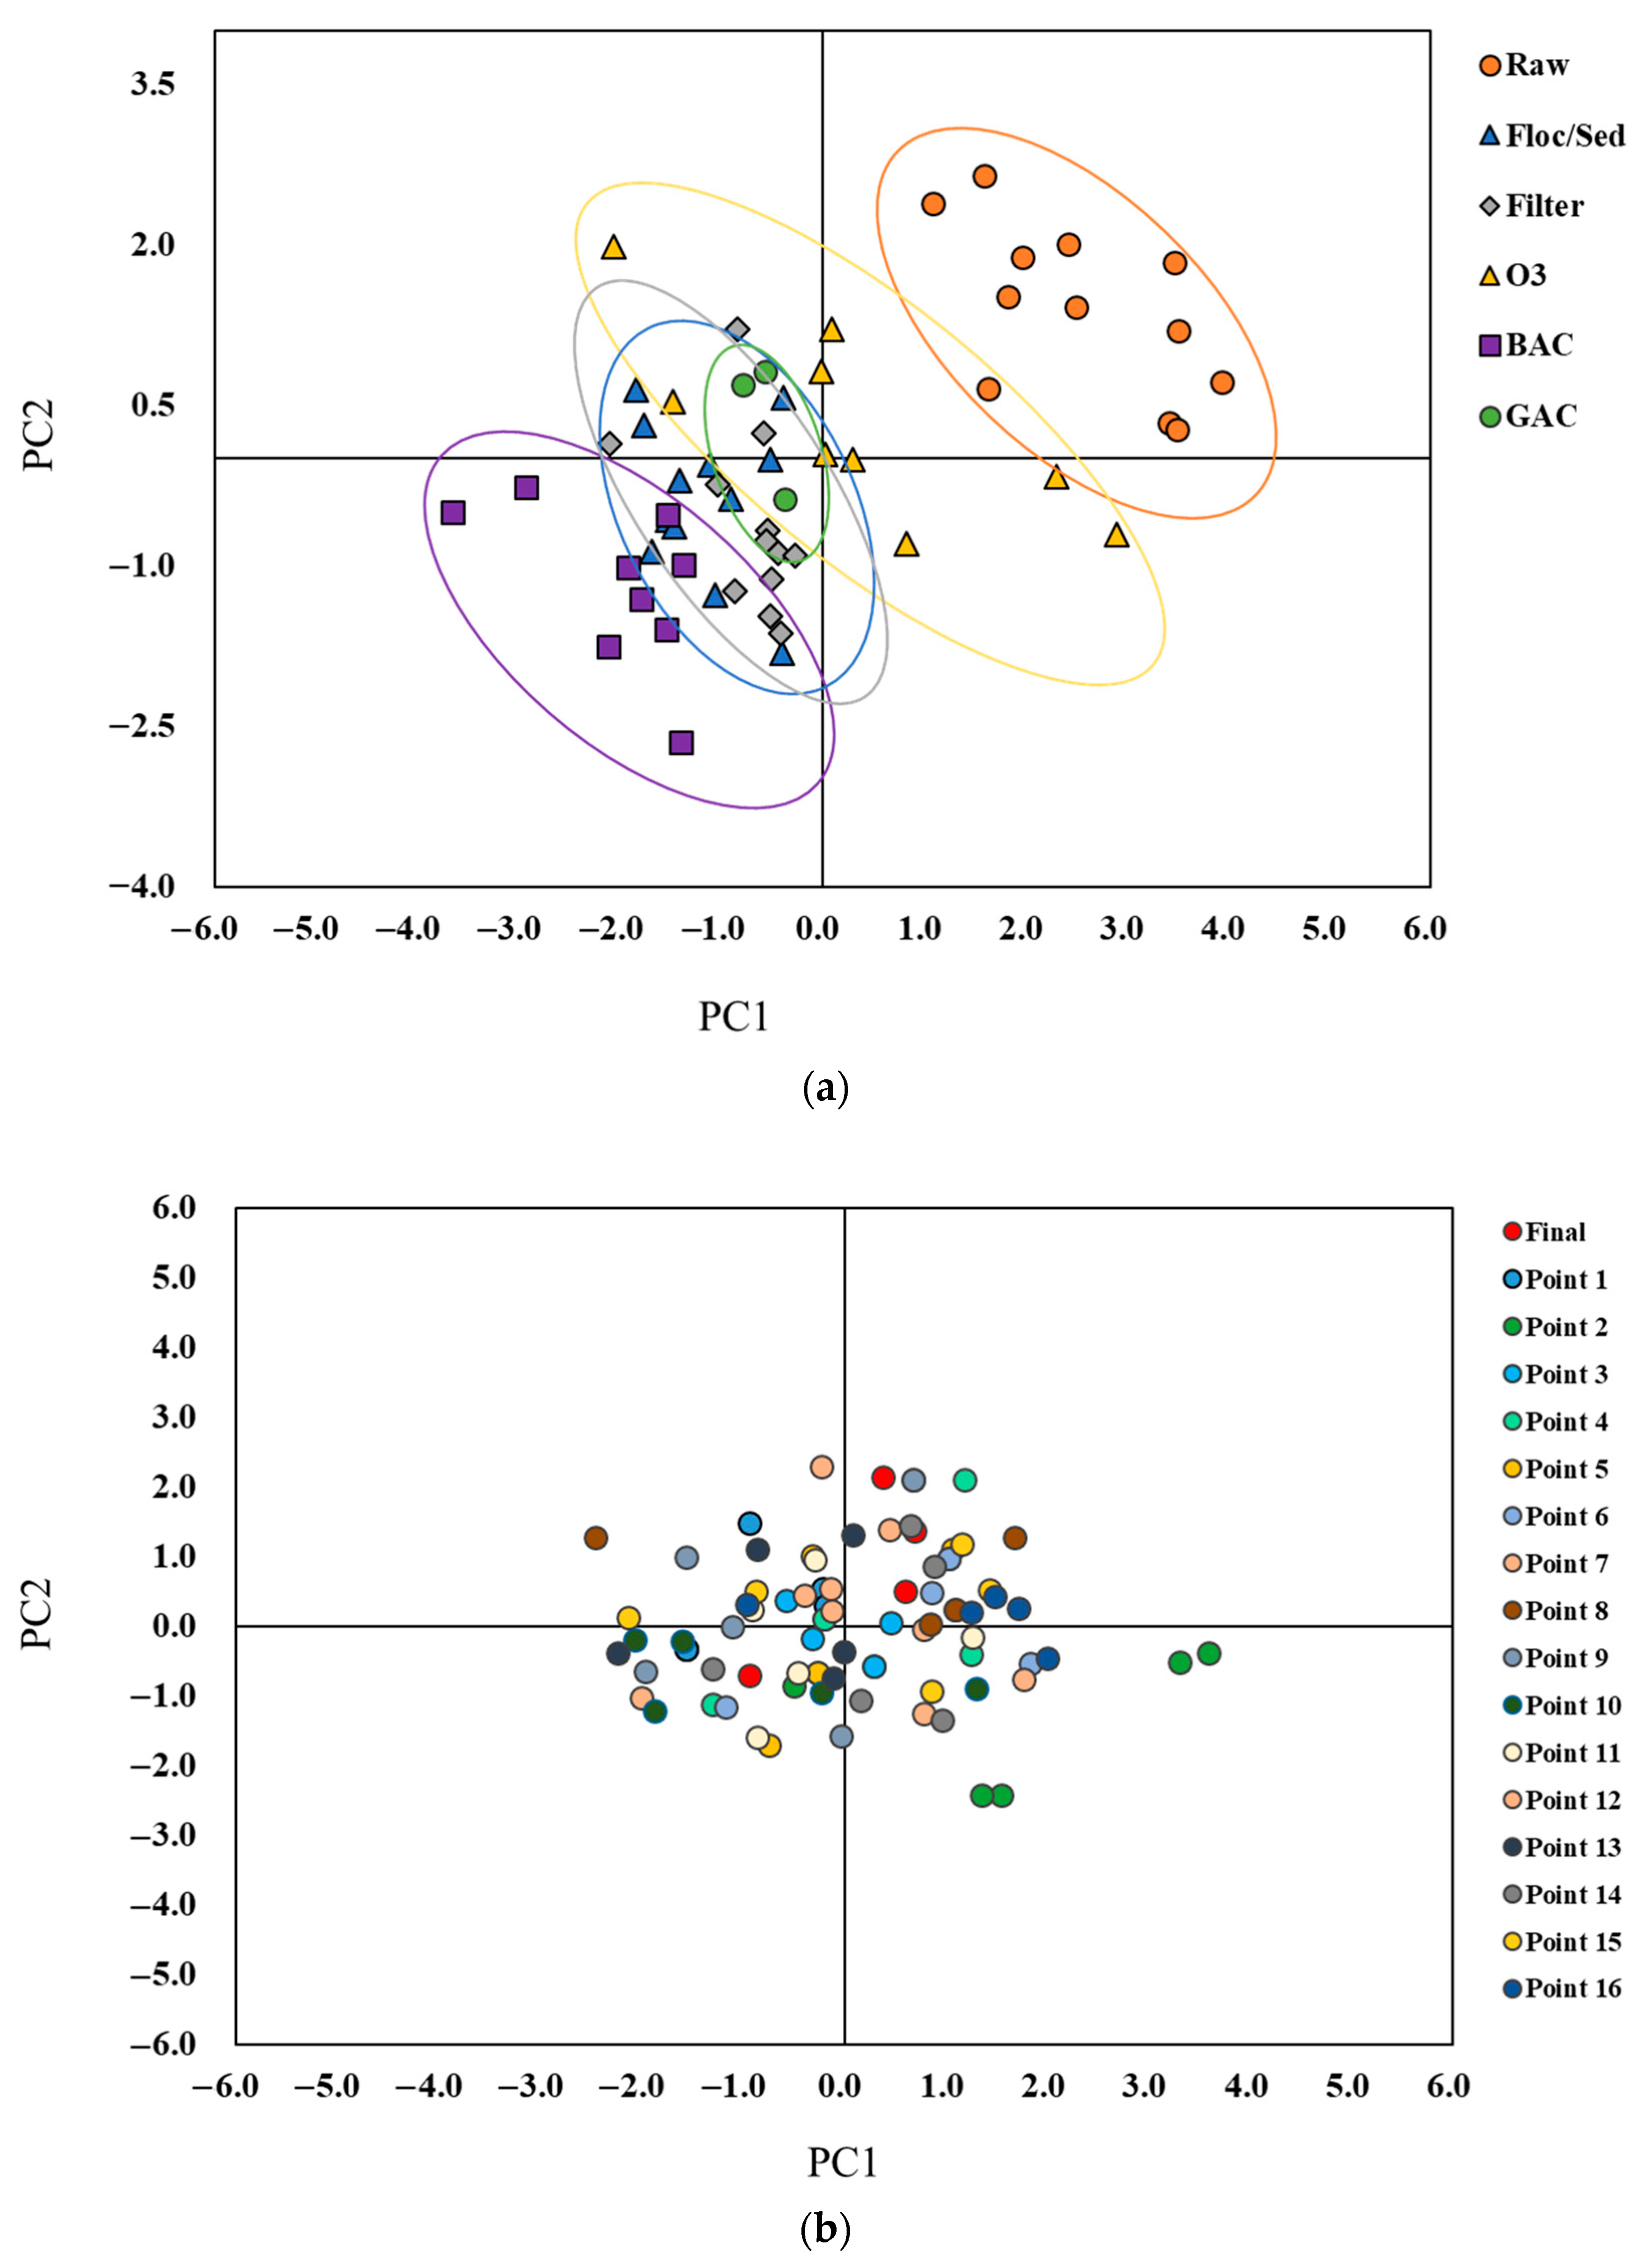
The use of electronic tongue techniques enables rapid and objective visualization of taste-related differences in drinking water through pattern recognition analysis. In this study, PCA was performed using the normalized E-tongue sensor response matrix, not the physicochemical parameters listed in Table 3. The PCA included 23 real-water samples, consisting of seven treatment process samples (Raw, Floc/Sed, Filter, GAC, O3, BAC, and Final) and 16 distribution network samples (P1–P16). The physicochemical characteristics of these samples are presented in Table 3. The purpose of this analysis was to compare taste-related sensor response patterns across treatment stages and distribution network locations (Figure 3).
Figure 3a presents the PCA biplot for the seven treatment process samples, explicitly labeled as Raw, Floc/Sed, Filter, GAC, O3, BAC, and Final. PC1 and PC2 explained 58.2% and 20.3% of the total variance, respectively. Samples from each treatment stage formed distinct clusters, indicating systematic changes in taste-related characteristics during treatment. The gradual shift from Raw to the activated carbon stages suggests the progressive removal or transformation of taste-related compounds, including DOM and inorganic ions [40]. In particular, the O3 sample showed a temporary shift in PCA position, likely due to DOM oxidation and the formation of low-molecular-weight byproducts such as aldehydes, ketones, and carboxylic acids. After BAC treatment, the samples moved closer to the Final cluster, indicating the removal or biodegradation of these oxidation byproducts and the stabilization of taste-related water quality [41].
Figure 3b presents the PCA results for the 16 distribution network samples (P1–P16), which are the same distribution samples listed in Table 3. These samples were collected after final treatment from spatial points in the distribution network and do not represent additional treatment-stage samples. Most distribution samples clustered near the Final sample, indicating relatively stable taste-related characteristics throughout the network. In contrast, P2, P8, P9, P12, and P16 were separated from the Final cluster, suggesting localized taste-related deviations. These deviations may be associated with distribution system factors such as hydraulic residence time, residual chlorine decay, pipe material interactions, or biofilm activity. Overall, the PCA results indicate that E-tongue measurements can evaluate taste-related consistency in the distribution system and identify localized deviations that may not be readily captured by conventional physicochemical monitoring.

3.3. Multivariate Evaluation of Taste Characteristics in Water Samples from Different Treatment Stages

Following the PCA-based taste profiling, the relationship between E-tongue sensor responses and water quality parameters was analyzed to identify key factors contributing to taste-related variations. The multivariate analysis was based on the normalized seven-sensor E-tongue response matrix obtained from the treatment process and distribution network samples listed in Table 3. Raw time-dependent sensor signals were preprocessed by excluding unstable initial readings, and the final three stable responses were averaged and normalized as steady-state features, as described in Section 2.3. These normalized steady-state sensor responses were used as input data for PLS-DA-based VIP analysis. The analysis employed variable importance in projection (VIP) values derived from PLS-DA and Pearson correlation coefficients (r). The measured physicochemical parameters listed in Table 3 were then used to interpret the E-tongue responses through Pearson correlation analysis, rather than as direct input variables for PCA. The physicochemical characteristics of samples are summarized in Table 3, providing a basis for interpreting sensor response variations. Sensors with VIP ≥ 1.0 were considered major contributors to sample differentiation, while Pearson correlation analysis was used to identify water quality parameters associated with these sensor responses.
As shown in Table 4, analysis of VIP values greater than or equal to 1 for each treatment stage identified key contributing sensors. At the Raw stage, PKS (1.35), NMS (1.32), and CPS (1.32) exhibited the highest responses. These sensors are considered sensitive to salty, umami, and sour tastes, respectively, suggesting that the raw water may possess complex taste characteristics due to the presence of diverse ions and organic substances. The same combination of sensors (PKS, NMS, CPS) remained dominant during the Floc/Sed and Filter stages, indicating that mineral-related taste components and precursor organic matter persisted throughout the pretreatment process. In the GAC stage, the same sensors continued to show responsiveness, although the VIP values slightly decreased to PKS (1.28), NMS (1.27), and CPS (1.26), implying the partial removal of adsorbable organic and ionic constituents.
At the O3 stage, sensor response variability increased markedly, ranging from 0.06 to 1.26, likely due to the oxidative transformation of DOM into diverse byproducts. This variability decreased after BAC treatment, indicating more uniform sensor responses as biodegradable oxidation products were removed. However, variability increased again in the Final stage, ranging from 0.36 to 1.40, possibly due to residual disinfectants and pH adjustment during post-treatment. Notably, AHS (1.38) and SCS (1.32) showed increased responses, suggesting a perceptible shift in taste-related characteristics after disinfection [33]. These results indicate that E-tongue profiling can track changes in taste-related sensor patterns across sequential treatment stages.
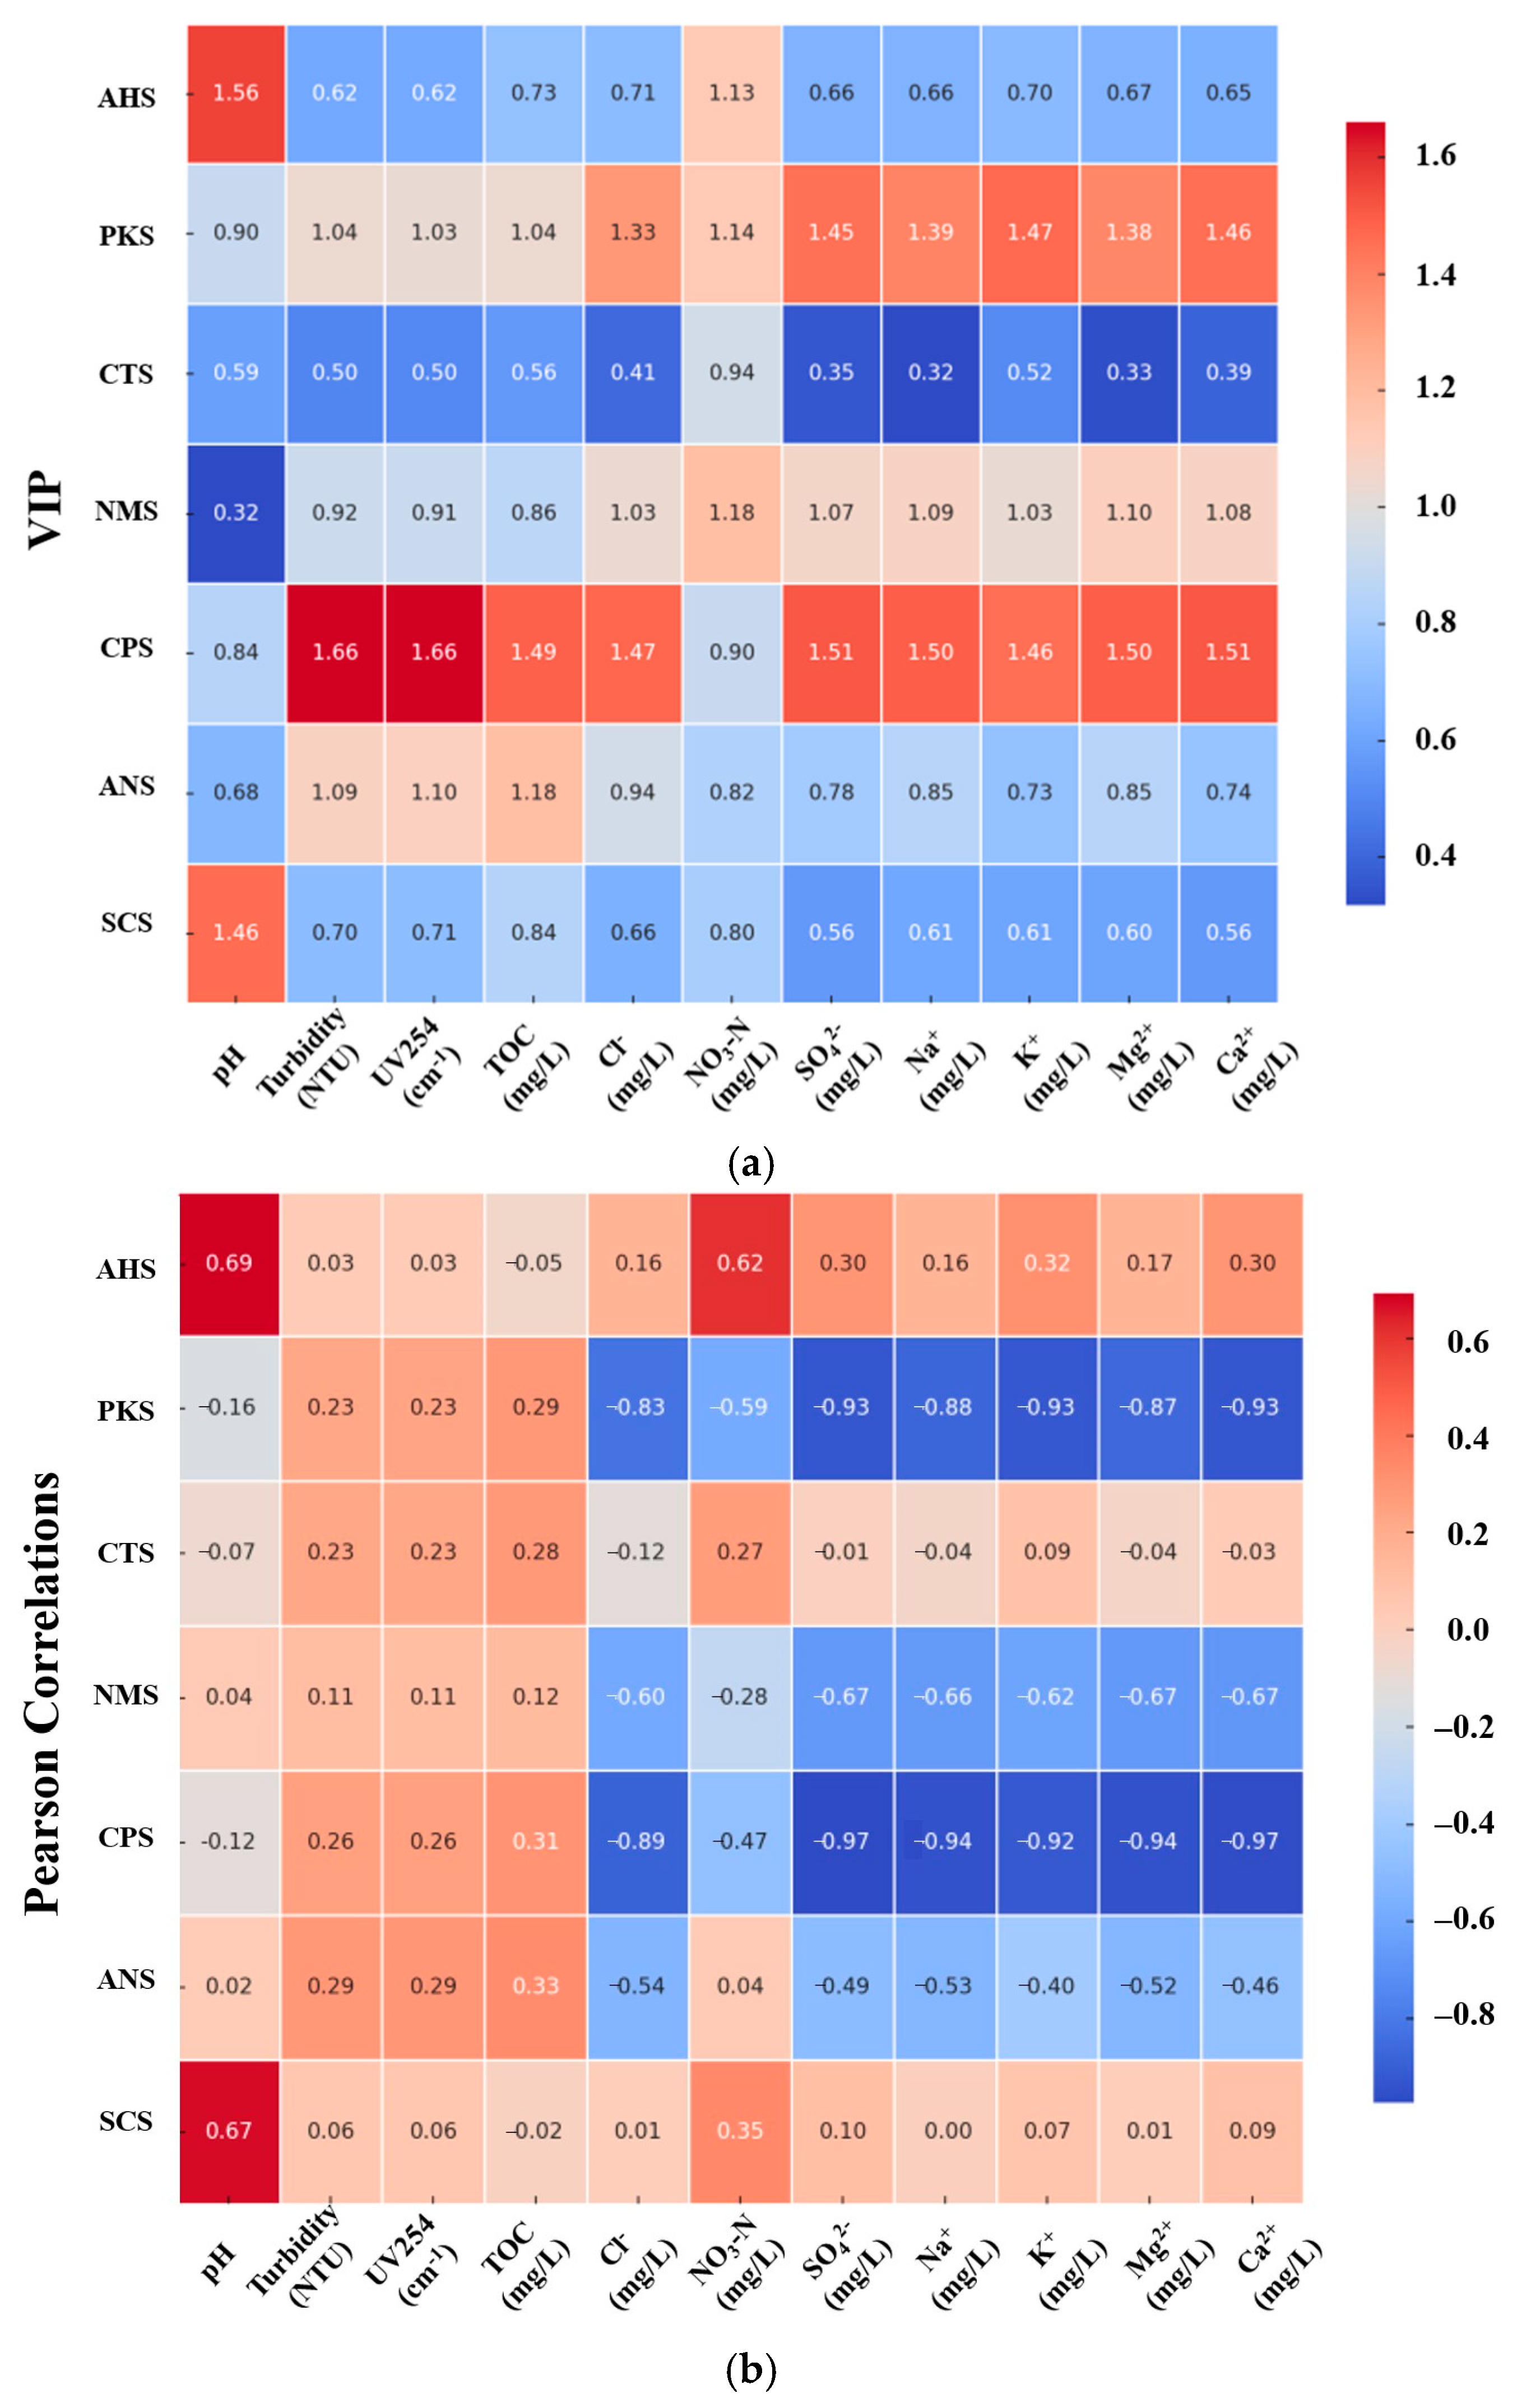
To further interpret the relationships between sensors and water quality parameters, Pearson correlation analysis was conducted, and the combined VIP and correlation results were visualized as heatmaps in Figure 4 [42]. Sensors with VIP ≥ 1.0 and |r| ≥ 0.5 were regarded as key contributors, and the integrated results are summarized in Table 5. In Table 5, the VIP score represents the maximum sensor-wise contribution identified from the PLS-DA-based analysis, whereas the Pearson correlation coefficients indicate associations between each sensor response and the measured physicochemical parameters. AHS was associated with alkalinity and pH, indicating sensitivity to acid–base-related taste modulation [43]. PKS and CPS showed strong relationships with sulfate, suggesting sensitivity to mineral-related bitterness. In contrast, CTS showed limited contribution, with a relatively low VIP of 0.94 and a weak correlation with NO3-N (r = 0.27) [44]. NMS exhibited strong correlations with multiple ionic species, including Cl, SO42−, Na+, K+, Mg2+, and Ca2+, indicating sensitivity to ionic balance and hardness. ANS was associated with organic matter-related astringency [45], while the SCS sensor showed broad sensitivity to pH-related taste variations [43]. Overall, the combined VIP and Pearson correlation analysis indicates that drinking water taste characteristics are governed by both inorganic ions and organic matter and that the E-tongue system can effectively capture these interactions through sensor response patterns [18].

3.4. Taste Profile Monitoring Across Treatment Stages and Distribution Using TI Score

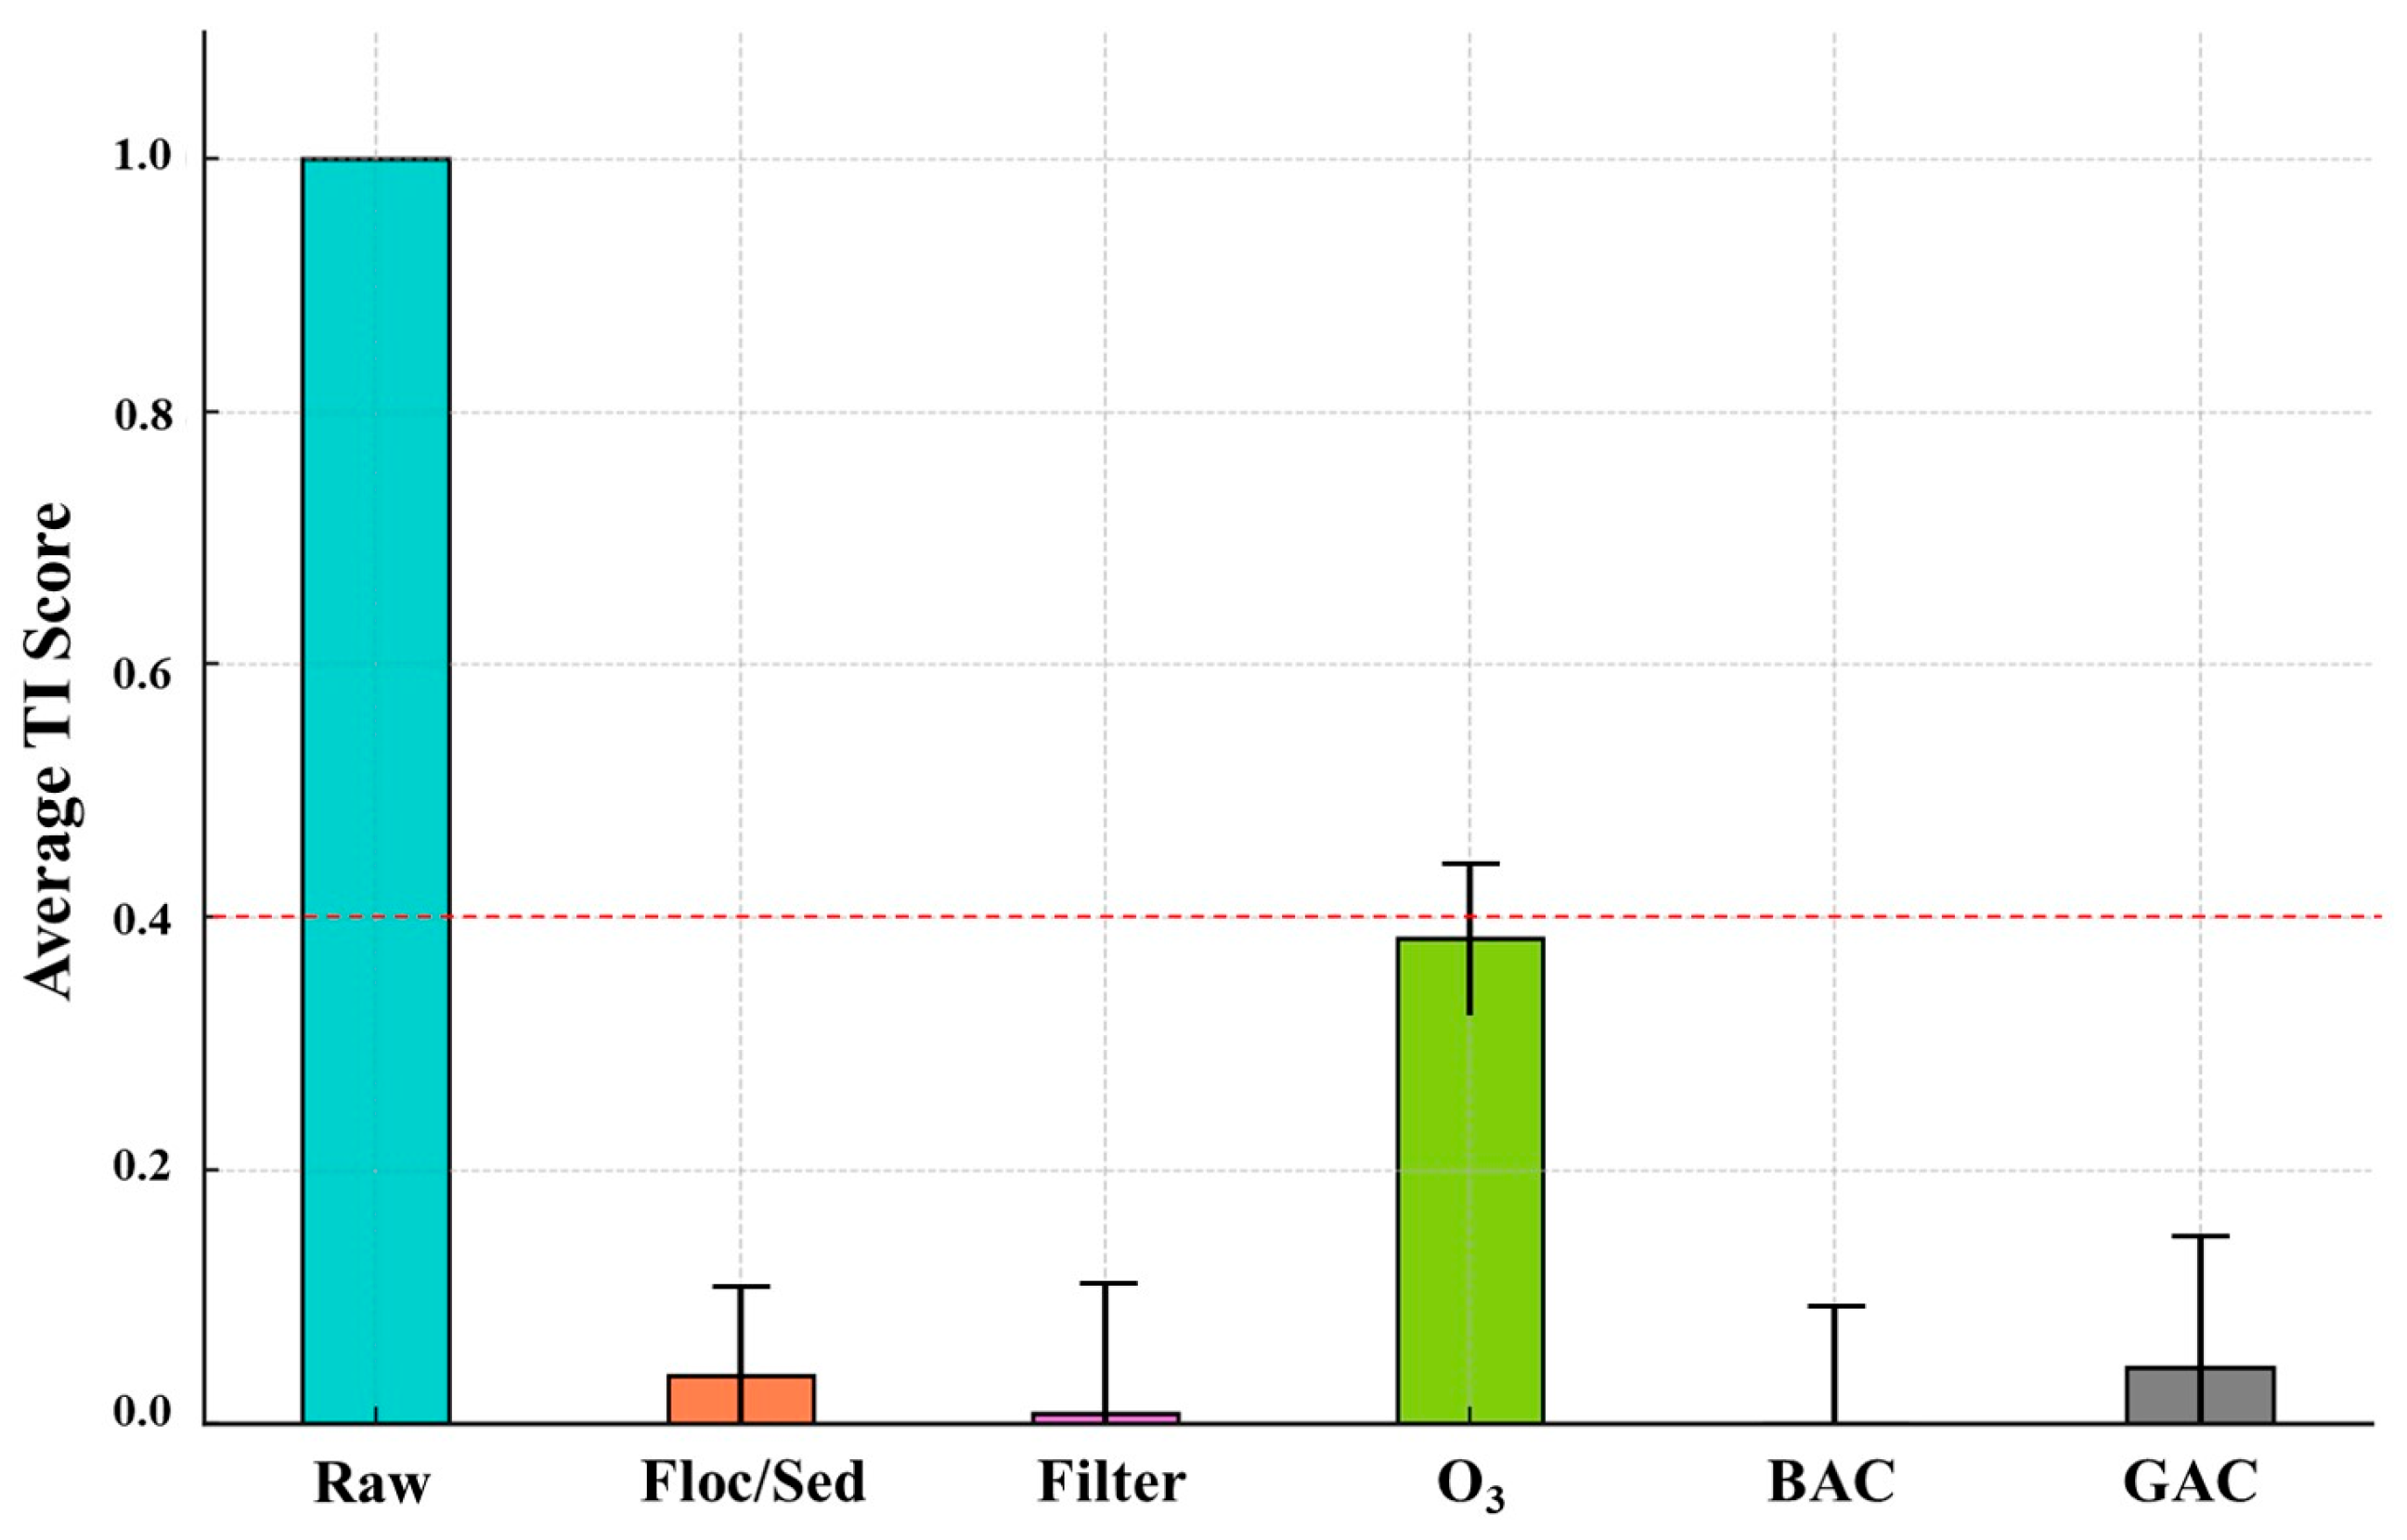
In this study, the TI was calculated as the Euclidean distance between each multidimensional E-tongue sensor response vector and a predefined reference (Figure 5). A higher TI indicates a greater deviation from the reference taste-related profile. Euclidean distance was selected because it provides a simple and interpretable measure of overall dissimilarity across the seven sensor responses. The Final sample was defined as the reference condition (TI = 0) for evaluating treatment-stage changes and distribution-network consistency. By converting complex sensor patterns into a single numerical index, the TI enables objective comparison of aesthetic water quality and identification of localized deviations from the plant effluent.
The TI of the influent Raw water was 1.00, representing the maximum deviation from the reference taste profile. Following the Floc/Sed process, the TI decreased substantially, suggesting the successful removal of a significant portion of particulates and taste-inducing substances. The filtration stage achieved a further reduction in TI, indicating the additional elimination of compounds associated with taste. In contrast, the TI score increased temporarily to 0.38 after O3 treatment. This shift is attributed to the oxidative transformation of DOM into low-molecular-weight byproducts, such as aldehydes and ketones, which are known to influence sensory characteristics. Subsequently, during the GAC and BAC stages, TI scores remained low and stable, highlighting the role of activated carbon and biological activity in removing these oxidation byproducts and stabilizing the final taste quality. Quantitatively, a lower TI value signifies a shorter Euclidean distance from the reference (Final), confirming that the treatment process effectively moves the water toward a more stable and desirable taste profile.
While most stages showed a downward trend, the temporary increase after O3 treatment serves as a critical indicator of process-induced taste transformations. This finding demonstrates that the TI can function as an early detection tool for oxidation-related anomalies, enabling operators to monitor and respond to subtle shifts in aesthetic water quality that might otherwise be overlooked by conventional parameters.
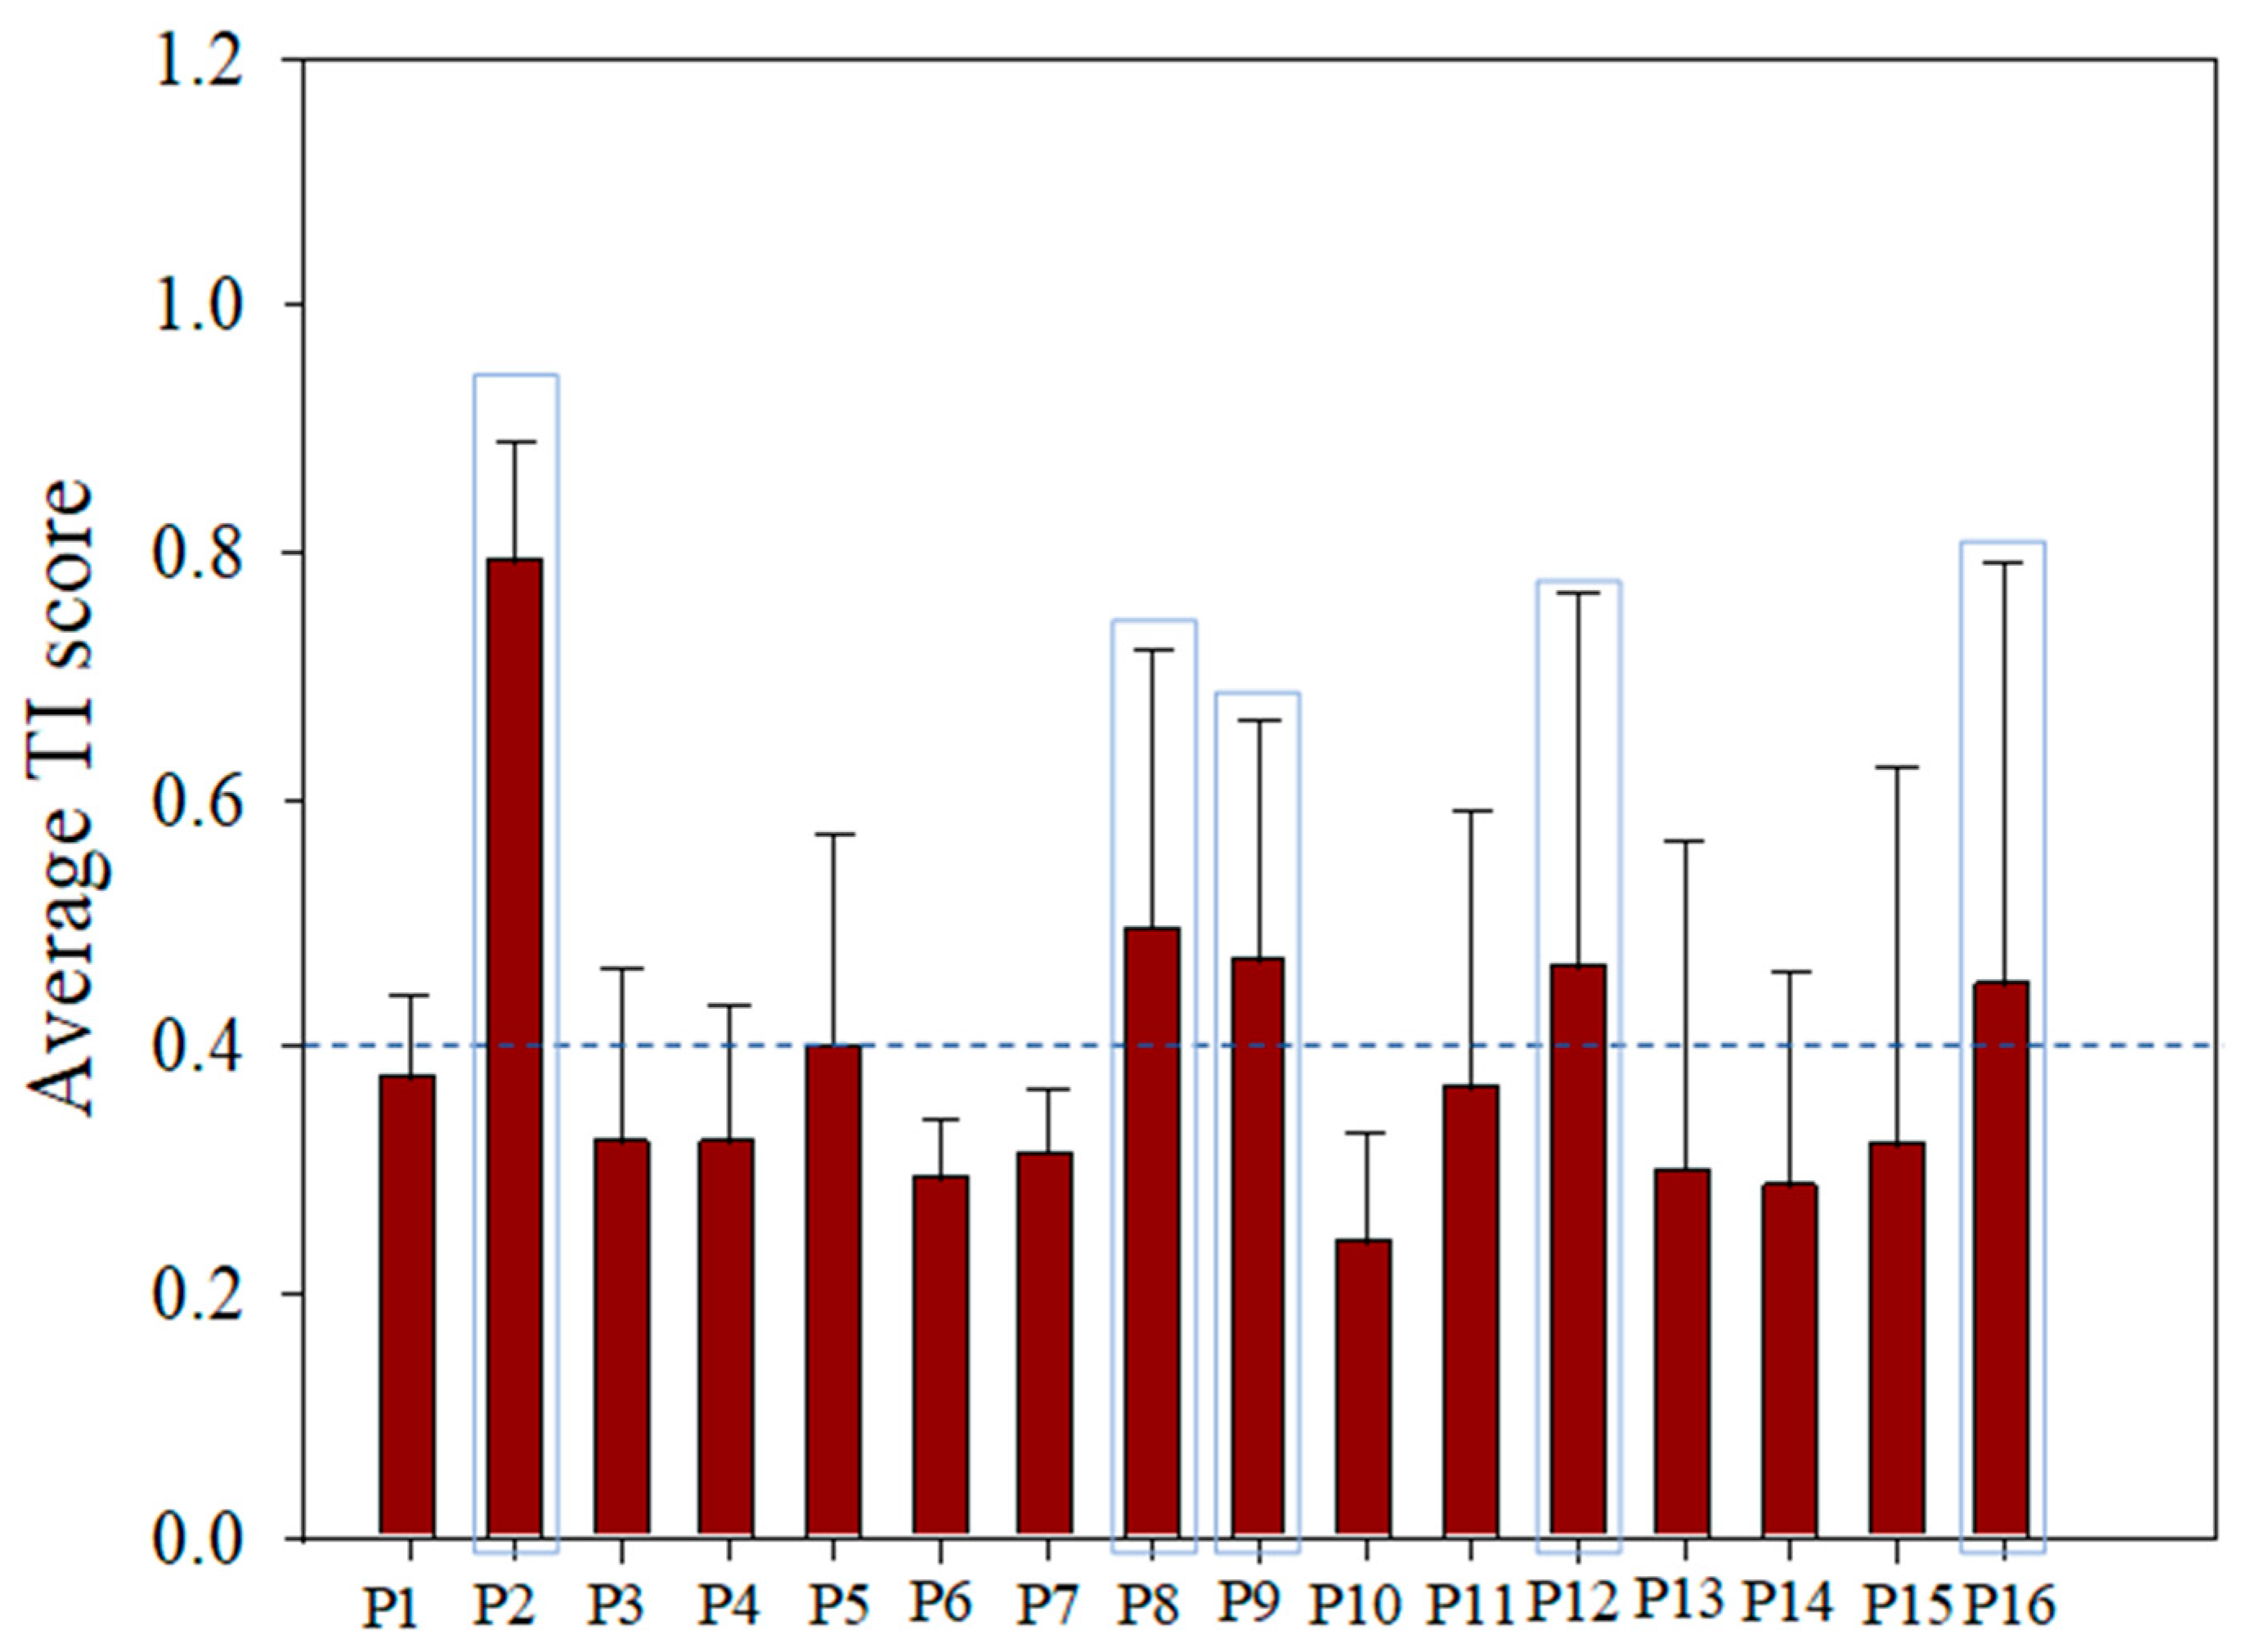
Figure 6 shows the TI scores across the distribution network. Locations with TI > 0.4 were spatially separated from the main cluster, indicating localized taste-related deviations. The TI > 0.4 criterion was used as a site-specific operational threshold rather than a universal abnormality standard. This threshold was empirically determined from the distribution of TI values, PCA-based separation patterns, and consistency with previously reported aesthetic issue-prone areas in the same distribution network. The high-TI locations (P2, P8, P9, P12, and P16) corresponded to issue-prone areas previously reported by Nam et al. (2024), where elevated Taste Index and Tryptophan-like Fluorescence Index values were associated with pipe aging, tank-based water supply, and reduced residual chlorine [33]. Here, issue-prone areas refer to locations with previously documented aesthetic water quality concern indicators in the distribution network. Although the TI is calculated from E-tongue sensor responses rather than directly from chemical concentrations, these high-TI locations may be partly linked to physicochemical changes such as residual chlorine decay, ionic balance shifts, DOM-related variation, and infrastructure-derived water quality changes. These results support the use of TI as a site-specific indicator for detecting localized aesthetic water quality variations in distribution systems.

3.5. Assessment of the Generalizability of the Taste Index Using Commercial Bottled Waters

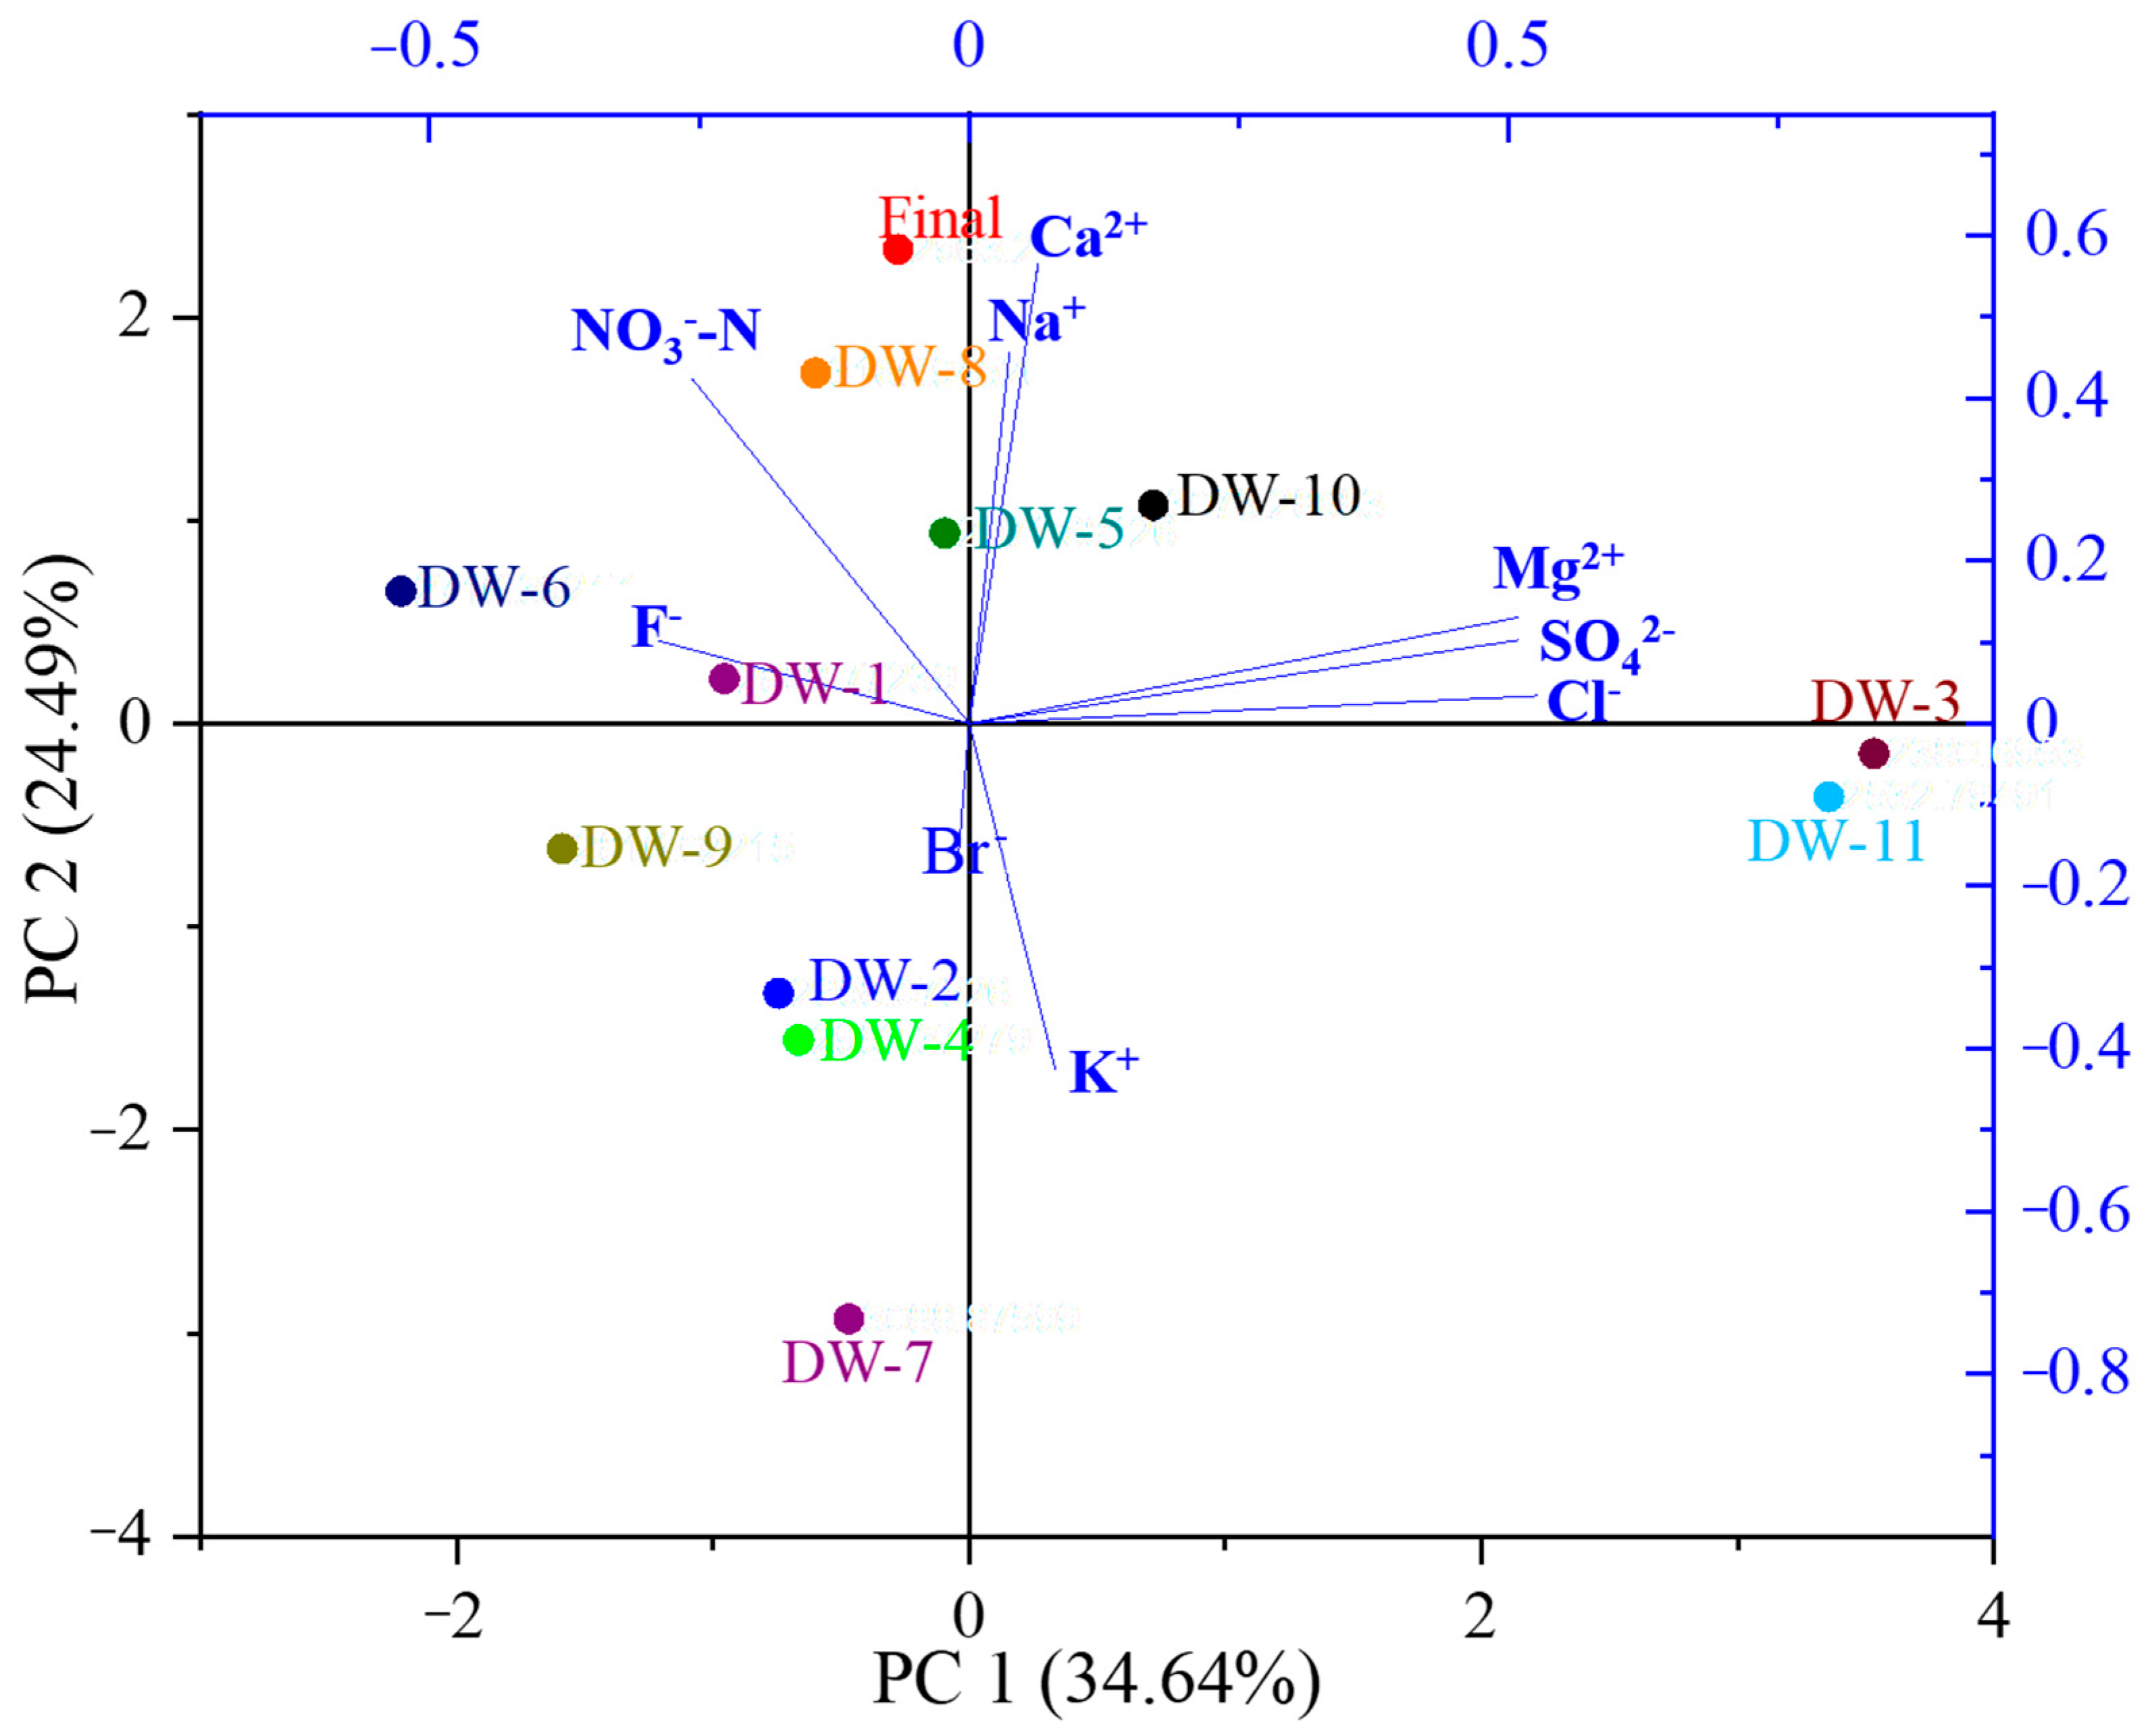
To assess the broader applicability of the proposed TI, 11 commercially available bottled water samples were analyzed and compared with the Final sample. The physicochemical characteristics of the bottled waters are summarized in Table 6 and were used to interpret variations in E-tongue responses and taste-related profiles. Figure 7 presents the PCA biplot generated from the standardized physicochemical parameters listed in Table 6. In Figure 7, the labeled points represent the PCA score positions of the bottled water samples and the Final reference, whereas the blue arrows represent loading vectors of the physicochemical variables on PC1 and PC2. Therefore, the concentration values discussed below are based on Table 6, while Figure 7 visualizes the overall relationships among bottled water samples and physicochemical variables.
As shown in Table 6, DW3 and DW11 showed elevated Mg2+ (30.27 and 28.71 mg/L), SO42− (54 and 63 mg/L), Cl (100.8 and 83.2 mg/L), and TDS (219 and 199 mg/L), indicating strong mineral-driven characteristics. DW10 also showed high TDS (296 mg/L), Ca2+ (26.24 mg/L), and Mg2+ (26.91 mg/L), suggesting a hardness-related profile. Other samples exhibited distinct ionic features, including elevated Na+ and Ca2+ in DW5 (17.63 and 18.42 mg/L), high Br in DW4 (7.98 mg/L), and high K+ in DW7 (40.01 mg/L). These results indicate that ionic composition and TDS were key factors differentiating bottled water samples [28].
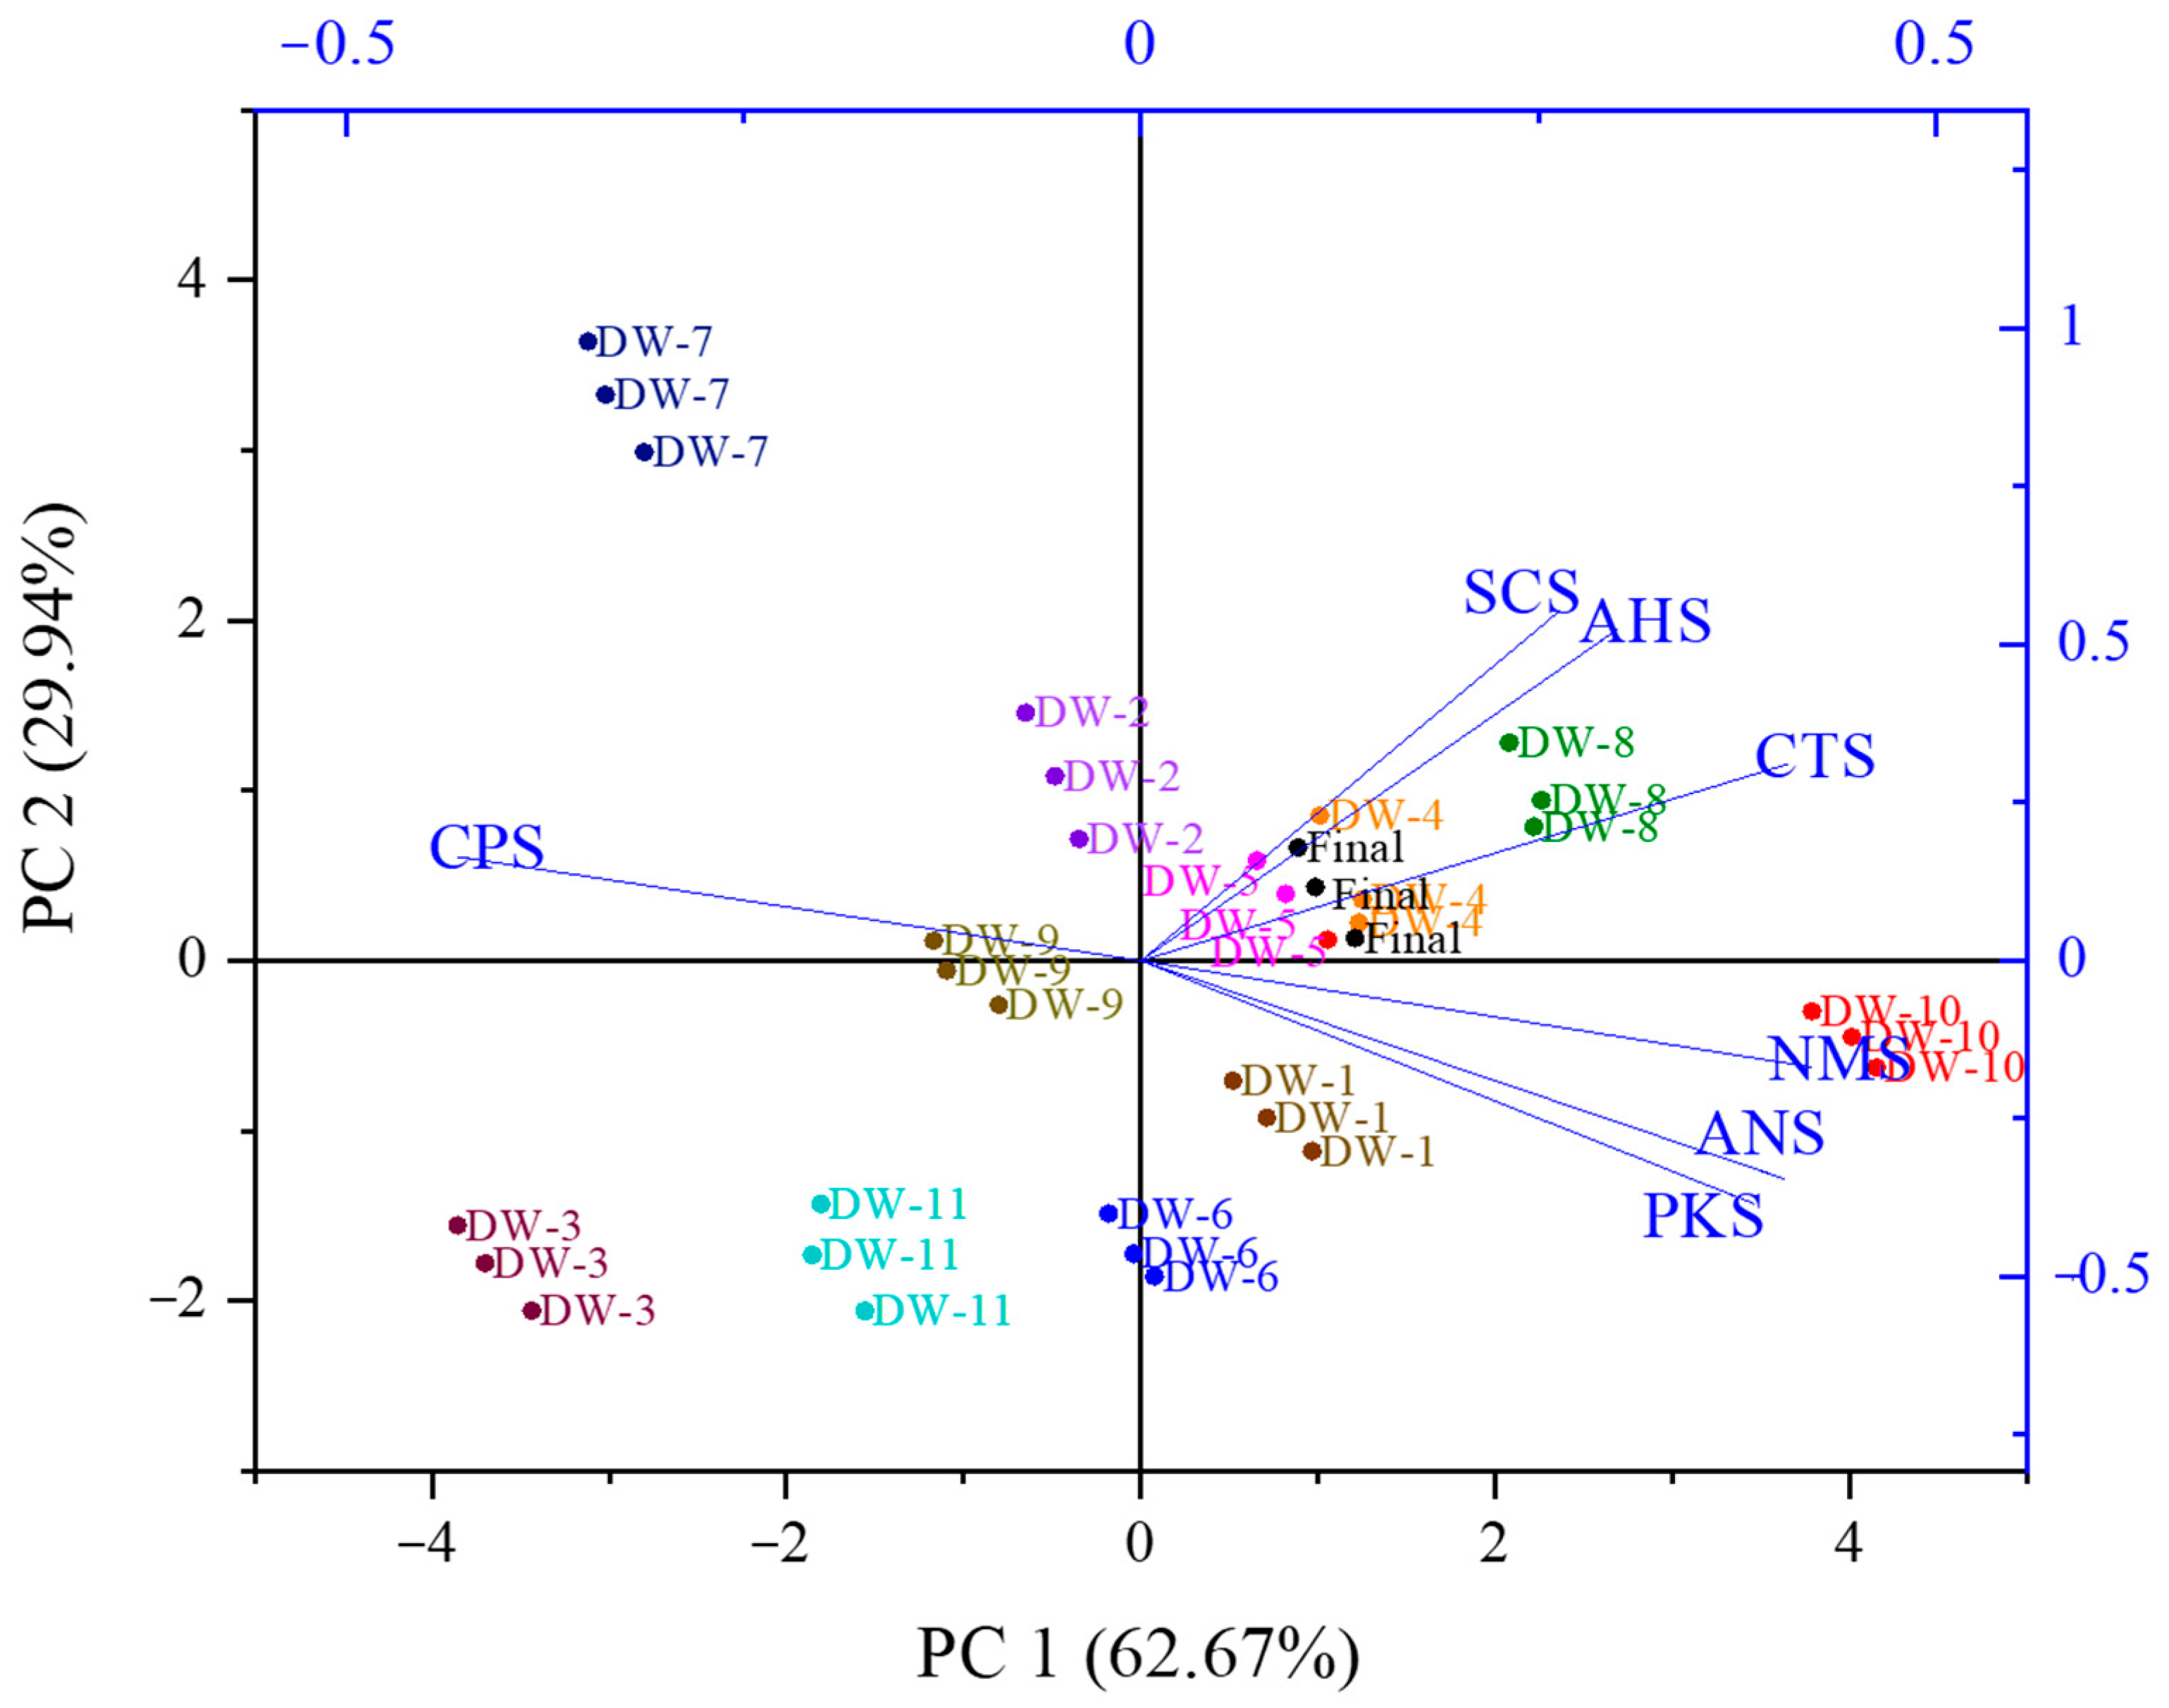
Figure 8 presents the PCA results based on the normalized E-tongue sensor responses of the bottled water samples and the Final reference, where PC1 and PC2 explained 62.67% and 29.94% of the total variance, respectively. DW3 and DW11 were clearly separated from the other samples, consistent with their high Cl and SO42− concentrations and their influence on mineral-related sensor responses. DW10 aligned with the NMS, PKS, and ANS sensor vectors, reflecting its elevated Ca2+, Mg2+, and Na+ concentrations. DW7 was separated mainly due to its high K+ concentration, whereas DW1, DW2, DW4, DW5, DW6, DW9, and the Final sample formed a relatively clustered group, indicating similar taste-related sensor patterns.
Table 7 summarizes the sensors with VIP values ≥ 1.0 and the corresponding sensor-inferred taste-related characteristics for each bottled water sample. Using the Final sample as the reference, TI values were calculated for the bottled waters (Table 8). DW3 and DW7 showed the highest TI values (1.00 and 0.95), indicating the greatest deviation from the Final reference. In contrast, DW4, DW5, and DW2 showed TI values below 0.05, suggesting high similarity to the Final sample. These results indicate that the TI captures differences in E-tongue response patterns associated with variations in mineral composition and overall water matrix characteristics.
Overall, the bottled water analysis supports the applicability of the TI as a compact quantitative indicator for comparing sensor-inferred taste-related profiles across diverse drinking water matrices. However, because the TI threshold is site-specific, further validation across different source waters, seasons, treatment configurations, and labeled anomaly datasets is needed to assess broader generalizability and anomaly-detection performance.

4. Conclusions

This study developed an E-tongue-derived Taste Index (TI) to quantify taste-related deviations in drinking water treatment and distribution systems. By converting multidimensional potentiometric sensor responses into a Euclidean distance-based index, the TI provides an interpretable metric for tracking aesthetic water quality changes that are not easily captured by conventional physicochemical parameters.
  • The E-tongue sensor array demonstrated clear discrimination across five basic taste substances, with LDA classification performance ranging from 0.94 to 1.00. VIP analysis further indicated that specific sensors contributed differently to ionic and organic taste-related responses, supporting the use of the sensor array for interpreting complex water matrices. Across the treatment process, the TI decreased from Raw water toward the Final reference, indicating progressive stabilization of taste-related profiles. The temporary increase in TI after ozonation (TI = 0.38) suggests sensitivity to process-induced transformations, likely associated with DOM oxidation and the formation of low-molecular-weight byproducts such as aldehydes and ketones.
  • In the distribution system, locations with elevated TI values above the site-specific threshold (TI > 0.4), including P2, P8, P9, P12, and P16, were consistent with previously documented aesthetic issue-prone areas. These deviations may be related to infrastructure and hydraulic factors, including pipe aging, tank-based water supply, residual chlorine decay, and water age. These results support the potential of TI as a site-specific indicator for detecting localized taste-related deviations in distribution networks.
  • The applicability of the TI was further examined using 11 commercial bottled waters. Bottled water samples with distinct mineral compositions, particularly DW3 and DW7, showed high TI values (1.00 and 0.95, respectively), indicating clear deviation from the Final reference. In contrast, DW4, DW5, and DW2 showed TI values below 0.05, suggesting taste-related sensor profiles similar to the treated tap water reference. These results indicate that the TI can serve as a compact quantitative indicator for comparing taste-related profiles across diverse drinking water matrices.
Overall, the proposed TI provides a practical framework for linking E-tongue-based sensory fingerprints with operational water quality monitoring. Rather than replacing conventional chemical analysis or sensory panels, the TI can complement existing monitoring approaches by providing an objective and interpretable indicator of taste stability. Although repeated measurements, stable-response averaging, RSD-based quality control, and application to treatment-stage, distribution-network, and bottled water samples supported the practical applicability of the TI, real-world matrix complexity, including DOM composition, ionic strength, viscosity, flow conditions, residual disinfectants, and hydraulic residence time, may affect diffusion layers and potentiometric response kinetics. Further validation under different seasonal, source-water, hydraulic, and site-specific distribution conditions is needed before broader implementation in real-time monitoring or automated control systems. In addition, future studies should incorporate time-resolved ChemFET responses and interface-level adsorption/desorption or diffusion-based modeling to better link interfacial electrochemical processes with TI variations.

Author Contributions

J.L.: Data curation, Formal analysis, Investigation, Writing—original draft. S.-H.N.: Data curation, Visualization, Methodology—review and editing. T.-M.H.: Project administration, Validation. J.-W.K.: Methodology, Resources. E.K., J.P. and I.S.: Methodology, Formal analysis, Resources. All authors have read and agreed to the published version of the manuscript.

Funding

This study was funded by the major project of the Korea Institute of Civil Engineering and Building Technology (KICT) (grant number 20260255-001).

Data Availability Statement

The data presented in this study are available on request from the corresponding author. The data are not publicly available due to institutional restrictions on the disclosure of site-specific drinking water treatment and distribution system data.

Acknowledgments

The authors confirm that ChatGPT (GPT-5.5 Thinking, OpenAI, San Francisco, CA, USA) was used solely for English language editing and grammar refinement. No AI/LLM-based tools were used for data analysis, interpretation of results, generation of scientific content, or preparation of conclusions in this study. The authors reviewed and verified all AI-assisted outputs and take full responsibility for the accuracy, integrity, and scientific validity of the technical content.

Conflicts of Interest

The authors declare no conflicts of interest.

References

  1. Gabrielli, M.; Pulcini, F.; Barbesti, G.; Antonelli, M. Source to Tap Investigation of Natural Organic Matter in Non-Disinfected Drinking Water Distribution Systems. Environ. Sci. Water Res. Technol. 2024, 10, 128–143. [Google Scholar] [CrossRef]
  2. Mpindou, G.O.M.; Escuder Bueno, I.; Chordà Ramón, E. Risk Analysis Methods of Water Supply Systems: Comprehensive Review from Source to Tap. Appl. Water Sci. 2022, 12, 56. [Google Scholar] [CrossRef]
  3. Akcaalan, R.; Devesa-Garriga, R.; Dietrich, A.; Steinhaus, M.; Dunkel, A.; Mall, V.; Manganelli, M.; Scardala, S.; Testai, E.; Codd, G.A.; et al. Water Taste and Odor (T&O): Challenges, Gaps and Solutions from a Perspective of the WaterTOP Network. Chem. Eng. J. Adv. 2022, 12, 100409. [Google Scholar] [CrossRef]
  4. Alsaqqar, A.S.; Khudair, B.H.; Ali, S.K. Evaluating Water Stability Indices from Water Treatment Plants in Baghdad City. J. Water Resour. Prot. 2014, 6, 1344–1351. [Google Scholar] [CrossRef]
  5. del Valle, M. Electronic Tongues Employing Electrochemical Sensors. Electroanalysis 2010, 22, 1539–1555. [Google Scholar] [CrossRef]
  6. Vlasov, Y.G.; Legin, A.V.; Rudnitskaya, A.M.; D’Amico, A.; Di Natale, C. «Electronic Tongue»—New Analytical Tool for Liquid Analysis on the Basis of Non-Specific Sensors and Methods of Pattern Recognition. Sens. Actuators B Chem. 2000, 65, 235–236. [Google Scholar] [CrossRef]
  7. Almario, A.A.; Calabokis, O.P.; Barrera, E.A. Smart E-Tongue Based on Polypyrrole Sensor Array as Tool for Rapid Analysis of Coffees from Different Varieties. Foods 2024, 13, 3586. [Google Scholar] [CrossRef]
  8. Arfao, A.T.; Onana, M.F.; Koji, E.; Moungang, L.M.; Ewoti, O.V.N.; Emadjeu, J.B.T.; Tchakonté, S.; Njoya, A.M.; Sime-Ngando, T.; Moise, E.N. Using Principal Component Analysis to Assess Water Quality from the Landing Stages in Coastal Region. Am. J. Water Resour. 2021, 9, 23. [Google Scholar] [CrossRef]
  9. Sarma, M.; Romero, N.; Cetó, X.; Valle, M. del Optimization of Sensors to Be Used in a Voltammetric Electronic Tongue Based on Clustering Metrics. Sensors 2020, 20, 4798. [Google Scholar] [CrossRef] [PubMed]
  10. Gutés, A.; Céspedes, F.; Alegret, S.; Del Valle, M. Determination of Phenolic Compounds by a Polyphenol Oxidase Amperometric Biosensor and Artificial Neural Network Analysis. Biosens. Bioelectron. 2005, 20, 1668–1673. [Google Scholar] [CrossRef]
  11. Herrera-Chacón, A.; Cetó, X.; del Valle, M. Molecularly Imprinted Polymers—Towards Electrochemical Sensors and Electronic Tongues. Anal. Bioanal. Chem. 2021, 413, 6117–6140. [Google Scholar] [CrossRef]
  12. Sivaranjanee, R.; Senthil Kumar, P.; Saravanan, R.; Govarthanan, M. Electrochemical Sensing System for the Analysis of Emerging Contaminants in Aquatic Environment: A Review. Chemosphere 2022, 294, 133779. [Google Scholar] [CrossRef] [PubMed]
  13. Sipos, L.; Kovács, Z.; Sági-Kiss, V.; Csiki, T.; Kókai, Z.; Fekete, A.; Héberger, K. Discrimination of Mineral Waters by Electronic Tongue, Sensory Evaluation and Chemical Analysis. Food Chem. 2012, 135, 2947–2953. [Google Scholar] [CrossRef] [PubMed]
  14. Martínez-Máñez, R.; Soto, J.; Garcia-Breijo, E.; Gil, L.; Ibáñez, J.; Llobet, E. An “Electronic Tongue” Design for the Qualitative Analysis of Natural Waters. Sens. Actuators B Chem. 2005, 104, 302–307. [Google Scholar] [CrossRef]
  15. Gutiérrez-Capitán, M.; Brull-Fontserè, M.; Jiménez-Jorquera, C. Organoleptic Analysis of Drinking Water Using an Electronic Tongue Based on Electrochemical Microsensors. Sensors 2019, 19, 1435. [Google Scholar] [CrossRef]
  16. Legin, E.; Zadorozhnaya, O.; Khaydukova, M.; Kirsanov, D.; Rybakin, V.; Zagrebin, A.; Ignatyeva, N.; Ashina, J.; Sarkar, S.; Mukherjee, S.; et al. Rapid Evaluation of Integral Quality and Safety of Surface and Waste Waters by a Multisensor System (Electronic Tongue). Sensors 2019, 19, 2019. [Google Scholar] [CrossRef]
  17. Sghaier, K.; Barhoumi, H.; Maaref, A.; Siadat, M.; Jaffrezic-Renault, N. Classification and Discrimination of Different Tunisian Water Samples Using an Electronic Tongue. Sens. Lett. 2009, 7, 683–688. [Google Scholar] [CrossRef]
  18. Cuartero, M.; Ruiz, A.; Galián, M.; Ortuño, J.A. Potentiometric Electronic Tongue for Quantitative Ion Analysis in Natural Mineral Waters. Sensors 2022, 22, 6204. [Google Scholar] [CrossRef] [PubMed]
  19. Liu, M.; Wang, J.; Li, D.; Wang, M. Electronic Tongue Coupled with Physicochemical Analysis for the Recognition of Orange Beverages. J. Food Qual. 2012, 35, 429–441. [Google Scholar] [CrossRef]
  20. Beullens, K.; Mészáros, P.; Vermeir, S.; Kirsanov, D.; Legin, A.; Buysens, S.; Cap, N.; Nicolaï, B.M.; Lammertyn, J. Analysis of Tomato Taste Using Two Types of Electronic Tongues. Sens. Actuators B Chem. 2008, 131, 10–17. [Google Scholar] [CrossRef]
  21. Whelton, A.J.; Dietrich, A.M.; Burlingame, G.A.; Schechs, M.; Duncan, S.E. Minerals in Drinking Water: Impacts on Taste and Importance to Consumer Health. Water Sci. Technol. 2007, 55, 283–291. [Google Scholar] [CrossRef]
  22. Sipos, L. Sensory Evaluation of Mineral Waters by Profile Analysis. Acta Aliment. 2010, 40, 19–26. [Google Scholar] [CrossRef]
  23. Hashimoto, S.; Fujita, M.; Furukawa, K.; Minami, J. Indices of Drinking Water Concerned with Taste and Health. J. Ferment. Technol. 1987, 65, 185–192. [Google Scholar] [CrossRef]
  24. Shukla, R.P.; Aroosh, M.; Cazelles, R.; Ware, R.E.; Vinks, A.A.; Ben-Yoav, H. Microsensor Array for the Electrochemical Analysis of Hydroxyurea in Blood Samples of Children Affected by Sickle Cell Anemia. Anal. Chem. 2025, 97, 24399–24414. [Google Scholar] [CrossRef] [PubMed]
  25. Callén, M.S.; Martínez, I.; Grasa, G.; López, J.M.; Murillo, R. Principal Component Analysis and Partial Least Square Regression Models to Understand Sorption-Enhanced Biomass Gasification. Biomass Convers. Biorefinery 2024, 14, 2091–2111. [Google Scholar] [CrossRef]
  26. Wold, S.; Sjöström, M.; Eriksson, L. PLS-Regression: A Basic Tool of Chemometrics. Chemom. Intell. Lab. Syst. 2001, 58, 109–130. [Google Scholar] [CrossRef]
  27. Aminu, M.; Ahmad, N.A. Complex Chemical Data Classification and Discrimination Using Locality Preserving Partial Least Squares Discriminant Analysis. ACS Omega 2020, 5, 26601–26610. [Google Scholar] [CrossRef]
  28. Platikanov, S.; Hernández, A.; González, S.; Luis Cortina, J.; Tauler, R.; Devesa, R. Predicting Consumer Preferences for Mineral Composition of Bottled and Tap Water. Talanta 2017, 162, 1–9. [Google Scholar] [CrossRef] [PubMed]
  29. Taylor, R. Interpretation of the Correlation Coefficient: A Basic Review. J. Diagn. Med. Sonogr. 1990, 6, 35–39. [Google Scholar] [CrossRef]
  30. Park, S.-K.; Cho, J.-S.; Yun, D.-Y.; Lee, G.; Lim, J.-H.; Choi, J.H.; Park, K.-J. Investigating Potential Freshness Indicators for Packaged Oysters through Multivariate Statistical Analysis. Food Sci. Biotechnol. 2025, 34, 815–827. [Google Scholar] [CrossRef]
  31. Belkhiri, L.; Mouni, L. Geochemical Characterization of Surface Water and Groundwater in Soummam Basin, Algeria. Nat. Resour. Res. 2014, 23, 393–407. [Google Scholar] [CrossRef]
  32. Ward, J.H., Jr. Hierarchical Grouping to Optimize an Objective Function. J. Am. Stat. Assoc. 1963, 58, 236–244. [Google Scholar] [CrossRef]
  33. Nam, S.-H.; Lee, J.; Kim, E.; Shin, Y.; Koo, J.-W.; Kye, H.; Park, J.; Jeon, H.; Song, Y.; Hwang, T.-M. Electronic Tongue and Nose Sensor Coupled with Fluorescence Spectroscopy to Analyze Aesthetic Water Quality Parameters in Drinking Water Distribution System. Process Saf. Environ. Prot. 2024, 188, 1201–1210. [Google Scholar] [CrossRef]
  34. Kairan, O. Multivariate Methods Approach for Water Quality Index Estimation. Appl. Math. Comput. Intell. AMCI 2022, 11, 492–504. [Google Scholar]
  35. Patel, P.S.; Pandya, D.M.; Shah, M. A Holistic Review on the Assessment of Groundwater Quality Using Multivariate Statistical Techniques. Environ. Sci. Pollut. Res. 2023, 30, 85046–85070. [Google Scholar] [CrossRef] [PubMed]
  36. Baloïtcha, G.M.P.; Mayabi, A.O.; Home, P.G. Evaluation of Water Quality and Potential Scaling of Corrosion in the Water Supply Using Water Quality and Stability Indices: A Case Study of Juja Water Distribution Network, Kenya. Heliyon 2022, 8, e09141. [Google Scholar] [CrossRef] [PubMed]
  37. Han, X.; Jiang, H.; Zhang, D.; Zhang, Y.; Xiong, X.; Jiao, J.; Xu, R.; Yang, M.; Han, L.; Lin, J. A Novel Quantitative Prediction Approach for Astringency Level of Herbs Based on an Electronic Tongue. Pharmacogn. Mag. 2017, 13, 492–497. [Google Scholar] [CrossRef]
  38. Vlasov, Y.; Legin, A.; Rudnitskaya, A. Electronic Tongues and Their Analytical Application. Anal. Bioanal. Chem. 2002, 373, 136–146. [Google Scholar] [CrossRef]
  39. Cho, S.; Moazzem, M.S. Recent Applications of Potentiometric Electronic Tongue and Electronic Nose in Sensory Evaluation. Prev. Nutr. Food Sci. 2022, 27, 354–364. [Google Scholar] [CrossRef]
  40. Arıman, S.; Soydan-Oksal, N.G.; Beden, N.; Ahmadzai, H. Assessment of Groundwater Quality through Hydrochemistry Using Principal Components Analysis (PCA) and Water Quality Index (WQI) in Kızılırmak Delta, Turkey. Water 2024, 16, 1570. [Google Scholar] [CrossRef]
  41. Fartas, F.; Remini, B.; Sekiou, F.; Marouf, N. The Use of PCA and ANN to Improve Evaluation of the WQIclassic, Development of a New Index, and Prediction of WQI, Coastel Constantinois, Northern Coast of Eastern Algeria. Water Supply 2022, 22, 8727–8749. [Google Scholar] [CrossRef]
  42. Evans, J.D. Straightforward Statistics for the Behavioral Sciences; Thomson Brooks/Cole Publishing, Co.: Belmont, CA, USA, 1996; p. xxii, 600. ISBN 978-0-534-23100-2. [Google Scholar]
  43. Adams, H.; Burlingame, G.; Ikehata, K.; Furatian, L.; Suffet, I.H. The Effect of pH on Taste and Odor Production and Control of Drinking Water. AQUA—Water Infrastruct. Ecosyst. Soc. 2022, 71, 1278–1290. [Google Scholar] [CrossRef]
  44. López, P.; Pérez-Rodríguez, I.; Estrany, F.; Devesa, R. Effects of Sulfate and Nitrate on the Taste of Water: A Study with a Trained Panel. J. Water Supply Res. Technol.-Aqua 2017, 66, 598–605. [Google Scholar] [CrossRef]
  45. Riyadh, A.; Peleato, N.M. Natural Organic Matter Character in Drinking Water Distribution Systems: A Review of Impacts on Water Quality and Characterization Techniques. Water 2024, 16, 446. [Google Scholar] [CrossRef]
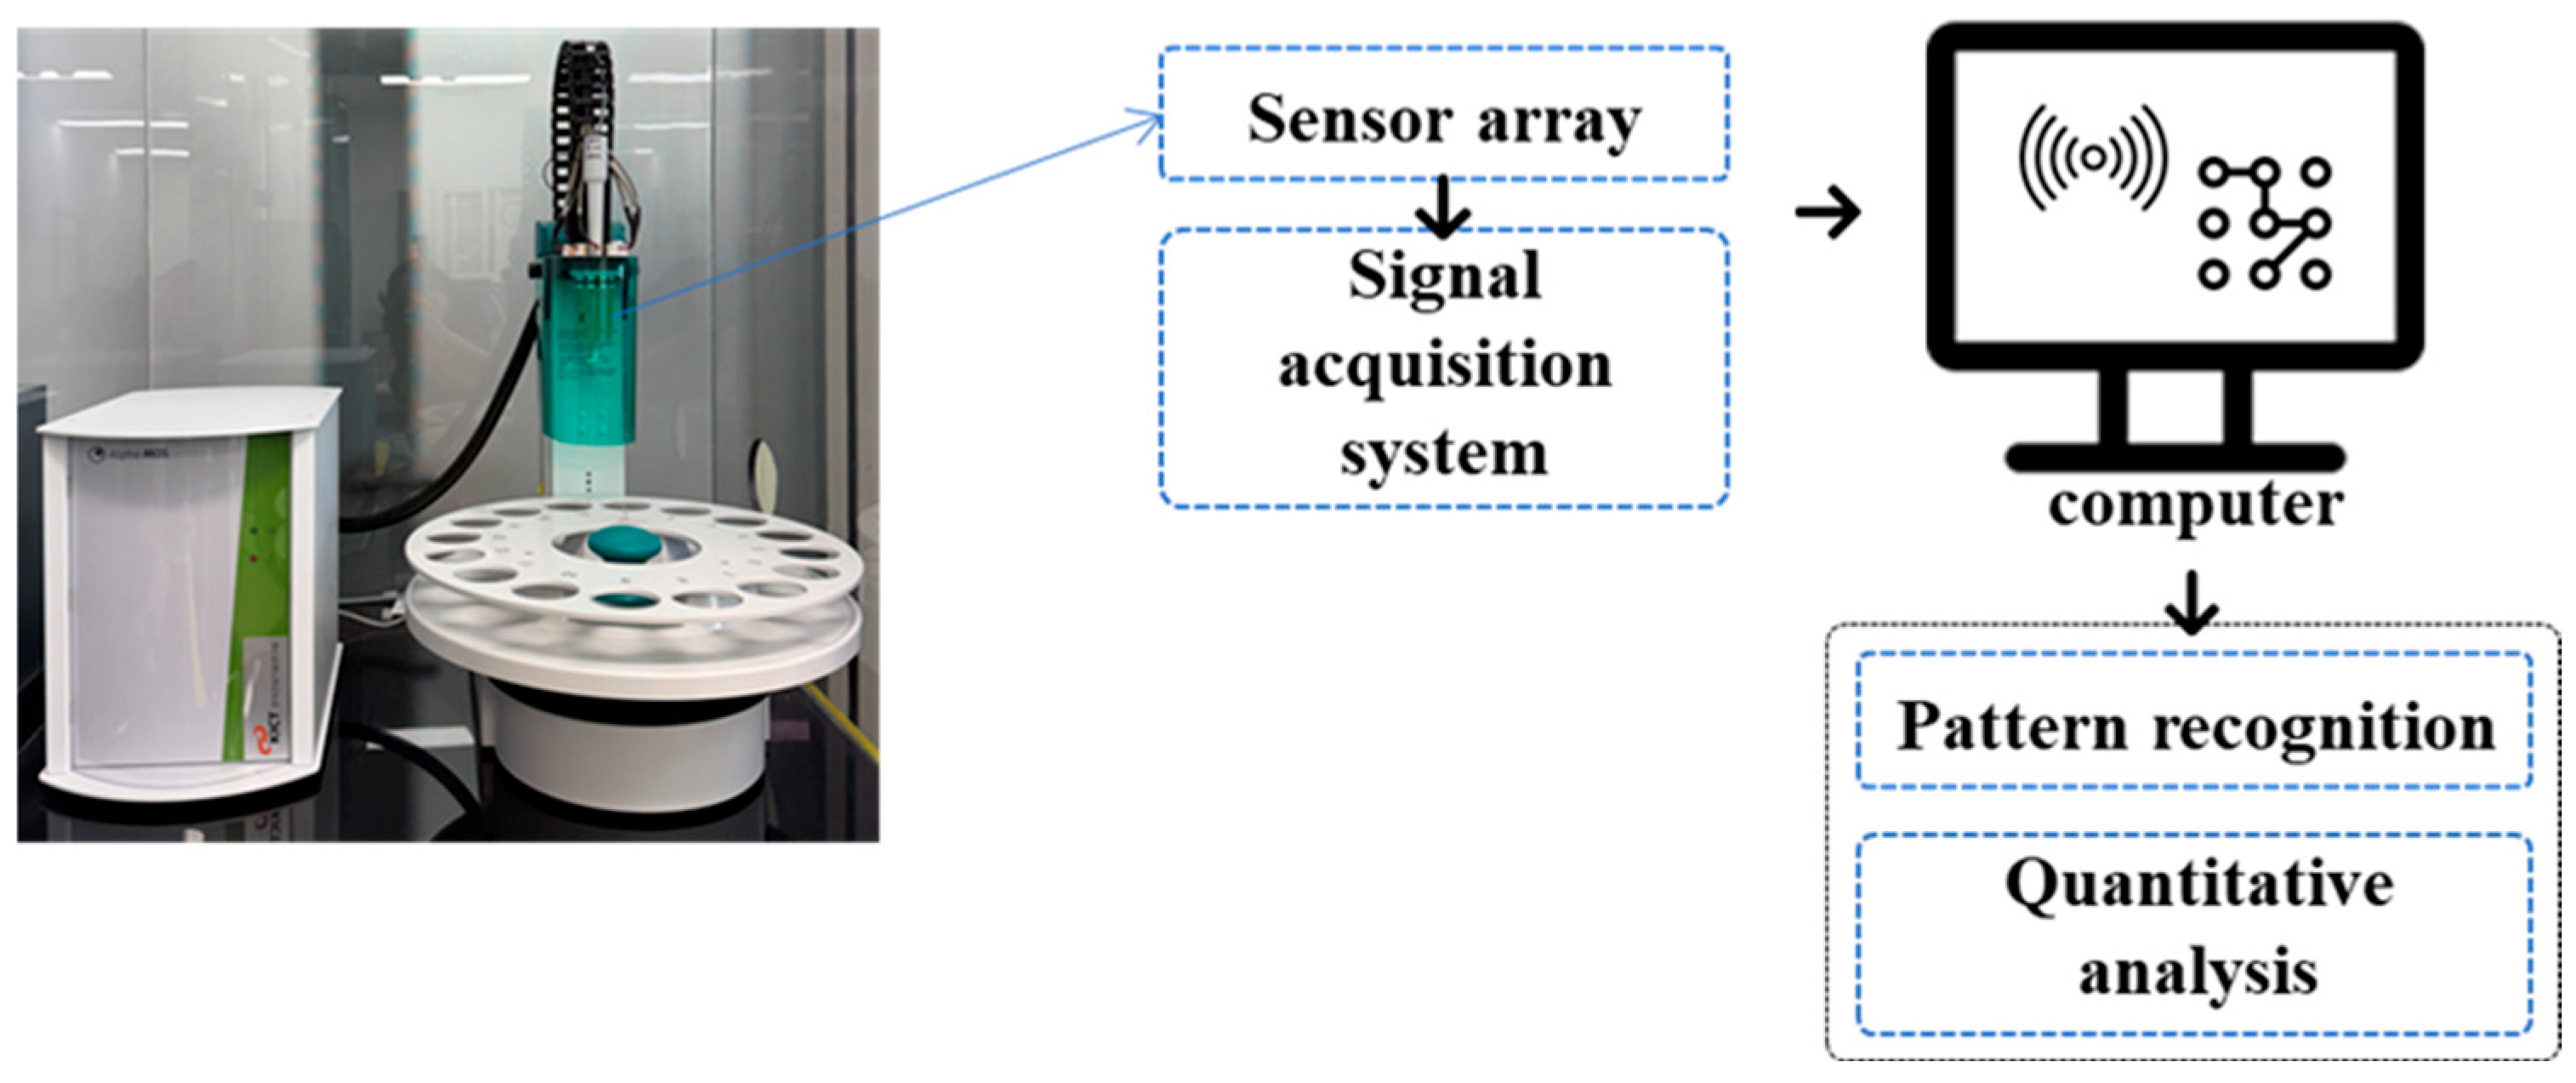
Figure 1. Schematic diagram of the electronic tongue system used in this study.
Water 18 01305 g001
Figure 2. Sampling locations in I City, showing 16 distribution-network sampling points (P1–P16) supplied by the G Water Treatment Plant.
Water 18 01305 g002
Figure 3. PCA biplots based on normalized E-tongue sensor responses. (a) PCA of seven treatment process samples: Raw, Floc/Sed, Filter, GAC, O3, BAC, and Final. (b) PCA of 16 distribution network samples, P1–P16, collected after final treatment. The physicochemical characteristics of these samples are listed in Table 3.
Water 18 01305 g003
Figure 4. Heatmaps showing (a) PLS-DA-based VIP scores for E-tongue sensors and (b) Pearson correlation coefficients between E-tongue sensor responses and measured physicochemical parameters.
Water 18 01305 g004
Figure 5. Normalized Taste Index (TI) values across drinking water treatment stages. Bars indicate mean TI values, and error bars represent the standard deviation of repeated E-tongue measurements. The Final sample was used as the reference condition (TI = 0), and Raw water was normalized to TI = 1.00. The red dashed line indicates the site-specific operational threshold of TI = 0.4.
Water 18 01305 g005
Figure 6. Normalized TI values across distribution network sampling locations. Bars indicate mean TI values, and error bars represent the standard deviation of repeated E-tongue measurements. The dashed line indicates the site-specific operational threshold of TI = 0.4. The blue boxes highlight sampling locations with TI values exceeding the site-specific threshold.
Water 18 01305 g006
Figure 7. PCA biplot based on standardized physicochemical parameters of the 11 commercial bottled water samples and the Final reference. The labeled points represent the PCA score positions of the bottled water samples (DW1–DW11) and the Final reference, whereas the blue lines and variable labels indicate the loading vectors of the physicochemical variables on PC1 and PC2.
Water 18 01305 g007
Figure 8. PCA biplot based on normalized E-tongue sensor responses of the 11 commercial bottled water samples and the Final reference. Colored sample labels represent individual bottled water samples (DW1–DW11) and the Final reference, whereas blue sensor labels and lines indicate E-tongue sensor loading vectors on PC1 and PC2.
Water 18 01305 g008
Table 1. Sensory attributes as determined by sensor test.
NoTasteSubstances
1SournessCitric acid
2SaltinessNaCl
3SweetnessGlucose
4BitternessCaffeine
5Umami-related amino acid responseL-arginine
Table 2. Sensory responses of electronic tongue sensors to basic taste substances.
SubstanceDiscrimination Range (mg/L)PCA Explained Variance (%)Responsive SensorsLDA Accuracy, R2
Citric acid0.1–20PC1: 94.59CTS, NMS, CPS, SCS0.99 (p < 0.0001)
NaCl2–20PC1: 60.89,
PC2: 24.45
CTS, NMS, CPS, SCS0.99 (p < 0.0001)
Glucose0.1–2PC1: 90.34AHS, PKS, CPS0.94 (p < 0.0001)
Caffeine10–20PC1: 95.32AHS, PKS1.00 (p < 0.0001)
L-arginine0.1–20PC1: 96.28AHS, NMS, SCS0.99 (p < 0.0001)
Table 3. Physicochemical characteristics of treatment and distribution samples.
SamplepHTurbidity
(NTU)
TOC
(mg/L)
UV254
(abs./cm)
F
(mg/L)
Cl
(mg/L)
Br-
(mg/L)
NO3-N
(mg/L)
SO42−
(mg/L)
Na+
(mg/L)
K+
(mg/L)
Mg2+
(mg/L)
Ca2+
(mg/L)
Raw7.648.593.030.3810.0716.98<0.0011.7914.3010.86<0.0012.553.97
Floc/Sed7.30.291.590.0200.2724.15<0.0011.7316.5413.08<0.0012.704.39
Filter7.20.071.520.0190.0622.07<0.0011.7814.6411.27<0.0012.563.92
GAC7.20.061.260.0120.0730.08<0.0012.6722.3316.54<0.0013.175.20
O37.20.061.670.0140.0619.66<0.0011.5012.169.49<0.0012.413.48
BAC7.20.061.510.0120.0722.06<0.0011.2713.7210.94<0.0012.413.92
Final7.10.061.440.0070.0414.61<0.0011.309.015.972.332.5213.99
P17.20.071.200.0090.0623.30<0.0011.3014.0011.372.433.9218.60
P27.50.121.150.0120.0624.10<0.0011.3014.1111.692.494.0119.08
P37.50.121.090.0100.0724.08<0.0011.3013.9712.072.773.8218.77
P47.50.121.090.0150.0623.39<0.0011.6013.4511.302.443.9718.72
P57.40.071.210.0090.0622.88<0.0011.2013.6111.172.393.8918.36
P67.40.081.150.0090.0724.40<0.0011.3014.2512.052.543.9719.33
P77.50.061.210.0080.0722.78<0.0011.5013.8611.162.393.8618.59
P87.50.091.220.0080.0623.52<0.0011.3013.9911.442.453.9718.97
P97.50.121.080.0100.0724.22<0.0011.3014.6712.062.543.9118.84
P107.50.121.250.0110.0623.82<0.0011.5014.6411.612.564.0219.29
P117.40.081.190.0090.0622.72<0.0011.4012.8710.802.373.7317.79
P127.50.081.170.0090.0622.61<0.0011.3012.8910.752.343.7417.82
P137.60.091.120.0090.0723.70<0.0011.3013.9611.432.433.9518.88
P147.40.091.150.0090.0722.75<0.0011.4013.1210.852.353.7818.23
P157.40.121.130.0100.0623.89<0.0011.3014.0011.312.433.7719.05
P167.40.101.190.0090.0623.53<0.0011.4012.7910.892.463.7317.93
Table 4. Key sensor responses and inferred tastes by treatment stage.
Treatment ProcessTop Sensors (VIP ≥ 1.0)Inferred Taste Characteristics
RawPKS, NMS, CPSComplex; salty, umami, sour
Floc/SedPKS, NMS, CPSSweetness-like mineral presence
FilterPKS, NMS, CPSSweetness-like mineral presence
GACPKS, NMS, CPSReduced taste intensity; fewer organoleptic properties
O3PKS, CTS, NMS,
CPS, ANS
Bitter/astringent (oxidized organics)
BACANS, CPS, PKSResidual organic taste (mild bitterness)
FinalCPS, AHS, SCSUmami, sour, and lingering taste (aftertaste)
Table 5. Summary of E-tongue sensor importance and major physicochemical correlations based on VIP scores and Pearson correlation coefficients.
SensorVIP ScoreTop Correlated Water Quality
Parameter (r)
Taste Implication
AHS1.56pH (0.69)Alkalinity-sensitive; general taste modulation
PKS1.47SO42− (−0.93), Ca2+ (−0.93)Mineral bitterness (sulfate)
CTS0.94NO3-N (0.27)Low contribution; Weak inorganic bitterness
NMS1.10Cl (−0.60), SO42− (−0.67),
Na+ (−0.66), K+ (−0.62),
Mg2+ (−0.67), Ca2+ (−0.67)
Sensitive to ionic strength and hardness; Mineral balance-related taste variation
CPS1.32SO42− (−0.97), Cl (−0.89), Na+ (−0.94), K+ (−0.92), Mg2+ (−0.94), Ca2+ (−0.97)Strong sulfate response; bitter taste likely
ANS1.18TOC (0.33),
Cl (−0.53), Na+ (−0.53), Mg2+ (−0.52)
Organic-related astringency
SCS1.46pH (0.67)pH-driven broad taste detection
Notes: VIP scores indicate the sensor-wise contribution derived from the PLS-DA model. Pearson correlation coefficients indicate the linear association between each E-tongue sensor response and the measured physicochemical parameters.
Table 6. Physicochemical characteristics of commercial bottled water samples.
SamplepHTurbidity
(NTU)
TDS
(mg/L)
TOC
(mg/L)
UV254
(abs./cm)
F
(mg/L)
Cl
(mg/L)
Br
(mg/L)
NO3-N
(mg/L)
SO42−
(mg/L)
Na+
(mg/L)
K+
(mg/L)
Mg2+
(mg/L)
Ca2+
(mg/L)
DW16.760.12660.250.0010.0711.30.001.645.840.672.5714.94
DW27.420.07380.130.0000.045.70.000.316.162.442.603.25
DW36.180.082190.180.0000.00100.81.390.05411.969.0130.279.71
DW47.310.07490.140.0010.054.37.980.035.021.191.8510.91
DW57.250.161450.220.0020.2012.10.000.2117.635.1414.5718.42
DW66.830.08530.250.0010.712.70.002.355.760.481.2112.10
DW77.830.08900.170.0000.045.20.000.215.0140.012.333.42
DW87.880.101180.280.0020.305.20.001.21815.290.886.5122.88
DW97.010.11500.780.0160.681.10.000.438.332.804.114.67
DW107.520.162960.220.0200.0610.80.000.8147.031.0726.9126.24
DW116.690.081990.360.0010.0283.20.000.0634.698.0128.7114.17
Table 7. Key sensor contributions (VIP ≥ 1.0) and inferred taste characteristics for each water sample.
SampleKey Sensor ResponsesInferred Taste Characteristics
DW1AHS, PKS, CTS, NMS, ANS, SCSastringency, organics, broad sourness, pH shift, inorganic bitterness (NO3), ionic strength, hardness, mineral bitterness (SO42−), pH/sourness modulation
DW2PKS, NMS, ANS, SCSastringency, organics, broad sourness, pH shift, ionic strength, hardness, mineral bitterness (SO42−)
DW3AHS, NMS, ANS, SCSastringency, organics, broad sourness, pH shift, ionic strength, hardness, pH/sourness modulation
DW4AHS, NMS, ANS, SCSastringency, organics, broad sourness, pH shift, ionic strength, hardness, pH/sourness modulation
DW5AHS, PKS, CTS, NMS, ANS, SCSastringency, organics, broad sourness, pH shift, inorganic bitterness (NO3), ionic strength, hardness, mineral bitterness (SO42−), pH/sourness modulation
DW6AHS, CTS, NMS, ANS, SCSastringency, organics, broad sourness, pH shift, inorganic bitterness (NO3), ionic strength, hardness, pH/sourness modulation
DW7PKS, NMS, ANS, SCSastringency, organics, broad sourness, pH shift, ionic strength, hardness, mineral bitterness (SO42−)
DW8AHS, CTS, NMS, CPS, ANS, SCSastringency, organics, broad sourness, pH shift, inorganic bitterness (NO3), ionic strength, hardness, pH/sourness modulation, strong mineral bitterness
DW9AHS, PKS, SCSbroad sourness, pH shift, mineral bitterness (SO42−), pH/sourness modulation
DW10AHS, PKS, CTS, NMS, ANS, SCSastringency, organics, broad sourness, pH shift, inorganic bitterness (NO3), ionic strength, hardness, mineral bitterness (SO42−), pH/sourness modulation
DW11AHS, PKS, NMS, ANS, SCSastringency, organics, broad sourness, pH shift, ionic strength, hardness, mineral bitterness (SO42−), pH/sourness modulation
FinalAHS, CPS, SCSUmami, sourness, pH/sourness modulation, mineral bitterness (SO42−), aftertaste
Table 8. TI scores of commercial bottled waters relative to final treated water.
SampleNormalized TI ScoreSampleNormalized TI Score
DW10.23DW70.95
DW20.29DW80.22
DW31.00DW90.38
DW40.02DW100.48
DW50.02DW110.66
DW60.42Final0.00
Disclaimer/Publisher’s Note: The statements, opinions and data contained in all publications are solely those of the individual author(s) and contributor(s) and not of MDPI and/or the editor(s). MDPI and/or the editor(s) disclaim responsibility for any injury to people or property resulting from any ideas, methods, instructions or products referred to in the content.