1. Introduction
Proper wastewater management is one of the key tools for protecting both surface and groundwater resources, and for reducing anthropogenic pressure on water-dependent ecosystems. In European Union (EU) Member States, the water and wastewater sector has been subject to progressively stricter legal requirements aimed at lowering pollutant loads discharged into receiving waters and improving water status at the catchment scale.
Municipal wastewater treatment plants (WWTP) are a fundamental component of these environmental protection systems to process liquid stream discharges before their final release into receiving waters. Nevertheless, released effluents still contain some residual pollution (organic matter, nutrients—N and P compounds—and micropollutants) either by WWTPs’ insufficient performance, inadequate design, or lack of specific available process technology and requirements (in particular, concerning contaminants of emerging concern). Even with state-of-the-art conventional treatments implemented, in fact, WWTPs are significant sources of specific contaminants in the environment, including nutrients, micro-plastics, and emerging pollutants (e.g., PFAS, pharmaceutical residues, etc.) [
1,
2,
3,
4,
5,
6]. This may contribute to the receiving waters’ quality degradation, or other adverse effects on ecosystems and public health. In fact, despite considerable improvements observed across Europe, the objectives of Water Framework Directive (WFD) 2000/60/EC [
7], aimed at achieving good ecological status of all water bodies, have not yet been fully met. A recent “fitness check” of the WFD’s implementation concluded that, as of 2021, only limited progress had been made towards achieving its overall objectives, with only 39.6% of EU waters having attained good status; additional room therefore exists for improvements in tackling chemical pollution [
8]. A proposal for WFD amendment has since been advanced, and is currently under discussion [
9].
The Urban Wastewater Treatment Directive (UWWTD) recast, (EU) 2024/3019 [
10], recently superseded previous Directive 91/271/EEC [
11]; while maintaining the same objectives, the modifications introduced new requirements and obligations concerning wastewater collection and WWTPs’ operation and performance. The new Directive re-defines agglomeration size thresholds subject to regulation, strengthens required treatment levels, and introduces new pollutant categories to those for which control is already mandated. New performance criteria for energy and emissions efficiency [
12], the concept of resources recovery and circular economy as essential approaches to WWTPs’ design and operation, as promoted by the EC’s second Circular Economy Action Plan of 2020 [
13], and discussed by recent studies [
14,
15] are also emphasized.
The provisions and stages of the requirements’ implementation under Dir. 2024/3019 are summarized in
Table 1. By placing emphasis on further reduction in nutrient discharge limits, introducing provisions for the removal of micropollutants [
16], and especially by extending treatment provision obligations to smaller agglomerations (from 10,000, and down to 1000 population equivalents, PE), the foreseen implementation of the new standards poses particular challenges to those regions and countries where a significant part of the population is distributed in a dispersed settlement pattern and thus relies on small and medium-sized urban wastewater systems.
The extension of secondary treatment to all agglomerations in the range 1000–2000 PE (2000 PE was the service threshold obligation according to Dir. 91/271/EEC) is also accompanied by the requirement of the existence, or foreseen construction, of sewage collection systems for agglomerations in that size range, to which all sources of domestic wastewater need be connected (Art. 3.2). Member States may derogate from these obligations only if the establishment of a collecting system, or the universal connection to it, is not justified due to the lack of ensuing environmental or human health benefits, or is not technically feasible, or requires excessive cost (which could be expected, in many cases). If such derogation is invoked, individual systems for collection, storage and treatment of urban wastewater ought to be implemented in a well-controlled regime. Therefore, financial implications of these regulatory developments will be, one way or the other, significant for Member States, both in terms of infrastructural upgrades, and of wastewater services management.
This study aims to assess the present status and future compliance readiness of Polish WWTPs, considering the forthcoming environmental requirements arising from the UWWTD recast. Public reports and statistics, including those available at the National and EU level (through the European Environment Agency, EEA), make it possible to describe the development of sewerage and treatment infrastructure at the macro scale; however, they do not always allow a precise assessment of how well individual regions and their administrative subdivisions are prepared to locally meet the new regulatory demands. At the same time, facility-level research often focuses on individual plants or selected technologies without considering the regional system scale or the size and structure of each collection and treatment facility [
16,
17,
18]. As a result, there remains a knowledge gap in terms of the integrated evaluation of “implementation readiness” that combines evolving legal requirements with infrastructure and operational data at the local (Voivodeship/provincial) level.
The objective of this study is to examine the present conditions and a possible approach for planning the implementation of Dir. 2024/3019 in the Opolskie Voivodeship, by relating regulatory requirements to the regional structure of wastewater infrastructure, and to locally available operational and statistical data. The analysis focuses on the structural characteristics of wastewater management systems in the area, including the number and size of WWTPs, population served, sewer network coverage, and the proportion of service provided by centralized and individual wastewater systems. An additional objective is to determine whether the introduction of the new requirements will necessitate generalized modernization, in particular of small and medium-sized treatment plants, and to what degree such upgrades may be needed. The novelty and methodological contribution of the study lies in bridging the regulatory analysis with local-scale operational data obtained directly from selected facilities, as well as with statistical data on the national wastewater treatment system, published by Statistics Poland (GUS). Local-scale WWTP performance can then be related to broader systemic conditions at the national level.
Assessments are based on operational data directly obtained from the operators of selected facilities, and on official statistical data published by Statistics Poland (GUS), in order to allow local-scale evidence to be linked with the broader systemic conditions of national sewerage and wastewater treatment systems, and enable an initial evaluation of the potential environmental benefits of possible technological improvements.
2. Present Situation of Urban Wastewater Management in Poland
The development of wastewater infrastructure in Poland has been supported, so far, by national programs, including the National Programme for Municipal Wastewater Treatment (NPMWT) [
19,
20]. Prior to Poland’s EU accession, only about 54% of the population was connected to sewer networks, while the latest available data report an overall connection rate close to 76% [
21]. This led to substantial improvements in the volumes of treated wastewater, and broader implementation of nutrient removal technologies. However, meeting the new UWWTD requirements will require additional investments, particularly in advanced treatment and monitoring infrastructure, particularly in larger ones, and in systems serving smaller agglomerations. In fact, only ≈42% of the rural population was connected to a sanitary sewerage system in 2024 [
22].
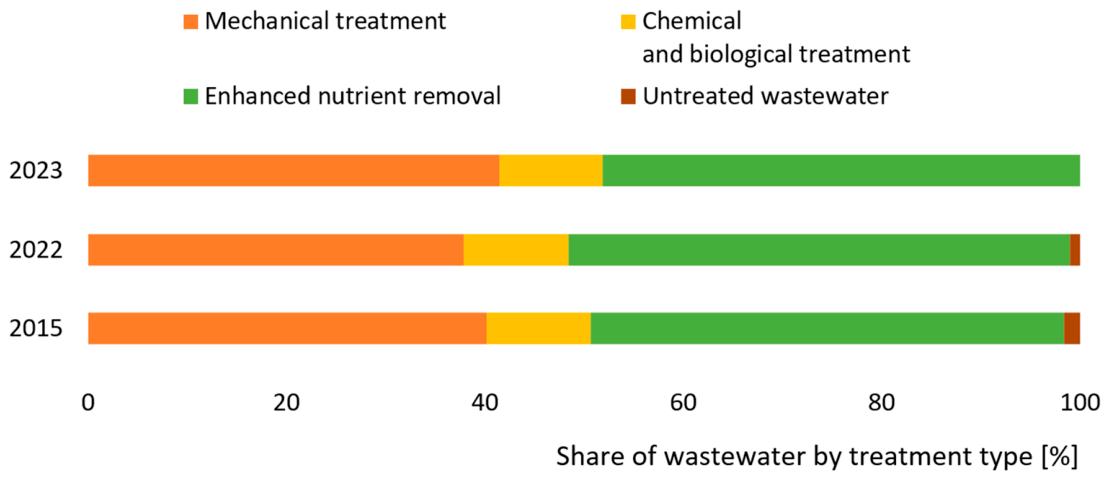
The volume of untreated discharges has decreased significantly since 2010, while the share of wastewater treated with enhanced nutrient removal (ENR, tertiary treatment) has increased, reflecting ongoing technological upgrades and modernization of WWTPs.
Figure 1 illustrates changes in the structure of industrial and municipal wastewater treatment, including mechanical, biological, and advanced nutrient removal processes, over the period 2015–2023 [
21].
The UWWTD specifies requirements based on service agglomeration size. According to Polish Law, the definition of “agglomeration” indicates, similarly to Dir. 2024/3019, an area where population or economic activities are sufficiently concentrated for wastewater to be collected and conveyed to a treatment plant or to a final discharge point (Art. 86.3(1) [
10] of the Polish Water Law, Art. 2(4) [
23] of the UWWTD). For the purpose if its application, the introductory clauses of the UWWTD indicate a nonbinding reference threshold of 10–25 PE/ha, above which the population in a specific area, possibly combined with economic activities, is considered sufficiently concentrated; however, other essential determinant factors such as, e.g., distance between buildings and topography are not included in the definition.
In Poland, an agglomeration is thus designated by a resolution of the municipal council, following prior agreement with the State Water Holding “Polish Waters” (PGW WP), and the competent Regional Directorate for Environmental Protection (in areas covered by at least one form of nature protection); this constitutes an act of local law. If an agglomeration covers areas located in two or more municipalities, the authority responsible for designating the agglomeration is the municipal council with the largest equivalent number of inhabitants. Agglomerations already designated are amenable to subsequent verification, which may result in their division, merger, creation of new entities, or even liquidation, following changes in population and economic activities distribution.
It should also be noted that, according to Eurostat (Statistical Office of the EU), the exact number of agglomerations in the newly introduced size range most affected by Dir. 2024/3019 (1000–2000 PE) is not currently tracked (either at the Member States and EU level) [
21], as Eurostat mandate focuses on broad population trends and projections, rather than on specific counts of smaller settlements. Research conducted on several EU institutional (e.g., Eurostat, EC, EEA) and commercial data companies’ websites, reveals that no such count estimate is currently easily available anywhere. According to Geonames’ website [
24], Europe currently has just short of 70,000 agglomerates with more than 1000 inhabitants; similarly, Poland counts 2989 such agglomerates, but the website does not allow the ready identification of those in the specified size range (i.e., less/more than 2000). It should also be considered that inhabitants and population equivalents are not synonymous, as the latter are determined according to the observed/potential Biochemical Oxygen Demand after 5 days, BOD
5 (or Chemical Oxygen Demand, COD) load, including the contribution of industrial, commercial, touristic and administrative everyday activities in the area, usually giving a weighting greater than their actual human occupancy. PE calculation could therefore significantly exceed or differ from the actual residents of a given agglomeration, depending on its socioeconomic characteristics. Pistocchi et al. [
25] proposed a digital morphology algorithm, based on the analysis of 100 m resolution GIS maps of population density in Europe, which produced an estimate of agglomerates in the 1000–2000 PE range counting 16,734 in the entire EU, 1329 in Poland. According to the census of the 6th update of the NPMWT, in Poland there are 1524 agglomerations with at least 2000 PE, served by a total of 1653 WWTPs, with combined load in excess of 37 million PE. Notably, more than 40% of the total pollution load (as PE) is treated by just 53 large plants associated with agglomerations exceeding 150,000 PE [
20].
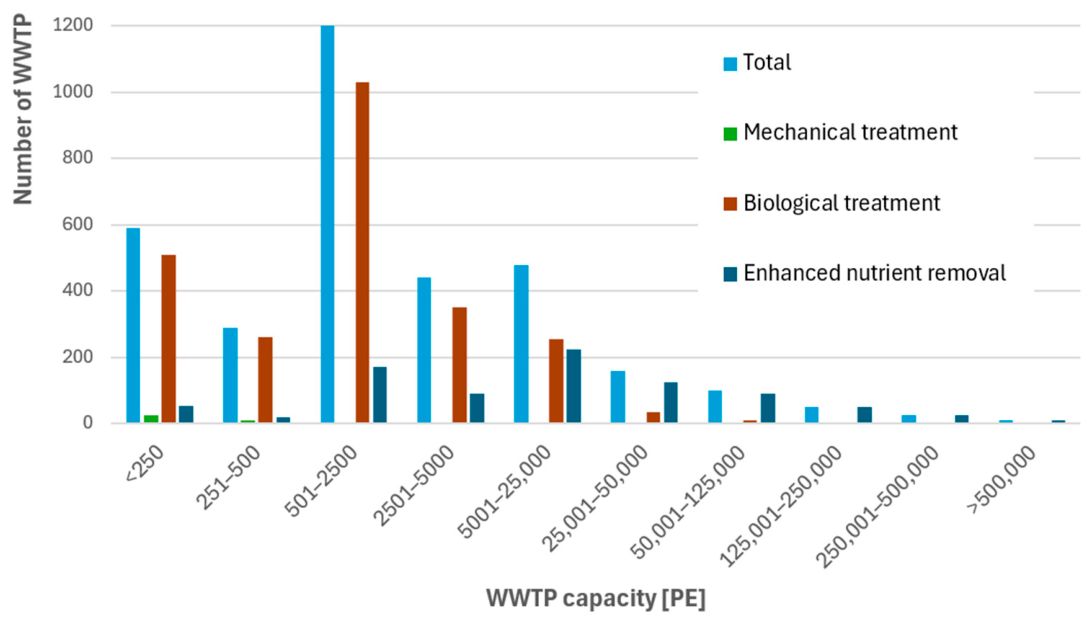
Figure 2 complements the analysis by presenting WWTP’s distribution by treated PE capacity in Poland. Data indicate the clear predominance of small facilities, particularly with capacities below 5000 PE, which together constitute the majority of all those existing. At the same time, a relatively small number of large plants account for a disproportionately high share of the total treatment load, which is consistent with the concentration of discharges in large agglomerations.
Figure 2 also highlights the widespread implementation of biological treatment processes, either conventional (secondary treatment) or with ENR (tertiary treatment), the latter especially in medium and large installations. This confirms the ongoing modernization of the sector and its alignment with the previous UWWTD’s requirements for nitrogen and phosphorus removal.
As mentioned, however, Dir. 2024/3019 introduces substantial modifications, significantly broadening the regulatory scope and implying significant consequences for Poland’s wastewater sector.
Table 2 summarizes the changes concerning the increase in minimum treatment requirements. While the previous Dir. 91/271/EEC [
11] primarily imposed secondary treatment obligations on agglomerations starting at 2000 PE, its recast extends these requirements to agglomerations starting from 1000 PE. Consequently, new facilities in that population range will be required to comply with the same BOD
5 effluent limits of larger plants (25 mg/L). Additionally, significantly more stringent discharge limits for total phosphorus (Pₜₒₜ) and total nitrogen (Nₜₒₜ) are introduced, starting already at the small–medium facilities range (≥10,000 PE, limited to sensitive areas), and particularly for installations serving large agglomerations (≥150,000 PE), reflecting the increased emphasis on combating eutrophication and protecting sensitive water bodies. Nutrient recovery, however, should be preferred to removal: Art. 20.1(b), in fact, specifically states “… recovery of resources, in particular phosphorus and nitrogen…”, shifting the focus of WWTPs to the Water Resources Recovery Facility (WRRF) concept [
14,
26].
For Poland, as well as for other EU Member States, these changes imply both regulatory and technical challenges. A considerable number of very small and small–medium sized facilities will need to ensure compliance with new standards, starting from the 1000 PE threshold, potentially requiring new construction, upgrading, modernization or process optimization. However, due to a different system of facilities’ classification in Poland, those with capacity in excess of 15,000 PE are already subject to stricter organic matter (BOD5) national emission limits than those introduced by the recast.
As reported in
Figure 2, most WWTPs above the range of 5000 PE capacity are designed according to enhanced nutrient removal (ENR) criteria; however, even in this case, this does not necessarily imply that they will automatically be able to comply with the reductions of P and N discharge limits, 65% and 33%, respectively, which will be requested for all mid-size installations above 10,000 PE. Although all facilities above 50,000 PE are ENR-designed, they too will be subject to a reduction of 50% and 20% of P and N removal targets.
The largest challenge will thus concern a facility’s efficiency in N and P removal, save for the expected future provisions on emerging pollutant removal.
Table 3 compares the numbers and PE size of agglomerations in Poland, according to the 2015 and 2024 updates of the NPMWT [
20]. The most recent figures show the scale and size of the existing system structure, which can be used as the basis for assessing the implementation of the UWWTD recast, and determining regulatory obligations and investment needs. Of particular interest is the general lack of official data concerning the consistency of the new cohort of agglomeration size class starting from 1000 PE.
The current level of compliance (with Dir. 91/271/EEC) varies depending on agglomeration size.
Table 4 summarizes the degree of fulfilment of the three key conditions of that Directive as of 31 December 2024, broken down by size classes according to current Polish and EU regulations. EU class percentages were calculated after aggregating Polish size classes into standard Dir. 91/271/EEC categories.
This study also addresses the smaller WWTPs situation, for which the planned changes may be the most difficult to implement. Examples of such agglomerations are herein presented as case studies, with particular attention paid to technological, economic, and organizational conditions, as well as to potential barriers and possibilities to adapt the systems to the new requirements. This paper proposes a diagnostic and comparative assessment approach that enables the identification of facilities and areas requiring modernization (for example, concerning nutrient removal efficiency, operational stability, loading conditions adjustment) and supports the evaluation of potential environmental and organizational consequences of the implementation of the new standards. The results may serve as a basis for planning investments and modernization priorities at regional level, as well as for inter-regional comparisons in the context of implementing EU wastewater management standards.
3. Materials and Methods
The study is based on the analysis of available local-scale operational data from selected facilities, as well as statistical data on the national wastewater treatment system published by Statistics Poland (GUS) [
20,
21,
27].
Agglomeration size classes in Poland vary significantly:
Table 5 summarizes the number of active ones, the number of WWTPs in each class, and the distribution of population connected to wastewater collection [
20]. The number of agglomerations does not directly correspond to WWTPs’ count: agglomerations are in fact defined as spatial and administrative units, established for reporting and planning purposes, whereas WWTPs represent physical installations. One agglomeration is often served by a single facility, especially in small and medium-sized municipalities, and this unique correspondence is almost always fulfilled in the 2000–10,000 PE range. Larger urban agglomerations, however, may be served by multiple WWTPs due to topographical or other factors. The few active agglomerations counting <2000 PE are not associated with a treatment facility but in some inter-municipal arrangements some may receive wastewater from more than one formally designated agglomeration.
According to 2024 data, 1524 agglomerations generate a BOD5 pollution load corresponding to slightly over 35.192 million PE, of which 26.598 million permanent residents. Among these, approximately 25.829 million are connected to sewerage systems, about 665 thousand use septic tanks (non-drainage holding tanks), and around 102 thousand use individual on-site treatment systems.
The Opolskie Voivodeship is the smallest of Poland’s 16 Voivodeships by surface (9142 km
2), characterized by a high share of rural areas and small towns; as such, it represents a region where adapting infrastructure to more stringent standards may require not only the modernization of existing facilities but also re-organizational measures of municipal wastewater management. The region lies in the Oder River basin, a major source of N and P to the Baltic Sea, designated as a sensitive area under Dir. 91/271/EEC (as is almost the entirety of Poland’s territory), which imposes ENR requirements from wastewater discharges for WWTPs serving over 10,000 PE. In addition, Polish regulations impose national limits for N and P on effluents discharged into lakes, their tributaries, and artificial reservoirs located on flowing waters, as shown in
Table 2.
In 2023, 108 WWTPs operated in the Opolskie Voivodeship, including 77 municipal facilities serving a total of 754,970 inhabitants, with a combined treatment capacity of 1,298,508 PE. These figures indicate the substantial scale of wastewater treatment infrastructure in the region, and provide an important reference point for assessing its capacity to adapt to the requirements of the new EU directive. A detailed overview of the existing treatment infrastructure in the study region is provided in
Table 6, presenting an inventory of industrial and municipal wastewater treatment plants in the Opolskie Voivodeship [
21].
Agglomerations in the Voivodeship are currently dominated by small to medium-sized ones (2000–50,000 PE). This indicates that the implementation of the UWWTD recast in the region will likely primarily involve infrastructural measures, such as the expansion of wastewater collection systems to unserved/underserved areas, as well as technological upgrades aimed at improving nutrient removal. As shown in
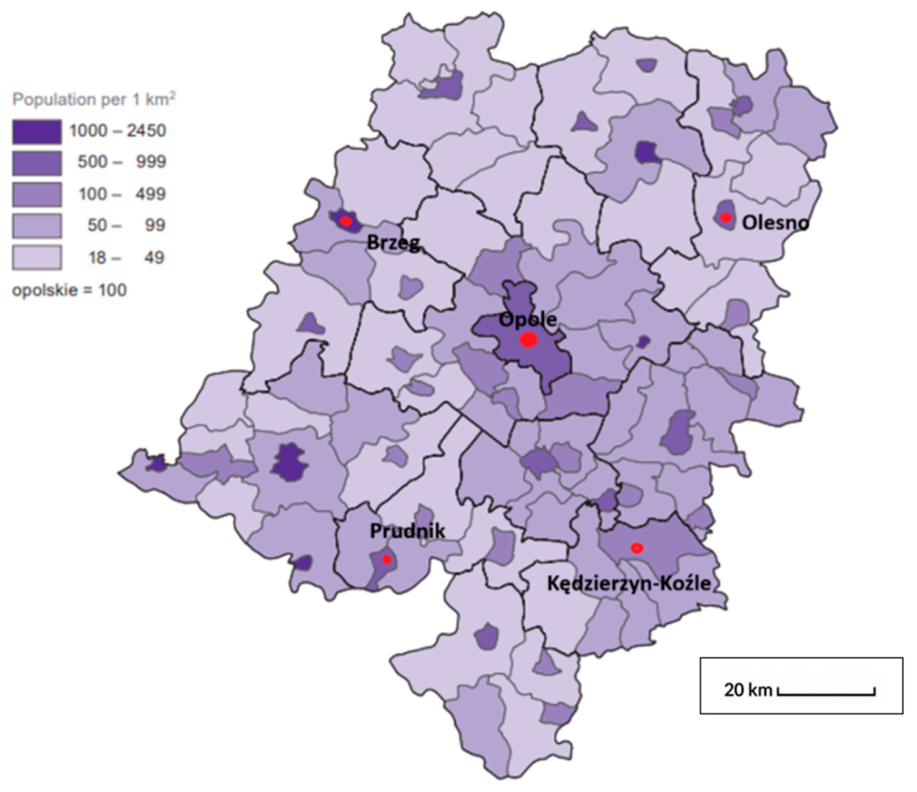
Figure 3, the population density in the region is relatively low and spatially dispersed, with higher concentrations observed mainly in urban centers such as Opole, Kędzierzyn-Koźle, Brzeg, Olesno, and Prudnik [
21]. Few administrative areas (in dark blue in the map) show population densities of more than 1000 inhabitants/km
2 (just short of 10 PE/ha) which is indicated by the UWWTD as the lower indicative reference threshold (not mandatory) in agglomeration definition. This settlement pattern further explains the predominance of smaller agglomerations and highlights the challenges associated with the development and optimization of wastewater infrastructure in less densely populated areas.
Table 7 highlights the low share of active ENR treatment in most counties, effectively treating only a minor share of wastewater [
21].
Table 8 illustrates specific key characteristics of selected agglomerations in the Opolskie Voivodeship, highlighting significant differences between large and small agglomerations, dispersed units, industrial loads, and individual systems. The table provides the basis for assessing the scale of infrastructural and organizational challenges related to the implementation of Dir. (EU) 2024/3019 in the Voivodeship.
The analysis of
Table 8 indicates very high levels of sewerage coverage in the largest and medium-sized urban centers. In Opole, Nysa, Kędzierzyn-Koźle, and Brzeg, 94–99% of residents are connected to the network, meaning that in those agglomerations the basic requirement concerning wastewater collection system density is fulfilled.
At the same time, differences can still be observed between large and smaller agglomerations. In smaller agglomerations, a slightly higher share of wastewater is handled through individual systems and part of the wastewater load reaches treatment plants indirectly via septic tank truck transport. This results in a higher risk of uncontrolled discharges and lower stability of influent load to the treatment plants.
From the perspective of treatment plant loading, the share of population equivalent (PE) originating from industry is in some cases significant, as in Opole and Brzeg, where it constitutes about 40% of the total system load. Industrial loads, even if pre-treated, may affect the efficiency and performance of municipal treatment facilities [
28]. In small agglomerations, this share is marginal, and the systems’ focus is on domestic wastewater treatment.
Among the most populated areas, the largest proportions of connected population are in the agglomerations of the city of Opole (94.8%), Brzeg (99%) and Kędzierzyn-Koźle (98.5%); however, at the related county level, Brzeg has an overall connection of just 83.7%, and Kędzierzyn-Koźle of 78.9%. Among the less populated areas, the lowest levels of sewerage coverage are observed in Olesno county (47.1% vs. 98% in the main center) and Prudnik (55.7%). It is therefore evident that the connection ratio is highly variable within parts of the same county.
Table 8 also highlights that, despite the fact that the specific sewer density (i.e., length of sewer per connected PE) may not be significantly different, with a Voivodeship’s average of ≈4.5 m/PE, actual connection ratios can vary by more than 5% in urban agglomerations, and even more at the whole county level. Sewer density in Brzeg is 4.38 m/PE with 99% connection, in Kędzierzyn-Koźle ≈ 4.66 m/PE (98.5% connection), in Olesno it is 4.26 m/PE (98% connection), in Opole 2.89 m/PE but, considering only resident population (i.e., excluding industrial inputs), rises to ≈4.7 m/PE, similarly to the previous cases, but limited to 94.8% connection. The lowest sewer density metric (3.84 m/PE) is reported in Kluczbork, where 100% connection is reported; in Strzelce Opolskie, where connection is 97.8%, sewer density shows the highest value (6.65 m/PE).
It should be noted that, in conventional urban wastewater management systems, the overall cost of sewer construction predominates against the cost of WWTP infrastructure by a ratio of approximately 2.3:1, increasing proportionally to the extension of the sewered area [
29]. A recent report indicated that conventional sewer construction costs in Poland averaged, in 2024, ≈115 EUR/m, while cost of pressure and vacuum systems, widely used in rural areas with dispersed buildings, ranged from 65 to 70 EUR/m [
30]. On the other hand, the investment cost for secondary level WWTP can be estimated at approximately 320–390 EUR/PE served, respectively, for a total design capacity of 2000 and 1000 PE [
31].
In the Opolskie Voivodeship, unconnected areas still exist, also due to the low economic feasibility of such investments. In these locations, individual on-site wastewater treatment systems or septic tanks (non-drainage holding tanks) are commonly used. In the Krapkowice municipality, the area served by the centralized WWTP increased in the past decade, with several outskirt localities reporting a rising share of sewer-connected population, from approximately 86% in 2013 to ≈92% in 2023. Despite the presence of centralized treatment infrastructure, publicly available data do not allow precise identification and assessment of applied process technologies and type of individual systems since, in this case, installations with capacity <5 m3/d discharging within the owner’s property do not require a permit under Polish rules, and therefore there is no reliable and comprehensive database on their number and technical performance. The relatively high number of individual on-site treatment systems is a key structural challenge in the Opolskie Voivodeship, for example, in the agglomeration of Kędzierzyn-Koźle. The use of such systems reduces the share of connected population and may affect formal compliance of agglomerations with UWWTD requirements, as according to national reporting rules, the load generated by residents using individual on-site treatment systems or septic tanks is not counted as sewered. Consequently, in agglomerations with characteristics similar to Kędzierzyn-Koźle, the increasing prevalence of on-site systems may pose a regulatory risk under the revised UWWTD framework.
In 2022, the municipality of Cisek was excluded from the agglomeration boundaries in which it was previously included, due to failure to meet the required indicator of 120 inhabitants/km of planned sewerage network (8.3 m/PE). Despite this adjustment, merely administrative, that reduced the reported agglomeration size, the actual equivalent population within that functional area may still, in the near future, approach or exceed regulatory thresholds due to demographic and infrastructural changes. Although the combined percentage of unconnected population currently remains relatively small, further expansion of decentralized systems may affect compliance indicators.
Table 9 shows a gradual increase in on-site treatment, accompanied by a slight decline in septic tank use, reflecting ongoing improvements in decentralized wastewater management [
21]. In the medium term, this could result in difficulties in maintaining the required PE thresholds and collection rates, potentially necessitating either expansion of the sewerage network or revision of agglomeration boundaries.
As presented in
Table 10, wastewater generation and sewerage coverage vary depending on the type of locality, reflecting differences in infrastructure development between urban and rural areas. In the table, “0” indicates localities where no wastewater was discharged to the collective sewerage system, either because the sewer network was not available, or because residents relied entirely on individual systems (e.g., septic tanks or on-site treatment systems).
The localities listed in
Table 10 are settlements/villages belonging to the Krapkowice Municipality, not separate municipalities. In this case, the item “Krapkowice” in the first line refers to the town itself, while the table includes the entire administrative area: the agglomeration for functional wastewater collection includes the town of Krapkowice and the surrounding villages connected (or planned to be connected) to the sewerage system. In eight localities within the Krapkowice Municipality region, no wastewater discharge records are available and no WWTPs are in operation; wastewater generated is not monitored and either conveyed to treatment facilities in neighboring municipalities, or to industrial facilities in the area accepting municipal wastewater. These installations are typically small-scale (1000–2000 PE) and, under revised UWWTD requirements, may need to adapt to more stringent treatment standards: a representative example is the Pokój WWTP, the only one serving the local sewered area, owned by the local correctional facility. The plant receives wastewater from approximately 400 residents of the village and 700 people associated with the correctional facility through an approximately 4 km long sewer. The nominal treatment capacity of the Pokój WWTP is 200 m
3/d, with a current load amounting to 1226 PE (design capacity 2105 PE, average hydraulic capacity is 250 m
3/d, with maximum of 26.7 m
3/h). The total volume of wastewater generated within the agglomeration amounts to approximately 68,000 m
3/y, versus a design capacity of 91,500 m
3/y, corresponding to an average daily flow of 186.3 m
3/d. Treated effluent is discharged into the local watercourse, under a water permit issued on 9 August 2016, valid until 8 August 2026. Selected pollution parameters of raw wastewater and treated effluent are summarized in
Table 11.
At present, treated wastewater complies with the requirements set out in the Polish Regulation of 12 July 2019. The Pokój WWTP, despite its small scale (1000–2000 PE), achieves effective organic matter removal (BOD
5 reduction >80%) and can therefore be considered a good practice example of a well-performing, small-scale facility. However, challenges may arise in other agglomerations within the same size range, particularly those characterized by dispersed settlement patterns and a high share of unsewered population. In such cases, a significant portion of wastewater may be delivered indirectly via septic tank hauling, which may complicate system operation, and compliance with future regulatory requirements. Small facilities of this type may require technical upgrades, or integration into larger agglomeration systems to ensure long-term compliance. In response to the lack of wastewater treatment infrastructure in selected municipalities, planned and implemented investments in non-sewered localities of the Krapkowice Municipality are summarized in
Table 12 [
20,
21].
4. Discussion
Data from the Opolskie Voivodeship show that WWTPs serving the largest agglomerations (>150,000 PE) are, to a significant extent, infrastructurally prepared to meet the new requirements, as the issue is not the lack of adequate sewerage systems, but rather the potential need to further improve treatment efficiency, in particular, once the criteria for quaternary treatment of micropollutants are established by the National authorities.
Quaternary treatment typically relies on sequestration and/or degradation processes: among the most effective and widely adopted technologies are adsorption (e.g., on activated carbon) [
32] and advanced oxidation processes (AOPs), either individually, or in combination [
16]. Quaternary treatment based on granular activated carbon (GAC) is a technologically simple, easily implementable, promising solution, but potentially expensive in the long term, due to the need for absorbent regeneration, replacement or disposal [
33,
34]. AOPs, such as, e.g., ozone, are energetically more intensive, may require initially higher initial investment and may induce only partial decomposition of some target micropollutants, generating potentially harmful byproducts [
35]. Comparative estimates between ozone-based AOPs and GAC treatment show costs ranging between 2 and 6 EUR/PE-y for the former and 3–7 EUR/PE-y for the latter, depending on required dosage and (for GAC) regeneration requirements [
16]. In this context, a comprehensive techno-economical and carbon footprint analysis of each option should be considered, encompassing both direct (CAPEX and OPEX) and indirect (GHG emissions) factors, considering that the UWWTD recast also addresses WWTPs’ energy and emissions efficiency operating aspects [
12]. In the case of a future designation of parts of Poland as micropollutant sensitive areas, removal shall be requested also for WWTPs with capacity >10,000 PE in those areas.
Facilities with capacity over 150,000 PE will be required to halve P emissions and cut N by 20% under the new limits; those between 100,000 and 150,000 will be subject to a reduction in P emissions of 30% and no change in N. Emission reduction could be achieved by the introduction of more efficient process control and automation in existing facilities in order to optimize removal [
36], or by upgrading them to more efficient removal processes, e.g., by converting conventional Modified Ludzack–Ettinger (MLE) processes to Anammox schemes [
37], and introducing enhanced biological P removal (EBPR) process schemes [
38]. However, due to the “encouragement” expressed in the Directive (Art. 20.1(b)) [
10], nutrient removal should be replaced by their recovery, adopting suitable process upgrading where possible [
39].
Perhaps those most affected by recast regulations will be the facilities servicing between 10,000 and 100,000 PE, which, especially in the lower size range (approximately 25,000 PE and below, as shown in
Figure 2), are often not designed for ENR. Nationwide upgrading of these facilities will likely be required; site-specific factors (existing system layout, space availability) will cause costs to vary significantly between plants with the same design capacities implementing similar upgrade configuration.
A study by the US EPA showed that costs for upgrade to enhanced nutrient removal (ENR) from conventional activated sludge (CAS) can vary more than tenfold, ranging from about USD 1.8 to 0.15 million per 1000 m
3/d capacity, in a capacity range between <4000 and >40,000 m
3/d, respectively [
40]. The difference in investment costs between CAS to ENR with conventional technologies (MLE for N and chemical precipitation for P) can be estimated as ≈216 EUR/PE served for a 10,000 PE WWTP and ≈112 EUR/PE at the 100,000 PE scale; therefore, it can be assumed that upgrade costs could be a bit higher than that; this will also increase the estimated energy demand for treatment from ≈25 kWh/PE/y for conventional secondary to ≈40 kWh/PE/y for tertiary treatment [
41].
Novel process technologies based on aerobic granular sludge (AGS) can achieve simultaneous carbon and nitrogen removal and while the better established technology is Nereda
®, several competing AGS processes can achieve similar results with benefits including lower energy use and smaller footprint. While it is difficult to estimate ex novo construction costs of such units (since they are proprietary technologies), they typically result in significant cost savings, with investment and operating costs that are often more than 25% lower than traditional options. Conversion from CAS to AGS may be achieved by retrofitting existing tanks, reducing the need for new construction; since AGS requires an up to 75% smaller footprint, there is the possibility of repurposing of existing volumes, or increasing capacity [
42]. Upgrading CAS facilities to AGS technology is an increasingly popular and relatively simple strategy to achieve higher organic matter and nitrogen removal efficiency (>95%), by reducing the aeration energy demand by over 60%, and minimizing sludge production, making wastewater treatment processes more economical to run in the long term [
43]. Similarly, traditional MLE tertiary processes may also be converted to AGS with considerable long-term energy savings and capacity increase.
ENR facilities could also benefit from introducing nutrient recovery schemes: N recovery from wastewater is more difficult than P recovery, since both MLE and AGS processes reduce this potential, as ammonia and nitrate are converted to gaseous N
2. On the other hand, P recovery can be achieved in the form of precipitated bioavailable P compounds [
39,
44]. At present, the best economically sustainable option to recover the fertilizer value of N and P in wastewater could be to limit their removal during treatment, and directly reuse effluents in agricultural fertigation, where possible. This option is offered by Art. 15.1 of the UWWTD [
10], where it contemplates the derogation from tertiary treatment requirements (specified in Table 2 of Annex I of the Directive [
10]), when treated urban wastewater is destined for reuse in agricultural irrigation. In practice, where such opportunity arises, WWTP need not remove nutrients that can benefit crop growth, with savings on treatment costs at the plant and, on the farmers’ side, of chemical fertilizer costs [
45]. It should be noted that in this case other provisions, such as those contained in Regulation EU/2020/741 also apply [
46].
Among existing agglomerations in the 2000–10,000 PE range, which constitute the majority at the national level, most WWTPs currently meet existing national standards. However, one issue in this PE range is presented by those agglomerations with low sewerage coverage, in which the share of unconnected population is still substantial. The extension of the lower compliance limit to 1000 PE may induce the administrative redefinition of existing agglomerations, with merging of currently unserviced areas into existing ones, leading to an increase in incoming loads to existing facilities. Detailed census and mapping efforts of all existing dischargers should be undertaken by the authorities in order to optimize and, if necessary, redefine administrative agglomeration boundaries under optimized criteria.
A far greater challenge concerns small and dispersed agglomerations, where a significant proportion of the population relies on individual plants or septic tanks. In order to assess the actual scale of the problem, it is first necessary to precisely determine the number of agglomerations in the 1000–2000 PE range. In these smaller enclaves, dispersed settlement patterns are most common, and the economic efficiency of conventional sewer network construction is lowest. In practical terms, this means that potentially several hundred agglomerations may require either the expansion of community sewerage systems, a formal revision of agglomeration boundaries leading to new aggregations, or the motivated derogation from UWWTD’s requirement under Art. 4 [
10].
The cost of implementing community sewerage in small, dispersed settlements is relatively higher, on a per capita basis, than in concentrated ones. Assuming an indicative cost of sewer construction of approximately 115 EUR/m [
30], and an average individual network length of a few to over ten kilometers in each locality, investment cost may span from 0.5 to well over EUR 1 million for an agglomeration in the 1000–2000 PE range, or approximately EUR 2500–5000 per person connected, several times higher than in densely populated urban areas. This could be partly addressed by the introduction of alternative sewerage paradigms to conventional gravity sewers, e.g., vacuum sewer technology, which allows substantial (≈30%) savings in infrastructure investment and operational costs compared to the former [
47]. Further savings from this technology could directly derive from the generation of more concentrated sewage, due to their lower water use, and smaller facilities could be designed to work on anaerobic technology (i.e., UASB) with dramatic capital costs and energy savings. UASB technology was demonstrated to work efficiently for organic matter removal also in unfavorable sub-mesophilic conditions [
48].
An alternative solution may consist of individual systems (on-site treatment based, e.g., on septic tanks with drainage, constructed wetlands, compact package activated sludge or MBR plants), with a typical unit cost of around EUR 4000–13,000 per household [
49]. Although this could be competitive compared to the cost of building extended community sewer infrastructures, their generalized use would reduce the sewerage connection metrics, and may complicate formal compliance with Article 3 requirements concerning collective wastewater collection systems [
10].
It is consequently clear that the greatest specific financial burden associated with the implementation of the new requirements will concern small and dispersed agglomerations, where infrastructure-specific costs per PE unit are the highest, while environmental benefits—although locally important—are relatively small and poorly significant at the national scale.
In light of the Directive’s planned implementation, it will thus be necessary to
Further expand sewerage networks of existing or redefined agglomerations; conventional sewerage technologies may not be optimally efficient in this respect. Alternatives should be considered;
Improve collection systems for transported (hauled) wastewater; in some municipalities the high share of wastewater delivered by septic tank trucks may imply poor control over incoming WWTP influents, making it difficult to achieve steady-state performance and maintain consistent environmental standards;
Improve WWTP treatment efficiency, adapting process technology to the new discharge limits with particular consideration to maximizing their energy efficiency and possibility of resources (nutrients, energy) recovery;
Increase control over individual facilities, with regular system inspection and performance checks implemented.
From the perspective of EU water policy, reducing nutrient inflow into the Oder River—and consequently to the Baltic Sea—is of particular importance. This means that upgrading systems in agglomerations of size >10,000 PE will be significant not just locally, but also at a supra-regional level. Current regulatory provisions constitute the legal background for the identification of the compliance gaps summarized in
Table 13. The gaps observed at the small WWTP level —particularly nutrient-removal efficiency, monitoring, and operational performance—reflect the increasing scope and stringency of the Directive’s obligations, especially for smaller and structurally dispersed systems. Two specific examples, namely the Krapkowice municipality and the Kędzierzyn Kożle municipality were analyzed in detail to assess the required intervention to achieve compliance with future regulations.
The analysis indicates that implementation of the Directive in the Opolskie Voivodeship should follow a multiple-track approach: in very large systems, it would focus on WWTPs technological modernization, with optimization or extension of tertiary treatment, and introduction of quaternary processes; in medium–large facilities (10,000 PE and above) refinement and upgrading of tertiary treatment will be necessary, while in the smaller agglomerations efforts should concentrate on expanding collection systems and reducing the share of individual systems, where possible.