Article

Environmental Regulation, Industrial Agglomeration and Water Environmental Governance: A Province-Based Analysis in China

by
Junyuan Liu
1,2,
Jingjun Li
3,
Hui Miao
4,
Xiujuan Guo
4,
Guojun Hao
5 and
Changxin Xu
2,6,*
1
College of Harbor, Coastal and Offshore Engineering, Hohai University, Nanjing 210024, China
2
Jiangsu Research Center for Coastal Resources and Economy, Hohai University, Nanjing 211100, China
3
China Harbour Engineering Company Ltd., Beijing 100088, China
4
CCCC Fourth Harbor Engineering Investigation and Design Institute Co., Ltd., Guangzhou 510230, China
5
Guangdong Provincial Transport Planning and Research Center, Guangzhou 510635, China
6
Business School, Hohai University, Nanjing 211100, China
*
Author to whom correspondence should be addressed.
Water 2026, 18(11), 1297; https://doi.org/10.3390/w18111297
Submission received: 11 April 2026 / Revised: 21 May 2026 / Accepted: 25 May 2026 / Published: 27 May 2026

Abstract

Against the background of increasing pressure on water environmental protection and regional industrial transformation, water environmental governance (WEG) is jointly shaped by environmental regulation and industrial agglomeration. However, the mechanisms underlying this relationship remain insufficiently examined. Based on provincial-level data from China, this study uses fixed-effects models and spatial econometric models to examine the effects of environmental regulation on WEG. The results show a clear threshold pattern. When the environmental regulation index exceeds 0.3, its positive association with WEG begins to emerge. Basin-location analysis indicates that downstream regions may require stronger environmental regulation to improve WEG. Spatial analysis reveals positive spillover effects under both the contiguity weight matrix and the basin-adjacency weight matrix. Mechanism analysis further shows that environmental regulation is negatively associated with WEG through the specialized agglomeration of pollution-intensive industries. It is also positively associated with WEG through upstream and downstream linkage agglomeration in the clean industrial chain. Future research could further explore micro-level mechanisms and cross-regional linkages to provide deeper evidence for improving WEG.

1. Introduction

Water environmental governance (WEG) is a central issue in global environmental governance. The deterioration of water environments threatens ecological security, economic development quality, and social stability [1]. Since the beginning of the twenty-first century, China has made sustained efforts to prevent and control water pollution and has introduced a series of basin-level policies for the development, utilization, and protection of water resources [2]. During the Eleventh Five-Year Plan period, China introduced binding reduction targets for major water pollutants, including chemical oxygen demand, marking a shift toward quantified assessment in WEG [3]. In terms of basin governance, China has gradually promoted reforms of the basin management system to address regional fragmentation through hierarchical management, cross-regional coordination, and multi-actor collaboration.
Although China’s WEG system has continued to improve, substantial practical challenges remain. On the one hand, multiple pollution sources overlap, including industrial wastewater discharge, agricultural non-point source pollution, and urban domestic sewage, which jointly increase the complexity of WEG. On the other hand, governance outcomes also depend on local governance capacity, policy enforcement, and cross-regional coordination [4]. This problem is particularly evident in some economically developed coastal and central regions, where heavily polluting industries, such as chemicals, steel, and paper manufacturing, are highly concentrated [5]. As a result, pollutant discharge shows clear spatial clustering. Such industrial agglomeration not only increases local water pollution pressure but may also affect WEG in surrounding areas through industrial relocation and pollution diffusion. Therefore, the analysis of WEG should not focus only on pollutant discharge but also examine the interactions among environmental regulation, industrial agglomeration, and regional spatial linkages.
Environmental regulation is an important policy tool for addressing the negative externalities of environmental pollution and a key institutional arrangement for improving WEG [6]. As a major form of social regulation, environmental regulation is generally understood as government intervention in firms’ pollution-related behavior, including administrative orders, economic incentives, governance investment, and regulatory supervision. Appropriate environmental regulation can increase the cost of pollutant discharge and encourage firms to adopt cleaner production technologies [7]. It may also motivate local governments to strengthen pollution control and increase environmental protection investment, thereby improving WEG. However, the effects of environmental regulation are not necessarily linear. When regulatory intensity is too low, policy constraints may be insufficient to change firms’ pollution behavior [8]. When regulatory intensity is too high, regulation may increase production costs and induce firms to reduce production, adopt avoidance strategies, or relocate to regions with weaker regulation [9]. Therefore, the effect of environmental regulation on WEG may be non-linear and may also depend on the spatial distribution of industries and the strength of regional linkages.
Industrial agglomeration provides an important perspective for understanding the effects of environmental regulation. In general, industrial agglomeration may improve resource use efficiency through knowledge spillovers, shared infrastructure, and specialized division of labor [10], thereby contributing to WEG. At the same time, industrial agglomeration may concentrate pollution sources and increase regional environmental pressure [11]. This problem is especially salient when heavily polluting industries are highly clustered in specific regions. In such cases, pollutant discharge becomes spatially concentrated, making WEG more difficult. More importantly, environmental regulation itself can affect firms’ location choices. When the marginal benefits of pollution control exceed the marginal costs, firms may actively comply with regulatory requirements and improve environmental performance through technological upgrading. By contrast, when compliance costs exceed expected benefits, firms may reduce production or relocate to regions with weaker regulation [12]. Such location adjustment may further reshape the pattern of industrial agglomeration and exert an indirect effect on WEG.
WEG also exhibits clear spatial dependence. Water flows across administrative boundaries, meaning that pollution discharge and governance actions in one region may affect neighboring regions as well as upstream and downstream areas. This feature is particularly important at the basin scale. The industrial layout, pollution discharge, and regulatory intensity of upstream regions may directly influence WEG in middle and downstream regions [13]. Thus, WEG is not only a local environmental management issue but also a comprehensive governance problem with strong cross-regional externalities. If spatial dependence and regional linkages are ignored, it may be difficult to identify the true effect of environmental regulation on WEG.
Accordingly, this study has three main objectives. First, it systematically examines the effects of environmental regulation on WEG and identifies the potential non-linear relationship between environmental regulation and WEG. Second, it analyzes the spatial spillover effects of environmental regulation on WEG and further explores spatial linkages and regional heterogeneity between upstream and downstream basin regions. Third, it incorporates industrial agglomeration into the analytical framework and examines the transmission roles of specialized industrial agglomeration and industrial-chain-related agglomeration in the relationship between environmental regulation and WEG. In doing so, this study reveals the internal links among environmental regulation, industrial spatial organization, and WEG.
To achieve these research objectives, this study uses China’s 27 provinces as the research sample and draws on provincial panel data from 2006 to 2022 to examine the relationships among environmental regulation, industrial agglomeration, and WEG. In terms of variable construction, this study classifies environmental regulation into four types: total-control regulation, quality-based regulation, project-based regulation, and governance-based regulation. This classification allows us to identify the heterogeneous effects of different regulatory tools. In addition, this study constructs a composite index of WEG based on indicators of water pollution pressure and water environmental quality. This index measures the overall performance of water environmental improvement across regions, with higher values indicating higher levels of WEG. In terms of methodology, this study first uses a panel model to examine the effect of environmental regulation on WEG and then introduces spatial econometric models to analyze spatial dependence and spatial spillover effects. Furthermore, industrial agglomeration is incorporated into the analytical framework to examine the transmission roles of specialized industrial agglomeration and industrial-chain-related agglomeration. Finally, this study considers differences between upstream and downstream basin regions to further analyze the heterogeneity of regulatory effects.
This study makes the following innovations and extensions to the existing literature. First, although existing studies have examined environmental regulation and environmental governance, most of them treat environmental regulation as a single overall indicator [14,15]. This makes it difficult to identify the heterogeneous effects of different regulatory tools. To address this limitation, this study constructs an environmental regulation index from four dimensions: total-control regulation, quality-based regulation, project-based regulation, and governance-based regulation. This allows us to more comprehensively examine how different types of environmental regulation affect WEG.
Second, existing studies mainly explain the effects of environmental regulation from the perspectives of pollution transfer or green innovation [16,17]. However, the transmission role of industrial agglomeration remains insufficiently examined, especially the distinction between specialized industrial agglomeration and industrial-chain-related agglomeration. To fill this gap, this study incorporates both types of industrial agglomeration into a unified analytical framework and examines their mediating roles in the relationship between environmental regulation and WEG.
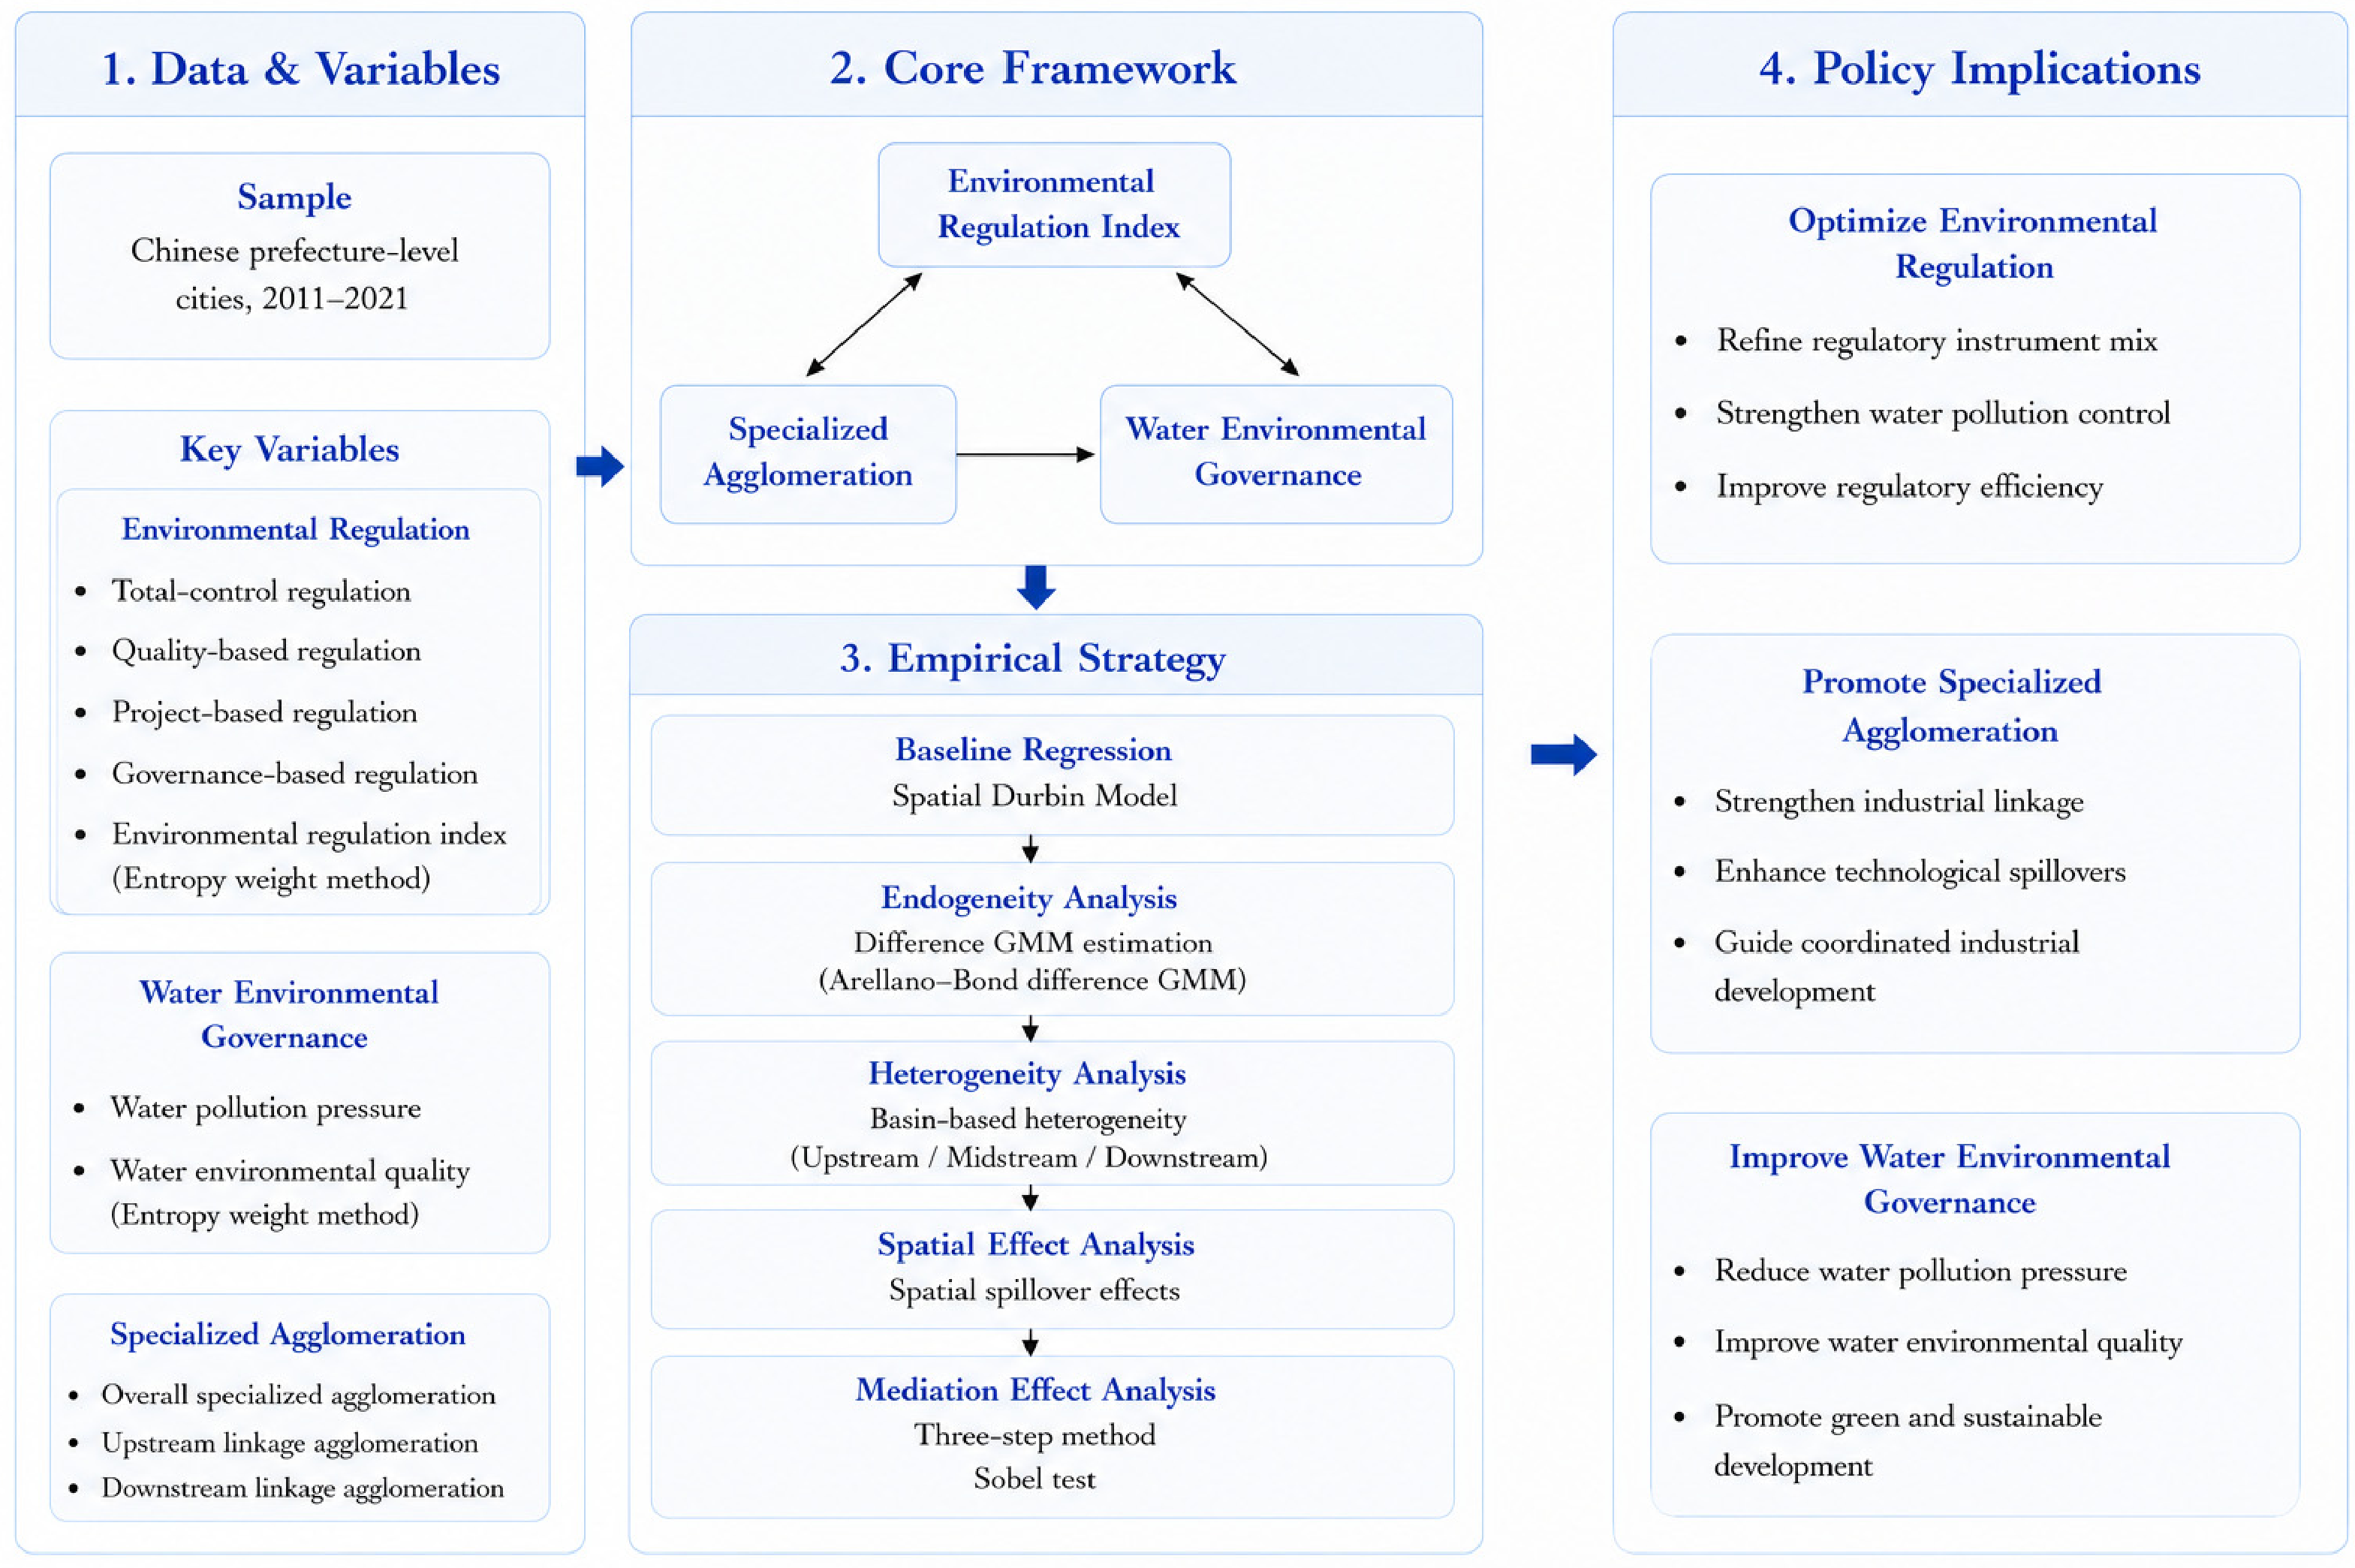
Third, some existing studies have not fully considered the spatial dependence and basin-level externalities of WEG [18,19]. As a result, the spatial spillover effects of environmental regulation and the heterogeneity between upstream and downstream basin regions remain insufficiently understood. To extend this literature, this study introduces spatial econometric models to examine spatial spillover effects and further analyzes regional heterogeneity from the perspective of upstream and downstream basin locations. The research framework is shown in Figure 1.

2. Literature Review

2.1. Environmental Regulation and Water Pollution Transfer

The impact of environmental regulation on pollution transfer has long been a major concern in environmental economics. Existing studies frequently draw on the pollution haven hypothesis [20], which suggests that differences in environmental regulation may influence firms’ location choices. When environmental regulation becomes more stringent in a particular region, firms face higher pollution-control costs. For highly polluting and high-emission firms, these additional costs may weaken the incentive to continue production in that region. Consequently, firms may relocate, adjust production capacity, or transfer pollution-intensive activities to regions with relatively weaker environmental regulation [21]. Under such circumstances, pollution is not necessarily reduced overall but instead redistributed across regions.
This perspective emphasizes the negative spatial spillover effects of environmental regulation. Although stricter regulation may improve local environmental quality [15], it may simultaneously increase pollution pressure in other regions. This phenomenon is more likely to occur when regions differ substantially in terms of economic development, environmental supervision, and industrial absorption capacity. Less-developed regions may become destinations for pollution-intensive industries because of lower regulatory standards and lower production costs. Such pollution transfer weakens the overall effectiveness of environmental regulation and may further exacerbate regional environmental inequality.
However, the pollution haven hypothesis cannot fully explain the overall effects of environmental regulation [21]. On the one hand, firms’ relocation decisions are not determined solely by environmental governance costs but are also influenced by market size, labor costs, industrial support systems, transportation conditions, and local policy incentives. On the other hand, stricter environmental regulation may induce firms to upgrade technology rather than simply relocate [22]. Therefore, interpreting environmental regulation solely from the perspective of pollution transfer may underestimate firms’ adaptive responses and the role of technological innovation.

2.2. Environmental Regulation and Green Innovation

Unlike the pollution haven hypothesis, another stream of literature draws on the Porter hypothesis and emphasizes the innovation-inducing effects of environmental regulation. This perspective argues that well-designed environmental regulation does not necessarily undermine firms’ competitiveness [23]. Instead, it may encourage firms to reallocate resources, accelerate the development of cleaner production technologies, and improve energy and resource-use efficiency [24]. Through green technological innovation, firms may satisfy environmental constraints while simultaneously enhancing production efficiency. In this way, environmental and economic performance can potentially improve simultaneously.
From this perspective, environmental regulation functions not only as a constraint mechanism but also as an incentive mechanism. By increasing the explicit costs of pollutant discharge, environmental regulation can reshape firms’ cost–benefit structures [25]. It may also encourage firms to invest in energy conservation, emission reduction, end-of-pipe treatment, and cleaner production technologies. At the governmental level, environmental regulation may stimulate governance investment and improve governance capacity, thereby enhancing regional environmental governance performance.
Nevertheless, the green innovation effect is not unconditional. Whether environmental regulation promotes technological innovation depends on factors such as regulatory intensity, policy stability, firms’ R&D capabilities, and financing conditions [26]. When regulatory intensity is too weak, firms may lack sufficient incentives to engage in green technological upgrading. Conversely, excessively stringent regulation may impose substantial compliance costs, crowding out R&D investment or even inducing avoidance and relocation strategies. Therefore, the effect of environmental regulation on environmental governance may not follow a simple linear pattern but instead exhibit stage-dependent and conditional characteristics.

2.3. Industrial Agglomeration and WEG

Industrial agglomeration is an important factor influencing environmental governance outcomes. Existing studies generally suggest that industrial agglomeration may affect environmental performance through two contrasting mechanisms. On the one hand, industrial agglomeration can generate economies of scale, knowledge spillovers, shared infrastructure, and specialized division of labor. These factors may improve resource-use efficiency, reduce pollution emissions per unit of output, and facilitate the diffusion of green technologies [27]. In regions with well-developed industrial support systems and strong governance capacity, industrial agglomeration may therefore contribute to improvements in WEG.
On the other hand, industrial agglomeration may intensify environmental pressure. When pollution-intensive industries are highly concentrated in specific regions, pollutant emissions tend to exhibit clear spatial clustering patterns [5]. Under such conditions, regional environmental carrying capacity may face increasing pressure, making WEG more difficult. Furthermore, when local governments rely heavily on pollution-intensive industries for economic growth, industrial agglomeration may weaken environmental supervision and further aggravate pollution problems [17].
It should also be noted that industrial agglomeration is not homogeneous. Different forms of agglomeration may generate distinct environmental effects. Specialized industrial agglomeration emphasizes the concentration of similar industries within particular regions. While this may promote specialized division of labor and improve production efficiency, it may also concentrate similar pollution sources [28]. By contrast, industrial-chain-related agglomeration emphasizes spatial coordination among upstream and downstream industries. This form of agglomeration may improve governance efficiency through industrial support, technological diffusion, and resource recycling [29]. Therefore, analyses of the relationship between industrial agglomeration and WEG should distinguish between different forms of agglomeration.

2.4. Environmental Regulation, Industrial Agglomeration and WEG

Environmental regulation is closely associated with industrial agglomeration. It affects not only firms’ pollution-control behavior but also their location choices and the spatial distribution of industries [30]. When environmental regulation alters firms’ production and compliance costs, firms may respond through technological upgrading, capacity adjustment, or spatial relocation. These responses may subsequently reshape patterns of industrial agglomeration and ultimately influence regional WEG [27].
From the perspective of WEG, the effects of environmental regulation are particularly complex. Because water flows across regional boundaries [19], pollution discharge and governance actions often extend beyond administrative jurisdictions. The industrial layout, pollutant discharge, and regulatory intensity of one region may therefore influence WEG in neighboring, upstream, or downstream regions [31]. Consequently, the effects of environmental regulation on WEG are not limited to local impacts but may also involve significant spatial spillover effects.

2.5. Research Gaps

Existing studies provide an important foundation for understanding the relationships among environmental regulation, industrial agglomeration, and environmental governance. Nevertheless, several important issues remain insufficiently explored. First, insufficient attention has been paid to different types of environmental regulation, making it difficult to identify the heterogeneous effects of different regulatory instruments on WEG. Second, the transmission role of industrial agglomeration in the relationship between environmental regulation and WEG remains underexamined. In particular, relatively few studies distinguish between specialized industrial agglomeration and industrial-chain-related agglomeration. Third, some studies overlook the spatial dependence and basin-level externalities of WEG, thereby limiting their ability to explain pollution transfer and governance spillover effects.
Based on these research gaps, this study extends the existing literature in several ways. First, it classifies environmental regulation into four dimensions: total-control regulation, quality-based regulation, project-based regulation, and governance-based regulation. This classification enables a more comprehensive identification of the heterogeneous effects of different regulatory instruments on WEG. Second, this study constructs a composite WEG index based on indicators of water pollution pressure and water environmental quality. The index measures the overall governance performance associated with controlling water pollution pressure and improving water environmental quality. Third, this study incorporates industrial agglomeration into the analytical framework linking environmental regulation and WEG. It further distinguishes between specialized industrial agglomeration and industrial-chain-related agglomeration, thereby revealing the industrial-spatial transmission mechanisms underlying environmental regulation and WEG. Finally, this study introduces spatial econometric models to examine the spatial spillover effects of environmental regulation on WEG and further considers differences between upstream and downstream basin regions to analyze regional heterogeneity.

3. Materials and Methods

3.1. Study Area and Data Sources

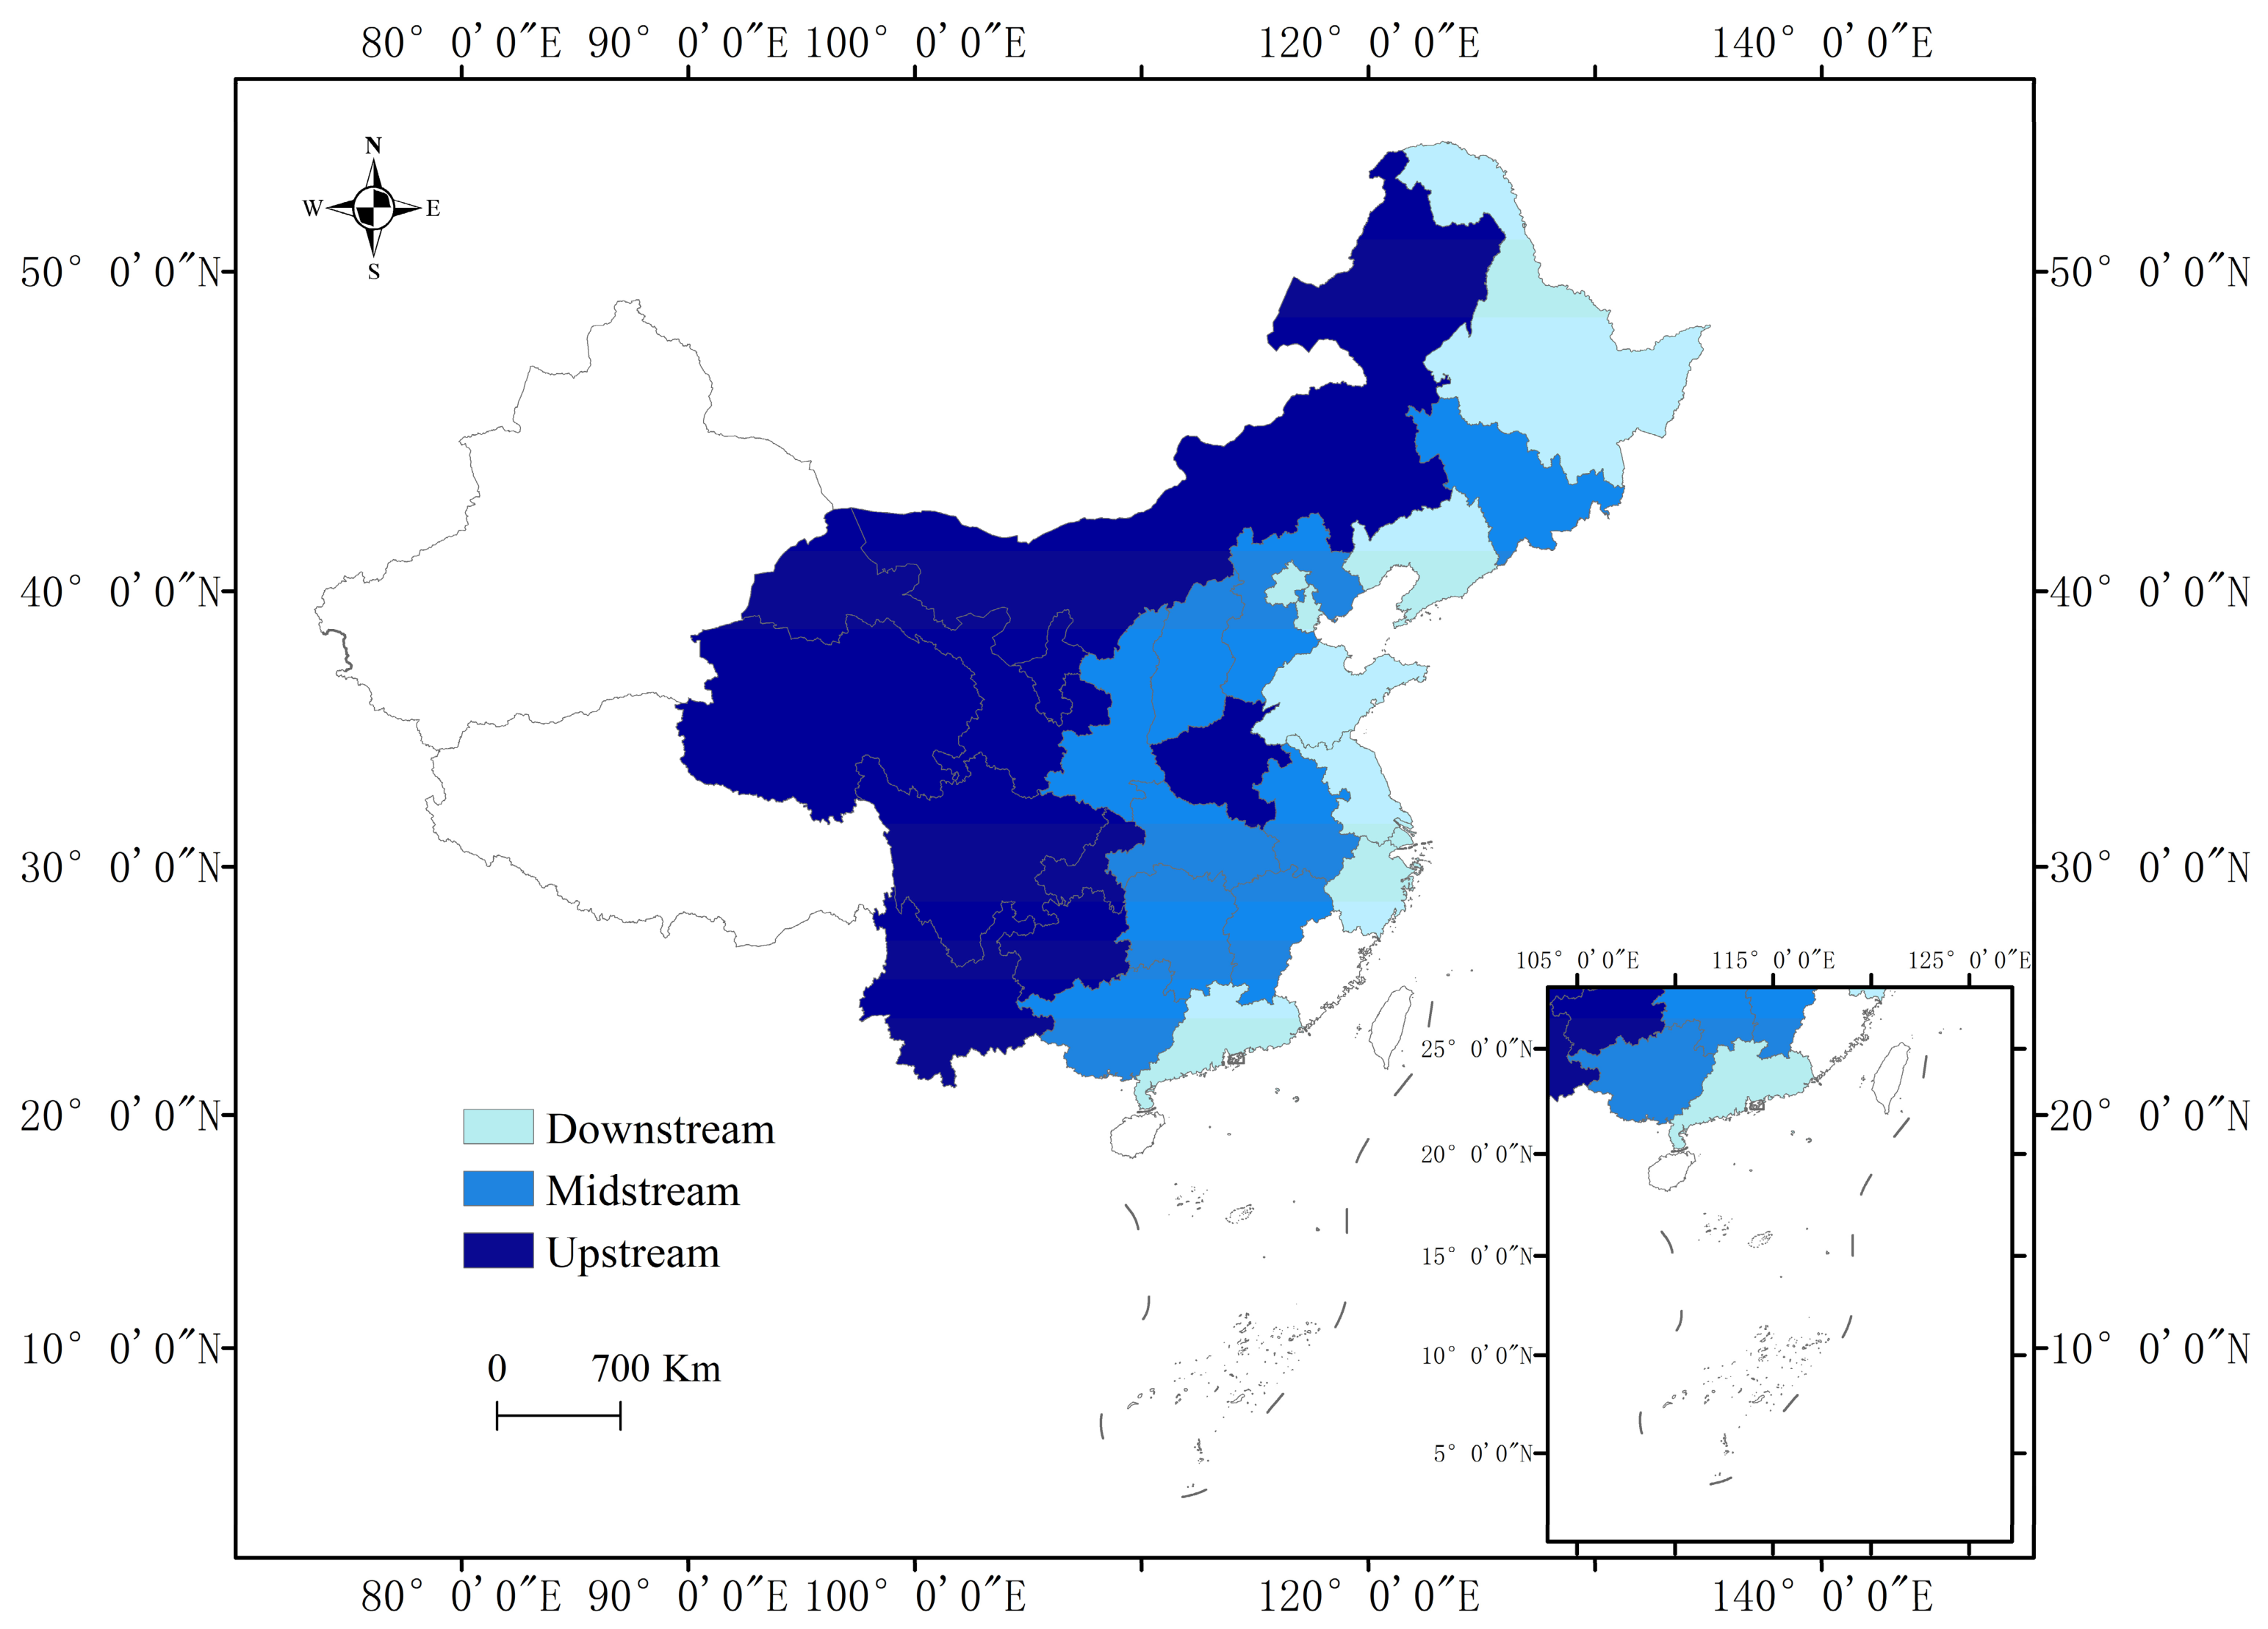
China’s major river basins primarily include the Yangtze River, Yellow River, Pearl River, Huai River, Hai River, Liao River, and Songhua River basins, covering 27 provincial-level administrative regions. Based on the upstream and downstream locations within these major river basins, the provinces are further classified into different basin-position groups. The classification results are presented in Figure 2. Spatial visualization and map rendering are conducted using ArcGIS (version 10.7).
This study constructs a provincial panel dataset covering 27 Chinese provinces from 2006 to 2022. Data on environmental regulation are mainly obtained from policy texts, the China Environment Yearbook, and the China Environmental Statistics Yearbook. Specifically, information on surface-water environmental monitoring sections is collected from the China Environment Yearbook, while data on industrial wastewater treatment facilities and investment in industrial wastewater treatment projects are obtained from the China Environmental Statistics Yearbook. Water-resource indicators, including industrial water use and total water resources, are also drawn from the China Environmental Statistics Yearbook. Other control variables are collected from the China Statistical Yearbook and provincial statistical yearbooks. Table 1 reports the descriptive statistics of the main variables. This table reports the definitions and variable names of the key variables used in the subsequent empirical analysis.

3.2. Variable Construction

3.2.1. Environmental Regulation

Existing studies often use difference-in-differences models to evaluate environmental regulation as a specific policy shock [36]. Although this approach is useful for identifying the causal effect of a particular policy, it may not fully capture the continuous and multidimensional nature of environmental regulation. In the context of water environmental governance, regulation usually involves a combination of instruments rather than a single policy intervention.
To provide a more comprehensive measure of environmental regulation, this study classifies it into four categories: total-control regulation (R1), quality-based regulation (R2), project-based regulation (R3), and governance-based regulation (R4). The entropy weight method is then applied to standardize and aggregate the indicators within each category. The specific indicators are presented in Table 2.

3.2.2. WEG

This study constructs a composite index of WEG from two dimensions: water pollution pressure and water environmental quality, as shown in Table 3. The water pollution pressure dimension includes industrial wastewater discharge (WP1), industrial chemical oxygen demand discharge (WP2), and industrial ammonia nitrogen discharge (WP3). The water environmental quality dimension includes water quality category (WQ1), permanganate index (WQ2), and ammonia nitrogen index (WQ3). WP1–WP3 measure industrial pollution discharge pressure, whereas WQ1–WQ3 reflect the status of water environmental quality [6,11]. Given differences in units and indicator attributes, all indicators are first standardized and directionally adjusted to ensure comparability. The entropy weight method is then applied to determine indicator weights and construct the composite WEG index. A higher index value indicates a higher level of WEG.
Based on the influencing factors identified in the literature review, this study further selects control variables from four dimensions: cost factors, market factors, policy factors, and other factors [34,35]. Cost factors include labor costs and fixed-asset relocation costs. Market factors include economic development level, industrial structure, and regional population size. Policy factors include domestic openness, external openness, and fiscal decentralization. Other factors include technological innovation and natural climatic conditions. These control variables are included to account for regional differences in economic development, industrial structure, policy environment, and natural conditions that may affect WEG.

3.2.3. Industrial Agglomeration

This paper adopts location entropy to examine the degree of regional industrial agglomeration; the expression is shown in Equation (1) [12,13]. lij represents the total number of workers employed by industrial enterprises above scale in industry j in region i, and Li represents the total number of workers employed by industrial enterprises above scale in region i.
W A G G i j = l i j / L i l i j / L i
In measuring the degree of associated agglomeration of upstream and downstream firms, drawing on the methodology of existing study [32,33], assuming that the output value of the products of polluting industry j using clean industry m in the total input of industry j in region i within the watershed is σjm, and at the same time, the output value of the products of polluting industry j using clean industry m in the total output value of industry j is μjm, we can get the upstream (AGG_uij) and downstream (AGG_dij) correlation agglomeration of the cleaner industry chain of polluting industry j in region i within the watershed level respectively:
AGG_u i j = m , m j σ j m W A G G i j  
A G G d i j = m , m j μ j m W A G G i j
According to the National Economic Industry Classification, industries above the mean value are defined as heavy pollution industries, and the distribution of WP1, WP2 and WP3 three types of pollution industries are obtained respectively. If two types of pollutants and above of an industry show heavy pollution pattern, it is set as water environment pollution intensive industry, intensive enterprises as shown in Table 4.

3.3. Methodologies

3.3.1. Model Building

Environmental regulation is included in the regression equation as the main explanatory variable. Its squared term is introduced to capture the potential nonlinear relationship between environmental regulation and water environmental governance. Following existing research [37]. The baseline regression model and the stepwise mediation test models are specified as follows:
l n W E G i t = α 1 l n R i t 2 + α 2 l n R i t + α 3 l n A i t 2 + α 4 l n A i t + α 5 l n X i t + μ i t
l n W A G G i t = α 1 l n R i t 2 + α 2 l n R i t + α 3 l n A i t 2 + α 4 l n A i t + α 5 l n X i t + μ i t
l n W E G i t = α 1 W A G G i t + α 2 l n R i t 2 + α 3 l n R i t + α 4 l n A i t 2 + α 5 l n A i t + α 6 l n X i t + μ i t
WEGit represents the level of water environmental governance in region i during period t. Rit denotes the intensity of environmental regulation in area i in year t, Ait represents affluence, proxied by GDP per capita, Xit represents social and natural drivers, WAGGit represents the level of specialization agglomeration in area i in year t, α1, α2, α3, α4, α5 represents the parameter being estimated, μit represents a random perturbation term.
Combining the nonlinear regression model in Equation (4), the SDM effects of environmental regulation on water environmental governance are modeled as below [38].
l n W E G i t = η w i t l n W E G i t + α 1 l n R i t 2 + α 2 l n R i t + α 3 l n A i t 2 + α 4 l n A i t + α 5 l n X i t + μ i t + θ 1 w i j l n R i j + θ 2 w i j l n A i j + θ 3 w i j l n X i j + μ i + λ t + ε i t

3.3.2. Spatial Autocorrelation Analysis

In order to study the pollution externalities arising from the effects of different types of environmental regulatory measures among watershed regions, two types of matrices are used to characterize the spatial interactions among regions [38,39]. Matrix W1 is the base matrix constructed based on the neighboring relationship between regions, which takes the form of Equation (8):
W 1 = 1   Existence   of   common   borders   in   areas   i   and   j 0                                     other                                          
To capture differences in upstream and downstream locations within river basins, this study constructs a basin-attribute contiguity weight matrix based on the conventional contiguity weight matrix. Specifically, considering that upstream regions have more direct impacts on the water environment of midstream and downstream regions, the relationship between upstream provinces and midstream or downstream provinces is defined as spatial adjacency and assigned a value of 1 [4,38]. In contrast, midstream and downstream provinces are treated as receiving areas within the same basin, and no spatial correlation is assigned between them, with a value of 0. In this way, a spatial weight matrix that reflects upstream–downstream basin attributes is obtained.
W 2 = 1           u p s t r e a m d o w n s t r e a m   a d j a c e n c y 0     other    
Moran’s I is a statistical measure used to quantify spatial autocorrelation, which is mainly used in spatial analysis to help reveal spatial aggregation phenomena in geographic data [39]. Its expression is shown in Equation (10):
I = N W c = 1 N i = 1 N W c i ( x c x ¯ ) ( x i x ¯ ) c = 1 N ( x c x ¯ ) 2

4. Results and Discussion

4.1. Spatial Autocorrelation Test

River basins often extend across multiple provinces, meaning that environmental regulation and WEG are unlikely to be spatially independent. As shown in Table 5, watershed environmental regulation exhibits a certain degree of spatial correlation under different spatial weight matrices. In particular, positive spatial correlation is observed under both the contiguity weight matrix and the geographic distance weight matrix.
This pattern can be attributed mainly to the cross-regional externalities of water pollution. Pollution discharge and governance intensity in upstream regions may affect water quality in downstream regions. Consequently, neighboring regions, as well as regions within the same basin, often need to adopt similar or coordinated environmental regulation measures. These findings suggest that watershed environmental regulation exhibits clear spatial linkage characteristics.

4.2. Analysis of the Impact of Environmental Regulation on Water Environmental Governance

The LLC unit root test is first conducted to examine the stationarity of the variables over the sample period. The results indicate that all variables are stationary. The Hausman test is subsequently performed to determine the appropriate model specification, and the test results support the use of the fixed-effects model. The estimation results are reported in Table 6.
Overall, the coefficient of environmental regulation is −0.62, whereas the coefficient of its squared term is 1.03, indicating a significant U-shaped relationship between environmental regulation and WEG. In addition, the estimation results for the four sub-indices of environmental regulation are also reported, and the findings are broadly consistent with the baseline results. Based on the estimated coefficients, the turning point is approximately 0.30, calculated as −(−0.62)/(2 × 1.03) ≈ 0.30. This finding suggests that when the environmental regulation index is below 0.30, environmental regulation is not significantly associated with improvements in WEG. However, once the regulation index exceeds this threshold, a positive association gradually emerges.
Regarding the control variables, economic development exhibits an inverted U-shaped relationship with WEG. When per capita GDP reaches a certain level, economic growth may attract population inflows and increase domestic pollutant emissions, thereby placing additional pressure on the water environment.
The coefficient of fiscal decentralization is −1.82, suggesting a negative association between fiscal decentralization and WEG. This finding is consistent with the possibility of a “race to the bottom” among local governments. In pursuit of economic growth, local governments may weaken environmental governance or tolerate pollution-intensive activities, thereby reducing WEG performance.
In addition, industrial development is highly competitive, making technological progress particularly important. R&D investment is generally associated with technological innovation in production processes and may further promote the development of cleaner and more environmentally friendly technologies and equipment. These improvements may contribute to better control of water pollutants during both the production and emission stages, thereby reducing the negative environmental pressure generated by industrial activities.
After examining the relationship between environmental regulation and WEG using the fixed-effects model, this study further employs the difference GMM method to address potential endogeneity arising from reverse causality. Specifically, the lagged dependent variable is introduced into the model to control for the dynamic persistence of WEG and mitigate potential endogeneity bias in column (6). The GMM results show that the AR(1) test is significant, whereas the AR(2) test is insignificant, indicating the presence of first-order serial correlation but the absence of second-order serial correlation. In addition, the Hansen test fails to reject the null hypothesis of instrument validity, suggesting that the instruments are valid overall. The estimation results continue to support a U-shaped relationship between environmental regulation and WEG, indicating that the baseline findings remain robust after accounting for dynamic effects and potential endogeneity.

4.3. Heterogeneity Discussion

Considering differences in regional development and regulatory standards, the effect of environmental regulation on WEG may vary across basin locations. Therefore, this study further divides the sample into upstream, midstream, and downstream regions. The results are reported in Table 7.
The estimation results show a U-shaped relationship between environmental regulation and WEG in all three regions. The turning points are 0.32, 0.33, and 0.39 for the upstream, midstream, and downstream regions, respectively. This indicates that the positive association between environmental regulation and WEG emerges only after regulatory intensity reaches a certain threshold. Among the three regions, the downstream region has the highest threshold, suggesting that stronger regulation may be required for environmental regulation to improve WEG in downstream areas.
One possible explanation is that downstream regions usually experience faster economic growth, host a higher concentration of large-scale enterprises, and generate greater water use and wastewater discharge from production activities. These characteristics increase the difficulty of local WEG and therefore require stronger regulatory intervention.

4.4. Tests for Spatial Spillover Effects

After examining the local effect of environmental regulation on WEG, this study further investigates its spatial spillover effects. Based on the LM, LR, Wald, and Hausman test results, the spatial Durbin model (SDM) with time fixed effects is selected for estimation. The test results are reported in Table 8.
After further accounting for spatial dependence, the relationship between environmental regulation and WEG remains significantly non-linear (Table 9). Specifically, under the contiguity spatial weight matrix and the basin-attribute spatial weight matrix, the turning points of environmental regulation are 0.37 and 0.31, respectively. This suggests that the positive association between environmental regulation and WEG gradually emerges only after regulatory intensity exceeds a certain threshold.
In addition, environmental regulation shows positive spatial spillover effects under both spatial weight matrices, with coefficients of 0.18 and 0.82, respectively. This indicates that stronger environmental regulation in one region is associated not only with higher local WEG but also with improved WEG in neighboring regions or other regions within the same basin through regional linkages and basin-level coordination mechanisms.

4.5. Measurement Results of Industrial Agglomeration Level

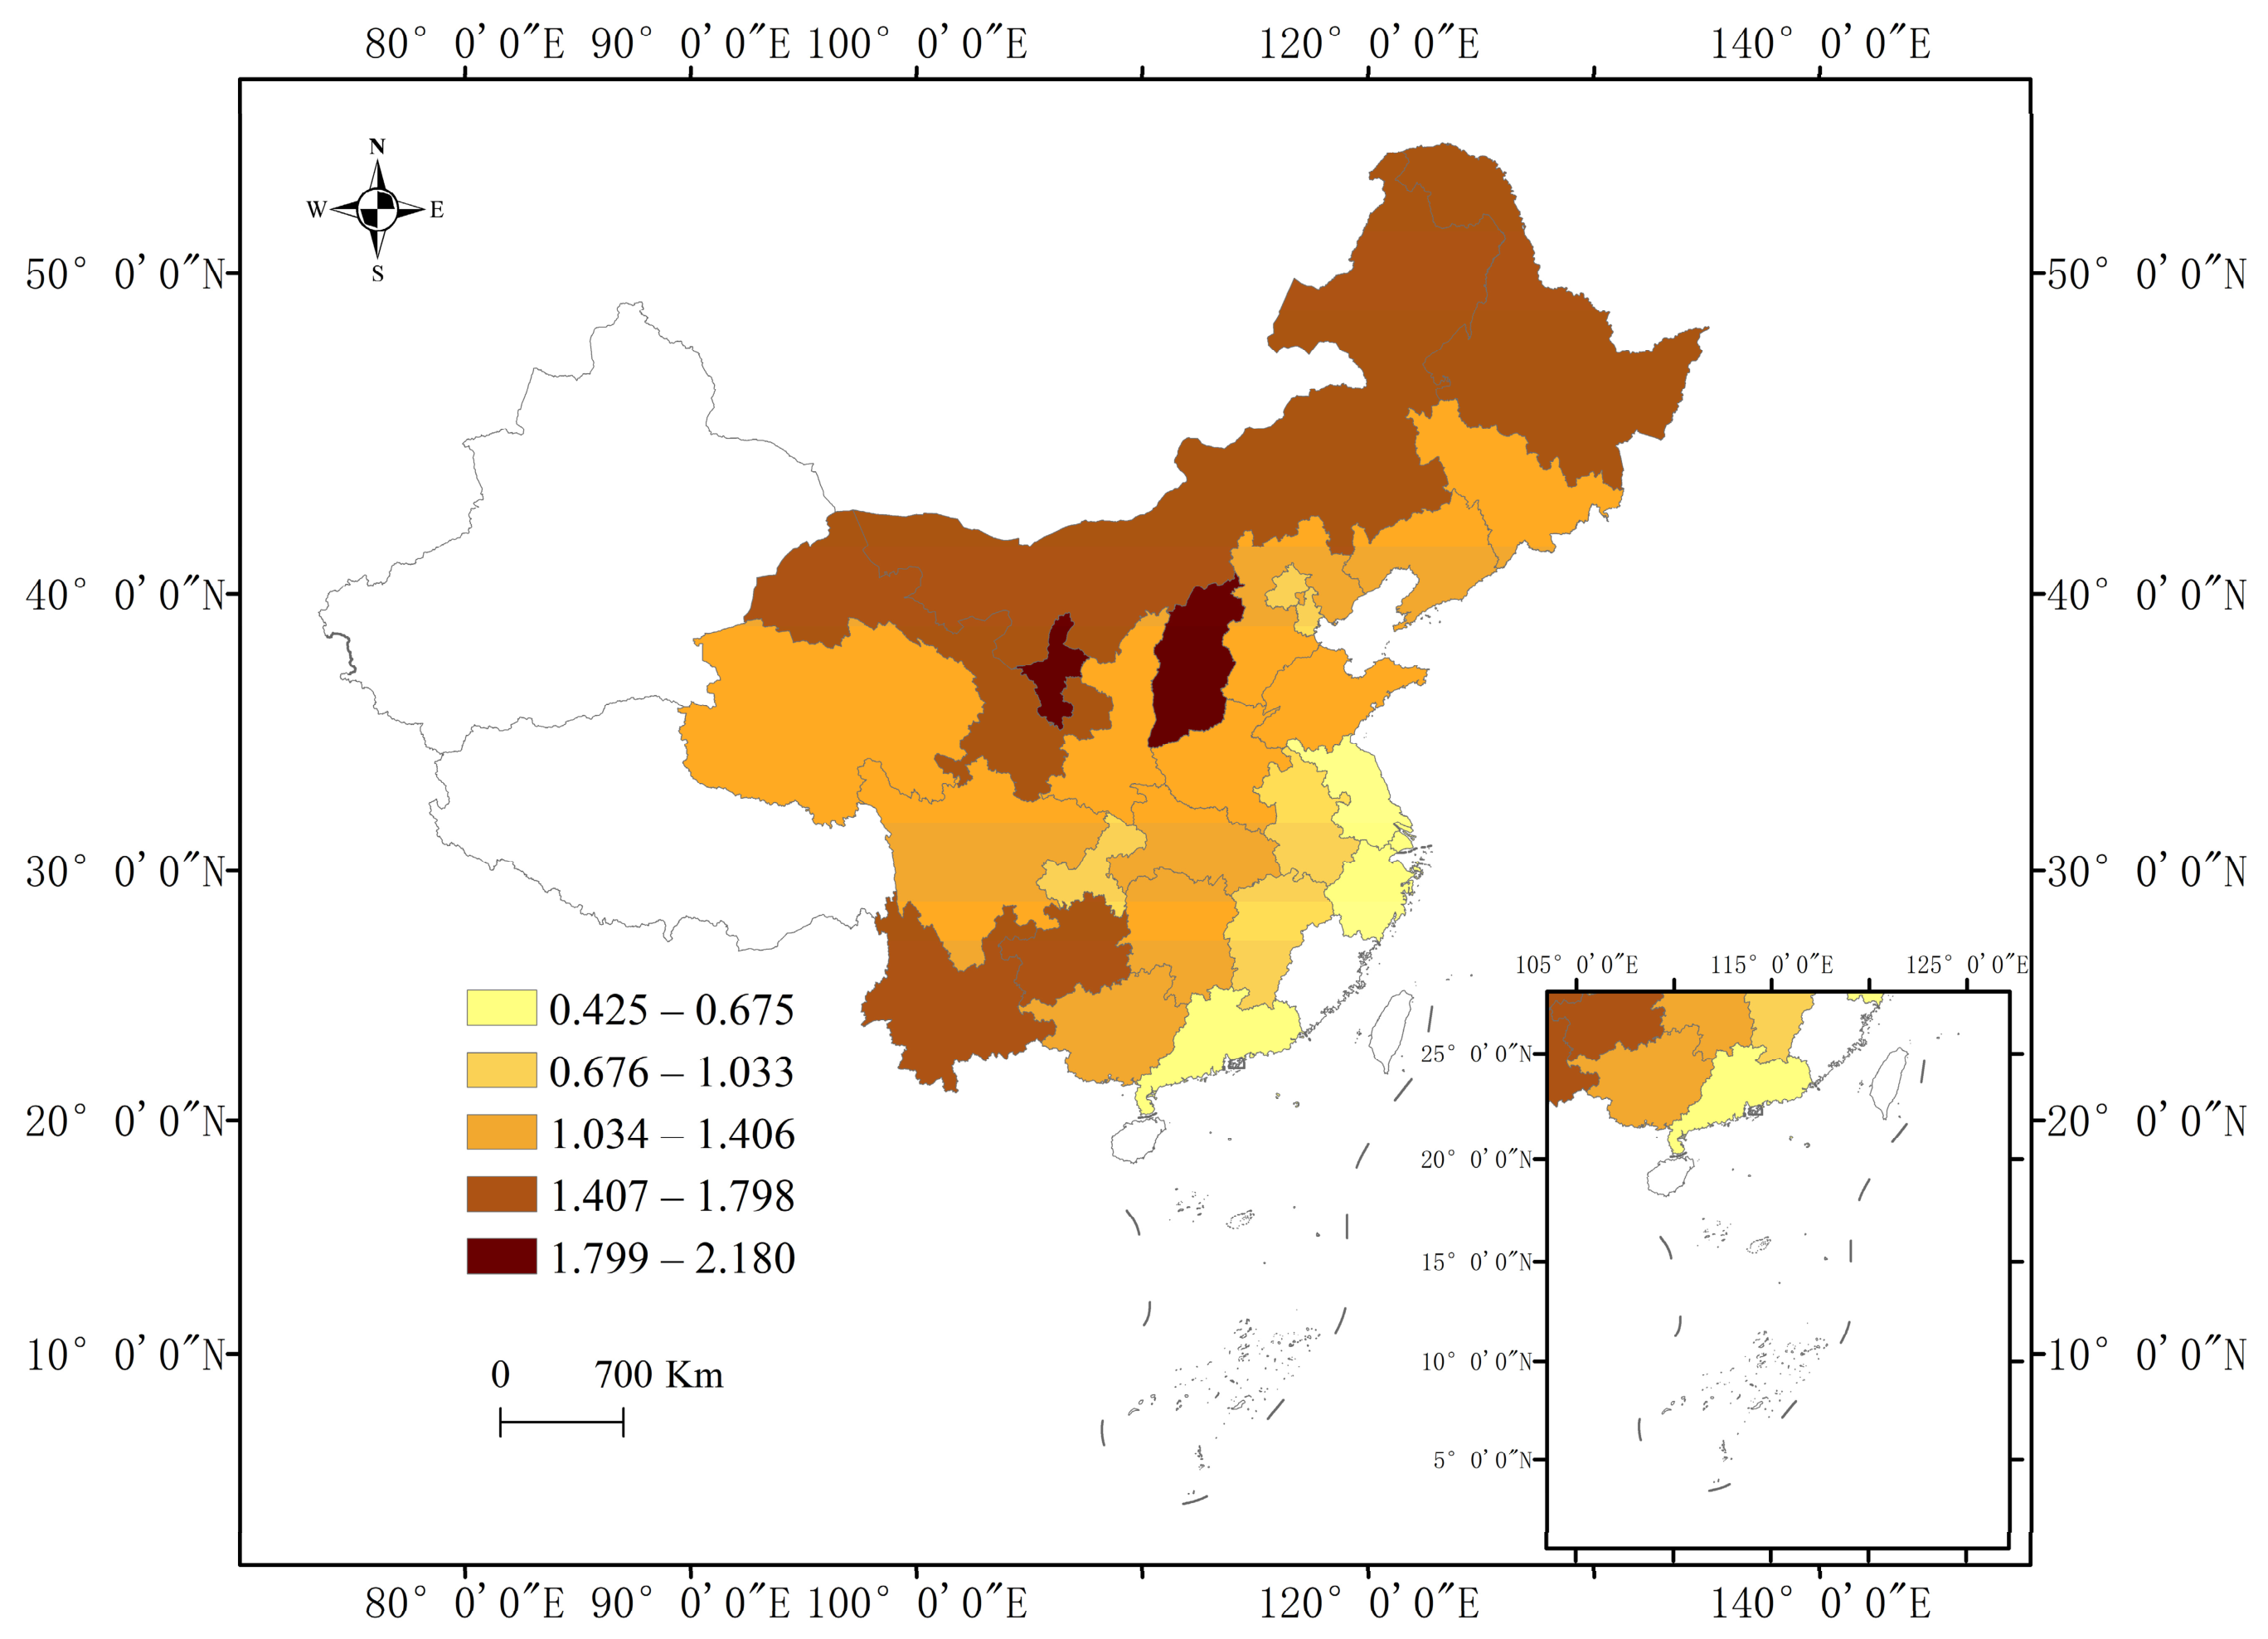
Based on the ten water pollution-intensive industries identified above, this study measures the agglomeration level of each industry and further constructs a provincial-level specialized agglomeration index for water pollution-intensive industries within the basin. The results are presented in Figure 3.
During the period from 2006 to 2022, the average specialized agglomeration index of water pollution-intensive industries for the entire basin was 1.21. Across different basin locations, the index exhibits a clear spatial distribution pattern characterized by “upstream > midstream > downstream”. Specifically, the average values for the upstream, midstream, and downstream regions were 1.45, 1.30, and 0.89, respectively. These results indicate that water pollution-intensive industries were more spatially concentrated in upstream and midstream regions.
The agglomeration of upstream industries may provide downstream firms with high-quality and low-cost intermediate inputs, while the agglomeration of downstream industries may create more convenient sales channels for upstream firms. These linkages can promote industrial symbiosis and support the development of a circular economy. Considering the scaling effects associated with asymmetric environmental regulation, this study defines industries other than water pollution-intensive industries as clean industries. It then evaluates the role of clean industrial-chain agglomeration in improving water environmental quality by estimating the upstream and downstream linkage agglomeration of clean industries across different basin regions.
The results show that upstream linkage agglomeration is generally lower than downstream linkage agglomeration. This suggests that the industrial linkages of water pollution-intensive industries are still dominated by polluting industries, while clean industries account for less than 40% of these linkages. In terms of basin location, clean industrial-chain linkage agglomeration follows a clear pattern of “upstream < midstream < downstream”. Overall, provinces with higher levels of clean industrial-chain linkage agglomeration tend to have lower levels of specialized agglomeration of water pollution-intensive industries.

4.6. Mediation Effect Test

4.6.1. Specialized Industrial Agglomeration Perspective

The mediating role of specialized agglomeration of pollution-intensive industries in the relationship between environmental regulation and WEG is examined in the first three columns of Table 10. As shown in column (2), environmental regulation exhibits an inverted U-shaped relationship with the specialized agglomeration of water pollution-intensive industries. This indicates that the relationship between environmental regulation and specialized agglomeration follows a threshold pattern. Specifically, the level of specialized agglomeration begins to decline only when environmental regulation exceeds the threshold value of 0.29.
Given that environmental regulation is significantly associated with both WEG and the specialized agglomeration of pollution-intensive industries, this study further includes environmental regulation and the industrial agglomeration index in the same panel model, with WEG as the dependent variable. Comparing columns (1) and (3), the absolute values of the coefficients of environmental regulation and its squared term decrease from 0.62 and 1.03 to 0.59 and 1.00, respectively. Meanwhile, the turning point of environmental regulation decreases from 0.30 to 0.29. These changes suggest that environmental regulation may affect WEG partly through industrial agglomeration.
In addition, the coefficient of specialized agglomeration of pollution-intensive industries is −0.07, indicating that a lower level of specialized agglomeration is associated with higher WEG. The Sobel test is significant at the 5% level, further confirming the statistical significance of the indirect effect. Therefore, the specialized agglomeration of pollution-intensive industries plays a significant partial mediating role in the relationship between environmental regulation and WEG.
Further evidence from the SDM results shows that the spatial spillover coefficients of environmental regulation on the specialized agglomeration of pollution-intensive industries in surrounding regions are 0.92 and 3.33 under the W1 and W2 spatial weight matrices, respectively. From a cost perspective, stronger environmental regulation may increase firms’ operating costs and economic burdens through taxes and fees, thereby influencing their location choices.

4.6.2. Linkage Agglomeration Perspective

Considering that the strength of upstream and downstream industrial linkages is an important factor shaping firms’ location choices, this study further examines the effect of clean industrial agglomeration on WEG from the perspective of industrial-chain-related agglomeration. The results are reported in Table 11.
According to columns (1) and (3), environmental regulation exhibits a U-shaped relationship with both upstream and downstream linkage agglomeration in the clean industrial chain. This indicates that the relationship between environmental regulation and clean industrial-chain-related agglomeration is not simply linear. When regulatory intensity is low, policy constraints may be insufficient to change firms’ location choices and industrial-chain layouts. Firms may therefore lack incentives to move toward clean industrial-chain agglomeration. As regulatory intensity increases, pollution-control costs and compliance pressure may gradually rise, while the comparative advantage of pollution-intensive production may decline. Under these conditions, the regional industrial structure may shift toward cleaner and more coordinated development, making upstream and downstream firms in the clean industrial chain more likely to agglomerate spatially. This may explain why environmental regulation is positively associated with clean industrial-chain-related agglomeration only after exceeding a certain threshold.
From the perspective of mediating effects, columns (2) and (4) of Table 11 show that the coefficients of upstream and downstream linkage agglomeration in the clean industrial chain are 0.39 and 0.34, respectively, both of which are positive. This suggests that clean industrial-chain-related agglomeration is associated with higher WEG. A possible mechanism is that such agglomeration may strengthen division of labor, cooperation, and technology diffusion among upstream and downstream firms. On the one hand, upstream clean industrial agglomeration may provide downstream firms with greener, lower-consumption, and higher-quality intermediate inputs, thereby reducing pollution intensity in downstream production. On the other hand, downstream clean industrial agglomeration may expand market demand for clean products and green production services, thereby strengthening the incentives of upstream firms to invest in green R&D and cleaner production. Coordination between upstream and downstream firms may improve water recycling efficiency and reduce wastewater and major water pollutant emissions, thereby contributing to higher WEG.
Furthermore, the Sobel tests for both mediating effects are statistically significant. This indicates that both upstream and downstream linkage agglomeration in the clean industrial chain play significant mediating roles in the relationship between environmental regulation and WEG.

5. Conclusions and Policy Implications

5.1. Conclusions

This study quantifies environmental regulation, WEG, and industrial agglomeration by classifying the upstream and downstream relationships of China’s major river basins at the provincial level. To measure environmental regulation more accurately, this study draws on China’s phased pollution-control planning for key regions and constructs a multidimensional indicator of regulatory intensity. Based on indicators of water pollution pressure, water environmental quality, and other influencing factors, this study further examines the mediating role of industrial agglomeration in the relationship between environmental regulation and WEG. In particular, the analysis focuses on two dimensions: the specialized agglomeration of pollution-intensive industries and the upstream and downstream linkage agglomeration of the clean industrial chain. The main conclusions are as follows.
(1)
Environmental regulation exhibits a clear threshold pattern in its relationship with WEG. When the environmental regulation index exceeds 0.30, a positive association with WEG gradually emerges. This suggests that a moderate increase in regulatory intensity may contribute to improvements in WEG. Further analysis across upstream, midstream, and downstream basin regions shows that the threshold values are 0.32, 0.33, and 0.39, respectively. These findings indicate that downstream regions may require stronger environmental regulation before regulatory effects on WEG become evident.
(2)
Environmental regulation exhibits heterogeneous spatial effects under different spatial weight matrices. Under the contiguity weight matrix, the spatial spillover coefficient of environmental regulation is 0.18, whereas under the basin-adjacency weight matrix, the coefficient increases to 0.82. Both coefficients are positive, indicating that environmental regulation is associated not only with local WEG but also with WEG in neighboring regions and other regions within the same basin through regional linkages and basin-level coordination mechanisms. Meanwhile, the threshold values of environmental regulation under the contiguity weight matrix and the basin-adjacency weight matrix are 0.37 and 0.31, respectively. These results suggest that the relationship between environmental regulation and WEG remains non-linear after accounting for spatial dependence.
(3)
From the perspective of mediating effects, the specialized agglomeration of pollution-intensive industries and clean industrial-chain-related agglomeration play different roles in the relationship between environmental regulation and WEG. The coefficient of specialized agglomeration of pollution-intensive industries is significantly negative, indicating that such agglomeration is associated with lower WEG. This suggests that environmental regulation may influence WEG partly through reducing the specialized agglomeration of pollution-intensive industries. In contrast, both upstream and downstream linkage agglomeration in the clean industrial chain exhibit significant positive mediating effects on WEG. This finding indicates that environmental regulation may contribute to higher WEG through clean industrial-chain-related agglomeration, stronger upstream and downstream industrial coordination, improved resource recycling, and the diffusion of green technologies.
Although this study focuses on China, the findings also provide important implications for other countries and regions facing similar basin-level water pollution challenges. In many developing countries and emerging economies, WEG is similarly constrained by cross-regional externalities, uneven regulatory capacity, and the spatial concentration of pollution-intensive industries. Therefore, the analytical framework developed in this study may also be applicable to other river-basin governance contexts. Nevertheless, caution should be exercised when generalizing the findings, as institutional arrangements, enforcement capacity, industrial structures, and data availability may differ substantially across countries. Future studies could further evaluate the applicability of this framework using data from other countries or transboundary river basins.

5.2. Policy Implications

Based on the above findings, we propose policy recommendations for improving water environmental governance.
First, differentiated environmental regulation should be implemented across basin regions. The estimated threshold values indicate that the effectiveness of regulation varies among upstream, midstream, and downstream areas. In upstream regions, regulatory intensity can be moderately increased to prevent pollution transfer. In midstream regions, an “incentive plus constraint” policy mix may be adopted by combining subsidies for clean technologies with higher discharge fees for highly polluting industries. In downstream regions, regulation should place greater emphasis on industrial-chain governance and coordinated emission reduction among upstream and downstream firms.
Second, spatial coordination in basin governance should be strengthened. Since environmental regulation generates positive spatial spillover effects, WEG should not be confined to individual administrative regions. Cross-regional coordination mechanisms should be improved, especially among neighboring provinces and regions within the same basin. Joint monitoring, information sharing, and coordinated enforcement can help reduce pollution transfer and improve overall basin governance efficiency.
Third, industrial layout should be optimized to promote green transformation. Excessive concentration of pollution-intensive industries should be restricted, especially in ecologically sensitive areas. Environmental access standards and land-use controls can be used to prevent the formation of new pollution hotspots. At the same time, governments should encourage clean industrial-chain agglomeration through tax incentives, green finance, and support for clean technologies, thereby guiding firms toward circular and low-pollution development.


Author Contributions

Conceptualization, J.L. (Junyuan Liu) and C.X.; methodology, J.L. (Junyuan Liu) and J.L. (Jingjun Li); software, J.L. (Jingjun Li); validation, H.M. and X.G.; formal analysis, J.L. (Junyuan Liu); investigation, J.L. (Jingjun Li); resources, H.M. and G.H.; data curation, J.L. (Jingjun Li); writing—original draft preparation, J.L. (Junyuan Liu) and J.L. (Jingjun Li); writing—review and editing, C.X., H.M. and G.H.; visualization, J.L. (Jingjun Li); supervision, C.X.; project administration, C.X.; funding acquisition, C.X. All authors have read and agreed to the published version of the manuscript.

Funding

This work was supported by the National Social Science Foundation of China (23BJY099), the Fundamental Research Funds for the Central Universities (B220207036).

Data Availability Statement

The data that support the findings of this study are available from the corresponding author upon reasonable request.

Conflicts of Interest

Jingjun Li was employed by China Harbour Engineering Company Ltd. Hui Miao and Xiujuan Guo were employed by CCCC Fourth Harbor Engineering Investigation and Design Institute Co., Ltd. Guojun Hao was employed by Guangdong Provincial Transport Planning and Research Center. The remaining authors declare that the research was conducted in the absence of any commercial or financial relationships that could be construed as a potential conflict of interest.

Abbreviations

REnvironmental regulation
R1Total-control regulation
R2Quality-based regulation
R3Project-based regulation
R4Governance-based regulation
WEGWater environmental governance
WP1Industrial wastewater discharge
WP2Industrial chemical oxygen demand discharge
WP3Industrial ammonia nitrogen discharge
WQ1Water quality category
WQ2Permanganate index
WQ3Ammonia nitrogen index
WAGGSpecialized agglomeration
AGG_uUpstream linkage agglomeration
AGG_dDownstream linkage agglomeration
GDPGross regional product
POPTotal population
LCAverage wage of urban employment
GCPercentage of fixed assets
INTPercentage of total retail sales
EXPPercentage of foreign capital
FSPercentage of fiscal expenditure
TECR&D funding
RAINAverage annual rainfall
TEMAverage annual temperature

References

  1. Li, L.; Li, P.; He, S.; Duan, R.; Xu, F. Ecological Security Evaluation for Changtan Reservoir in Taizhou City, East China, Based on the DPSIR Model. Hum. Ecol. Risk Assess. 2023, 29, 1064–1090. [Google Scholar] [CrossRef]
  2. Wang, B.; Yu, F.; Teng, Y.; Cao, G.; Zhao, D.; Zhao, M. A SEEC Model Based on the DPSIR Framework Approach for Watershed Ecological Security Risk Assessment: A Case Study in Northwest China. Water 2022, 14, 106. [Google Scholar] [CrossRef]
  3. Marchand, S.; Barro, M.; Xiong, H.; Guo, H. Industrial Water Pollution and Farmer Adaptation: Evidence from Rice Farming in Jiangsu, China. Agric. Econ. 2025, 56, 108–123. [Google Scholar] [CrossRef]
  4. Tang, Y.; Liu, Z.; Walker, T.R.; Rodenbiker, J.; Li, Y.; Liu, W. How Centralizing Environmental Enforcement Affects Water Quality: A Quasi-Experiment in China. Environ. Impact Assess. Rev. 2025, 110, 107704. [Google Scholar] [CrossRef]
  5. Bai, Y.; Huang, Y.; Jiang, M.; Zhao, P.; Qi, Q.; Wang, Q. Spillover Effects of Structure-Adjustment Pollution Reduction Measures in China’s Iron and Steel Industry. J. Environ. Manag. 2024, 368, 122133. [Google Scholar] [CrossRef]
  6. Wen, G.; Yang, L.; Zhang, X.; Zhou, Y.; Zhou, H.; Hu, X. The Impact of Environmental Regulation on Farmland Non-Point Source Pollution: Evidence from the Dongting Lake Plain, China. Sustainability 2025, 17, 328. [Google Scholar] [CrossRef]
  7. Yi, Y.; Li, Z. The Impact of Environmental Regulation on Water Resources Carrying Capacity in the Yangtze River Economic Belt. J. Water Clim. Change 2024, 15, 3361–3376. [Google Scholar] [CrossRef]
  8. Dong, S.; Gong, H. Environmental Technological Specialization, Diversification and Green Start-Up Emergence: The Role of Technological Opportunities and Environmental Regulation. Environ. Dev. Sustain. 2025, 1–23. [Google Scholar] [CrossRef]
  9. Chen, Y.; Du, K.; Sun, R.; Wang, T. Can Strict Environmental Regulation Reduce Firm Cost Stickiness? Evidence from the New Environmental Protection Law in China. Energy Econ. 2025, 142, 108218. [Google Scholar] [CrossRef]
  10. Liu, X.; Luo, P.; Rijal, M.; Hu, M.; Chong, K.L. Spatial Spillover Effects of Urban Agglomeration on Road Network with Industrial Co-Agglomeration. Land 2024, 13, 2097. [Google Scholar] [CrossRef]
  11. Zhang, J.; Han, R.; Li, L.; Zhang, D.; Han, Y. The Impact of China’s Super Urban Agglomeration Strategy on Industrial Pollution. Sci. Rep. 2025, 15, 27993. [Google Scholar] [CrossRef]
  12. Qin, C.; Lu, D.; Li, Y. Industrial Agglomeration, Environmental Regulation, and Regional Environmental Performance: Direct and Interactive Effects. Manag. Decis. Econ. 2024, 45, 5527–5540. [Google Scholar] [CrossRef]
  13. Li, L.; Xia, Z.; Yi, J.; Qi, R.; Cheng, J. Industrial Agglomeration and PM2.5 Pollution in Yangtze River Economic Belt in China: Non-Linear Estimation and Mechanism Analysis. Front. Environ. Sci. 2024, 11, 1346323. [Google Scholar] [CrossRef]
  14. Wang, T.; Tang, J.; Wang, X.; He, Q. Assessing Capital Allocation Efficiency under Environmental Regulation. Financ. Res. Lett. 2024, 62, 105104. [Google Scholar] [CrossRef]
  15. Liu, J.; Tao, M.; Yao, Q.; Tian, X.; Li, X.; Chen, L. Are Environmental Regulations Really Effective in Curbing Agricultural Carbon Emissions? Environ. Dev. Sustain. 2025, 1–28. [Google Scholar] [CrossRef]
  16. Zhao, Z.; Zhao, Y.; Lv, X.; Li, X.; Zheng, L.; Fan, S.; Zuo, S. Environmental Regulation and Green Innovation: Does State Ownership Matter? Energy Econ. 2024, 136, 107762. [Google Scholar] [CrossRef]
  17. Song, W.; Han, X.; Liu, Q. Patterns of Environmental Regulation and Green Innovation in China. Struct. Change Econ. Dyn. 2024, 71, 176–192. [Google Scholar] [CrossRef]
  18. Huang, C.; Wang, C.-M. Water Pollution, Industrial Agglomeration and Economic Growth: Evidence from China. Front. Environ. Sci. 2022, 10, 1071849. [Google Scholar] [CrossRef]
  19. Mu, L.; Zhang, C.; Zeng, X.; Ma, R.; Li, Y.; Liu, H. The Impact of the River Chief System on Transboundary Water Pollution. Sci. Rep. 2025, 15, 8192. [Google Scholar] [CrossRef]
  20. Hamaguchi, Y. Pollution Havens and Agglomeration: The Effect of Globalization and Technological Spillover. Appl. Econ. 2024, 56, 2223–2240. [Google Scholar] [CrossRef]
  21. Campos-Romero, H.; Mourao, P.R.; Rodil-Marzábal, Ó. Is There a Pollution Haven in European Union Global Value Chain Participation? Environ. Dev. Sustain. 2024, 26, 22499–22523. [Google Scholar] [CrossRef]
  22. Peng, H.; Shen, N.; Ying, H.; Wang, Q. Can Environmental Regulation Directly Promote Green Innovation Behavior?—Based on Situation of Industrial Agglomeration. J. Clean. Prod. 2021, 314, 128044. [Google Scholar] [CrossRef]
  23. Fabrizi, A.; Gentile, M.; Guarini, G.; Meliciani, V. The Impact of Environmental Regulation on Innovation and International Competitiveness. J. Evol. Econ. 2024, 34, 169–204. [Google Scholar] [CrossRef]
  24. Su, L. Environmental Regulation and Corporate Green Innovation: Evidence from the Implementation of the Total Energy Consumption Target in China. J. Bus. Econ. 2025, 95, 499–526. [Google Scholar] [CrossRef]
  25. Ahmad, M.; Yousaf, M.; Han, J.-C.; Rahman, S.U.; Sharif, H.M.A.; Wang, L.; Tang, Z.; Zhou, Y.; Huang, Y. State-of-the-Art Analysis of the Fuel Desulphurization Processes: Perspective of CO2 Utilization in Coal Biodesulphurization. Chem. Eng. J. 2023, 478, 147517. [Google Scholar] [CrossRef]
  26. Jiang, Z.; Wang, Z.; Lan, X. How Environmental Regulations Affect Corporate Innovation? The Coupling Mechanism of Mandatory Rules and Voluntary Management. Technol. Soc. 2021, 65, 101575. [Google Scholar] [CrossRef]
  27. Liu, J.; Fang, Y.; Ma, Y.; Chi, Y. Digital Economy, Industrial Agglomeration, and Green Innovation Efficiency: Empirical Analysis Based on Chinese Data. J. Appl. Econ. 2024, 27, 2289723. [Google Scholar] [CrossRef]
  28. Song, G.; Feng, W. Analysis of the Spatial Layout and Influencing Factors of Pollution-Intensive Industries Based on Enterprise Dynamics. Ecol. Indic. 2023, 152, 110378. [Google Scholar] [CrossRef]
  29. Zhang, Z.; Chi, L.; Wu, J.; Zhu, M.; Shen, C. Industrial Clustering and Environmental Pollution: Spatial-Temporal Dynamics and Driving Factors of China’s Feed Processing Industry. J. Clean. Prod. 2025, 498, 145173. [Google Scholar] [CrossRef]
  30. Bao, Q.; Shao, M.; Yang, D. Environmental Regulation, Local Legislation and Pollution Control in China. Environ. Dev. Econ. 2021, 26, 321–339. [Google Scholar] [CrossRef]
  31. Wang, Q.; Fu, Q.; Shi, Z.; Yang, X. Transboundary Water Pollution and Promotion Incentives in China. J. Clean. Prod. 2020, 261, 121120. [Google Scholar] [CrossRef]
  32. Javorcik, B.S. Does Foreign Direct Investment Increase the Productivity of Domestic Firms? In Search of Spillovers through Backward Linkages. Am. Econ. Rev. 2004, 94, 605–627. [Google Scholar] [CrossRef]
  33. Qin, J.; Luo, W.; Cheng, Q. Industrial Collaborative Agglomeration and Green Innovation: Spatial Interactions and Regional Impacts. Ann. Reg. Sci. 2026, 75, 12. [Google Scholar] [CrossRef]
  34. Wang, Q.; Du, Z.; Wang, B.; Chiu, Y.-H.; Chang, T.-H. Environmental Regulation and Foreign Direct Investment Attractiveness: Evidence from China Provinces. Rev. Dev. Econ. 2022, 26, 899–917. [Google Scholar] [CrossRef]
  35. Radulescu, M.; Cifuentes-Faura, J.; Si Mohammed, K.; Alofaysan, H. Energy Efficiency and Environmental Regulations for Mitigating Carbon Emissions in Chinese Provinces. Energy Effic. 2024, 17, 67. [Google Scholar] [CrossRef]
  36. Li, S. Environmental Regulation Policy, Firm Endogenous Capability, and Green Technological Innovation: Evidence from a Multi-Period DID Study in Heavily Polluting Industries. J. Environ. Manag. 2025, 391, 126436. [Google Scholar] [CrossRef] [PubMed]
  37. Zhu, H.; Yang, L.; Xu, C.; Fu, T.; Lin, J. Exploring the Nonlinear Association between Agri-Environmental Regulation and Green Growth: The Mediating Effect of Agricultural Production Methods. J. Clean. Prod. 2024, 444, 141138. [Google Scholar] [CrossRef]
  38. Xiao, Y.; Feng, Z.; Wu, H.; Wang, S. Every Rose Has Its Thorn: Do Environmental Regulations Exacerbate Regional Energy Poverty? J. Clean. Prod. 2023, 419, 138285. [Google Scholar] [CrossRef]
  39. Xie, W.; Qing, Y.; Tao, L.; Li, W.; Wen, C. Spatial Spillover Effects of Environmental Regulation on Ecological Industrialization: Evidence from the Upper Reaches of the Yangtze River. Int. Rev. Econ. Financ. 2025, 98, 103862. [Google Scholar] [CrossRef]
Figure 1. Research framework.
Water 18 01297 g001
Figure 2. Classification of provinces based on basin attributes.
Water 18 01297 g002
Figure 3. Level of specialized agglomeration of water environment pollution-intensive industries at the provincial level in the basin.
Water 18 01297 g003
Table 1. Descriptive Statistics of Variables.
TypologyNotationIndicator NameUnitMaxMinStd.Dev.References
Dependent variableREnvironmental regulation-0.620.000.07[4,6,7,9,11,16,22,24]
Independent variableWEGWater environmental governance-1.000.000.23[3,4,6,7,11]
Mediating variableWAGGSpecialized agglomeration-4.010.771.43[12,13]
AGG_uUpstream linkage agglomeration-0.880.010.12[29,32,33]
AGG_dDownstream linkage agglomeration-0.840.010.10[29,32,33]
Control factorsGDPGross regional product1013 yuan11.110.061.96[34,35]
POPTotal population109 units1.330.050.31
LCAverage wage of urban employment104 yuan17.801.522.71
GCPercentage of fixed assets%0.610.110.10
INTPercentage of total retail sales%0.550.230.19
EXPPercentage of foreign capital%0.010.00000160.002
FSPercentage of fiscal expenditure%0.100.010.02
TECR&D funding109 yuan25002.10414.50
RAINAverage annual rainfallmm2321214.30473.10
TEMAverage annual temperature°C22.803.004.90
Table 2. Statistical results of environmental regulation indicators.
NotationIndicator NameUnitMaxMinStd.Dev.References
R1chemical oxygen demand104 t38.60.0015.4[6,11]
Total ammonia nitrogen104 t190.0014.6[6,11]
R2Number of surface water monitoring sections104 units0.20.010.05[4,7]
Water Environment Key Monitoring Enterprisesunits842071252.5[4,7]
R3Amount of investment in environmental projects109 yuan3853.70.5421.8[9]
Project Investment in “three simultaneous”109 yuan310,0001.452,000[4,16]
R4Number of wastewater treatment facilities104 units1.60.020.3[24]
Investment in industrial wastewater treatment109 yuan36.30.017.5[6,22]
Table 3. Statistical results of water environment indicators and related factors.
TypologyNotationIndicator NameUnitMaxMinStd.Dev.References
WEGWP1Wastewater discharge109 t28.70.55.9[3,6,11]
WP2Chemical oxygen demand emissions104 t67.90.19.8[3,6,11]
WP3Ammonia emissions104 t4.20.0030.7[3,6,11]
WQ1Water quality category-610.9[4,7]
WQ2Permanganate indexmg/L55.81.55[4,7]
WQ3Ammonia nitrogen indexmg/L1802[4,7]
Table 4. Distribution of pollution-intensive industries.
Main ClassCategory NameWP1WP2WP3References
06Coal mining and washing++[5,28,33,36]
13Agri-food processing industry+++
14food manufacturing+++
15Alcohol, beverages and refined tea manufacturing+++
17textile industry+++
22Paper and paper products industry+++
25Petroleum, coal and other fuel processing industries+++
26Chemical raw materials and chemical products manufacturing+++
27Pharmaceutical manufacturing+++
31Ferrous metal smelting and rolling+++
Note(s): “+” indicates that the share of pollutant emissions is higher than the average value, and “−“ indicates that the share of pollutant emissions is lower than the average value.
Table 5. Moran’s I values for environmental regulation in watersheds.
YearW1W2
Moran’ IZ (I)Moran’ IZ (I)
20060.030.120.050.58
20070.17 ***2.520.06 **3.21
20080.32 ***3.30.19 **3.81
20090.28 ***2.920.13 **2.09
20100.060.870.22 *0.96
20110.25 ***2.630.35 ***2.55
20120.4 ***3.920.29 ***3.73
20130.39 ***3.820.29 ***4.54
20140.34 ***3.30.27 ***4.43
20150.39 ***3.770.27 ***4.76
20160.24 **2.330.22 **2.25
20170.091.07−0.112.33
20180.17 **2.010.18 **2.10
20190.19 **2.110.23 **2.31
20200.22 *1.980.21 **2.26
20210.21 **1.970.26 **2.72
20220.23 **2.080.22 **3.21
Note(s): ***, **, * represent 1%, 5% and 10% significance levels, respectively.
Table 6. Regression results of environmental regulation on water environmental governance.
VariableRR1R2R3R4GMM Method
L.WEG 0.397 **
R21.03 ***0.16 ***1.11 ***−0.020.17 **2.38 *
R−0.62 ***−0.18 ***−0.69 ***0.02 *−0.21 ***−1.09 **
PGDP2−0.01 *−0.01 *−0.01 *−0.01 *−0.01 *0.12
PGDP0.240.090.190.060.010.36
ST−0.36 ***−0.44 ***−0.45 ***−0.41 ***−0.35 ***−0.51 *
POP−0.07 ***−0.22 **−0.1−0.16 *−0.16 *−0.22
LC0.06 **0.08 **0.09 **0.09 **0.09 ***0.17 *
GC−0.25 ***−0.26 ***−0.33 ***−0.25 **−0.26 ***−0.32
INT0.070.050.040.030.050.11
EXP−3.05 *−2.82−3.92 **−3.39 *−3.09−4.10
FS−1.82 ***−0.38−0.29−0.35−0.11−3.18 **
TEC0.05 ***0.09 ***0.07 ***0.07 ***0.07 ***0.67 *
RAIN−0.01−0.02−0.02−0.02−0.02−0.03
TEM0.00 **0.000.000.00 *0.00 *0.01
AR(1) 0.08
AR(2) 0.27
Hansen test 0.69
Constant−0.571.08−0.260.730.98
r20.660.630.650.620.63
Note(s): ***, **, * represent 1%, 5% and 10% significance levels, respectively.
Table 7. Impact results based on watershed attributes.
VariableUMD
R21.18 ***1.18 ***0.41 *
R−0.75 ***−0.78 ***−0.32 *
PGDP20.00−0.02 **−0.03 **
PGDP−0.160.53 **0.58 **
ST0.06−0.71 ***−0.39 ***
POP0.04 *−0.13 ***−0.04
LC0.26 ***−0.1 ***0.17 ***
GC−0.35 **0.140.47 ***
INT−0.47 ***−0.110.47 ***
EXP−16.17 ***−11.35 ***−1.31
FS−2.34−2.42−0.15
TEC0.020.08 ***−0.03
RAIN−0.03 *0.06 ***−0.03 *
TEM0.000.02 ***0.00
Constant−0.25−1.81−3.4 ***
r20.690.830.91
Note(s): ***, **, * represent 1%, 5% and 10% significance levels, respectively.
Table 8. Spatial econometric model test results.
Test MethodW1W2
Statisticp-ValueStatisticp-Value
LM_spatial_erro222.9170.000152.9920.000
Robust LM_spatial_erro96.6390.00090.1320.000
LM_spatial_lag127.5410.00094.9290.000
Robust LM_spatial_lag1.2630.06132.0690.000
LR_sdm_sar46.8000.000113.8200.000
LR_sdm_sem29.0300.00070.5400.000
Wald_sdm_sar28.9000.00038.8800.000
Wald_sdm_sem30.3300.00080.5000.000
Hausman35.7900.001301.1900.001
Table 9. Results of the spatial spillover effect test.
VariableW1VariableW1VariableW2VariableW2
R21.05 *** R21.02 ***
R0.18 **W*R0.18 **R−0.65 ***W*R0.82 *
PGDP2−0.02 ** PGDP2−0.01
PGDP0.02W*PGDP0.02PGDP0.32 *W*PGDP0.69 ***
ST−0.22W*ST−0.22ST−0.22 ***W*ST0.92
POP−0.15 ***W*POP−0.15 ***POP−0.04 ***W*POP−0.11
LC−0.05W*LC−0.05LC0.01W*LC−0.24
GC−0.52 **W*GC−0.52 **GC−0.53 ***W*GC0.37
INT0.2 *W*INT0.2 *INT0.01W*INT1.22 **
EXP−8.71 **W*EXP−8.71 **EXP−0.03W*EXP−42.29 ***
FS−3.94 ***W*FS−3.94 ***FS−3.56 ***W*FS−10.64 ***
TEC0.04 *W*TEC0.04 *TEC0.03 ***W*TEC−0.22 ***
RAIN0.13 ***W*RAIN0.13 ***RAIN−0.01W*RAIN0.26 ***
TEM0.01 **W*TEM0.01 **TEM0.01 ***W*TEM0.01
r20.75r20.68
Log-L652.95Log-L648.38
AIC−1249.90AIC−1240.76
Note(s): ***, **, * represent 1%, 5% and 10% significance levels, respectively.
Table 10. Intermediation and space efficiency results.
VariableIntermediary EffectSpatial Spillover Effects (W1)
WEGWAGGWEGWAGG
WAGG −0.07 **
R21.03 ***−0.52 *1.00 ***−0.57 *−0.81 **
R−0.62 ***0.30 *−0.59 ***0.09 *0.05 *
PGDP2−0.01 *−0.02−0.01−0.05−0.02
PGDP0.240.65 *0.181.28 *2.00 *
ST−0.36 ***−0.15−0.4 ***2.18 ***1.71 ***
POP−0.07 ***0.31 **−0.15 *0.47 ***0.31 **
LC0.06 **0.090.08 **0.66 ***0.51 *
GC−0.25 ***0.00−0.24 ***0.69 **0.66 **
INT0.07−0.19 *0.05−0.44 *−0.51 **
EXP−3.05 *7.14 **−2.58−19.79 ***−16.01 **
FS−1.82 ***−3.19 **−0.78−4.43 ***−4.11 **
TEC0.05 ***−0.14 ***0.06 ***−0.25 ***−0.26 ***
RAIN−0.01−0.01−0.03 *−0.26 ***−0.32 ***
TEM0.00 **0.00 **0.000.01 ***0.01 ***
W*R 0.92 ***3.33 ***
Constant−0.57−4.31 *0.35
Sobel test0.041
r20.360.210.350.750.80
Note(s): ***, **, * represent 1%, 5% and 10% significance levels, respectively.
Table 11. Results of clean industry agglomeration on water environment pollution.
VariableIntermediary Effect
AGG_uWEGAGG_dWEG
R2−0.66 **1.01 ***−0.32 **1.01 ***
R0.42 **−0.6 ***0.21 **−0.6 ***
AGG_u 0.39 ***
AGG_d 0.34 **
PGDP2−0.02−0.01−0.05−0.01
PGDP0.540.120.32 *0.15
ST−0.11 *−0.4 ***−0.27−0.4 ***
POP0.41 *−0.14 *0.12−0.13 *
LC0.09 *0.08 **0.310.08 **
GC0.01−0.31 ***0.03−0.29 ***
INT−0.22 *0.07−0.24 *0.07
EXP1.47−2.480.91−2.67
FS−2.19 *−0.63−1.22−0.57
TEC−0.18 *0.08 ***−0.34 *0.08 ***
RAIN0.01−0.03 *0.02−0.03
TEM0.01 **0.000.19 ***0.00
Sobel test0.0030.029
Constant1.01 *0.190.88 **0.02
r20.510.300.440.29
Note(s): ***, **, * represent 1%, 5% and 10% significance levels, respectively.
Disclaimer/Publisher’s Note: The statements, opinions and data contained in all publications are solely those of the individual author(s) and contributor(s) and not of MDPI and/or the editor(s). MDPI and/or the editor(s) disclaim responsibility for any injury to people or property resulting from any ideas, methods, instructions or products referred to in the content.