Article

Spatial Evolution Characteristics and Driving Factors of Compound Droughts in Karst Regions of Southwest China: A Copula-Based Study


1
College of Environmental Science and Engineering, Guilin University of Technology, Guilin 541006, China
2
Guangxi Key Laboratory of Environmental Pollution Control Theory and Technology, Guilin University of Technology, Guilin 541006, China
3
University Engineering Research Center of Watershed Protection and Green Development, Guilin University of Technology, Guilin 541006, China
4
Key Laboratory of Carbon Emission and Pollutant Collaborative Control, Education Department of Guangxi Zhuang Autonomous Region, Guilin University of Technology, Guilin 541006, China
*
Author to whom correspondence should be addressed.
Water 2026, 18(11), 1275; https://doi.org/10.3390/w18111275
Submission received: 16 April 2026 / Revised: 15 May 2026 / Accepted: 22 May 2026 / Published: 25 May 2026
(This article belongs to the Section Hydrology)

Abstract

Due to its unique hydrogeological conditions, the Southwest Karst Area (SKA) in China experiences droughts far more frequently than non-karst regions. Exploring the distribution patterns and driving factors of different drought types is crucial for enhancing the region’s disaster prevention and mitigation capabilities and effectively addressing climate change risks. Using meteorological data from 1979 to 2023 in the SKA—including precipitation, temperature, humidity, potential evapotranspiration, and soil moisture—this study employed Copula theory to construct the Standardized Temperature Deficit Index (SDTI), the Standardized Humidity–Temperature Deficit Index (SDHTI), and the Standardized Atmosphere–Soil Index (SASI). Based on these indices and run theory, this study revealed the spatial distribution characteristics of different drought types (general, atmospheric, and composite) in terms of intensity, frequency, severity, and duration. Furthermore, the Mann–Kendall test and random forest analysis were applied to investigate drought trends and primary driving factors. The results indicate that droughts in the SKA exhibit significant regional characteristics and an overall worsening trend. Among them, droughts in karst-developed regions are generally more severe, though their manifestations vary across areas: compound droughts are particularly severe on the western Sichuan Plateau but relatively mild in Guangxi. In contrast, atmospheric droughts are more pronounced in Guangxi. Regarding trends, the rate of drought intensification was relatively moderate in Guangxi and the western Sichuan Plateau but more pronounced in other regions, with the maximum increase reaching 0.59. However, this upward trend is not statistically significant. Additionally, drought in karst areas was characterized by high frequency and intensity but shorter duration and lower severity, whereas the opposite was true in non-karst areas. Random forest analysis revealed that temperature is the primary driver of SDTI (2.60), while relative humidity and temperature have significant impacts on SDHTI (3.21 and 2.42, respectively). Soil moisture and temperature contribute most significantly to SASI (2.08 and 1.48, respectively). These findings provide important insights to guide the rational allocation of regional water resources and optimize agricultural management strategies.

1. Introduction

Since the 1990s, the frequency of various extreme weather events has risen steadily. This trend has intensified against the backdrop of global warming [1,2]. Among all natural disasters, drought is the most prevalent. Due to the interplay of multiple factors, drought often exhibits complex spatiotemporal patterns. When two distinct drought types occur simultaneously, the phenomenon is defined as a compound drought [3], which inflicts more severe damage on natural ecosystems and human societies than a single drought event [4]. However, previous studies have primarily focused on individual meteorological or hydrological factors, largely neglecting the influence of multidimensional driving mechanisms. This research gap is particularly evident in regions with extensive karst development, which are often more sensitive to drought and thus warrant further investigation.
To quantify drought severity, McKee et al. introduced the Standardized Precipitation Index (SPI). Subsequent studies have refined this approach: Vicente-Serrano et al. developed the Standardized Precipitation-Evapotranspiration Index (SPEI), while Shukla and Wood proposed the Standardized Soil Moisture Index (SSMI), which directly reflects soil conditions. Building on these foundations, Hao et al. employed copula theory to construct a novel dry-hot index by coupling precipitation and temperature, enabling the assessment of compound drought severity [5,6,7,8,9]. Other drought indices, such as the Standardized Antecedent Precipitation Index (SAPI) and Standardized Weighted Average Precipitation (SWAP) [10,11], have also been widely applied, offering valuable references for drought identification. Overall, these studies have primarily focused on characterizing drought through single-variable approaches [12,13,14,15,16,17,18]. However, most of the aforementioned indices are based on statistical assumptions or simple water balance relationships and thus inadequately characterize the physical mechanisms underlying drought processes. In particular, because these indices rely on a single variable (e.g., precipitation, evapotranspiration, or soil moisture), they cannot comprehensively capture drought events driven by the coupling of multiple variables, limiting their ability to characterize compound droughts.
Owing to the unique climate, topography, geological structure, and hydrogeological conditions of karst regions, their hydrological cycles differ markedly from those of non-karst areas [19], attracting considerable research attention. For example, Chen et al. quantified the propagation thresholds for different drought levels and elucidated the underlying transmission mechanisms from a drought propagation perspective [20]. Sun et al. conducted a comprehensive quantitative assessment of the evolution of atmospheric drought in China’s karst regions by disentangling the contributions of atmospheric evaporation demand and precipitation [21]. Fu et al. analyzed interannual and seasonal variations in atmospheric drought and the factors influencing them [22]. Pan et al. found that drought in karst basins of Southwest China exhibits distinct regional and seasonal characteristics [23]. Wang et al. used the SPEI to demonstrate that meteorological drought in Southwest China shows a drying trend at both interannual and seasonal scales [24]. Although these studies provide an important foundation for understanding drought in karst regions, most continue to rely on traditional drought indices or focus on specific drought processes, thereby failing to systematically capture the fundamental multidimensional characteristics of drought (frequency, intensity, duration, and severity). Moreover, existing research has largely focused on a single aspect of meteorological or hydrological drought, and further exploration is needed to assess different drought types.
As a complex natural phenomenon, drought is intrinsically linked with processes in the lithosphere, atmosphere, and hydrosphere, and is often strongly correlated with anomalies in precipitation and temperature. Among various meteorological factors, relative humidity is more sensitive to drought than precipitation, while soil moisture is a critical variable linking atmospheric and terrestrial systems [25,26,27,28,29]. The specific objectives of this study are as follows: (1) to develop a multi-factor standardized drought index by integrating Copula functions with multiple variables, including temperature, relative humidity, potential evapotranspiration, precipitation, and soil moisture; (2) to identify drought events using the developed index and run theory, determining their duration, intensity, frequency, severity, and spatial extent; and (3) to analyze future trends and driving mechanisms using the Mann–Kendall test and random forest.
The article is organized as follows: Section 2 provides an overview of the research field, the data used, and the fundamental principles and procedures of the methods employed. Section 3 presents the main results of this paper, with the discussion divided into four parts. Finally, the main conclusions are presented in Section 5.

2. Materials and Methods

2.1. Study Area Overview

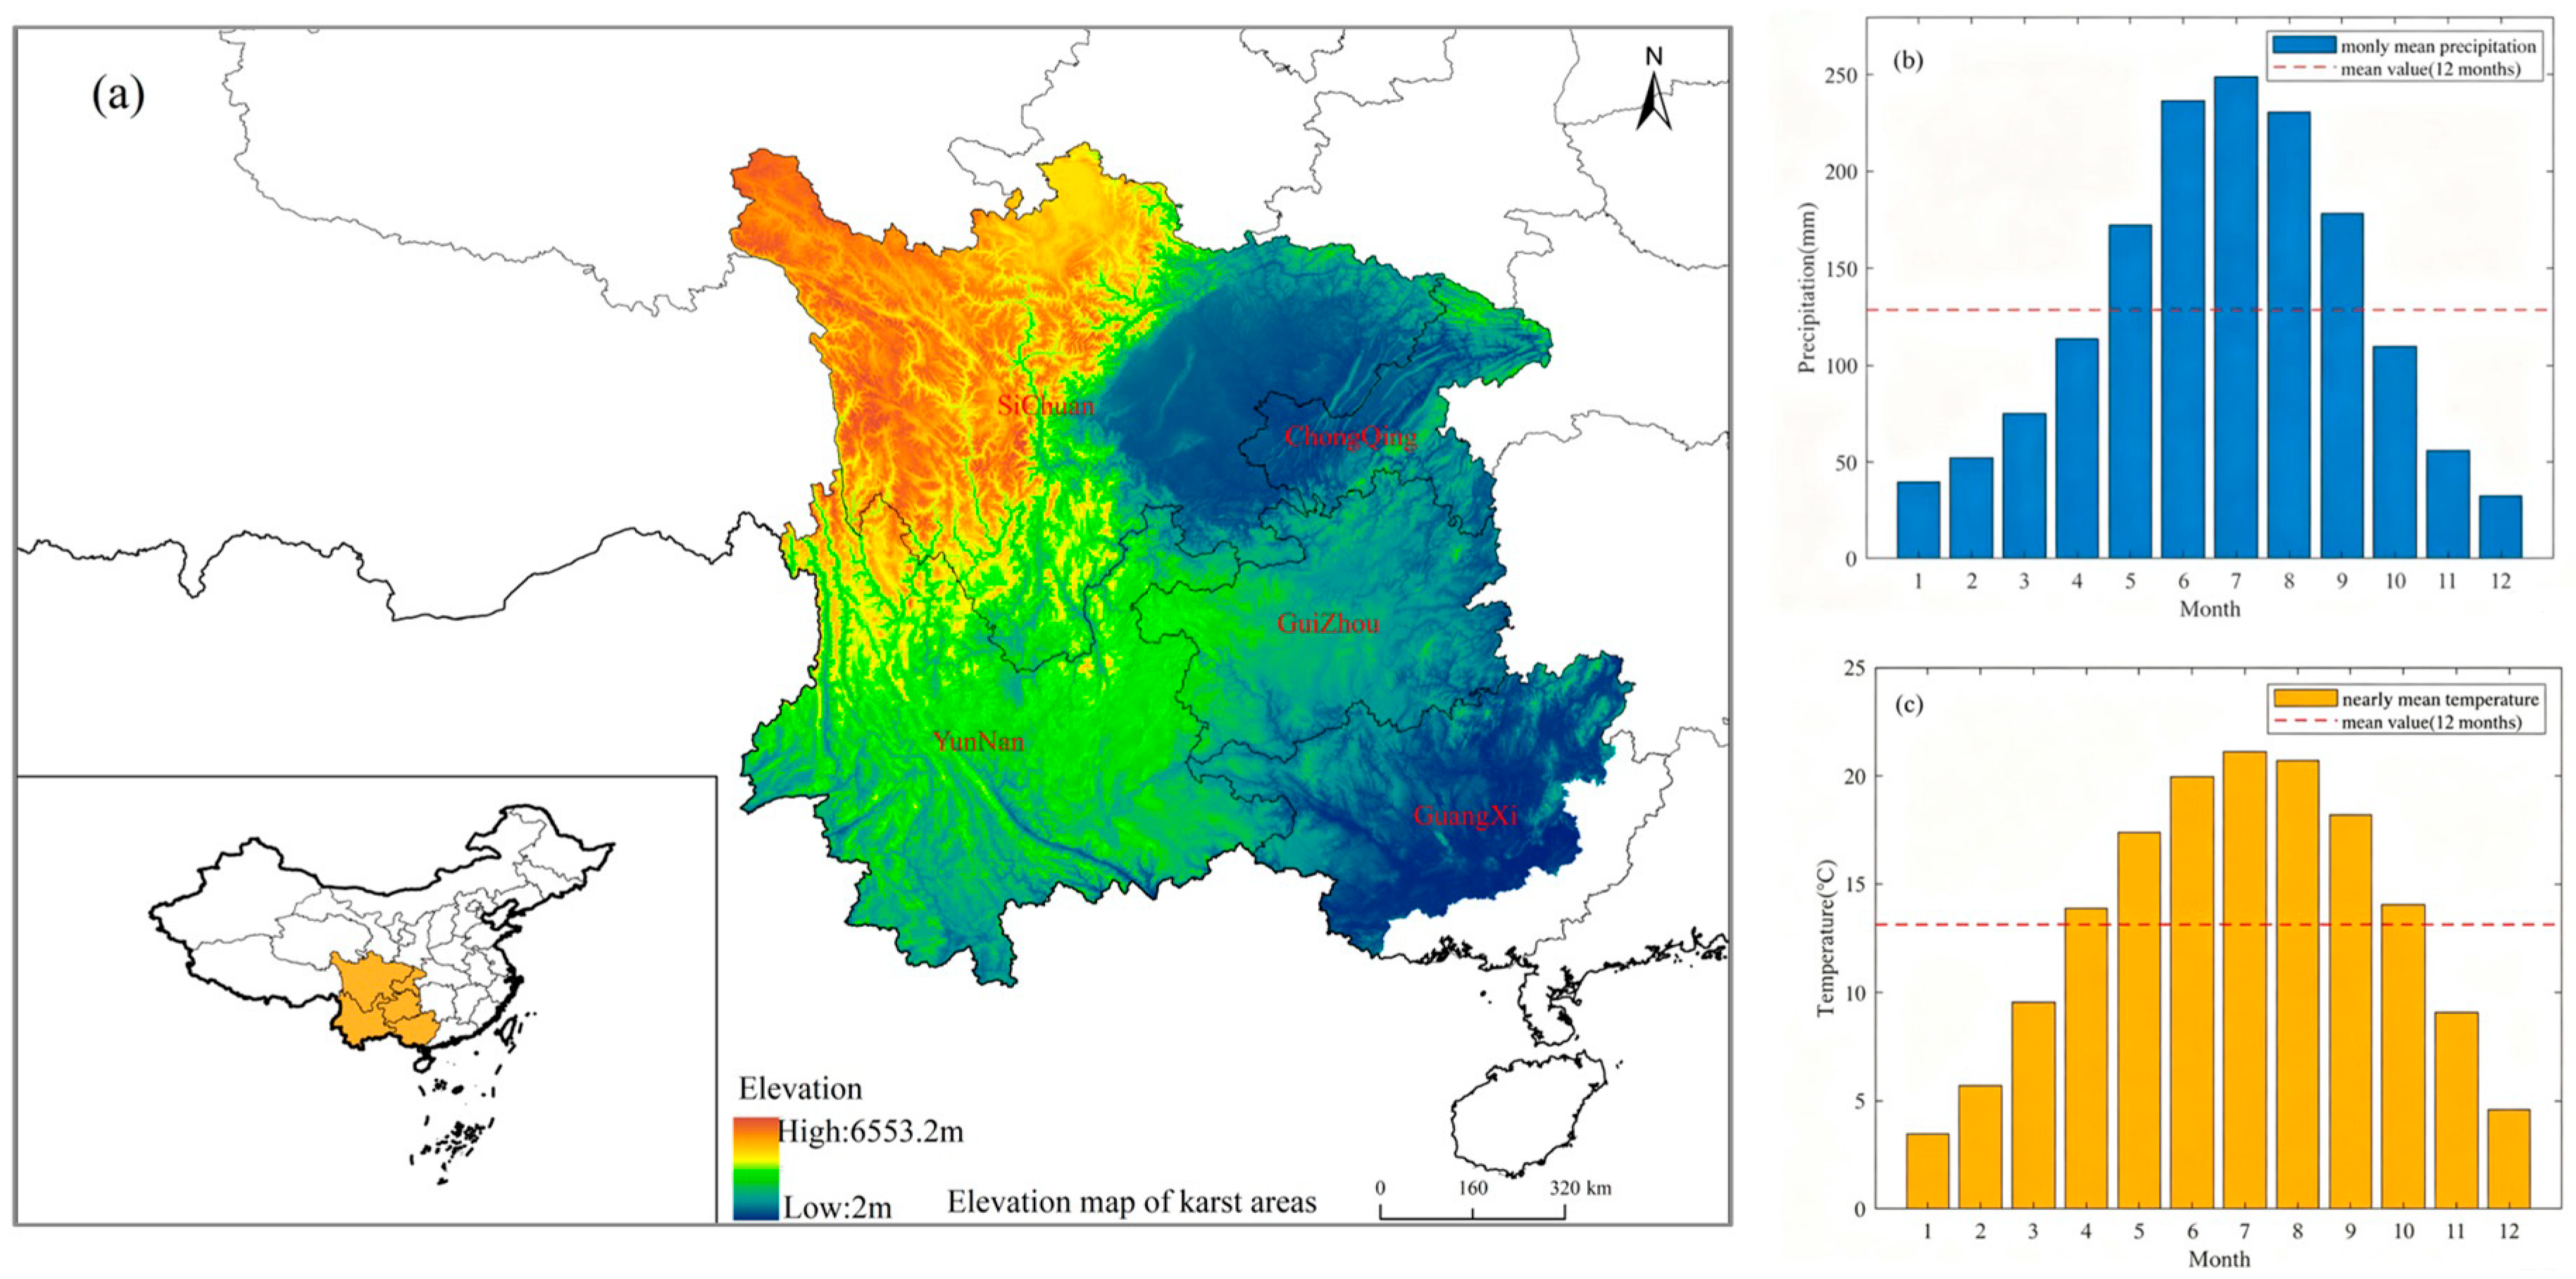
The study area (97°21′–112°04′ E, 20°54′–34°19′ N) is located in southwestern China (Figure 1a), encompassing five provincial-level administrative regions: Chongqing, Sichuan, Yunnan, Guizhou, and Guangxi. The region covers approximately 1,376,270 km2 and features higher elevations in the north and west and lower elevations in the south and east. The SKA is predominantly influenced by subtropical monsoon and subtropical plateau monsoon climates, with monthly average precipitation ranging from 32 to 250 mm. Precipitation distribution is temporally heterogeneous, with most occurring between May and September (Figure 1b). Monthly average temperatures range from 3 to 22 °C, with higher temperatures recorded from May to September, exhibiting a characteristic rainfall–heat synchrony pattern (Figure 1c).
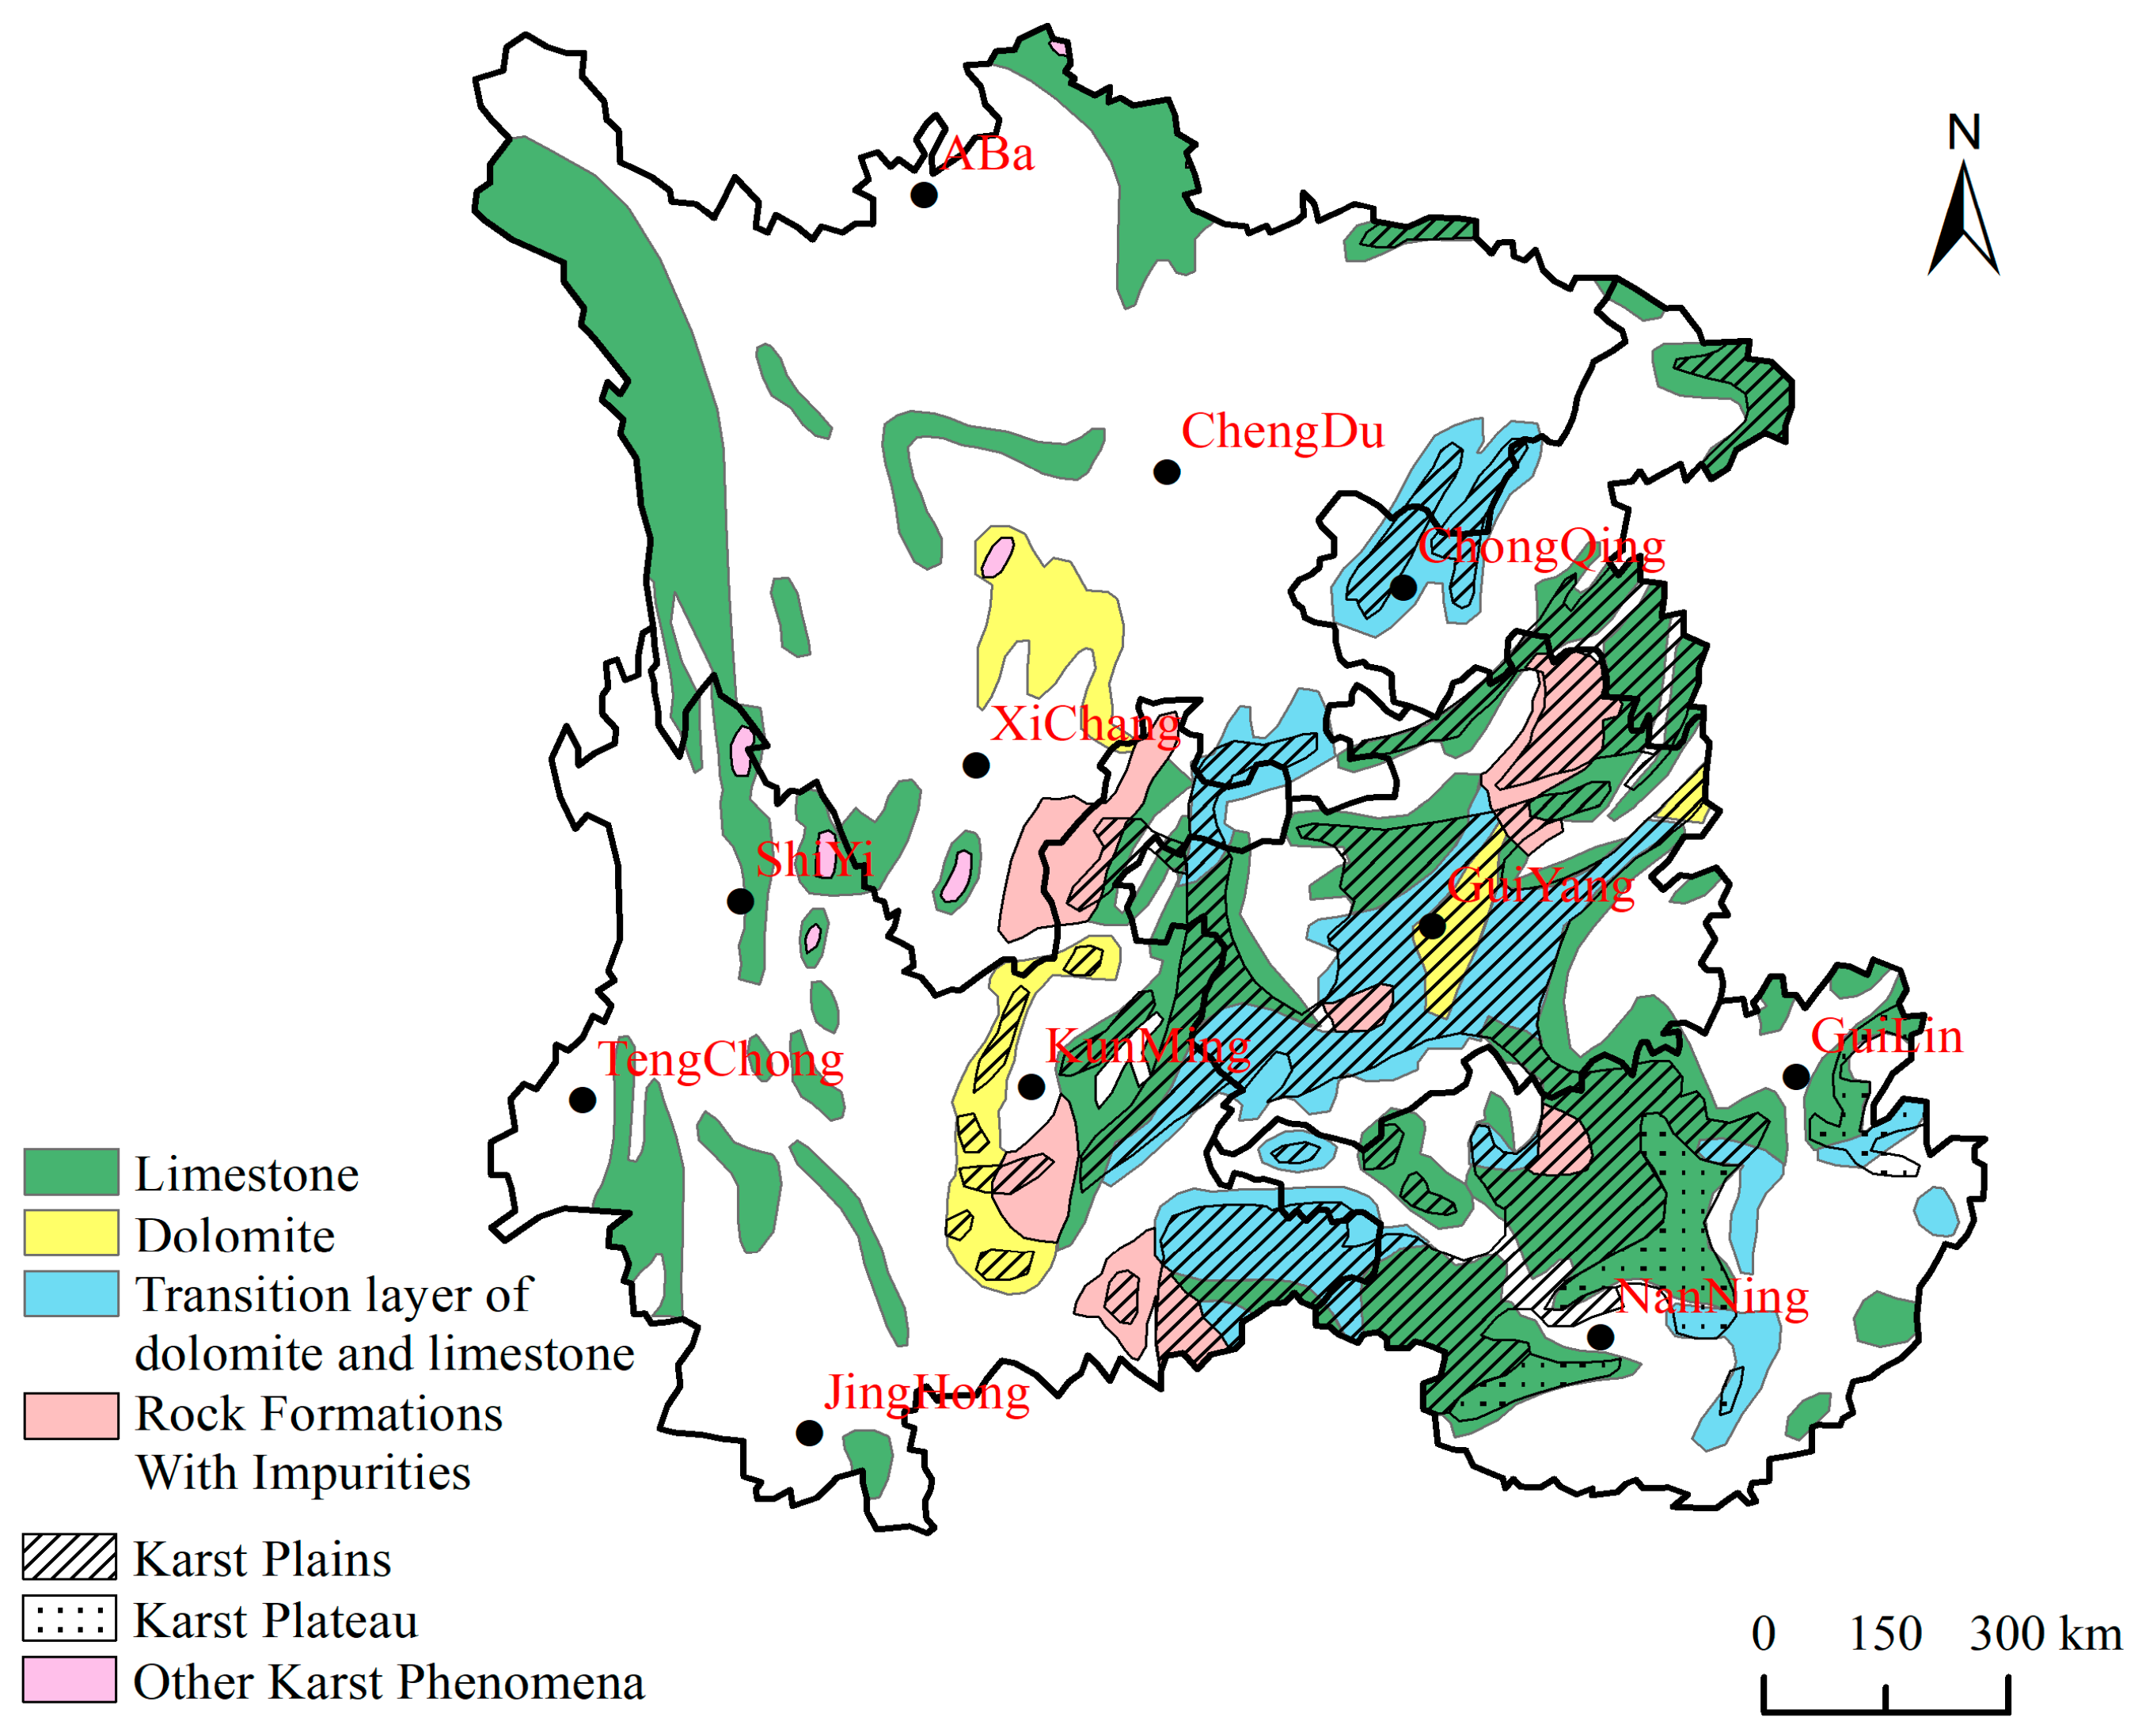
The SKA is characterized by unique hydrogeological conditions, including rugged surface topography, shallow, nutrient-poor soils, high surface-water infiltration, limited surface-water availability, and well-developed underground karst river systems [19]. These factors collectively contribute to the heightened drought sensitivity characteristic of karst regions. Drought occurring in such specialized environments is referred to as karst drought [30]. Furthermore, the distribution of karst landforms within the SKA exhibits marked regional concentration. Karst features are densely distributed in Guangxi, Guizhou, and the western Sichuan Plateau, whereas they are relatively sparse in Yunnan and the Sichuan Basin. Regarding carbonate rock types, Guangxi is predominantly limestone, whereas a transitional zone between limestone and dolomite dominates Guizhou. In addition, Guangxi exhibits a greater diversity of karst landform types than Guizhou (Figure 2).

2.2. Data Sources

Meteorological data used in this study—including temperature, precipitation, relative humidity, and related variables—were obtained from the ERA5-Atmosphere reanalysis dataset provided by the European Center for Medium-Range Weather Forecasts (ECMWF). This dataset is widely used due to its high spatial resolution, rigorous quality control, and regular updates. The soil moisture data are derived from the ECMWF ERA5-Land reanalysis dataset, which closely agrees with Chinese observational data and performs well across all land-use types in China [32].
The reanalysis dataset is characterized by high spatiotemporal resolution and temporal continuity. ERA5 provides a spatial resolution of 0.25° × 0.25° and a monthly temporal resolution, covering the period from January 1979 to December 2023 (Table 1).

2.3. Methodology

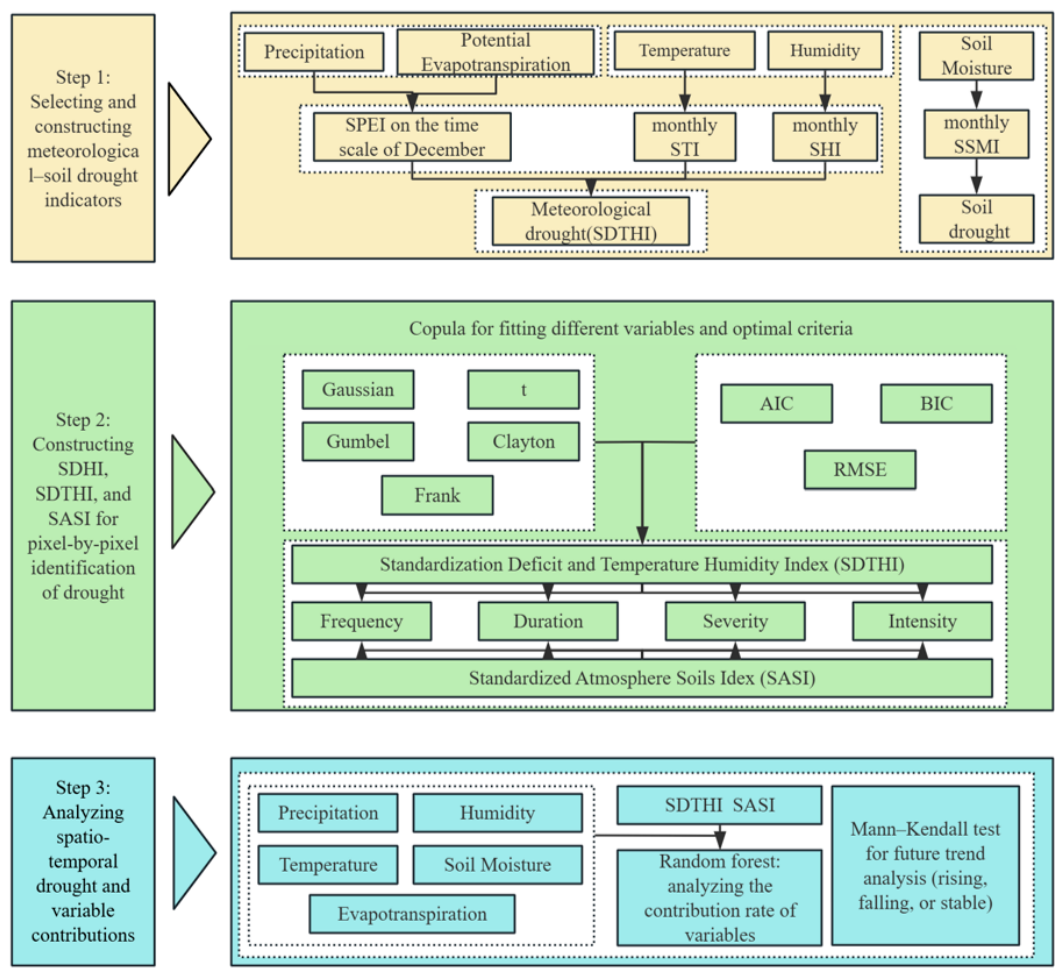
The methodological framework of this study consists of three main components (Figure 3). The first component involves selecting the optimal probability density function for each variable—water deficit or surplus (P-PET), temperature, soil moisture, and relative humidity—and subsequently calculating their corresponding standardized indices. The second component constructs composite drought indices using copula theory: the Standardized Deficit Temperature Index (SDTI), the Standardized Deficit Temperature–Humidity Index (SDTHI), and the Standardized Atmospheric–Soil Index (SASI). Based on these indices, we characterize the spatiotemporal patterns of general drought, atmospheric drought, and composite drought in terms of duration, intensity, severity, and frequency. The third component employs the Mann–Kendall (M–K) test and Sen’s slope estimator to examine drought trends and uses random forest analysis to identify potential underlying drivers. A detailed description of each method is provided below. In addition, the software versions used in this study are MATLAB R2025b, ArcGIS 10.2, and AXMath 2.5.

2.3.1. Calculation of Potential Evapotranspiration

This study employs the Thornthwaite method to calculate potential evapotranspiration [33]. This method requires only the monthly mean temperature and estimates PET as a function of temperature raised to a power. It is closely integrated with climate classification systems. It has been widely used in research on water balance, agricultural zoning, and drought assessment, effectively reflecting the dominant role of temperature in evapotranspiration [34,35]. The specific calculation procedure is as follows:
P E T = 16.0 × ( 10 T i H ) 4
H = i = 1 12 H i = i = 1 12 ( T i 5 ) 1.514
A = 6.75 × 1 0 2 H 3 7.71 × 1 0 5 H 2 + 1.792 × 1 0 2 H + 0.49
In Equations (1)–(3), P E T denotes potential evapotranspiration, T i represents the monthly mean temperature, H indicates the annual heat index, H i signifies the monthly heat index, and A is a constant. When the monthly temperature is less than or equal to 0, both the monthly heat index and potential evapotranspiration are set to 0.

2.3.2. Standardized Index

To characterize drought conditions, the Standardized Precipitation Index (SPI), proposed by McKee et al., is recommended by the World Meteorological Organization (WMO) for its effectiveness in identifying drought onset. The detailed calculation procedure comprises the following three steps:
First, precipitation observations are aggregated at a specific time scale. For SPEI calculation, PET and water balance data are also required. Second, the aggregated monthly precipitation series is fitted using probability distribution functions. This study employs four probability distributions that accommodate negative values in the series: the Generalized Extreme Value (GEV), Logistic, Normal, and t-location-scale distributions [36]. Goodness-of-fit is assessed using the Akaike Information Criterion (AIC), root mean square error (RMSE), and Kolmogorov–Smirnov (K–S) test.
Distribution parameters were estimated using maximum likelihood estimation for the SPI, while SPEI parameters were derived using the method of least squares. The SPI parameters are given by:
{ α ^ = 1 4 A ( 1 + 1 + 4 A 3 ) β ^ = x ˉ α ^ A = l n ( x ˉ ) l n ( x ) n
In Equation (4), x represents the mean of the precipitation observation. Given that the gamma distribution is invalid for x = 0 and that aggregated precipitation sequences may contain zero values, the cumulative probability G ( x ) is modified to H ( x ) :
H ( x ) = ( 1 q ) G ( x ) + q
Third, the cumulative probability distribution function is normalized to a normal distribution. The SPI formula is calculated as follows:
S P I = { ( t c 0 + c 1 t + c 2 t 2 1 + d 0 + d 1 t + d 2 t 2 + d 3 t 3 ) , w h e n 0 < H ( x ) 0.5 + ( t c 0 + c 1 t + c 2 t 2 1 + d 0 + d 1 t + d 2 t 2 + d 3 t 3 ) , w h e n 0.5 < H ( x ) 1
t = { l n 1 [ H ( x ) ] 2 ,   w h e n   0 < H ( x ) 0.5 l n 1 [ 1 H ( x ) ] 2 ,   w h e n   0.5 < H ( x ) 1
In Equations (6) and (7), c 0 , c 1 , c 2 , d 1 , d 2 and d 3 are 2.515517, 0.802853, 0.010328, 1.432788, 0.189269, and 0.001308, respectively.
Given the widespread application of the Standardized Precipitation Index (SPI) in drought research, its standardization principle can be extended to other hydrological variables—such as soil moisture, temperature, and relative humidity—to develop a suite of standardized indices for monitoring different drought types within the hydrological cycle. For example, the Standardized Temperature Index (STI) effectively captures the spatiotemporal characteristics of temperature and is frequently used alongside SPI at the monthly scale to identify hot and dry events [37]. The Standardized Soil Moisture Index (SSMI) has been shown to reliably assess soil moisture conditions, thereby accurately characterizing historical agricultural drought events [38,39]. Previous studies have also demonstrated that the Standardized Precipitation–Evapotranspiration Index (SPEI), which incorporates potential evapotranspiration, offers advantages over the SPI [40,41]. Furthermore, the Standardized Relative Humidity Index (SHI) has been suggested to detect drought onset earlier than the SPI, making it a valuable addition to drought monitoring systems [42,43].

2.3.3. Copula Theory

Copula theory was first proposed by Sklar in 1959 as Sklar’s theorem: any multivariate joint distribution can be expressed in terms of univariate marginal distribution functions and a copula that describes the dependence between variables [44]. If H ( x , y ) is a bivariate joint distribution function with continuous marginal distributions F ( x ) and G ( y ) , then there exists a unique copula function C such that H ( x , y ) = C ( F ( x ) , G ( y ) ) . Conversely, if C is a copula function, and F and G are any two probability distribution functions, then the function H defined by the above equation must be a joint distribution function. Moreover, its corresponding marginal distributions are precisely F and G , i.e.,:
C ( u , v ) = H ( F 1 ( u ) , G 1 ( v ) ) = P ( x F 1 ( u ) , y G 1 ( v ) ) = P ( F ( x ) u , G ( y ) v )
Drought is a typical multidimensional event, with common indicators including duration, severity, peak intensity, and recurrence interval. Copulas enable the selection of appropriate marginal distributions (e.g., Gamma, Weibull) for each variable and then describe the correlations between them via a link function, without being constrained by linear correlations or homoscedasticity. Equation (8) shows that a bivariate copula can link the optimal marginal distribution functions of these standardized indices. Therefore, this study selected five bivariate copulas that perform well for hydrometeorological variables: the Gaussian, t-, Gumbel, Frank, and Clayton copulas [45,46,47].
The AIC, Bayesian Information Criterion (BIC), and RMSE are widely employed to evaluate the fitting performance of bivariate copulas [48]. Lower values of these criteria indicate better model fit and higher accuracy. In this study, the optimal copula is selected based on a comprehensive evaluation using all three metrics.

2.3.4. Run Theory

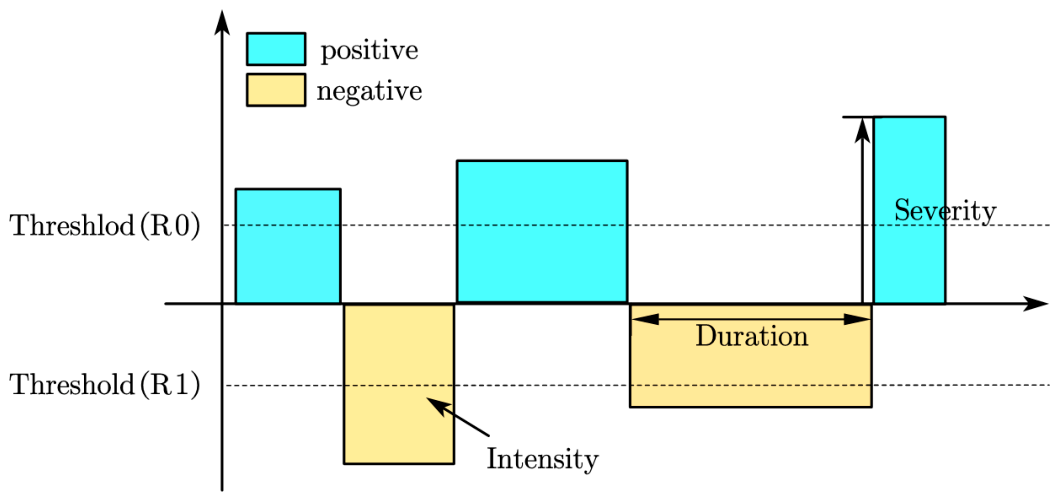
Yevjevich first applied the run theory to describe and identify drought events. Since then, this approach has been widely adopted in meteorology, hydrology, and related fields [49,50,51]. It provides a key methodological framework for the secondary analysis of standardized drought index time series (e.g., SDTI), aiming to objectively identify discrete drought events within continuous index series and quantify their internal structure and statistical characteristics (Figure 4). The procedure involves three steps:
(1)
Threshold selection. Drought duration and intensity are selected as characteristic factors for identifying drought events. When the drought index falls below R1(−0.5), that month is preliminarily identified as a drought month.
(2)
Drought event identification. If the drought index remains below R1 for more than one consecutive month, the period is recorded as a drought event. Conversely, if the index remains below R1 for less than one month, it is classified as a non-drought month.
(3)
Quantification of drought characteristics. Drought frequency refers to the number of drought events occurring within a given hydrological sequence. Drought duration denotes the length of time the drought index remains below the threshold. Drought intensity is the cumulative sum of the absolute values of the drought index over the duration (the yellow region in Figure 4). Drought intensity is defined as the average value of the cumulative drought index over the duration of a single drought event—that is, the cumulative index divided by the duration (The height of the blue region in Figure 4).
In addition, the 2008 Global Land Degradation Assessment provides vector data on rock types, enabling statistical analysis at the grid level and thus quantifying drought intensity, severity, frequency, and duration in karst and non-karst areas.

2.3.5. Trend Analysis

The M–K test and Sen’s slope estimator are widely used nonparametric statistical methods for trend detection. Owing to their advantages—such as not requiring a joint distribution of the data and being robust to outliers [53]—they have been extensively applied to hydrological time series [54,55,56,57]. In this study, we employ both methods to detect temporal trends in drought characteristics. Sen’s slope is calculated as follows:
β = m e d i a n ( X j X i j i ) 1 < i < j < n
In Equation (9), Median denotes the median value, β represents the slope trend, where a positive value indicates an upward trend, a negative value indicates a downward trend, and a value of 0 indicates no significant trend. Additionally, the statistic in the M–K test | Z | is considered significant at the 0.05 significance level when it is greater than or equal to 1.92.

2.3.6. Random Forest

The random forest model, a machine learning algorithm proposed by Breiman, is widely used for classification, regression, and other predictive tasks [58,59]. In addition, it can be used for feature selection by measuring variable importance after fitting the data—specifically, each feature’s contribution to each tree in the random forest, quantified by changes in the out-of-bag error rate.
The fundamental idea of random forests is to build a large number of uncorrelated decision trees using a bagging ensemble method with random feature selection at each node, and then aggregate the results via simple voting or averaging. This approach significantly reduces variance while maintaining low bias, enabling robust modeling of high-dimensional, nonlinear data with complex interactions. Within this framework, out-of-bag mean squared error (OOB MSE) is commonly used as a model evaluation metric. For each decision tree, predictions are made on the out-of-bag data (approximately one-third of the samples) not used during training. The mean of the predictions from all trees is then compared with the true values to compute the mean squared error. This metric provides an unbiased estimate of the model’s generalization error without requiring a separate validation set. Based on these principles, to prevent overfitting, this study sets the minimum number of samples per leaf node to 5 while keeping all other parameters at their default values. To enhance model transparency, this study evaluates model performance using R2 and RMSE, calculated on a randomly selected test set comprising 20% of the data.

3. Results

3.1. Optimal Marginal Distribution and Copula

This paper employs three methods—AIC, BIC, and RMSE—to evaluate the quality of copula fitting. Given that these criteria may yield divergent outcomes, the BIC-based results are selected for the final analysis. This choice is justified because RMSE is sensitive to extreme values, and BIC imposes a larger penalty term than AIC, which also accounts for sample size. With a larger sample, BIC helps prevent overfitting by penalizing model complexity, thus favoring simpler models with fewer parameters [60]. Notably, this issue did not arise when fitting the optimal marginal distribution.
Table 2 shows that among all optimized marginal distributions of the standardized indices, the Gev copula exhibits the highest pixel coverage, with proportions of 81.69%, 73.98%, 50.75%, and 54.76%, respectively. In contrast, the t-location-scale distribution shows the lowest coverage, at 1.07%, 1.79%, 11.73%, and 6.75%.
Table 3 presents the proportions of optimal copulas for the three drought indices within the SKA region. Specifically, the Clayton copula accounts for the largest pixel proportion in both SDHTI and SASI, at 68.4% and 73.3%, respectively, whereas the Gumbel copula has the highest proportion in SDTI. Regarding the smallest shares, the Frank copula occupies the lowest pixel proportion in SASI (0.3%), the t copula is the least frequent in SDTI (also 0.3%), and the Gumbel copula represents the smallest proportion in SDHTI (0.5%).

3.2. Spatial-Temporal Patterns of Composite Drought

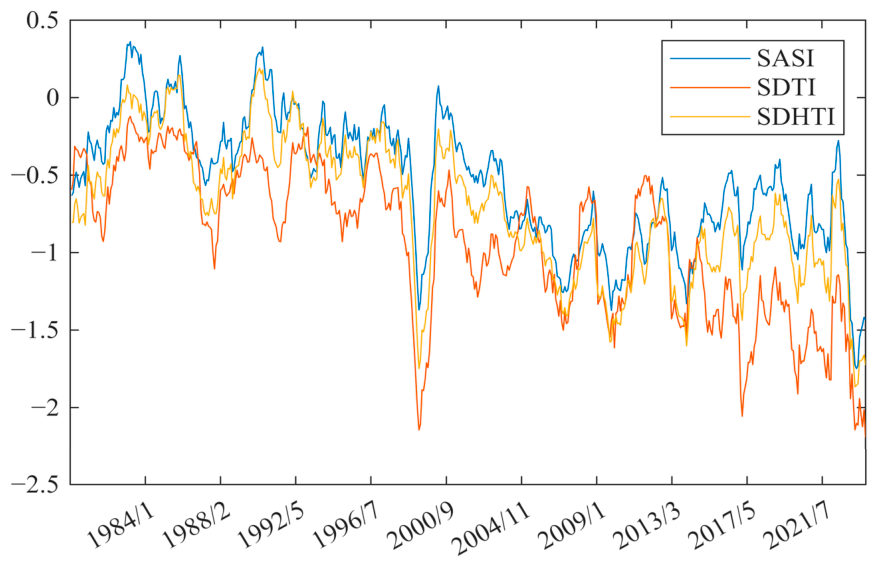
From 1979 to 2018, the average trends of SDTI, SDHTI, and SASI in the SKA region exhibited coherent temporal patterns. The rates of decline for all three indices accelerated sharply starting in August 1998, with each reaching its lowest point in March 1999—recording values of −2.14, −1.75, and −1.37, respectively. Following a gradual recovery until April 2000, the indices resumed their decline, reflecting an overall downward trajectory (Figure 5). This pattern suggests that drought conditions have intensified against the backdrop of global warming.
Throughout the study period, SASI values ranged from 0.68 to −1.74, SDTI from 0.73 to −2.73, and SDHTI from 0.60 to −1.99. Overall, the three drought indices exhibited a consistent ranking: SASI > SDHTI > SDTI (Figure 5).
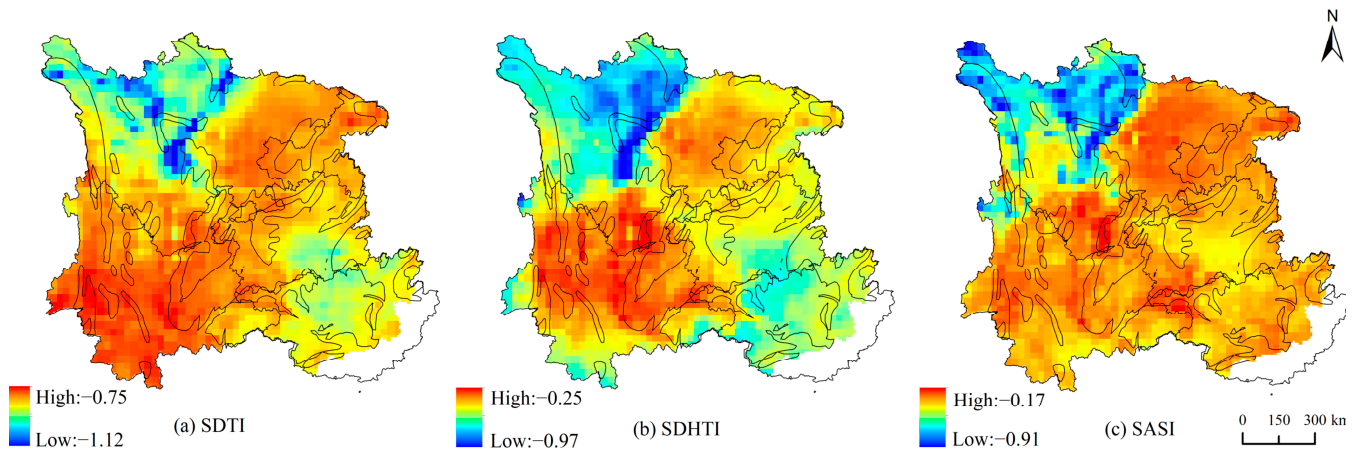
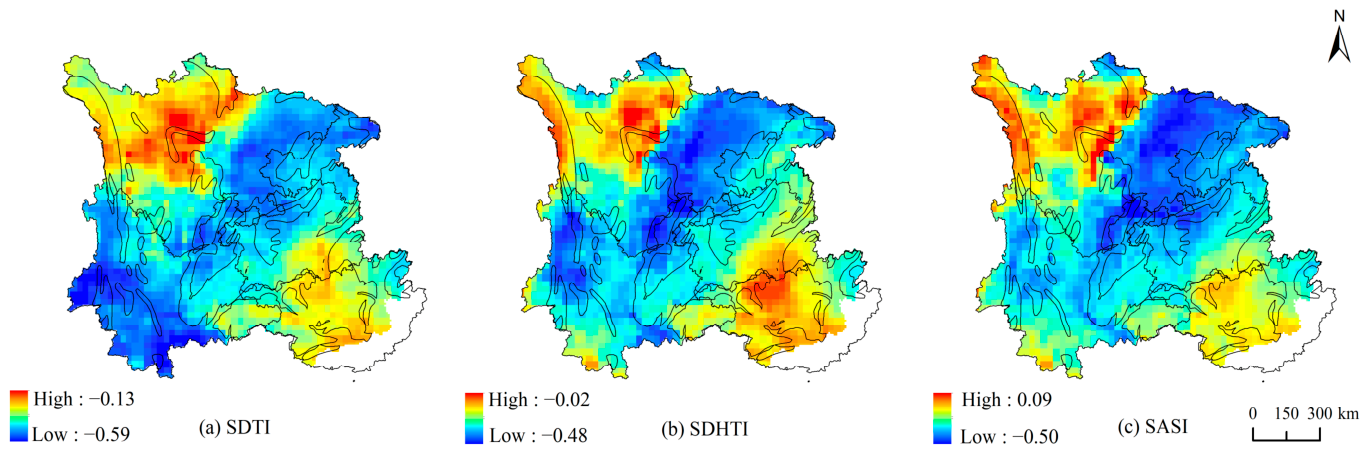
Figure 6 illustrates the spatial distribution of the three drought indices. The distribution patterns exhibit similarities, with lower values on the western Sichuan Plateau and in Guangxi, while high-value areas are mainly concentrated in the Sichuan Basin and Yunnan. Topographically, drought severity in southern Guangxi exceeds that in the Sichuan Basin, and drought conditions in Yunnan are more pronounced than those in Chongqing. On the western Sichuan Plateau, the three drought indices exhibit distinct spatial patterns, with the most pronounced values at the junction of Aba–Ganzi Prefecture and the Mianyang–Chengdu–Deyang area. This region marks the boundary between the highlands and the valleys and closely aligns with the karst distribution zone. This phenomenon may be attributed to rapid water loss and reduced soil water retention capacity, which exacerbate drought conditions.
Severe drought areas are typically concentrated in transitional zones, such as the boundary between Aba and Ganzi Prefectures, where significant topographic changes occur. Mild droughts exhibit a distinctive dumbbell-shaped pattern spanning the Sichuan Basin and Yunnan. In contrast, Yunnan exhibits relatively high SDTI values compared with other regions (Figure 6a).
The spatial distribution of atmospheric drought exhibits more pronounced regional patterns. In addition to the topographic junctions, the most severe drought conditions are concentrated in Aba Prefecture. Yunnan records the highest SDHTI values, followed by the Sichuan Basin; however, the distinctive dumbbell-shaped pattern observed in other indices is no longer present (Figure 6b).
The spatial pattern of compound droughts is more pronounced, with mild drought conditions dominating most areas except the western Sichuan Plateau. Extending from the northwest to the southeast of the SKA region, a band of moderate drought separates the mild drought areas of Yunnan from those in the Sichuan Basin (Figure 6c).
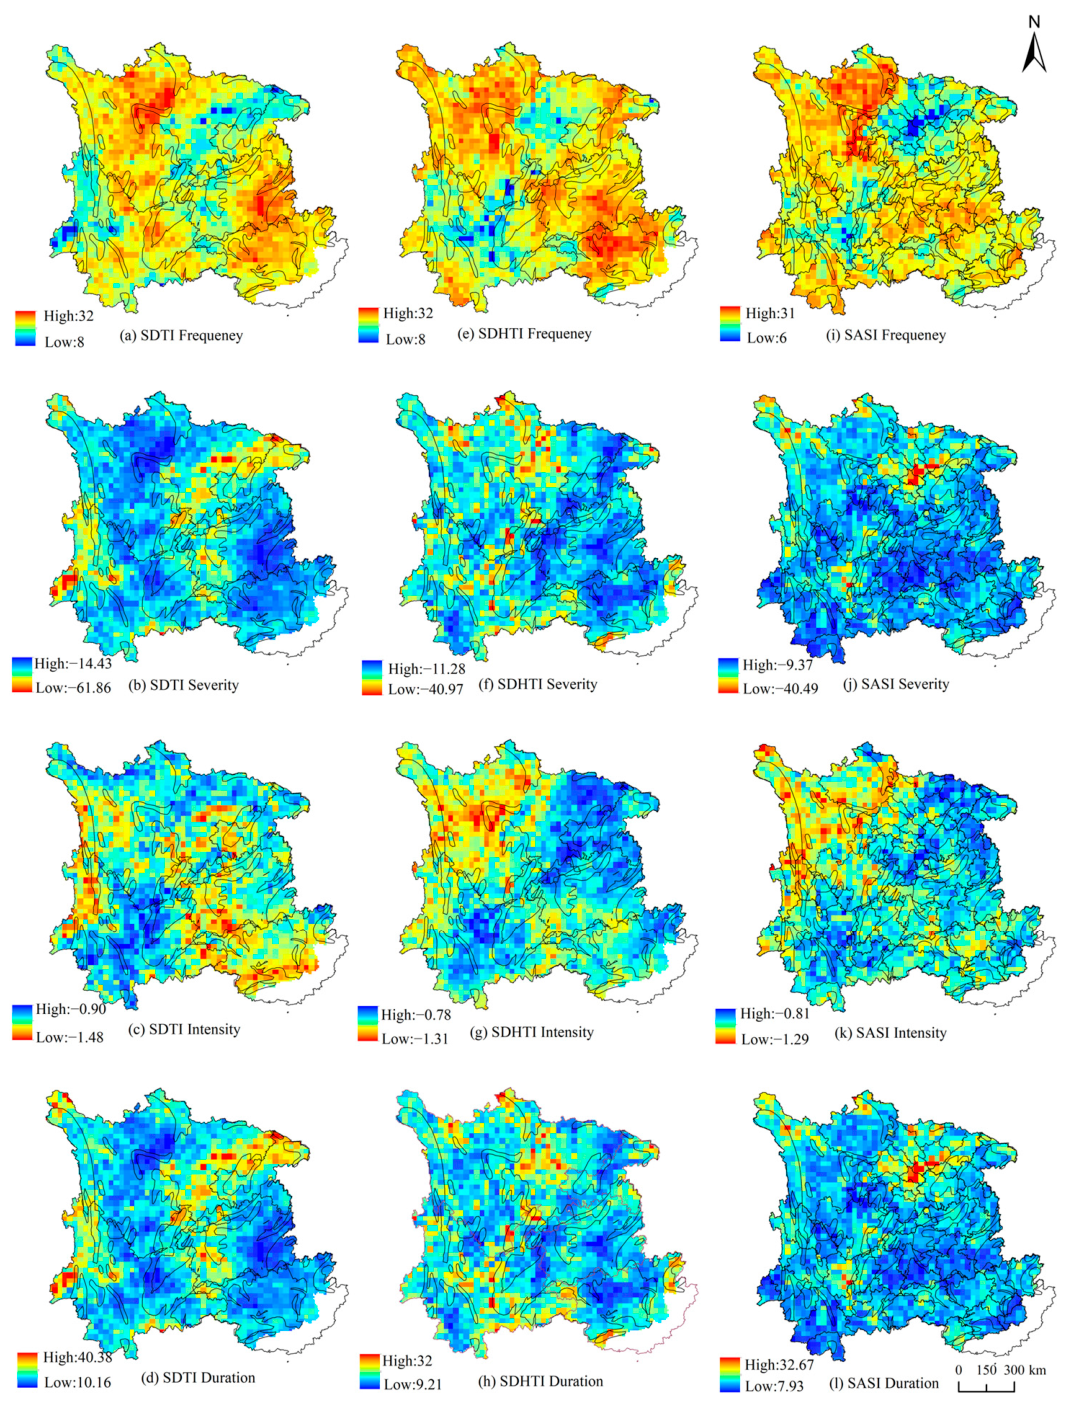
Based on the run theory, this study examines the spatial distribution of frequency, intensity, severity, and duration for drought, atmospheric drought, and compound drought (Figure 7). Overall, these phenomena occur more frequently and with greater intensity in areas with more pronounced karst development. However, in these same areas, they tend to have shorter durations and lower severity—most notably in the western Sichuan Plateau and Guangxi region.
The frequency distribution of general droughts differs markedly from that of the other two drought types. High frequencies are observed in the Guangxi region, with a band-like distribution extending from the western Sichuan Plateau to parts of Yunnan, while frequencies are lower elsewhere. The distribution of intensity resembles that of frequency, and the distribution of severity resembles that of duration. This indicates that in regions with higher drought frequency, drought intensity is typically higher, whereas severity is lower and duration is shorter (Figure 7a–d).
The frequency distributions of atmospheric drought and composite drought exhibit similar characteristics, with high-value (low-value) centers in the Sichuan Basin and Yunnan, while variations elsewhere are relatively mild (severe). Overall, regions with high frequency and high intensity are characterized by shorter durations and lower severity (Figure 7e–l). Furthermore, this pattern generally aligns with the distribution of karst terrain. For example, in Guangxi, SDTI frequency and severity are high, but intensity is low, and duration is short; in the Sichuan Basin, the opposite is true.
In summary, the influence of karst distribution and topography is reflected not only in drought indices but also significantly affects the frequency, severity, intensity, and duration of different drought types. This suggests that in highly developed karst areas, these three drought types tend to occur more frequently and cause greater damage. Such characteristics are especially pronounced in Guangxi, possibly due to the presence of diverse karst landforms.

3.3. Trends in Composite Drought

In this section, trend changes in compound drought events within the SKA region were assessed using the nonparametric M–K trend test, applied to three drought indices: SDTI, SDHTI, and SASI (Figure 8). Regarding spatial distribution, all three indices exhibit similar patterns: a distinct belt extending from the southeast to the northwest of the SKA region, where the trend of drought intensification is particularly pronounced. In contrast, other regions show a weaker intensification trend or, in some cases, an extremely weak moderation trend.
Overall, drought in the SKA region shows an increasing trend, consistent with the rising frequency of drought and hot weather observed in recent decades. In areas with concentrated karst formations, spatial variations in this trend are pronounced: intensification is weaker in Guangxi but stronger elsewhere, with this contrast being particularly evident in atmospheric drought. This disparity may be attributed to Guangxi’s lower elevation. Additionally, in Sichuan Province, where karst landforms are sparsely distributed, drought intensification is relatively mild.
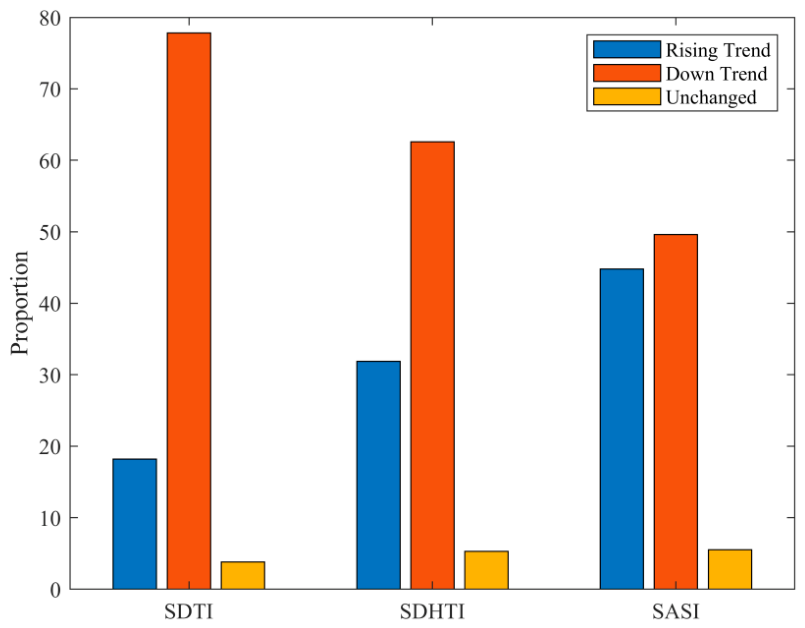
At a significance level of α = 0.05, if | Z | 1.96 the null hypothesis is rejected, indicating that the original time series exhibits a statistically significant upward or downward trend (none of the grid cells in the study area passed the hypothesis test, indicating no significant trend). Each grid point was processed, and the results are summarized in Figure 9. Among the three indices—SDTI, SDHTI, and SASI—the proportions of grid points showing a downward trend were 77.8%, 62.6%, and 49.6%, respectively, while those exhibiting an upward trend accounted for 18.2%, 31.9%, and 44.8%, respectively. The proportion of grid points with no significant change averaged 4.87%. These results indicate that, during compound drought events, the intensification of drought conditions is gradually slowing, although the overall upward trend persists.

3.4. Potential Drivers of Compound Drought

Factors such as temperature, precipitation, evapotranspiration, soil moisture, and humidity all influence drought and compound drought events to varying degrees. Accordingly, this section employs a random forest model to assess the contributions of these drivers to the three drought indices. As shown in Table 4, SDTI and SDHTI demonstrate excellent goodness-of-fit (R2 > 0.95), indicating that the models effectively capture the complex relationships between the input variables and the target variable. The fitting accuracy of SASI is relatively low, but this is considered acceptable given the complex karst terrain. Despite some uncertainty, the variable importance rankings it provides still retain relative reference value.
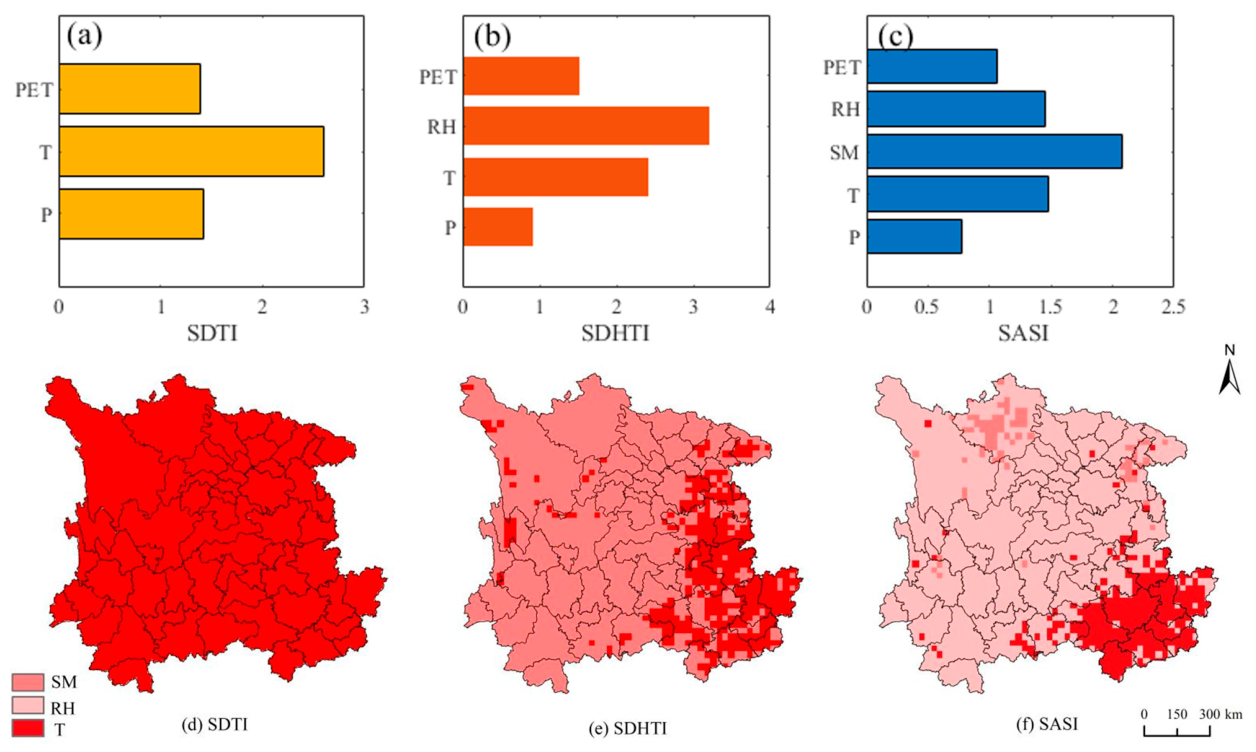
For SDTI, temperature is the dominant driver, with a contribution rate of 2.60—approximately 45.9% higher than that of the other two factors. Spatially, temperature also emerges as the primary driver across all grid points. In the case of SDHTI, humidity is the leading contributor, with a rate 3.21–32.4% higher than that of temperature. Spatially, humidity dominates in most regions except Guangxi, accounting for 83.1% of all grid points. For SASI, soil moisture is the primary driver, with a contribution rate of 2.08. Spatially, soil moisture is the primary driver for 84.9% of grid points, followed by temperature (12.3%) and humidity (2.6%).
In Figure 10d–f, temperature is the primary driver in the vast majority of grid cells in Guangxi. This suggests that in environments characterized by limestone and a greater diversity of karst features, temperature exerts a stronger influence on the three drought types than other factors. Furthermore, temperature exerts a significant influence on both atmospheric and compound droughts, with contribution rates of 2.60, 2.42, and 1.48 for the SDTI, SDHTI, and SASI, respectively, indicating a decreasing trend.

4. Discussion

4.1. Potential Drivers of Compound Drought

In drought-related research, temperature and precipitation are two key factors often combined to assess regional dryness and heat intensity [61,62]. In southern China, soil moisture plays a crucial role in agricultural drought [63,64,65,66]. Relative humidity is another important climatic variable, often more sensitive to drought than precipitation [43]. This greater sensitivity arises because precipitation and relative humidity are correlated; under low relative humidity conditions, precipitation is unlikely to occur [67]. Drought indices developed from these elements have been widely applied in both drought research and studies of abrupt flood–drought transitions. Such indices enable drought identification through threshold-based methods and effectively capture the spatiotemporal characteristics of drought events.
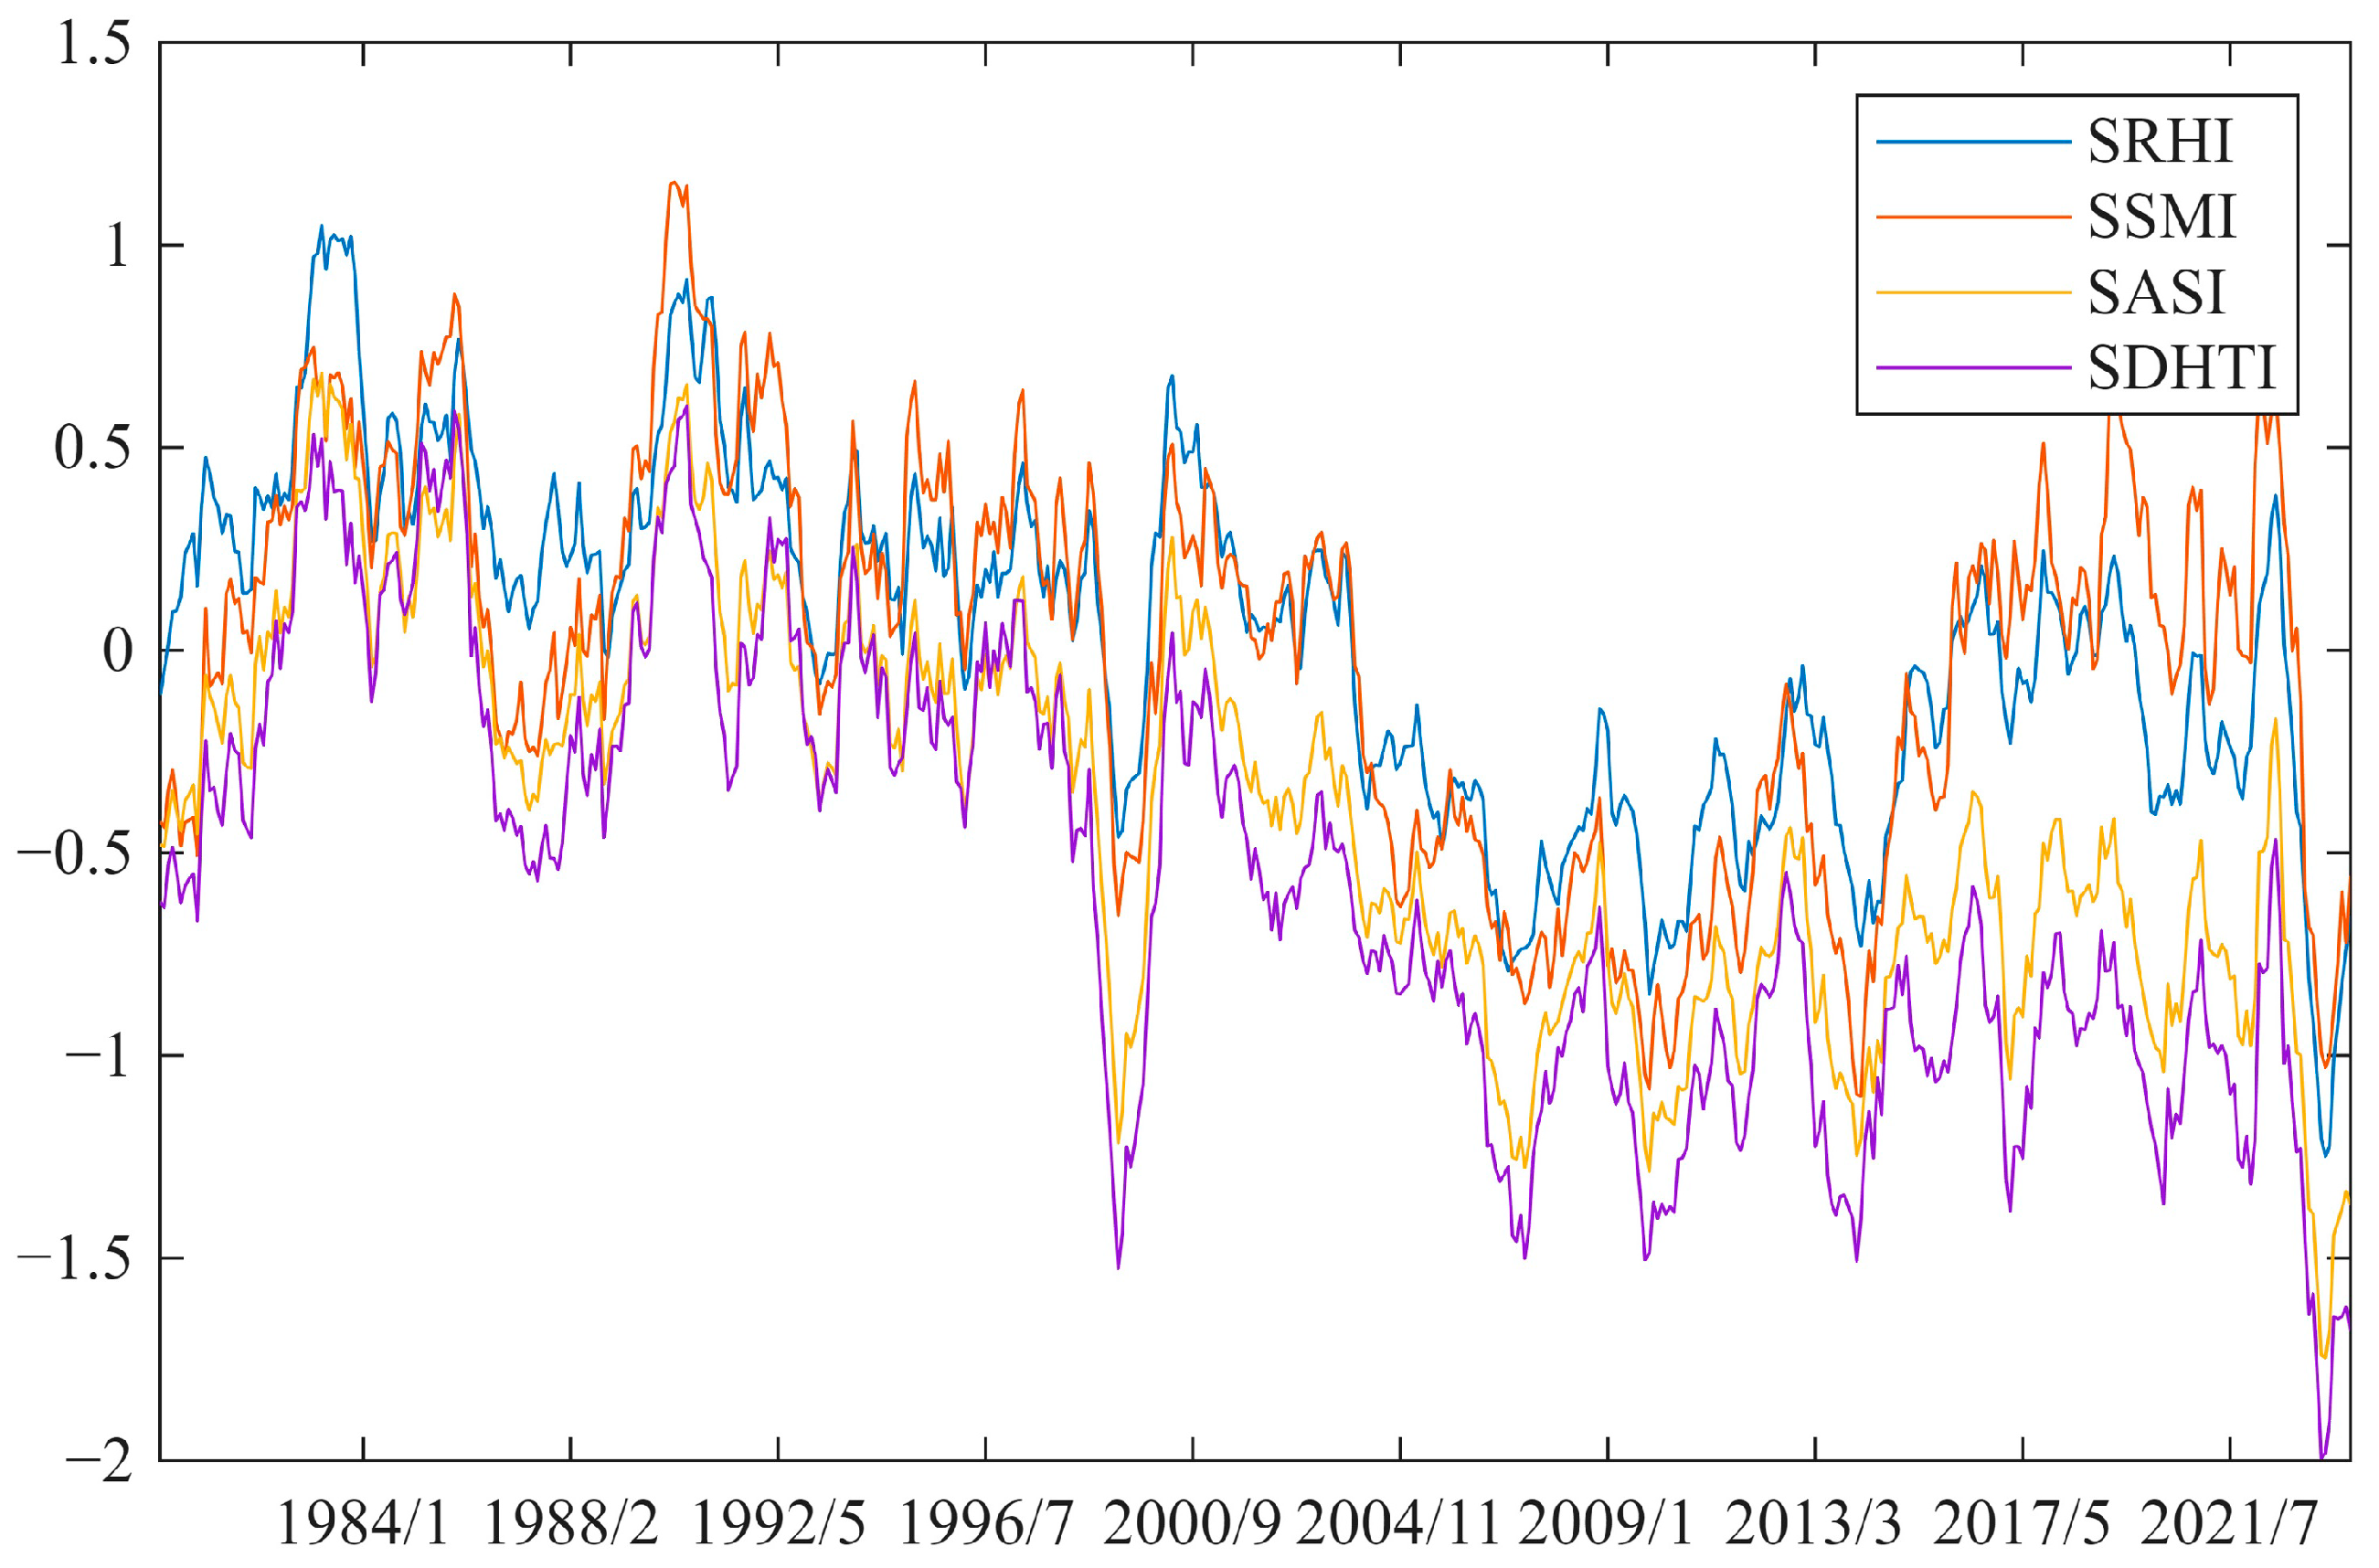
An initial analysis of pixel-wise correlations among the indices was conducted using the mean values. From 1979 to 2023, strong consistency was observed between the mean SDHTI/SASI and the mean SRHI/SSMI across the SKA region. Furthermore, Pearson correlation coefficients indicate that SDHTI correlates strongly with SRHI (r = 0.8059), while SASI exhibits even stronger correlations with SRHI (r = 0.8418) and SSMI (r = 0.9611). These results demonstrate that the constructed drought indices effectively capture humidity and soil moisture conditions within the SKA region.
Moreover, as shown in Figure 11, the rate of decline for all indices accelerated significantly starting in August 1998, reaching its minimum in March 1999. Subsequently, the indices gradually recovered until April 2000, and then resumed a gradual decline. This trend may be associated with the 1998/1999 La Niña event [68,69]. Following the strongest El Niño event in the summer of 1998, a strong La Niña event developed in October of the same year. It peaked in January 1999, then gradually weakened before re-intensifying in the autumn, reaching a second peak by late autumn and persisting for approximately 15 months in total. Previous studies indicate that El Niño–La Niña phenomena in the central and eastern equatorial Pacific influence China’s climate, precipitation, and drought patterns [70,71,72]. The temporal evolution of the index changes observed in this study aligns closely with the progression of the La Niña event. This may be due to El Niño, which, via abnormally high sea surface temperatures in the central and eastern equatorial Pacific, weakens the Asian summer monsoon, making it difficult for the moisture-laden southwesterly flow to penetrate inland and directly reducing regional precipitation. At the same time, the circulation anomalies triggered by El Niño form anticyclones and cyclones in the South China Sea and the Bay of Bengal, forcing moisture that would normally reach southwestern China to turn back toward the South China Sea near the Indochinese Peninsula, further cutting off the moisture supply. Under the combined influence of these two factors, abnormal subsiding air currents prevail over the southwestern region, suppressing cloud and precipitation formation and thereby triggering a sudden shift toward drought [73,74].
Under the influence of anthropogenic climate change, drought conditions across the entire SKA region are worsening, with distinct regional characteristics emerging in the frequency, intensity, duration, and severity of drought events. These changes suggest a potential trend toward more frequent and severe flash droughts [75]. The findings of this study are consistent with previous research indicating that climate change is driving more frequent, severe, and widespread drought events [76,77,78]. Moreover, earlier studies have confirmed that drought indices constructed using copulas exhibit high accuracy and reliability [79,80,81]. Therefore, the drought indices proposed in this paper are suitable for identifying compound drought events in the SKA region and provide a valuable reference for constructing composite drought indices using copula methods.

4.2. Hydrological Characteristics and Ecological Vulnerability of Karst Areas in the SKA

Previous studies indicate that regions with well-developed karst topography and widespread rock fissures are more prone to drought than non-karst areas [82]. This phenomenon stems from the ecological fragility inherent in karst landscapes. Intense karst processes sculpt complex pathways, including solution–cavity systems, sinkholes, and underground rivers, thereby forming an efficient system for rapid surface-water infiltration [83]. Coupled with the coexistence of sparse surface hydrological networks and well-developed underground river systems, the hydrological circulation patterns in karst regions differ fundamentally from those in non-karst areas [84,85]. As a result, karst aquifers exhibit dual-medium characteristics of high permeability but low storage capacity, marked by intense hydrological dynamics, uneven runoff distribution, and limited natural storage. Consequently, even substantial precipitation rapidly infiltrates into the subsurface, and, with sparse surface hydrological networks, runoff generation is typically 30–50% lower than in non-karst areas [19,86]. This extremely low surface water retention collectively creates conditions vulnerable to so-called “karst-type drought.”
The unique geological structure of karst regions alters the movement of water. In non-karst areas, evaporation from soil moisture and transpiration from plants replenish atmospheric water vapor, thereby regulating local precipitation. In karst areas, however, once the shallow soil layer dries out, evapotranspiration decreases sharply. This not only exacerbates surface aridity but also reduces atmospheric water vapor, increasing the saturated vapor pressure gradient and creating a vicious cycle [87]. Moreover, climate change will further exacerbate the ecological vulnerability of these regions [88]. Recent studies further indicate that human-induced climate change is ongoing and that its impacts are intensifying; by altering atmospheric circulation and temperature, it changes the geographical distribution of precipitation and radiation [89].
Consequently, these unique geological and hydrological processes ultimately shape plant survival strategies. The trade-off between resistance and resilience in karst vegetation also differs from that in non-karst areas. From a macro perspective, in non-karst areas, plants prioritize resilience—ensuring survival and restoring functions—during early succession, whereas resistance—maintaining system stability—becomes dominant in late succession. In contrast, plants in karst regions prioritize resilience during early succession; only in later stages do they reduce safety margins while improving water uptake efficiency, thereby freeing up energy for photosynthesis [90,91].
Based on established classification criteria [92], landforms are broadly categorized into low mountains (DEM < 1000 m), medium mountains (<3500 m), and high mountains (<5000 m). The 2008 Global Land Degradation Assessment provides vector data on rock types, which, together with these two factors, enable further statistical analysis of regional variations. Table 5 presents differences in basic drought characteristics between non-karst and karst areas. For example, in the low mountain regions of the SDTI, the average drought duration in non-karst areas was 3.782 months longer than that in karst areas. Except for medium mountain terrain, results for all other terrain types are consistent with the study’s overall conclusions. Other studies have shown that elevation influences the trade-off between plant resistance and resilience [93].

4.3. Differential Impacts of Various Factors on Drought and Their Possible Causes

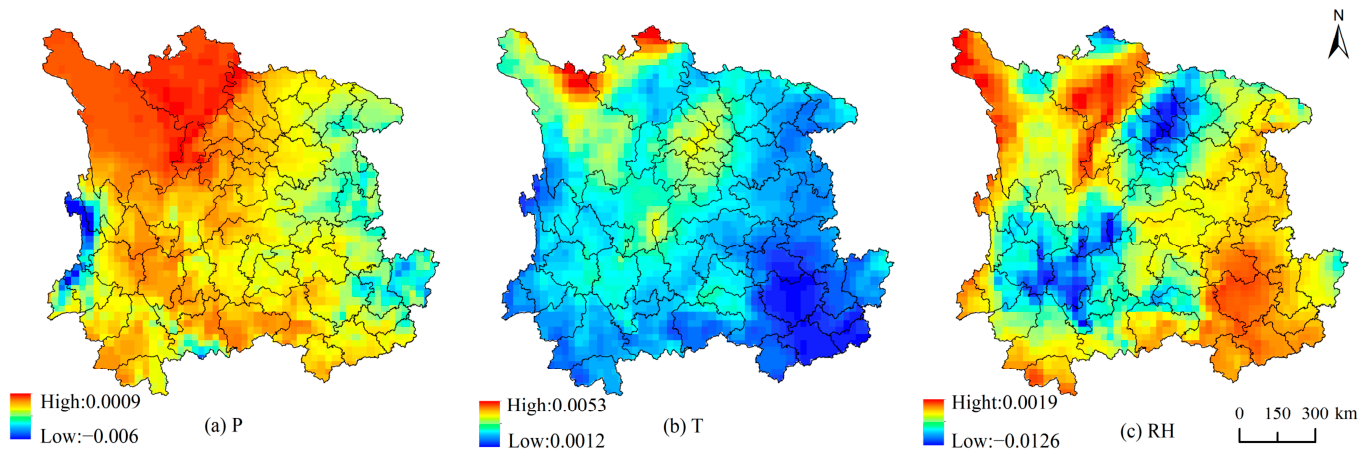
The results of this study indicate that changes in temperature and precipitation patterns in Southwest China generally reflect a trend toward hotter and drier conditions, accompanied by declining relative humidity (Figure 12). This trend reinforces the occurrence and co-occurrence of high-temperature and dry extremes, consistent with the broader context of global warming and with findings from other studies [85,86,87]. Indeed, due to its increasingly hot and dry climate, the SKA region is widely recognized as a high-risk zone for extreme heat and drought. Temperature and precipitation are the primary drivers of this phenomenon, while relative humidity and temperature are the main drivers of atmospheric drought. This outcome may be attributed to elevated air temperatures, which increase the saturation vapor pressure deficit—thereby enhancing atmospheric moisture demand and amplifying drought conditions.
Furthermore, attribution studies in non-karst landscapes indicate that monthly temperature has a considerably smaller influence on aridity than sunshine duration and dew point temperature—a finding that contrasts with the results of the present study [88]. Karst regions are characterized by greater environmental fragility; consequently, once temperature fluctuations occur, they are more likely to affect the water cycle and precipitation patterns, thereby accelerating the progression of aridity.
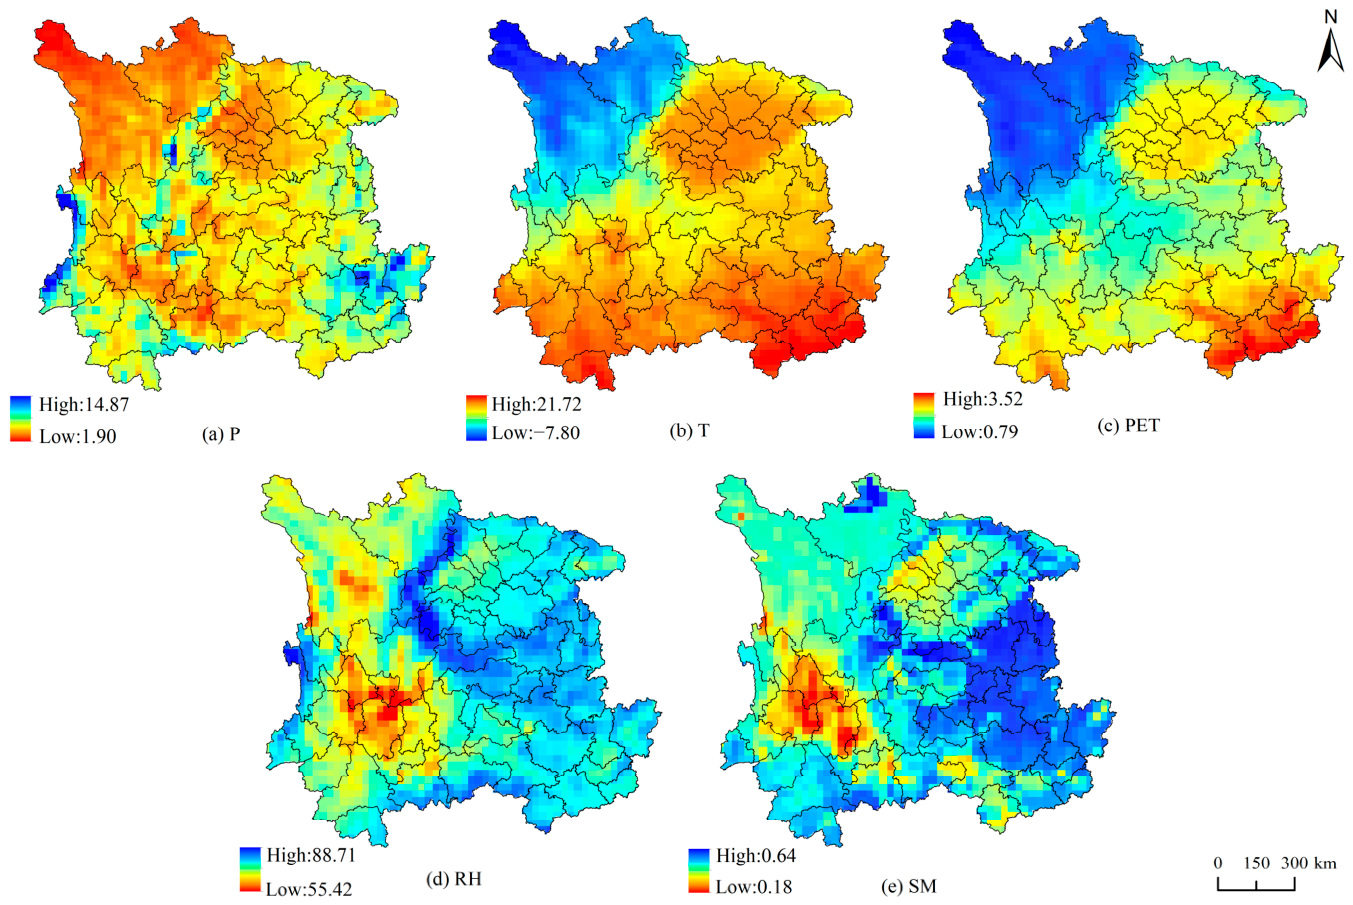
Droughts occur more frequently and with greater severity in the western Sichuan Plateau. In addition to the extreme topographical variations within the SKA region, climatic factors also play a significant role. Unlike other areas, the western Sichuan Plateau features a plateau climate characterized by cold and dry conditions, with multi-year average precipitation as low as 1.9 mm/day and average temperatures dropping to −7.9 °C (Figure 13a,b). Moreover, due to its high elevation, the plateau experiences reduced atmospheric thickness, lower air density, diminished water vapor content, and lower aerosol concentrations. As a result, the intensity of direct solar radiation is high, allowing the surface to absorb more heat. Both humidity and soil moisture content remain relatively low—factors that may collectively exacerbate drought conditions (Figure 13d,e) [94].
Guangxi is situated in a subtropical climate zone characterized by high temperatures and abundant rainfall, with heat and rainfall typically occurring concurrently. Despite ample precipitation, the region features poorly developed karst terrain, resulting in low water storage capacity and high evapotranspiration. At the same time, precipitation trends in Guangxi are declining—factors that may collectively contribute to more severe drought conditions. In contrast, the Sichuan Basin receives less precipitation and experiences higher evapotranspiration; however, due to its unique basin topography, water tends to accumulate in this region, potentially mitigating drought severity.
Furthermore, from the perspective of drought propagation, the water cycle encompasses multiple stages—including evaporation, moisture transport, precipitation, infiltration, and runoff. When a drought is triggered by atmospheric anomalies such as high temperatures, low precipitation, or elevated evapotranspiration and persists, its effects intensify as they propagate through the hydrological cycle. Subsequently, reduced water input from insufficient precipitation, combined with increased atmospheric evaporative demand, further depletes soil moisture—a process that can trigger compound droughts [95].

4.4. Limitations

The drought index constructed in this study demonstrates good applicability within the SKA region; however, certain limitations should be acknowledged. First, although the ERA5 reanalysis dataset has been widely used in regional hydrometeorological research, its potential uncertainties must be considered when applied to the complex and unique karst terrain of this study. For example, reanalysis data reflect average grid-point conditions, thus limiting their ability to capture microclimate effects in steep terrain. In subsequent analyses, the ERA5 results can be cross-validated against local observational data. Second, the analyses are conducted at monthly or longer timescales, which precludes investigation of daily-scale drought events and detailed examination of issues arising from short-term heavy rainfall at finer temporal resolutions. This limitation may hinder a comprehensive understanding of short-duration drought phenomena. Finally, the causes of drought—particularly compound drought—are highly complex. Although this study considered relative humidity, evapotranspiration, and soil moisture, these factors alone are insufficient to fully characterize drought events, underscoring the need for further investigation.
Moreover, temperature plays a critically important role in drought dynamics. Its spatial distribution pattern resembles that of drought, yet its influence varies significantly across different regions. This is especially relevant within the SKA, which encompasses substantial topographical heterogeneity and spans two distinct climate zones—areas that warrant more detailed examination in future research.

5. Conclusions

Understanding the distribution and driving factors of drought in karst landscapes is crucial for early warning and prevention. Using copula functions, this study developed three drought indices—SDTI, SDHTI, and SASI—to measure general, atmospheric, and composite drought within the SKA. The results show that the GEV distribution is optimal for the SKA, the Gumbel copula for the SDTI, and the Clayton copula for the SDHTI and SASI. Droughts in karst areas are generally more severe, although their intensification trend is relatively slow. These droughts exhibit higher frequency and intensity, but shorter duration and lower severity. Compound drought is particularly severe on the western Sichuan Plateau but less significant in Guangxi, whereas atmospheric drought is more prominent in Guangxi. Temperature is the primary driver of spatiotemporal variations in drought, with its importance for the SDTI, SDHTI, and SASI ranked as follows: 2.60, 2.42, and 1.48, respectively.
Future research should further investigate the evolution of different drought types across various karst landforms. Integrating high-resolution climate models with human activity data would help quantify the synergistic effects of multiple factors on drought indices. Alternatively, nonlinear dependency structures could be incorporated to improve drought index construction, thereby enabling more accurate characterization of drought pattern evolution under non-stationary conditions.

Author Contributions

Writing—review and editing, conceptualization, M.C.; project administration, data analysis, and review, H.Z.; methodology and investigation, Z.R. and J.Z. All authors have read and agreed to the published version of the manuscript.

Funding

This study was supported by the Guangxi Key R&D Program (Grant No. Guike-AB 21075007). The first author acknowledges the valuable institutional support provided by the Guilin Agricultural Water and Soil Resources and Environment Observation and Research Station of Guangxi, the Collaborative Innovation Center for Water Pollution Control and Water Safety in Karst Area, and the Guilin Lijiang River Ecology and Environment Observation and Research Station of Guangxi (all at Guilin University of Technology).

Data Availability Statement

The original contributions presented in this study are included in the article. Further inquiries can be directed to the corresponding author.

Conflicts of Interest

The authors declare no conflicts of interest.

References

  1. Fischer, E.M.; Bador, M.; Huser, R.; Kendon, E.J.; Robinson, A.; Sippel, S. Record-Breaking Extremes in a Warming Climate. Nat. Rev. Earth Environ. 2025, 6, 456–470. [Google Scholar] [CrossRef]
  2. Jin, H.; Zhang, K.; Liu, M.; Yu, X.; Yang, X.; Chao, L.; Zhang, P.; Liu, G. Global Escalation of More Frequent and Intense Compound Heatwave-Extreme Precipitation Events. EGUsphere 2025, 2025, 1–30. [Google Scholar] [CrossRef]
  3. Brett, L.; White, C.J.; Domeisen, D.I.V.; van den Hurk, B.; Ward, P.; Zscheischler, J. Review Article: The Growth in Compound Weather and Climate Event Research in the Decade since SREX. Nat. Hazards Earth Syst. Sci. 2025, 25, 2591–2611. [Google Scholar] [CrossRef]
  4. Li, J.; Wang, Z.; Wu, X.; Zscheischler, J.; Guo, S.; Chen, X. A Standardized Index for Assessing Sub-Monthly Compound Dry and Hot Conditions with Application in China. Hydrol. Earth Syst. Sci. 2021, 25, 1587–1601. [Google Scholar] [CrossRef]
  5. McKee, T.B.; Doesken, N.J.; Kleist, J. The Relationship of Drought Frequency and Duration to Time Scales. In Proceedings of the Eighth Conference on Applied Climatology, Anaheim, CA, USA, 17–22 January 1993. [Google Scholar]
  6. Shukla, S.; Wood, A.W. Use of a Standardized Runoff Index for Characterizing Hydrologic Drought. Geophys. Res. Lett. 2008, 35, 2007GL032487. [Google Scholar] [CrossRef]
  7. Vicente-Serrano, S.M.; Beguería, S.; López-Moreno, J.I. A Multiscalar Drought Index Sensitive to Global Warming: The Standardized Precipitation Evapotranspiration Index. J. Clim. 2010, 23, 1696–1718. [Google Scholar] [CrossRef]
  8. Hao, Z.; Hao, F.; Singh, V.P.; Zhang, X. Statistical Prediction of the Severity of Compound Dry-Hot Events Based on El Niño-Southern Oscillation. J. Hydrol. 2019, 572, 243–250. [Google Scholar] [CrossRef]
  9. Li, X.; He, B.; Quan, X.; Liao, Z.; Bai, X. Use of the Standardized Precipitation Evapotranspiration Index (SPEI) to Characterize the Drying Trend in Southwest China from 1982–2012. Remote Sens. 2015, 10918, 10917–10937. [Google Scholar] [CrossRef]
  10. Qiao, Y.; Xu, W.; Wu, D.; Meng, C.; Qin, L.; Li, Z.; Zhang, X. Changes in the Spatiotemporal Patterns of Dry/Wet Abrupt Alternation Frequency, Duration, and Severity in Mainland China, 1980–2019. Sci. Total Environ. 2022, 838, 156521. [Google Scholar] [CrossRef]
  11. Zhao, Y.; Weng, Z.; Chen, H.; Yang, J. Analysis of the Evolution of Drought, Flood, and Drought-Flood Abrupt Alternation Events under Climate Change Using the Daily SWAP Index. Water 2020, 12, 1969. [Google Scholar] [CrossRef]
  12. Kumar, K.C.A.; Reddy, G.P.O.; Masilamani, P.; Turkar, S.Y.; Sandeep, P. Integrated Drought Monitoring Index: A Tool to Monitor Agricultural Drought by Using Time-Series Datasets of Space-Based Earth Observation Satellites. Adv. Space Res. 2021, 67, 298–315. [Google Scholar] [CrossRef]
  13. Figueira Branco, E.R.; dos Santos, A.R.; Macedo Pezzopane, J.E.; dos Santos, A.B.; Alexandre, R.S.; Bernardes, V.P.; da Silva, R.G.; de Souza, K.B.; Moura, M.M. Space-Time Analysis of Vegetation Trends and Drought Occurrence in Domain Area of Tropical Forest. J. Environ. Manag. 2019, 246, 384–396. [Google Scholar] [CrossRef] [PubMed]
  14. Shives, E.; Chen, T.-H.K.; Seto, K.C. Multiple Hazards and Exposure in California: A Space-Time Analysis of Temperature, Drought, and Wildfire. Int. J. Disaster Risk Reduct. 2025, 120, 105391. [Google Scholar] [CrossRef]
  15. Wu, X.; Hao, Z.; Zhang, X.; Li, C.; Hao, F. Evaluation of Severity Changes of Compound Dry and Hot Events in China Based on a Multivariate Multi-Index Approach. J. Hydrol. 2020, 583, 124580. [Google Scholar] [CrossRef]
  16. Hao, Z.; AghaKouchak, A.; Phillips, T.J. Changes in Concurrent Monthly Precipitation and Temperature Extremes. Environ. Res. Lett. 2013, 8, 034014. [Google Scholar] [CrossRef]
  17. Mazdiyasni, O.; AghaKouchak, A. Substantial Increase in Concurrent Droughts and Heatwaves in the United States. Proc. Natl. Acad. Sci. USA 2015, 112, 11484–11489. [Google Scholar] [CrossRef]
  18. Zhou, P.; Liu, Z. Likelihood of Concurrent Climate Extremes and Variations over China. Environ. Res. Lett. 2018, 13, 094023. [Google Scholar] [CrossRef]
  19. Jiang, T.; Zhou, Z.; Cao, S. Drought Monitoring and Analysing on Typical Karst Ecological Fragile Area Based on GIS. Procedia Environ. Sci. 2011, 10, 2091–2096. [Google Scholar] [CrossRef][Green Version]
  20. Chen, L.; He, Z.; Tan, H.; Xu, M.; Gu, X. Propagation Thresholds and Driving Mechanism Detection of Karst Meteorological- Agricultural Drought: A Case Study in Guizhou Province. PLoS ONE 2024, 19, e0298654. [Google Scholar] [CrossRef]
  21. Sun, S.; Li, Q.; Li, J.; Wang, G.; Zhou, S.; Chai, R.; Hua, W.; Deng, P.; Wang, J.; Lou, W. Revisiting the Evolution of the 2009–2011 Meteorological Drought over Southwest China. J. Hydrol. 2019, 568, 385–402. [Google Scholar] [CrossRef]
  22. Fu, B.; Jing, J.; Deng, Q.; Ding, S. Inter-Annual and Seasonal Variations of Meteorological Drought and Their Drivers in the Southwest Karst Region of China. Environ. Sci. Pollut. Res. 2025, 32, 10836–10854. [Google Scholar] [CrossRef]
  23. Pan, S.; He, Z.; Gu, X.; Xu, M.; Chen, L.; Yang, S.; Tan, H. Agricultural Drought-Driven Mechanism of Coupled Climate and Human Activities in the Karst Basin of Southern China. Sci. Rep. 2024, 14, 12072. [Google Scholar] [CrossRef]
  24. Wang, Z.; Li, J.; Lai, C.; Huang, Z.; Zhong, R.; Zeng, Z.; Chen, X. Increasing Drought Has Been Observed by SPEI_pm in Southwest China during 1962–2012. Theor. Appl. Climatol. 2018, 133, 23–38. [Google Scholar] [CrossRef]
  25. Chen, D.; Norris, J.; Thackeray, C.; Hall, A. Increasing Precipitation Whiplash in Climate Change Hotspots. Environ. Res. Lett. 2022, 17, 124011. [Google Scholar] [CrossRef]
  26. Dracup, J.A.; Lee, K.S.; Paulson, E.G. On the Definition of Droughts. Water Resour. Res. 1980, 16, 297–302. [Google Scholar] [CrossRef]
  27. Ford, T.W.; Steiner, J.; Mason, B.; Quiring, S.M. Observation-Driven Characterization of Soil Moisture-Precipitation Interactions in the Central United States. J. Geophys. Res. Atmos. 2023, 128, e2022JD037934. [Google Scholar] [CrossRef]
  28. Ma, N.; Kumar, S. Optimal Cell Selection with Load Balancing and Handover Optimisation in LTE-Advanced Networks. Int. J. Eng. Trends Technol. 2022, 70, 21–30. [Google Scholar] [CrossRef]
  29. Wilhite, D.A. (Ed.) Droughts: A Global Assesment, 1st ed.; Routledge: Abingdon, UK, 2016. [Google Scholar]
  30. Fiorillo, F.; Guadagno, F.M. Karst Spring Discharges Analysis in Relation to Drought Periods, Using the SPI. Water Resour. Manag. 2010, 24, 1867–1884. [Google Scholar] [CrossRef]
  31. Liu, M. Atlas of China’s Physical Geography, 3rd ed.; China Map Publishing House: Beijing, China, 1998. [Google Scholar]
  32. Huang, X.; Wu, W.; Xu, J.; Li, S.; Jiang, Y.; Du, B.; Wang, L. The Applicability Performance of the ERA5-Land Precipitation Datasets in Southwest China. Gaoyuan Qixiang 2023, 42, 1562. [Google Scholar] [CrossRef]
  33. Thornthwaite, C.W. An Approach toward a Rational Classification of Climate. Geogr. Rev. 1948, 38, 55–94. [Google Scholar] [CrossRef]
  34. Bormann, H. Sensitivity Analysis of 18 Different Potential Evapotranspiration Models to Observed Climatic Change at German Climate Stations. Clim. Change 2011, 104, 729–753. [Google Scholar] [CrossRef]
  35. Phumkokrux, N.; Trivej, P. An Investigation of Changes in the New Thornthwaite Climate Classification Based on Temperature, Rainfall, and Evapotranspiration over Thailand, Using CMIP 5 for the Mid-21st Century Period. Appl. Sci. 2025, 15, 11731. [Google Scholar] [CrossRef]
  36. Tam, B.Y.; Cannon, A.J.; Bonsal, B.R. Standardized Precipitation Evapotranspiration Index (SPEI) for Canada: Assessment of Probability Distributions. Can. Water Resour. J. 2023, 48, 283–299. [Google Scholar] [CrossRef]
  37. Zscheischler, J.; Michalak, A.M.; Schwalm, C.; Mahecha, M.D.; Huntzinger, D.N.; Reichstein, M.; Berthier, G.; Ciais, P.; Cook, R.B.; El-Masri, B.; et al. Impact of Large-scale Climate Extremes on Biospheric Carbon Fluxes: An Intercomparison Based on MsTMIP Data. Glob. Biogeochem. Cycles 2014, 28, 585–600. [Google Scholar] [CrossRef]
  38. Wang, Y.; Yang, J.; Chen, Y.; Su, Z.; Li, B.; Guo, H.; De Maeyer, P. Monitoring and Predicting Drought Based on Multiple Indicators in an Arid Area, China. Remote Sens. 2020, 12, 2298. [Google Scholar] [CrossRef]
  39. Wen-Jing, Y.; Jian-Zhu, L.I.; Ping, F. Evaluation of Agricultural Drought in Luanhe River Basin Based on the Standardized Soil Moisture Index. Chin. J. Appl. Ecol. 2022, 33, 801–807. [Google Scholar] [CrossRef]
  40. Liu, Z.; Wang, Y.; Shao, M.; Jia, X.; Li, X. Spatiotemporal Analysis of Multiscalar Drought Characteristics across the Loess Plateau of China. J. Hydrol. 2016, 534, 281–299. [Google Scholar] [CrossRef]
  41. Wang, L.; Yu, H.; Yang, M.; Yang, R.; Gao, R.; Wang, Y. A Drought Index: The Standardized Precipitation Evapotranspiration Runoff Index. J. Hydrol. 2019, 571, 651–668. [Google Scholar] [CrossRef]
  42. Farahmand, A.; AghaKouchak, A.; Teixeira, J. A Vantage from Space Can Detect Earlier Drought Onset: An Approach Using Relative Humidity. Sci. Rep. 2015, 5, 8553. [Google Scholar] [CrossRef]
  43. Wu, X.; Wang, P.; Ma, Y.; Gong, Y.; Wu, D.; Yang, J.; Huo, Z. Standardized Relative Humidity Index Can Be Used to Identify Agricultural Drought for Summer Maize in the Huang-Huai-Hai Plain, China. Ecol. Indic. 2021, 131, 108222. [Google Scholar] [CrossRef]
  44. Geenens, G. (Re-)Reading Sklar (1959)—A Personal View on Sklar’s Theorem. Mathematics 2024, 12, 380. [Google Scholar] [CrossRef]
  45. Dash, S.S.; Sahoo, B.; Raghuwanshi, N.S. A SWAT-Copula Based Approach for Monitoring and Assessment of Drought Propagation in an Irrigation Command. Ecol. Eng. 2019, 127, 417–430. [Google Scholar] [CrossRef]
  46. Liu, Y.; Zhu, Y.; Ren, L.; Yong, B.; Singh, V.P.; Yuan, F.; Jiang, S.; Yang, X. On the Mechanisms of Two Composite Methods for Construction of Multivariate Drought Indices. Sci. Total Environ. 2019, 647, 981–991. [Google Scholar] [CrossRef]
  47. Varol, T.; Atesoglu, A.; Ozel, H.B.; Cetin, M. Copula-Based Multivariate Standardized Drought Index (MSDI) and Length, Severity, and Frequency of Hydrological Drought in the Upper Sakarya Basin, Turkey. Nat. Hazards 2023, 116, 3669–3683. [Google Scholar] [CrossRef]
  48. Rajini, A.; Jayalakshmi, C. Statistical Modeling of Temperature in Krishna District Using Copula Analysis. Stat. Appl. 2023, 21, 143–159. [Google Scholar]
  49. Yang, X.; Wu, J.; Liu, J.; Ye, X. Changes of Extreme Precipitation and Possible Influence of ENSO Events in a Humid Basin in China. Atmosphere 2021, 12, 1522. [Google Scholar] [CrossRef]
  50. Moyé, L.A.; Kapadia, A.S. Predictions of Drought Length Extreme Order Statistics Using Run Theory. J. Hydrol. 1995, 169, 95–110. [Google Scholar] [CrossRef]
  51. Moyé, L.A.; Kapadia, A.S.; Cech, I.M.; Hardy, R.J. The Theory of Runs with Applications to Drought Prediction. J. Hydrol. 1988, 103, 127–137. [Google Scholar] [CrossRef]
  52. Ma, X.; Xia, J. Principles of Run Probability Statistics and Its Applications, 1st ed.; Science Press: Beijing, China, 2011. [Google Scholar]
  53. Chen, T.; Ao, T.; Zhang, X.; Li, X.; Yang, K. Climate Change Characteristics of Extreme Temperature in the Minjiang River Basin. Adv. Meteorol. 2019, 2019, 1935719. [Google Scholar] [CrossRef]
  54. Venkataraman, K.; Tummuri, S.; Medina, A.; Perry, J. 21st Century Drought Outlook for Major Climate Divisions of Texas Based on CMIP5 Multimodel Ensemble: Implications for Water Resource Management. J. Hydrol. 2016, 534, 300–316. [Google Scholar] [CrossRef]
  55. Ayantobo, O.O.; Li, Y.; Song, S.; Javed, T.; Yao, N. Probabilistic Modelling of Drought Events in China via 2-Dimensional Joint Copula. J. Hydrol. 2018, 559, 373–391. [Google Scholar] [CrossRef]
  56. Gu, X.; Zhang, Q.; Li, J.; Singh, V.P.; Liu, J.; Sun, P.; He, C.; Wu, J. Intensification and Expansion of Soil Moisture Drying in Warm Season Over Eurasia Under Global Warming. J. Geophys. Res. Atmos. 2019, 124, 3765–3782. [Google Scholar] [CrossRef]
  57. Sinha, D.; Syed, T.H.; Reager, J.T. Utilizing Combined Deviations of Precipitation and GRACE-Based Terrestrial Water Storage as a Metric for Drought Characterization: A Case Study over Major Indian River Basins. J. Hydrol. 2019, 572, 294–307. [Google Scholar] [CrossRef]
  58. Antoniadis, A.; Lambert-Lacroix, S.; Poggi, J.-M. Random Forests for Global Sensitivity Analysis: A Selective Review. Reliab. Eng. Syst. Saf. 2021, 206, 107312. [Google Scholar] [CrossRef]
  59. Gregorutti, B.; Michel, B.; Saint-Pierre, P. Grouped Variable Importance with Random Forests and Application to Multiple Functional Data Analysis. Comput. Stat. Data Anal. 2015, 90, 15–35. [Google Scholar] [CrossRef]
  60. Kuha, J. AIC and BIC: Comparisons of Assumptions and Performance. Sociol. Methods Res. 2004, 33, 188–229. [Google Scholar] [CrossRef]
  61. Gao, X.; Xiao, F.; Liu, Q.; Yu, C.; Huang, D.; Chi, Y.; Zheng, X. Increasing Influence of Compound Dry-Hot Events on Vegetation in Northern China in Recent Years. J. Arid Environ. 2025, 229, 105393. [Google Scholar] [CrossRef]
  62. Wu, H.; Su, X.; Singh, V.P.; Zhang, T. Compound Climate Extremes over the Globe during 1951–2021: Changes in Risk and Driving Factors. J. Hydrol. 2023, 627, 130387. [Google Scholar] [CrossRef]
  63. Brêda, J.P.L.F.; de Paiva, R.C.D.; Siqueira, V.A.; Collischonn, W. Assessing Climate Change Impact on Flood Discharge in South America and the Influence of Its Main Drivers. J. Hydrol. 2023, 619, 129284. [Google Scholar] [CrossRef]
  64. Hao, C.; Zhang, J.; Yao, F. Combination of Multi-Sensor Remote Sensing Data for Drought Monitoring over Southwest China. Int. J. Appl. Earth Obs. Geoinf. 2015, 35, 270–283. [Google Scholar] [CrossRef]
  65. Lin, P.; Hopper, L.J.; Yang, Z.-L.; Lenz, M.; Zeitler, J.W. Insights into Hydrometeorological Factors Constraining Flood Prediction Skill during the May and October 2015 Texas Hill Country Flood Events. J. Hydrometeorol. 2018, 19, 1339–1361. [Google Scholar] [CrossRef]
  66. Chen, H.; Zhang, W.; Wang, K.; Fu, W. Soil Moisture Dynamics under Different Land Uses on Karst Hillslope in Northwest Guangxi, China. Environ. Earth Sci. 2010, 61, 1105–1111. [Google Scholar] [CrossRef]
  67. Manabe, S.; Wetherald, R.T. Thermal Equilibrium of the Atmosphere with a Given Distribution of Relative Humidity. J. Atmos. Sci. 1967, 24, 241–259. [Google Scholar] [CrossRef]
  68. Chen, J.; Wang, X.; Zhou, W.; Wang, C.; Xie, Q.; Li, G.; Chen, S. Unusual Rainfall in Southern China in Decaying August during Extreme El Niño 2015/16: Role of the Western Indian Ocean and North Tropical Atlantic SST. J. Clim. 2018, 31, 7019–7034. [Google Scholar] [CrossRef]
  69. Yuan, Y.; Yang, S. Impacts of Different Types of El Niño on the East Asian Climate: Focus on ENSO Cycles. J. Clim. 2012, 25, 7702–7722. [Google Scholar] [CrossRef]
  70. Li, Y.; Ma, B.; Feng, J.; Lu, Y. Influence of the Strongest Central Pacific El Niño–Southern Oscillation Events on the Precipitation in Eastern China. Int. J. Climatol. 2019, 39, 3076–3090. [Google Scholar] [CrossRef]
  71. Wu, R.; Chen, W.; Wang, G.; Hu, K. Relative Contribution of ENSO and East Asian Winter Monsoon to the South China Sea SST Anomalies during ENSO Decaying Years. J. Geophys. Res. Atmos. 2014, 119, 5046–5064. [Google Scholar] [CrossRef]
  72. Zhang, W.; Jin, F.-F.; Turner, A. Increasing Autumn Drought over Southern China Associated with ENSO Regime Shift. Geophys. Res. Lett. 2014, 41, 4020–4026. [Google Scholar] [CrossRef]
  73. Xu, L.; Cheng, X.; Huang, G.; Liu, X.; Liang, H.; Wang, R.-Y. Teleconnection between Atmospheric Circulation and Meteorological Drought in Southwest China. Int. J. Environ. Agric. Biotechnol. 2025, 10, 098–113. [Google Scholar] [CrossRef]
  74. Yu, T.; Chen, W.; Huang, P.; Huang, G.; Yang, X. Weakened Influence of ENSO on the East Asian Summer Monsoon since the Early 2000s. npj Clim. Atmos. Sci. 2025, 8, 114. [Google Scholar] [CrossRef]
  75. Xiao, L.; Wu, X.; Guo, C.; Lu, Z.; Khan, M.A.; Zheng, C.; Zhou, J. Thriving amidst Adversity: Responses of Karst Vegetation to Extreme Compound Droughts. J. Hydrol. 2025, 659, 133216. [Google Scholar] [CrossRef]
  76. Li, X.; Ju, H.; Liu, Q.; Li, Y.; Qin, X. Analysis of Drought Characters Based on the SPEI-PM Index in Huang-Huai-Hai Plain. Acta Ecol. Sin. 2017, 37, 2054–2066. [Google Scholar] [CrossRef]
  77. Liu, Y.; Shan, F.; Yue, H.; Wang, X.; Fan, Y. Global Analysis of the Correlation and Propagation among Meteorological, Agricultural, Surface Water, and Groundwater Droughts. J. Environ. Manag. 2023, 333, 117460. [Google Scholar] [CrossRef]
  78. Nie, M.; Huang, S.; Duan, W.; Leng, G.; Bai, G.; Wang, Z.; Huang, Q.; Fang, W.; Peng, J. Meteorological Drought Migration Characteristics Based on an Improved Spatiotemporal Structure Approach in the Loess Plateau of China. Sci. Total Environ. 2024, 912, 168813. [Google Scholar] [CrossRef] [PubMed]
  79. Hao, Z.; Hao, F.; Singh, V.P.; Zhang, X. Changes in the Severity of Compound Drought and Hot Extremes over Global Land Areas. Environ. Res. Lett. 2018, 13, 124022. [Google Scholar] [CrossRef]
  80. Hao, Z.; Hao, F.; Singh, V.P.; Ouyang, W.; Zhang, X.; Zhang, S. A Joint Extreme Index for Compound Droughts and Hot Extremes. Theor. Appl. Climatol. 2020, 142, 321–328. [Google Scholar] [CrossRef]
  81. Huang, Z.; Zhao, T. How Suitable Are Copula Models for Post-Processing Global Precipitation Forecasts? J. Hydrol. 2025, 656, 133005. [Google Scholar] [CrossRef]
  82. Gao, Z.; He, W.; Yao, Y.; Huang, J. Revealing the Exacerbated Drought Stress Impacts on Regional Vegetation Ecosystems in Karst Areas with Vegetation Indices: A Case Study of Guilin, China. Sustainability 2025, 17, 1308. [Google Scholar] [CrossRef]
  83. Wu, Q.; Wang, L. Suitability of Agronomic Water Saving in Karst Areas and Its Enlightenment in the Karst Desertification Control. Heliyon 2024, 10, e32568. [Google Scholar] [CrossRef] [PubMed]
  84. Zhao, J.; Xu, T.; Xiao, J.; Liu, S.; Mao, K.; Song, L.; Yao, Y.; He, X.; Feng, H. Responses of Water Use Efficiency to Drought in Southwest China. Remote Sens. 2020, 12, 199. [Google Scholar] [CrossRef]
  85. Chen, H.; Fu, W.; Wang, K.; Zhang, J.; Zhang, W. A Preliminary Study on the Dynamic Changes of Soil Moisture in Karst Peak Cluster Depressions in Northwest Guangxi. J. Soil Water Conserv. 2006, 20, 136–139. [Google Scholar] [CrossRef]
  86. Jiang, G.; Guo, F.; Liu, F.; Li, Z.; Milanović, S. Hydrogeological Responses of Karst Compartments to Meteorological Drought in Subtropical Monsoon Regions. J. Hydrol. 2025, 655, 132940. [Google Scholar] [CrossRef]
  87. Johnson, C.M.; Fan, X.; Mahmood, R.; Groves, C.; Polk, J.S.; Yan, J. Evaluating Weather Research and Forecasting Model Sensitivity to Land and Soil Conditions Representative of Karst Landscapes. Bound.-Layer Meteorol. 2018, 166, 503–530. [Google Scholar] [CrossRef]
  88. de Figueiredo, D.R.; de Melo, M.T.C.; Saraiva, P.P.; Oliveira, J.; Goncalves, A.M.M.; Reboleira, A.S.P.S.; Polonia, A.R.M.; Abrantes, N.; Cleary, D.F.R. Bacterioplankton Community Diversity of a Portuguese Aquifer System (Maciço Calcário Estremenho). Water 2024, 16, 1858. [Google Scholar] [CrossRef]
  89. Milly, P.C.D.; Betancourt, J.; Falkenmark, M.; Hirsch, R.M.; Kundzewicz, Z.W.; Lettenmaier, D.P.; Stouffer, R.J.; Dettinger, M.D.; Krysanova, V. On Critiques of “Stationarity Is Dead: Whither Water Management?”. Water Resour. Res. 2015, 51, 7785–7789. [Google Scholar] [CrossRef]
  90. Ding, Y.; Nie, Y.; Chen, H.; Wang, K.; Querejeta, J.I. Water Uptake Depth Is Coordinated with Leaf Water Potential, Water-use Efficiency and Drought Vulnerability in Karst Vegetation. New Phytol. 2021, 229, 1339–1353. [Google Scholar] [CrossRef]
  91. Sun, Q.; Zhou, Q.; Luo, Y.; Shi, C.; Hu, Y. Resilience and Resistance of Vegetation in Response to Droughts in a Subtropical Humid Region Dominated by Karst. Forests 2024, 15, 1931. [Google Scholar] [CrossRef]
  92. Shen, Y.; Su, S.; Yin, Z. Retrospect and Prospect of the Research Work on the Classification, Regionalization and Mapping of the Geomorphology of China. Geogr. Sci. 1982, 2, 97–105. [Google Scholar] [CrossRef]
  93. Yang, Y.; He, X.; Feng, Y.; Niu, B.; Wu, J.; Li, M. Altitude Weakens the Drought Resistance-Resilience Tradeoff across Northern Ecosystems. Glob. Planet. Change 2025, 254, 105026. [Google Scholar] [CrossRef]
  94. Shi, Z.; Sha, Y.; Liu, X.; Xie, X.; Li, X. Effect of Marginal Topography around the Tibetan Plateau on the Evolution of Central Asian Arid Climate: Yunnan-Guizhou and Mongolian Plateaux as Examples. Clim. Dyn. 2019, 53, 4433–4445. [Google Scholar] [CrossRef]
  95. Lin, H.; Yu, Z.; Chen, X.; Gu, H.; Ju, Q.; Shen, T. Spatial-Temporal Dynamics of Meteorological and Soil Moisture Drought on the Tibetan Plateau: Trend, Response, and Propagation Process. J. Hydrol. 2023, 626, 130211. [Google Scholar] [CrossRef]
Figure 1. Spatial distribution of key topographic and climatic variables influencing the SKA region, sourced from a geospatial data cloud, with WGS84 projection and a 90 m resolution. (a) Digital elevation model, (b) mean daily precipitation, and (c) mean monthly temperature.
Water 18 01275 g001
Figure 2. Lithological Distribution of the SKA. In addition, Figure 2 is modified from the Atlas of China’s Physical Geography [31].
Water 18 01275 g002
Figure 3. Research methodology framework diagram.
Water 18 01275 g003
Figure 4. Run-time theory: identifying drought events and quantifying drought characteristics (intensity, severity, frequency, and duration). In addition, Figure 4 is modified from the book Principles of Run Probability Statistics and Its Applications [52].
Water 18 01275 g004
Figure 5. The distribution of the three drought indices in the SKA region during 1979−2023. The blue line corresponds to SASI, the red line to SDTI, and the yellow line to SDHTI.
Water 18 01275 g005
Figure 6. Spatial patterns of mean drought indices in the SKA region (1979–2023): (a) SDTI, (b) SDHTI, (c) SASI. In addition, the black line delineates the karst-developed zone within the study area.
Water 18 01275 g006
Figure 7. Spatial patterns of drought frequency, intensity, severity, and duration in the SKA region (1979−2023) for three drought indices: (ad) SDTI, (eh) SDHTI, (il) SASI.
Water 18 01275 g007
Figure 8. Spatial patterns of Sen’s slope for the three drought indices in the SKA region during 1979–2023. (a) SDTI and (b) SDHTI: Blue areas indicate accelerated drought intensification, while red areas denote a relatively moderated trend. (c) SASI: Blue represents drought intensification, and red represents drought moderation.
Water 18 01275 g008
Figure 9. Statistical proportions of the M–K test trends for the three drought indices during 1979–2023. Blue denotes an increasing trend, red a decreasing trend, and yellow indicates no significant change.
Water 18 01275 g009
Figure 10. Results of the random forest analysis for the period 1979–2023: (ac) average contribution rates of various factors to the three drought indices; (df) spatial distribution of the primary driving factors for each drought index across the SKA region.
Water 18 01275 g010
Figure 11. Comparison of temporal consistency between the proposed drought index and the reference indices (SSMI and SRHI).
Water 18 01275 g011
Figure 12. Trend changes in various factors across the SKA region from 1979 to 2023. (a) Precipitation, (b) Temperature, (c) Relative humidity.
Water 18 01275 g012
Figure 13. Spatial patterns of various factors within the SKA region from 1979 to 2023. (a) Precipitation, (b) Temperature, (c) Potential evapotranspiration, (d) Relative humidity, (e) Soil moisture.
Water 18 01275 g013
Table 1. High-Resolution Climate and Geographic Data Sources.
DatasetResolutionCoverage PeriodWebsite Link
ERA5-Atmosphere Reanalysis Dataset0.25° × 0.25°January 1979–December 2023https://cds.climate.copernicus.eu/datasets/reanalysis-era5-pressure-levels-monthly-means?tab=overview (accessed on 10 February 2025)
ERA5-land reanalysis dataset0.25° × 0.25°January 1979–December 2023https://cds.climate.copernicus.eu/datasets/ecv-for-climate-change?tab=overview (accessed on 10 February 2025)
Geospatial Data Cloud90 m-https://www.gscloud.cn/search (accessed on 5 April 2025)
Table 2. Pixel proportion of optimal marginal distribution for standardized index (%).
Distribution FunctionGevNormalLogistict-Location Scale
SPEI81.6913.813.431.07
STI73.9814.0410.201.79
SSMI50.7520.2217.3011.73
SHI54.7620.9617.536.75
Table 3. Pixel proportion of optimal copula functions within SKA (%).
CopulaClaytonFrankGaussianGumbelt
SDTI4.90.80.693.40.3
SDHTI68.40.925.60.54.6
SASI73.30.319.20.66.6
Table 4. Accuracy evaluation results of the random forest model.
SASISDHTISDTI
RSME0.5050.2180.151
R20.7100.9500.977
Table 5. Lithological analysis of the basic characteristics of different types of arid zones in the SKA Region.
DifferenceDurationSeverityIntensityFrequency
SDTILow Mountains3.7826.031−0.004−3.836
Mid-range Mountains−0.322−0.298−0.0480.403
High Mountains2.5833.544−0.038−4.083
SDHTILow Mountains1.4262.054−0.008−2.680
Mid-range Mountains1.3602.4810.012−1.336
High Mountains0.269−0.022−0.033−2.389
SASILow Mountains1.3681.857−0.009−2.207
Mid-range Mountains2.0183.1910.025−1.036
High Mountains1.0360.944−0.038−2.680
Disclaimer/Publisher’s Note: The statements, opinions and data contained in all publications are solely those of the individual author(s) and contributor(s) and not of MDPI and/or the editor(s). MDPI and/or the editor(s) disclaim responsibility for any injury to people or property resulting from any ideas, methods, instructions or products referred to in the content.