Review

A Review of Trigger Index Construction Methods for Index-Based Flood Insurance

1
College of Architecture and Civil Engineering, Beijing University of Technology, Beijing 100124, China
2
Beijing University of Technology Chongqing Research Institute, Chongqing 401100, China
*
Author to whom correspondence should be addressed.
Water 2026, 18(11), 1274; https://doi.org/10.3390/w18111274
Submission received: 18 April 2026 / Revised: 16 May 2026 / Accepted: 22 May 2026 / Published: 25 May 2026
(This article belongs to the Special Issue "Watershed–Urban" Flooding and Waterlogging Disasters)

Abstract

Under the combined impacts of climate change and urbanization, flood disasters have exhibited increasing non-stationarity, low-frequency but high-impact characteristics, and enhanced spatial dependence. Traditional indemnity-based flood insurance has certain limitations in claim efficiency and loss assessment. In contrast, index-based flood insurance, characterized by objective triggering mechanisms, rapid claim settlement, and low operational costs, has gradually become an important tool for flood catastrophe risk management. Based on a literature review approach, this study systematically reviews the index system, pricing mechanisms, and basis risk of index-based flood insurance, and provides a comprehensive analysis from the perspectives of index construction, threshold determination, and payout design. The results indicate that index systems have evolved from single hazard indicators to coupled indices integrating hazard characteristics and loss information, and multiple pricing approaches have been developed, including fixed, linear, piecewise payout, and probabilistic payout schemes (payouts determined by loss probabilities rather than fixed thresholds). Among the reviewed approaches, inundation-area-based indices generally show stronger consistency with actual losses at urban scales, whereas precipitation-based indices are more suitable for large-scale regional applications due to their rapid triggering capability. However, basis risk remains a critical issue, mainly arising from index errors, spatial scale mismatches, and inappropriate threshold settings. Therefore, to address the identified limitations of basis risk, threshold uncertainty, and spatial mismatches, future research should focus on multi-dimensional risk indices, dynamic threshold setting, and optimized spatial risk zoning, as well as the integration of remote sensing and machine learning methods to improve the consistency between indices and actual losses. The findings provide practical guidance for insurers in product design, for policymakers in regional flood risk financing, and for disaster managers in improving climate adaptation strategies.

1. Introduction

In recent years, under the combined influences of global climate change and human activities, the probability of extreme precipitation events has shown a significant increasing trend across watershed, regional, and urban scales [1,2]. This has led to a higher frequency of riverine flooding and urban pluvial inundation events, thereby expanding the exposed population and increasing potential economic losses. As a result, flood disasters have become one of the most widespread and economically damaging natural hazards worldwide [3,4,5,6,7,8].
As one of the most widely used market-based risk management tools, catastrophe insurance plays a critical role throughout the disaster management cycle and provides essential support for disaster risk governance [9,10]. Its pricing process generally involves risk identification, risk quantification, premium determination, risk diversification, and capital allocation. Although modern catastrophe models and some spatially explicit insurance models have incorporated mechanisms to address aspects of hazard evolution, many conventional insurance models that rely primarily on historical stationary assumptions still struggle to adequately capture the non-stationarity, low-frequency but high-impact characteristics, and spatial dependence of flood risks under changing climate conditions [3,10,11]. Index-based flood insurance, typically regarded as a form of parametric insurance, uses single or composite indices as triggers for compensation. By predefining threshold values of reference indicators, it enables automatic payouts, thereby reducing reliance on post-disaster loss assessment and improving claim efficiency and institutional resilience [12,13]. Furthermore, compared with traditional indemnity-based insurance, the key distinction of index-based flood insurance lies in its predefined trigger indices and payout mechanisms. Compensation is automatically activated when the selected index exceeds a specified threshold, reducing reliance on post-disaster individual loss assessment and improving claim efficiency and institutional resilience [10,14,15].
In recent years, with advancements in remote sensing, hydrological modeling, machine learning, and risk modeling techniques, significant progress has been achieved in index construction, threshold determination, payout function design, and basis risk management for index-based flood insurance [16,17,18,19]. However, despite the rapid development of index-based flood insurance, there remains a lack of systematic understanding regarding how different trigger indices influence payout design, basis risk, and practical applicability under changing climate conditions. Existing studies have mainly focused on individual aspects such as trigger index construction, pricing methods, or basis risk assessment, while comprehensive comparative analyses across different index systems and payout mechanisms remain limited. Therefore, it is necessary to systematically review the existing literature to clarify the development of trigger index systems, payout mechanisms, and future research directions, thereby providing theoretical support for flood insurance product design and flood risk management.

Review Methodology

This study adopts a narrative review approach to synthesize and compare the existing literature on trigger index construction methods, payout mechanisms, and basis risk in index-based flood insurance from conceptual and methodological perspectives.
Relevant studies were identified through major academic databases, including Web of Science, Scopus, and Google Scholar, using combinations of keywords such as “index-based flood insurance”, “parametric flood insurance”, “trigger index”, and “basis risk”. Priority was given to peer-reviewed journal articles in the fields of hydrology, disaster risk management, and insurance studies.
The selected literature was analyzed and categorized according to trigger index type, payout design, and basis risk mitigation strategies, with the aim of summarizing the development of index systems, compensation mechanisms, and future research directions in index-based flood insurance.
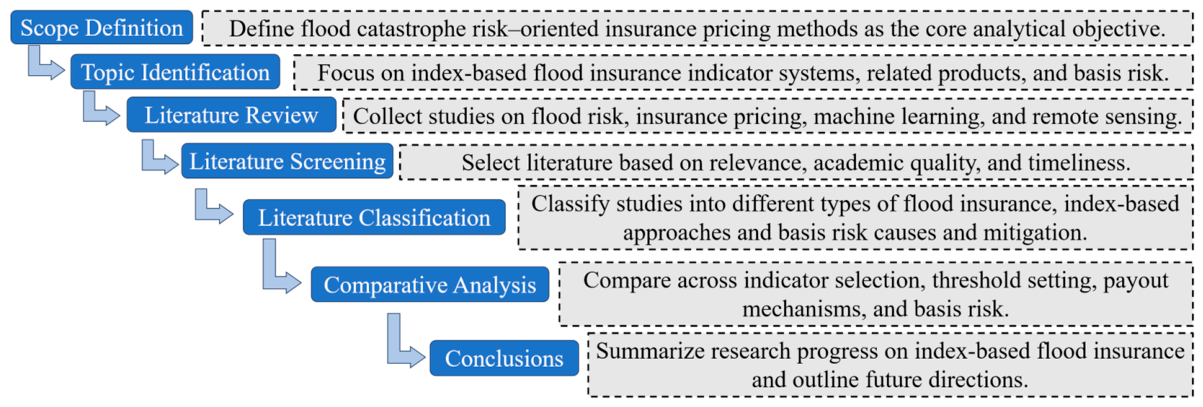
Based on the above review framework, this study examines index-based flood insurance from the perspectives of flood catastrophe risk management and insurance pricing (Figure 1, where the distinct colors classify the main review dimensions, the solid blocks map out the corresponding manuscript sections, and the progressive arrows indicate the logical flow of the systemic review).

2. Overview of Flood Insurance

2.1. General Classification of Existing Insurance Products

In the context of flood risk management, insurance products can be classified according to different dimensions, such as claim basis, trigger mechanism, and risk transfer structure. From the perspective of payout and trigger mechanisms, the products most relevant to flood insurance mainly include traditional indemnity-based insurance, index-based insurance, and dual-trigger insurance. In addition, layered compensation mechanisms are commonly used as a risk transfer structure in catastrophe financing and reinsurance systems (Table 1) [11,12].
From the perspective of market distribution, traditional indemnity-based insurance remains the most widely applied form due to its fairness in compensation, comprehensive coverage, and relatively simple structure. It is mainly used in retail insurance and general property insurance markets, including property insurance, engineering insurance, agricultural insurance, and liability insurance [20]. Index-based insurance uses objective indicators such as rainfall, water level, and wind speed as triggers for payouts and is primarily applied in agricultural insurance, weather insurance, catastrophe insurance, and regional risk management [21]. Although its current market share is relatively small, index-based insurance has gained increasing attention in recent years due to its advantages of rapid claim settlement, lower operational costs, and objective compensation mechanisms, particularly in agricultural insurance and regional disaster risk management [22,23]. Dual-trigger insurance, developed based on index-based insurance, determines payouts by combining index triggers with actual loss conditions, thereby reducing basis risk to some extent [24]. It is mainly applied in corporate catastrophe insurance, agricultural insurance, and infrastructure insurance, and can be regarded as an improved form of index insurance. Layered compensation mechanisms, based on loss layering principles, are designed to distribute risks characterized by low frequency but high impact. They are primarily applied in reinsurance arrangements, catastrophe bonds, and sovereign disaster risk transfer systems, while their application in direct flood insurance for households or individual properties is relatively limited [25].
Table 1. Characteristics and application areas of different insurance product types [10,12,15,21,24,25].
Insurance TypePayout MechanismAdvantagesApplication Areas
Traditional indemnity-based insuranceCompensation based on actual post-disaster lossesFair compensation; comprehensive coverageProperty insurance; engineering insurance; agricultural insurance; liability insurance
Index-based insuranceAutomatic payout triggered by predefined indicesRapid claim settlement; low operational costAgricultural insurance; weather insurance; catastrophe insurance; regional risk management
Dual-trigger insurancePayout triggered jointly by index thresholds and actual lossesFast claim settlement; improved loss accuracyCorporate catastrophe insurance; agricultural insurance; infrastructure insurance
Layered compensation mechanismCompensation based on loss layersRisk diversification for catastrophic eventsReinsurance; engineering insurance; catastrophe bonds
Overall, different types of insurance exhibit significant differences in their functional roles. For flood disaster risk, traditional indemnity-based insurance and index-based insurance remain the two most commonly applied direct insurance forms. Dual-trigger insurance can be regarded as an extension of index-based insurance, while layered compensation mechanisms are mainly used in reinsurance and catastrophe risk financing rather than in direct household-level flood insurance [12,20,24,26].
Therefore, considering their widespread application and relevance to flood risk management, this section focuses on comparing traditional indemnity-based insurance and index-based insurance.

2.2. Comparison Between Traditional Indemnity-Based Insurance and Index-Based Flood Insurance

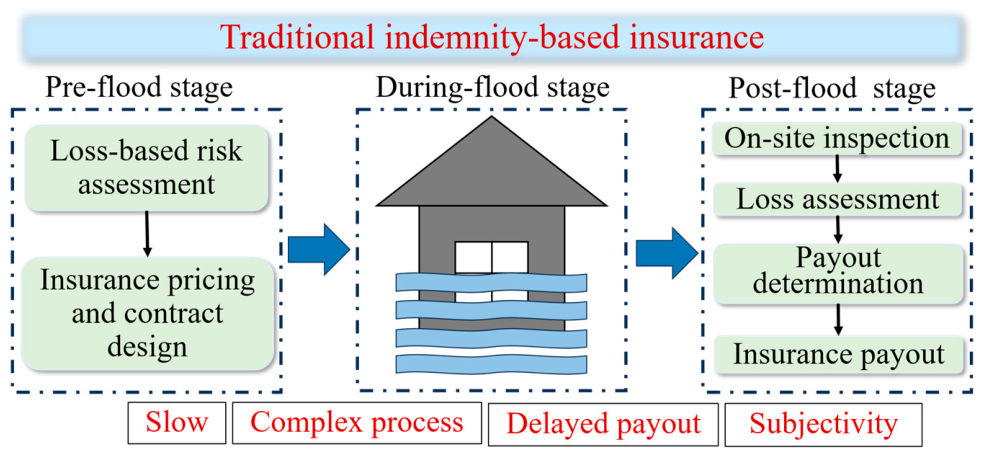
Traditional indemnity-based insurance relies on individual loss functions for insurance pricing. Prior to a disaster, compensation rules are specified in the insurance contract. After a disaster occurs, on-site inspections are conducted to assess the degree of damage in the insured area, and the compensation amount is determined based on the verified losses (Figure 2, where the solid arrows represent the operational workflow, different colors distinguish the pre- and post-disaster phases, and the dashed box highlights the loss verification process) [20]. The payout is directly linked to the actual losses incurred, enabling adequate financial compensation for policyholders and providing a high level of protection. This is also a key reason why traditional indemnity-based insurance has long been widely applied in flood insurance and has maintained a dominant position in the insurance market [20,26].
However, this approach has several limitations in the post-disaster phase. On-site inspections are often time-consuming, and the loss assessment process can be complex [7,8]. In addition, the strong subjectivity involved in loss evaluation may lead to moral hazard and claim disputes [10]. These issues significantly reduce claim settlement efficiency, increase insurers’ operational and management costs, and undermine policyholders’ trust in insurance, thereby negatively affecting the willingness of potential clients to purchase insurance [11,14].
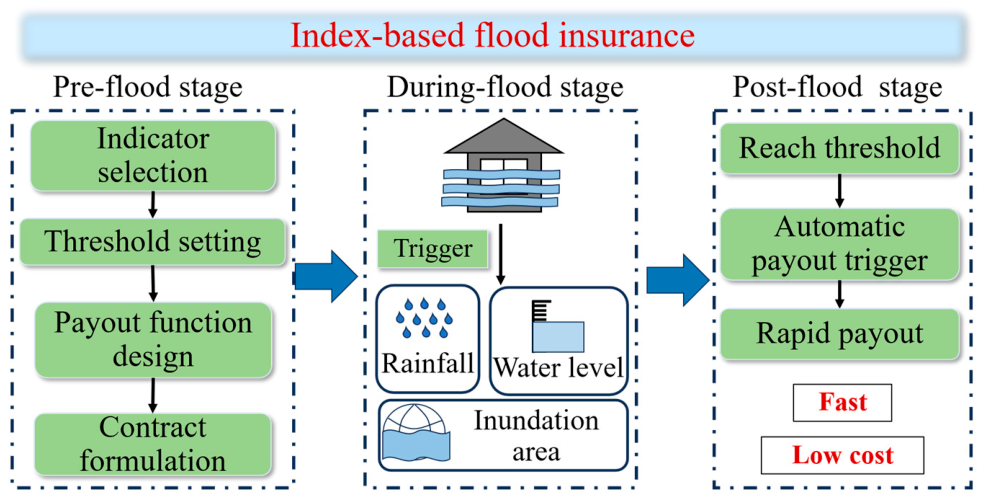
For index-based flood insurance, the payout function is designed based on flood-generating causal indicators. Specifically, in the pre-disaster stage, indicators that can characterize flood hazard characteristics are first selected [19,23]. Thresholds are then defined for these indicators, and corresponding payout functions are established under different threshold levels [13,21]. When a flood event occurs, the selected indicators are continuously monitored, and payouts are automatically triggered once the observed values reach the predefined thresholds (Figure 3, where the solid arrows indicate the operational sequence, different colors distinguish the design and execution phases, and the dashed box highlights the automatic trigger mechanism). Compared with traditional indemnity-based insurance, this type of insurance does not require on-site loss assessment, and therefore offers faster claim settlement and lower operational costs [27]. In addition, payouts are determined directly by the monitored index values. By carefully designing the payout function, a statistical consistency between triggering indices and actual losses can be achieved, which reduces the likelihood of moral hazard and claim disputes [17,28,29]. For example, satellite-based index insurance has been applied in Bangladesh and the United States to support rapid post-flood compensation in data-scarce or large-scale flood-prone regions [18,30].
Based on this, this study focuses on reviewing the system of index-based flood insurance, aiming to systematically summarize methods for index selection and payout function design, thereby providing theoretical support for flood insurance product development and flood risk management [25,30].

3. Index-Based Flood Insurance Indicator System

In the past, floods were regarded as localized and high-frequency natural hazards. Accordingly, flood risk was typically assessed under the assumption of stationarity, using historical statistical data for modeling [1,2,31,32]. However, under the combined influences of climate change and human activities, the underlying mechanisms of flood risk formation are undergoing significant transformation [3,31,33,34]. The United Nations Office for Disaster Risk Reduction (UNDRR) and the Sendai Framework for Disaster Risk Reduction emphasize that catastrophe risk exhibits systemic interdependencies, with impacts that can propagate and amplify across different systems [9,35,36].
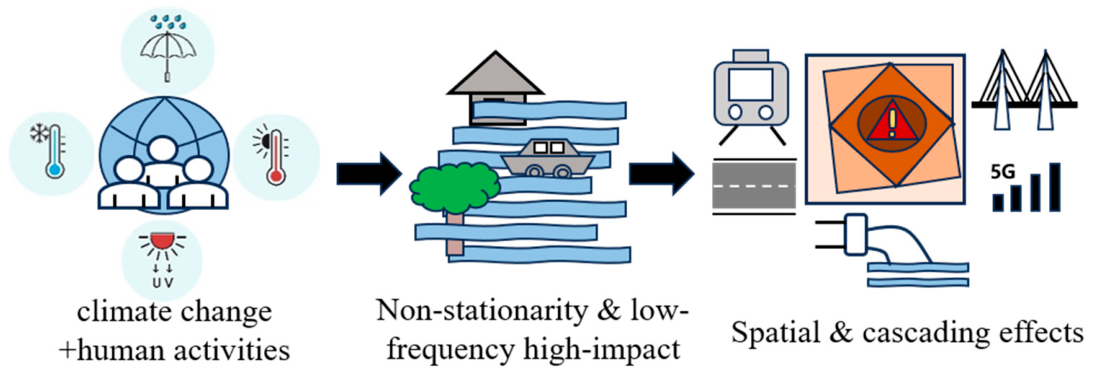
Against this backdrop, flood risk is no longer a purely hydrological issue, but has evolved into a comprehensive risk shaped by the interaction of climate change, increasing exposure, and infrastructure systems [7,8,37,38]. Its manifestations are increasingly characterized by enhanced non-stationarity, low-frequency but high-impact events, spatial dependence, and cascading amplification effects (Figure 4, where different colors distinguish risk dimensions across climate, exposure, and infrastructure systems, and the arrows indicate the pathways of risk propagation and cascading amplification) [6,32,33,34].

3.1. Index-Based Flood Insurance Based on Precipitation Indicators

3.1.1. Definition of Precipitation Indicators

Precipitation indices are constructed based on observed rainfall data, or by combining numerical weather prediction models with multi-source remote sensing observations and data-assimilated reanalysis datasets, to characterize precipitation processes over a specific period [17,18,39]. These indicators are used to represent the intensity of extreme rainfall events. In index-based flood insurance based on precipitation indicators, commonly used features include cumulative rainfall, extreme precipitation, and continuous rainfall processes [19,23]. Trigger thresholds are predefined to link precipitation events with insurance payout mechanisms [13,21].
As a primary driving factor of flood formation, precipitation directly affects rainfall–runoff processes within a basin [32,34]. Therefore, precipitation-based index-based flood insurance can reflect the potential flood risk at an early stage of a disaster and enable rapid payout triggering [28,29]. In addition, precipitation data are relatively easy to obtain, with wide spatial coverage and long historical records. As a result, precipitation indices are among the most widely used indicators in index-based flood insurance [17,27].

3.1.2. Research Progress on Index-Based Flood Insurance Based on Precipitation Indicators

Existing studies on precipitation-based index-based flood insurance mainly focus on the construction of precipitation indices, the determination of trigger thresholds, and the design of payout functions, forming a relatively systematic technical framework [19,21]. Accordingly, this section summarizes the development of such insurance along the following technical pathway: data acquisition-precipitation index selection-threshold determination-payout design-pricing. In this framework, the data used in precipitation-based index insurance can generally be divided into two categories: trigger data sources and supporting/modeling data sources. Trigger data sources are directly used to activate insurance payouts, while supporting/modeling data sources are mainly applied to index construction, calibration, and loss assessment.
In precipitation-based index insurance, rainfall data are typically obtained from rain gauges, hydrological stations, and meteorological stations. In recent years, with the development of remote sensing and satellite-based precipitation retrieval techniques, data sources have gradually shifted toward satellite observations and reanalysis products [18,39,40]. Compared with ground-based observations, satellite-derived precipitation data offer wider spatial coverage, higher spatiotemporal resolution, and stronger data continuity, reducing data gaps caused by uneven station distribution or observational blind spots. However, although satellite observations and reanalysis datasets provide broad spatial coverage, their application in index-based flood insurance still requires bias correction and validation against ground-based observations to ensure reliability in local-scale flood risk assessment.
The types of precipitation indices used in this insurance can be classified as shown in Table 2. From the perspective of the mapping relationship between precipitation indices and losses, early studies mainly used simple indicators such as cumulative rainfall as trigger conditions for payouts [19]. However, such single-parameter indicators can only reflect the rainfall process itself and are prone to significant basis risk [29,41]. Subsequently, indices capturing extreme precipitation characteristics were introduced, which improved the correlation between indices and actual losses to some extent; however, these indices primarily reflect the probability of hazard occurrence rather than actual losses [30].
On this basis, standardized precipitation indices were developed, which can describe climatic risk variations at regional scales and exhibit an indirect relationship with losses [15]. In recent years, with the advancement of machine learning and artificial intelligence, rainfall–loss relationship indices have been constructed, which can directly capture the mapping between precipitation and losses, significantly reducing basis risk and making loss-driven modeling an emerging feature of this type of index-based flood insurance [16,17].
In index-based flood insurance product design based on precipitation indicators, the selection of trigger thresholds determines the insurance activation mechanism. In the past, thresholds were typically determined directly using historical statistical percentiles or extreme-value-based cut-offs [42]. Although such approaches are simple, they are highly subjective and indirectly increase basis risk. With the development of research, threshold determination methods have gradually evolved toward approaches based on loss data, disaster identification models, and cost function optimization [19,21]. These methods require higher data quality and model reliability, but they substantially reduce the subjectivity associated with threshold selection.
The form of the payout function determines the insurance compensation structure [13,21]. Existing payout functions can be classified into several types, as shown in Table 3. Among them, fixed payout functions have the simplest structure: once the index exceeds the threshold, a fixed compensation is triggered. Although this approach has low data requirements, it does not establish a direct correspondence between payouts and actual losses, leading to relatively high basis risk. It is mainly applied in agricultural index insurance with limited data availability or relatively homogeneous risk structures [19,23,27].
Linear payout structures can partially capture the relationship between hazard intensity and losses, thereby reducing basis risk to some extent [28,29]. They are suitable for agricultural insurance and regional flood insurance applications. Piecewise payout structures define multiple compensation intervals, where different hazard intensities correspond to different payout ratios. This flexible structure can represent the nonlinear characteristics of losses and is the most widely used in flood index insurance, with relatively low basis risk [21,41]. Finally, probabilistic or loss-model-based payout methods determine compensation by explicitly modeling the relationship between the index and loss probability. These approaches can significantly improve payout accuracy and further reduce basis risk; however, they require high-quality data, advanced models, and substantial computational resources, and are therefore mainly applied in catastrophe insurance and reinsurance pricing [17,43].

3.1.3. Premium Determination and Pricing Mechanisms

While the payout structure determines the compensation amount triggered under different precipitation index thresholds, premium determination represents a distinct component of index-based flood insurance product design. Specifically, premium pricing refers to the actuarial process of estimating insurance costs based on expected losses, administrative expenses, and risk loading factors [12,21].
In early studies, premiums were often determined using historical average losses or empirical rates, which are relatively simple but may not adequately capture the uncertainty of extreme flood events [19,23]. With the development of catastrophe modeling and risk analysis methods, premium determination has gradually evolved toward approaches based on probabilistic loss estimation, extreme value theory, and simulation-based pricing models [17,29,32]. These methods can better incorporate the occurrence probability of extreme floods and improve pricing accuracy.
Overall, although payout structures directly affect expected compensation, premium determination additionally depends on market conditions, insurer capital requirements, and catastrophe risk diversification strategies. Therefore, payout design and premium pricing should be regarded as two related but distinct components in index-based flood insurance product development.
Because precipitation data are relatively easy to obtain, have wide spatial coverage, and can trigger insurance payouts at an early stage of a disaster, index-based flood insurance using precipitation indicators is one of the earliest and most widely applied forms of index-based flood insurance. However, from the perspective of flood formation mechanisms, precipitation is only a driving factor and cannot directly represent actual losses. The rainfall process also involves complex hydrological and hydrodynamic processes, including rainfall–runoff generation, channel routing, and inundation propagation. As a result, precipitation-based index-based flood insurance is prone to a mismatch between index values and actual losses, leading to relatively high basis risk.
Therefore, precipitation-based index-based flood insurance is mainly suitable for large-scale flood risk diversification, but has limitations in providing fine-scale flood loss compensation. This limitation has also driven the development of water level-based indices and inundation extent-based index-based flood insurance for flood risk.

3.2. Index-Based Flood Insurance Based on Water Level Indicators

3.2.1. Definition of Water Level Indicators

Water level indices are constructed based on observed water level data from hydrological stations and water level monitoring systems [20,44]. They characterize flood intensity and its impacts through variations in water levels within rivers, reservoirs, or urban drainage systems. In index-based flood insurance based on water level indicators, commonly used variables include peak water level, duration of exceedance above warning levels, magnitude of exceedance above predefined thresholds, and features of water level hydrographs [43,45]. Predefined water level thresholds are used to link flood processes with insurance payout mechanisms [13,21].
Compared with precipitation indices, water level indices can more directly reflect catchment rainfall–runoff processes and channel routing dynamics [32,34]. Therefore, water level-based index-based flood insurance can, to some extent, more directly represent flood intensity and its potential losses [16,43]. Water level data typically have long time series and high observational accuracy, and show a stronger correlation with flood losses than precipitation indices [43,46]. As a result, they are widely used in both riverine flood insurance and urban flood insurance [27,47].

3.2.2. Research Progress on Index-Based Flood Insurance Based on Water Level Indicators

Existing studies on water level-based index-based flood insurance follow a technical framework similar to that of precipitation-based index insurance, typically involving data acquisition, water level index selection, threshold determination, payout design, and pricing.
In water level-based index insurance, the main types of indices are summarized in Table 4. Early studies primarily constructed indices based on observed water levels from hydrological stations. Insurance payouts were triggered once water levels exceeded predefined thresholds. This approach is simple and relies on relatively reliable data; however, due to spatial mismatches between hydrological stations and insured areas, observed water levels may not adequately represent conditions within the coverage area, leading to basis risk [29,41].
Subsequently, some studies derived water level indices using remote sensing data and hydrodynamic models [39,40]. Characteristic water levels corresponding to different return periods were calculated from historical records and used as trigger thresholds [42]. This approach can compensate for the mismatch between station locations and insured areas and is suitable for data-scarce regions or large-scale flood insurance applications. However, the accuracy of the water level index depends on uncertainties in remote sensing retrieval and model simulation, which may still introduce basis risk [29,30]. However, satellite altimetry is constrained by revisit time, spatial resolution, and signal uncertainty in complex terrain. Therefore, it is often necessary to combine satellite observations with hydrodynamic models through data assimilation to improve water level estimation and flood characterization.
To further reduce basis risk, some studies moved away from simple threshold-trigger mechanisms and instead established functional relationships between water level indices and loss rates. Payouts are directly determined using loss functions, often based on nonlinear loss formulations or conditional probability models. Such approaches are generally suitable for estimating shallow inundation losses [46].
With the development of multi-source data integration and machine learning techniques, recent studies have used water level as the core variable while incorporating rainfall, inundation extent, terrain, and exposure data to build flood loss prediction models [16,17]. Insurance payouts are then determined based on predicted losses. This multi-source fusion approach improves the correlation between water level and actual losses and effectively reduces basis risk; however, it is highly dependent on data quality and training sample size [29,43].
In addition, some studies have introduced risk classification schemes by combining water level indices with rainfall, exposure, or vulnerability information. Tiered payout structures or parameterized trigger mechanisms are then designed according to different risk levels [19,21]. This approach partially addresses the limitation that single water level indices cannot fully capture loss heterogeneity, and is therefore more suitable for regional flood risk management and insurance design [22].
Water level indices can directly reflect catchment rainfall–runoff processes and flood propagation dynamics, and they generally exhibit a relatively strong correlation with flood inundation depth and disaster losses in areas located close to gauging stations. However, this relationship may vary depending on distance from the gauge, local topography, levee conditions, backwater effects, drainage systems, and stage–damage relationships. Therefore, they have strong capability in characterizing flood hazards and are widely used in both riverine flood insurance and urban flood insurance. In addition, water level observations typically have long time series and high measurement accuracy, providing a relatively reliable data basis for index construction and disaster loss analysis.
However, compared with precipitation-based index insurance, research on water level-based index-based flood insurance is relatively less extensive. This is mainly because water level data are primarily obtained from hydrological station observations, resulting in limited spatial coverage. Moreover, water levels are influenced by catchment topography, river morphology, and engineering operations, leading to significant spatial heterogeneity in the relationship between water levels and losses. As a result, this type of index has limited generalizability and is constrained in large-scale insurance product design.
Overall, water level indicators are essentially point-based or channel-scale variables and cannot directly represent the spatial extent of flood inundation or affected areas. This limitation has driven the gradual shift in research toward index-based flood insurance based on inundation extent.

3.3. Index-Based Insurance Flood Based on Inundation Area Indicators

3.3.1. Definition of Inundation Area Indicators

Inundation area indices are constructed based on indicators such as flooded area, inundation ratio, or spatial extent of flooding [40,43,48]. These indices are derived from remote sensing imagery, hydrodynamic model simulations, or flood inundation mapping methods [49]. Insurance payouts are triggered by predefined inundation area thresholds or are determined through tiered payout structures based on the magnitude of inundation [21,23].
Compared with precipitation and water level indices, inundation area indices can directly represent the spatial extent and severity of flood impacts and exhibit a more direct relationship with economic losses [16,38,43]. Therefore, they show strong application potential in agricultural flood insurance, urban flood insurance, and regional flood catastrophe insurance [27].

3.3.2. Research Progress on Index-Based Flood Insurance Based on Inundation Area Indicators

From the perspective of index construction, inundation area indices used in index-based flood insurance can be classified into several categories, as shown in Table 5. Among them, the absolute inundation area index directly uses the flooded extent of a disaster area as the index. Although this approach is structurally simple, it has limited transferability across regions [40]. In contrast, the inundation area ratio index normalizes the inundated area by total area, improving comparability across regions; however, differences in exposure and socioeconomic development levels may still lead to discrepancies between the index and actual losses [43].
In recent years, with advances in flood remote sensing and risk assessment methods, composite indices that better capture flood impacts have been developed [16,27]. The inundation area–exposure index incorporates population or asset exposure, thereby improving the ability of inundation-based indices to represent disaster impacts [38]. However, due to the relatively low update frequency of exposure data, constructing such indices remains complex [37]. The inundation area–loss index converts inundation area into economic loss through loss modeling, but significant uncertainties may arise during model construction [43,47]. The inundation area risk index integrates hazard, exposure, and vulnerability factors and is mainly used for flood risk assessment and insurance pricing. However, it involves strong subjectivity in weighting different components and is therefore less suitable for rapid-response, trigger-based index-based flood insurance [29].
From the perspective of insurance payout mechanisms, existing studies have developed five main modes, as summarized in Table 6. Among them, fixed payout refers to a mechanism in which a predetermined amount is paid once the inundation area index exceeds a predefined threshold. This approach has a simple structure and enables rapid claims settlement; however, it exhibits low consistency with actual losses and is prone to basis risk [12,13].
Loss-function-based payout establishes a functional relationship between inundation area and losses, thereby improving their correlation. However, this approach requires high-quality historical loss data and accurate model specification [43].
Tiered payout assigns different compensation levels according to flood intensity, offering greater flexibility. It is suitable for urban flood insurance and graded risk compensation systems [23].
Claim-based relational payout links the inundation area index with actual insurance claim data, thereby reducing basis risk; however, this method is highly dependent on data availability and quality [45].
Finally, risk-level or index-triggered payout is based on composite risk indices to trigger compensation. It can reflect spatial heterogeneity in risk using multi-source data and is suitable for regional risk management and policy-oriented insurance design [22,25,27].
Index-based flood insurance based on inundation area indicators partially addresses the limitations of precipitation-based and water level-based index insurance. This index can directly reflect the spatial extent of flood impacts and the degree of affected areas, and it shows a more direct correspondence with population exposure, asset exposure, and economic losses. Therefore, it has strong application potential in agricultural flood insurance, urban flood insurance, and regional flood catastrophe insurance.
However, due to limitations associated with remote sensing data accuracy, uncertainties in the relationship between inundation area and losses, and model complexity, inundation area indices still involve a certain level of basis risk. Consequently, future research should further improve data accuracy, reduce basis risk, and simplify index modeling frameworks.

3.4. Comparison of Different Types of Index-Based Flood Insurance

To facilitate practical application and support insurance product design, a comparative framework was established to summarize the characteristics of different trigger index types across multiple dimensions, including data availability, spatial representativeness, temporal responsiveness, correlation with losses, basis risk level, suitable flood scenarios, insurance scales, and degree of model dependence (Table 7).
Through a horizontal comparison of different types of indicators, it can be observed that all index types select variables that characterize flood intensity or impacts as trigger variables for insurance payouts, and implement compensation through predefined thresholds or payout functions. The core objective of these designs is to reduce information asymmetry, lower post-disaster loss assessment costs, and enable rapid claims settlement. However, different index types exhibit significant differences in data sources, spatial scales, correlation with disaster losses, and application domains.
A vertical review of the evolution of index-based flood insurance shows that index construction methods have progressed from indices representing single hazard-driving factors, to indices reflecting hazard processes, and further to indices integrating disaster impacts. Early studies mainly used precipitation-based indices as flood insurance triggers, representing flood risk through rainfall amount or intensity. These indices are relatively easy to obtain and thus widely applicable; however, they exhibit weak correlation with actual flood losses and are prone to basis risk. Subsequently, research shifted toward water level-based indices, using river stage or discharge as trigger variables. These indices better capture flood processes, but are limited by cross-sectional observations and cannot adequately represent inundation extent or spatial loss distribution.
In practical applications, advanced approaches such as machine learning models, Copula-based methods, and probabilistic indices generally improve the consistency between trigger indices and actual losses. However, these approaches require high-quality multi-source data, greater computational resources, and stronger technical support, which may limit their applicability in data-scarce or developing regions.
Building on this, recent studies have focused on developing inundation area-based flood insurance products. By deriving flood extent from remote sensing or hydrodynamic models, these indices can directly reflect disaster impacts and the degree of regional damage, showing a stronger correlation with economic losses. However, they are more dependent on data quality and model accuracy, and their construction process is relatively complex.
In summary, the evolution of index construction methods indicates that the core challenge in index-based flood insurance research lies in reducing the discrepancy between the index and actual losses, namely basis risk. Therefore, it is necessary to further analyze basis risk in index-based flood insurance.

4. Basis Risk in Index-Based Flood Insurance

4.1. Definition and Mechanism of Basis Risk

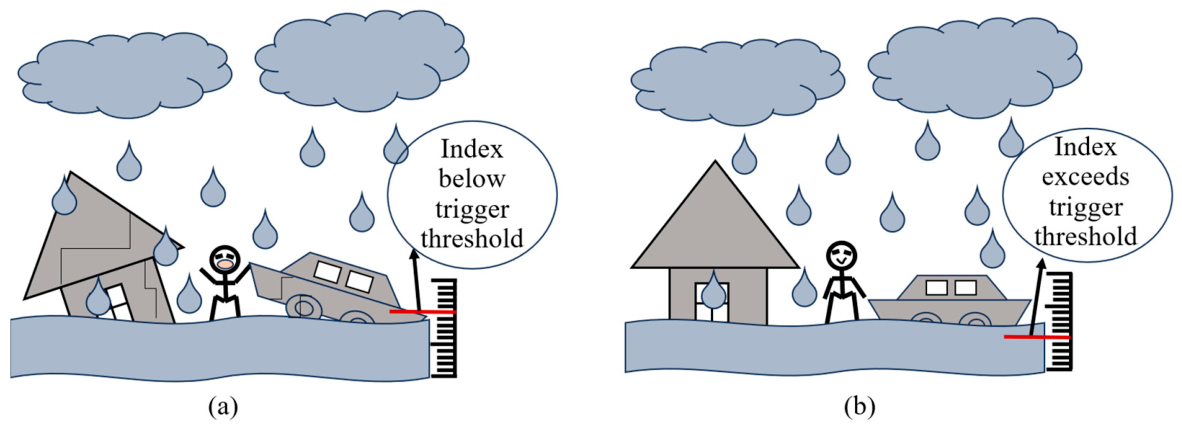
In index-based flood insurance, basis risk refers to the mismatch between flood insurance payouts and actual losses [29,41]. It can be broadly classified into two types. The first occurs when policyholders suffer substantial economic losses due to flood events, but the monitoring index of the index-based flood insurance does not reach the predefined trigger threshold, resulting in non-payment despite actual damage (no payout despite loss) [52] (Figure 5a, where the actual loss is prominent but the monitored index value remains below the red dashed trigger threshold). The second occurs when the monitoring index reaches the trigger threshold and insurance compensation is paid, but the policyholder does not experience any corresponding economic loss, resulting in payouts without actual damage (false payout) [28,29] (Figure 5b, which conversely illustrates a zero-loss scenario where the index value successfully exceeds the threshold line).
Non-payment despite loss leads to economic losses for policyholders. This is particularly severe for low-income groups and vulnerable regions, where post-disaster recovery capacity is limited, further exacerbating socioeconomic inequality [7,8,37]. It also reduces policyholders’ willingness to participate in flood insurance schemes [29]. Conversely, payout without loss leads to flood insurance payouts exceeding expected budgets, increasing insurers’ operating costs [41]. To mitigate solvency pressure, insurers may increase premiums for subsequent products, meaning that the additional cost is ultimately borne by all policyholders [9]. In addition, although index-based flood insurance can reduce moral hazard, a severe mismatch between index design and actual losses may incentivize policyholders to manipulate the index environment to obtain unfair benefits.
Although basis risk cannot be completely eliminated, it can be effectively reduced through improved index design and risk-sharing mechanisms, thereby enhancing the stability of index-based flood insurance. Therefore, this study focuses on summarizing the sources and mitigation strategies of basis risk to provide a reference for future research.

4.2. Quantification and Mitigation Strategies for Basis Risk

In flood-related index insurance, basis risk arises from several sources, including the limited transferability of threshold values across different regions, inconsistencies between selected index variables and regional flood generation mechanisms, and difficulties in quantifying regional tail risks. Existing studies have mainly combined remote sensing technologies, machine learning methods, and threshold optimization techniques to improve model performance. These approaches enhance the correlation between economic losses and insurance payouts, thereby reducing basis risk to some extent. However, they are often computationally complex, require large amounts of high-quality data, and also face the challenge of model interpretability due to their “black-box” nature.
Index-based insurance in the agricultural and livestock sectors typically uses precipitation, temperature, or vegetation indices as triggering variables for insurance payouts. The sources of basis risk in these sectors are highly similar to those in index-based flood insurance. For example, in agricultural index insurance, precipitation indices cannot fully capture the actual extent of crop damage [19,29]. Similarly, in index-based flood insurance, single indicators such as rainfall are insufficient to accurately represent flood inundation extent and the resulting losses [3,43].
Since index-based insurance in the agricultural and livestock sectors has been developed earlier, with relatively mature theoretical frameworks and product designs, the approaches used in these fields to reduce basis risk provide important references for mitigating basis risk in index-based flood insurance [17,21] (Table 8).
However, the direct transfer of methodologies from agricultural and livestock index insurance to flood insurance remains subject to important limitations. Agricultural losses are primarily associated with crop growth conditions and seasonal climatic variability, whereas flood losses are strongly influenced by local hydrodynamic processes, infrastructure systems, drainage conditions, and spatial exposure heterogeneity. Therefore, although agricultural index insurance provides valuable methodological references, its basis risk mitigation strategies require further adaptation before being directly applied to flood insurance.
In agricultural and livestock insurance, to reduce measurement errors in index data, existing studies have constructed multi-source insurance indices by integrating remote sensing data, meteorological observations, and ground-based monitoring data [18,40]. In addition, policyholders are allowed to independently select trigger thresholds and coverage levels, which helps reduce basis risk; however, this approach requires a relatively high level of financial literacy among policyholders.
Given the high uncertainty associated with threshold selection in traditional extreme risk models, some studies have, on the basis of multi-source data, employed artificial neural networks (ANN) to predict index thresholds, utilized Copula functions to characterize tail risk dependence, and adopted dynamic quantile methods for threshold setting. These approaches improve the threshold determination mechanism, but involve complex model construction and require high-quality data [17,54].
Furthermore, using administrative boundaries as insurance units can lead to significant intra-regional heterogeneity, thereby increasing basis risk [29]. To address this issue, some studies have incorporated lower tail dependence (LTD) coefficients and Copula-based methods to estimate extreme risk correlations, and have optimized insurance zoning through spatial clustering techniques [53,54]. From the perspective of spatial risk homogeneity, these approaches effectively reduce basis risk; however, they rely heavily on high-resolution remote sensing data and involve substantial computational complexity (Table 9).
Overall, the basis risk in index-based flood insurance primarily arises from measurement errors in index data, neglect of regional heterogeneity in threshold selection, and inadequate characterization of tail risks. Spatial scale plays a critical role in basis risk because the consistency between trigger indices and actual losses varies significantly across different application scales. At larger regional scales, precipitation-based indices are often more suitable due to their broad spatial coverage, whereas at local or urban scales, inundation-area and water-depth indices generally provide better loss representation. Spatial heterogeneity in topography, land use, and exposure conditions further increases the uncertainty of index-based payouts. This mismatch is particularly evident when point-based hydrological or rainfall monitoring stations are used to represent regional flood events, as localized observations often fail to capture the spatial extent and heterogeneity of actual inundation processes. Existing studies have optimized the insurance triggering process through the application of satellite remote sensing technologies, machine learning methods, tail risk models, and dynamic threshold selection approaches.
The sources of basis risk in index-based insurance are similar between the agricultural and flood sectors. However, index-based insurance in the agricultural sector is more mature in terms of theoretical development and product design. Therefore, index-based flood insurance can draw valuable insights from the agricultural sector in terms of basis risk mitigation strategies.

5. Future Challenges and Research Directions

A review of the literature on index systems, payout mechanisms, and basis risk control in index-based flood insurance indicates that, although this type of flood insurance has clear advantages in reducing claim settlement costs and improving efficiency, it still faces numerous challenges in practical applications and product design. The core challenge lies in reducing basis risk while simultaneously addressing the “black-box” nature of models and their high dependence on data accuracy. Therefore, future research should aim to enhance the correlation between indices and actual losses, while also improving model interpretability and operational feasibility, in order to develop index-based flood insurance products that can dynamically adapt to climate change [56].
In response to these challenges, future research is likely to focus on the following directions: (i) construction of multi-dimensional coupled risk indices based on disaster chains; (ii) development of dynamic trigger thresholds driven by climate change and temporal evolution; and (iii) optimization of flood insurance zoning based on tail risk and spatial clustering.
(1)
Multi-dimensional coupled risk index construction based on disaster chains [57]. Future research can integrate precipitation indices, water level indices, inundation area indices, and exposure indicators to construct a multi-dimensional risk index system that reflects both flood generation mechanisms and loss processes [58]. For example, comprehensive flood risk indices can be developed by combining multi-source remote sensing data, hydrological model simulations, and socioeconomic exposure data. Such indices can capture not only hazard intensity but also potential losses, thereby improving the correlation between indices and actual losses and reducing basis risk. In practice, multi-dimensional coupled risk indices can be constructed by integrating meteorological indicators (e.g., precipitation), hydrodynamic indicators (e.g., water depth or inundation extent), and exposure-related variables through weighted coupling models. Their validation can be performed by comparing historical index values with observed loss records, and they can be implemented in insurance products through dynamic payout functions linked to composite index thresholds. In urban environments, emerging data sources such as 5G-enabled monitoring systems, IoT waterlogging sensors, and real-time drainage network observations can further enhance the representation of localized flooding processes and cascading infrastructure impacts, thereby improving the applicability of index-based insurance in urban flood scenarios.
(2)
Dynamic trigger threshold construction based on climate change and temporal drivers. Future studies can incorporate climate model scenarios, non-stationary extreme value analysis, and time-varying parameter models to develop dynamically evolving trigger thresholds. For instance, thresholds can be derived using moving-window extreme value distributions, non-stationary generalized extreme value (GEV) models, or climate index-driven threshold models. These approaches enable the flood insurance triggering mechanism to dynamically reflect changes in risk levels, thereby enhancing the long-term adaptability of flood insurance products under climate change.
(3)
Flood insurance zoning optimization based on tail risk and spatial clustering [49,59]. Future research can employ Copula functions or multivariate extreme value theory to characterize tail dependence of extreme flood events across regions. Combined with spatial clustering methods-such as K-means, hierarchical clustering, or risk distance-based clustering-this approach can partition study areas into risk-homogeneous zones [59]. Within each zone, flood risks would exhibit similar probability distributions and loss characteristics, thereby reducing spatial basis risk and improving the rationality of flood insurance pricing.
(4)
Future research on pricing mechanisms under non-stationary flood risk.
In addition to trigger index design and basis risk reduction, premium determination remains a key issue in index-based flood insurance. Existing studies mainly focus on trigger construction and payout mechanisms, whereas premium pricing under changing climate conditions has received relatively limited attention. Future research should incorporate climate-conditioned premiums, actuarially fair pricing, and risk loading under uncertainty to improve the long-term sustainability of flood insurance products.
Furthermore, balancing affordability and financial sustainability is particularly important in developing countries and high-risk regions. Future studies may explore subsidy mechanisms, government-supported premium sharing, and public–private partnership frameworks. The integration of index-based flood insurance with reinsurance arrangements and catastrophe bonds may also provide an effective pathway for transferring extreme tail risks and improving system resilience.
(5)
Cross-cutting technical support from remote sensing and intelligent modeling.
In the construction of multi-dimensional coupled risk indices, remote sensing can be used to obtain multi-source data such as precipitation, inundation extent, land use, and exposure, while machine learning methods can support feature extraction and nonlinear mapping. For example, models such as random forests, gradient boosting trees, and neural networks can be used to establish functional relationships among rainfall, water levels, inundation, and losses, enabling the mapping from multi-source hazard factors to economic losses and thus constructing more loss-consistent composite risk indices.
In the development of dynamic trigger thresholds, remote sensing and reanalysis datasets can provide long-term time series, while machine learning approaches-particularly time series models and dynamic learning algorithms-can be used to identify the evolving relationships between climatic factors and flood risks, enabling adaptive updating of trigger thresholds and reducing temporal triggering bias.
In the optimization of flood insurance zoning, remote sensing spatial data can be used to characterize regional flood risk patterns, while machine learning methods can be applied to spatial clustering and risk partitioning. For instance, K-means, hierarchical clustering, or density-based clustering methods can be used to identify regions with similar flood risk characteristics. Combined with statistical models for estimating tail dependence between regions, these approaches can optimize flood insurance zoning and reduce basis risk arising from spatial heterogeneity.

6. Conclusions

This review addresses the core objective by systematically examining the development of trigger index systems, payout mechanisms, basis risk characteristics, and future challenges in index-based flood insurance. Compared with previous studies that mainly focused on individual components, this study provides an integrated analytical framework linking trigger index design, payout mechanisms, and basis risk control. This study systematically reviews the existing research on index systems, payout mechanisms, and basis risk control in index-based flood insurance. It summarizes three primary index construction pathways centered on precipitation, water level, and inundation extent, and analyzes the applicability of different payout function forms and threshold-setting methods. These index types rely on different databases and trigger threshold approaches. Precipitation-based indices mainly use rain gauge observations, satellite precipitation products, and reanalysis datasets, and commonly adopt percentile-based or extreme-value thresholds. Water-level indices generally depend on hydrological station records or model-simulated water levels, while inundation-based indices are mainly derived from remote sensing imagery and hydrodynamic simulations. Each type has distinct advantages and limitations: precipitation indices provide rapid triggering and broad spatial coverage but exhibit relatively high basis risk; water-level indices improve hazard representation but are constrained by spatial heterogeneity; inundation-based indices show stronger consistency with actual losses but require high-quality data and more complex modeling. Furthermore, by examining two typical scenarios-failure to trigger despite losses and triggering without actual losses-it reveals the underlying mechanisms and multi-source drivers of basis risk in index-based flood insurance.
Looking ahead, future research should further promote the practical integration of multi-source data, dynamic trigger mechanisms, and regionalized risk assessment to improve the adaptability of index-based flood insurance under climate change. Continued efforts are needed to enhance the consistency between trigger indices and actual losses while improving model interpretability and operational feasibility.
From a practical perspective, three recommendations can be drawn from this review. First, precipitation-based indices are more suitable for large-scale regional insurance products where rapid triggering is prioritized, while inundation-based indices are more appropriate for urban or asset-intensive areas where loss accuracy is critical. Second, insurance product designers should prioritize coupled hazard-loss indicators and dynamic threshold setting to reduce basis risk under non-stationary climate conditions. Third, regional policy makers should integrate index-based flood insurance with flood zoning and disaster risk financing strategies to enhance regional resilience to extreme flood events.
This study has several limitations. First, as a narrative review, the literature selection may not cover all recent developments in rapidly evolving areas such as machine learning-based insurance modeling and climate-adaptive pricing. Second, this review mainly focuses on conceptual frameworks and methodological development, while quantitative comparisons of insurance performance across different regions remain limited. Future research should strengthen empirical validation using actual claim datasets and establish standardized evaluation frameworks for comparing the effectiveness of different index systems.

Author Contributions

Conceptualization, J.Z. and C.Q.; methodology, C.Q.; validation, J.Z., C.Q. and X.Z.; formal analysis, C.Q. and J.W.; investigation, J.Z. and C.Q.; resources, H.W.; data curation, C.Q. and T.H.; writing-original draft preparation, C.Q.; writing-review and editing, all authors.; visualization, C.Q.; supervision, C.Q.; project administration, H.W.; funding acquisition, J.Z. All authors have read and agreed to the published version of the manuscript.

Funding

The study is financially supported by the National Natural Science Foundation of China (No. 52192671), the Beijing Natural Science Foundation (No. 8242003), and the Chongqing Natural Science Foundation (No. CSTB2024NSCQ-MSX0557).

Data Availability Statement

No new data were created or analyzed in this study.

Conflicts of Interest

The authors declare no conflicts of interest.

References

  1. Deng, Z.F.; Gao, W.Z.; Liao, Y.X.; Wang, Z.L. Research progress of impact of climate change on urban rainstorm flooding. J. North China Univ. Water Resour. Electr. Power (Nat. Sci. Ed.) 2024, 45, 1–14. [Google Scholar] [CrossRef]
  2. Hu, P.; Chen, B.; Shi, P.J. Spatiotemporal patterns and influencing factors of rainstorm-induced flood disasters in China. Acta Geogr. Sin. 2021, 76, 1148–1162. [Google Scholar] [CrossRef]
  3. Gu, X.; Zhang, Q.; Li, J.; Chen, D.; Singh, V.P.; Zhang, Y.; Liu, J.; Shen, Z.; Yu, H. Impacts of anthropogenic warming and uneven regional socio-economic development on global river flood risk. J. Hydrol. 2020, 588, 125262. [Google Scholar] [CrossRef]
  4. Alfieri, L.; Bisselink, B.; Dottori, F.; Naumann, G.; de Roo, A.; Salamon, P.; Wyser, K.; Feyen, L. Global projections of river flood risk in a warmer world. Earth’s Future 2017, 5, 171–182. [Google Scholar] [CrossRef]
  5. IPCC. Summary for Policymakers. In Climate Change 2022: Impacts, Adaptation and Vulnerability. Contribution of Working Group II to the Sixth Assessment Report of the Intergovernmental Panel on Climate Change; Pörtner, H.-O., Roberts, D.C., Tignor, M., Poloczanska, E.S., Mintenbeck, K., Alegría, A., Craig, M., Langsdorf, S., Löschke, S., Möller, V., et al., Eds.; Cambridge University Press: Cambridge, UK; New York, NY, USA, 2022; pp. 3–33. [Google Scholar] [CrossRef]
  6. Krichene, H.; Geiger, T.; Frieler, K.; Willner, S.N.; Sauer, I.; Otto, C. Long-term impacts of tropical cyclones and fluvial floods on economic growth-Empirical evidence on transmission channels at different levels of development. World Dev. 2021, 144, 105475. [Google Scholar] [CrossRef]
  7. Allaire, M. Socio-economic impacts of flooding: A review of the empirical literature. Water Secur. 2018, 3, 18–26. [Google Scholar] [CrossRef]
  8. Bailey, R.; Saffioti, C.; Drall, S. Sunk Costs: The Socioeconomic Impacts of Flooding; Marsh McLennan Advantage: New York, NY, USA, 2021; pp. 1–32. [Google Scholar]
  9. Mechler, R.; Mochizuki, J.; Hochrainer-Stigler, S. Disaster Risk Management and Fiscal Policy: Narratives, Tools, and Evidence Associated with Assessing Fiscal Risk and Building Resilience; World Bank Policy Research Working Paper; World Bank Group: Washington, DC, USA, 2016; p. 7635. [CrossRef]
  10. Linnerooth-Bayer, J.; Surminski, S.; Bouwer, L.M.; Noy, I.; Mechler, R. Insurance as a Response to Loss and Damage? In Loss and Damage from Climate Change; Mechler, R., Bouwer, L., Schinko, T., Surminski, S., Linnerooth-Bayer, J., Eds.; Springer: Cham, Switzerland, 2018; pp. 483–512. [Google Scholar] [CrossRef]
  11. Zhao, J.; Lee, J.Y.; Li, Y.; Yin, Y.J. Effect of catastrophe insurance on disaster-impacted community: Quantitative framework and case studies. Int. J. Disaster Risk Reduct. 2020, 42, 101387. [Google Scholar] [CrossRef]
  12. Lin, X.; Kwon, W.J. Application of parametric insurance in principle-compliant and innovative ways. Risk Manag. Insur. Rev. 2020, 23, 121–150. [Google Scholar] [CrossRef]
  13. Figueiredo, R.; Martina, M.L.V.; Stephenson, D.B.; Youngman, B.D. A Probabilistic Paradigm for the Parametric Insurance of Natural Hazards. Risk Anal. 2018, 38, 2400–2414. [Google Scholar] [CrossRef]
  14. Davlasheridze, M.; Fan, Q. Flood risk, insurance, and community-level mitigation efforts: Evidence from the National Flood Insurance Program’s (NFIP) Community Rating System. Int. J. Disaster Risk Reduct. 2025, 118, 105255. [Google Scholar] [CrossRef]
  15. Kousky, C.; Wiley, H.; Shabman, L. Can Parametric Microinsurance Improve the Financial Resilience of Low-Income Households in the United States? A Proof-of-Concept Examination. Econ. Disasters Clim. Change 2021, 5, 301–327. [Google Scholar] [CrossRef]
  16. Yang, Q.; Shen, X.; Yang, F.; Anagnostou, E.N.; He, K.; Mo, C.; Seyyedi, H.; Kettner, A.J.; Zhang, Q. Predicting Flood Property Insurance Claims over CONUS, Fusing Big Earth Observation Data. Bull. Am. Meteorol. Soc. 2022, 103, E791–E809. [Google Scholar] [CrossRef]
  17. Cesarini, L.; Figueiredo, R.; Monteleone, B.; Martina, M.L.V. The potential of machine learning for weather index insurance. Nat. Hazards Earth Syst. Sci. 2021, 21, 2379–2405. [Google Scholar] [CrossRef]
  18. Thomas, M.; Tellman, E.; Osgood, D.E.; DeVries, B.; Islam, A.S.; Steckler, M.S.; Goodman, M.; Billah, M. A Framework to Assess Remote Sensing Algorithms for Satellite-Based Flood Index Insurance. IEEE J. Sel. Top. Appl. Earth Obs. Remote Sens. 2023, 16, 2589–2604. [Google Scholar] [CrossRef]
  19. Abdi, M.J.; Raffar, N.; Zulkafli, Z.; Nurulhuda, K.; Rehan, B.M.; Muharam, F.M.; Khosim, N.A.; Tangang, F. Index-based insurance and hydroclimatic risk management in agriculture: A systematic review of index selection and yield-index modelling methods. Int. J. Disaster Risk Reduct. 2022, 67, 102653. [Google Scholar] [CrossRef]
  20. He, X.W.; Tong, J.L.; Liu, Y.X.; Cui, Z.H. Flood insurance in China: Current situation, dilemma and optimization. J. China Emerg. Manag. Sci. 2023, 18, 15–30. [Google Scholar]
  21. Steinmann, C.B.; Guillod, B.P.; Fairless, C.; Bresch, D.N. A generalized framework for designing open-source natural hazard parametric insurance. Environ. Syst. Decis. 2023, 43, 555–568. [Google Scholar] [CrossRef]
  22. Nguyen, V.D.; Aerts, J.; Tesselaar, M.; Botzen, W.; Kreibich, H.; Alfieri, L.; Merz, B. Exploring the use of seasonal forecasts to adapt flood insurance premiums. Nat. Hazards Earth Syst. Sci. 2024, 24, 2923–2937. [Google Scholar] [CrossRef]
  23. Abrego-Pérez, A.L.; Boonman, T.M.; Valencia Arboleda, C.F. Index insurance for simultaneous flooding and drought risks with insufficient data: A two-step approach. Stoch. Environ. Res. Risk Assess. 2025, 39, 2769–2788. [Google Scholar] [CrossRef]
  24. Li, S.L.; Liu, X. Double-triggered catastrophe put option with risk ratio and its pricing. J. Shandong Univ. Nat. Sci. 2025, 60, 12–21. [Google Scholar] [CrossRef]
  25. Zhang, J. Blended insurance scheme: A synergistic conventional-index insurance mixture. Insur. Math. Econ. 2024, 119, 93–105. [Google Scholar] [CrossRef]
  26. Poudel, S.; Elliott, R.; Anyah, R.; Grabowski, Z.; Knighton, J. Differential flood insurance participation and housing market trajectories under future coastal flooding in the United States. Commun. Earth Environ. 2024, 5, 668. [Google Scholar] [CrossRef]
  27. Gesualdo, G.C.; Benso, M.R.; Sass, K.S.; Mendiondo, E.M. Index-based insurance to mitigate current and future extreme events financial losses for water utilities. Int. J. Disaster Risk Reduct. 2024, 100, 104218. [Google Scholar] [CrossRef]
  28. Morsink, K.; Clarke, D.J.; Mapfumo, S. How to Measure Whether Index Insurance Provides Reliable Protection; World Bank Policy Research Working Paper; World Bank: Washington, DC, USA, 2016; p. 7744. [CrossRef]
  29. Clement, K.Y.; Botzen, W.J.W.; Brouwer, R.; Aerts, J.C.J.H. A global review of the impact of basis risk on the functioning of and demand for index insurance. Int. J. Disaster Risk Reduct. 2018, 28, 845–853. [Google Scholar] [CrossRef]
  30. Saunders, A.; Tellman, B.; Benami, E.; Anchukaitis, K.J.; Hossain, S.; Bennett, A.; Islam, A.K.S.; Giezendanner, J. Sensitivity to Data Choice for Index-Based Flood Insurance. Earth’s Future 2025, in press. [Google Scholar] [CrossRef]
  31. Wang, T.; Mao, D.H.; Deng, M.R.; Feng, C.; Hu, G.W.; Zhang, J.Y.; Zou, Y. Non-stationarity analysis of flood extremes under climate change and human activities in the Yuan River Basin, China. J. Hydrol. Reg. Stud. 2025, 57, 102131. [Google Scholar] [CrossRef]
  32. Macdonald, E.; Merz, B.; Guse, B.; Nguyen, V.D.; Guan, X.; Vorogushyn, S. What controls the tail behaviour of flood series: Rainfall or runoff generation? Hydrol. Earth Syst. Sci. 2024, 28, 833–850. [Google Scholar] [CrossRef]
  33. Lu, X.C.; Xu, Z.X.; Shi, Q.M.; Tang, Q.Z. Evolution characteristics of urban flood disasters chain and approaches for disaster mitigation. Adv. Water Sci. 2025, 36, 97–108. [Google Scholar] [CrossRef]
  34. Pink, I.; Reaney, S.M.; Hardy, R.J.; Bovolo, C.I. Increased rainfall-runoff drives flood hazard intensification in Central Himalayan river systems. Sci. Rep. 2025, 15, 42277. [Google Scholar] [CrossRef]
  35. Aitsi-Selmi, A.; Egawa, S.; Sasaki, H.; Wannous, C.; Murray, V. The Sendai Framework for Disaster Risk Reduction: Renewing the Global Commitment to People’s Resilience, Health, and Well-being. Int. J. Disaster Risk Sci. 2015, 6, 164–176. [Google Scholar] [CrossRef]
  36. Wang, H.; Du, W.; Liu, J.H.; Wang, J.; Mei, C. Derivation and transmission analysis of urban flood disaster chain based on knowledge graph. Adv. Water Sci. 2024, 35, 185–196. [Google Scholar] [CrossRef]
  37. Hallegatte, S.; Bangalore, M.; Vogt-Schilb, A. Assessing Socioeconomic Resilience to Floods in 90 Countries; World Bank Policy Research Working Paper; World Bank: Washington, DC, USA, 2016; p. 7663. [CrossRef]
  38. Liu, Y.; Li, Y.; Wang, G.; Gao, G.; Chen, Y. Quantifying multi-regional indirect economic losses: An assessment based on the 2021 rainstorm events in China. Front. Earth Sci. 2023, 10, 1057430. [Google Scholar] [CrossRef]
  39. Vecere, A.; Martina, M.; Monteiro, R.; Galasso, C. Satellite precipitation–based extreme event detection for flood index insurance. Int. J. Disaster Risk Reduct. 2021, 55, 102108. [Google Scholar] [CrossRef]
  40. Tellman, B.; Lall, U.; Islam, S.; Bhuyan, M.A. Regional Index Insurance using Satellite-based Fractional Flooded Area. Earth’s Future 2022. submitted. [Google Scholar] [CrossRef]
  41. Lichtenberg, E.; Iglesias, E. Index insurance and basis risk: A reconsideration. J. Dev. Econ. 2022, 158, 102883. [Google Scholar] [CrossRef]
  42. Wang, Y.M.; Yang, X.T. Distribution fitting of catastrophe loss based on LogGED-GPD model. J. Zhengzhou Univ. Nat. Sci. Ed. 2021, 53, 100–104. [Google Scholar] [CrossRef]
  43. Wu, Z.; Zheng, X.; Chen, Y.; Huang, S.; Hu, W.; Duan, C. Urban Flood Loss Assessment and Index Insurance Compensation Estimation by Integrating Remote Sensing and Rainfall Multi-Source Data: A Case Study of the 2021 Henan Rainstorm. Sustainability 2023, 15, 11639. [Google Scholar] [CrossRef]
  44. Shao, J. A Simple Assessment of Flood Risk from Insurance Perspective: Based on Historical Data in Japan. Doctoral Dissertation, Waseda University, Shinjuku, Japan, 2020; pp. 61–78. [Google Scholar]
  45. Yan, F.; Fan, J.H.; Sun, J.Y.; Qi, X.H.; Leng, J.X.; Qin, X.B. Disaster-causing Factor and Threshold Analysis of Urban Heavy Rain Based on Insurance Claims: A Case of Four Districts in Shijiazhuang City. Chin. J. Agrometeorol. 2025, 46, 112–121. [Google Scholar] [CrossRef]
  46. Tamaki, Y.; Sayama, T.; Sugawara, Y. Empirical flood depth damage functions based on insurance data from multiple flood events in Japan. Hydrol. Res. Lett. 2025, 19, 15–21. [Google Scholar] [CrossRef]
  47. He, L.; Yin, Y.; Cai, J.; Wu, L.; Tang, Y.; He, R.; Qu, Z.; Liu, Y.; Pei, P.; Wang, Q. Flood inundation amplified by large-scale ground subsidence funnel under the ongoing global climate change. Commun. Earth Environ. 2025, 6, 718. [Google Scholar] [CrossRef]
  48. Thapa, A.; Horanont, T.; Neupane, B. Parcel-Level Flood and Drought Detection for Insurance Using Sentinel-2A, Sentinel-1 SAR GRD and Mobile Images. Remote Sens. 2022, 14, 6095. [Google Scholar] [CrossRef]
  49. Garcia-Ayllon, S.; Radke, J. Geostatistical Analysis of the Spatial Correlation between Territorial Anthropization and Flooding Vulnerability: Application to the DANA Phenomenon in a Mediterranean Watershed. Appl. Sci. 2021, 11, 809. [Google Scholar] [CrossRef]
  50. Gao, B. Non-stationary Fitting of Extreme Precipitation in the Upper Reaches of the Yangtze River and Analysis of Its Disaster Causing Effects. Water Res. Hydropower Eng. 2025, 56, 1–14. [Google Scholar] [CrossRef]
  51. Gallagher Re; JBA Risk Management. Improving Climate Resilience with Parametric Insurance: How Index-Based Products Can Help Governments and Policyholders Tackle Increased Flood Risk; White Paper; Gallagher Re: London, UK; JBA Risk Management: Skipton, UK, 2023; Available online: https://www.ajg.com/gallagherre/news-and-insights/improving-climate-resilience-with-parametric-insurance/ (accessed on 21 May 2026).
  52. Negi, D.S.; Ramaswami, B. Basis risk and the demand for catastrophic rainfall insurance. Q Open 2024, 4, qoae009. [Google Scholar] [CrossRef]
  53. Miki, Y.; Chua, C.T.; Suppasri, A.; Cheng, A.C.; Iwasaki, T.; Shinozuka, Y.; Ogawa, T.; Imamura, F. A proposed approach towards minimizing basis risk in tsunami parametric insurance scheme. npj Nat. Hazards 2025, 2, 67. [Google Scholar] [CrossRef]
  54. Estefania-Salazar, E.; Carter, M.; Iglesias, E.; Escribano, Á. Breaking Boundaries: Lower Tail Dependence Can Triple the Economic Value of Index Insurance for Rural Households; NBER Working Paper; National Bureau of Economic Research: Cambridge, MA, USA, 2024; p. 32618. [Google Scholar] [CrossRef]
  55. Pleterski, N. Parametric Insurance for Sustainable Disaster Risk Finance: Legal, Data, and Governance Pathways in Slovenia and Croatia. Sustainability 2025, 17, 9643. [Google Scholar] [CrossRef]
  56. Xue, Y.; Xia, J.; Liu, Y.; Zou, L. Economic impacts of floods in China and adaptation strategies under climate change. Environ. Res. Lett. 2025, 20, 014073. [Google Scholar] [CrossRef]
  57. Guo, H.; Huang, C.; Zhang, C.; Shao, Q. A novel comprehensive system for analyzing and evaluating storm surge disaster chains based on complex networks. Front. Mar. Sci. 2024, 11, 1510791. [Google Scholar] [CrossRef]
  58. Gao, Y.Q.; Wang, Z.R.; Wang, H.; Liu, Y. Flood risk assessment of Nanjing City based on spatial information grid. Adv. Sci. Technol. Water Resour. 2024, 44, 6–12. [Google Scholar] [CrossRef]
  59. Shu, X.Y.; Xu, Z.X.; Ye, C.L.; Liao, R.T.; Huang, Y.X.; Wang, J.J.; Jia, S.H. Dynamic risk of urban flooding/waterlogging with attention to spatial heterogeneity of the underlying surface. J. Beijing Norm. Univ. Nat. Sci. 2024, 60, 375–385. [Google Scholar] [CrossRef]
Figure 1. Logical framework and conceptual structure of the literature review on index-based flood insurance.
Water 18 01274 g001
Figure 2. Operating mechanism of traditional indemnity insurance.
Water 18 01274 g002
Figure 3. Operating mechanism of index-based flood insurance.
Water 18 01274 g003
Figure 4. Structure of systemic risk in flood catastrophe.
Water 18 01274 g004
Figure 5. Types of basis risk in index-based flood insurance: (a) actual loss incurred without triggering an insurance payout (no payout despite loss); (b) insurance payout triggered without actual economic loss (false payout). The red dashed line represents the trigger threshold, and the blue columns denote the status of actual losses.
Water 18 01274 g005
Table 2. Comparison of precipitation-based trigger index categories for index-based flood insurance.
Index CategoryPhysical RepresentationLoss RelevanceTypical ApplicationReferences
Cumulative Precipitation IndexTotal rainfall amountAgricultural rainfall index trigger-based rainfall indexAgricultural insurance, regional flood insurance[19,23,27]
Extreme Precipitation IndexRainfall intensityExtreme rainfall event identification index, urban storm rainfall indexUrban flood insurance, flash flood insurance[18,39]
Extreme Value Statistical Precipitation IndexExtreme precipitation probabilityExtreme value distribution, Copula-based rainfall indexCatastrophe flood insurance, reinsurance pricing[30,42]
Standardized Precipitation IndexPrecipitation anomalySPI, SPEI climate indicesAgricultural drought insurance, climate index insurance[15]
Rainfall–Loss/Probability-Based IndexLoss probabilityMachine learning-based index, potential loss indexFlood catastrophe insurance, loss prediction insurance[16,17,29,43]
Note: The classification is based on the physical meaning of the trigger variable and its degree of correspondence with actual flood losses. The categories are organized from direct hazard indicators to coupled hazard–loss indicators.
Table 3. Comparison of payout schemes for precipitation-based index-based flood insurance.
Payout Function TypeThreshold Determination MethodAdvantagesLimitationsReferences
Fixed payoutBased on disaster characteristics or industry standardsSimple product structure; fast claim settlementLow consistency with actual losses; high basis risk[19,23,27]
Linear/Regression payoutBased on quantiles or index–loss regression relationshipsStrong correlation between payouts and disaster lossesDifficulty in capturing nonlinear loss relationships[16,28,29]
Piecewise payoutDetermined using extreme value thresholds, historical quantiles, or loss-based relationshipsFlexible payout structure; widest range of applicationsThreshold selection retains some subjectivity[13,21,41]
Probabilistic/Loss-model-based payoutOptimized using receiver operating characteristic (ROC), extremal dependence index (EDI), area under the curve (AUC) and related methodsReduce basis riskHigh requirements for data quality and model performance[17,29,43]
Note: The payout schemes are classified according to the functional relationship between trigger index values and compensation amounts, ranging from simple threshold-based payout to model-driven probabilistic payout.
Table 4. Comparison of water-level-based trigger index construction methods.
Index CategoryPhysical RepresentationLoss RelevanceReferences
Hydrological station water levelBased on standardized station water level observationsProbabilistic threshold triggering[28,29,44]
Remote sensing/model-based water levelBased on remote sensing data and hydrodynamic/hydrological modelsStatistical threshold triggering[31,48,49,50]
Water level–loss functionWater level–loss rate functional modelLoss-function-based payout[20,43,46]
Multi-source data & machine learningIntegration of multi-source data and machine learning methodsData-driven triggering[17,19,27,30]
Integrated risk & index triggeringComposite risk index trigger modelsTiered payout or parameter threshold triggering[23,24,25]
Note: The classification is based on the source of water level data and the methodological complexity of index construction.
Table 5. Comparison of inundation-area-based trigger index categories.
Index CategoryPhysical RepresentationTypical ApplicationReferences
Absolute inundation area indexFlood inundation area or spatial extentRegional, national scale[40,49]
Inundation area ratio indexRatio of inundated area to total study areaNational, watershed scale[43]
Inundation area probability indexBased on probability distribution of inundation area ratioNational, watershed scale[42,47]
Inundation area–exposure indexCoupling inundation area with population and asset exposureUrban scale[38,43]
Inundation area–loss indexConversion of inundation area into economic loss indexUrban scale[16,20,43]
Inundation area risk indexIntegrated measure of hazard, vulnerability, and exposure combined with inundation areaRegional, watershed scale[29,37,49]
Note: The classification is based on the spatial representation of inundation extent and the degree of integration with exposure and loss information.
Table 6. Comparison of payout schemes for inundation-area-based index-based flood insurance.
Payout Function TypeThreshold Determination MethodAdvantagesLimitationsReferences
Fixed payoutExceedance probability or return-period thresholdSimple structure; suitable for rapid payoutLow consistency with actual losses; high basis risk[12,13,51]
Loss-function-based payoutProbability distribution fitting-based thresholdEstablishes relationship between inundation area and lossesHigh model uncertainty[16,43,47]
Tiered payoutMulti-threshold classificationFlexible payouts adaptable to different hazard intensitiesComplex parameter setting; relies on expert judgment[21,23,30]
Claim-linked payoutThreshold based on claim counts or damage severity levelsDirectly links index with actual insurance claim processesHigh data and model requirements[16,18,43,45]
Risk-level/index-triggered payoutThreshold determined by risk index classificationIntegrates multi-source dataResearch still under development[22,27,29]
Note: The payout schemes are categorized according to the relationship between inundation extent indicators and compensation calculation methods.
Table 7. Classification of basis risk sources and corresponding mitigation strategies.
Index CategoryData AvailabilitySpatial RepresentativenessTemporal ResponsivenessBasis Risk LevelSuitable Flood TypesSuitable Insurance ScaleModel DependenceCorrelation with Losses
PrecipitationHighMediumHighHighFlash flood/pluvialRegionalLowLow–Medium
Water levelMediumMediumMediumMediumRiver floodPoint/parcelMediumMedium–High
Inundation areaMediumHighLow–MediumLowUrban/regional floodCity/regionHighHigh
Note: The classification is based on the primary source of basis risk and the corresponding technical mitigation approach proposed in previous studies.
Table 8. Comparison of representative basis risk mitigation methods.
Basis Risk SourcesMitigation MethodsAdvantagesLimitationsReferences
Insufficient spatial representativeness of rainfall data; uniform thresholds across regionsRemote sensing-based inundation area extraction; multi-source rainfall data fusion; tiered payout structuresSignificantly improves the consistency between payouts and actual losses; suitable for urban areasDependence on remote sensing data; limited regional applicability[18,40,43]
Data scarcity; difficulty in identifying extreme events; mismatch between index and flood generation mechanismsMulti-source satellite data; runoff indices; machine learning modeling; threshold optimizationImproves extreme event detection accuracy and reduces false triggeringWeak model interpretability; high data requirements[17,30]
Uniform thresholds ignoring heterogeneity; poor spatial representativeness of single indicesTail Value at Risk (TVaR)-based basis risk quantification; Bayesian threshold optimization; dual-index triggeringSignificantly reduces both positive and negative basis riskComputationally complex; relies on scenario simulations[21,25,53,54]
Note: The mitigation strategies are categorized according to the perspective of intervention, including contract design, model optimization, and spatial risk zoning.
Table 9. Comparison of representative basis risk reduction strategies.
Basis Risk SourcesMitigation MethodsAdvantagesLimitationsReferences
Measurement errors in index data; fixed trigger levels ignoring heterogeneity among policyholders; regional systemic riskMulti-source data monitoring; policyholder-selected trigger thresholds and coverage levelsReduces basis risk from a contract design perspective by allowing flexible trigger selectionRequires a relatively high level of financial literacy among policyholders[19,28,29,55]
Inability of linear models to capture extreme risks; insufficiency of single indices; spatial mismatch; threshold instability under climate changeMulti-source climate index construction; ANN-based threshold prediction; Copula-based tail dependence modeling; dynamic quantile thresholdsSignificantly improves hedging effectiveness and reduces premiums, mitigating basis risk from a modeling perspectiveModel complexity; high requirements for data quality and computational resources[17,21,30,54]
High intra-regional heterogeneity caused by administrative zoning; inability of linear correlation to capture tail riskLower tail dependence (LTD) coefficients; Copula-based estimation; spatial clustering for insurance zoning optimizationEnhances insurance economic value through optimized regional delineation, reducing basis risk from a spatial perspectiveComputationally intensive; highly dependent on high-resolution remote sensing data[29,53,54]
Disclaimer/Publisher’s Note: The statements, opinions and data contained in all publications are solely those of the individual author(s) and contributor(s) and not of MDPI and/or the editor(s). MDPI and/or the editor(s) disclaim responsibility for any injury to people or property resulting from any ideas, methods, instructions or products referred to in the content.