Article

Valorization of Mixed Household Organic Waste into a High-Surface-Area Porous Carbon Adsorbent for Efficient Phenol Removal from Aqueous Solutions


by
Radmila Lišanin
1,
Jelena Gulicovski
1,
Marija Stojmenović
1,
Sonja Milićević
2,
Vladimir Dodevski
1,
Tamara Minović-Arsić
1 and
Milan Kragović
1,*
1
“Vinča” Institute of Nuclear Sciences, National Institute of the Republic of Serbia, University of Belgrade, 11351 Belgrade, Serbia
2
Institute for Technology of Nuclear and Other Mineral Raw Materials, Franše d’Eperea 86, 11000 Belgrade, Serbia
*
Author to whom correspondence should be addressed.
Water 2026, 18(11), 1267; https://doi.org/10.3390/w18111267
Submission received: 26 March 2026 / Revised: 28 April 2026 / Accepted: 21 May 2026 / Published: 23 May 2026

Abstract

In this study, phenol adsorption from aqueous solutions was investigated using a carbonized adsorbent derived from a 1:1:1 mixture of banana, carrot, and potato peels, representing a major fraction of municipal bio-waste in Serbia. The material (CARB_BCP) was characterized by pHpzc, SEM, FTIR, and BET analyses. The results indicated a highly porous structure with developed micro- and mesoporosity and a high specific surface area (SBET = 483 m2/g). FTIR confirmed the formation of a stable aromatic carbon structure, while the high pHpzc value (10.55) suggested a limited role of electrostatic interactions. Adsorption experiments performed at an initial phenol concentration of 1858 mg/L, room temperature, and an adsorbent dose of 0.1 g achieved a removal efficiency of 20.5%. The Langmuir model provided the best fit, indicating monolayer adsorption, with good agreement between theoretical (≈187 mg/g) and experimental (≈190 mg/g) capacities. Kinetic analysis followed the pseudo-second-order model, suggesting chemisorption as the rate-controlling step. The adsorption mechanism was mainly governed by π–π interactions, hydrophobic effects, and hydrogen bonding. These results demonstrate that CARB_BCP, derived from biodegradable waste, is a promising low-cost adsorbent for wastewater treatment.

1. Introduction

A key environmental challenge of modern society is the contamination of ground and surface water with organic compounds. Among them, phenol and its derivatives stand out as a priority due to their high toxicity, chemical stability and ability to bioaccumulate in organisms and sediments. Elevated concentrations of phenols are often present in wastewater from the petrochemical, pharmaceutical, textile, food and chemical industries. Due to their high-water solubility, phenols easily migrate through the environment, which requires effective removal methods before their release into the natural environment [1]. The toxic effects of phenols can occur even at low concentrations, affecting the central nervous system, liver, kidneys and cardiovascular system in humans, as well as physiological processes in active organisms [2]. Phenol is harmful to living organisms in aquatic environments already at about 0.007–0.009 mg/dm3, and for humans, the safe level in drinking water is much lower, around 0.001–0.002 mg/dm3 [3]. Therefore, phenols are included in the list of priority pollutants according to USEPA (2015) [4], while their derivatives, such as nonylphenol and pentachlorophenol, are defined as priority substances under EU Directive 2008/105/EC and 2013/39/EU [5,6]. Because of its toxicity and harmful effects, removing phenol from contaminated water is very important, and developing materials and techniques that can remove it efficiently is therefore a very important challenge today. Conventional methods for the removal of phenols, such as chemical oxidation, coagulation, membrane technologies and biological treatments, are often limited by high costs, secondary sludge generation, or low efficiency at high phenol concentrations [1,7]. In contrast, adsorption stands out as a simple, efficient, and economically viable method for the removal of phenol and similar organic pollutants [8]. Traditional commercial activated carbon (AC) exhibits high phenol adsorption capacity, often in the range of 170–213 mg/g [9,10]. However, its application is limited by high prices, transportation costs, and lack of local availability, which favors the use of locally available adsorbents of various types and nature, and thus, for that purpose, the low-cost adsorbents of biological origin, obtained from waste lignocellulosic materials, are getting more and more attention [7,11].
In the past ten years, biowaste-based adsorbents like fruit and vegetable peels have gained attention as alternatives to traditional activated carbons [11,12]. Such materials are rich in cellulose, hemicellulose, lignin and pectin, which make them suitable for carbonization and the production of biochar with a developed porous structure and active functional groups [11,12]. These functional groups (–OH, –COOH) allow interaction with phenol molecules through π–π bonding, hydrogen bonding and dipole–dipole interactions [8,12]. Some studies have shown that biochar from banana peels, coffee, pomegranate and other organic waste can reach adsorption capacities of 50 to 200 mg/g, depending on pH, carbonization temperature and surface chemistry [1,11]. According to Hairuddin et al. (2019), magnetic biochar derived from palm kernel shells exhibits a phenol adsorption capacity of around 10.8 mg/g, confirming its potential for wastewater treatment applications [13]. Biochars obtained by pyrolysis of pistachio shell, pecan and wood waste and then modified with KOH show a significant increase in porosity, surface area and number of active sites, leading to improved phenol adsorption efficiency compared to unmodified carbon [12]. Several studies have shown that rice husk–derived adsorbents can remove between 35% and 65% of phenol from aqueous solutions, depending on the pretreatment and pyrolysis conditions [14]. In another study, KOH-activated rice straw biochars showed extremely high adsorption capacity, with good Langmuir isotherms and pseudo-second-order kinetics, and π–π interactions identified as the adsorption mechanisms [15]. To improve the properties of bio-adsorbents, orange peels were pyrolyzed at high temperatures (up to 700 °C) and showed a capacity of up to 31 mg/g of phenol, good thermal stability, and the possibility of reuse [16]. Recently, KOH-pretreated biochar from orange peel has been developed by pyrolysis at a relatively low temperature (400 °C), which improved morphology, porosity and functional groups, which significantly increases the adsorption activity [16]. All these studies show that agro-waste biomass, with reasonable and relatively simple physical and chemical treatments (such as pyrolysis, KOH modification and magnetization), can be a sustainable, affordable and highly effective alternative to expensive commercial adsorbents for the removal of phenols from wastewater.
In recent years, adsorbents derived from agro-waste, especially banana peels, potatoes and various plant residues, have been intensively investigated due to their availability, low cost and potential for application in wastewater treatment. Studies show that by carbonization and activation of these materials, a porous carbon adsorbent with a pronounced capacity for the removal of phenols and similar aromatic pollutants can be obtained. For example, in a study on activated carbon derived from banana peels, it was shown that such materials can achieve significant phenol adsorption efficiency, emphasizing that the performance is directly conditioned by the degree of activation and the developed specific surface area [11]. Similar results were shown in recent studies where banana peel biochar showed good adsorption capacity for organic pollutants, but with a limitation in specific surface area and capacity compared to highly activated carbons [17]. Also, in other lignocellulosic biomasses, KOH activation has been shown to significantly increase the porosity and adsorption capacity for phenol, as shown in studies with orange peel [16].
Given the growing amounts of biowaste and the need for sustainable wastewater treatment, the concept of a circular economy is becoming increasingly important. In Serbia, biowaste accounts for about 44% of total municipal waste generated, while in the EU this percentage is about 34% [18,19]. In developed European countries, the biowaste management system is based on its valorization through composting, digestion, and the production of biochemicals [20]. Despite this, in Serbia, most biowaste still ends up in landfills, leading to greenhouse gas emissions and groundwater pollution [21]. Using biowaste as raw material to create functional adsorbents can be one of the ways that helps reduce waste and at the same time improve water quality, which follows the ideas of the circular economy [22]. The valorization of biowaste through thermal conversion represents an innovative approach to obtaining highly efficient adsorbents [11]. A mixture of different biowastes can provide a heterogeneous structure and an optimal ratio of functional groups, which potentially improves the adsorption properties compared to individual raw materials. However, the potential of such combined lignocellulosic materials is still underexplored.
Despite extensive research on individual biochars obtained from agro-waste, as well as certain binary systems based on a mixture of biomasses, the use of a ternary system including banana, carrot and potato peels in a 1:1:1 ratio as a precursor to obtain porous carbon adsorbents for phenol removal has not been investigated so far. This study, therefore, introduces a new concept of adsorbent design based on the combination of three widely available types of household biowaste, which allows obtaining a highly porous carbonaceous material with improved surface properties and significant adsorption performance. In this way, the combination of different types of biowaste will lead to the creation of materials with improved structural and adsorption properties, what open a new perspective in the development of sustainable adsorbents for water purification. Particular attention in this paper was given to assessing the influence of various experimental conditions on phenol removal efficiency, as well as to the characterization of the synthesized material using different instrumental techniques.

2. Materials and Methods

2.1. Chemicals

The following chemicals were used for the experiments: phenol (Phenol, C6H5OH ≥ 99%, VWR International, Leuven, Belgium), which was used without further purification, and distilled water for the preparation of all solutions. Potassium hydroxide (KOH, Lachner, Brno, Czech Republic) was used for pH adjustment and modification of the adsorbent. Potassium nitrate (KNO3) and nitric acid (HNO3) (Lachner, Brno, Czech Republic) were also used in the experiments. All chemicals were used in their analytical grade, and the solutions were prepared immediately before use.

2.2. Materials

Biowaste fruit and vegetable peels were used for the preparation of the adsorbent. Specifically, potato peels (Solanum tuberosum), carrot peels (Daucus carota) and banana peels (Musa sp.) (Figure 1) were used. All raw materials were obtained as waste from the fruit and vegetables purchased at a local market, thoroughly washed with distilled water to remove impurities and dried at a temperature of 105 °C. After drying, the materials were crushed and sieved so that the particle size was less than 100 μm, which ensured sample homogeneity and uniform thermal treatment.

2.3. Synthesis of Materials

Carbonization was carried out in a tube furnace under a nitrogen atmosphere to develop a porous structure and functional groups suitable for phenol adsorption. The effect of different treatment temperatures on the adsorption precursors was investigated, using temperatures of 600 °C, 700 °C, 800 °C and 900 °C, with a single operating time and a heating rate of 6 °C/min and a holding time of 1 h at each temperature. The chosen range of 600–900 °C represents a compromise between efficient carbonization and preservation of the optimal textural and chemical structure of the material. At lower temperatures (~600 °C), the decomposition of the lignocellulosic structure and the formation of initial porosity begin, while an increase in temperature contributes to the removal of volatile components, the aromatization of the carbon network and the development of micro- and mesopores, which leads to an increase in the specific surface area and the number of active sites. However, excessive temperature increase can lead to structural shrinkage and densification, partial collapse of pores and loss of surface functional groups, which negatively affects the adsorption performance. Therefore, this temperature range was chosen as optimal for achieving a balanced structure with a high adsorption capacity. Thus, the carbonization process was performed in a flow of N2 atmosphere (500 cm3/min). Experimental data showed that the sample carbonized at 800 °C had the highest affinity for phenol. The carbonization yields at 800 °C were carrot peel 21.64%, banana peel 27.7%, and potato peel 21.04%. To prepare the composite adsorbent, carbonized potato, carrot and banana peels were mixed in a mass ratio of 1:1:1. The sample was labeled CARB_BCP and used for adsorption experiments.

2.4. Methods

2.4.1. Point of Zero Charge (pHpzc)

In this study, the point of zero charge (pHpzc) of the CARB_BCP was determined by using the following procedure: 0.1 g of the adsorbent was added to 50 cm3 of KNO3 solutions of different concentrations (0.1 mol/dm3, 0.01 mol/dm3, and 0.001 mol/dm3), while the initial pH was adjusted in the range of 2–12 with 0.1 mol/dm3 KOH or HNO3. The prepared suspensions were sealed and shaken for 24 h at 250 rpm at room temperature, after which the final pH values were measured using a pH meter. The difference between the final and initial pH values (ΔpH) was calculated, and pHpzc was determined from the curve of the pHf = f(pHi), i.e., from the point where ΔpH tends to zero and the experimental curve intersects the linear curve pHf = pHi.

2.4.2. Field Emission Scanning Electron Microscopy (FESEM)

Field emission scanning electron microscopy (FESEM) was employed to characterize the surface morphology of the adsorbent. The analyses were performed using a TESCAN Mira3 XMU microscope operated at 20 kV (TESCAN ORSAY HOLDING, a.s., Brno, Czech Republic). Prior to imaging, the samples were sputter-coated with a thin layer of Au/Pd alloy using a Polaron SC503 Fision sputter coater (Quorum Technologies Ltd., Lewes, UK).

2.4.3. Fourier-Transform Infrared Spectroscopy (FTIR)

Fourier-transform infrared spectroscopy (FTIR) was employed to analyze carbonized samples derived from peels of carrots, potatoes, and bananas. The measurements were carried out using a Thermo Scientific Nicolet iS50 spectrometer (Thermo Fisher Scientific, Madison, WI, USA). Spectra were recorded in transmission mode over the range of 4000–450 cm−1, with a resolution of 2 cm−1 and 64 scans per sample. After acquisition, automatic baseline correction and atmospheric suppression were applied to refine the recorded spectra.

2.4.4. BET Surface Area Analysis

The specific surface area of the material was determined using the gravimetric McBain method. Nitrogen adsorption–desorption isotherms were recorded at −196 °C, and from these isotherms we calculated the BET surface area (SBET), pore size distribution, mesopore surface area (Smeso), external surface area, and micropore volume (Vmic). The pore size distribution (PSD) was obtained from the desorption branch by applying the Barrett–Joyner–Halenda (BJH) method [23]. High-resolution αs plots [24,25,26] were employed to estimate both the mesopore surface area and the micropore volume. The contribution of microporosity to the total surface area (Smic) was evaluated by subtracting Smeso from SBET.

2.5. Adsorption Experiments

2.5.1. Testing of the Efficiency of the Individual Adsorbents

Each material carbonized at 800 °C (peels of carrots (CP), potatoes (PP), and bananas (BP)) was tested as an individual adsorbent. Also, mixtures of the carbonized materials were made for different ratios (where one component was 50%, and the other two were 25% each (Carb_1–3), and three carbonized materials were in CP:PP:BP = 1:1:1 ratio (Carb_BCP)). Additionally, a composite sample of all raw materials was made in a mass ratio of 1:1:1, and thus carbonized under the same conditions (Carb_RBCP) and tested for phenol adsorption. All tests were performed in triplicate and under the following experimental conditions: 0.1 of the adsorbents were mixed with 50 cm3 phenol solution with an initial concentration of 50 mg/dm3 and shaken on an orbital shaker at 250 rpm for 24 h without setting the initial pH. After the end of the contact time, the suspensions were passed through filter paper, and then the concentration of phenol in the supernatant was measured by UV–VIS spectrophotometry on Shimadzu UV-1900 (Shimadzu, Kyoto, Japan) at a wavelength of 270 nm, according to the literature [27]. As the results revealed no significant differences in phenol removal among the tested materials, a representative sample was prepared for subsequent experiments by combining the three carbonized peels in a 1:1:1 ratio (CARB_BCP). Also, because of the turbidity of the solution, it was not possible to perform experiments on the initial raw samples.

2.5.2. Influence of Initial pH

The study of the effect of initial pH on the adsorption of phenol was carried out in triplicate and by using a batch method. For each experimental sample, the phenolic solution was prepared in a volume of 50 cm3 with an initial concentration of 21 mg/dm3, while the mass of the adsorbent was 0.1 g. The solutions were treated at room temperature (approximately 25 °C), with continuous mixing on a rotary shaker at a speed of 250 rpm. The pH value of each solution was adjusted before the addition of the adsorbent using 0.1 mol/dm3 HNO3 or 0.1 mol/dm3 KOH solutions, depending on the desired pH range. During the experiment, solutions with initial pH values ranging from extremely acidic to basic conditions (2–12) were tested, and after the treatment, the final pH values of each sample were measured. After the end of the contact time, the suspensions were passed through filter paper, and then the concentration of phenol in the supernatant was measured by UV–VIS spectrophotometry.

2.5.3. Influence of Initial Phenol Concentration

The influence of the initial phenol concentration on the efficiency of the CARB_BCP was examined in triplicate using a batch method. A stock solution of phenol was prepared by dissolving the appropriate mass of phenol in distilled water. Based on this stock solution, working solutions were prepared with concentrations of 5–1850 mg/dm3. For each concentration, 50 cm3 of the solution was transferred to individual Erlenmeyer flasks, after which 0.1 g of adsorbent was added. The flasks were closed and placed on an orbital shaker at 250 rpm at room temperature for 24 h to establish equilibrium between the solution and the adsorbent. After the end of the contact time, the suspensions were passed through filter paper, and then the concentration of phenol in the supernatant was measured by UV–VIS spectrophotometry.
Adsorption data were analyzed using three commonly used isotherm models: Langmuir, Freundlich and Temkin [28,29,30]. These models make it possible to describe the adsorption behavior and evaluate the capacity of the adsorbent.
The Langmuir model [28] describes adsorption on a homogeneous surface in a monolayer. The linearized form is given in Equation (1):
C e q e = 1 q m a x K L + C e q m a x
The equilibrium concentration of pollutant in the solution is denoted as Ce (mg/dm3), while qe (mg/g) is the amount of pollutant adsorbed per gram of adsorbent. The maximum adsorption capacity of the adsorbent is denoted by qmax (mg/g), while KL is the Langmuir adsorption constant expressed in dm3/mg, which reflects the affinity of the adsorbent towards the pollutant.
The Freundlich model is an empirical relation suitable for describing adsorption on heterogeneous surfaces, with a non-linear distribution of binding sites and their energy. The model allows for multilayer adsorption and is often used to interpret the behavior of natural and modified adsorbents with complex surface morphology, especially at lower adsorbate concentrations [29].
The linear form of the Freundlich model is given by Equation (2):
ln q e = ln K F + 1 n ln C e
where the equilibrium amount of pollutant adsorbed per unit mass of adsorbent is denoted as qe (mg/g), while Ce (mg/dm3) represents the equilibrium concentration of adsorbent in the solution. Model constant KF((mg/g)(dm3/mg))1/n reflects the adsorption capacity, while the parameter 1/n indicates the intensity and favorability of adsorption.
The Temkin model takes into account the interactions between the adsorbed molecules and the adsorbent, assuming that the heat of adsorption decreases linearly with increasing surface coverage. Unlike Langmuir’s model, which predicts a constant adsorption energy, and Freundlich’s, which is empirical, Temkin’s model offers a thermodynamic basis and enables a better interpretation of adsorption processes on heterogeneous surfaces with weak chemical interactions [30].
The linearized form of the Temkin isotherm is given by the following equation:
q e = B · l n A T + B · l n C e
where the equilibrium amount of pollutant adsorbed per unit mass of adsorbent is denoted as qe (mg/g), while Ce (mg/dm3) represents the equilibrium concentration of pollutant in the solution. Temkin’s equilibrium constant is denoted by AT (dm3/mg), while the parameter B = RT/bT is related to the heat of adsorption across parameter bT (J/mol). The R is the universal gas constant (8.314 J/mol·K), and T is the temperature in Kelvin.

3. Results and Discussion

3.1. Characterization

3.1.1. Determination of the Point of Zero Charge (pHpzc)

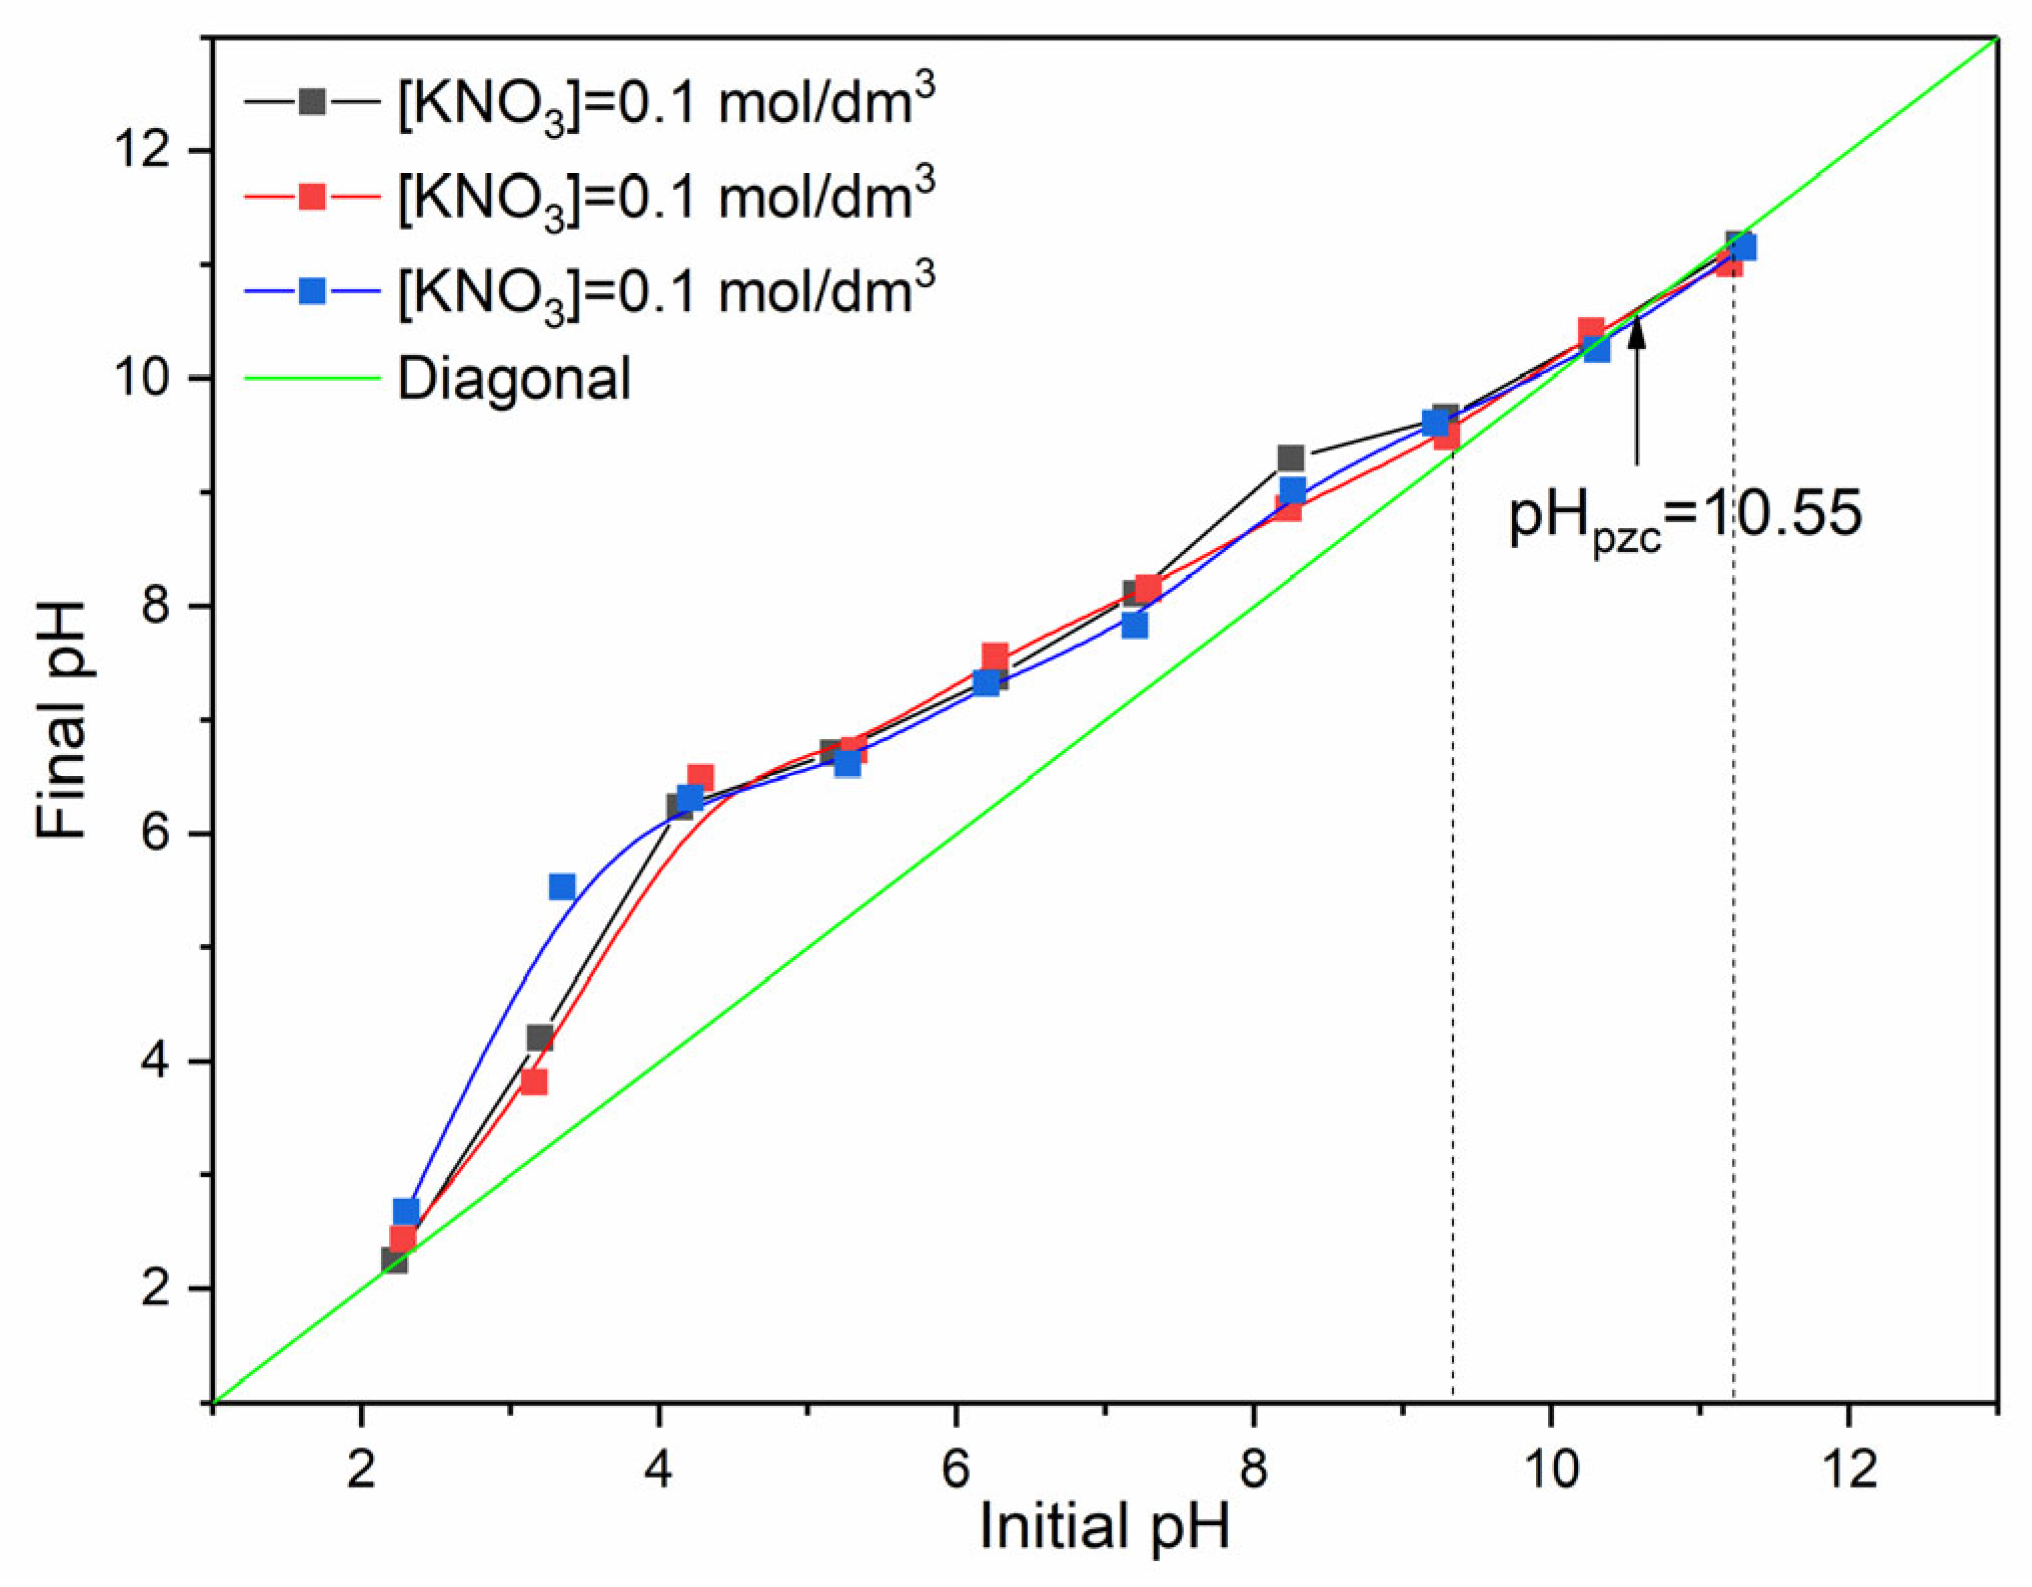
The point of zero charge (pHpzc) is the pH at which the material surface charge is equal to zero. At this point, the sum of positive and negative charges on the surface is equal, so the material does not show an acid or a base property [31]. Determination of the pHpzc is important because the behavior of a surface in relation to ions from a solution depends primarily on its charge, and in dependence on it, the surface will attract or repel ions in solution. At pH below the pHpzc, the surface is positively charged and attracts anions, while above it the surface is negatively charged and can adsorb cations. In bio-carbonized and other heterogeneous materials, surface charge mainly depends on the behavior of certain functional groups such as –OH, –COOH, –C=O, etc., as well as whether these groups are protonated or deprotonated [32]. The pHpzc can be determined from the diagram of the dependence of the final pH (pHf) on the initial pH (pHi). Because the solution was unstable, it was not possible to determine the point of zero charge of the starting raw material, so the properties of the raw and carbonized material could not be compared. For this reason, only the point of zero charge of the carbonized material was determined, and the results are shown in Figure 2.
As shown in Figure 2, the curves obtained at three ionic strengths of KNO3 (0.1, 0.01, and 0.001 mol/dm3) almost overlap, suggesting that ionic strength has only a minor effect on the measured pHpzc. However, it should be kept in mind that at higher ionic strength the diffuse double layer is compressed, reducing long-range electrostatic effects, so the measured value reflects mainly local acid–base chemistry. At lower ionic strength, the double layer is more extended, making surface heterogeneity more apparent and allowing earlier detection of charge neutralization [33].
It is clearly visible that, for all three ionic strengths, the final pH increases in all initial pH ranges, without forming a clear plateau. That means a very small buffer capacity of the investigated material, and that its surface influences the equilibrium pH in the whole pH range. However, it can be noted that the effect weakens as the system approaches the point of zero charge. The change in ΔpH = pHf − pHi from positive to negative occurs between pHi = 9.22 (ΔpH = +0.39) and pHi = 11.26 (ΔpH = −0.08). The pHpzc is the pH at which ΔpH equals zero, corresponding to the point on the diagram where the experimental curve intersects the linear interpolation. So, it can be seen that the pHpzc is equal to 10.55.
As shown in Figure 2, in the acidic region (pHi < 5), the final pH is much higher than the initial, which means strong protonation of the surface and uptake of H+ from solution, and consequently, ΔpH is positive, so the surface is positively charged. In the pHi 6–9, the increase is nearly linear but is still above the linear diagonal line pHf = pHi, meaning the surface still has a positive charge. At higher pH values (>9), the curve approaches the linear curve (ΔpH = 0) and then becomes negative. Thus, the surface charge shifts from positive, through neutral in a narrow region around the pHpzc, to negative.
The high pHpzc value (10.55) obtained for the material carbonized at 800 °C is expected since it is lignocellulosic materials treated at high temperatures. At 800 °C, most acidic surface groups are removed, and strong basic surface groups can be formed, which increases the pHpzc [32]. These carbonized biomasses also can contain higher amounts of alkaline minerals such as K, Ca, and Mg, and their oxides and carbonates formed during carbonization, which can make the surface more basic [31,32]. Similar increases in pH have been reported for other lignocellulosic materials carbonized at high temperatures, where values for the pHpzc between 9 and 11 are common [32].

3.1.2. Determination of the Surface Morphology

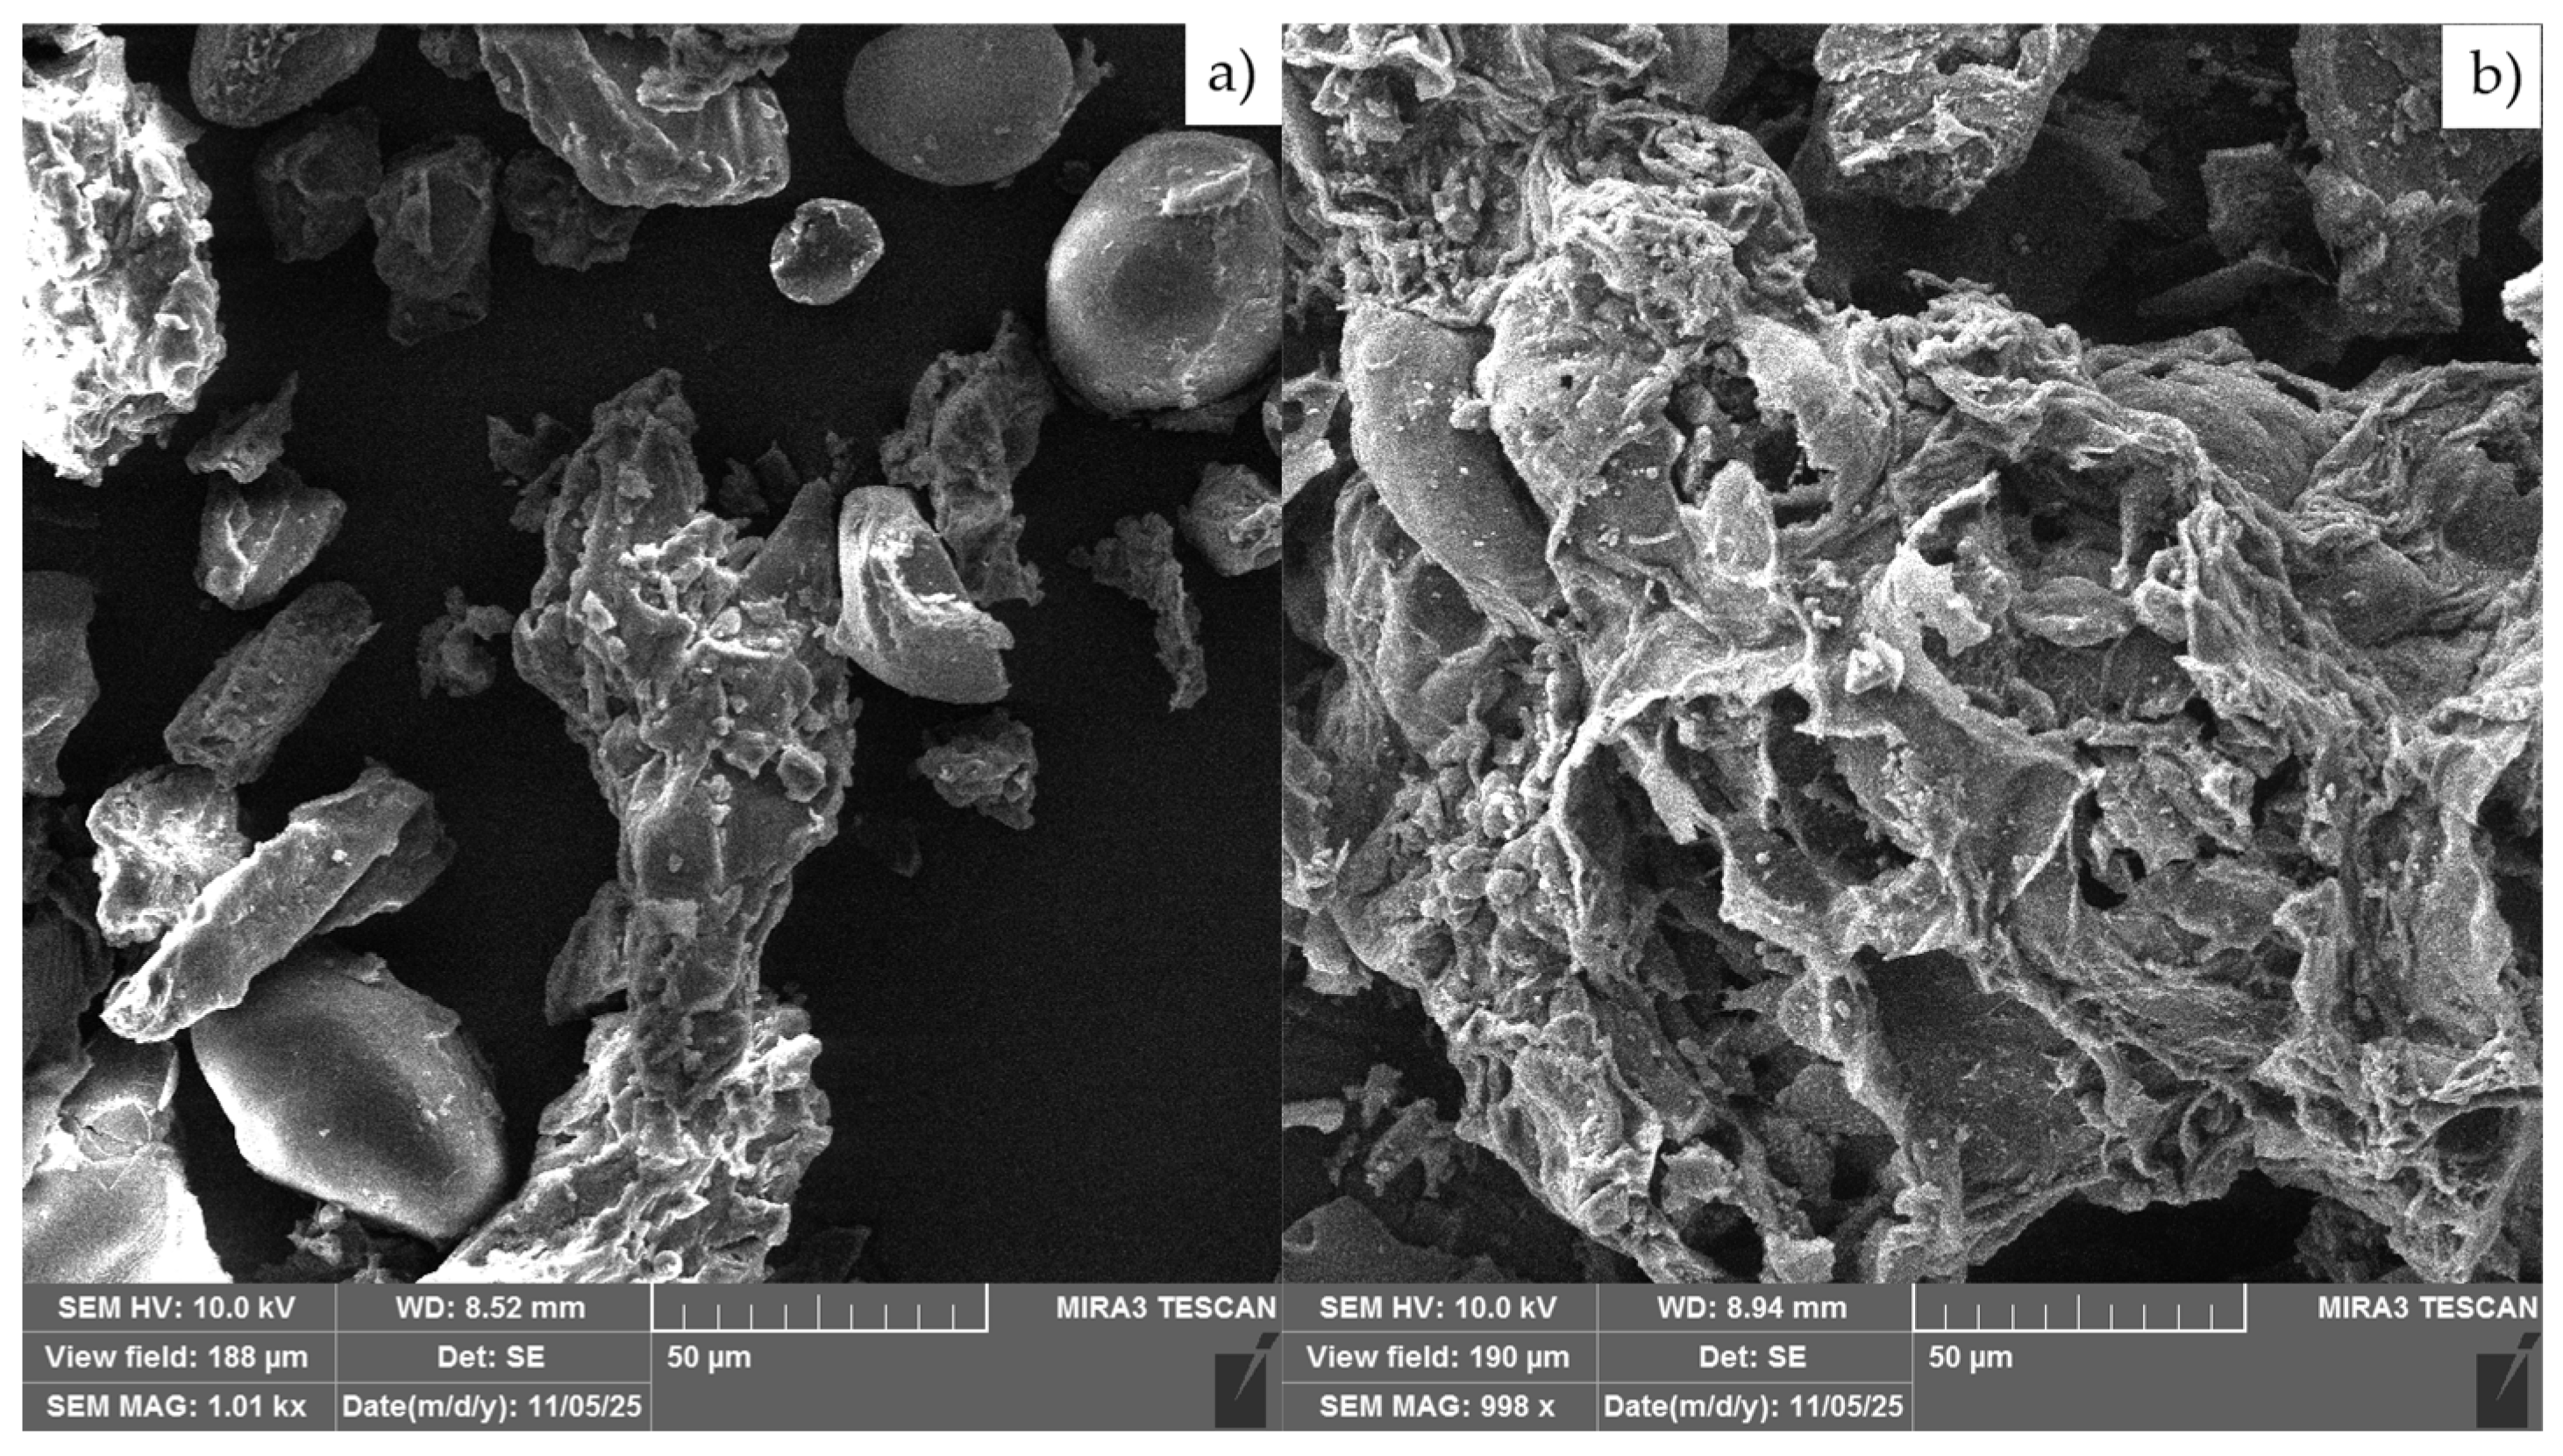
To examine the surface morphology of the sample obtained by mixing banana, carrot, and potato peels in a 1:1:1 ratio before (RAW_BCP) and after carbonization (CARB_BCP), scanning electron microscopy (SEM) was used, and the results are shown in Figure 3.
As shown in Figure 3a, the raw material possesses a heterogeneous structure made of irregularly shaped fragments, grains of different sizes, and larger fragments of plant tissue that may originate from cell walls, cuticle, and other components, which are typical for banana, carrot, and potato peels. Also, the surface of the RAW_BCP is compact, weakly porous, and without a well-developed microstructure. Due to such a structure, functional groups are mostly trapped within dense organic matrices and therefore are not available for interaction with ions and other functional groups from the solution [11,33].
From Figure 3b, it is evident that CARB_BCP exhibits markedly different morphological features compared to the raw sample. The SEM micrograph reveals a highly developed porous, fibrous, and rough texture, characterized by numerous cavities interconnected by channels. This contrasts with the raw sample, which indicates thermal degradation of organic matter during the carbonization process, accompanied by the release of thermolabile components. As a result, cell walls break down, forming a carbonaceous material with a significantly larger surface area [34,35]. Furthermore, the disruption of the compact structure and its transformation into a well-developed pore network enhances the accessibility of functional groups and residual oxides for protonation and deprotonation reactions, as well as for adsorption and interaction with various ions or pollutants in solution [31,32].

3.1.3. Fourier-Transform Infrared Spectroscopy (FTIR)

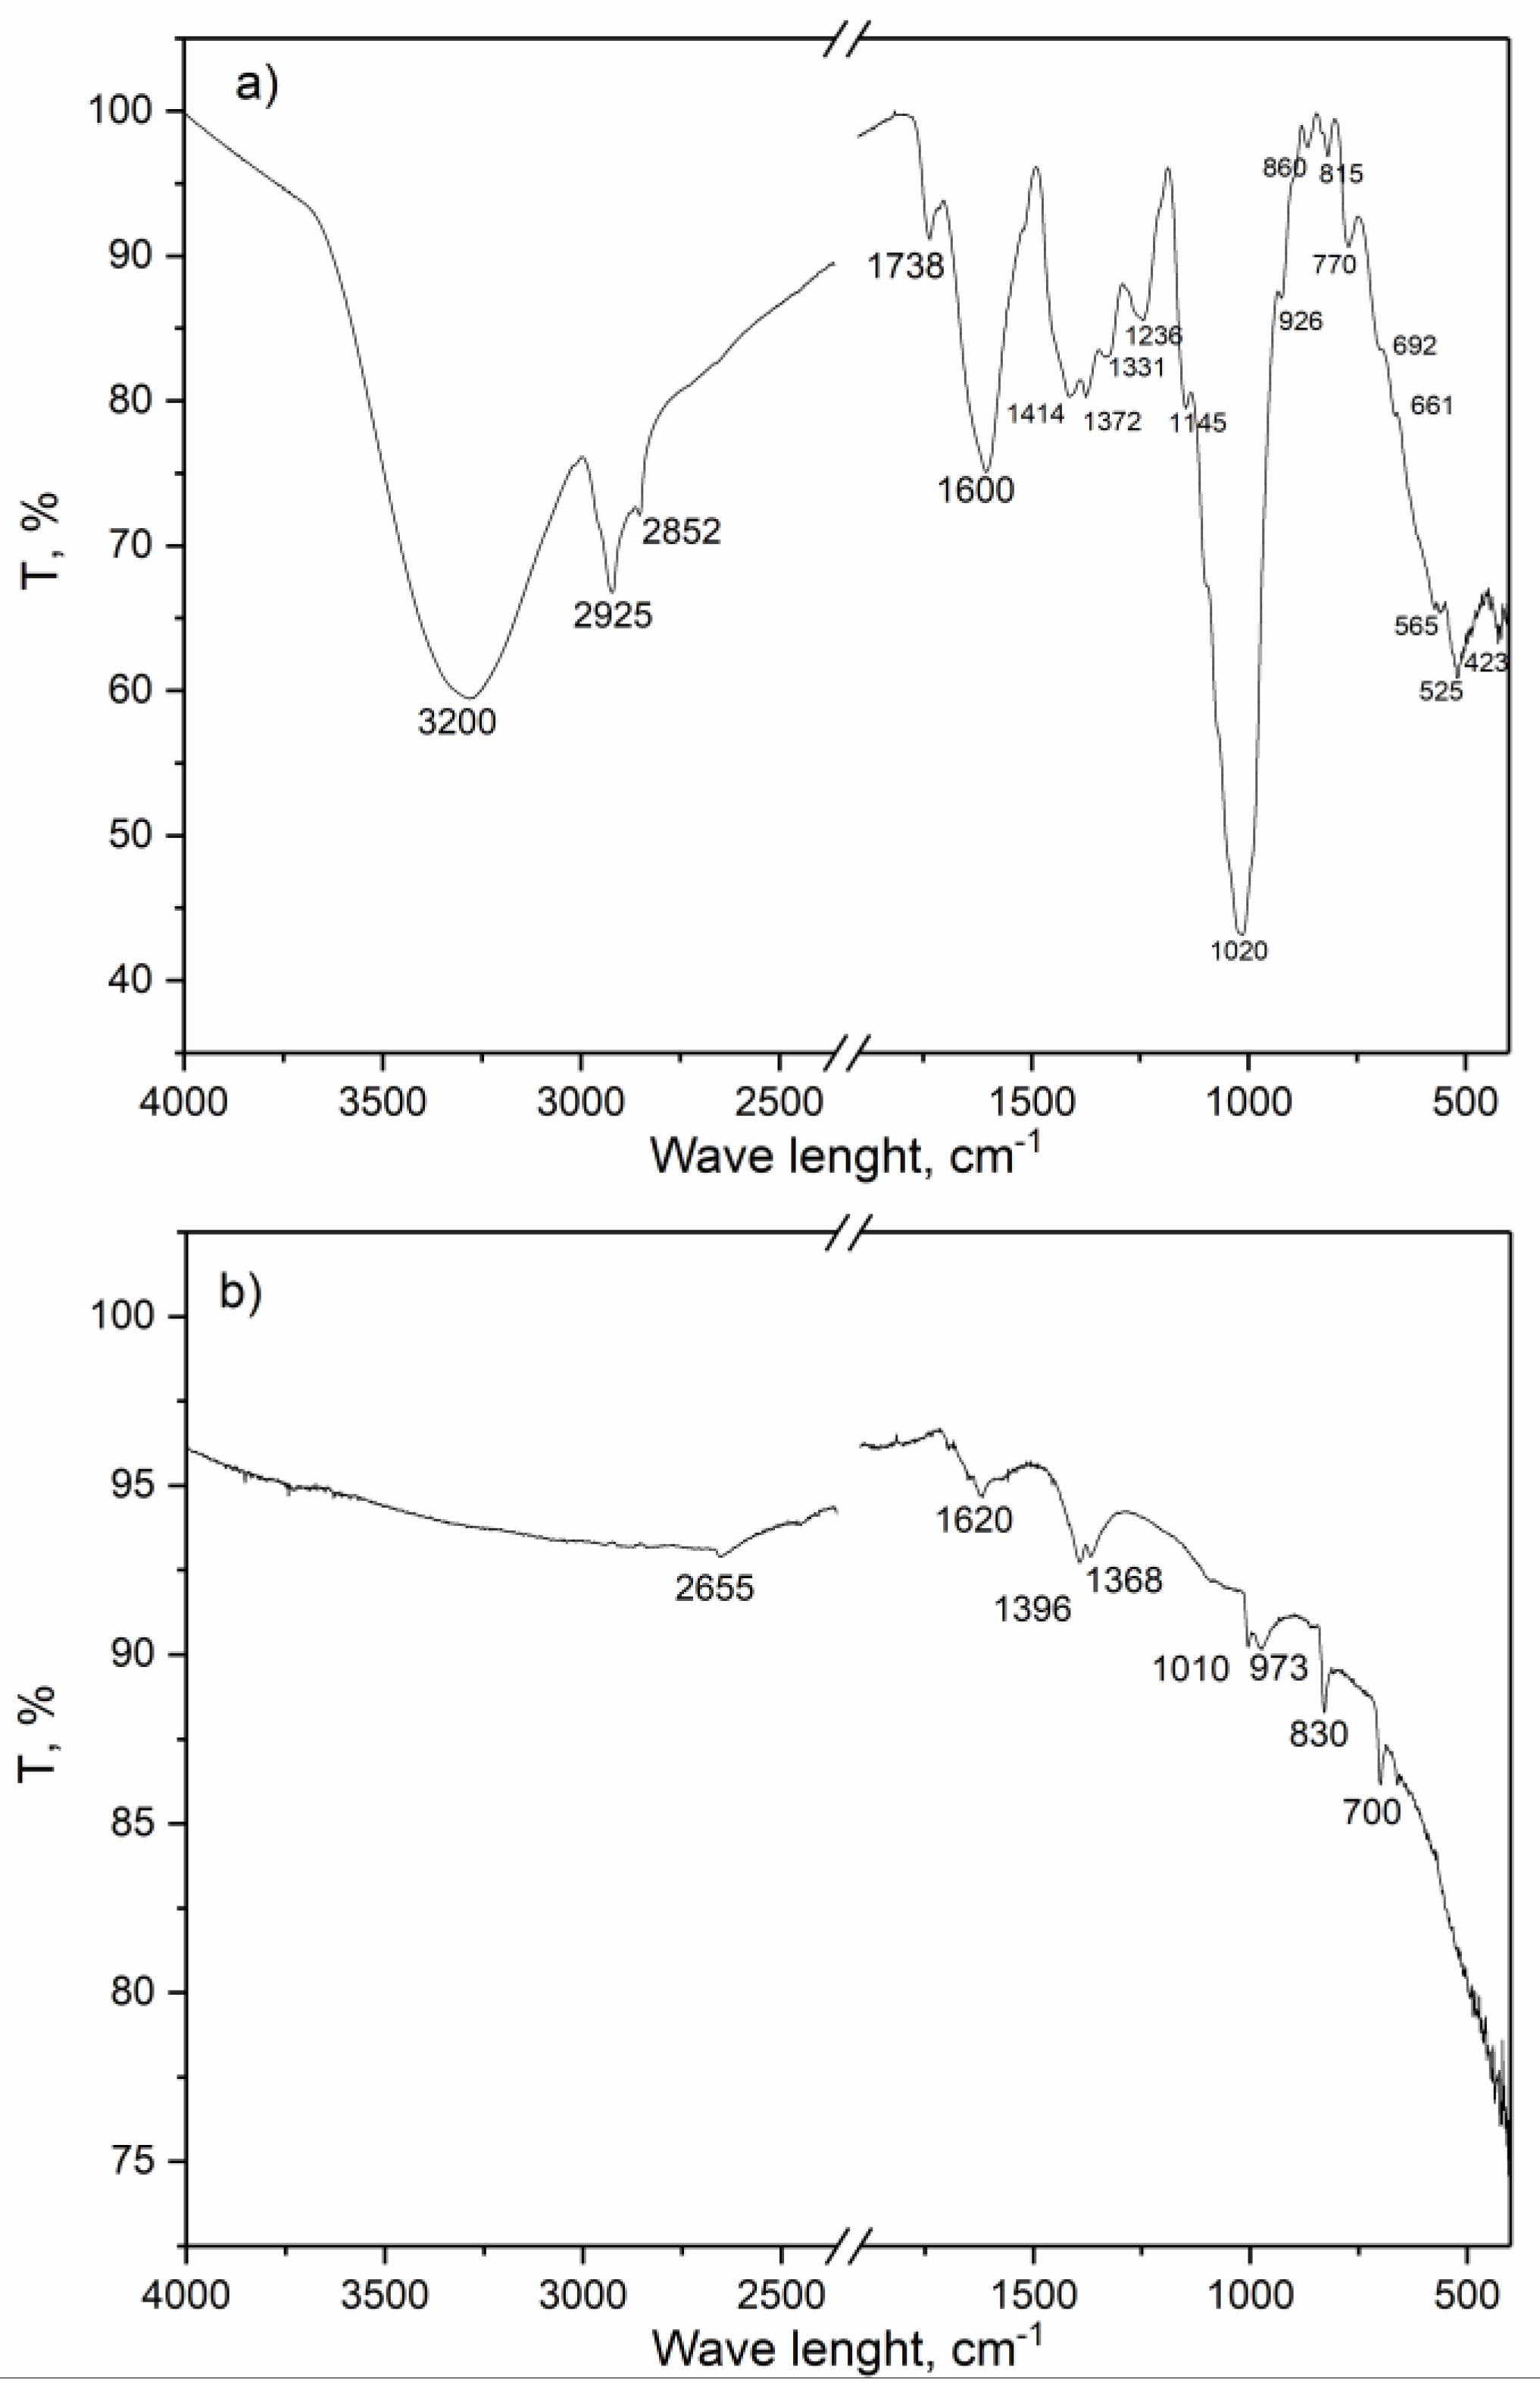
In order to investigate the structural properties of the sample obtained by mixing banana, carrot, and potato peels in a 1:1:1 ratio before and after carbonization, infrared spectroscopy was used, and the results are presented in Figure 4.
The FTIR spectrum of the mixed peel sample clearly reveals a typical polysaccharide-rich plant biomass. The extremely intense and broad band centered around 1020 cm−1 (C–O–C glycosidic stretching and C–OH contributions) together with the very wide O–H stretching band at ≈3200 cm−1 confirm that the material is dominated by cellulose, hemicellulose, pectin and starch, which is exactly what is expected from these three types of peel [36,37,38].
The aliphatic C–H stretching vibrations at 2925 and 2852 cm−1 arise from the polysaccharides and minor amounts of lipids on the peel surface. These bands can also be assigned to O–CH3 stretching due to methyl esters of galacturonic acid [39].
A prominent ester carbonyl peak at 1738 cm−1 (C=O stretching) [40] accompanied by carboxylate bands at 1600 (aromatic C=C and COO– stretching) and 1414 cm−1 (symmetric COO– stretching and C–H bending) is a classic signature of pectin [36,40]. The presence of a distinct band at 1372 cm−1 (CH2 bending) is further associated with the monosaccharides [40,41] and considered as a reliable marker that the pectin is highly esterified. Banana and carrot peels are naturally rich sources of such pectin, and even though potato peel contributes less, the mixture still exhibits a strong pectin character.
The medium-intensity band at 1600 cm−1 and the shoulder near 1236 cm−1 point to COO– antisymmetric stretching and aromatic C=C and C–O vibrations of lignin and phenolic compounds [42,43]. Banana peel has the highest lignin content of the three, so it is the primary source of these signals.
Potato peel, being the richest in starch, intensifies the polysaccharide fingerprint region (1200–900 cm−1) and the small sugar-ring modes below 900 cm−1 [44].
The band at 1331 cm−1 indicates that a significant portion of the cellulose and hemicellulose is relatively amorphous. At the same time, a weak shoulder at ≈1145 cm−1 (asymmetric C–O–C stretching) shows that some crystalline domains of cellulose and starch are still preserved after drying and grinding, which is normal and expected for air-dried or oven-dried peels [38].
Overall, the mixed biomass is a pectin-rich cellulosic material with moderate amounts of lignin and starch, combining the most useful structural features of all three agricultural by-products.
In addition to the main organic components, peels like those from bananas, potatoes, and carrots always contain some inorganic material, usually reported as CaO, MgO, K2O, and Na2O when ash is analyzed [45].
In the FTIR spectrum, the only inorganic contribution that leaves a noticeable (though indirect) trace is calcium oxalate: its carboxylate bands around 1620–1615 cm−1 and 1320–1315 cm−1 overlap heavily with the strong pectin and polysaccharide signals at 1600, 1331, and 1372 cm−1. The bands from magnesium (mainly Mg-oxalate or carbonate, ~1650–1600 and 1350–1300 cm−1), potassium (soluble carbonates or oxalates, broad ~1450–1400 cm−1), and sodium salts (very weak ~1450 and ~880 cm−1) are much fainter and completely hidden by the dominant organic absorptions. Any carbonate-related peaks (1450–1420, 875, or 712 cm−1) are either too weak to stand out or buried under the intense polysaccharide fingerprint region [45].
The FTIR spectrum of the carbonized sample (CARB_BCP) looks completely different from that of the original mixed peels, which is exactly what was expected after successful carbonization.
Most of the peaks that defined the raw biomass have either disappeared entirely or become so weak that they are barely noticeable. The broad, intense O–H stretching band around 3300 cm−1—coming from all the hydroxyl groups in cellulose, pectin, starch, and water has completely vanished. The aliphatic C–H stretches at 2925 and 2852 cm−1 are absent as well, indicating that the CH2 and CH3 chains in the polysaccharides and lipids have been broken down. The ester carbonyl peak at 1738 cm−1 (from pectin esters) is completely absent, indicating that those ester groups were destroyed during the process. Perhaps the most striking difference is in the polysaccharide fingerprint region between 1200 and 900 cm−1: the huge peak around 1020 cm−1 from C–O–C glycosidic bonds and C–OH groups has collapsed, leaving just weak traces near 1010 and 973 cm−1. All those smaller sugar-ring modes below 900 cm−1 and the pectin-related peaks at 1414 and 1372 cm−1 have also disappeared.
On the other hand, a few new features now dominate the spectrum, indicating that the material has become truly carbon-rich. The strongest band is now the broad one centered around 1620 cm−1—that’s aromatic C=C stretching [31], often slightly conjugated with remaining carbonyls, and it is classic for hydrochar or biochar. There are also weaker peaks at 1396 and 1368 cm−1, probably from residual aliphatic bending or deformations in the evolving carbon network. Down below 900 cm−1, weak bands at 830 and 700 cm−1 show aromatic C–H vibrations [30], confirming that polyaromatic domains have started to form. A very weak, broad signal around 2655 cm−1 might come from some strongly hydrogen-bonded carboxylic groups, but it is far less intense than before.
All these changes indicate the near-complete loss of oxygen-rich groups and polysaccharide signals, along with the emergence of dominant aromatic features. This clearly shows that carbonization was carried out successfully. The original pectin-rich cellulosic biomass has been transformed into a proper carbon-rich material.

3.1.4. BET Surface Area Analysis

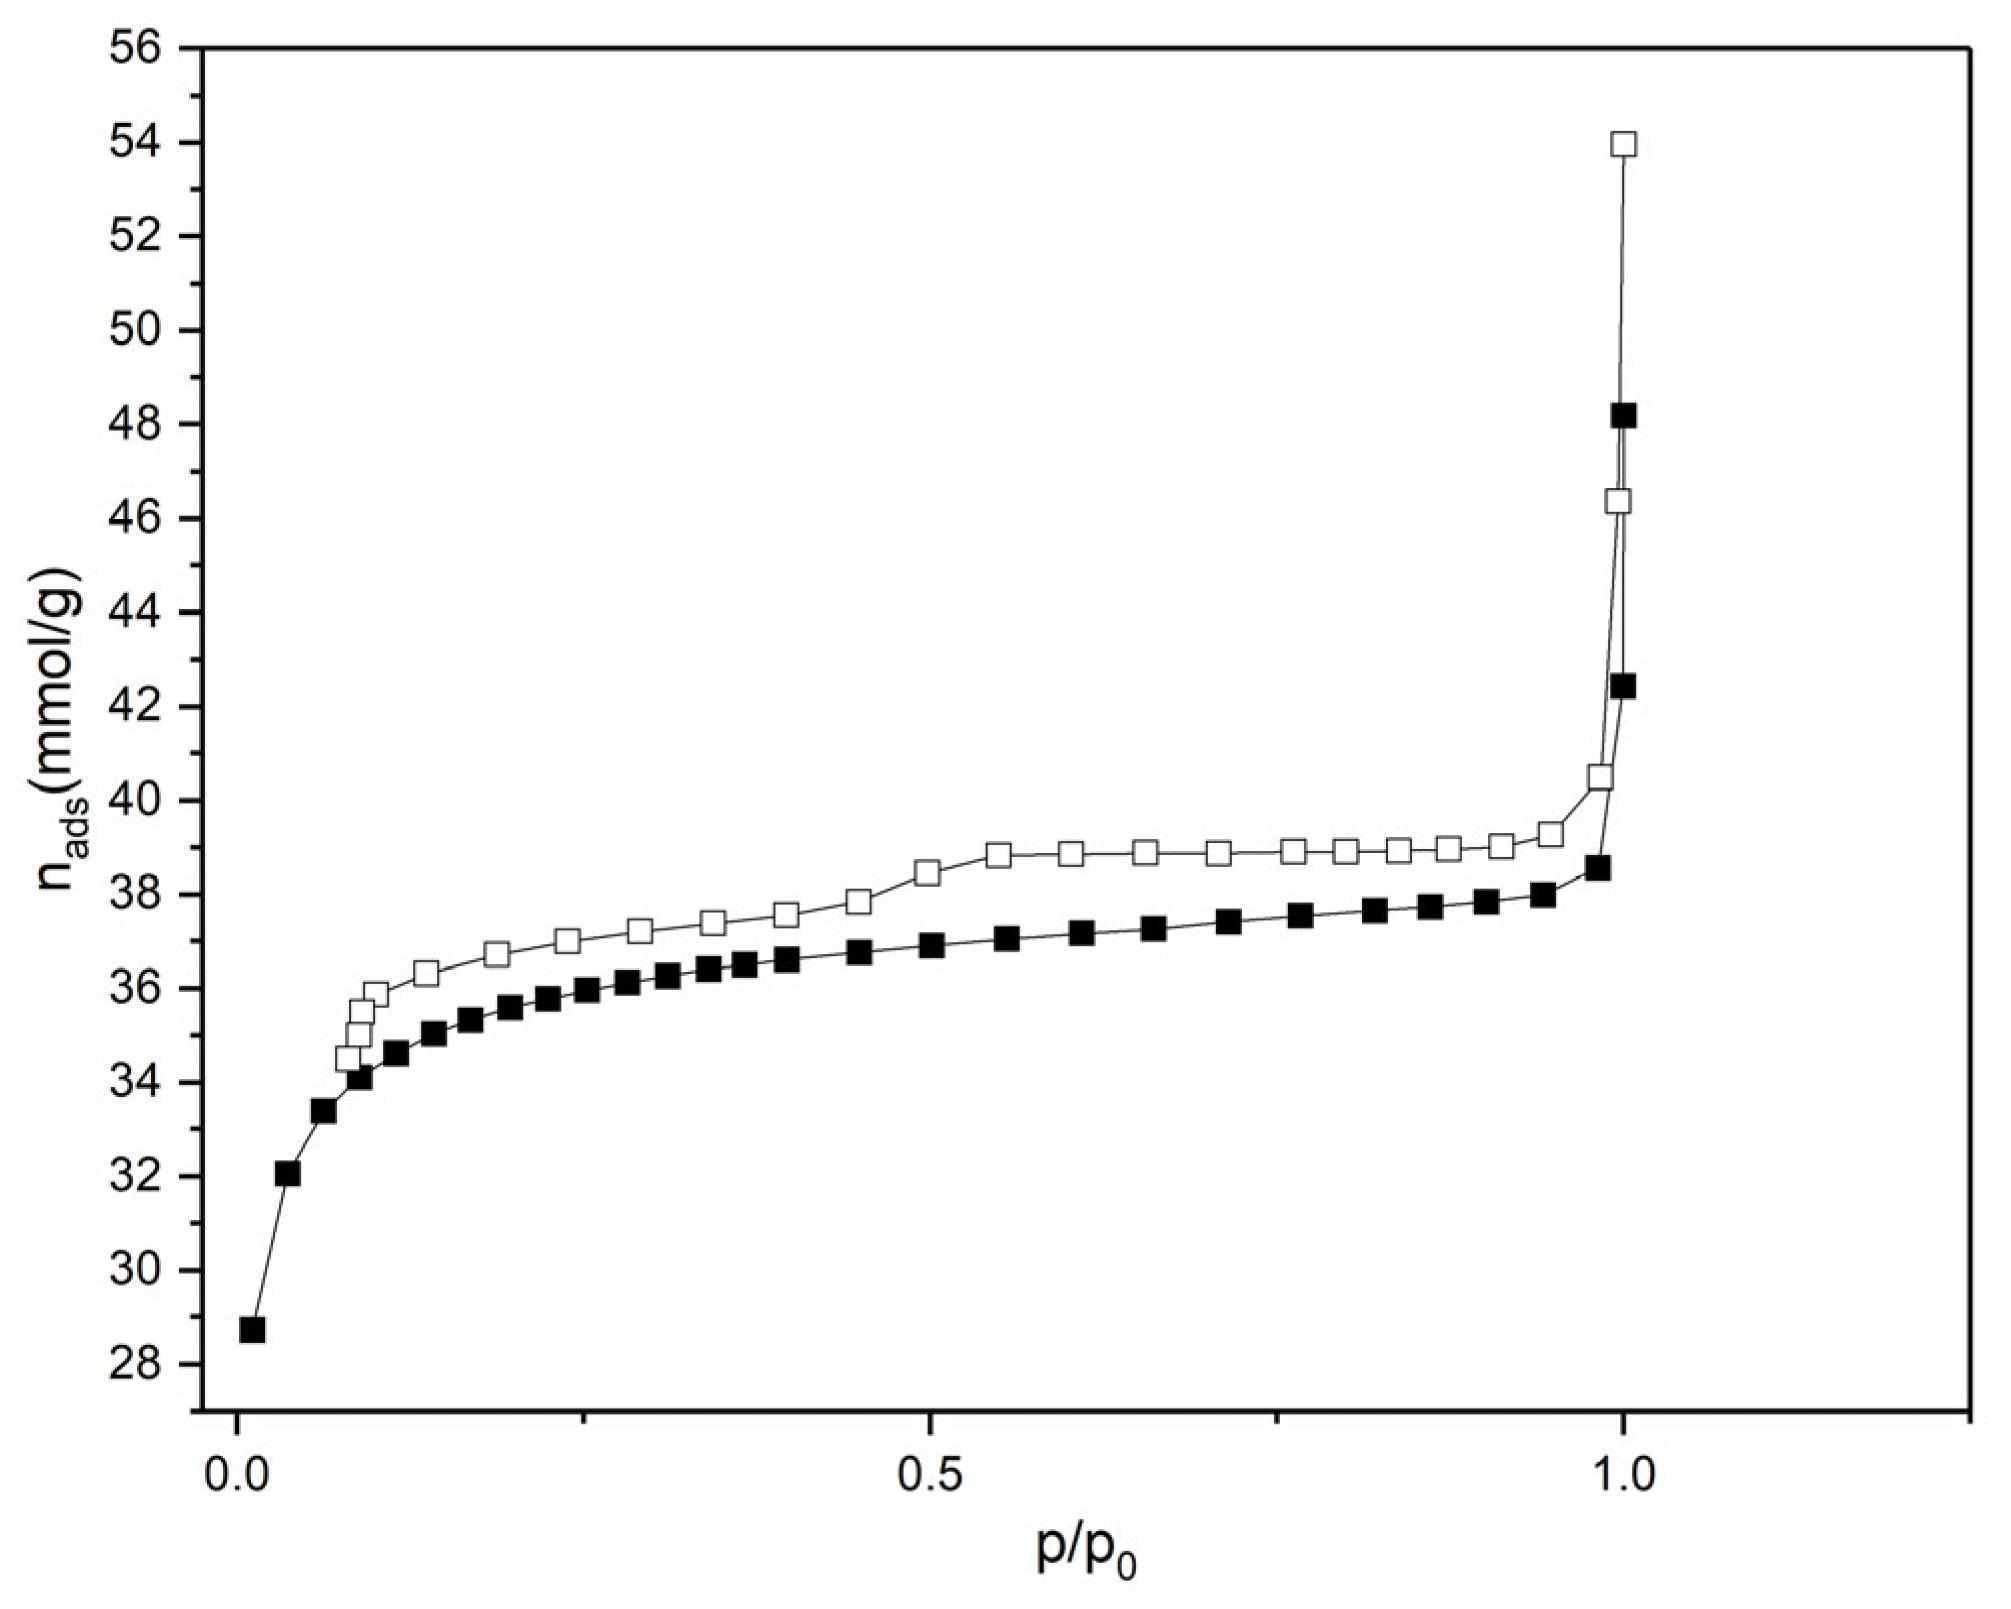
Preliminary results of the textural characterization of the raw material showed that the starting material obtained by drying and mixing banana peel, carrot, and potato in a 1:1:1 ratio does not have a developed surface area, and that the total measured specific surface area is very low, within the measurement error of the instrument. For this reason, the BET surface area analysis was only performed by nitrogen adsorption isotherms for the CARB_BCP sample, and the results are shown in Figure 5.
According to the IUPAC classification, the adsorption isotherm corresponds to Type IV with an H4 hysteresis [23,46]. This type of isotherm is characteristic of mesoporous materials, reflecting multilayer adsorption accompanied by capillary condensation [46]. However, the specific H4 hysteresis loop is typically observed in materials containing both micropores and slit-like mesopores [31,32,46]. The BET analysis revealed a specific surface area of SBET = 483 m2/g, with the microporous surface contributing Smic = 379 m2/g and a micropore volume of Vmic = 0.1921 cm3/g, confirming that microporosity dominates the sample’s textural properties (Table 1). The calculated average pore diameter was dmed = 1.95 nm. The dominance of microporosity is consistent with reports in the literature on biochar and activated carbon materials derived from lignocellulosic biomass [31,32]. In addition, the material exhibits a mesoporous surface area of Smeso = 104 m2/g, highlighting the coexistence of micro- and mesoporous domains. Such hierarchical pore structures are frequently reported for biomass-derived carbons and are considered beneficial for adsorption applications [31,32].
The literature confirms a clear difference between carbonized and activated samples: only carbonized biochars usually have very low surface areas, e.g., cotton husks 4.7 m2/g [47], poultry manure 17.7 m2/g and dairy fertilizer 13.0 m2/g [48]. In contrast, activated biochars reach many times higher values: K2CO3-activated rice husks up to 1850 m2/g [49] with ZnCl2 about 645 m2/g [50], while coconut shells exceed 1000 m2/g [51]. Mohan et al. (2014) state that carbonized biochars usually have surface areas below 300 m2/g, while activated ones reach 300–800 m2/g [32], and Khan et al. (2024) point out that activation significantly increases porosity and adsorption capacity [35]. Abu Bakar et al. (2023) showed that phosphoric acid-activated banana peel biochars can reach up to ~1000 m2/g [34]. In this context, the result of 483 m2/g for the CARB_BCP sample, which was only carbonized in an inert atmosphere, represents an extremely high level of porosity and shows that the carbonization alone can produce a structure approaching activated materials, emphasizing the efficiency of the process and the competitiveness of the obtained material [31,32,34,35].
The obtained specific surface area is consistent with values reported in the literature for biomass-derived carbon materials [31,32,34,35]. It is important to note that in most reported studies, higher surface areas are achieved only after chemical or physical activation. In contrast, the material investigated in this work was solely carbonized, which further underscores the significance of the obtained SBET value.
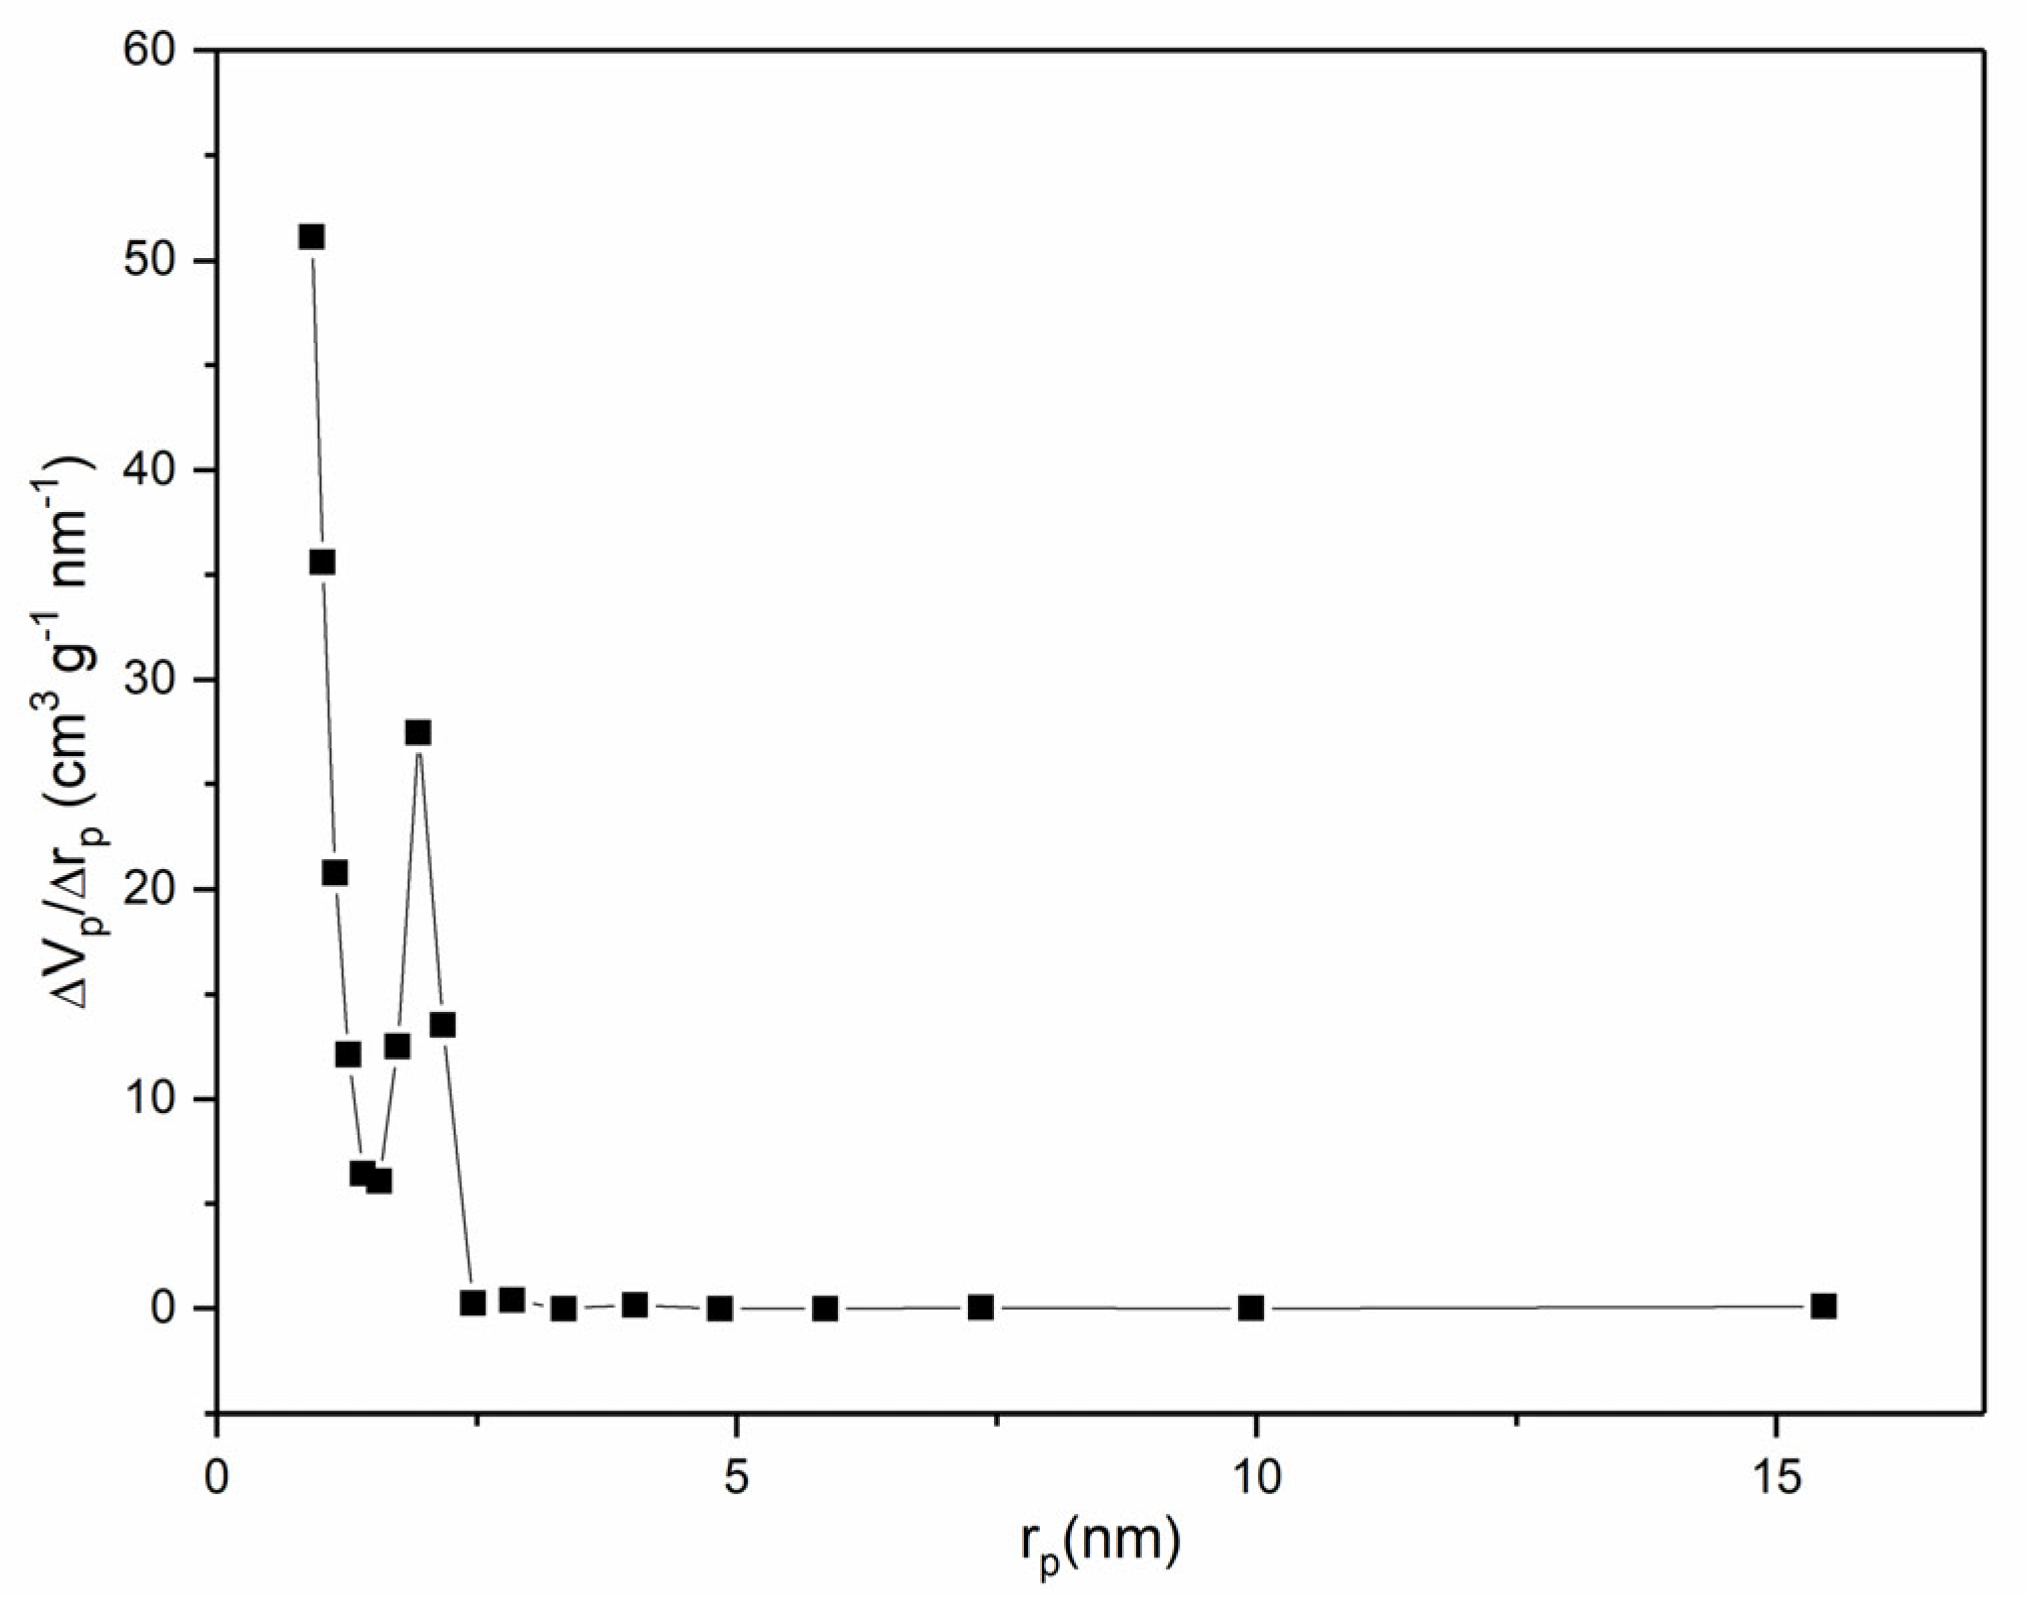
Pore size distribution (PSD) of the CARB_BCP sample is shown in Figure 6. The figure shows that the pore diameter ranges from approximately 0.9 to 20 nm, confirming the presence of both micropores and mesopores.
Pore size distribution analysis (BJH method) further shows a sharp peak centered at ~2 nm, indicative of a dominant microporous fraction. This suggests a high specific surface area and strong adsorption potential for small molecules. Taken together, these findings demonstrate that the sample possesses a hierarchical micro–mesoporous structure, in which micropores provide extensive surface area and strong adsorption sites at low relative pressures. At the same time, mesopores facilitate diffusion and capillary condensation. Such a dual contribution is particularly advantageous for adsorption processes, as it combines high capacity with efficient mass transport [23,31,46].

3.2. Adsorption

3.2.1. Selection of the Material

In order to select a material that could be considered representative of all carbonized materials, a preliminary experiment was conducted on the removal of phenol from contaminated aqueous solutions using pure carbonized banana (BP), potato (PP), and carrot peels (CP) as well as their various mixtures (Carb1–3, Carb_BCP and Carb_RBCP), and the obtained results are presented in Table 2.
As it can be seen from Table 2, all three pure materials (CP, PP and BP) showed high adsorption capacities, with phenol removal efficiencies of 91–92%. Mixed samples (Carb_1–3) showed slightly lower adsorbed amounts (85–88%). The sample labeled Carb_RBCP, a carbonized sample obtained by mixing peels before carbonization, showed a phenol removal efficiency of 58%. Notably, the sample labeled as CARB_BCP, composed of equal parts of all three carbonized peels (33.3 wt% of each), achieved an adsorption efficiency of 92%, which is equal to the highest value observed for the pure materials. Due to its good adsorption properties, the CARB_BCP sample was selected as the representative material for further experiments. The decision to use this material was not only based on its adsorption efficiency. Even though the real amount of banana, potato, and carrot peels in household waste is not always the same, using an equal ratio helps us keep the experiments consistent. Organic waste can vary a lot, so the 1:1:1 mixture reduces random differences in composition. This way, each type of peel contributes to the final material, and the produced adsorbent can be compared more easily between different batches and experimental conditions.

3.2.2. Influence of Initial pH on Removal Efficiency

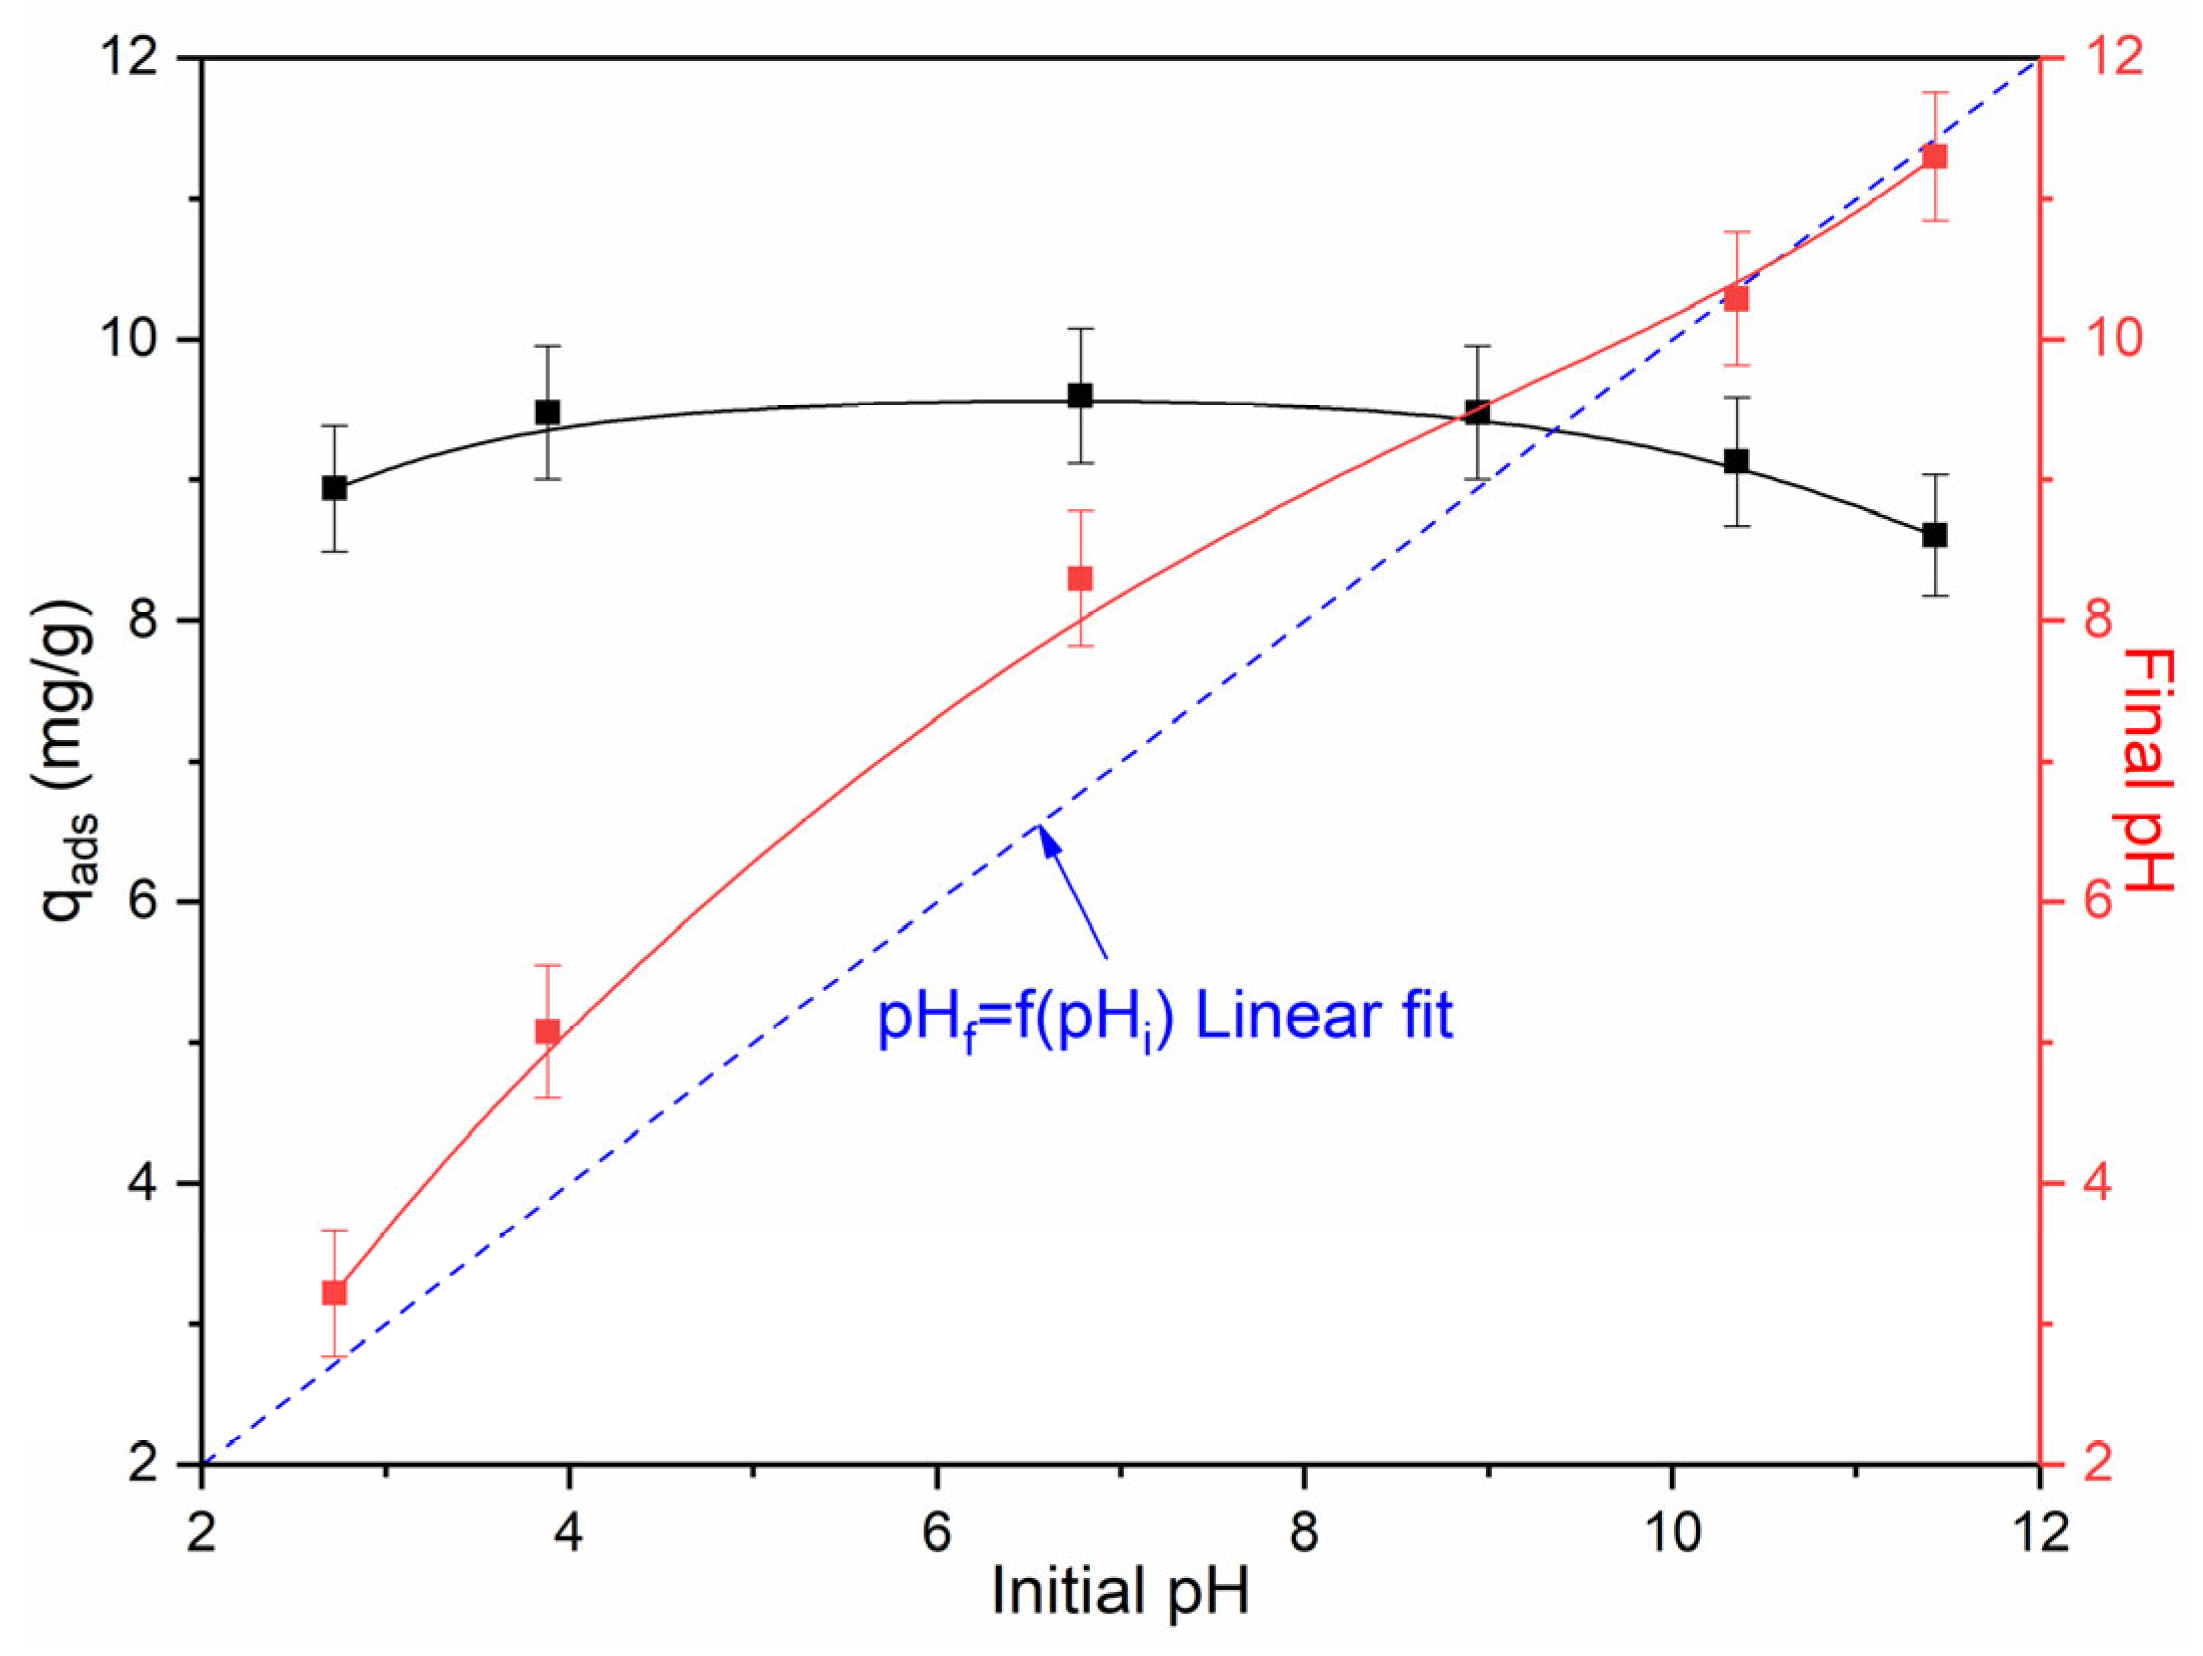
As stated during the determination of the point of zero charge, the pH of the solution can have a significant influence on the efficiency of removing various pollutants from aqueous solutions, since the protonated or deprotonated state of the adsorbent surface depends on pH, as well as the ionic form of the pollutant itself in the solution. For this reason, it was of interest to examine the effect of the initial pH on the efficiency of CARB_BCP in removing phenol from solution. The initial phenol concentration of 21 mg/dm3 was selected because it represents a realistic level of contamination found in many industrial wastewaters. In addition, initial concentrations in the range of 10–50 mg/dm3 are commonly used in adsorption studies, which allows direct comparison with previously published research [8,9,16]. The investigation was carried out in the pH range of approximately 2 to 12, and the obtained results are presented in Figure 7.
As can be seen from Figure 7, under applied experimental conditions, the phenol removal was in the range between 8.61 and 9.60 mg/g, with a slight maximum at pH ≈ 6.8 corresponding to a removal efficiency of 86–96%. These results demonstrate that CARB_BCP can almost completely remove phenol under moderate concentration conditions. At the same time, it is very important to emphasize that, in the entire investigated pH interval, the efficiency of phenol removal almost does not depend on the initial pH.
In the strongly acidic region (pH < 4), the efficiency was slightly lower, which can be explained by strong protonation of the surface and competition between H+ ions and phenol molecules for adsorption sites [29,52]. At near-neutral pH, phenol remains in its molecular form while the surface is positively charged, allowing hydrophobic interactions and π–π stacking to dominate, which results in the highest efficiency [36,53]. At strongly basic conditions (pH > 10), phenol ionizes to phenolate anions, and the surface becomes negatively charged, leading to a slight decrease in adsorption efficiency [54].
The influence of initial pH on phenol adsorption has been widely reported in the literature. It has been demonstrated that higher adsorption capacities are generally obtained under acidic conditions, while a decrease in performance is observed at alkaline pH values [53,54,55,56]. This behavior is attributed to the surface charge of the adsorbent, the point of zero charge, and the formation of phenolate ions at higher pH, which leads to electrostatic repulsion and reduced adsorption efficiency [56].
Results presented in this study agree with these findings, because the highest removal efficiency for CARB_BCP was also observed in the pH range 5–7. However, unlike most of the studies mentioned above, for CARB_BCP was no significant change in efficiency across the entire tested pH range (pH 2–12). This behavior can be explained by its large specific surface area that provides a significant number of easily accessible active sites for phenol binding as well as a relatively high point of zero charge (pH = 10.55), meaning that the surface is neutral or positively charged in almost the whole investigated pH range. Because of that, electrostatic repulsion of phenolate ions is minimized, and hydrophobic and π–π interactions remain the dominant adsorption mechanisms [53,55,57].

3.2.3. Results of the Influence of Initial Phenol Concentration

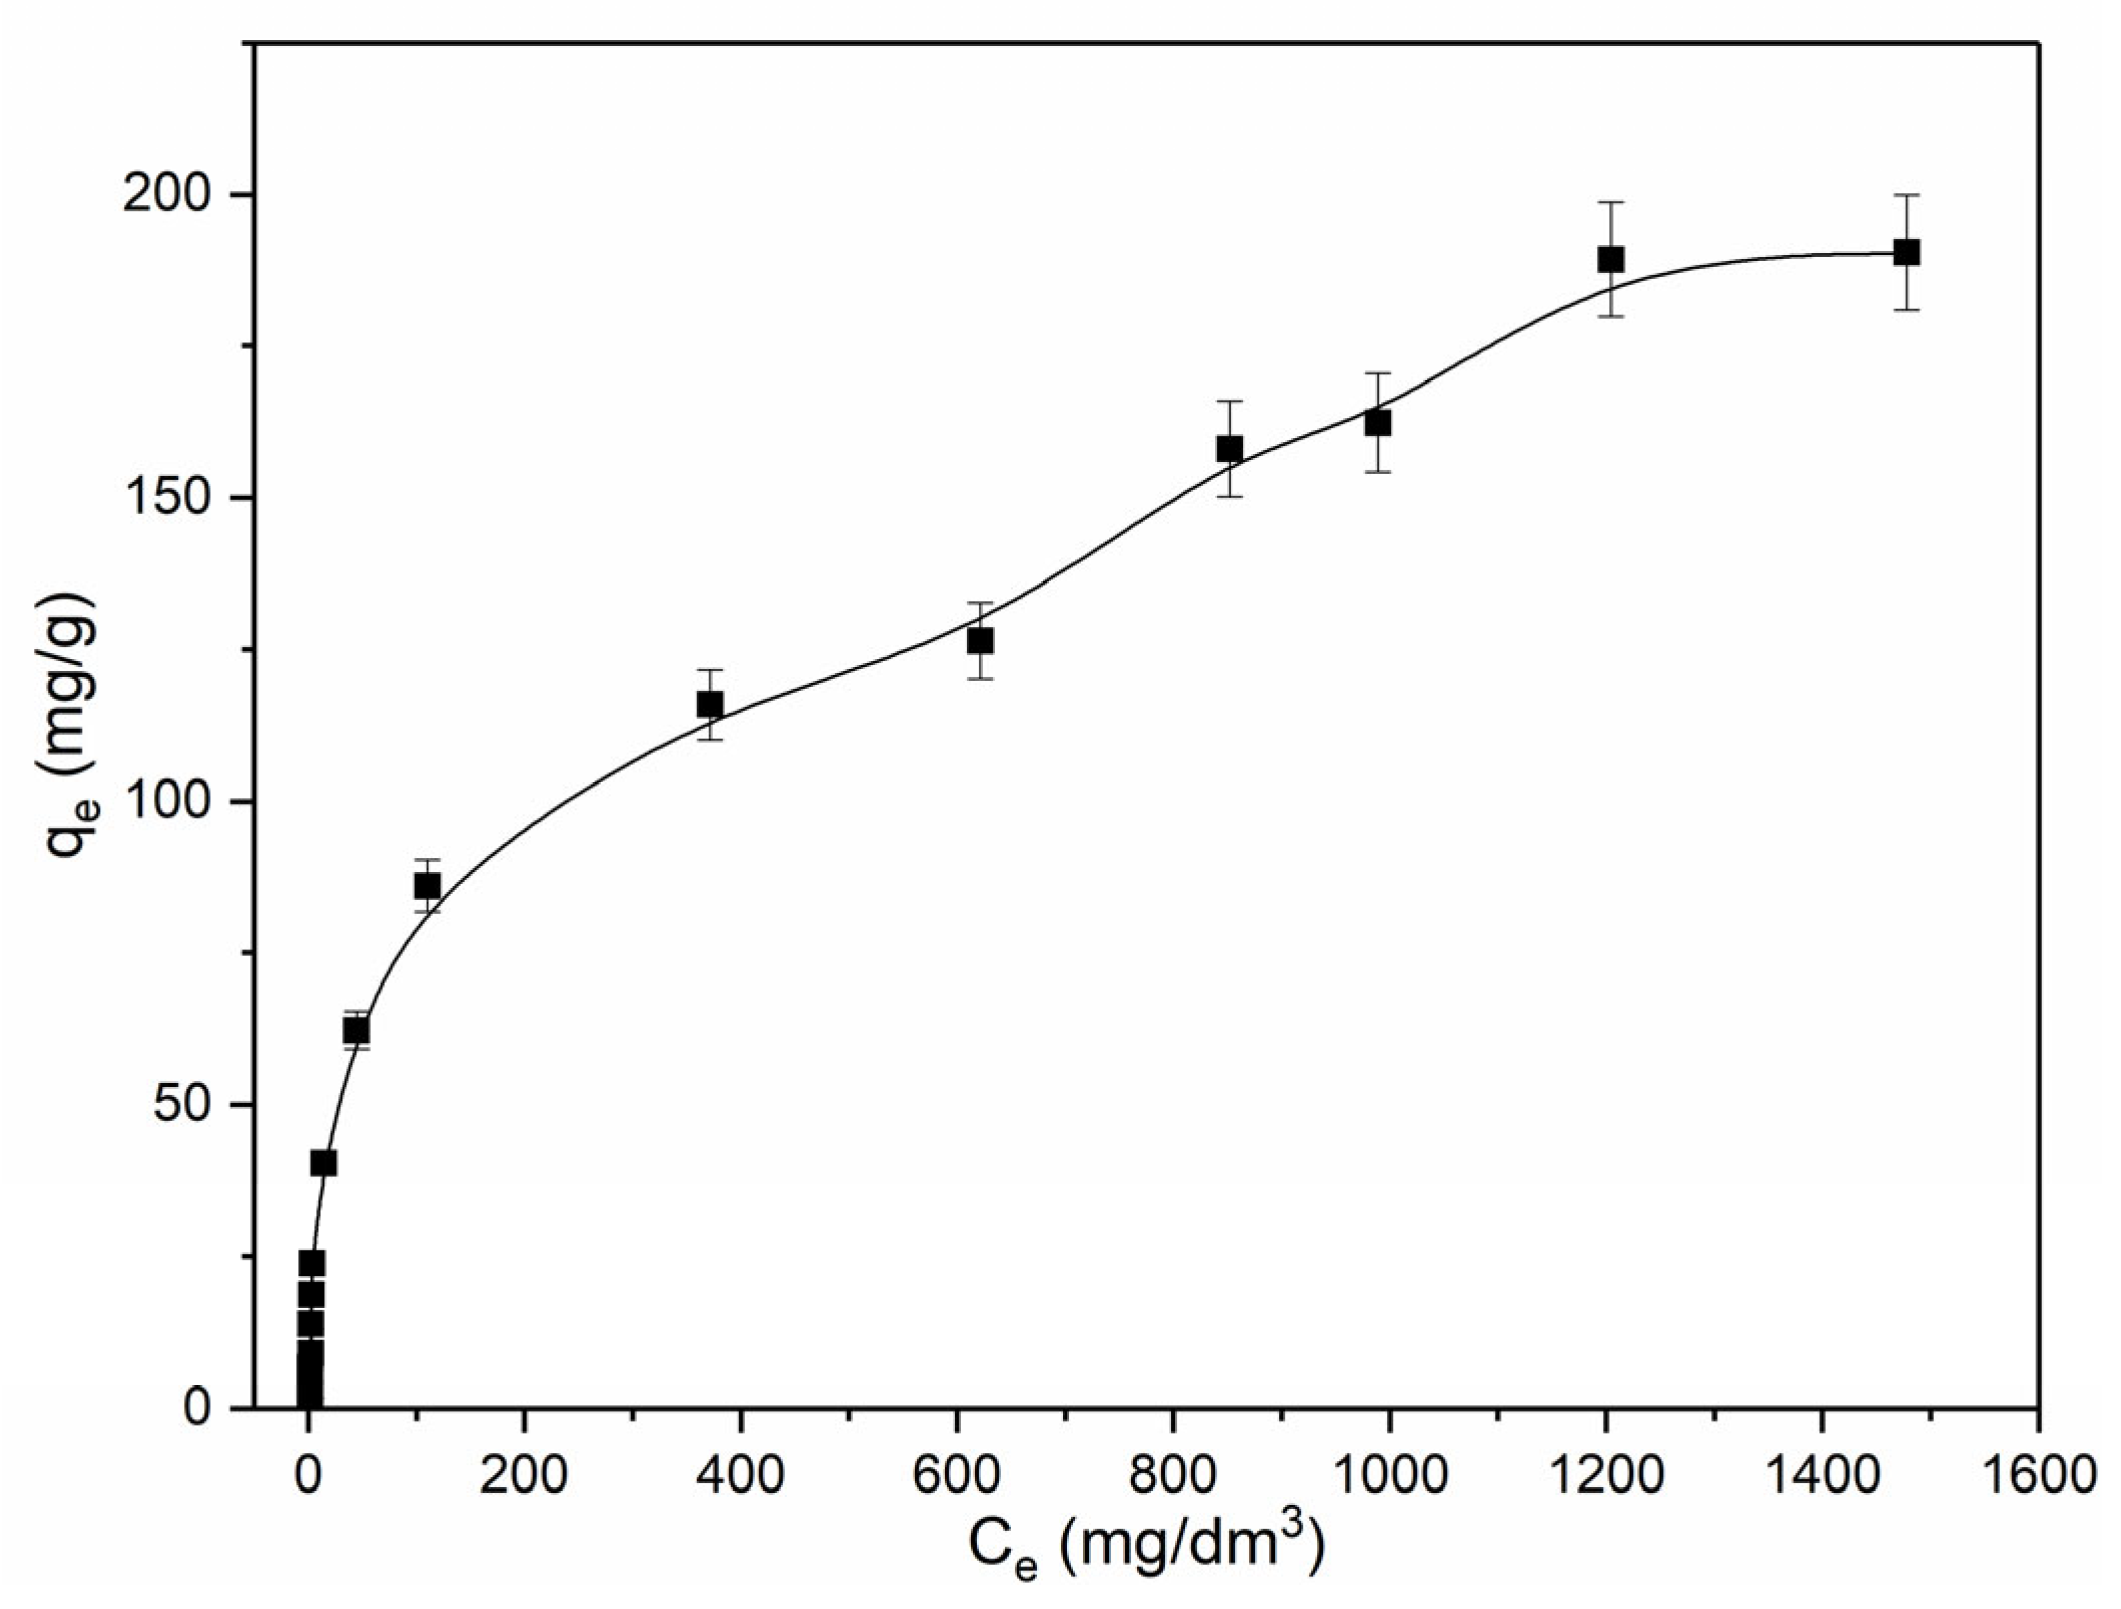
The influence of the initial phenol concentration on the CARB_BCP efficiency was investigated in the initial concentration range of 5–1850 mg/dm3 for mas/volume ratio of 0.1 mg/50 cm3, and the results are presented in Figure 8.
Figure 8 shows the curve that describes how the initial phenol concentration affects the efficiency of the CARB_BCP material. The curve indicates that the amount of phenol adsorbed per unit mass of adsorbent (qe, mg/g) increases as the initial, or equilibrium, phenol concentration in the solution (Ce, mg/dm3) rises. For lower initial concentrations (Ce in the range of 0 to 200 mg/dm3), the largest increase in the adsorbed amount was observed (0–95 mg/g). After that, the curve continues to rise, but much more slowly, up to about Ce ≈ 1200 mg/dm3, where the adsorbed amount reaches 189.40 mg/g. Beyond this point, the system becomes saturated, and the curve no longer shows any significant increase, so for the last point (Ce ≈ 1500 mg/dm3), there is practically no noticeable change in the adsorbed amount (qe = 189.70 mg/g), suggesting that the adsorption sites are becoming saturated.
Ruiz Lopez et al. (2025) investigated bio-carbonized materials obtained from banana leaves and coffee husks at an initial phenol concentration of 50 mg/dm3 and an adsorbent dose of 1 g/L, achieving a removal efficiency of approximately 28–42% [12]. Cho et al. (2022) showed that bio-carbonized kenaf material achieves about 41% phenol removal at a concentration of 100 mg/dm3 and an adsorbent dose of 1 g/dm3 [55]. Mesquita et al. (2024) used bio-carbonized material from Eucalyptus saligna activated by NiCl, at a phenol concentration of 200 mg/dm3 and an adsorbent dose of 0.5 g/dm3, achieving about 19% removal [58]. In a recent study, activated bio-carbonized material from waste wood panels achieved about 17% phenol removal at a concentration of 500 mg/dm3 and an adsorbent dose of 0.5 g/dm3 [59].
The results of this research indicate that CARB_BCP achieves an extremely high maximum removal efficiency (20.51%, 189.9 mg/g) under the applied phenol concentrations, without significant influence of the initial pH. This characteristic highlights the practical advantage of CARB_BCP, as it enables efficient removal of phenol from solutions at initial concentrations up to ≈1900 mg/dm3, without the need for strict pH control.
The adsorption efficiency of CARB_BCP (92% phenol removal) shows a comparable or higher value compared to recently reported adsorbents obtained from agro-waste. For example, biochar derived from bananas and other lignocellulosic residues usually exhibits moderate phenol adsorption capacities under conditions without intensive chemical modification [12]. Similarly, biochar obtained from Delonix regia shows relatively low adsorption capacity (~2.59 mg/g) with moderate phenol removal efficiency (~82%) [48]. Rice straw biochar requires chemical activation to achieve significantly higher phenol removal efficiency, indicating the limited efficiency of raw materials [60]. In contrast, CARB_BCP achieves high phenol removal efficiency without the need for intensive chemical activation, which confirms the synergistic effect of the agro-waste ternary system and improved adsorption properties.
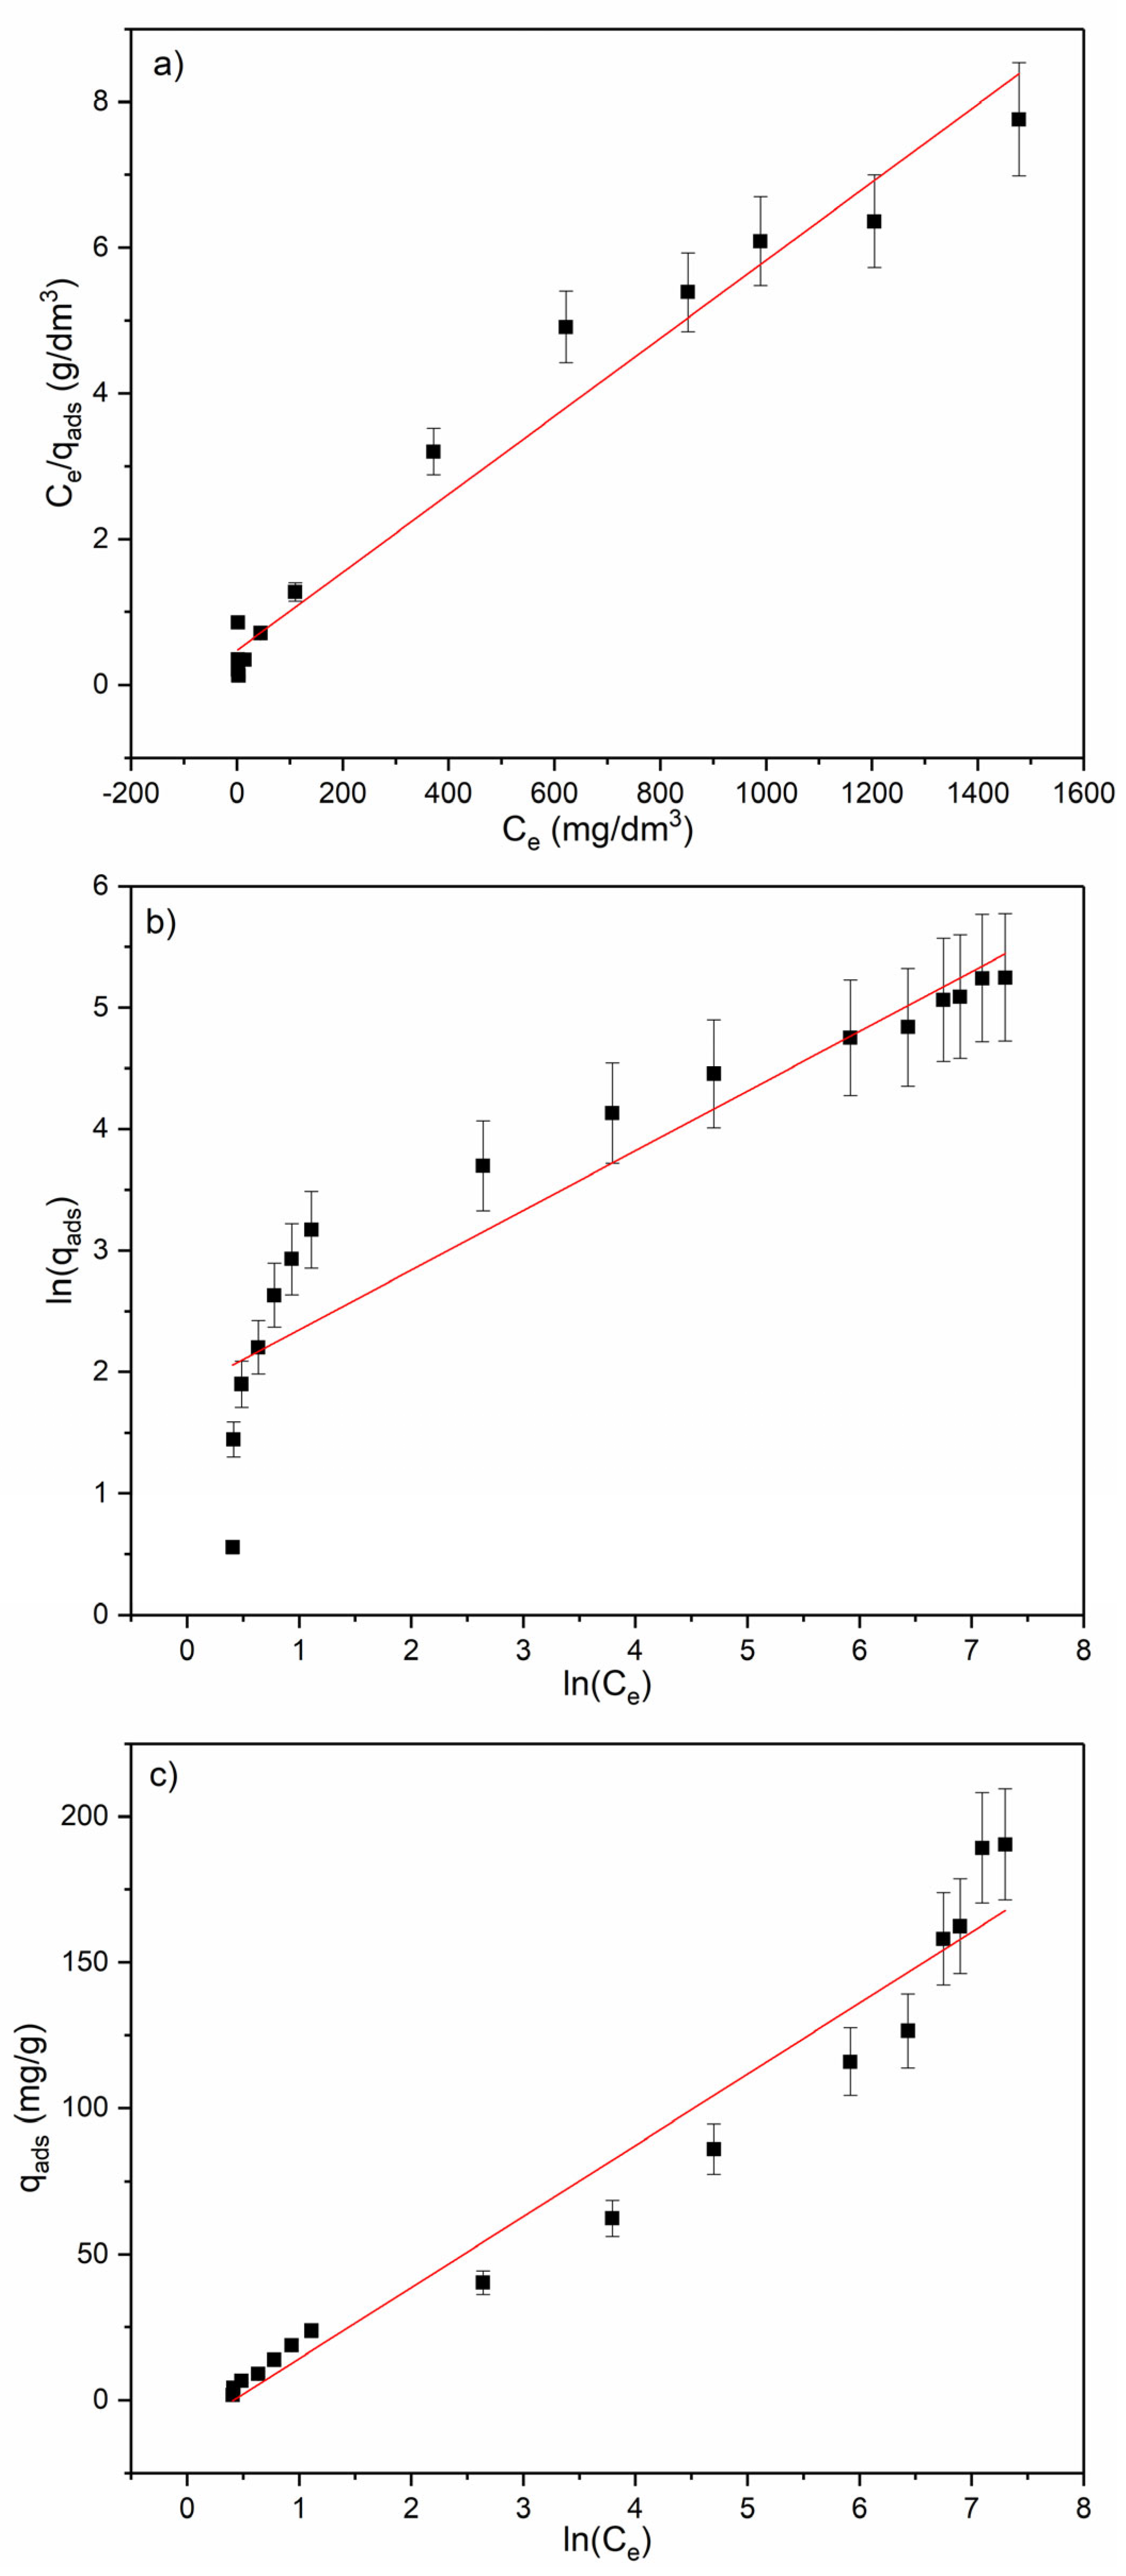
The non-linear shape of the curve suggests that the adsorption process does not follow a simple mechanism, and to better describe the adsorption mechanism, the obtained results were fitted using three adsorption models, and adequate linear isotherms are presented in Figure 9, while their parameters are listed in Table 3 and Table 4.
As presented in Figure 9 and Table 3 and Table 4, among the three applied adsorption models, the Langmuir model showed the best agreement with the experimental data, with a value of 0.96736. In addition, a very good match between the experimentally measured and theoretically calculated maximum adsorption capacities (qmax,theor = 186.92 mg/g and qmax,exp = 189.70 mg/g) further confirms that the Langmuir model is suitable for describing the adsorption of phenol onto CARB_BCP. These results indicate that phenol adsorption from solution mainly occurs as a monolayer and that the surface of CARB_BCP is largely homogeneous, meaning that most active sites have the same or very similar adsorption energy. The obtained Langmuir constant, which reflects the affinity between phenol and the adsorbent surface (KL = 0.0112 dm3/mg), suggests a moderate adsorption affinity. In practical terms, this means that phenol binding occurs through a combination of physisorption and specific interactions such as π–π interactions between the aromatic ring of phenol and the aromatic structures on the carbon surface, as well as through hydrogen bonding or dipole–dipole interactions.
The agreement between the experimental data and the Freundlich model is noticeably lower (R2 = 0.85969), indicating that some degree of surface heterogeneity and multilayer adsorption is present, but that these effects are not dominant in the adsorption of phenol onto the CARB_BCP adsorbent. The obtained value of the Freundlich constant, which is neither very high nor very low (KF = 6.41 ((mg/g)(dm3/mg))1/n), suggests that the applied material has a moderate adsorption capacity. Regarding the parameter n, its value reflects both the degree of surface heterogeneity and how favorable the adsorption process is. Higher n values indicate a more favorable adsorption process and a lower degree of heterogeneity. In this study, the obtained value was n = 2.04, or 1/n = 0.49, which confirms moderate-to-low surface heterogeneity and a generally favorable adsorption process.
Regarding the Temkin isotherm, the obtained results showed a fairly high degree of agreement (R2 = 0.9562), which is slightly lower than the Langmuir model but still significantly better than the Freundlich isotherm. This model suggests that the adsorption heat decreases linearly with increasing surface coverage. In other words, the energetically most favorable sites are occupied first, and phenol then binds to less favorable sites, which corresponds to adsorption on different functional groups as well as pores of different diameters and volumes. The Temkin constant AT provides information similar to the Langmuir constant KL, reflecting the affinity between phenol and the adsorbent surface. The obtained value of 1.51 dm3/mg is relatively high and consistent with the Langmuir constant, indicating that the interaction between phenol and the surface is energetically favorable, but not extremely strong.
The parameter bT is related to the adsorption energy. When its value is higher than 100 J/mol, this indicates weak chemisorption or strong physisorption, while values below 100 J/mol suggest strong chemisorption and weak physisorption. The obtained bT value of 101.75 J/mol indicates weak chemisorption or, more precisely, strong physisorption as the dominant mechanism of phenol binding onto the CARB_BCP surface. Such physisorption may include hydrogen bonding, π–π interactions, and dipole interactions.
The analysis of the statistical parameters presented in Table 4 clearly supports the previous discussion regarding the agreement between the experimental results and the applied isotherm models. The Langmuir model shows the lowest SSE and RMSE values, indicating the smallest overall and average deviations between the experimental and calculated data. However, the relatively high χ2 value observed for the Langmuir model is a consequence of several experimental points with pronounced deviations at high concentrations, which substantially increase the weighted error and contribute to the total χ2. This suggests the limited applicability of the Langmuir model at higher concentration ranges. The Temkin isotherm ranks second based on the obtained statistical parameters, showing moderate increases in all error values but still performing better than the Freundlich model. The Freundlich isotherm exhibits the highest SSE, RMSE, and χ2 values, indicating the weakest overall and weighted fit. The statistical indicators consistently confirm that the order of agreement between the experimental data and the applied adsorption models is: Langmuir > Temkin > Freundlich.
In summary, based on the fitting results of the three adsorption models (Table 3 and Table 4 and Figure 9), it can be concluded that monolayer adsorption on a relatively homogeneous surface is the dominant mechanism of phenol binding onto the CARB_BCP material. At the same time, the adsorption energy is not constant but decreases with increasing surface coverage, indicating moderate heterogeneity and interactions among the adsorbed molecules. The binding most likely occurs through physisorption and weak chemisorption, involving aromatic structures (π–π interactions with phenol), acidic or basic functional groups (hydrogen bonding and dipole interactions), as well as micro- and mesopores previously obtained by determination of textural properties (Table 1 and Figure 6).
The results obtained by fitting the experimental data with the three different adsorption isotherm models are fully consistent with the other findings presented in this study. The best agreement with the Langmuir model (R2 = 0.96736, Table 3) indicates that phenol adsorption onto CARB_BCP occurs predominantly as monolayer adsorption on a relatively homogeneous surface. This is typical in cases where electrostatic forces are not dominant and where adsorption mainly proceeds through hydrophobic interactions, π–π interactions, and hydrogen bonding, which also explains the nearly constant removal efficiency of phenol across a wide pH range (pH 2–12, Figure 7). The slight variations observed in Figure 7 at extremely high and low pH values can be explained by the Temkin model, which suggests moderate surface heterogeneity and a decrease in adsorption energy as surface coverage increases.
Such adsorption behavior of CARB_BCP is also fully in line with the structural and chemical characteristics of the material obtained by SEM, BET (Figure 3, Figure 5 and Figure 6), FTIR (Figure 4), and pHpzc analyses. SEM and BET analyses showed that the surface of CARB_BCP is highly porous, fibrous, and rough, with numerous pores of different sizes. Since these pores were formed by the thermal degradation of polysaccharides (hemicellulose and cellulose), they were classified as micro- and mesopores by the BET method. This provides a large number of easily accessible active sites and facilitates the diffusion of phenol into the internal structure of the adsorbent, which explains the high adsorption capacity and the good agreement with the Langmuir model.
On the other hand, FTIR analysis confirmed that the carbonization process almost completely removed hydroxyl, carboxyl, ester, and glycosidic groups characteristic of raw biomass, while dominant aromatic C=C and C–H vibration modes were formed. This transformation into an aromatic, hydrophobic, and mostly non-polar surface explains why π–π interactions, hydrophobic interactions, and hydrogen bonding are primarily responsible for phenol binding. It also explains the weaker agreement with the Freundlich model, since the surface after carbonization is not heterogeneous in terms of different functional groups but is instead dominated by aromatic structures.
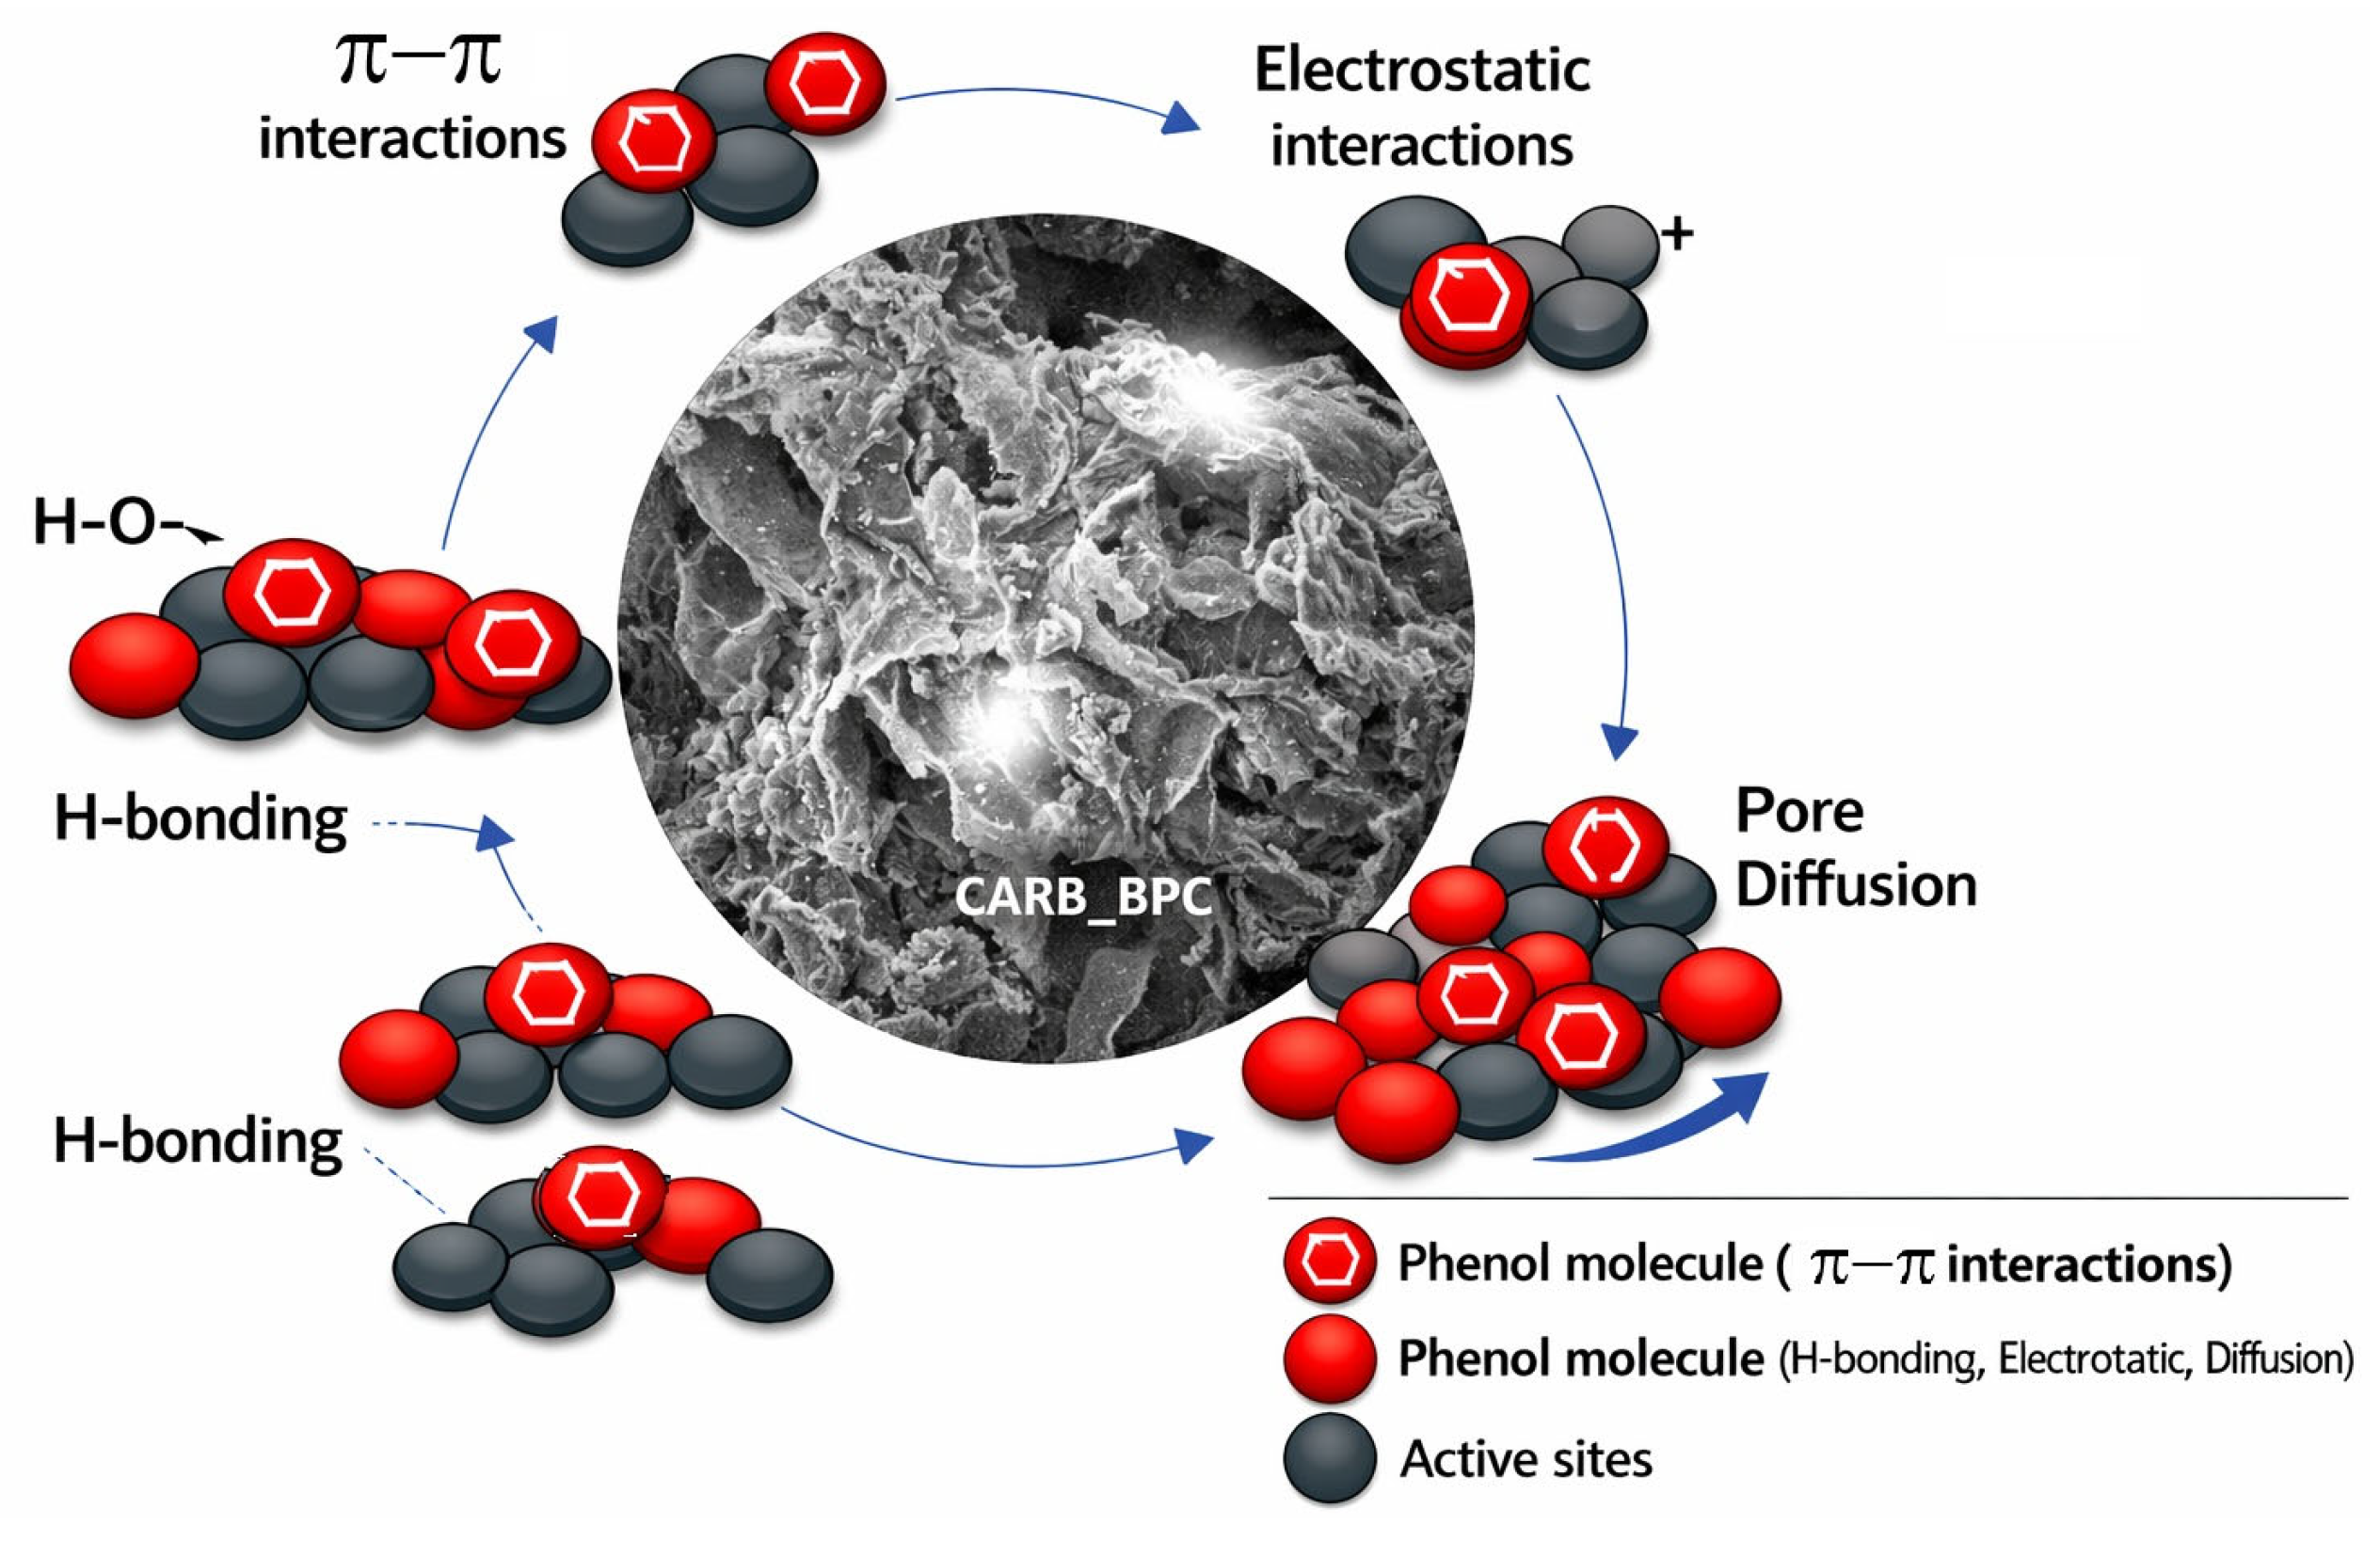
Additionally, the high pHpzc value indicates that the surface is positively charged across almost the entire investigated pH range (pH 2–12), meaning that electrostatic interactions play only a secondary role in phenol adsorption onto CARB_BCP. This is fully consistent with the experiments of the influence of pH on phenol removal, which show that phenol removal efficiency remains nearly constant across the entire pH range, with only slight decreases under strongly acidic and strongly basic conditions. At low pH, the slight decrease is due to competition between H+ ions and phenol for active sites, while at pH > 10, phenol is present as phenolate, leading to mild electrostatic repulsion from the negatively charged surface. However, since the surface is mainly aromatic and hydrophobic, these effects have minimal influence on overall adsorption, which is entirely consistent with both the Langmuir and Temkin models. The graphical illustration of the adsorption mechanism is given in Figure 10.

4. Conclusions

The overall conclusion can be summarized as follows:
-
CARB_BCP exhibits a highly porous, fibrous structure with micro- and mesopores formed during carbonization with a high specific surface area of SBET = 483 m2/g.
-
FTIR analysis confirms the removal of oxygen-rich functional groups and the formation of aromatic, hydrophobic, and largely non-polar carbon structures.
-
The high pHpzc (10.55) indicates that the surface is positively charged across most of the studied pH range, explaining the minimal influence of electrostatic interactions.
-
Phenol adsorption is stable across a wide pH range (2–12), with only slight decreases under strongly acidic or basic conditions.
-
The Langmuir model best describes the adsorption process, confirming monolayer adsorption on a relatively homogeneous surface.
-
The Temkin model indicates moderate heterogeneity and decreasing adsorption energy with increasing surface coverage.
-
The Freundlich model shows weaker agreement, consistent with the uniform aromatic surface formed after carbonization.
-
The dominant adsorption mechanisms are π–π interactions, hydrophobic interactions, and hydrogen bonding, with weak chemisorption or strong physisorption.
-
CARB_BCP, with a surface area of 483 m2/g before adsorption, demonstrates a high adsorption capacity (≈190 mg/g) and favorable interaction with phenol; this performance arises from the combination of its large surface area and micro–mesoporous structure, which enables effective phenol adsorption and highlights its strong potential as a low-cost adsorbent derived from agricultural waste for pollutant removal.

Author Contributions

M.K. and R.L. conceived and designed the experiments, wrote the paper, and contributed to all experiments and the analysis of the obtained results. M.S. and J.G. participated in physical–chemical measurements (SEM, pHpzc) and contributed to analyzing the results. S.M. contributed to the work with FTIR and the explanation of the FTIR results. J.G., V.D. and T.M.-A. participated in BET measurements. All authors have read and agreed to the published version of the manuscript.

Funding

This work was supported by the Ministry of Science, Technological Development and Innovation of the Republic of Serbia (grant numbers 451-03-33/2026-03/200017 through the realization of research themes 1702603 and 1702605 and 451-03-33/2026-03/200023).

Data Availability Statement

The original contributions presented in this study are included in the article. Further inquiries can be directed to the corresponding author.

Conflicts of Interest

The authors declare no conflicts of interest.

References

  1. Afsharnia, M.; Saeidi, M.; Zarei, A.; Narooie, M.R.; Biglari, H. Phenol removal from aqueous environment by adsorption onto pomegranate peel carbon. Electron. Physician 2016, 8, 3248–3256. [Google Scholar] [CrossRef]
  2. Ngole-Jeme, V.; Ntumba, C.N. Fruit and vegetable peel characteristics and their conversion to biosorbents using hydrothermal carbonization and pyrolysis: A review. BioResources 2024, 19, 9853–9904. [Google Scholar] [CrossRef]
  3. European Union. Directive (EU) 2020/2184 on the Quality of Water Intended for Human Consumption. 2020. Available online: https://eur-lex.europa.eu/eli/dir/2020/2184/oj/eng (accessed on 18 March 2026).
  4. United States Environmental Protection Agency (USEPA). Priority Pollutants List; USEPA: Washington, DC, USA, 2015. Available online: https://www.epa.gov/sites/default/files/2015-09/documents/priority-pollutant-list-epa.pdf (accessed on 18 March 2026).
  5. European Union. Directive 2008/105/EC on environmental quality standards in the field of water policy. Off. J. Eur. Union 2008, L 348, 84–97. Available online: https://eur-lex.europa.eu/eli/dir/2008/105/oj/eng (accessed on 18 March 2026).
  6. European Union. Directive 2013/39/EU amending Directives 2000/60/EC and 2008/105/EC. Off. J. Eur. Union 2013, L 226, 1–17. Available online: https://eur-lex.europa.eu/eli/dir/2013/39/oj/eng (accessed on 18 March 2026).
  7. Qiu, M.; Liu, L.; Ling, Q.; Cai, Y.; Yu, S.; Wang, S.; Fu, D.; Hu, B.; Wang, X. Biochar for the removal of contaminants from soil and water: A review. Biochar 2022, 4, 19. [Google Scholar] [CrossRef]
  8. Komnitsas, K.A.; Zaharaki, D. Morphology of modified biochar and its potential for phenol removal from aqueous solutions. Front. Environ. Sci. 2016, 4, 26. [Google Scholar] [CrossRef]
  9. Xie, B.; Qin, J.; Wang, S.; Li, X.; Sun, H.; Wenqing, C. Adsorption of phenol on commercial activated carbons: Modelling and interpretation. Int. J. Environ. Res. Public Health 2020, 17, 789. [Google Scholar] [CrossRef]
  10. Patil, P.; Jeppu, G.R.; Vallabha, M.S.; Chikmagalur, R.G. Enhanced adsorption of phenolic compounds using biomass-derived high surface area activated carbon: Isotherms, kinetics and thermodynamics. Environ. Sci. Pollut. Res. 2024, 31, 67442–67460. [Google Scholar] [CrossRef]
  11. Al-Sareji, O.J.; Grmasha, R.A.; Meiczinger, M.; Al-Juboori, R.A.; Somogyi, V.; Hashim, K.S. A Sustainable Banana Peel Activated Carbon for Removing Pharmaceutical Pollutants from Different Waters: Production, Characterization, and Application. Materials 2024, 17, 1032. [Google Scholar] [CrossRef] [PubMed]
  12. Ruiz Lopez, M.A.; Ferreira, G.M.D.; Figueiredo, M.T.D.; Ferreira, G.M.D.; Franca, J.R.; Penido, E.S.; Soares, J.R.; Lobato, R.L.M.; Mageste, A.B. Mechanisms of phenol adsorption on banana leaves and coffee husk biochars. ACS Omega 2025, 10, 15989–16005. [Google Scholar] [CrossRef]
  13. Hairuddin, M.N.; Mubarak, N.M.; Khalid, M.; Abdullah, E.C.; Walvekar, R.; Karri, R.R. Magnetic palm kernel biochar potential route for phenol removal from wastewater. Environ. Sci. Pollut. Res. 2019, 26, 35183–35197. [Google Scholar] [CrossRef] [PubMed]
  14. Gholizadeh, A.; Kermani, M.; Gholami, M.; Farzadkia, M.; Yaghmaeian, K. Removal Efficiency, Adsorption Kinetics and Isotherms of Phenolic Compounds from Aqueous Solution Using Rice Bran Ash. Asian J. Chem. 2013, 25, 3871–3878. [Google Scholar] [CrossRef]
  15. Shen, Y. Rice husk-derived activated carbons for adsorption of phenolic compounds in water. Glob. Chall. 2018, 2, 1800043. [Google Scholar] [CrossRef]
  16. Kumar, L.; Hakeem, I.G.; Varathan, E.; Shah, K. Adsorption of phenol from aqueous solution using activated char synthesized by one-step and two-step KOH activation and pyrolysis of orange peel. Water Air Soil Pollut. 2025, 236, 803. [Google Scholar] [CrossRef]
  17. Urgel, J.J.D.T.; Briones, J.M.A.; Diaz, E.B., Jr.; Dimaculangan, K.M.N.; Rangel, K.L.; Lopez, E.C.R. Removal of Diesel Oil from Water Using Biochar Derived from Waste Banana Peels as Adsorbent. Carbon Res. 2024, 3, 13. [Google Scholar] [CrossRef]
  18. Environmental Protection Agency of the Republic of Serbia. Report on Waste Management in the Republic of Serbia for the Period 2011–2022; SEPA: Belgrade, Serbia, 2022. Available online: https://sepa.gov.rs/wp-content/uploads/2024/12/Otpad2011-2023.pdf (accessed on 18 March 2026).
  19. European Environment Agency. Bio-Waste in Europe—Turning Challenges into Opportunities; EEA: Copenhagen, Denmark, 2020; Available online: https://www.eea.europa.eu/en/analysis/publications/bio-waste-in-europe (accessed on 18 March 2026).
  20. European Commission. A European Strategy for Plastics in a Circular Economy; European Commission: Brussels, Belgium, 2018; Available online: https://research-and-innovation.ec.europa.eu/research-area/environment/circular-economy/plastics-circular-economy_en (accessed on 18 March 2026).
  21. Ministry of Environmental Protection of the Republic of Serbia. National Waste Management Strategy 2021–2030; Ministry of Environmental Protection: Belgrade, Serbia, 2021. Available online: https://www.ekologija.gov.rs/sites/default/files/2022-03/program_upravljanja_otpadom_eng_-_adopted_version.pdf (accessed on 18 March 2026).
  22. Circular Biocarbon. Demonstrating the Circular Economy Value of Organic Waste and Wastewater; Circular Biocarbon: Brussels, Belgium, 2022; Available online: https://circularbiocarbon.eu/ (accessed on 18 March 2026).
  23. Barrett, E.P.; Joyner, L.G.; Halenda, P.P. The determination of pore volume and area distributions in porous substances. I. Computations from nitrogen isotherms. J. Am. Chem. Soc. 1951, 73, 373–380. [Google Scholar] [CrossRef]
  24. Kaneko, K.; Ishii, C.; Ruike, M.; Kuwabara, H. Origin of superhigh surface area and microcrystalline graphitic structures of activated carbons. Carbon 1992, 30, 1075–1088. [Google Scholar] [CrossRef]
  25. Kaneko, K.; Ishii, C.; Kanoh, H.; Hanzawa, Y.; Setoyama, N.; Suzuki, T. Characterization of porous carbons with high resolution αs-analysis and low temperature magnetic susceptibility. Adv. Colloid Interface Sci. 1998, 76, 295–320. [Google Scholar] [CrossRef]
  26. Kruk, M.; Jaroniec, M.; Gadakaree, K.P. Nitrogen adsorption studies of novel synthetic active carbons. J. Colloid Interface Sci. 1997, 192, 250–256. [Google Scholar] [CrossRef]
  27. Ge, M.; Wang, X.; Du, M.; Liang, G.; Hu, G.; Alam, S.M.J. Adsorption analyses of phenol from aqueous solutions using magadiite modified with organo-functional groups: Kinetic and equilibrium studies. Materials 2019, 12, 96. [Google Scholar] [CrossRef]
  28. Langmuir, I. The adsorption of gases on plane surfaces of glass, mica and platinum. J. Am. Chem. Soc. 1918, 40, 1361–1403. [Google Scholar] [CrossRef]
  29. Freundlich, H.M.F. Over the adsorption in solution. J. Phys. Chem. 1906, 57, 385–471. [Google Scholar]
  30. Temkin, M.; Pyzhev, V. Kinetics of ammonia synthesis on promoted iron catalysts. Acta Physicochim. URSS 1940, 12, 217–222. [Google Scholar]
  31. Moreno-Castilla, C. Adsorption of organic molecules from aqueous solutions on carbon materials. Carbon 2004, 42, 83–94. [Google Scholar] [CrossRef]
  32. Mohan, D.; Sarswat, A.; Ok, Y.S.; Pittman, C.U., Jr. Organic and inorganic contaminants removal from water with biochar, a renewable, low-cost and sustainable adsorbent—A critical review. Bioresour. Technol. 2014, 160, 191–202. [Google Scholar] [CrossRef]
  33. Stumm, W.; Morgan, J.J. Aquatic Chemistry: Chemical Equilibria and Rates in Natural Waters, 3rd ed.; Wiley: New York, NY, USA, 1996. [Google Scholar]
  34. Abu Bakar, N.; Othman, N.; Yunus, Z.M.; Altowayti, W.A.H.; Al-Gheethi, A.; Asharuddin, S.M.; Tahir, M.; Fitriani, N.; Mohd-Salleh, S.N.A. Nipah (Musa acuminata balbisiana) banana peel as a lignocellulosic precursor for activated carbon: Characterization study after carbonization process with phosphoric acid impregnated activated carbon. Biomass Convers. Biorefin. 2023, 13, 11085–11098. [Google Scholar] [CrossRef]
  35. Khan, S.; Irshad, S.; Mehmood, K.; Hasnain, Z.; Nawaz, M.; Rais, A.; Gul, S.; Wahid, M.A.; Hashem, A.; Abd Allah, E.F.; et al. Biochar production and characteristics, its impacts on soil health, crop production, and yield enhancement: A review. Plants 2024, 13, 166. [Google Scholar] [CrossRef]
  36. Szymańska-Chargot, M.; Zdunek, A. Use of FT-IR Spectra and PCA to the bulk characterization of cell wall residues of fruits and vegetables along a fraction process. Food Biophys. 2013, 8, 29–42. [Google Scholar] [CrossRef]
  37. Techawinyutham, L.; Techawinyutham, W.; Mavinkere Rangappa, S.; Siengchin, S. Lignocellulose-based biofiller reinforced biopolymer composites from fruit peel wastes as natural pigment. Int. J. Biol. Macromol. 2024, 257, 128767. [Google Scholar] [CrossRef]
  38. Ling, Z.; Wang, T.; Makarem, M.; Cintrón, M.S.; Cheng, H.N.; Kang, X.; Bacher, M.; Potthast, A.; Rosenau, T.; King, H.; et al. Effects of ball milling on the structure and properties of cellulose. Cellulose 2019, 26, 305–328. [Google Scholar] [CrossRef]
  39. Santiago-Gómez, I.; Carrera-Lanestosa, A.; González-Alejo, F.A.; Guerra-Que, Z.; García-Alamilla, R.; Rivera-Armenta, J.L.; García-Alamilla, P. Pectin extraction process from cocoa pod husk (Theobroma cacao L.) and characterization by Fourier transform infrared spectroscopy. ChemEngineering 2025, 9, 25. [Google Scholar] [CrossRef]
  40. Gnanasambandam, A.; Proctor, A. Determination of pectin degree of esterification by diffuse reflectance Fourier transform infrared spectroscopy. Food Chem. 2000, 68, 327–332. [Google Scholar] [CrossRef]
  41. Goel, C.; Mohan, S.; Dinesha, P.; Rosen, M.A. CO2 adsorption by KOH-activated hydrochar derived from banana peel waste. Chem. Pap. 2024, 78, 3845–3856. [Google Scholar] [CrossRef]
  42. Canteri, M.H.G.; Renard, C.M.G.C.; Le Bourvellec, C.; Bureau, S. ATR-FTIR spectroscopy to determine cell wall composition: Application on a large diversity of fruits and vegetables. Carbohydr. Polym. 2019, 212, 186–196. [Google Scholar] [CrossRef] [PubMed]
  43. Jóźwiak, T.; Filipkowska, U.; Nowicka, A.; Kaźmierczak, J. Application of potato peels as an unconventional sorbent for the removal of anionic and cationic dyes from aqueous solutions. Materials 2026, 19, 185. [Google Scholar] [CrossRef] [PubMed]
  44. Hikal, W.M.; Said-Al Ahl, H.A.H.; Bratovcic, A.; Tkachenko, K.G.; Sharifi-Rad, J.; Kačániová, M.; Elhourri, M.; Atanassova, M. Banana peels: A waste treasure for human being. Evid.-Based Complement. Altern. Med. 2022, 2022, 7616452. [Google Scholar] [CrossRef] [PubMed]
  45. Salgado, N.; Silva, M.A.; Figueira, M.E.; Costa, H.S.; Albuquerque, T.G. Oxalate in foods: Extraction conditions, analytical methods, occurrence, and health implications. Foods 2023, 12, 3201. [Google Scholar] [CrossRef]
  46. Lippens, B.C.; Linsen, B.G.; de Boer, J.H. Studies on pore systems in catalysts I. The adsorption of nitrogen; apparatus and calculation. J. Catal. 1964, 3, 32–37. [Google Scholar] [CrossRef]
  47. Uchimiya, M.; Wartelle, L.H.; Klasson, K.T.; Fortier, C.A.; Lima, I.M. Influence of Pyrolysis Temperature on Biochar Property and Function as a Heavy Metal Sorbent in Soil. J. Agric. Food Chem. 2011, 59, 2501–2510. [Google Scholar] [CrossRef]
  48. Emenike, E.C.; Ogunniyi, S.; Ighalo, J.O.; Iwuozor, K.O.; Okoro, H.K.; Adeniyi, A.G. Delonix regia Biochar Potential in Removing Phenol from Industrial Wastewater. Bioresour. Technol. Rep. 2022, 19, 101195. [Google Scholar] [CrossRef]
  49. Scapin, E.; Maciel, G.P.S.; Polidoro, A.S.; Lazzari, E.; Benvenutti, E.V.; Falcade, T.; Jacques, R.A. Activated Carbon from Rice Husk Biochar with High Surface Area. Biointerface Res. Appl. Chem. 2021, 11, 10265–10277. [Google Scholar] [CrossRef]
  50. Ahiduzzaman, M.; Islam, A.K.M.S. Preparation of Porous Bio Char and Activated Carbon from Rice Husk by Leaching Ash and Chemical Activation. SpringerPlus 2016, 5, 1248. [Google Scholar] [CrossRef]
  51. Ajien, A.; Idris, J.; Sofwan, N.M.; Husen, R.; Seli, H. Coconut Shell and Husk Biochar: A Review of Production and Activation Technology, Economic, Financial Aspect and Application. Waste Manag. Res. 2023, 41, 37–51. [Google Scholar] [CrossRef]
  52. Teweldebrihan, M.D.; Gnaro, M.A.; Dinka, M.O. Adsorption of Phenol from Aqueous Solution Utilizing Activated Carbon Prepared from Catha edulis Stem. Environments 2025, 12, 314. [Google Scholar] [CrossRef]
  53. Li, Y.; Du, Q.; Liu, T.; Peng, X.; Wang, J.; Sun, J.; Wang, Y.; Wu, S.; Wang, Z.; Xia, Y.; et al. Comparative study of methylene blue dye adsorption onto activated carbon, graphene oxide, and carbon nanotubes. Chem. Eng. Res. Des. 2013, 91, 361–368. [Google Scholar] [CrossRef]
  54. Blanco-Martínez, D.A.; Giraldo, L.; Moreno-Piraján, J.C. Effect of the pH in the adsorption and in the immersion enthalpy of monohydroxylated phenols from aqueous solutions on activated carbons. J. Hazard. Mater. 2009, 169, 291–296. [Google Scholar] [CrossRef]
  55. Cho, E.-J.; Lee, C.-G.; Kang, J.-K.; Park, S.-J. Adsorption of phenol on kenaf-derived biochar: Studies on physicochemical and adsorption characteristics and mechanism. Biomass Convers. Biorefin. 2022, 14, 9621–9638. [Google Scholar] [CrossRef]
  56. Kuśmierek, K.; Świątkowski, A. Adsorption of Phenols on Carbonaceous Materials of Various Origins but of Similar Specific Surface Areas. Separations 2023, 10, 422. [Google Scholar] [CrossRef]
  57. Auta, M.; Hameed, B.H. Optimized waste tea activated carbon for adsorption of Methylene Blue and Acid Blue 29 dyes using response surface methodology. Chem. Eng. J. 2011, 186, 821–829. [Google Scholar] [CrossRef]
  58. Mesquita, M.S.; Tanabe, E.H.; Bertuol, D.A. Adsorption of Phenol Using Eucalyptus saligna Biochar Activated with NiCl2. Water Air Soil Pollut. 2024, 235, 311. [Google Scholar] [CrossRef]
  59. Bentis, A.; Ceron Daza, L.D.; Dia, M.; Koubaa, A.; Lega Braghiroli, F. Innovative Valorization of Wood Panel Waste into Activated Biochar for Efficient Phenol Adsorption. Appl. Sci. 2025, 15, 8518. [Google Scholar] [CrossRef]
  60. Bhatia, D.; Saroha, A.K. Biochar Derived from Pyrolysis of Rice Straw as an Adsorbent for Removal of Phenol from Water. J. Water Process Eng. 2024, 58, 105003. [Google Scholar] [CrossRef]
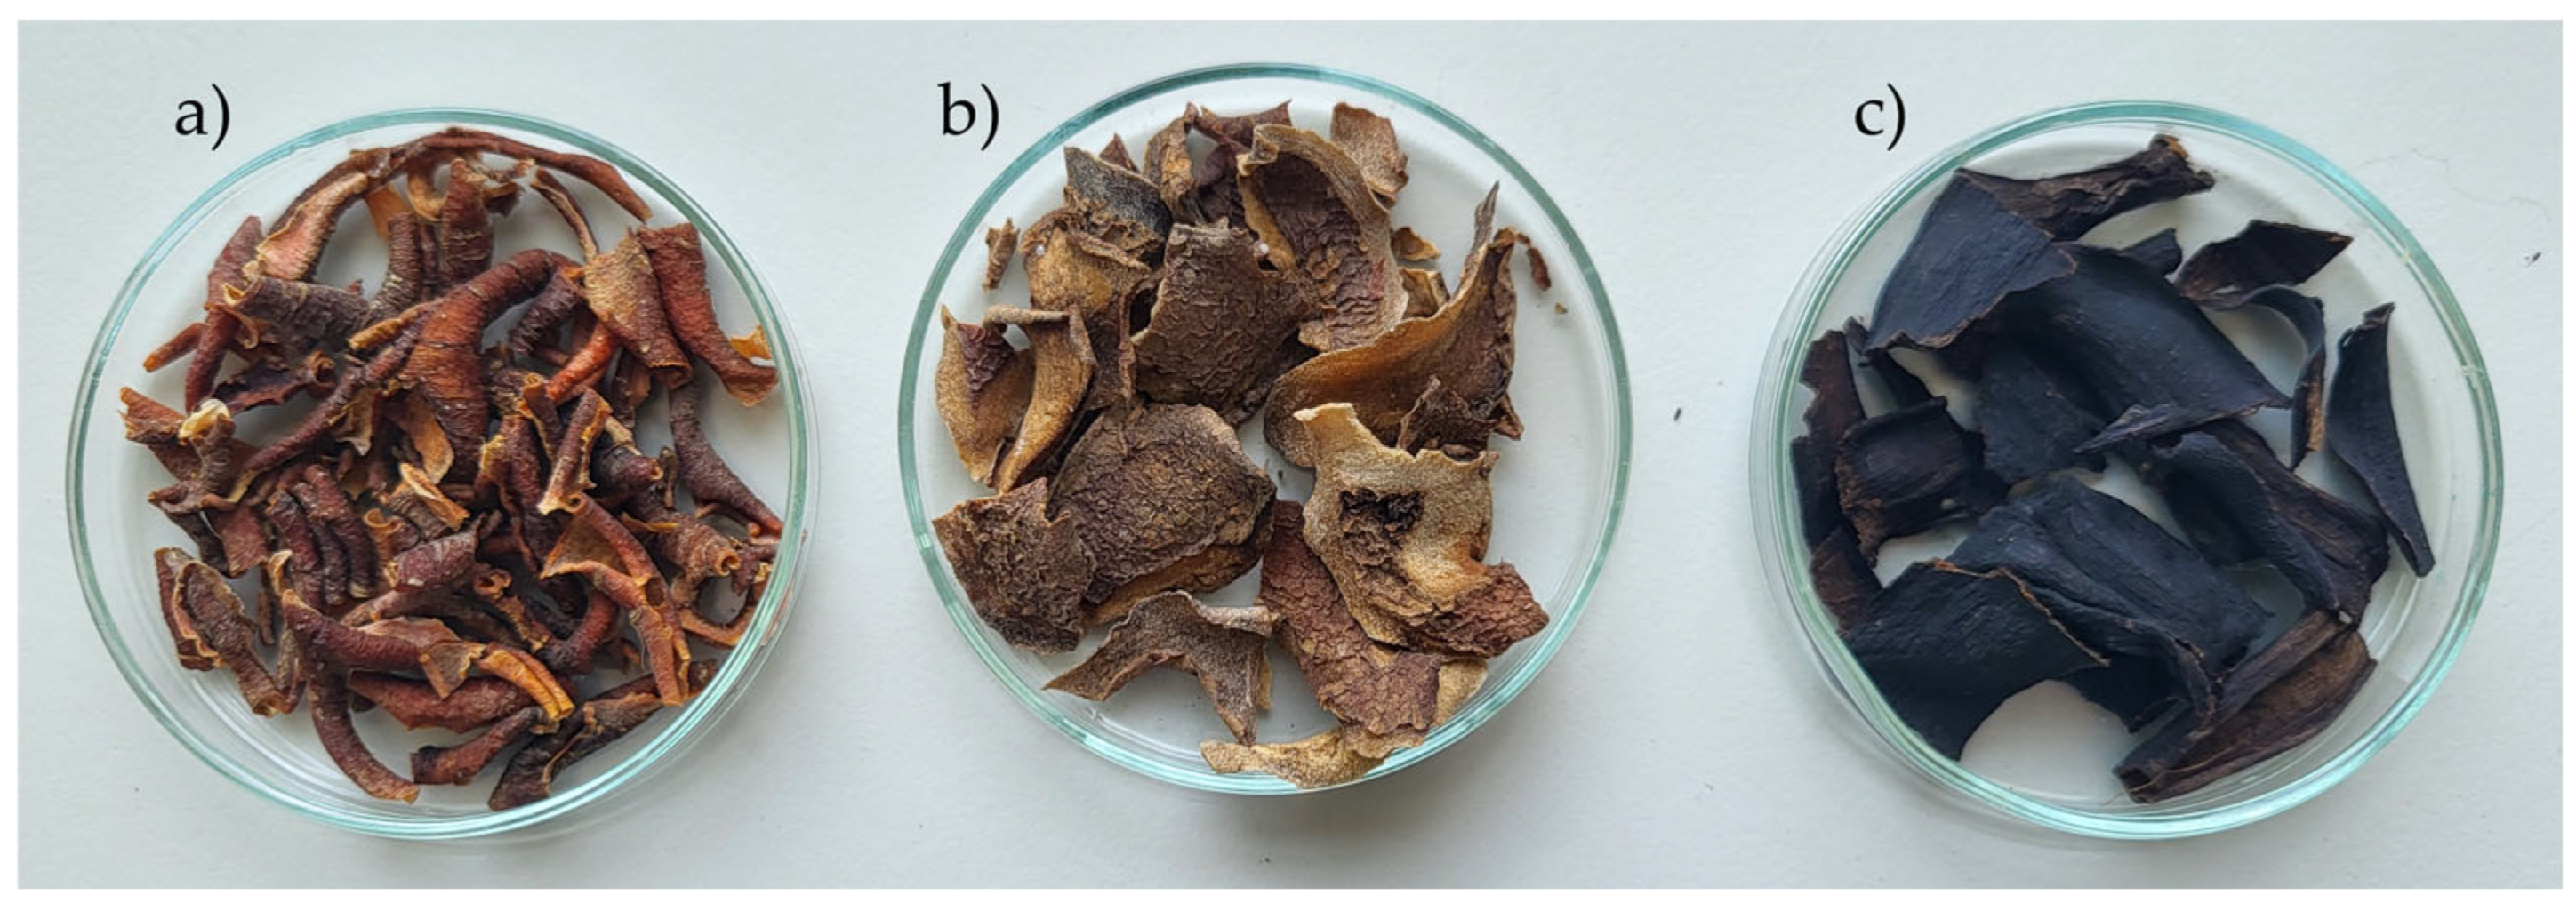
Figure 1. Washed and dried peels used as raw materials: a) carrots, b) potatoes, and c) bananas.
Water 18 01267 g001
Figure 2. Determination of the point of zero charge (pHpzc) of the CARB_BCP sample. The diagonal (linear interpolation) corresponds to the ideal line pHf = pHi (ΔpH = 0).
Water 18 01267 g002
Figure 3. SEM micrographs of the: a) RAW_BCP and b) CARB_BCP.
Water 18 01267 g003
Figure 4. The FTIR spectra of: a) RAW_BCP and b) CARB_BCP.
Water 18 01267 g004
Figure 5. Nitrogen adsorption isotherms, as the amount of N2 adsorbed as a function of relative pressure for the CARB_BCP sample. Solid symbols—adsorption; open symbols—desorption.
Water 18 01267 g005
Figure 6. Pore size distribution (PSD) for CARB_BCP sample.
Water 18 01267 g006
Figure 7. Influence of initial pH on the phenol removal by using CARB_BCP.
Water 18 01267 g007
Figure 8. Influence of initial phenol concentration on the adsorption capacity (qe) of CARB_BCP.
Water 18 01267 g008
Figure 9. Linear isotherms for phenol removal by CARB_BCP. a) Langmuir; b) Freundlich; c) Temkin model.
Water 18 01267 g009
Figure 10. Graphical illustration of the adsorption mechanism.
Water 18 01267 g010
Table 1. Porous properties of the CARB_BCP sample.
SampleSBET (m2/g)Smeso (m2/g)Smic (m2/g)Vmic (cm3/g)dav (nm)
CARB_BCP4831043790.19211.95
Table 2. Results of the preliminary tests of phenol removal.
SampleThe Carrot Peels (wt %)Potatoes Peels (wt %)Banana Peels (wt %)Adsorbed Amount (wt %)
CP100--91
PP-100-91
BP--10092
Carb_150252587
Carb_225502585
Carb_325255088
Carb_BCP33.333.333.392
Carb_RBCP33.333.333.358
Table 3. Parameters of Langmuir, Freundlich and Temkin isotherms for phenol removal by CARB_BCP.
SampleLangmuir Isotherm
CARB_BCPqmax,teor (mg/g)qmax,exp (mg/g)KL (dm3/mg)R2
186.92189.700.01120.96736
Freundlich isotherm
KF ((mg/g)(dm3/mg))1/nn1/nR2
6.412.040.490.85969
Temkin isotherm
B (mg/g)AT (dm3/mg)bT (J/mol)R2
24.361.51101.750.9562
Table 4. Statistical comparison of Langmuir, Freundlich and Temkin isotherm models.
Isotherm/ParameterSSERMSEχ2
Langmuir4377.5216.542088.49
Freundlich4875.9717.4678.77
Temkin9570.3024.46134.19
Disclaimer/Publisher’s Note: The statements, opinions and data contained in all publications are solely those of the individual author(s) and contributor(s) and not of MDPI and/or the editor(s). MDPI and/or the editor(s) disclaim responsibility for any injury to people or property resulting from any ideas, methods, instructions or products referred to in the content.