Abstract
In designing an optimized activated carbon-based adsorbent, several key factors are crucial for its practical application in the industrial sector, including high BET surface area, strong adsorption capacity, selectivity, mechanical and thermal stability, regeneration potential, environmental impact, and cost-effectiveness. This study explores the innovative approach of combining two chemical activating agents, potassium carbonate and sodium thiosulfate, to produce activated carbon with enhanced properties for improved mercury removal. At an activation temperature of 800 °C, the resulting adsorbent achieved a BET surface area of 2132.7 m2/g and a total pore volume of 1.08 cm3/g. Testing its mercury removal efficiency, the maximum adsorption capacity was 289 mg/g at room temperature. The Langmuir isotherm provided an excellent fit to the experimental data, indicating a monolayer adsorption process. Kinetic modeling revealed that the adsorption followed a pseudo-second-order model, consistent with chemisorption. The primary removal mechanism was found to involve complexation of mercury with oxygen and sulfur-containing functional groups, along with pore-filling physical adsorption. The adsorbent also showed a strong affinity for mercury even in the presence of other competing heavy metals. Furthermore, regeneration studies demonstrated the adsorbent’s effectiveness over five cycles. This research introduces a novel, environmentally friendly, and cost-efficient adsorbent for mercury removal.
1. Introduction
Mercury pollution is a critical environmental concern that presents high risks to the ecosystem and human health. Mercury, a naturally occurring heavy metal, is discharged into the environment through both anthropogenic and environmental activities. The widespread pollution of mercury is due to emissions originating from natural sources such as volcanic activities and human activities such as coal combustion, electronic waste, artisanal and gold mining, and other industrial operations [1,2]. Coal combustion is the largest single source of atmospheric mercury. Mercury is present in trace amounts in coal and is released as elemental mercury vapor when coal is burned. Common in coal-fired power plants, industrial boilers, and cement kilns [3]. Gold mining is also a major global source of mercury emissions. Mercury is used to form amalgams with gold, which are later heated to recover the gold—releasing mercury vapor in the process [4]. Chlor-alkali plants, metal smelting, and other chemical manufacturing facilities release mercury through wastewater discharges and air emissions [5]. As for natural sources, volcanos emit mercury naturally in the form of elemental and oxidized species, along with other trace metals [6]. Hydrothermal vents and hot springs can leach mercury from underground reservoirs into surface water or atmosphere [6]. What differentiates mercury from other contaminants is the fact that it is a persisting pollutant that remains in the environment for long periods of time [2]. Human exposure to mercury occurs through different routes, including seafood consumption, mercury vapor inhalation, and exposure in the workplace [7]. The central nervous system can be negatively impacted, resulting in cognitive deficits, developmental delays, and neurological illnesses [2]. Despite international efforts to regulate mercury emissions, challenges persist in the implementation of effective control measures. Thus, the removal of mercury from aquatic systems is a paramount task in worldwide environmental management.
The most often employed technologies for mercury removal are adsorption, membrane filtration, precipitation, and biological treatment [5]. Although applying membrane technologies for mercury removal is efficient, it requires high costs due to high energy demands [6,8]. Employing biological remedies is environmentally friendly and cost effective; however, it is a time-consuming strategy [4]. Mercury adsorption is a cost-effective method, sustainable, and highly efficient [9]. A lot of ongoing research is dedicated to developing new materials, namely those that exhibit high surface area, significant porosity, and active sites [10,11,12,13,14]. Activated carbon (AC) is recognized as a potential adsorbent for the removal of heavy metal ions from contaminated waters due to its exceptionally large BET surface area, extensive total pore volume, high acid stability, and mechanical strength [15]. The worldwide demand for AC is estimated to increase by 6% annually which is equivalent to 2 million metric tons by 2025 according to industry market research report [16]. However, the high cost of commercial AC is a major drawback to the utilization of AC in the industrial sector [14]. Thus, it is important to develop a cost-effective method for the production of AC with a high BET surface area to effectively reform mercury ions from wastewater bodies.
The low cost and availability of biomass waste for producing activated carbon, such as coconut shells, wood, or coal, can influence market dynamics. Walnut shell has been successfully used as a carbon precursor for the synthesis of AC [17,18]. According to the literature, AC produced by chemical activation has a greater BET surface area and total pore volume compared to AC produced by physical activation [19]. Several activating agents have been used for chemical activation processes and the ones that are often used include KOH [20], ZnCl2 [21], H3PO4 [22], and NaOH [23]. However, these activating agents generate toxic waste that contributes to environmental pollution. As of recent, a green and sustainable approach has taken the frontlines in the investigation of producing AC in an environmentally friendly manner. Chemical activating agents that are harmless and less toxic are now being extensively investigated in recent research works [17,18,19].
A prominent nontoxic chemical activating agent is potassium carbonate. Potassium carbonate, an alkaline inorganic salt, is known to create AC with high BET surface areas ranging from 700 to 2700 m2/g [24]. Kilic et al. prepared AC from euphorbia rigida using four different types of chemical activating agents including ZnCl2, K2CO3, NaOH, and H3PO4 [25]. It was reported that although K2CO3 had low carbon yields, it was the best performing activating agent in terms of surface morphology, porosity development, and high surface area under the same activating conditions. It is noteworthy that NaOH failed as a chemical activating agent where no pores were created, rather surface deformation and poor surface area were generated. Similar to carbonate salts, sulfates also have the ability to oxidize carbon at temperatures exceeding 300 °C generating highly porous AC samples [24]. Sulfates are notorious for producing AC with BET surface areas that are not as high as AC produced by carbonates; however, they are known to generate higher carbon yield with a more structured and sturdier AC material [3].
Low-cost carbon resources coupled with a green process for the production of AC are two essential ingredients to further increase and expand AC production and usage into various fields outside the water treatment industry. Our study presents an innovative method for producing activated carbon by utilizing a binary-salt activating agent, created through the combination of potassium carbonate and sodium thiosulfate. The purpose is to create AC with a high BET surface area and high carbon yield by incorporating two inorganic salts via a simple one-step chemical activation approach using walnut shells as carbon precursors. The synthesized AC was subsequently examined for its efficacy in the removal of mercury from aqueous solutions. The adsorption process was investigated through batch isotherms at several operational parameters such as contact time, solution pH, temperature, and mass dosage. In addition, the mechanism of adsorption was discussed and presented. The effect of competing ions and regeneration studies were investigated as well.
2. Materials and Methods
2.1. Chemicals and Walnut Shells
Walnut shells were obtained from a local supermarket in Doha, Qatar. Standard mercury stock solutions of 1000 ppm were purchased from Inorganic Ventures (Christiansburg, VA, USA) and kept at a temperature of 5 °C. Analytical high-quality anhydrous potassium carbonate (99.99%) was purchased from BDH Chemicals (Dubai, United Arab Emirates). High-purity sodium thiosulfate (laboratory reagent grade) was obtained from Fisher Scientific (Newington, NH, USA).
2.2. Synthesis of Composite Activated Carbon (CAC)
Walnut shells were thoroughly washed to remove any adhering dirt and then dried overnight in an oven. Afterward, the shells were crushed into particles ranging from 0.75 to 1 mm in size. Activated carbon (AC) was produced through a one-step chemical activation process using the wet method, where the walnut shells were combined in desired quantities, potassium carbonate (5 g) and sodium thiosulfate (10 g) were combined at different impregnation ratios. The impregnation ratio was then selected based on the resulting BET surface area and carbon yield. The combined walnut shell and salt mixture is then mixed with distilled water and heated on a magnetic stirrer (100 °C) until a slurry material is observed. The sample is then inserted into an oven at a temperature of 105 °C for 24 h to fully vaporize any moisture content. Next, the resulting sample is inserted into a Nabertherm horizontal furnace. Pyrolysis was conducted under nitrogen gas flow with a flowrate of 100 mL/min, activation temperature of 800 °C, 1 h residence time, and a heating rate of 5 °C/min. These activation conditions were optimized according to our previous research studies [26,27].
As for the washing step, only deionized water was used. The sample was repeatedly washed to remove the remaining residues until neutral conditions were achieved. The final product was then inserted into an oven at 105 °C overnight until the water content was vaporized, and the sample was stored for further use.
2.3. Characterization of CAC
All characterization techniques employed in this study and their description are included in Appendix A.1. information on characterization techniques.
2.4. Batch Adsorption Experiments and Fitting Models
To assess the effectiveness of the adsorbent, a series of batch isotherm tests were performed. Contact time experiments were also conducted to determine the equilibrium time. The experiments took place with three different initial concentrations of mercury, including 10, 50, and 100 ppm. A mass of adsorbent of 0.02 g was added to a volume of mercury solution of 50 mL in airtight sealed conical flasks. The flasks were placed on a bench-mounted horizontal mechanical shaker and stirred at 180 RPM for specific intervals to establish equilibrium time. To determine the optimal pH, the solution’s pH was adjusted between 2 and 10 by adding either HCl or NaOH. The effect of increasing the adsorbent dosage was evaluated by varying the amount used between 0.01 g and 0.07 g. Finally, equilibrium studies were conducted with initial mercury concentrations ranging from 10 to 100 ppm, while the solution temperature was varied from room temperature to 55 °C using an incubator. Prior to each experiment, fresh mercury stock solutions were diluted to the desired concentration from the 1000 ppm stock solution. Experiments were conducted at room temperature except for when temperature is the varied parameter.
The method for mercury analysis, along with the equations used to calculate mercury removal percentage and adsorption capacity, can be found in Appendix A.2. Additionally, the isotherms and kinetic models employed in this study are also detailed in Appendix A.2.
2.5. Effect of Competing Heavy Metals
The impact of competing heavy metals was examined by introducing ions such as zinc, cadmium, and lead alongside mercury. A stock solution of 100 ppm for each ion was prepared, and batch experiments were carried out similarly to the primary adsorption tests. A 0.02 g sample of the adsorbent was mixed with 50 mL of the stock solution in sealed volumetric flasks and agitated on a shaker for 24 h.
2.6. Regeneration Experiments
The regeneration experiments were conducted using two regenerative effluents. HCl and ethylenediaminetetraactic acid (EDTA) were used at a concentration of 1 M each. The mercury-loaded adsorbent was mixed with 50 mL of each effluent in a sealed volumetric flask and agitated on a mechanical shaker for 24 h. The adsorbents were filtered and air dried, after which they were used for another mercury adsorption experiment. The process was repeated for five cycles.
3. Results
3.1. Activation Mechanism
In the activation process, two main activating mechanisms took place. The first is based on the porogenic action of K2CO3 according to reactions presented in Equations (1)–(4) [23]. In the reaction in Equation (1), carbon is oxidized to CO, creating voids in the process. It is noteworthy to mention that the element potassium has the ability to intercalate within the carbon layers disrupting the internal structure of the carbon matrix, thereby generating additional pores and voids in the carbon precursor [28]. At temperatures reaching up to 800 °C, the reaction in Equation (2) occurs where K2CO3 slowly decomposes, and CO2 further reacts with C according to the reaction in Equation (3), also creating more pores or enlarging existing ones. A schematic diagram of the activating process is presented in Figure 1.
K2CO3 + 2C → 2K + 3CO
K2CO3 → K2O + CO2
C + CO2 → 2CO
K2O + C → 2K + CO

Figure 1.
Schematic representation of the activation mechanism using K2CO3.
The detailed activating mechanism pertaining to Na2S2O3 was reported by Fuertes et al. according to reactions in Equations (5) and (6) [29]. Reaction in Equation (5) happens at temperatures above 250 °C, while reaction in Equation (6) occurs beyond 750 °C. And finally, the Na2S particles are then removed during the washing process.
4Na2S2O3 → 3Na2SO4 + Na2S5
Na2SO4 + xC → Na2S + porous carbon + yCO/CO2
3.2. Characterization of CAC Before and After Adsorption of Mercury
From our previous research studies, AC produced using K2CO3 had a BET surface area of 1046.28 m2/g while Na2O2S3 produced an AC sample with a lower BET surface area of 451.08 m2/g [25]. In this research study, the effect of combining both activating agents to produce AC that harbors both characteristics together was demonstrated. Four impregnation ratios were varied while maintaining the same activation temperature. Table 1 represents the different impregnation ratios that were carried out along with their respective BET surface area, pore volume, pore diameter, and carbon yield. The resulting BET surface areas pertaining to the composite activated carbon (CAC) are substantially higher than AC activated with potassium carbonate and AC produced from sodium thiosulfate in all four different impregnation ratios. This shows that the combined effect of both activating agents enhanced the activation process beyond what either agent could achieve individually. This synergy effect led to a highly porous structure. The impregnation ratio 1:1:2 was selected to produce CAC for the adsorption experiments as it created the highest BET surface area of 2132.7 m2/g while maintaining an acceptable carbon yield.

Table 1.
The effect of the impregnation ratio (IR) of CAC on BET surface area and carbon yield at 800 °C.
The surface characteristics of CAC were attained from the N2 adsorption/desorption isotherms and presented in Figure 2. The N2 isotherms observed in Figure 2a suggest a type II characteristic, which according to the IUPAC classification convention is a mesoporous system [30]. For further confirmation, Figure 2b illustrates the average pore size distribution, which falls within the mesopore range (the average pore diameter is 2–3 nm) [31].
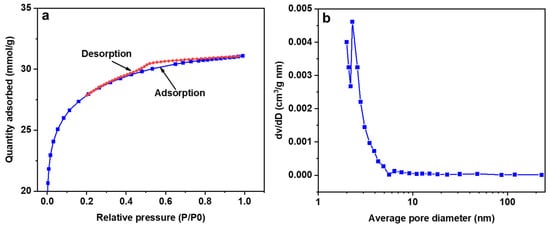
Figure 2.
N2 adsorption/desorption isotherms (a) average pore diameter for CAC (b).
Figure 3a,b illustrate the comparison of the surface morphology between walnut shells pyrolyzed at 800 °C without chemical impregnation (Figure 3a) and with chemical impregnation with Na2S2O3 and K2CO3 (Figure 3b). It is evident from Figure 3 that an apparent morphological change occurred due to the presence of Na2S2O3 and K2CO3. Figure 3a shows a smoother surface that has no visible pores, while Figure 3b exhibits a sponge-like surface that is rich with pores. This porous material is a result of the combined effect of using dual inorganic salts during the activation process. Kilic et al. produced AC using K2CO3 and reported that the SEM images revealed a sponge-like morphology [24]. On the other hand, Altinci and Demir reported the synthesis of AC for the production of carbon electrodes from pistachio shells via chemical activation with Na2S2O3 and the SEM images revealed a sponge-like structure with irregular scale porosity that suggests a hierarchically porous material with an interconnected 3D framework which is similar to what is depicted in Figure 3b [32].
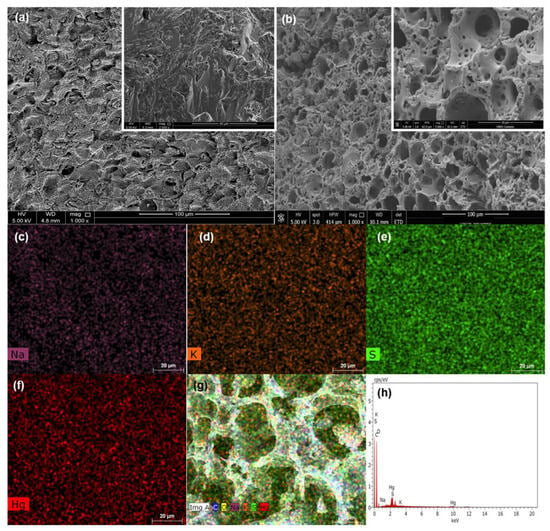
Figure 3.
SEM analysis of WS carbonized at 800 °C without chemical impregnation (a) and after chemical impregnation with Na2S2O3 and K2CO3 (CAC) (b). EDX element mapping of Na (c), K (d), S (e), Hg (f), and total elements after adsorption (g); EDX spectrum after adsorption (h).
The EDX elemental mapping, depicted in Figure 3c–g, illustrates the spatial distribution of certain elements and the general elemental composition. The effectiveness of the activation process utilizing Na2S2O3 and K2CO3 is confirmed by the EDX analysis, which shows an even distribution of the following elements including sodium (Na), potassium (K), and sulfur (S) on the surface of CAC. In addition, the EDX spectra shown in Figure 3h displays a peak that corresponds to mercury, demonstrating its removal from the solution and its adsorption onto the surface of CAC.
Two XRD patterns referring to AC without chemical impregnation and CAC (IR 1:1:2) are presented in Figure 4a. Activated carbon (CAC) is predominantly made up of amorphous carbon, which has a disordered structure. As a result, XRD patterns of AC typically do not exhibit distinct diffraction peaks [33]. The XRD patterns illustrate two distinct peaks at 25° and 44°, which correspond to the (002) and (101) reflections of the AC material, respectively. It is noted that the intensity of the peak after impregnation has decreased and broadened in comparison to the peak pertaining to AC without chemical impregnation, indicating a reduction in the crystallinity of AC post chemical impregnation. The thermal decomposition behavior of CAC was assessed and presented in Figure 4b. From the TGA plot, volatile matter, fixed carbon, ash content, and moisture content were determined and displayed in Table 2. AC is characterized by low ash content and high fixed carbon content, which is evident by 2.06% low ash content and 62.46% carbon content in CAC. From the TGA plots, the first mass loss took place starting at 105 °C due to the vaporization of moisture as CAC may absorb water. The second mass drop is due to thermal decomposition of the sample between 200 and 600 °C. From a thermal stability point of view, CAC exhibited a high thermal stability as the mass remained almost constant until 600 °C, after which a slight decrease in carbon content was observed.
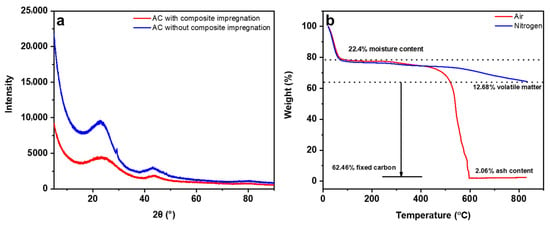
Figure 4.
XRD pattern of adsorbent with and without chemical impregnation (a), TGA of CAC (b).

Table 2.
Proximate analysis of CAC.
The XPS technique was utilized to examine the binding energy and chemical composition of CAC. Figure 5 shows high-resolution XPS spectra of C 1s, O 1s, S 2p, and Hg 4f. Figure 5a revealed that the major peak at 284.5 eV in C 1s consists of the following groups: carbonyl groups (287.7–289.0 eV), carboxyl group (2891.5–292.3 eV), and aromatic/graphitic groups (285.3–285.4 eV) [34]. The major peak in O 1s consists of oxygen in carbonyl (530.1–530.6 eV) and carboxylic groups (533.7–533.8 eV) [34]. The high resolution of S 2p plot exhibits two doublets, the lower and high intensity doublet. The lower doublet is attributable to sulfur from thiophene groups (164.2 and 165.4 eV) and the high intensity one refers to oxidized sulfur (168.1 and 169.3 eV) [29]. The mercury adsorbed onto CAC showed two district peaks at 99.7 and 103 eV which indicate that mercury is in Hg2+ oxidation state.
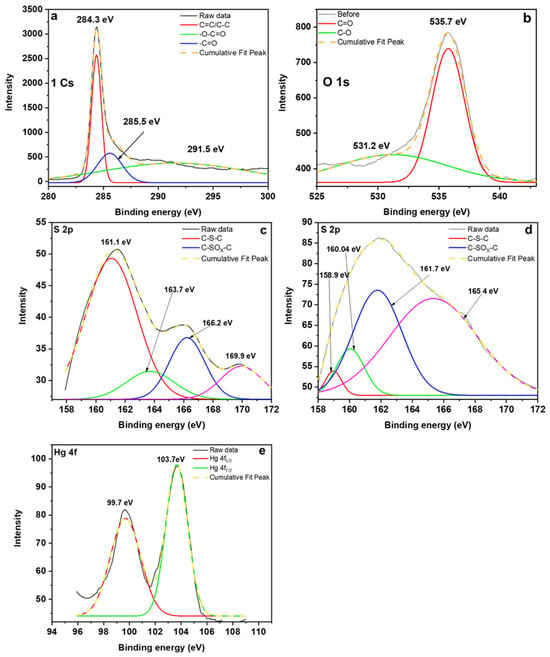
Figure 5.
High-resolution XPS spectra of C 1s (a), O 1s (b), S 2p before (c) and after (d) adsorption, and Hg 4f after adsorption (e).
3.3. Investigation of Parameters
3.3.1. Effect of pH and Adsorbent Dosage
The pH of the solution plays a crucial role in the adsorption of mercury. The impact of pH variation on adsorption has been examined across a pH range of 2 to 11 and is displayed in Figure 6a. According to the diagram, Qmax was observed at pH 2. There was a slight decrease in adsorption capacity between pH 3 and 4, and from pH 4 to 8, the adsorption capacity remained constant. However, a significant decrease occurred at higher pH levels. These results demonstrate that the process of removing mercury is highly efficient when the pH level is between 2 and 8. This result indicates that electrostatic attractions do not play a role in the adsorption mechanisms. This is because low pH values result in the presence of hydronium ions that act as barriers and compete with mercury ions for adsorption sites thus leading to poor uptakes of mercury. The significant decline in removal in the alkaline zone is related to the prevalence of Hg(OH)2 as the main mercury species at high pH levels [35].
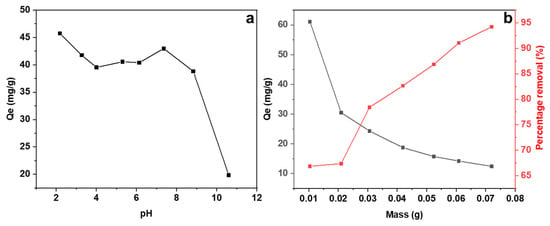
Figure 6.
Effect of pH (a) and mass dosage (b) on the adsorption of mercury onto CAC with 100 ppm initial mercury concentration at 180 RPM at room temperature.
The dosage of adsorbent is also a crucial factor in the removal of mercury. Figure 6b illustrates the impact of increasing the mass dosage on the adsorption of mercury. It has been observed that as the mass dosage of CAC increases, the adsorption capacity decreases, but the percentage removal increases. This is because the adsorbent’s pores are not being used effectively at greater doses. Economically speaking, this offers a benefit as the same quantity of mercury can be eliminated using smaller amounts of mass.
3.3.2. Effect of Initial Concentration and Contact Time
The study examined the adsorption of mercury ions at various initial concentrations (10, 50, and 100 ppm) and analyzed the results in Figure 7. It was observed that it took around 4 h for equilibrium to reach at all three different initial concentrations. It was also noted that the rate of removal increased at the higher initial concentration of mercury. A rapid removal occurred within the first hour where 60–70% of mercury was removed reaching almost 50% of the maximum adsorption capacity and then gradually reaching a plateau. The early stage is characterized by a quick removal process, which can be attributed to the abundance of accessible vacancies for adsorption. Subsequently, a gradual rise is observed as these sites become occupied [36]. Figure 7 illustrates that the effectiveness of removing mercury ions is dependent on the initial concentration of mercury. The adsorption capacity increases as the initial concentration of mercury increases. These results are similar to the results reported by Zhu et al. [37].
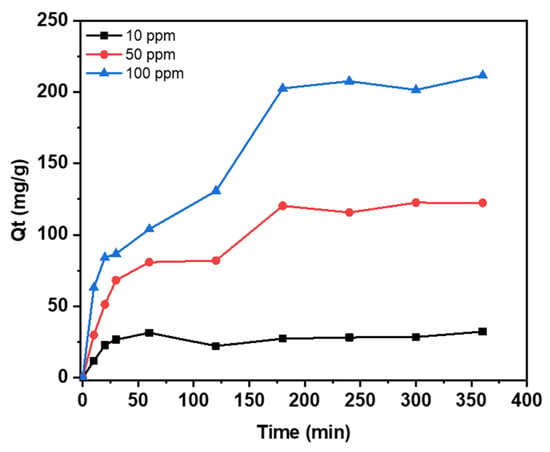
Figure 7.
The influence of contact time on the mercury adsorption at various initial concentrations. Experiments are conducted at an agitation speed of 180 RPM and room temperature.
3.4. Adsorption Isotherms
From a system engineering perspective, a thorough analysis of the adsorption isotherm is crucial. Three isotherm models were carried out including Langmuir, Freundlich, and Temkin models. The best fitting model was selected based on how close the correlation coefficient (R2) is to unity and the low bias of the chi-squared value (χ2) and the root mean square error (RMSE). The isotherms were fitted through the non-linear method using Origin Pro 2018.
The mercury adsorption isotherms are given in Figure 8 and were performed at four different temperatures. Table 3 lists all adsorption parameters for all temperatures. From Table 3, the experimental data fits the Langmuir model very adequately according to the relatively high R2 values and low χ2 and RSME values. The maximum adsorption capacity was determined and found to be 289 mg/g. This shows that the distribution of mercury ions over CAC follows the monolayer adsorption distribution profile over a homogenous surface [38]. According to Treybal, if the values of n lie between 1 and 10, this is an indication that the adsorption of mercury onto CAC is favorable [39]. In addition, a dimensionless constant known as the separation factor and denoted by RL, defined by Webber and Chakkravorti, was calculated for all four temperatures and the values are between 0 and 1, indicating that the adsorption process is also favorable [40]. Sajjadi et al. reported the use of AC prepared from pistachio shells for the adsorption of mercury ions [15]. The removal of mercury ions also followed the Langmuir isotherm model.
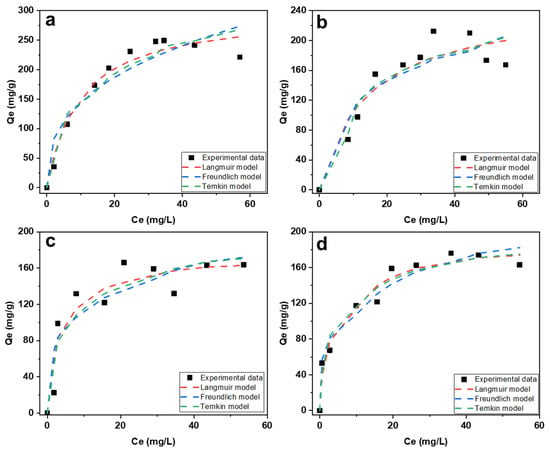
Figure 8.
Applied isotherms fitted into experimental data with concentrations in the range of 10 to 100 ppm at room temperature (a), 35 °C (b), 45 °C (c), and 55 °C (d) at 180 RPM.

Table 3.
Parameters of the isotherms applied.
3.5. Adsorption Kinetics
Understanding how fast pollutants stick to a material is key. Adsorption kinetic models help us achieve this by describing the basic rules of interaction between molecules and surfaces, allowing us to predict the speed of the adsorption process [41]. Four kinetic models have been utilized including pseudo-first and -second order, Elovich and intraparticle diffusion, and the results are displayed in Figure 9. The fitting accuracy of the kinetic models was assessed according to R2, χ2, and RMSE values. The parameters obtained for all kinetic models are depicted in Table 4. According to the R2 values, all three models fit the experimental data adequately. Upon examining the χ2 and RSME values, it was determined that the pseudo-second-order model provided the most accurate match. The adsorption behavior of mercury onto CAC is best described by the pseudo-second-order model, which states that chemisorption is involved in the adsorption process [42]. It is observed that K1 and K2 rate constant values decrease with concentration indicating that the adsorption system is concentration dependent [43]. The Elovich model also exhibits a strong correlation with the experimental data and it is known to describe chemisorption as well [44].
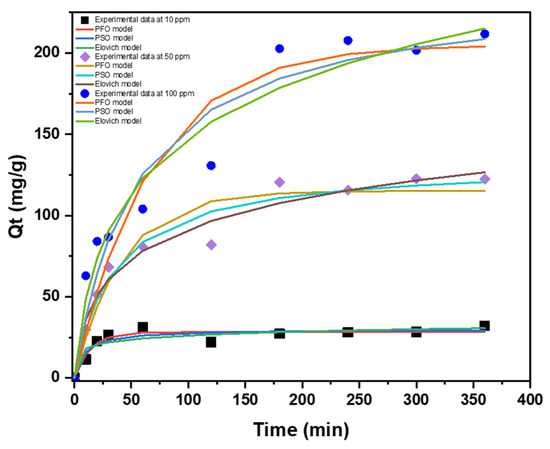
Figure 9.
Applied kinetic models fitted into experimental data with initial concentrations 10, 50, and 100 ppm at room temperature at 180 RPM.

Table 4.
Kinetic models’ parameters for the adsorption of mercury onto CAC at three different initial concentrations, 10, 50, and 100 ppm.
A graph of qt versus t 0.5 is shown in Figure A1 for the intraparticle diffusion model. The plotted data are linear, do not possess an intercept and do not pass through the origin. This is an indication that intraparticle diffusion is involved in the adsorption process; however, it is not the rate-controlling step [15]. In addition, the intraparticle diffusion plots exhibit multi-linearity suggesting that the adsorption of mercury took place by several mechanisms simultaneously [45].
3.6. Adsorption Thermodynamics
The study examined the adsorption of mercury onto CAC at different temperatures as this parameter can greatly impact the adsorption process of mercury. The results are displayed in Figure 10, while the thermodynamic properties, such as Gibbs free energy (ΔG°), standard enthalpy (ΔH°), and standard entropy (ΔS°), are listed in Table 5. The calculation of the Gibbs free energy involves the direct utilization of Equation (7). To determine how much heat is absorbed or released (enthalpy change) and how disorder changes (entropy change) in an adsorption process, a graph is plotted. This graph shows the natural logarithm of the equilibrium constant (ln Kc) versus the inverse of temperature (1/T). The slope and intercept of this graph provide values that are needed, as described in Equation (8). But first, the Kc constant needs to be calculated depending on the model that best describes the experimental data [46]. The Langmuir model provided the most accurate representation of the adsorption process in this research investigation. Consequently, the KC value was computed using Equation (9), utilizing the Langmuir constant as suggested by [45].
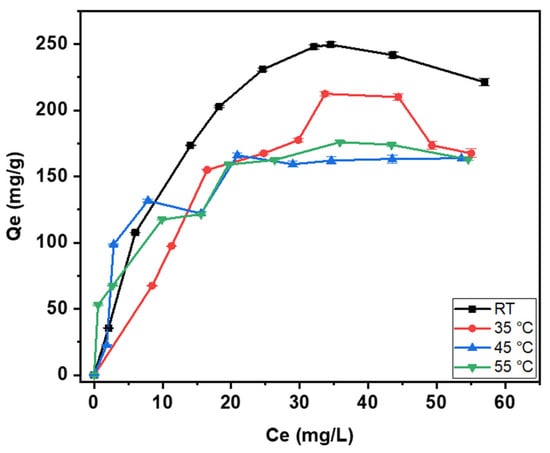
Figure 10.
Temperature change on the removal of mercury by CAC.

Table 5.
Calculated thermodynamic parameters.
According to the obtained results, the adsorption process is unfavorable at higher temperatures as lower adsorption capacities were attained. The exothermic nature of the adsorption of mercury onto CAC is also demonstrated by the results in Table 5 where the enthalpy (ΔH°) of the adsorption process is negative, indicating that energy is released into the system. Mohan et al. have reported a similar conclusion, stating that the adsorption of mercury onto activated carbon generated from fertilizer waste is exothermic in nature [47]. This behavior is related to the physical adsorption mechanism of mercury onto CAC, indicating weak forces of attraction between the surface of CAC and mercury. The negative value of the Gibbs free energy (ΔG°) shows that the adsorption process is spontaneous in nature in conjunction to what is reported by [41,48]. Moreover, the entropy change (ΔS°) results in a positive value, indicating an improvement in randomness at the interface between the mercury ions and the surface of CAC [49]. Given that the numerical value of the entropy change is the highest among all three thermodynamic parameters, this indicates that the adsorption process is driven by randomness, as opposed to temperature. Therefore, the process is said to be “entropy-driven” because the increase in randomness is the main thermodynamic factor pushing the adsorption to occur spontaneously.
Operating at higher temperatures does not provide any extra advantages in terms of adsorption efficiency from a practical standpoint. Hence, optimizing the process involves maintaining the temperature at or near ambient temperature, which leads to reduced energy consumption and lower manufacturing expenses.
3.7. Adsorption Mechanism
The adsorption mechanism of mercury onto CAC was intricate and it involved several distinct mechanisms that can be generally categorized into physisorption or chemisorption. It is evident from the SEM images that micropores exist within the mesopores on the surface of CAC; consequently, this paves the path for the pore-filling mechanism (physical adsorption) to take place. Essentially, the pore-filling technique depends entirely on the size of the pores and the size of the target contaminant [50]. If the size of the pore is greater than the size of the adsorbate, then this maximizes the amount of the contaminant captured, leading to a higher adsorption capacity. Looking into mercury’s ionic radius, it is reported that it is about 116 pm (picometer) [49]. This number is smaller than CAC’s pore sizes that are within the mesoporous range as indicated by CAC’s average pore size diameter distribution pattern in Figure 3. Thus, it is safe to assume that the pore-filling mechanism took place during the adsorption process.
The XPS characterization results clearly demonstrated that the presence of oxygen and sulfur groups led to an increase in intensity and a shift in the binding energy of the peaks observed in the oxygen and sulfur XPS spectra. The mechanism of mercury adsorption by oxygen and sulfur functional groups can be elucidated by the Lewis properties of mercury ions, which form bonds with the basic functional groups on the surface of the adsorbent material [51]. The strong affinity of sulfur elements for mercury ions leads to the formation of a complexation bond through electron donation, which anchors the mercury ions [52]. In addition, the inclusion of oxygen groups, such as COO- and C=O, also significantly influences the adsorption process. The oxygen-containing functional groups on the adsorbent’s surface have a tendency to release their protons and become ionized. This leads to an uneven distribution of electric charge on the surface of the adsorbent, enabling the exchange of ions with mercury ions [53]. Proposed mechanisms for the removal of mercury are summarized and presented in Figure 11.
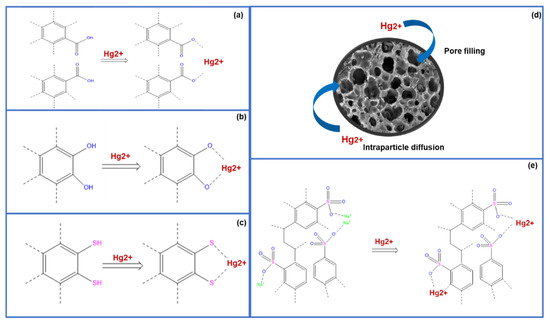
Figure 11.
Suggested mechanisms for the removal of mercury using CAC. The removal of mercury through a carboxylic group (a), a phenolic group (b), and sulfur-containing functional groups (c–e). The removal of mercury through the pore-filling mechanism.
3.8. Impact of Other Heavy Metals in Solution
Figure 12 illustrates the impact of additional heavy metal ions on the solution. The adsorption capacities in descending order are Hg2+ at 103.3 mg/g, Pb2+ at 43.2 mg/g, Zn2+ at 33.03 mg/g, and Cd2+ at 19.78 mg/g. Mercury was removed by approximately 45%, whereas the other ions had significantly lower removal percentages. The strong affinity for mercury is due to the sulfur-containing functional groups effectively trapping mercury ions from the solution. Lead ions exhibited the highest adsorption capacity and percentage removal after mercury, and this is attributed to the fact that lead ions have a high affinity towards oxygen-containing functional groups, allowing the formation of complexes on the surface of CAC. Essentially, this test demonstrates that the presence of other heavy metal ions in the solution has minimal impact on the removal of mercury from the solution using CAC.
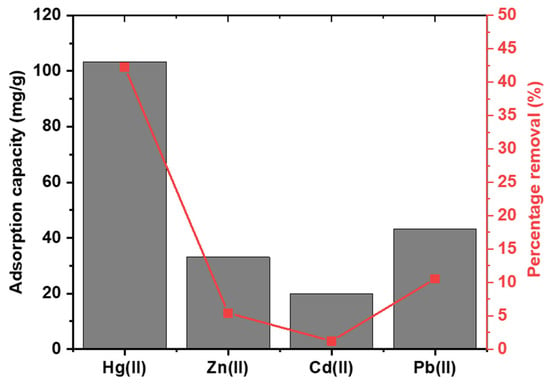
Figure 12.
The impact of competing heavy metals on the removal of mercury on CAC from water.
3.9. Regeneration Studies
Regeneration studies were conducted using two chemical effluents including HCl and ethylenediaminetetraacetic acid (EDTA), and the results are presented in Figure 13. The results demonstrate CAC’s high degree of recyclability. As more cycles were performed, the percentage removal decreased in comparison to its original value. A 20% removal was attained by the absorbent after five cycles. EDTA is an excellent chelating agent, especially for divalent ions due to its ability to form stable complexes with these ions [54]. This strong binding affinity makes it effective at removing heavy metal ions. In contrast, HCl performed poorly as it was only able to retain about 5% of percentage removal after only three cycles.
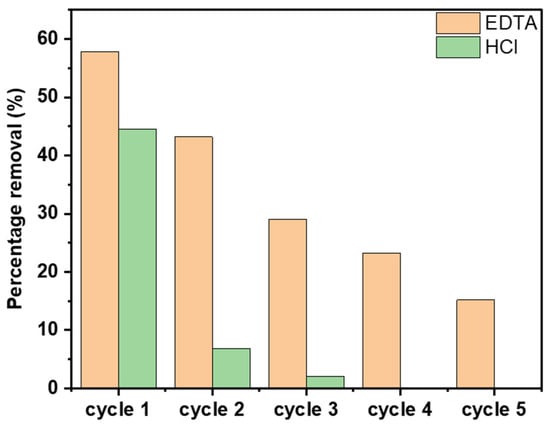
Figure 13.
Regeneration of CAC using 1 M EDTA and HCl.
3.10. Comparison with Other Adsorbents
When performing a comparison among different AC adsorbents for mercury removal, several key elements were considered, including BET surface area, initial concentration of mercury, surface chemistry, and the maximum (Langmuir) adsorption capacity. Table 6 displays different studies related to the removal of mercury using AC produced from different precursors and activated with different chemical activating agents. From the data presented, it is deduced that the AC precursor has minimal effect on the maximum mercury adsorption. Guo et al., experimented with three different commercial AC samples from three different carbon precursors, including peach stone, coal, and coconut husk [55]. The Langmuir maximum adsorption capacity fell within the range of 44.9–59.5 mg/L and the removal efficiencies reached up to 94.1–99.5% for all three adsorbents. The numbers show insignificant differences between the lowest and highest performing adsorbents. The BET surface areas and activating agents given in Table 5 illustrate that there is a strong correlation between these two entities and the mercury maximum adsorption capacities. This emphasizes the role of both physisorption and chemisorption mechanisms. Given that BET surface area is greatly tied to porosity, pore filling is partly responsible for the adsorption of mercury as implied by the trend that is seen where higher BET surface areas yield higher adsorption capacities. The activating agent is also hugely responsible for large BET surface areas and high adsorption of mercury. The BET surface area (2132.7 m2/g) and the Langmuir maximum adsorption capacity pertaining to CAC (289 mg/g) is relatively high in comparison to values of other synthesized AC in the literature. This highlights the combined and synergetic effect of both K2CO3 and Na2S2O3 activating agents.

Table 6.
Comparative study of AC-based adsorbents for the adsorption of mercury ions.
4. Conclusions
This study successfully demonstrated the synthesis of a highly efficient carbonaceous adsorbent (CAC) from walnut shells. The chemical activation method, utilizing K2CO3 and Na2S2O3 as inorganic activating agents, was successfully employed for mercury removal from aqueous solutions. The CAC demonstrated superior adsorption performance compared to activated carbon produced using a single activating agent. The synthesized adsorbent exhibited a BET surface area of 2132.7 m2/g and a total pore volume of 1.0835 cm3/g, slightly exceeding values reported in the literature. The maximum adsorption capacity reached 289 mg/g at room temperature. The adsorption behavior followed the Langmuir isotherm and pseudo-second-order kinetic models, while thermodynamic analysis indicated that the process was spontaneous and exothermic. As for the mechanism of removal, the removal of mercury was facilitated through the formation of complexes with oxygen- and sulfur-containing functional groups, along with other mechanisms involving pore filling and intraparticle diffusion. This study highlights the effectiveness of employing dual activating agents to enhance the adsorbent’s properties, resulting in significantly improved mercury adsorption capacity.
Author Contributions
Conceptualization, H.A. and H.Q.; methodology, H.A. and H.Q.; formal analysis, H.A.; investigation, H.A.; data curation, H.A.; writing—original draft preparation, H.A.; writing—review and editing, H.Q.; supervision, H.Q.; funding acquisition, H.Q. All authors have read and agreed to the published version of the manuscript.
Funding
This research was funded by Qatar University, grant number QUHI-CENG-25/26-747.
Data Availability Statement
Data is available upon request.
Acknowledgments
The authors would like to express their gratitude to the Central Laboratory Unit (CLU), the Gas Processing Center (GPC), and the Environmental Science Center (ESC) at Qatar University for their support in conducting the analytical tests.
Conflicts of Interest
The authors declare no conflicts of interest.
Appendix A
Appendix A.1. Information for Characterization Techniques
The surface morphologies were analyzed using scanning electron microscopy (SEM) and Energy-Dispersive X-ray spectroscopy (EDX) with a Nova Nanosem 450 instrument from Field Electron and Ion (Hillsboro, OR, USA). The thermal stability of CAC was examined through Thermogravimetric Analysis (TGA) using a Perkin Elmer Pyris 1 TGA instrument (Waltham, MA, USA). The analysis was conducted under both nitrogen and air atmospheres, with a temperature range of 30 °C to 850 °C, a heating rate of 10 °C/min, and a gas flow rate of 30 mL/min. The crystal structure was examined using X-Ray Diffraction (XRD) with the PANalytical EMPYREAN instrument (Almelo, The Netherlands). The surface chemistry of CAC was examined using X-ray Photoelectron Spectroscopy (XPS) with the Thermo Fisher Sci, Escalab 250 Xi instrument (Waltham, MA, USA). The nitrogen (N2) adsorption/desorption isotherms were used to determine the specific surface area, total pore volume, and pore size distribution. The characteristics were determined using different analytical approaches, including BET for measuring surface area and BJH (Barrett-Joyner-Halenda) for determining pore size distribution using the Micrometrics pore sizer (Norcross, GA, USA).
Appendix A.2. Information for Batch Adsorption Experiments and Fitting Model
The analysis of mercury was conducted using a direct approach method employing the direct mercury analyzer, DMA-80 evo Direct Mercury Analyzer (Bergamo, Italy). The percentage of mercury removed was determined by utilizing Equation (A1), whereas the adsorption capacity was calculated using Equation (A2).
The concentrations of mercury at equilibrium and prior to the start of the experiment are denoted as Ce (mg/L) and C0 (mg/L), respectively. The adsorption capacity of mercury is represented by qe (mg/g), where V (L) is the volume of the mercury solution and m (mg) is the mass of CAC.
Three adsorption isotherms were used to investigate the processes of adsorption between mercury ions and CAC. The adsorption isotherms, namely the Langmuir model, Freundlich model, and Temkin model, are expressed as non-linear Equations (A3)–(A5), respectively [26,27].
The kinetics data were fitted using pseudo-first order (PFO), Pseudo-second order (PSO), and Elovich model and are denoted as Equations (A6)–(A8) respectively [28].
where qt (mg/g) and qe (mg/g) represent the quantity of mercury adsorbed at a given time t and at equilibrium, respectively. The rate constants k1 (g/(mg min)) and k2 (g/(mg min)) represent the rates of the pseudo-first and pseudo-second order reactions, respectively. α (mg/(g min)) and β (g/mg) are constants of adsorption.
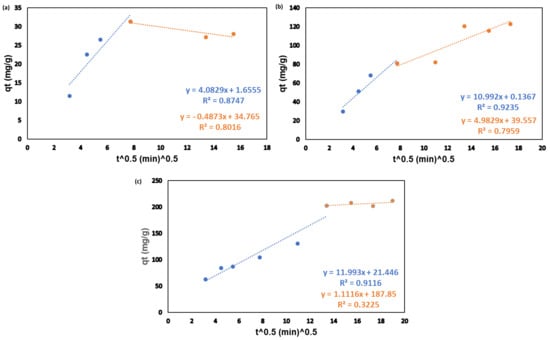
Figure A1.
Linearized intraparticle diffusion plot for the adsorption of mercury onto CAC at room temperature and 180 RPM at three different concentrations: 10 ppm (a), 50 ppm (b), 100 ppm (c).
References
- Moossa, B.; Qiblawey, H.; Nasser, M.S.; Al-Ghouti, M.A.; Benamor, A. Electronic Waste Considerations in the Middle East and North African (MENA) Region: A Review. Environ. Technol. Innov. 2023, 29, 102961. [Google Scholar] [CrossRef]
- Rodríguez, O.; Padilla, I.; Tayibi, H.; López-Delgado, A. Concerns on Liquid Mercury and Mercury-Containing Wastes: A Review of the Treatment Technologies for the Safe Storage. J. Environ. Manag. 2012, 101, 197–205. [Google Scholar] [CrossRef] [PubMed]
- Li, P.; Feng, X.B.; Qiu, G.L.; Shang, L.H.; Li, Z.G. Mercury Pollution in Asia: A Review of the Contaminated Sites. J. Hazard. Mater. 2009, 168, 591–601. [Google Scholar] [CrossRef] [PubMed]
- Liu, Z.; Chen, B.; Wang, L.; Urbanovich, O.; Nagorskaya, L.; Li, X.; Tang, L. A Review on Phytoremediation of Mercury Contaminated Soils. J. Hazard. Mater. 2020, 400, 123138. [Google Scholar] [CrossRef]
- Wang, L.; Hou, D.; Cao, Y.; Ok, Y.S.; Tack, F.M.G.; Rinklebe, J.; O’Connor, D. Remediation of Mercury Contaminated Soil, Water, and Air: A Review of Emerging Materials and Innovative Technologies. Environ. Int. 2020, 134, 105281. [Google Scholar] [CrossRef]
- Wang, J.; Feng, X.; Anderson, C.W.N.; Xing, Y.; Shang, L. Remediation of Mercury Contaminated Sites—A Review. J. Hazard. Mater. 2012, 221–222, 1–18. [Google Scholar] [CrossRef]
- Sharma, A.; Sharma, A.; Arya, R.K. Removal of Mercury (II) from Aqueous Solution: A Review of Recent Work. Sep. Sci. Technol. 2015, 50, 1310–1320. [Google Scholar] [CrossRef]
- Albatrni, H.; Qiblawey, H.; El-Naas, M.H. Comparative Study between Adsorption and Membrane Technologies for the Removal of Mercury. Sep. Purif. Technol. 2021, 257, 117833. [Google Scholar] [CrossRef]
- Yu, J.G.; Yue, B.Y.; Wu, X.W.; Liu, Q.; Jiao, F.P.; Jiang, X.Y.; Chen, X.Q. Removal of Mercury by Adsorption: A Review. Environ. Sci. Pollut. Res. 2016, 23, 5056–5076. [Google Scholar] [CrossRef]
- Shahzadi, I.; Wu, Y.; Lin, H.; Huang, J.; Zhao, Z.; Chen, C.; Shi, X.; Deng, H. Yeast Biomass Ornamented Macro-Hierarchical Chitin Nanofiber Aerogel for Enhanced Adsorption of Cadmium (II) Ions. J. Hazard. Mater. 2023, 453, 131312. [Google Scholar] [CrossRef]
- Azha, S.F.; Sellaoui, L.; Shamsudin, M.S.; Ismail, S.; Bonilla-Petriciolet, A.; Ben Lamine, A.; Erto, A. Synthesis and Characterization of a Novel Amphoteric Adsorbent Coating for Anionic and Cationic Dyes Adsorption: Experimental Investigation and Statistical Physics Modelling. Chem. Eng. J. 2018, 351, 221–229. [Google Scholar] [CrossRef]
- Sun, Y.; Li, X.; Zheng, W. Facile Synthesis of Core-Shell Phase-Transited Lysozyme Coated Magnetic Nanoparticle as a Novel Adsorbent for Hg (II) Removal in Aqueous Solutions. J. Hazard. Mater. 2021, 403, 124012. [Google Scholar] [CrossRef]
- Al-Yaari, M.; Saleh, T.A. Mercury Removal from Water Using a Novel Composite of Polyacrylate-Modified Carbon. ACS Omega 2022, 7, 14820–14831. [Google Scholar] [CrossRef]
- Yin, M.; Bai, X.; Wu, D.; Li, F.; Jiang, K.; Ma, N.; Chen, Z.; Zhang, X.; Fang, L. Sulfur-Functional Group Tunning on Biochar through Sodium Thiosulfate Modified Molten Salt Process for Efficient Heavy Metal Adsorption. Chem. Eng. J. 2022, 433, 134441. [Google Scholar] [CrossRef]
- Sajjadi, S.A.; Mohammadzadeh, A.; Tran, H.N.; Anastopoulos, I.; Dotto, G.L.; Lopičić, Z.R.; Sivamani, S.; Rahmani-Sani, A.; Ivanets, A.; Hosseini-Bandegharaei, A. Efficient Mercury Removal from Wastewater by Pistachio Wood Wastes-Derived Activated Carbon Prepared by Chemical Activation Using a Novel Activating Agent. J. Environ. Manag. 2018, 223, 1001–1009. [Google Scholar] [CrossRef]
- World Activated Carbon; Freedonia: North Bethesda, MD, USA, 2016.
- Georgieva, V.G.; Gonsalvesh, L.; Tavlieva, M.P. Thermodynamics and Kinetics of the Removal of Nickel (II) Ions from Aqueous Solutions by Biochar Adsorbent Made from Agro-Waste Walnut Shells. J. Mol. Liq. 2020, 312, 112788. [Google Scholar] [CrossRef]
- Albatrni, H.; Qiblawey, H.; Al-Marri, M.J. Walnut Shell Based Adsorbents: A Review Study on Preparation, Mechanism, and Application. J. Water Process Eng. 2022, 45, 102527. [Google Scholar] [CrossRef]
- Ruiz-Fernández, M.; Alexandre-Franco, M.; Fernández-González, C.; Gómez-Serrano, V. Development of Activated Carbon from Vine Shoots by Physical and Chemical Activation Methods. Some Insight into Activation Mechanisms. Adsorption 2011, 17, 621–629. [Google Scholar] [CrossRef]
- Liu, Z.; Sun, Y.; Xu, X.; Qu, J.; Qu, B. Adsorption of Hg (II) in an Aqueous Solution by Activated Carbon Prepared from Rice Husk Using KOH Activation. ACS Omega 2020, 5, 29231–29242. [Google Scholar] [CrossRef]
- Danish, M.; Hashim, R.; Rafatullah, M.; Sulaiman, O.; Ahmad, A. Govind Adsorption of Pb (II) Ions from Aqueous Solutions by Date Bead Carbon Activated with ZnCl2. Clean 2011, 39, 392–399. [Google Scholar] [CrossRef]
- Danish, M.; Hashim, R.; Ibrahim, M.N.M.; Sulaiman, O. Optimization Study for Preparation of Activated Carbon from Acacia Mangium Wood Using Phosphoric Acid. Wood Sci. Technol. 2014, 48, 1069–1083. [Google Scholar] [CrossRef]
- Zbair, M.; Ainassaari, K.; Drif, A.; Ojala, S.; Bottlinger, M.; Pirilä, M.; Keiski, R.L.; Bensitel, M.; Brahmi, R. Toward New Benchmark Adsorbents: Preparation and Characterization of Activated Carbon from Argan Nut Shell for Bisphenol A Removal. Environ. Sci. Pollut. Res. 2018, 25, 1869–1882. [Google Scholar] [CrossRef] [PubMed]
- Sevilla, M.; Díez, N.; Fuertes, A.B. More Sustainable Chemical Activation Strategies for the Production of Porous Carbons. ChemSusChem 2021, 14, 94–117. [Google Scholar] [CrossRef]
- Kiliç, M.; Apaydin-Varol, E.; Pütün, A.E. Preparation and Surface Characterization of Activated Carbons from Euphorbia Rigida by Chemical Activation with ZnCl2, K2CO3, NaOH and H3PO4. Appl. Surf. Sci. 2012, 261, 247–254. [Google Scholar] [CrossRef]
- Albatrni, H.; Qiblawey, H. Evaluation of Sodium Thiosulfate Activated Carbon for High-Performance Mercury Removal from Aqueous Solutions. Environ. Technol. Innov. 2024, 34, 103621. [Google Scholar] [CrossRef]
- Albatrni, H.; Abou Elezz, A.; Elkhatat, A.; Qiblawey, H.; Almomani, F. A Green Route to the Synthesis of Highly Porous Activated Carbon from Walnut Shells for Mercury Removal. J. Water Process Eng. 2024, 58, 104802. [Google Scholar] [CrossRef]
- Sevilla, M.; Fuertes, A.B. A Green Approach to High-Performance Supercapacitor Electrodes: The Chemical Activation of Hydrochar with Potassium Bicarbonate. ChemSusChem 2016, 9, 1880–1888. [Google Scholar] [CrossRef]
- Fuertes, A.B.; Ferrero, G.A.; Diez, N.; Sevilla, M. A Green Route to High-Surface Area Carbons by Chemical Activation of Biomass-Based Products with Sodium Thiosulfate. ACS Sustain. Chem. Eng. 2018, 6, 16323–16331. [Google Scholar] [CrossRef]
- Brantley, S.L.; Mellott, N.P. Surface Area and Porosity of Primary Silicate Minerals. Am. Mineral. 2000, 85, 1767–1783. [Google Scholar] [CrossRef]
- Alothman, Z.A. A Review: Fundamental Aspects of Silicate Mesoporous Materials. Materials 2012, 5, 2874–2902. [Google Scholar] [CrossRef]
- Altinci, O.C.; Demir, M. Beyond Conventional Activating Methods, a Green Approach for the Synthesis of Biocarbon and Its Supercapacitor Electrode Performance. Energy Fuels 2020, 34, 7658–7665. [Google Scholar] [CrossRef]
- Dittmann, D.; Saal, L.; Zietzschmann, F.; Mai, M.; Altmann, K.; Al-Sabbagh, D.; Schumann, P.; Ruhl, A.S.; Jekel, M.; Braun, U. Characterization of Activated Carbons for Water Treatment Using TGA-FTIR for Analysis of Oxygen-Containing Functional Groups. Appl. Water Sci. 2022, 12, 203. [Google Scholar] [CrossRef]
- Zhang, G.; Sun, S.; Yang, D.; Dodelet, J.-P.; Sacher, E. The Surface Analytical Characterization of Carbon Fibers Functionalized by H2SO4/HNO3 Treatment. Carbon N. Y. 2008, 46, 196–205. [Google Scholar] [CrossRef]
- Xu, X.; Schierz, A.; Xu, N.; Cao, X. Comparison of the Characteristics and Mechanisms of Hg(II) Sorption by Biochars and Activated Carbon. J. Colloid Interface Sci. 2016, 463, 55–60. [Google Scholar] [CrossRef] [PubMed]
- Rani, L.; Srivastav, A.L.; Kaushal, J. Bioremediation: An Effective Approach of Mercury Removal from the Aqueous Solutions. Chemosphere 2021, 280, 130654. [Google Scholar] [CrossRef]
- Zhu, J.; Deng, B.; Yang, J.; Gang, D. Modifying Activated Carbon with Hybrid Ligands for Enhancing Aqueous Mercury Removal. Carbon N. Y. 2009, 47, 2014–2025. [Google Scholar] [CrossRef]
- Vijayaraghavan, K.; Padmesh, T.V.N.; Palanivelu, K.; Velan, M. Biosorption of Nickel (II) Ions onto Sargassum Wightii: Application of Two-Parameter and Three-Parameter Isotherm Models. J. Hazard. Mater. 2006, 133, 304–308. [Google Scholar] [CrossRef]
- Treybal, R.E. Mass-Transfer Operations; McGraw-Hill: New York, NY, USA, 1980; ISBN 0070651760. [Google Scholar]
- Weber, T.W.; Chakravorti, R.K. Pore and Solid Diffusion Models for Fixed-bed Adsorbers. AIChE J. 1974, 20, 228–238. [Google Scholar] [CrossRef]
- Al-Hazmi, G.A.A.M.; Alayyafi, A.A.A.; El-Desouky, M.G.; El-Bindary, A.A. Chitosan-Nano CuO Composite for Removal of Mercury (II): Box-Behnken Design Optimization and Adsorption Mechanism. Int. J. Biol. Macromol. 2024, 261, 129769. [Google Scholar] [CrossRef]
- Ho, Y.S.; McKay, G. Pseudo-Second Order Model for Sorption Processes. Process Biochem. 1999, 34, 451–465. [Google Scholar] [CrossRef]
- Javed, S.H.; Zahir, A.; Khan, A.; Afzal, S.; Mansha, M. Adsorption of Mordant Red 73 Dye on Acid Activated Bentonite: Kinetics and Thermodynamic Study. J. Mol. Liq. 2018, 254, 398–405. [Google Scholar] [CrossRef]
- Tan, K.L.; Hameed, B.H. Insight into the Adsorption Kinetics Models for the Removal of Contaminants from Aqueous Solutions. J. Taiwan Inst. Chem. Eng. 2017, 74, 25–48. [Google Scholar] [CrossRef]
- Wang, J.; Guo, X. Rethinking of the Intraparticle Diffusion Adsorption Kinetics Model: Interpretation, Solving Methods and Applications. Chemosphere 2022, 309, 136732. [Google Scholar] [CrossRef] [PubMed]
- Milonjic, S. A Consideration of the Correct Calculation of Thermodynamic Parameters of Adsorption. J. Serbian Chem. Soc. 2007, 72, 1363–1367. [Google Scholar] [CrossRef]
- Mohan, D.; Gupta, V.K.; Srivastava, S.K.; Chander, S. Kinetics of Mercury Adsorption from Wastewater Using Activated Carbon Derived from Fertilizer Waste. Colloids Surf. A Physicochem. Eng. Asp. 2001, 177, 169–181. [Google Scholar] [CrossRef]
- Albatrni, H.; Qiblawey, H.; Almomani, F.; Adham, S.; Khraisheh, M. Polymeric Adsorbents for Oil Removal from Water. Chemosphere 2019, 233, 809–817. [Google Scholar] [CrossRef]
- Tohamy, H.-A.S.; El-Sakhawy, M.; Hassan, E.B.; Kamel, S. Microwave-Prepared Quantum Dots and Their Potential Applications as Adsorbents and Chemosensors. Materials 2023, 16, 6722. [Google Scholar] [CrossRef]
- Mistar, E.M.; Hasmita, I.; Alfatah, T.; Muslim, A.; Supardan, M.D. Adsorption of Mercury (II) Using Activated Carbon Produced from Bambusa Vulgaris Var. Striata in a Fixed-Bed Column. Sains Malays. 2019, 48, 719–725. [Google Scholar] [CrossRef]
- Nabais, J.V.; Carrott, P.J.M.; Carrott, M.M.L.R.; Belchior, M.; Boavida, D.; Diall, T.; Gulyurtlu, I. Mercury Removal from Aqueous Solution and Flue Gas by Adsorption on Activated Carbon Fibres. Appl. Surf. Sci. 2006, 252, 6046–6052. [Google Scholar] [CrossRef]
- Pan, Q.; Hong, Q.; Fan, Y.; Sun, X.; Huang, W.; Yan, N.; Qu, Z.; Xu, H. Efficient Selective Uptake of Mercury Ions Using Inverse Vulcanization-Synthesized Sulfur-Rich Adsorbents. Sep. Purif. Technol. 2024, 333, 125917. [Google Scholar] [CrossRef]
- Sun, X.; Hwang, J.Y.; Xie, S. Density Functional Study of Elemental Mercury Adsorption on Surfactants. Fuel 2011, 90, 1061–1068. [Google Scholar] [CrossRef]
- Mohammadi, Z.; Shalavi, S.; Jafarzadeh, H. Ethylenediaminetetraacetic Acid in Endodontics. Eur. J. Dent. 2013, 07, S135–S142. [Google Scholar] [CrossRef] [PubMed]
- Guo, Y.; Wang, Z.; Zhou, X.; Bai, R. Removal of Mercury (II) from Aqueous Solution with Three Commercial Raw Activated Carbons. Res. Chem. Intermed. 2017, 43, 2273–2297. [Google Scholar] [CrossRef]
- Zabihi, M.; Omidvar, M.; Motavalizadehkakhky, A.; Zhiani, R. Competitive Adsorption of Arsenic and Mercury on Nano-Magnetic Activated Carbons Derived from Hazelnut Shell. Korean J. Chem. Eng. 2022, 39, 367–376. [Google Scholar] [CrossRef]
- Mariana, M.; Mistar, E.M.; Aswita, D.; Zulkipli, A.S.; Alfatah, T. Nipa Palm Shell as a Sustainable Precursor for Synthesizing High-Performance Activated Carbon: Characterization and Application for Hg2+ Adsorption. Bioresour. Technol. Rep. 2023, 21, 101329. [Google Scholar] [CrossRef]
- Liu, Z.; Sun, Y.; Xu, X.; Meng, X.; Qu, J.; Wang, Z.; Liu, C.; Qu, B. Preparation, Characterization and Application of Activated Carbon from Corn Cob by KOH Activation for Removal of Hg (II) from Aqueous Solution. Bioresour. Technol. 2020, 306, 123154. [Google Scholar] [CrossRef]
Disclaimer/Publisher’s Note: The statements, opinions and data contained in all publications are solely those of the individual author(s) and contributor(s) and not of MDPI and/or the editor(s). MDPI and/or the editor(s) disclaim responsibility for any injury to people or property resulting from any ideas, methods, instructions or products referred to in the content. |
© 2025 by the authors. Licensee MDPI, Basel, Switzerland. This article is an open access article distributed under the terms and conditions of the Creative Commons Attribution (CC BY) license (https://creativecommons.org/licenses/by/4.0/).