Article

Projected Changes in Dry and Wet Conditions in the Henan Section of the Yellow River Based on the CMIP6 Multi-Model Ensemble

1
Henan Center of Hydrology and Water Resources, Zhengzhou 450003, China
2
School of Water Conservancy and Transportation, Zhengzhou University, Zhengzhou 450001, China
3
School of Social Management, Shijiazhuang Vocational College of Industry and Commerce, Shijiazhuang 050020, China
4
Yellow River Institute for Ecological Protection & Regionally Coordinated Development, Zhengzhou University, Zhengzhou 450001, China
5
College of Surveying and Geo-Informatics, North China University of Water Resources and Electric Power, Zhengzhou 450046, China
*
Author to whom correspondence should be addressed.
Water 2026, 18(11), 1252; https://doi.org/10.3390/w18111252
Submission received: 21 March 2026 / Revised: 12 May 2026 / Accepted: 20 May 2026 / Published: 22 May 2026

Abstract

Under the continuous impact of global warming, the water cycle has undergone significant changes, causing a series of problems such as water shortage, frequent climate disasters and ecological environment deterioration. Therefore, understanding the evolution of regional historical and future drought and wet conditions is crucial for adapting and mitigating disasters. This paper discusses the evolution of drought and pluvial events in the Henan section of the Yellow River from 1970 to 2014, projects the future evolution of drought and wet conditions, and assesses the performance of various climate models from Coupled Model Intercomparison Project Phase 6 in simulating precipitation and temperature. Subsequently, future drought and wet conditions in the Henan section were projected for the 2015–2100 period across four SSP-RCP scenarios using Standardized Precipitation and Evapotranspiration Index (SPEI) and run theory. The results indicate that the Henan section of the Yellow River exhibited a significant drying trend during the historical period, with a rate of 0.15 per decade. Looking ahead, a wetting tendency is projected under the SSP1-2.6 scenario, with an increasing rate of 0.02 per decade, whereas the other three scenarios consistently show drying trends, with rates of −0.11, −0.15, and −0.23 per decade, respectively. Across all scenarios, drought and wetness variations exhibit pronounced periodicity, particularly at timescales of approximately 20–30 years, suggesting the persistence of multi-decadal hydroclimatic oscillations. Furthermore, drought and wetness events are projected to become more persistent and severe during the mid-to-late 21st century. Compared with the historical baseline, increasing radiative forcing is associated with an expansion in drought-affected areas, accompanied by reduced event frequency but longer duration and greater severity. In terms of risk, the SSP3-7.0 scenario presents the highest overall drought and wetness risk with the widest spatial extent, whereas the SSP2-4.5 scenario shows relatively lower risk levels and a more balanced spatial distribution.

1. Introduction

In the past hundred years, due to the intensification of human activities, the emission of greenhouse gases has been accelerated and the global climate has experienced warming [1]. According to the assessment from the IPCC [2], there was a 1.09 °C (0.95–1.20 °C) increase in global mean annual temperatures during the 2011–2020 period compared to the 1850–1900 baseline. Furthermore, it is projected that global warming is likely to hit or surpass the 1.5 °C threshold between 2021 and 2040 [2]. Temperature rise will cause an increase in evapotranspiration and atmospheric water vapor content, as well as a change in precipitation pattern and intensity, resulting in profound changes in the global hydrological cycle pattern and causing a range of water-related challenges, including water scarcity and ecological imbalances [3,4]. Global warming has increased the likelihood, persistence, and severity of drought events, while also intensifying wet conditions [5,6,7,8,9]. According to the Emergency Events Database (EM-DAT) [10], 324 drought events were recorded globally during 2001–2020, representing a 21% increase compared to 1981–2000. In China, drought has caused substantial socioeconomic impacts, with direct economic losses reaching 288.97 billion, accounting for approximately 15.6% of total meteorological disaster losses from 2012 to 2016 [11]. Meanwhile, wet conditions in China exhibit strong seasonal variability, particularly during the summer monsoon period, when sustained precipitation can lead to markedly humid hydrological regimes in major river basins such as the Yangtze River [12,13]. In addition, notable wet anomalies have also been observed in northern river basins, including the Heilongjiang River, with widespread impacts on regional hydrological conditions [14]. Therefore, in the context of global warming, accurate predictions of the evolution of future drought and wet conditions have long been a hot topic for both the scientific community and the public.
The Coupled Model Intercomparison Project (CMIP), published by the World Climate Research Programme (WCRP), aims to promote the sharing and comparison of Global Climate Model (GCM) data and is widely used to explore historical climatic mechanisms and projection future climate trajectories [15,16,17,18,19]. The CMIP6 models simulate the past, present and future climate design and distribution by coordinating GCMs to obtain the future climate development trends under different scenarios, providing basic information to further assess the impact of climate change on water resources, ecology and environment [20]. Currently, the CMIP program is at Phase 6 (CMIP6) and is providing technical support for the 6th IPCC assessment report. Compared with CMIP5, CMIP6 employs a newly established emission scenario framework that couples Shared Socioeconomic Pathways (SSPs) with Representative Concentration Pathways (RCPs). By simultaneously accounting for greenhouse gas concentration trajectories and Land Use/Cover Change (LUCC), this framework provides a more integrated description of historical, current, and future climate states influenced by natural external forcing and internal climate variability. Previous studies had validated that the enhanced spatial resolution, updated dynamic structures, and refined parameterization schemes of CMIP6 make it highly effective for projecting China’s future climatic trends [21,22].
The Yellow River Basin is located in the arid and semi-arid areas of northern China. Driven by intensifying global climate shifts, the basin’s water resources exhibit increasingly erratic spatiotemporal distribution, which restricts the ecological environment protection and the high-quality economic development of the Yellow River Basin [23]. Although precipitation is projected to increase in the later period, the concurrent rise in temperature enhances evapotranspiration demand. As a result, the increase in atmospheric water demand may exceed the gains in precipitation, leading to an overall drying trend [24,25]. Despite substantial progress in understanding drought–wet variations in the Yellow River Basin, existing studies have primarily focused on trend detection or single-index analyses, often at coarse spatial resolutions, with limited attention to the persistence of hydroclimatic changes and their implications for risk assessment. In particular, the integration of trend persistence with comprehensive risk frameworks remains insufficient, and fine-scale, scenario-based projections for meso-scale regions are still lacking.
Consequently, the objective of this research is to assess how effectively CMIP6 models simulate temperature and precipitation, while examining the future spatiotemporal patterns of drought and wet conditions in the Henan section across various SSP-RCP scenarios, and grasp the possible future drought and wet conditions. The main objectives are to (1) appraise the proficiency of five CMIP6 candidates and the BMME in replicating precipitation and temperature through Taylor diagrams; (2) analyze historical trends in dry and wet conditions in the Henan section of the Yellow River and conduct future climate projections; (3) project and evaluate future trends in dry and wet conditions in the Henan section of the Yellow River under different climate scenarios; (4) analyze the variation in drought and wet condition characteristics in the future under different scenarios compared with historical periods, and explore the spatial distribution of drought and wet condition risks. The findings of this study offer a substantial reference for advancing early warning mechanisms, catastrophe risk evaluation, and regional agricultural strategy within the Henan section of the Yellow River.

2. Materials and Methods

2.1. Study Area

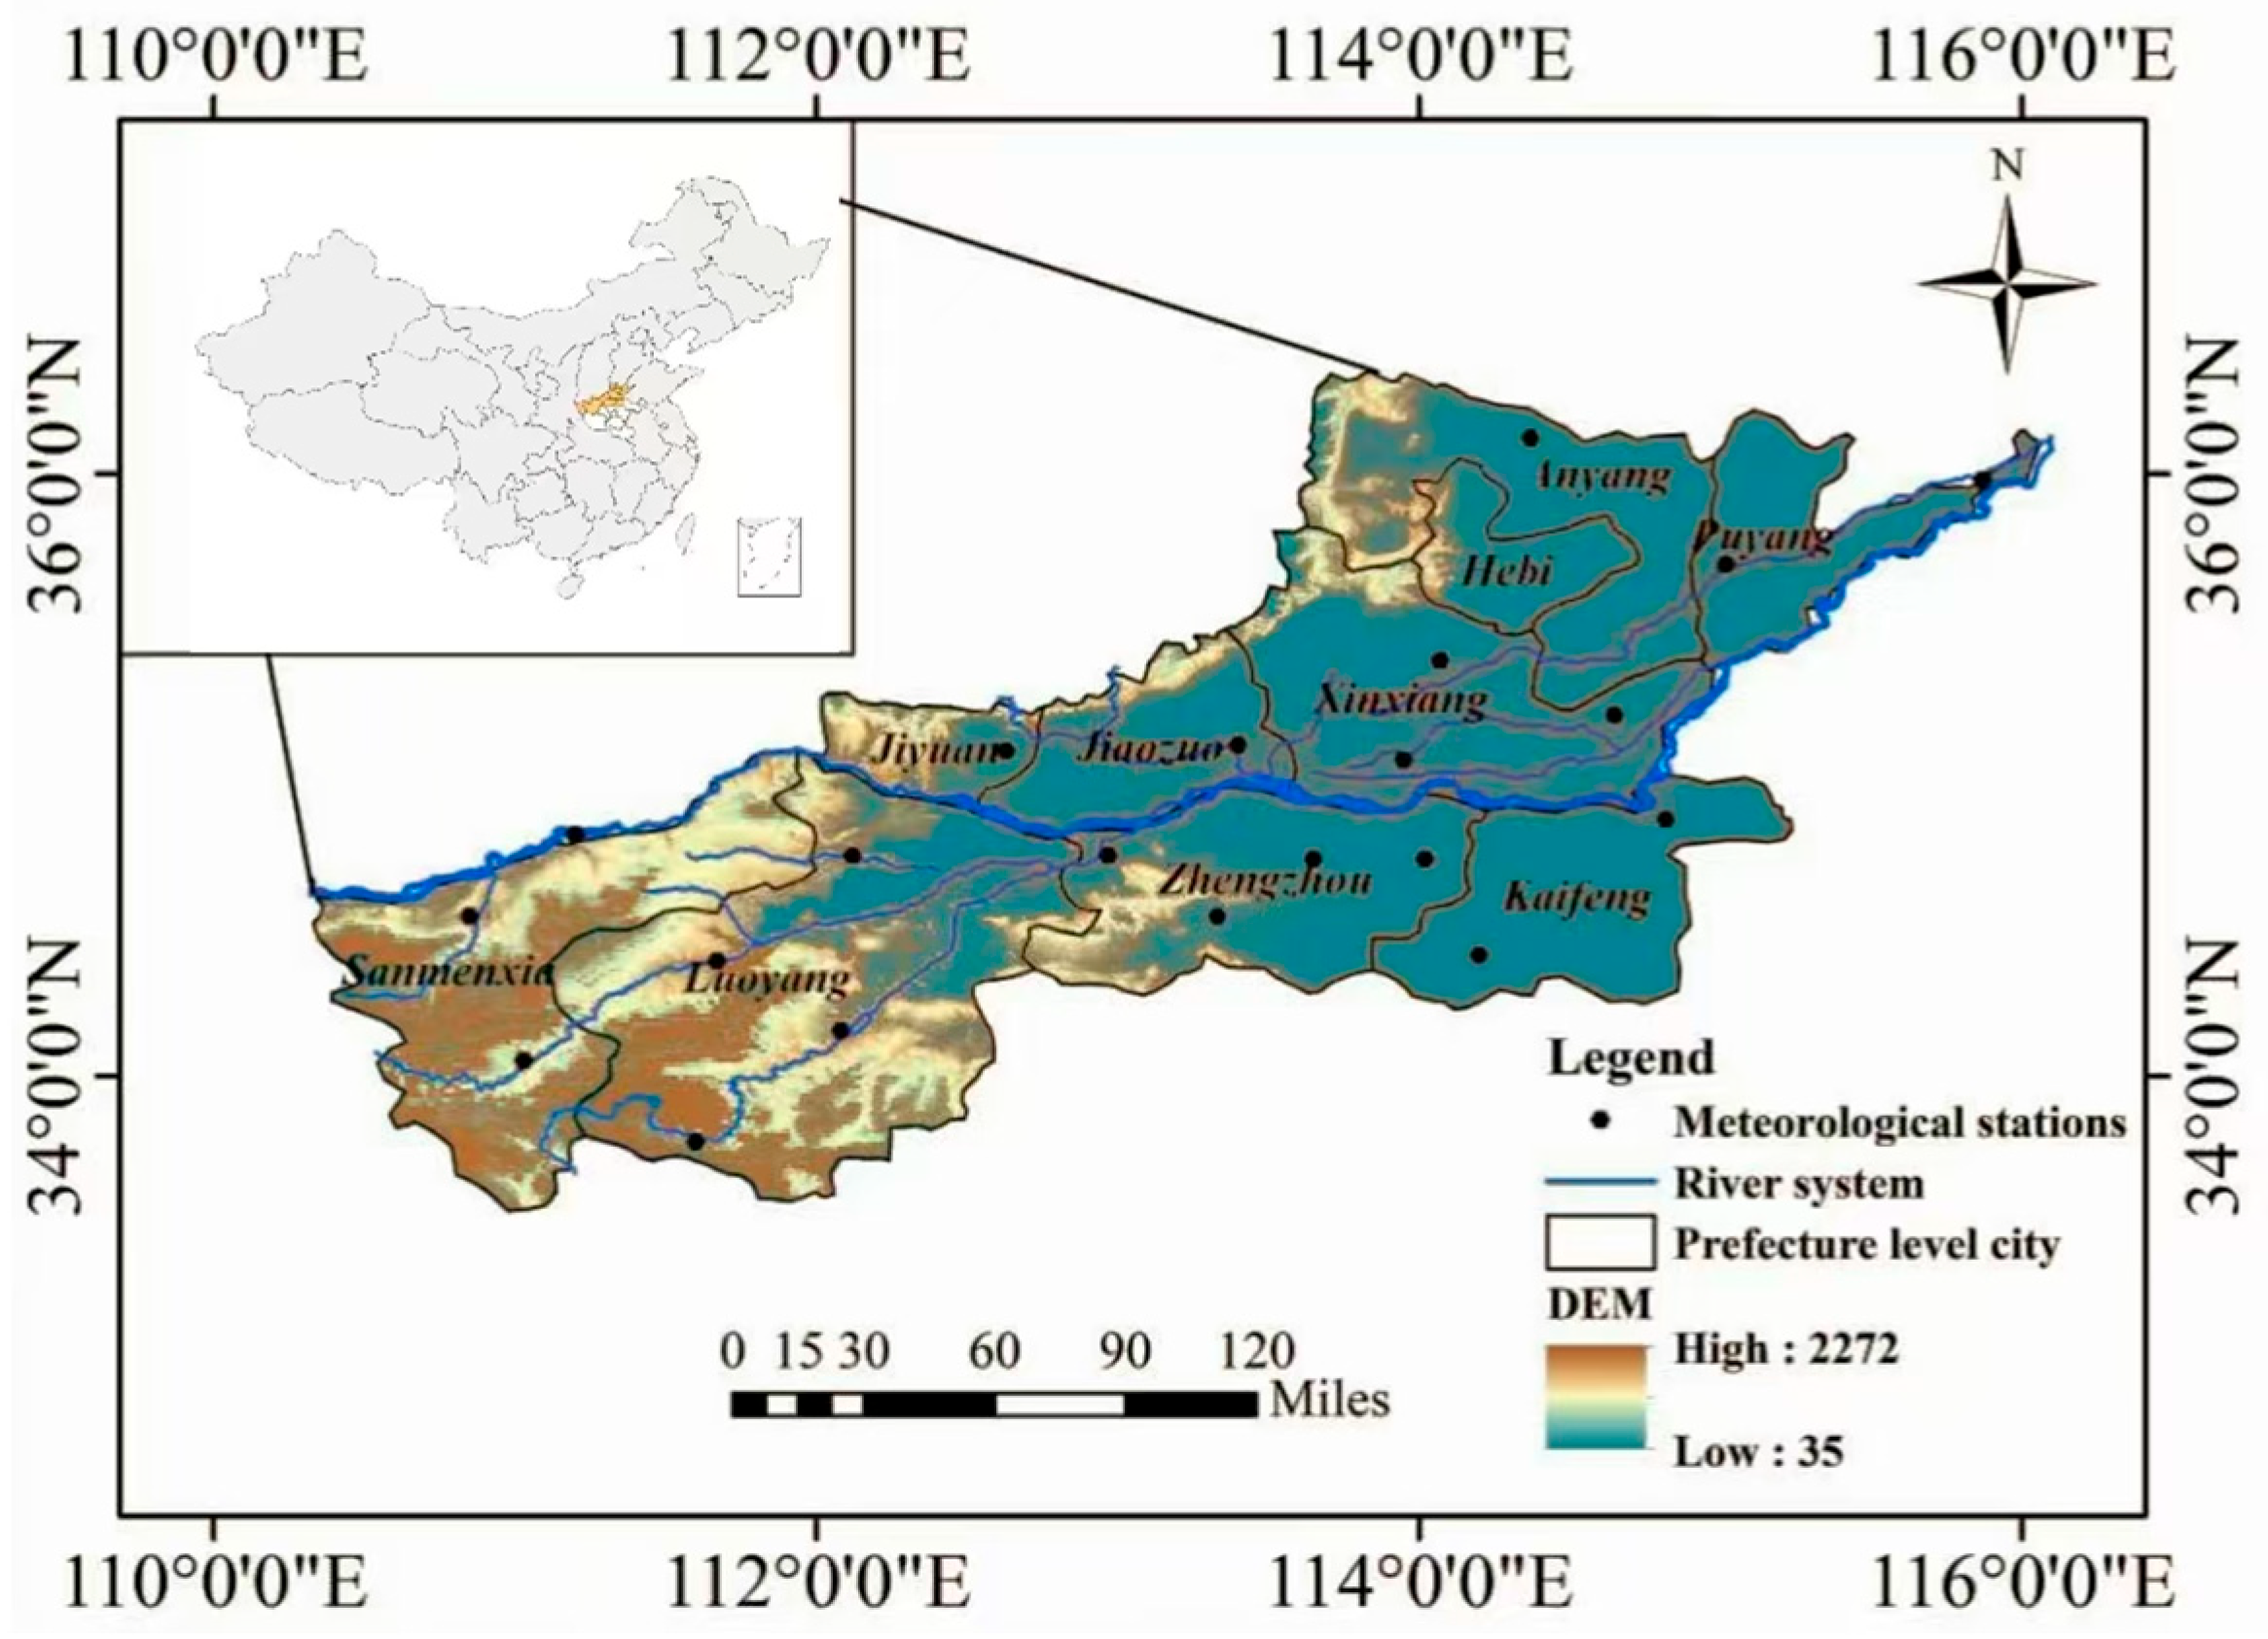
The Henan section of the Yellow River is located between 110°21′ and 116°06′ E and between 33°37′ and 36°05′ N (as in Figure 1). It serves as a vital socio-economic and cultural corridor. This segment is central to the broader development strategy for the Yellow River and stands as a premier agricultural hub within China, covering approximately 6.76 × 10⁴ km2 [26,27]. The area consists of four landforms: plateau, mountain, hilly and plain. Because of the East Asian summer monsoon and atmospheric circulation, which greatly affect the spatial–temporal distribution of water resources, the average annual precipitation ranges from 500 to 900 mm and is mostly concentrated in summer. Situated across the middle and lower reaches, the Henan segment of the Yellow River lies within a transitional semi-arid to semi-humid climatic belt, rendering it highly vulnerable to global climate fluctuations. For example, Henan Province suffered a one-hundred-year drought in 2014. The affected area expanded to cover the entire province, and precipitation in Zhengzhou decreased by 80% compared with historical averages. But the temperature increased by about 3–5 °C [11].

2.2. Data Sources

For the 1970–2020 timeframe, monthly datasets covering temperature and precipitation across 21 weather stations were sourced via the China Meteorological Data Network (http://data.cma.cn/site/index.html, accessed on 25 February 2025). The reanalysis datasets of monthly precipitation and temperature were provided by the National Science and Technology Foundation Platform/National Earth System Science Data Center (http://www.geodata.cn, accessed on 27 February 2025), which is anchored in gridded products developed from observational inputs of over 2400 domestic surface-level meteorological sites, with a time span of 1970–2014 and a spatial resolution of 1 km × 1 km.
Considering the temporal and spatial integrity of climate data in historical and future periods, the five models in CMIP6 were selected (https://esgf-node.llnl.gov/search/cmip6/, accessed on 27 February 2025) (see Table 1), with the time spans of 1970–2014 and 2015–2100, both on a monthly scale. The historical reference period (1970–2014) was used for model evaluation, bias correction, and drought–wetness characterization, and the future projection period (2015–2100) was used for scenario-based projections under four SSP-RCPs. The future simulation data include the combination scenarios of different Shared Socioeconomic Pathways (SSPs) and different Representative Concentration Pathways (RCPs). Four scenarios of SSP1-2.6, SSP2-4.5, SSP3-7.0 and SSP5-8.5 were chosen for the paper to illustrate various radiative forcing degrees. For all CMIP6 models utilized in this study, the r1i1p1f1 ensemble member was selected to maintain uniformity and ensure comparability with previous benchmarking studies.

2.3. Methods

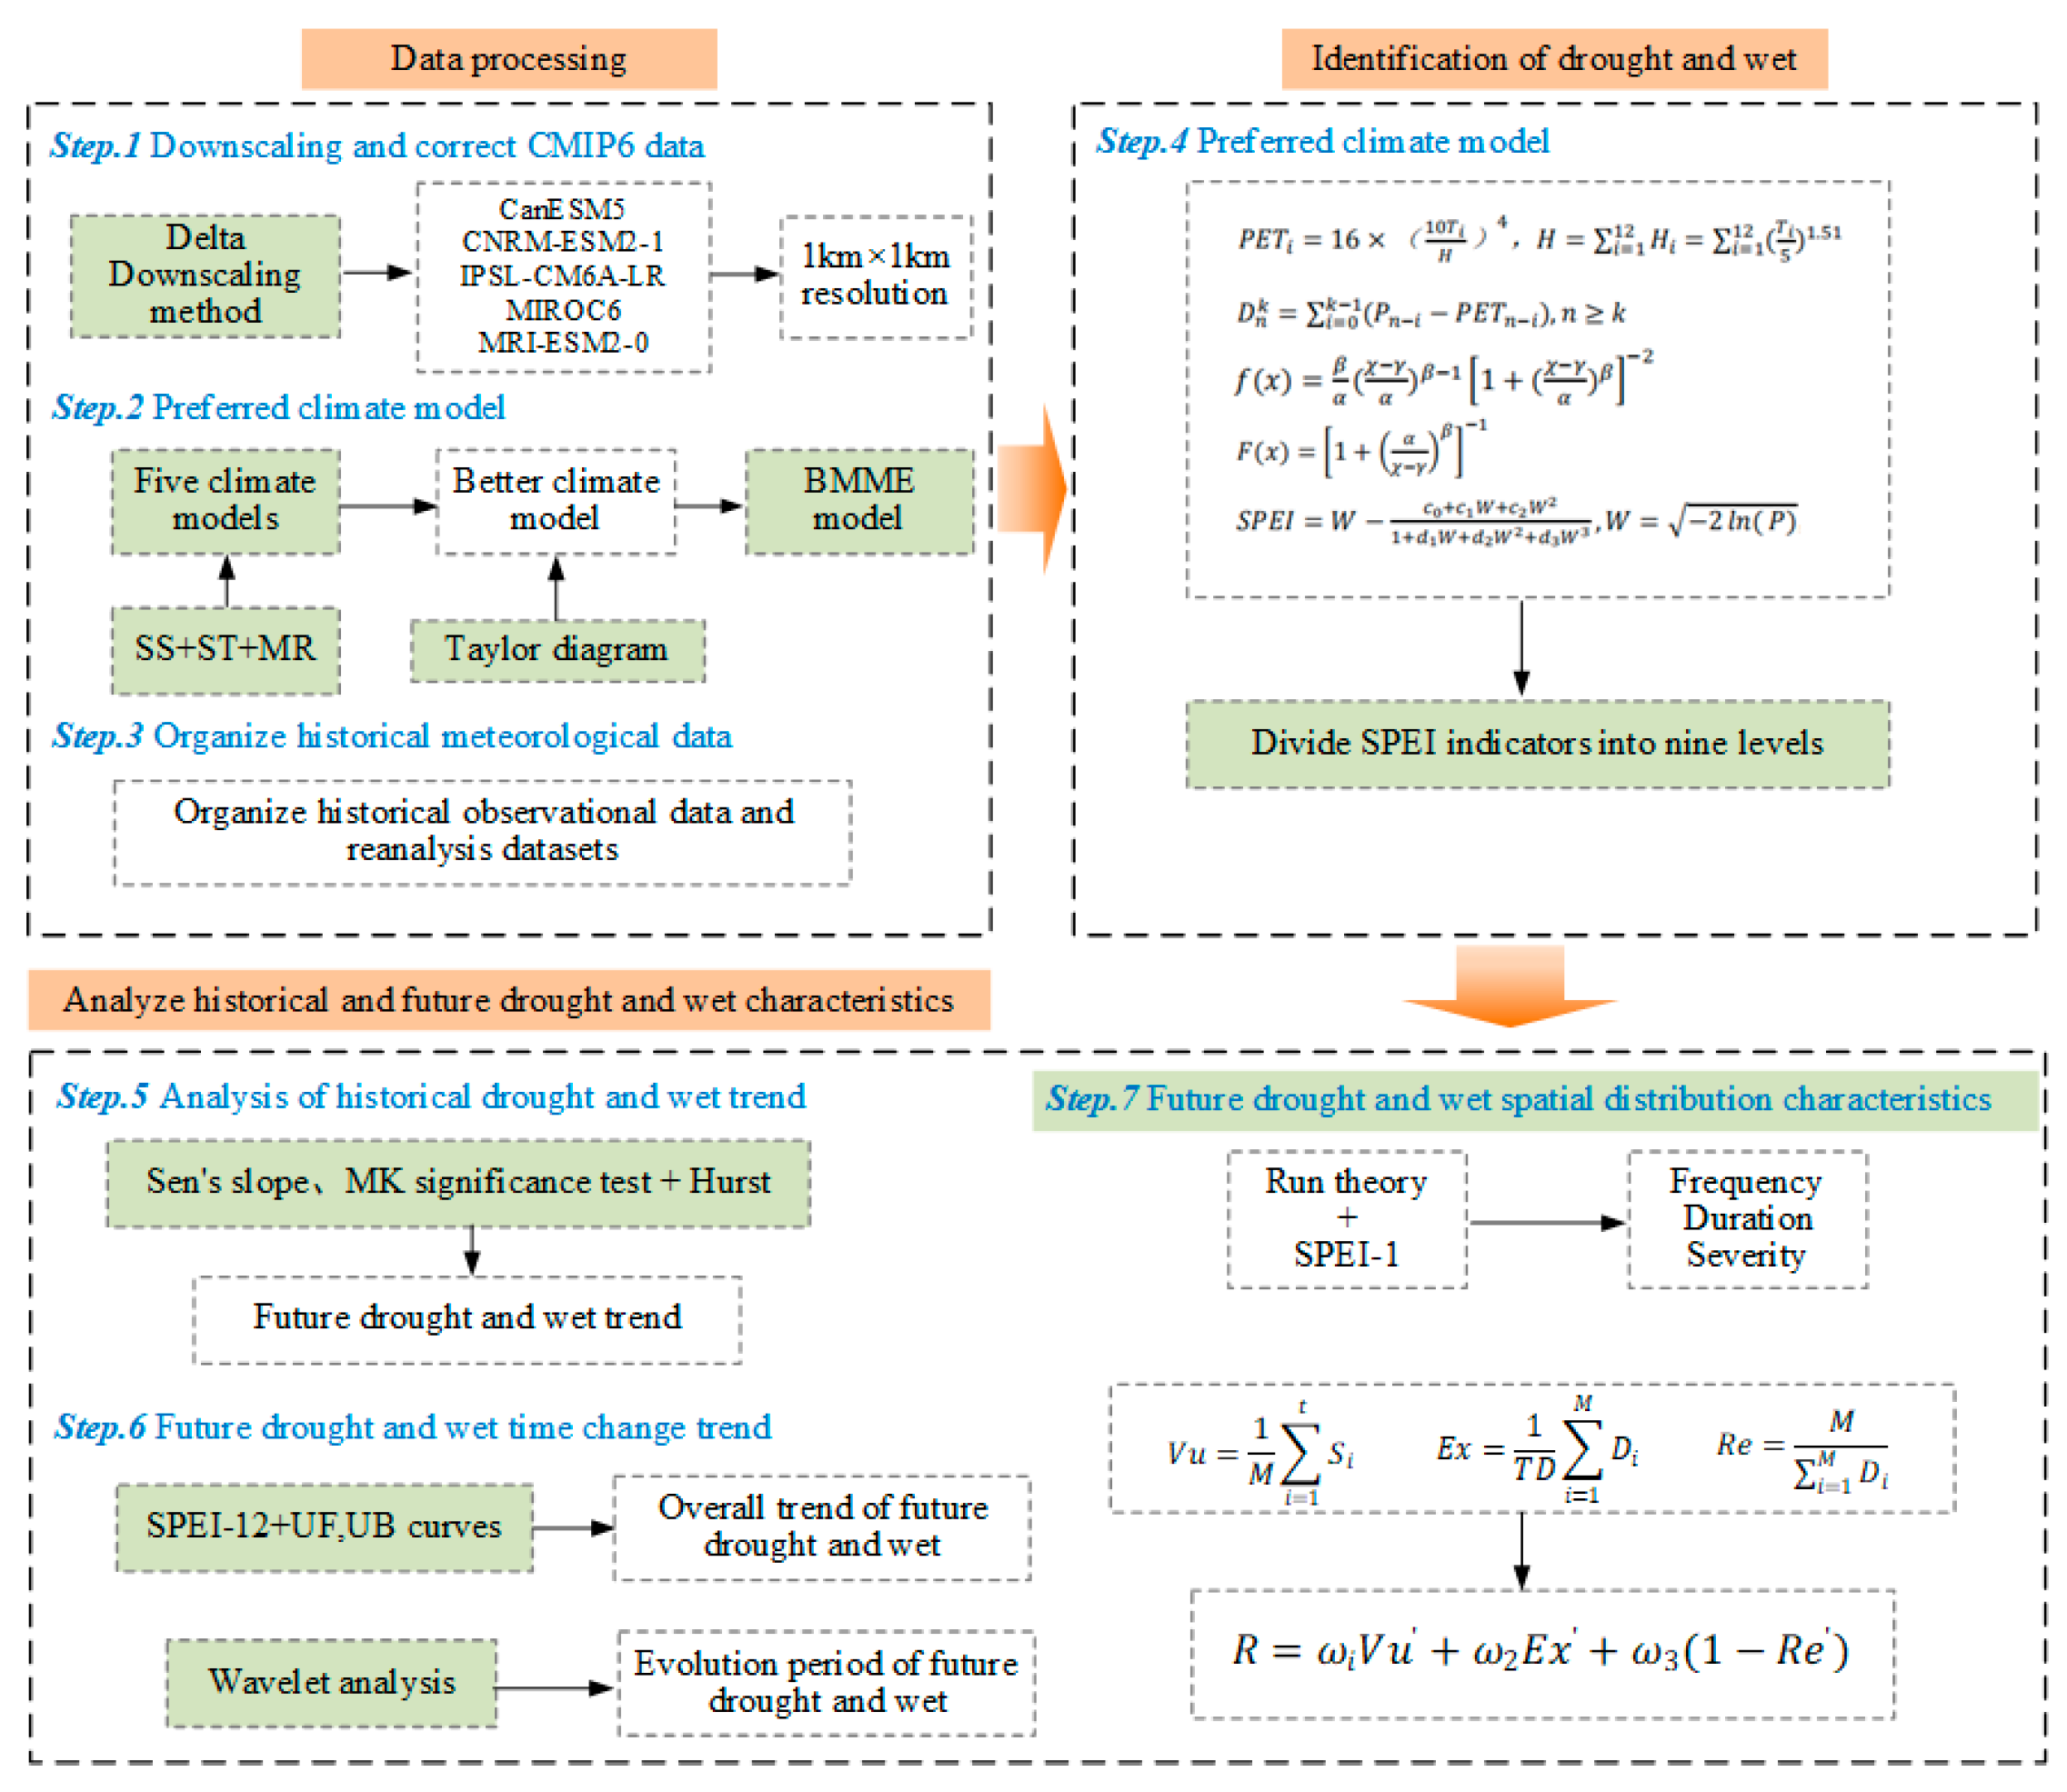
The methodological framework is depicted in Figure 2.

2.3.1. Data Pre-Processing

  • Delta downscaling method
The Delta approach, a bias-correction methodology endorsed by the National Assessment Center of the United States, has been widely applied in climate-related research [28,29,30,31]. In this study, the method was used to calculate the monthly mean changes (Delta) in precipitation and temperature between the projection and reference conditions based on CMIP6 model outputs. We used the inverse distance weighting method to interpolate the Delta value into 1 km spatial resolution, so as to combine it with the reanalysis data set to obtain the downscaling data of each SSP-RCP scenario in the projection period. Precipitation Delta is the relative variation (specific value), and temperature Delta is the absolute variation (difference value). The calculation process is as follows:
D e l t a ( P ) = ( P g c m s _ r c p / P g c m s _ h i s )
P r c p = D e l t a ( P ) 1 k m × P o b s
D e l t a ( T ) = T g c m s _ r c p T g c m s _ h i s
T r c p = D e l t a ( T ) 1 k m + T o b s
where D e l t a ( P ) and D e l t a ( T ) are the variation in prediction period relative to the base period; P r c p , T r c p , P h i s and T h i s respectively represent the monthly precipitation and temperature output data in the prediction and reference period of CMIP6 models; D e l t a ( P ) 1 k m and D e l t a ( T ) 1 k m are 1 km Delta values after spatial interpolation; P o b s and T o b s respectively represent the multi-year average values of precipitation and temperature of reanalysis data in the reference period.
2.
Assessment and selection of climate model simulation capability
The spatial skill score (SS) evaluates the similarity between simulated and observed spatial patterns, reflecting the model’s ability to reproduce spatial heterogeneity. Spatial skill score (SS) [32] is introduced to comprehensively consider the spatial correlation coefficient and average deviation between the simulation and observation field, and Time Skill score (TS) [33] is employed to assess how accurately simulated values replicate the observed temporal series at individual spatial points. The detailed calculation process is as follows:
Let M k and O k represent the precipitation assessment field and observation field, respectively. The spatial mean squared error between the observation and assessment fields is defined as
E M S m , o = 1 N k = 1 N M k O k 2
where N is the number of spatial grid points. To achieve dimensionless normalization in Equation (1), the dimensionless spatial skill score is derived as
S s = 1 E M S m , o E M S o ¯ , o
S s = r m , o 2 r m , o s m / s o 2 m ¯ o ¯ / s o 2
Here, r m , o is the spatial correlation coefficient between the assessment and observation fields, s m and s o are the standard deviations of the assessment and observation fields, respectively, and m ¯ and o ¯ are the regional averages of the assessment and observation fields, respectively.
Let Y t and X t represent the precipitation assessment and observation time series, respectively. The temporal mean squared error between the assessment and observation series is
E M S y , x = 1 n t = 1 n Y t X t 2
where n is the length of the time series sample. Applying dimensionless normalization to the above equation yields the dimensionless temporal skill score:
S t = 1 E M S y , x E M S x ¯ , x
S t = r y , x 2 r y , x s y / s x 2 y ¯ x ¯ / s x 2
Here, r x , y 2 is the squared correlation coefficient between the assessment and observation time series, s y and s x are the standard deviations of the assessment and observation series, respectively, and y ¯ and x ¯ are the averages of the assessment and observation series, respectively.
When the SS and TS of each model are closer to 1, the spatial and time simulation capability of each model for precipitation and temperature is better and closer to the observations. Through MR comprehensive rating [34], the climate models with better simulation capability were selected. In general, the multi-model ensemble techniques typically enhance the reliability of simulation outputs [35,36,37], so the Better Multi-Model Ensemble (BMME) was performed. The Better Multi-Model Ensemble (BMME) is an ensemble learning method used to improve prediction accuracy. Its core principle involves the optimal combination of prediction results from multiple sources through equal-weight allocation, aiming to reduce structural discrepancies and uncertainties inherent in individual models. In this study, models with superior simulation capabilities were selected based on Spatial Skill (SS) and Temporal Skill (TS) scores. The top three performing models—MRI-ESM2-0, CNRM-ESM2-1, and MIROC6—were then assigned equal weights to form the BMME.
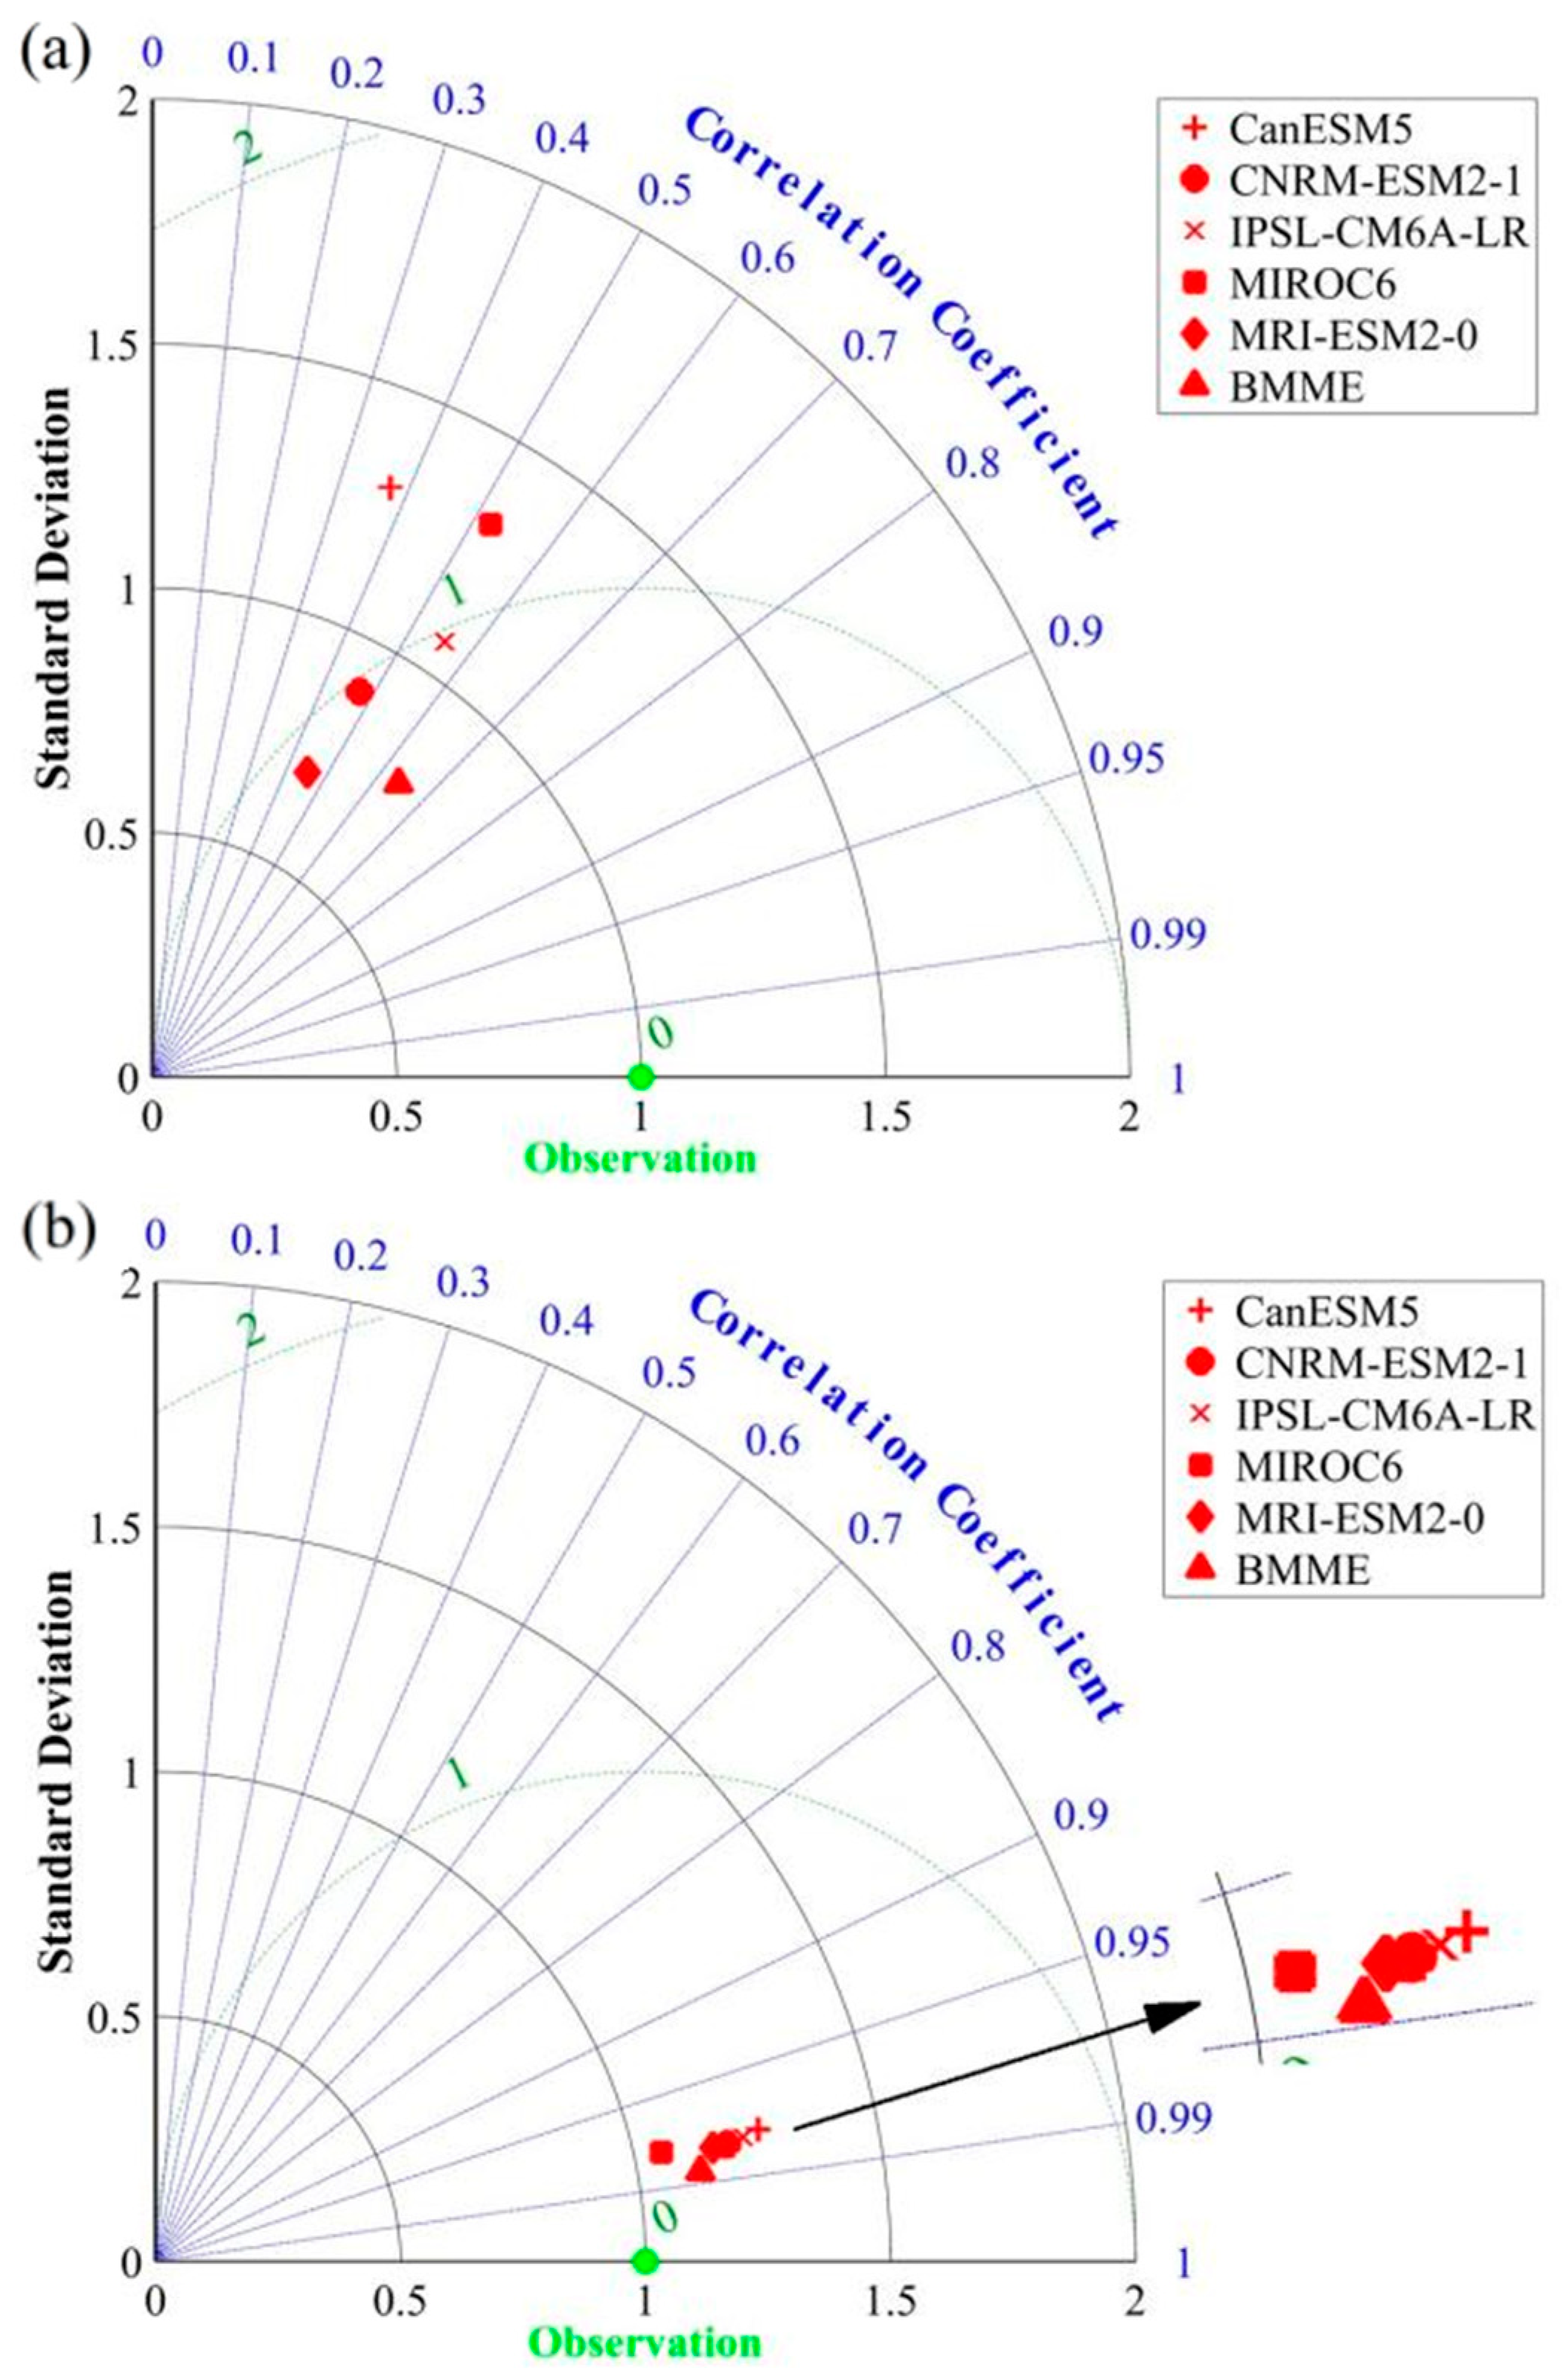
The Taylor diagram is a widely used method in model evaluation. It is mainly based on three indicators, correlation coefficient (R), relative standard deviation (SD) and root mean square error (RMSE), to compare the similarity and difference between model simulation results and measured values. In general, higher correlation coefficient, standard deviation closer to 1, and lower RMSE collectively indicate better model simulation performance. In this study, Taylor diagrams were generated using MATLAB R2021b, and five climate models and the BMME were combined with Taylor analysis to explore the multi-year changes in regional average precipitation and temperature, evaluate the accuracy change characteristics of each model, and intuitively reflect the differences in simulation capability of each model.

2.3.2. Standardized Precipitation Evapotranspiration Index

SPEI was selected in this study to explicitly capture the “warming-induced drying” effect, as it is simple to calculate, suitable for multi-scale and spatial comparisons, and widely used in drought characteristic analysis [38,39,40,41,42]. The Thornthwaite method estimates potential evapotranspiration (PET) using empirical formulas based on temperature and latitude. It only requires basic meteorological data to quantify the atmospheric potential demand for water, making it suitable for data-scarce scenarios. For identifying long-term drought trends at large scales, temperature-driven changes in evapotranspiration are sufficient to reflect the core patterns [43]. The detailed calculation procedure of the SPEI has been described in previous studies [43].
Following the Meteorological Drought Grades standard established by the National Climate Center in 2017 [44], the SPEI values are categorized into nine distinct classes (see Table 2).

2.3.3. Statistical Method

Sen’s slope estimator is a robust non-parametric statistical method, which is applicable to qualitative description of time series with clear patterns [45]. The Hurst exponent was used to analyze the long-range persistence of the SPEI series [46,47]. Sen’s slope is calculated using Equation (11):
S e n = M e d i a n ( x j x i j i ) , j > I
where x j and x i are the sequences of SPEI in the years i and j; Sen’s slope is represented by Sen; when Sen > 0, SPEI time series show an upward trend and wetting state is enhanced. When Sen < 0, SPEI time series show a downward trend and drought degree is enhanced.
The Hurst exponent is widely utilized to investigate the fractal nature and long-range persistence of temporal sequences. This approach captures the intrinsic autocorrelation and particularly the underlying long-term trend signals embedded in the data [48], and is commonly applied to judge the consistency or difference between the future and past trend [49,50]. The value range of the Hurst index is [0, 1]; when H is [0, 0.5), the future SPEI is expected to follow a trend contrary to the historical pattern; when H = 0.5, the future SPEI development trend will show no association with its historical trend; when (0.5, 1], the future SPEI will show the same trend as the past.
Therefore, Sen’s slope method and the Hurst index method were comprehensively used to examine the trend and persistence of drought and wet conditions in the Henan section of the Yellow River in the historical and future periods. The specific combination of Sen’s slope and Hurst value is described in Table 3.

2.3.4. Wavelet Analysis

The wavelet method is a sophisticated time–frequency tool for multiresolution analysis established by Morlet [51,52]. It is capable of identifying both the magnitude of multitemporal periodicities embedded in sequences and their respective temporal distributions, and it can directly reflect the amplitude and phase information of time series changes. It can construct wavelet variance maps and real-part contour plots, obtain the distribution characteristics (time factor) and periodic characteristics (scale factor) of drought and wet conditions with time, and quantitatively estimate the future development trend [53].
In this study, wavelet analysis was employed to investigate the temporal characteristics of dry–wet variations. Specifically, it was used to identify the dominant periodic signals, revealing significant oscillations at approximately 5–10-year and 20–30-year scales. The primary period was further determined based on wavelet variance, which highlights the most energetic frequency components of the time series. In addition, wavelet analysis enabled a comparative assessment of periodic structures across the four SSP-RCP future scenarios, thereby providing insights into how climate change may influence the evolution of dry–wet cycles.

2.3.5. Run Theory

Run theory is employed in this study to identify drought and wet events and extract their key characteristics based on the SPEI-1 series. Following threshold definition according to the classification of dry and wet grades, consecutive runs are identified to distinguish valid drought and wet episodes, with adjacent short-term events properly merged to avoid excessive segmentation. On this basis, the frequency, duration, and severity of each identified event are calculated and further used for spatiotemporal variation analysis and comprehensive risk assessment. This procedure ensures the accurate identification of major drought and wet events and provides robust indicators for subsequent quantitative analysis.
Run theory primarily elucidates the statistical regularities governing the persistent occurrence of stochastic events [54,55]. This framework facilitates the identification of hydrological indices and the exploration of their properties, specifically targeting run frequency (annual event counts), run duration (event persistence), and run severity (cumulative deficit) [56]. In order to filter the impact of slight drought and avoid affecting the identification and statistical analysis of major drought and pluvial events, we adopted the three-threshold run theory to identify the characteristics of drought and wet conditions [57]. Herein, drought frequency (F) refers to the number of droughts experienced per year; drought duration (D) denotes the length of time from the onset to the termination of an individual drought event; drought severity (S) is defined as the cumulative sum of SPEI values over the duration of each drought event [58].
This study adopted the 1-month-time-scale SPEI (SPEI-1) to classify drought grade; we set three drought thresholds as X0 = 0, X1 = −0.5 and X2 = −1.5, respectively (wet thresholds as X0 = 0, X1 = 0.5 and X2 = 1.5, respectively). That is, when the random variable is less than 0 within the specified time, it is a negative run; otherwise, it is a positive run. The drought event identification process is outlined below:
Step 1. Drought events occur only when the SPEI-1 sequence has a negative run, and light droughts occur when SPEI-1 < −0.5; it is preliminarily judged that drought occurred in this month.
Step 2. When the drought lasts only one month and the corresponding SPEI-1 > −1.5, that month is considered non-drought and is excluded from the analysis. Otherwise it is a drought process.
Step 3. When the time interval between two adjacent drought processes is only one month and the SPEI in that month is <0, the two processes are combined into a single drought event. The drought duration (DD) is then calculated as the sum of the two individual durations plus 1. The drought severity (DS) is defined as the absolute value of their cumulative intensity. Otherwise, the two drought processes are considered independent. The principle of wet event identification is the same as above.

2.3.6. Risk Identification Method

Risk factors are risk indicators in the evolution process of drought and wet conditions, which have certain physical significance and facilitate the analysis of the risk from the micro perspective [59]. Three risk factors of vulnerability (Vu), exposure (Ex) and resilience (Re) were selected to analyze the comprehensive drought and wet condition risks in the Henan section of the Yellow River. After obtaining the frequency, duration and severity of drought and wet conditions through run theory, Vu, Ex and Re are calculated and normalized respectively. The comprehensive drought–wetness risk index R is calculated using the weighted combination of three indicators.
V u = 1 F i = 1 t S i
E x = 1 T D i = 1 F D i
R e = F i = 1 F D i
R = ω i V u + ω 2 E x + ω 3 ( 1 R e )
where F is the number of drought and wet events; TD is the total number of months in the timeframe; S i and D i are the severity and duration of the i drought and wet events respectively; V u , E x , R e are obtained by normalizing V u , E x , R e . ω i , ω 2 and ω 3 are the weights of V u , E x and R e in drought and wet risk, and this paper takes equal weight 1/3.

3. Results and Analysis

3.1. Climate Model Data Preprocessing

3.1.1. Evaluation and Optimization of CMIP6 Models’ Simulation Capability

We calculated the SS and TS values of the five climate models for precipitation and temperature and determined the ranking results of individual model indices (see Table 4). For precipitation, the models with better simulation capability were MRI-ESM2-0, CNRM-ESM2-1 and IPSL-CM6A-LR; for temperature, the models with better capability were MIROC6, MRI-ESM2-0 and CNRM-ESM2-1. The more comprehensive models were MRI-ESM2-0, CNRM-ESM2-1 and MIROC6, and then the three optimal models were set with equal weight.
In order to further explore the simulation capabilities and differences of different modes, a Taylor diagram was employed to assess the simulation performance of individual models as well as the BMME model (as in Figure 3). In terms of precipitation, the R values between the simulation and observation results of each model were between 0.3 and 0.7; the BMME, IPSL-CM6A-LR and MIROC6 models were greater than 0.5. The SD values between the simulated and observation results were about 0.6, and the BMME, IPSL-CM6A-LR and MIROC6 models were greater than 0.5. The RMSE values between the simulated and observation results were between 0.7 and 1.4, which were more dispersed. The RMSE of the BMME was the smallest, which was 0.78 and closer to the observation point.
As far as temperature is concerned, the R values between the simulation and observation results of each model were between 0.95 and 0.98, and the BMME was 0.98; the SD values between the model simulation and the observation results were between 1.0 and 1.3, and the MIROC6 model was closest to 1.0, followed by the BMME. The RMSE values between the simulated and the observation results were less than 0.5, and the BMME and MIROC6 models are closer to the observation point. In general, the BMME has good simulation ability for regional annual precipitation and annual average temperature, so this model ensemble is selected for subsequent analysis and calculation.

3.1.2. Verification of Climate Models’ Simulation Capability

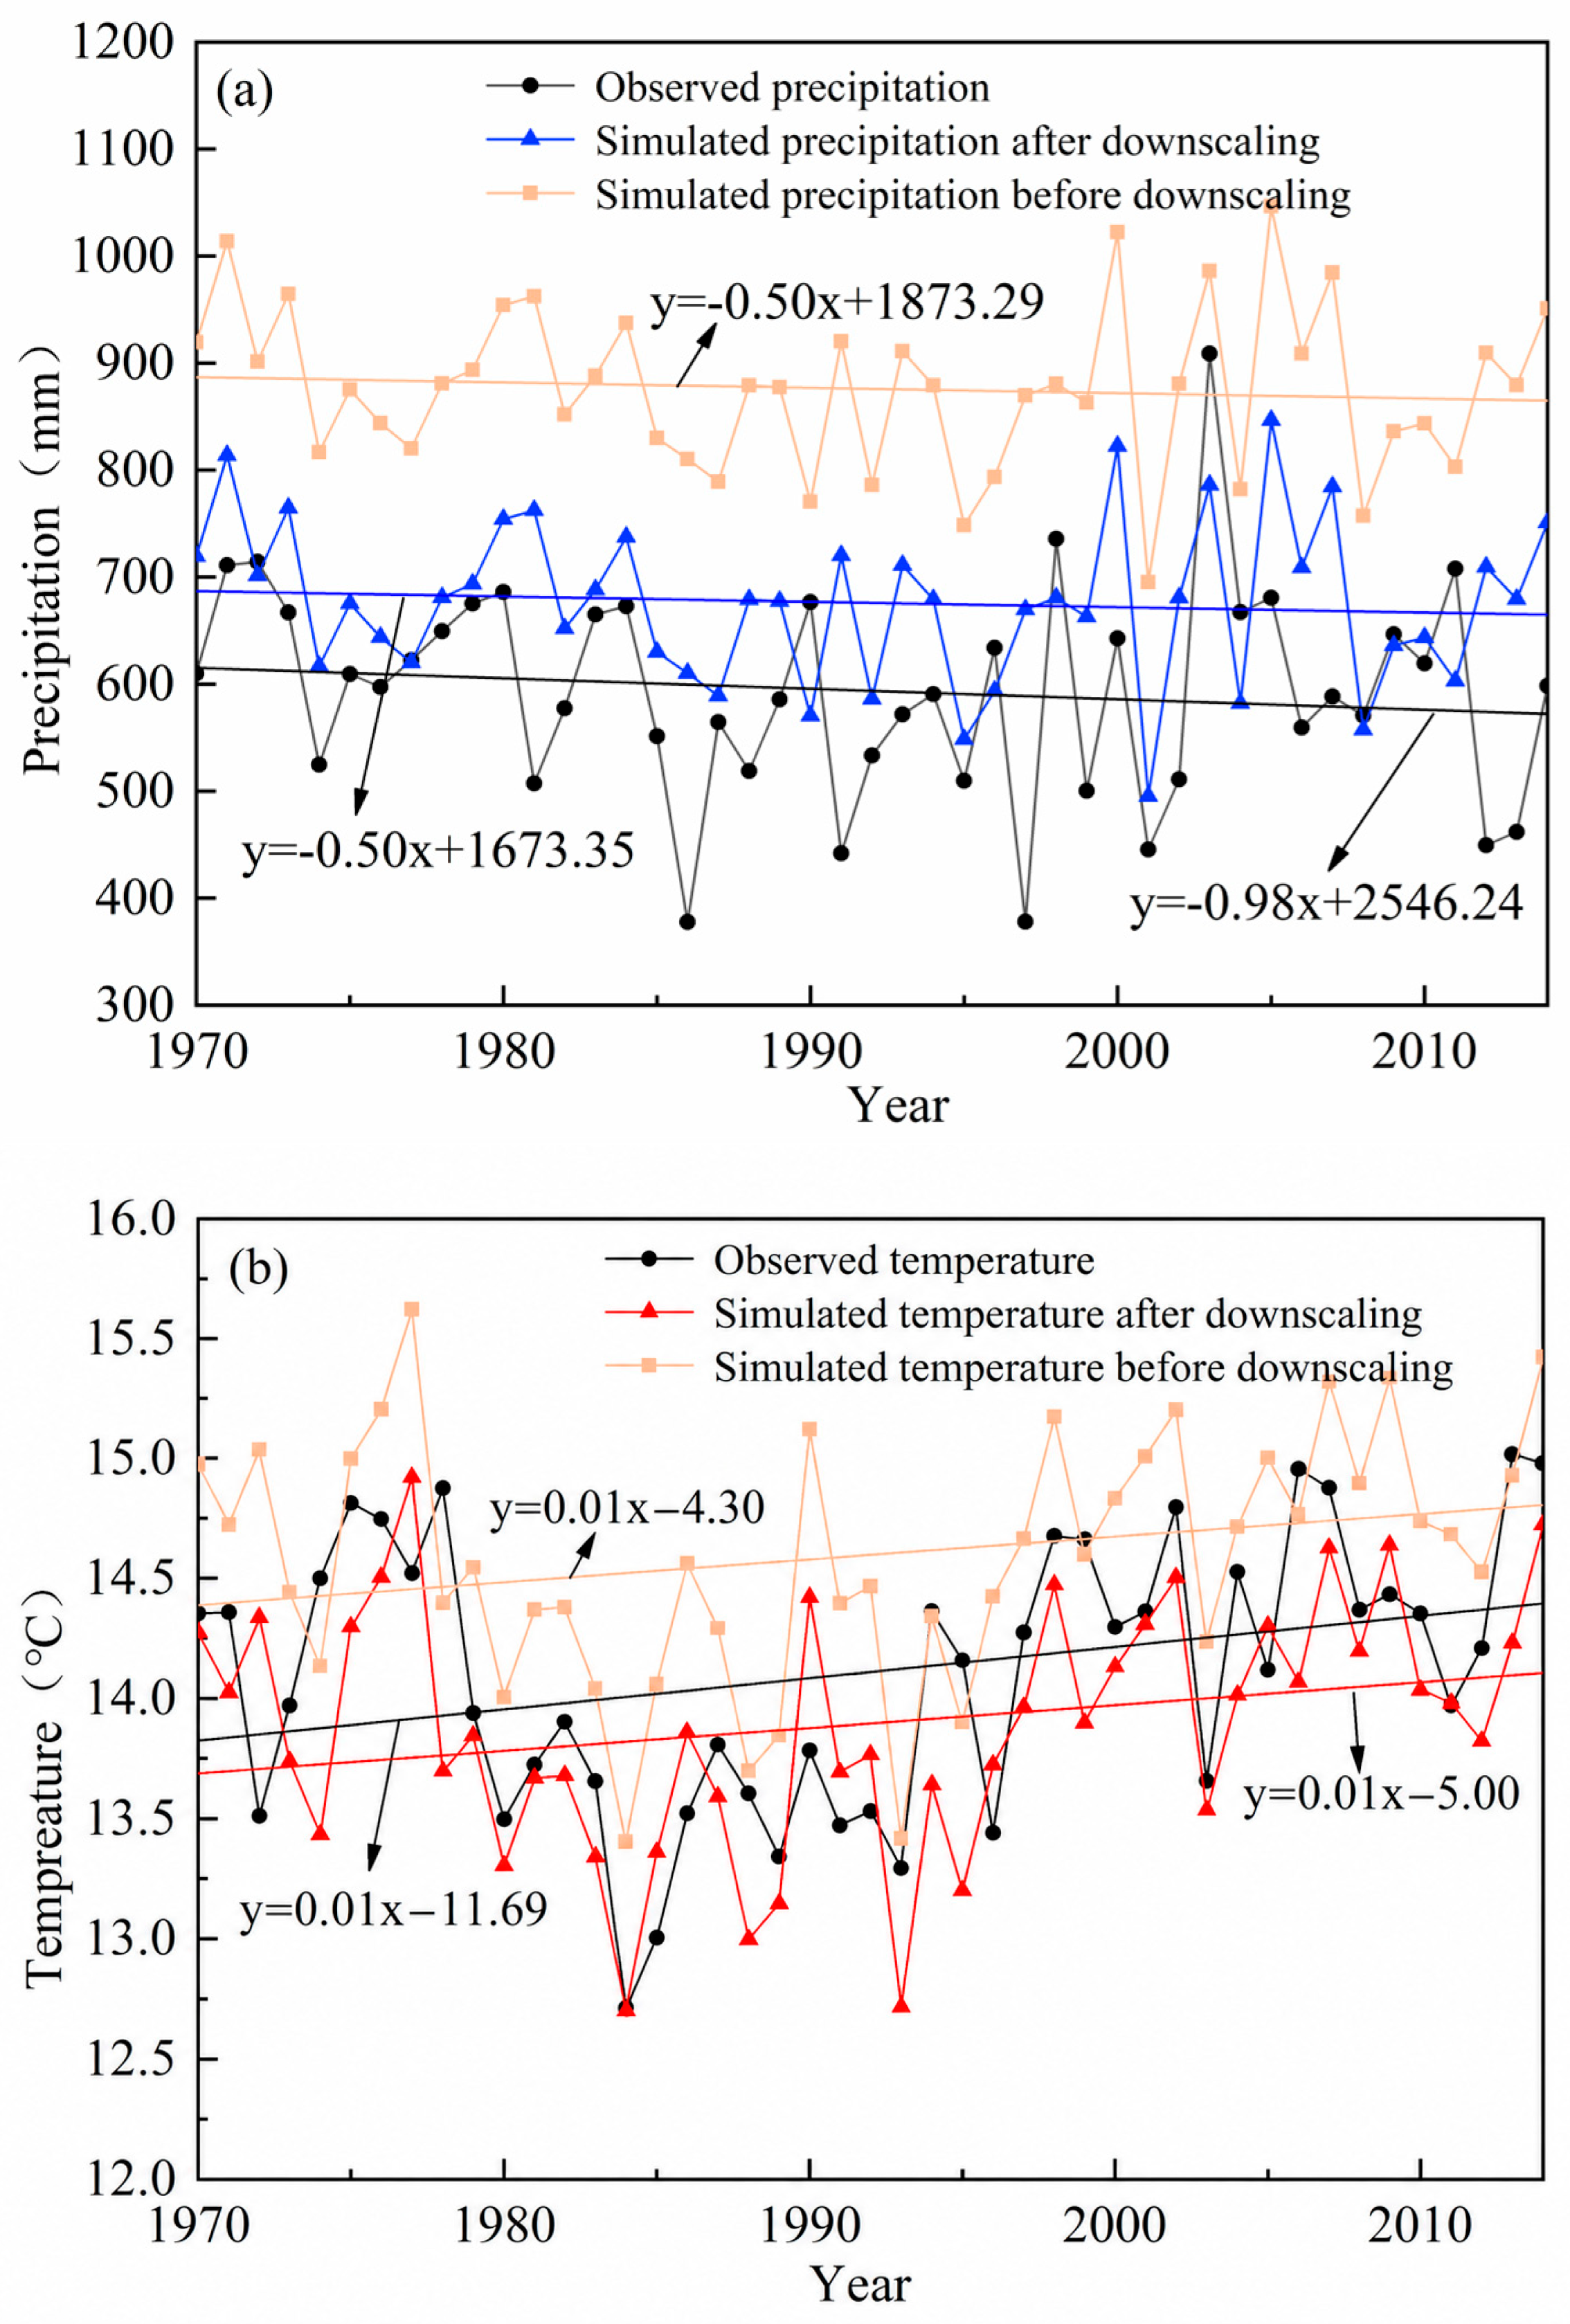
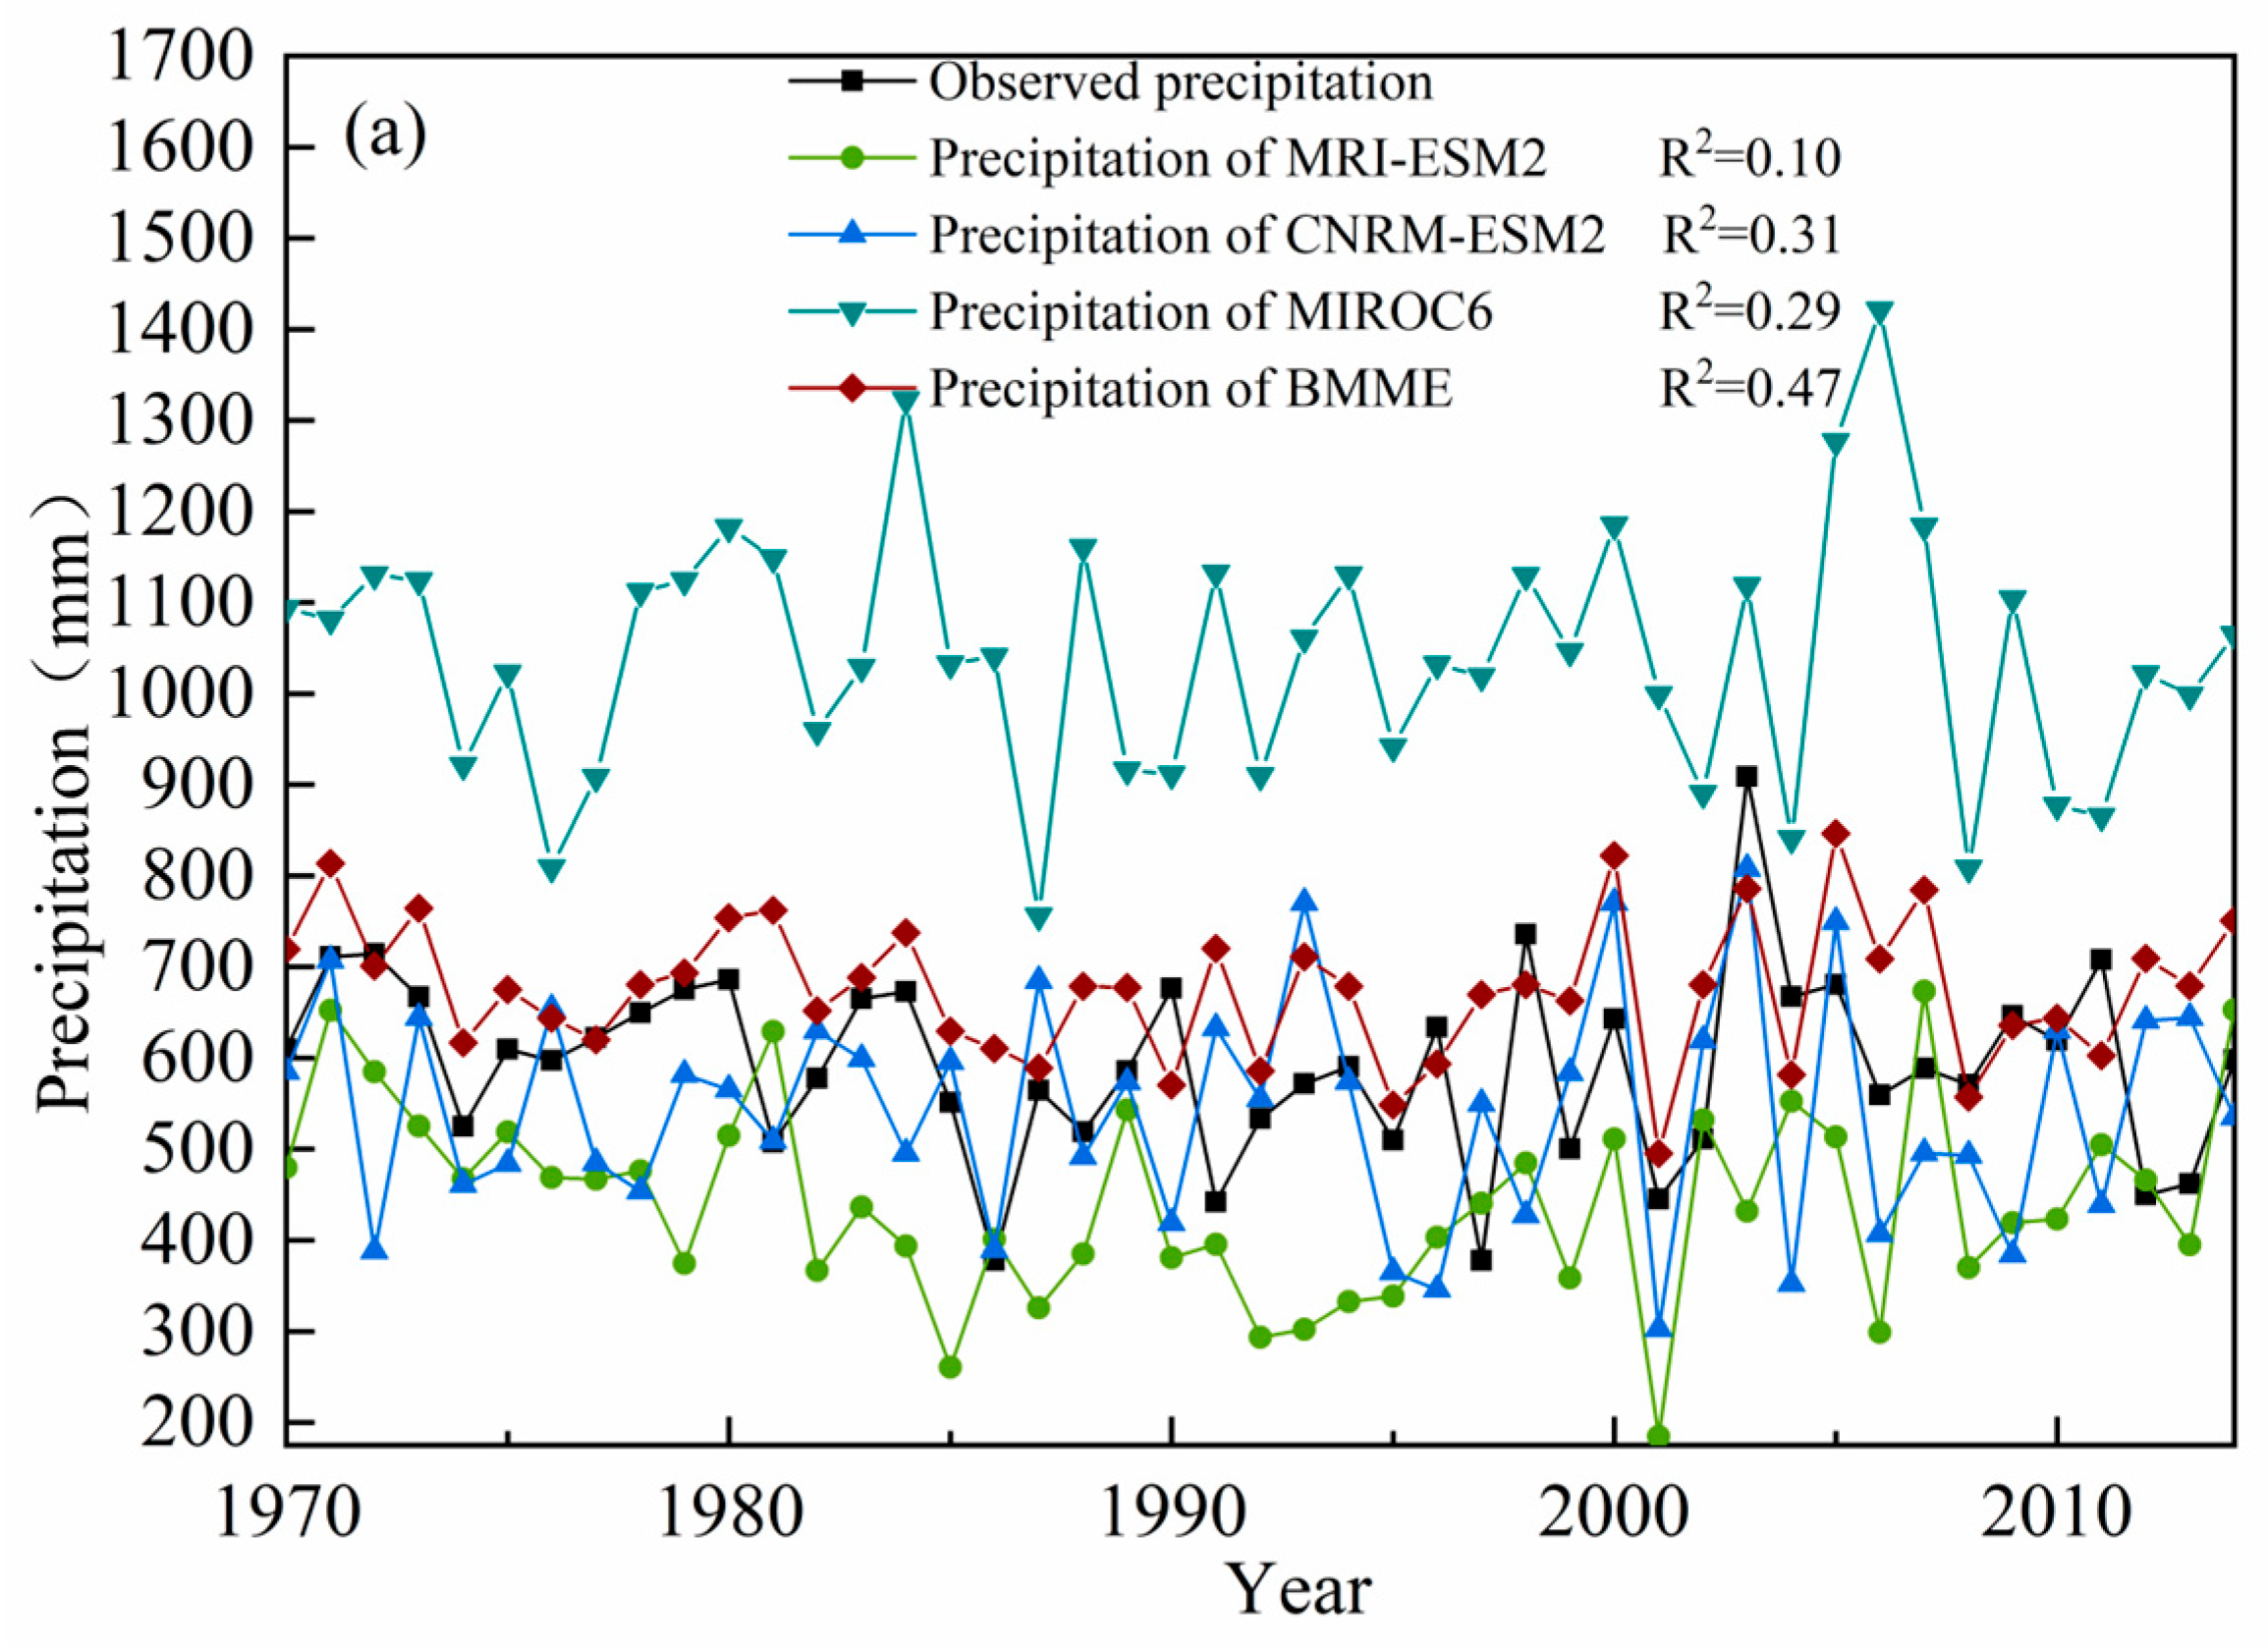
Figure 4 shows the variation trend of annual precipitation and average temperature changes observed and simulated by climate models in the Henan section of the Yellow River from 1970 to 2014. As shown in Figure 4a, the mean yearly precipitation during the 1970–2014 period stood at 593.7 mm, exhibiting a decline at a rate of −9.8 mm/10a. The multi-year average precipitation simulated by the climate model before downscaling was 875.9 mm, showing a decreasing trend at the rate of −5.0 mm/10a, which was 282.2 mm higher than the observed annual average precipitation. After downscaling treatment, the multi-year average precipitation was 675.9 mm, showing a downward trend at the rate of −5.0 mm/10a, which was 82.2 mm higher than the observed annual average precipitation. Although the downscaling procedure effectively corrected the systematic overestimation of raw CMIP6 outputs, a slight positive bias of 82.2 mm (approximately 13%) still exists in the downscaled precipitation relative to observations. This positive bias may lead to a slight overestimation of precipitation totals in the projection period, which could potentially increase the calculated frequency and severity of Extreme Wet (Grade 9) events to a limited extent. To reduce the impact of this residual bias, the thresholds for drought and wetness identification were kept consistent with the national standard throughout the historical and future periods, ensuring the comparability of event identification results [44].
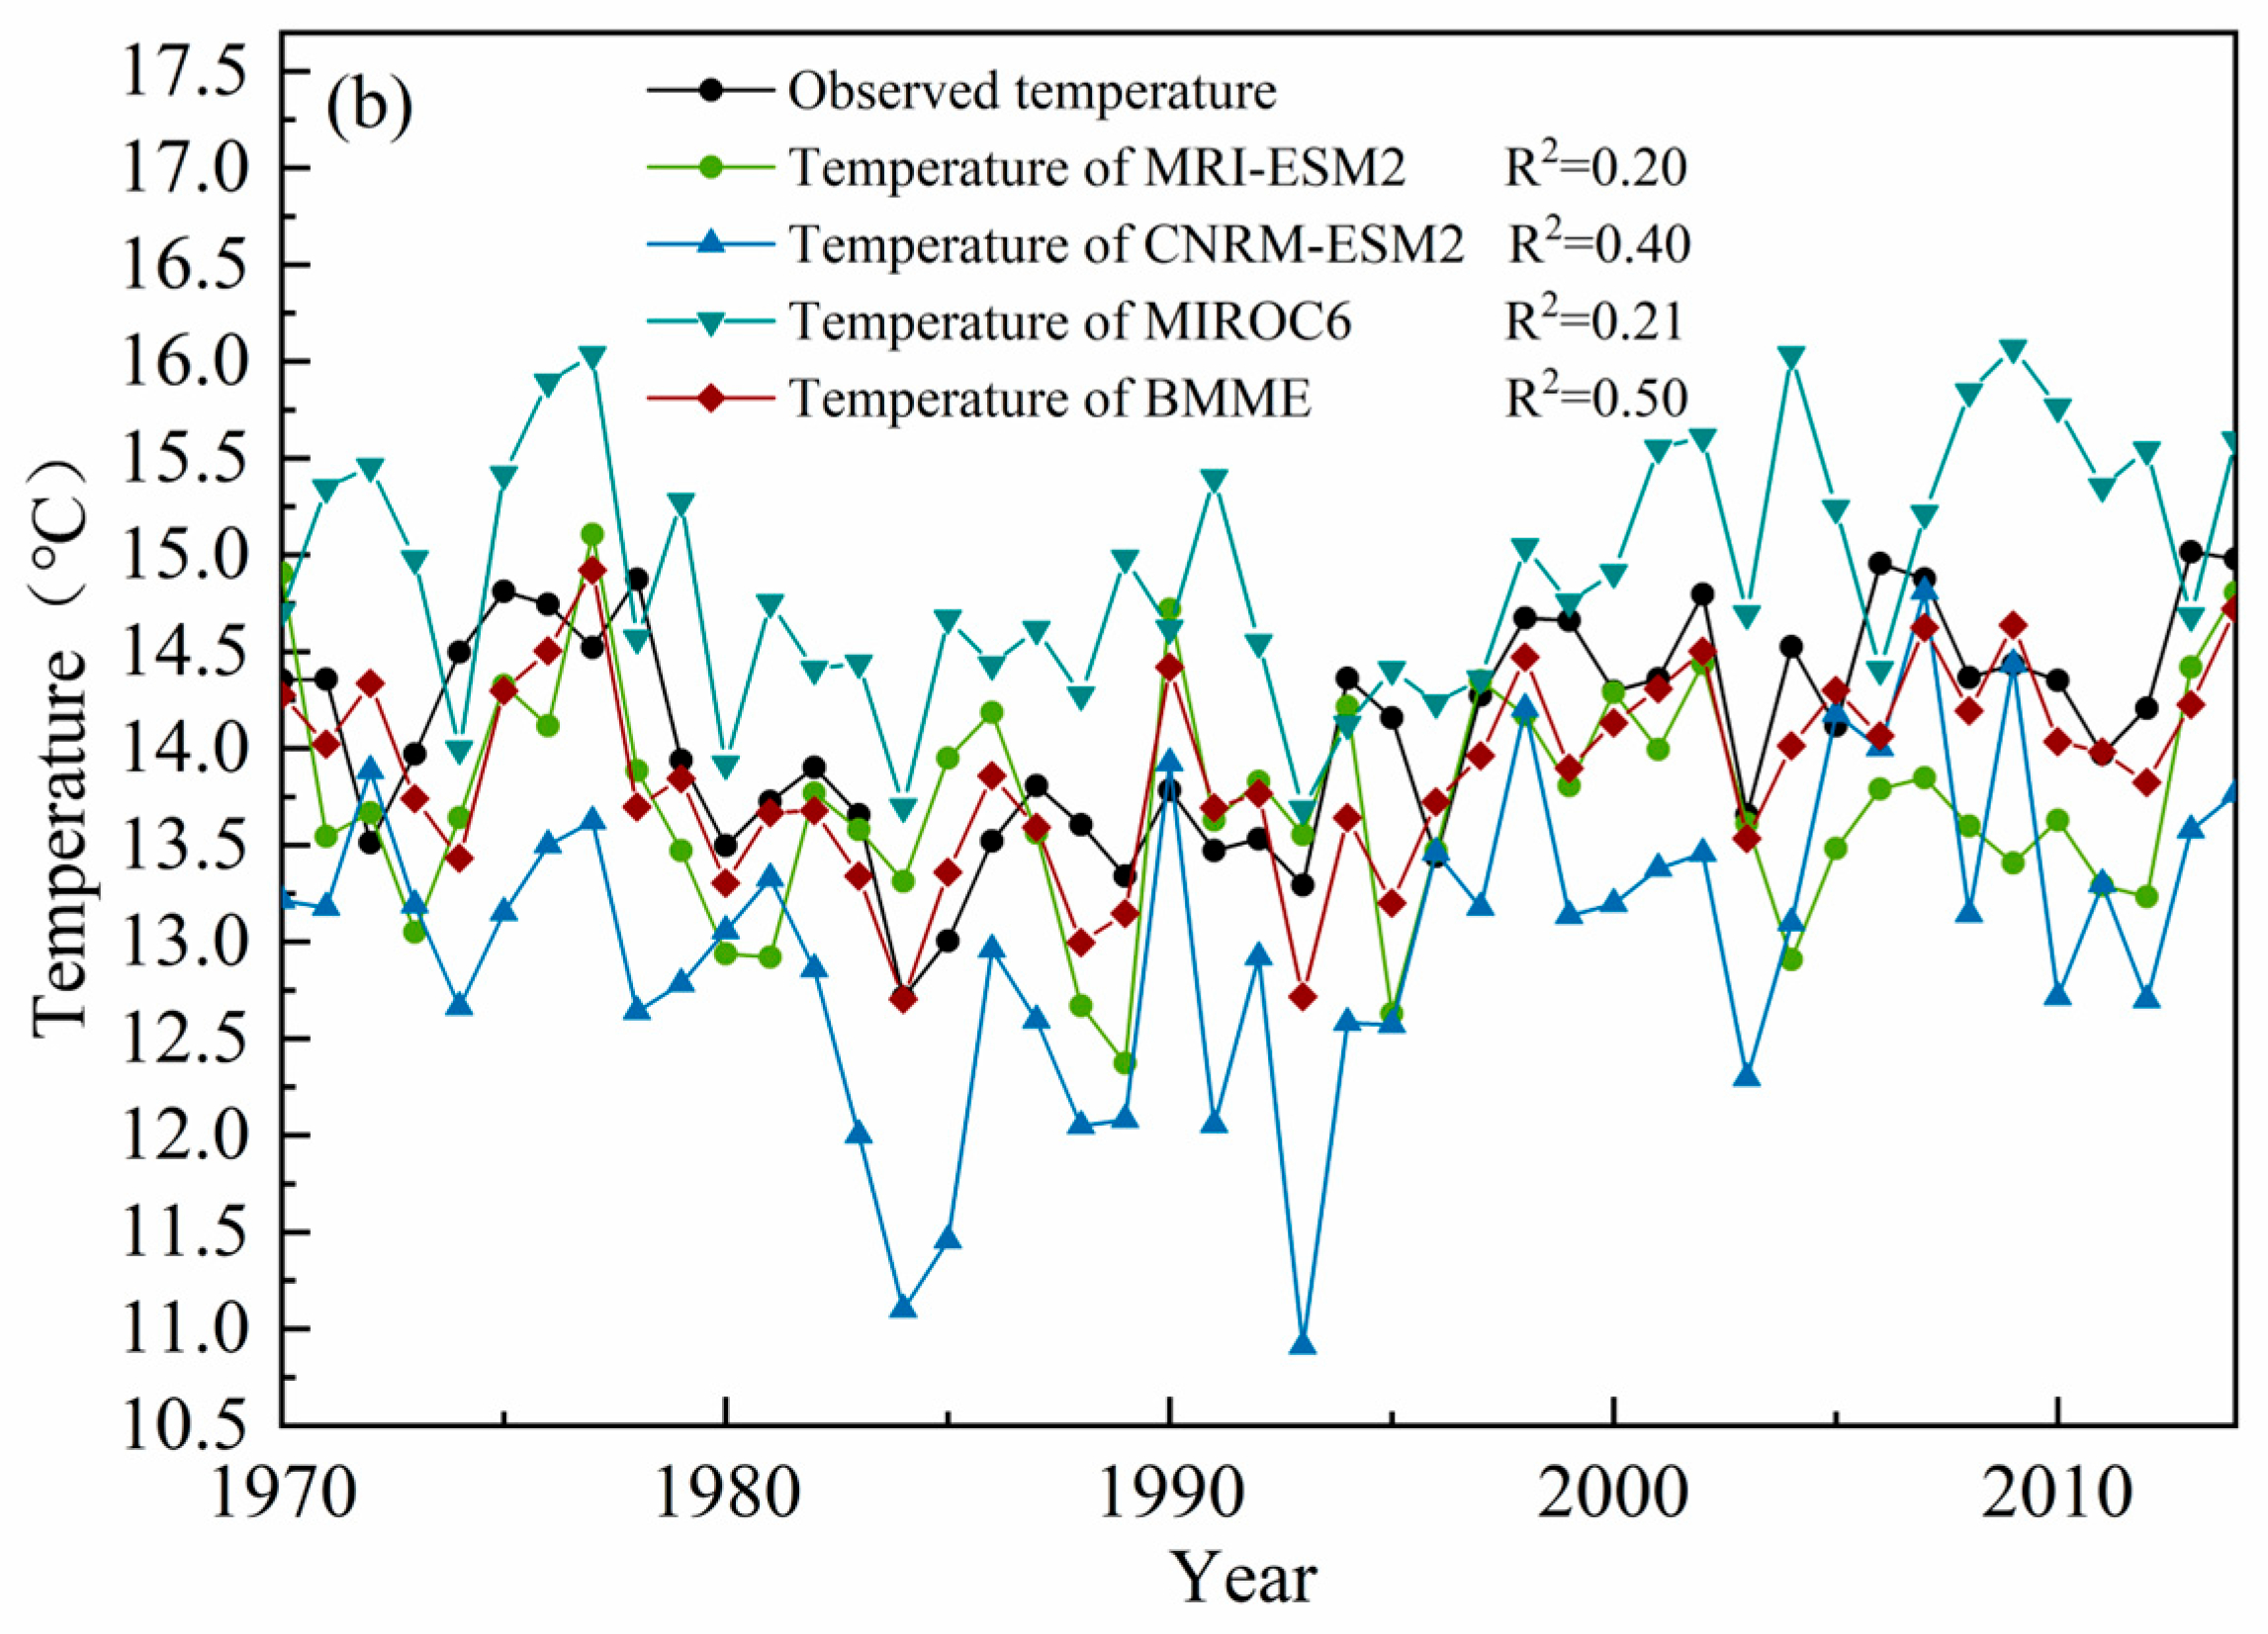
The average annual temperature of the Henan section of the Yellow River from 1970 to 2014 was 14.1 °C, increasing at a rate of 0.13 °C/10a. The annual average temperature simulated by the climate model before downscaling is 14.6 °C, increasing at the rate of 0.09 °C/10a, and is 0.5 °C higher than the observed annual average temperature. After downscaling, the multi-year average temperature simulated by the climate model was 13.9 °C, with an upward trend of 0.09 °C/10a, which was 0.2 °C lower than the measured annual average temperature. Evidence suggests that post-downscaling climate projections for both precipitation and temperature align closely with observed data, demonstrating minimal deviation and a highly synchronized evolutionary trend.
Figure 5 shows precipitation and temperature from individual CMIP6 models and the BMME mean with historical observations. The results indicate that several single models exhibit pronounced systematic biases during the historical period, either overestimating or underestimating the observed values, which in turn degrades the overall fidelity of the simulated time series. In contrast, the BMME approach integrated information across multiple models and effectively mitigated model-specific biases. As a result, the ensemble simulations showed improved agreement with observations in a statistical sense and demonstrated a better capacity to reproduce historical climate variability. The coefficient of determination (R2) shows that the BMME outperforms all individual CMIP6 models in simulating both precipitation (R2 = 0.47) and temperature (R2 = 0.50). The MRI-ESM2 model shows the lowest performance for precipitation (R2 = 0.10), while the CNRM-ESM2 model performs best among single models for both variables.
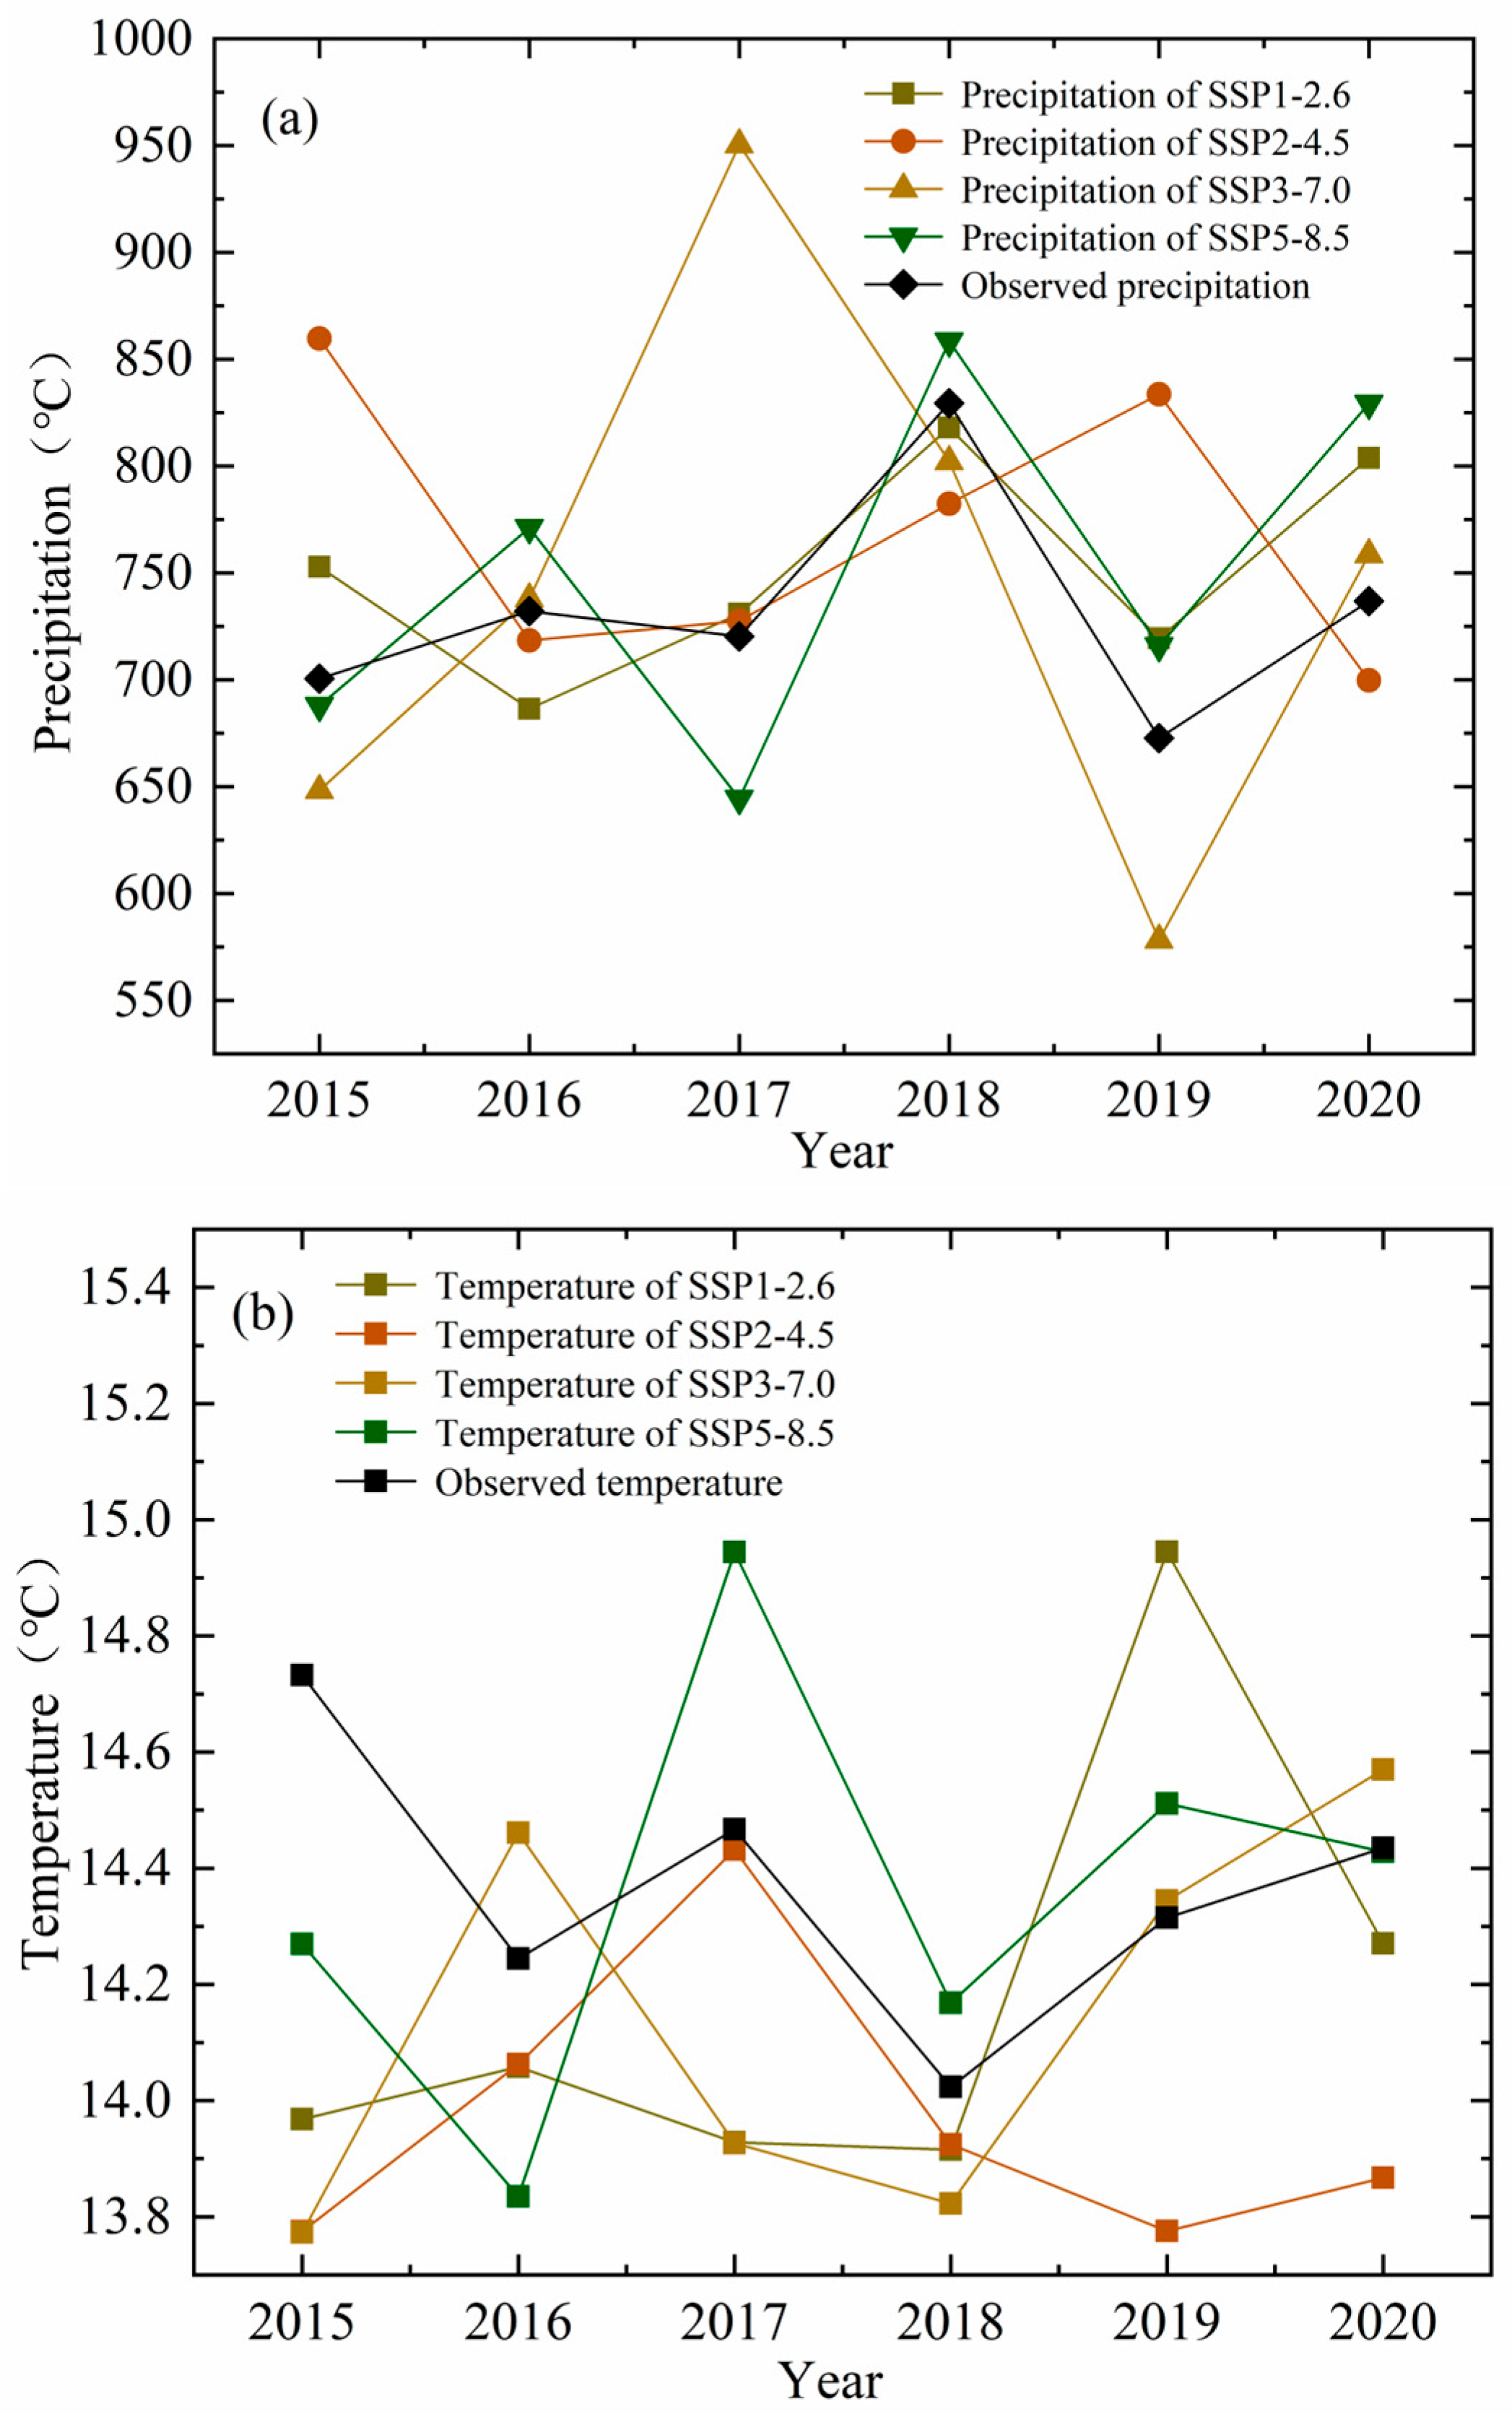
Figure 6 shows the comparison between observed data and BMME simulations under multiple SSP scenarios during 2015–2020. The results indicated that the BMME demonstrates a satisfactory ability to reproduce the interannual variability of precipitation and temperature. The simulated values generally follow the observed fluctuations, indicating that the ensemble approach effectively captures short-term climate variability.

3.2. Analysis of the Evolution of Historical Drought and Wet Conditions in the Henan Section of the Yellow River

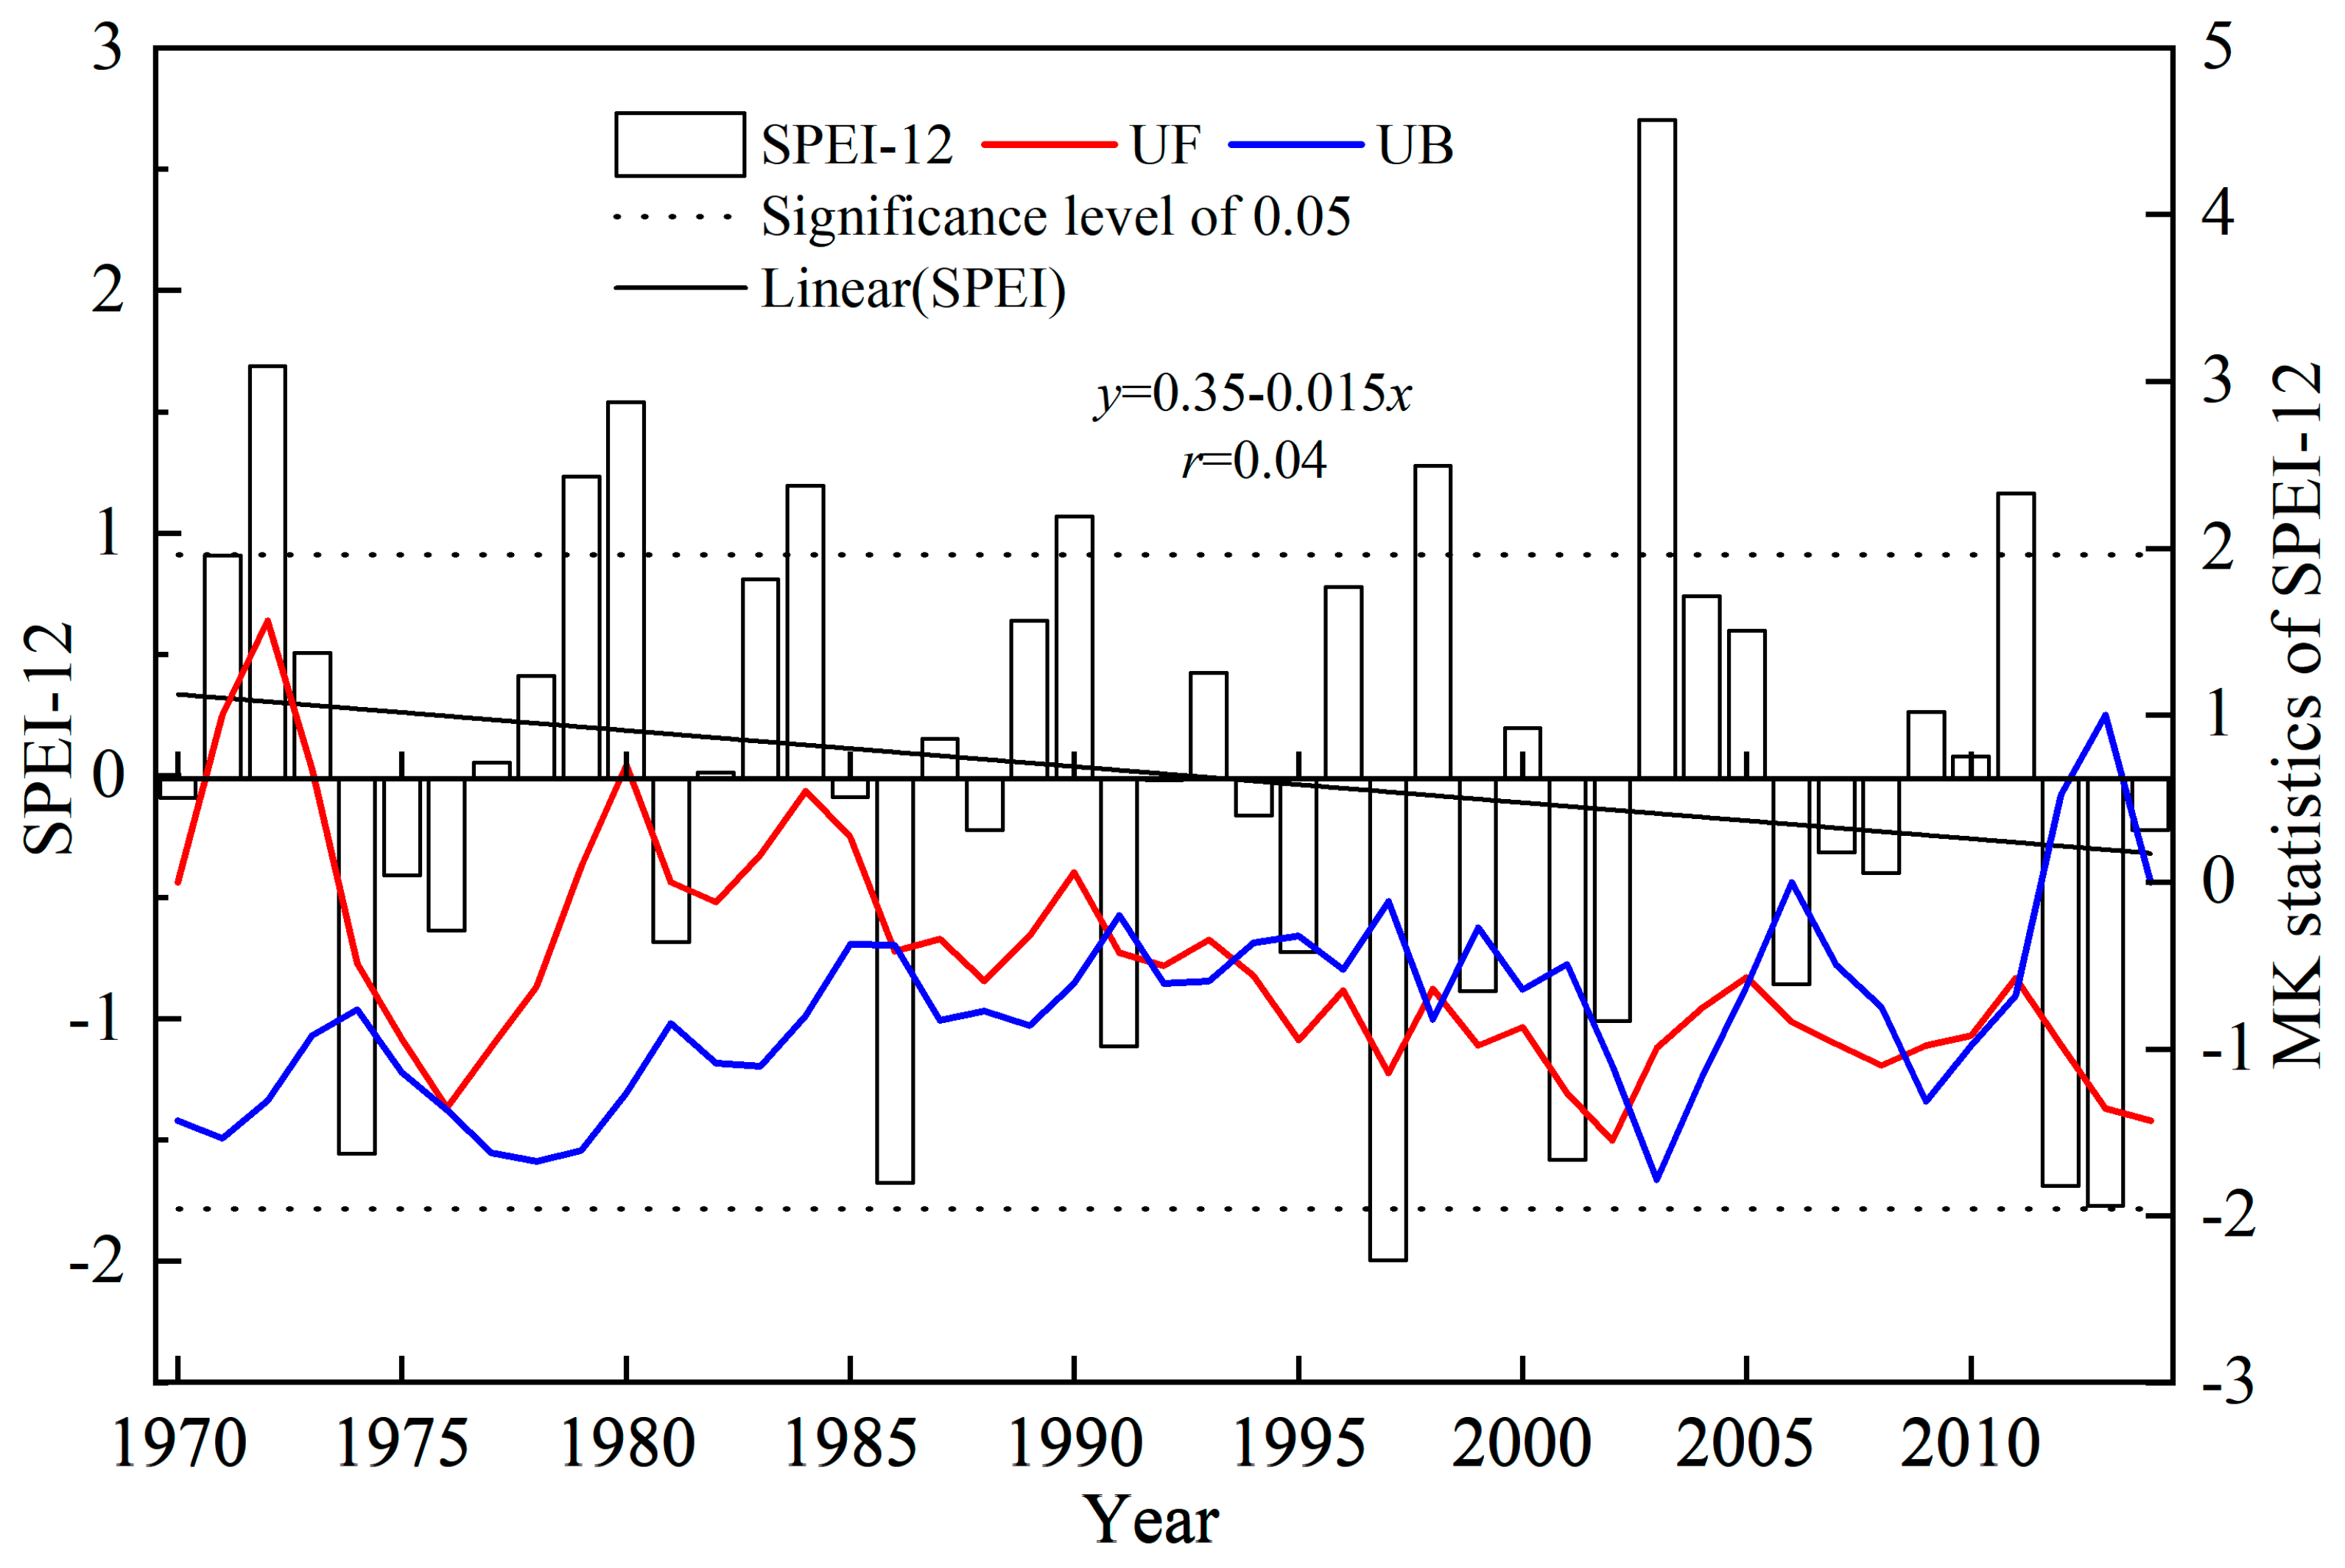
Figure 7 shows the mutation test results of SPEI-12 values from 1970 to 2020 on the basis of the Mann–Kendall test. It can be seen that the overall SPEI-12 time series shows a declining trend at a rate of 0.12/10a, and the negative value of SPEI-12 increases roughly after 1993, indicating a marked increase in the occurrence and severity of drought events. The UF and UB curves intersected in 1991 and 2003, both of which were within a significant range. Combined with SPEI-12 values, it can be inferred that the study area experienced frequent droughts and wet periods between 1990 and 2003. Moreover, the UF curve remained below 0 and showed a downward trend after 1991, which also indicated that the drought degree was increasing.
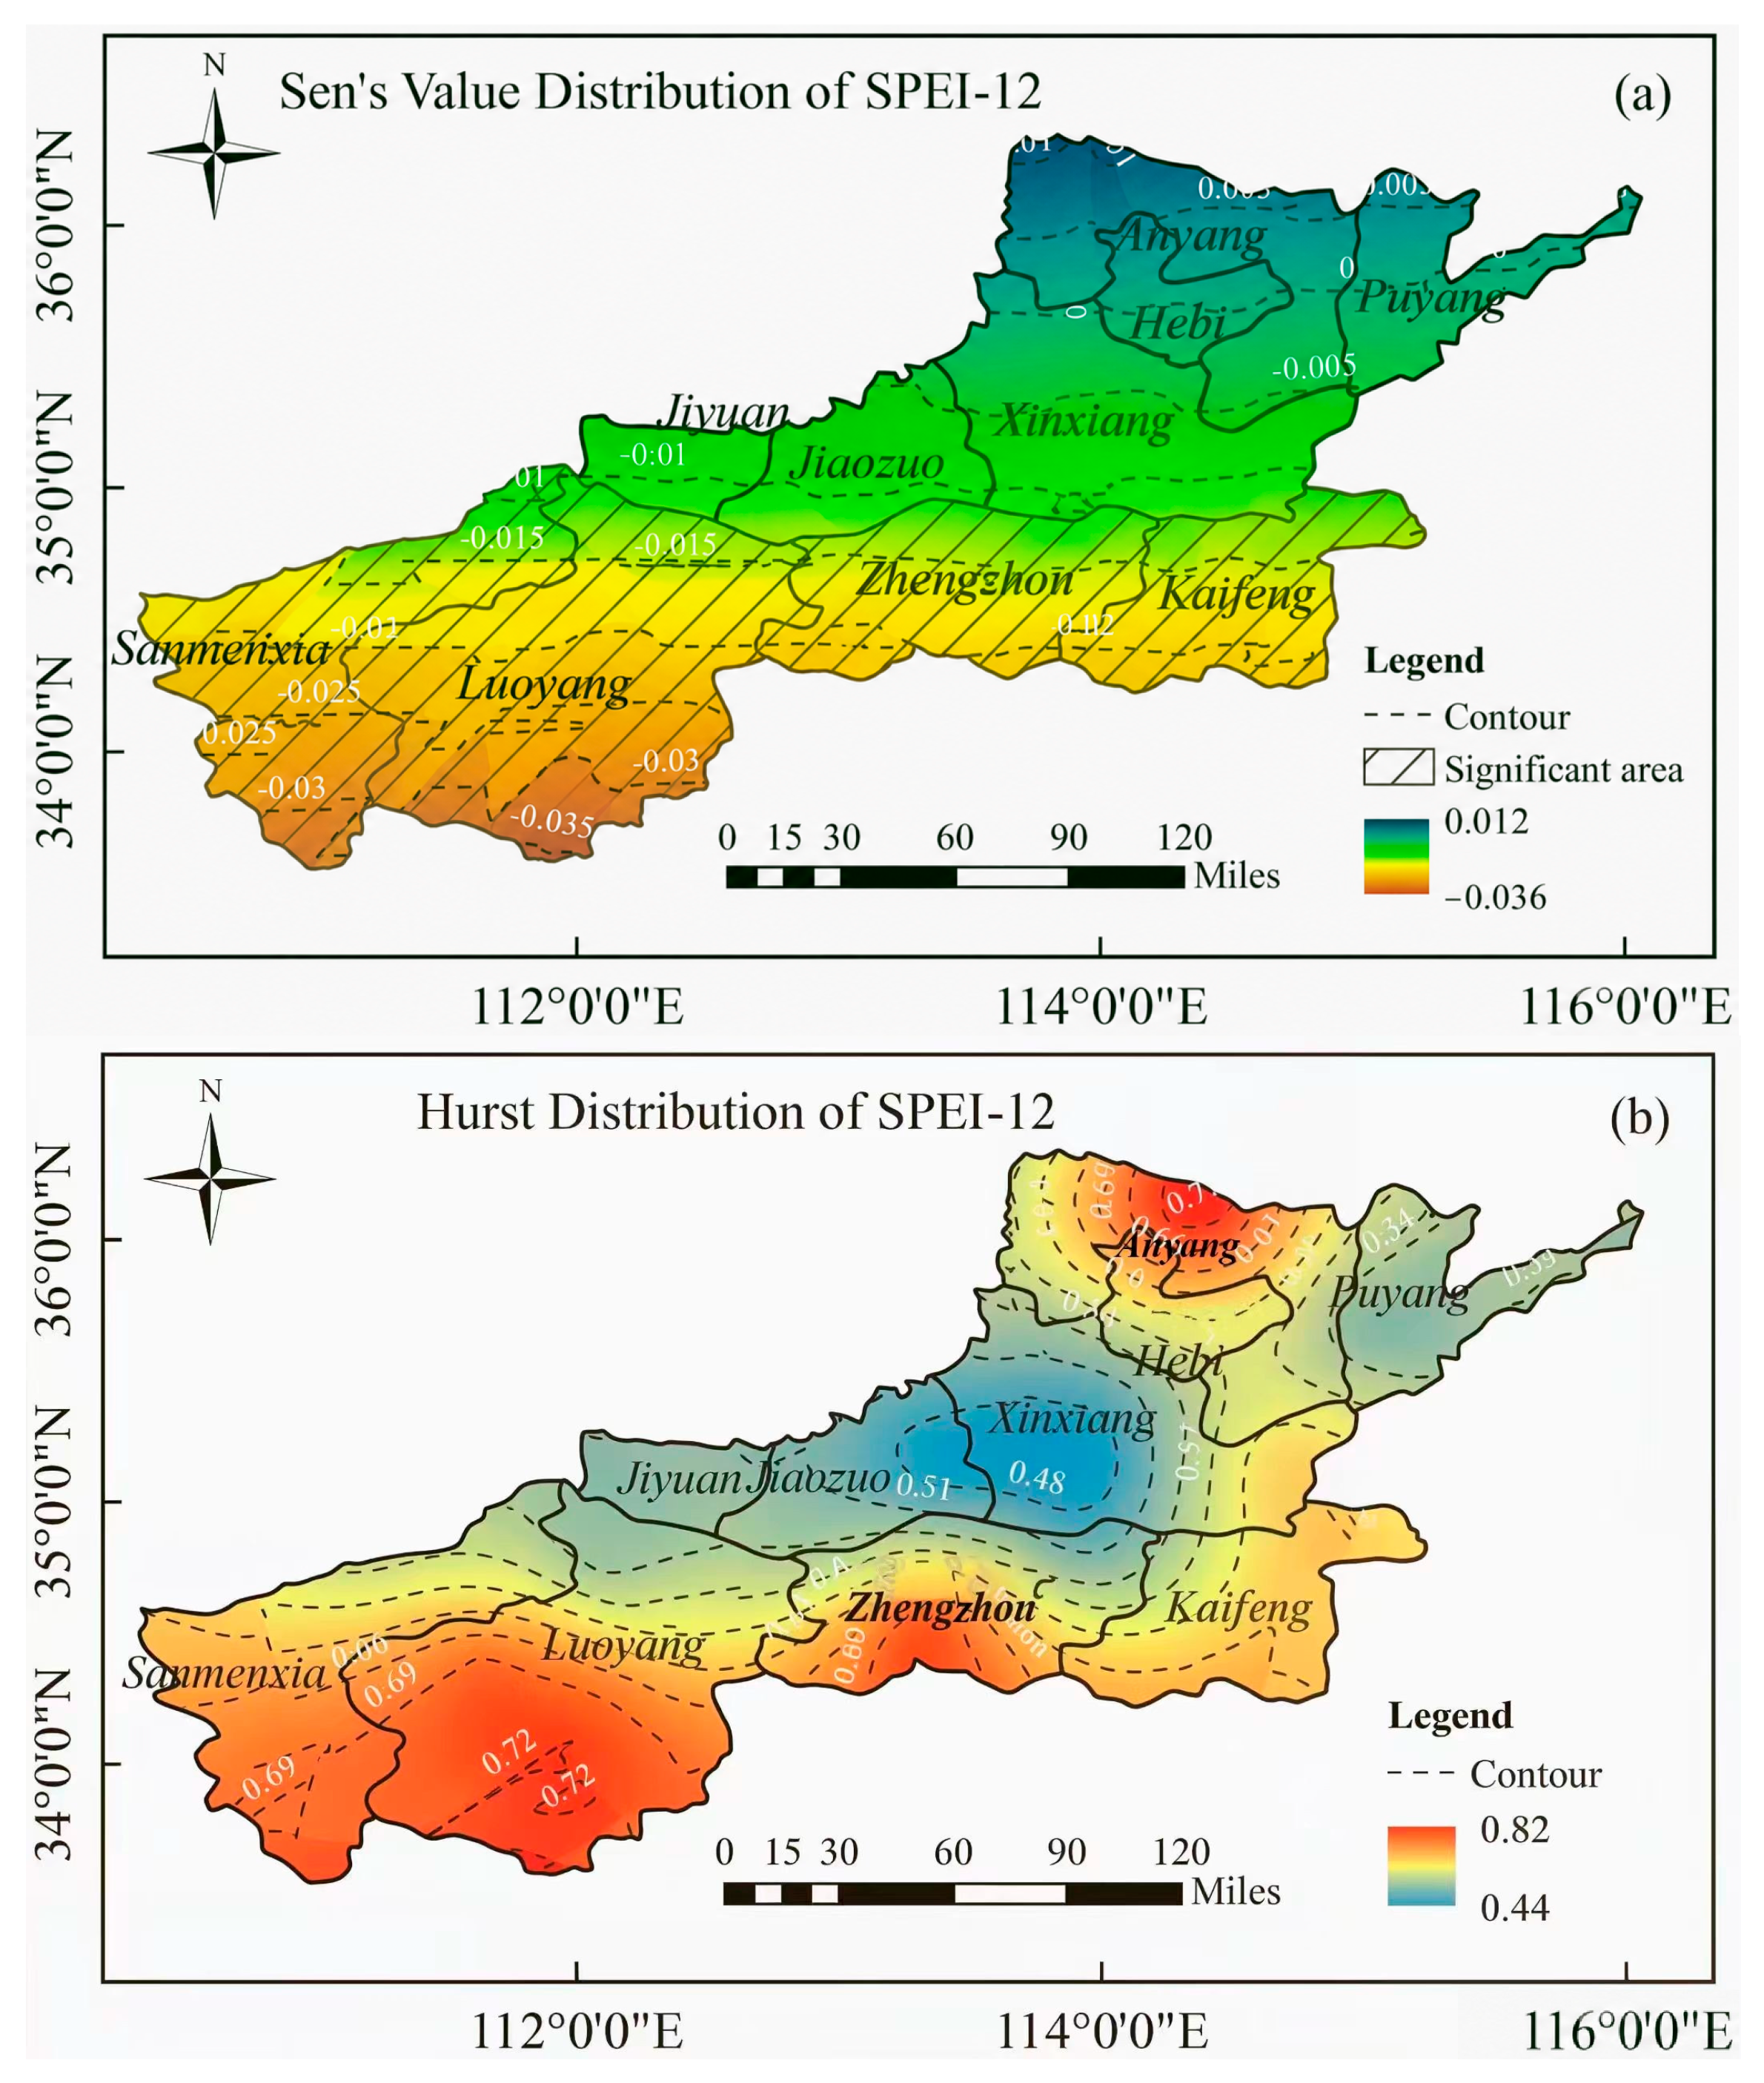
To investigate the future evolution of drought and wet conditions, Sen’s slope and the Hurst index were used to analyze the SPEI-12 change trend in the Henan section of the Yellow River from 1970 to 2014 (as shown in Figure 8a,b). The spatial pattern of Sen’s slope is shown in Figure 8a. Sen’s slope was less than 0 in the area south of Hebi–Puyang and SPEI values displayed an increasing tendency, while Sen’s slope > 0 in the north area and SPEI-12 showed an upward trend. The Hurst value obtained based on historical SPEI-12 is shown in Figure 8b. Obvious spatial differences were observed across the study area. Only the central part of Xinxiang exhibited H < 0.5, although the value remained close to 0.5, while the corresponding Sen’s slope ranged between −0.01 and 0, indicating that the slight decreasing tendency of SPEI may weaken or remain relatively stable in future periods. In contrast, most regions showed H > 0.5, suggesting persistent hydroclimatic tendencies. In the southern part of Hebi–Puyang, where Sen’s slope was negative and H > 0.5, the current drying tendency of SPEI-12 is likely to persist in future periods, particularly in Sanmenxia, Luoyang, and Zhengzhou. Conversely, in the northern part of Hebi–Puyang, positive Sen’s slope values combined with H > 0.5 indicate that the existing wetting tendency is likely to continue, especially in parts of Anyang. Regions with Sen < 0 and H > 0.5 are therefore characterized by statistically persistent drying tendencies rather than random fluctuations. This indicates that the drying signal is not random fluctuation but a long-term sustained tendency, implying increasing challenges for regional water supply stability and agricultural irrigation. For the Henan section, such persistent drying suggests a need for strengthened drought preparedness, optimized water allocation, and improved agricultural resilience to water deficit.

3.3. Analysis of the Temporal Trend of Future Dry and Wet Conditions in the Henan Section of the Yellow River

3.3.1. Analysis of Change Trends of Future Drought and Wet Conditions in Henan Section of the Yellow River

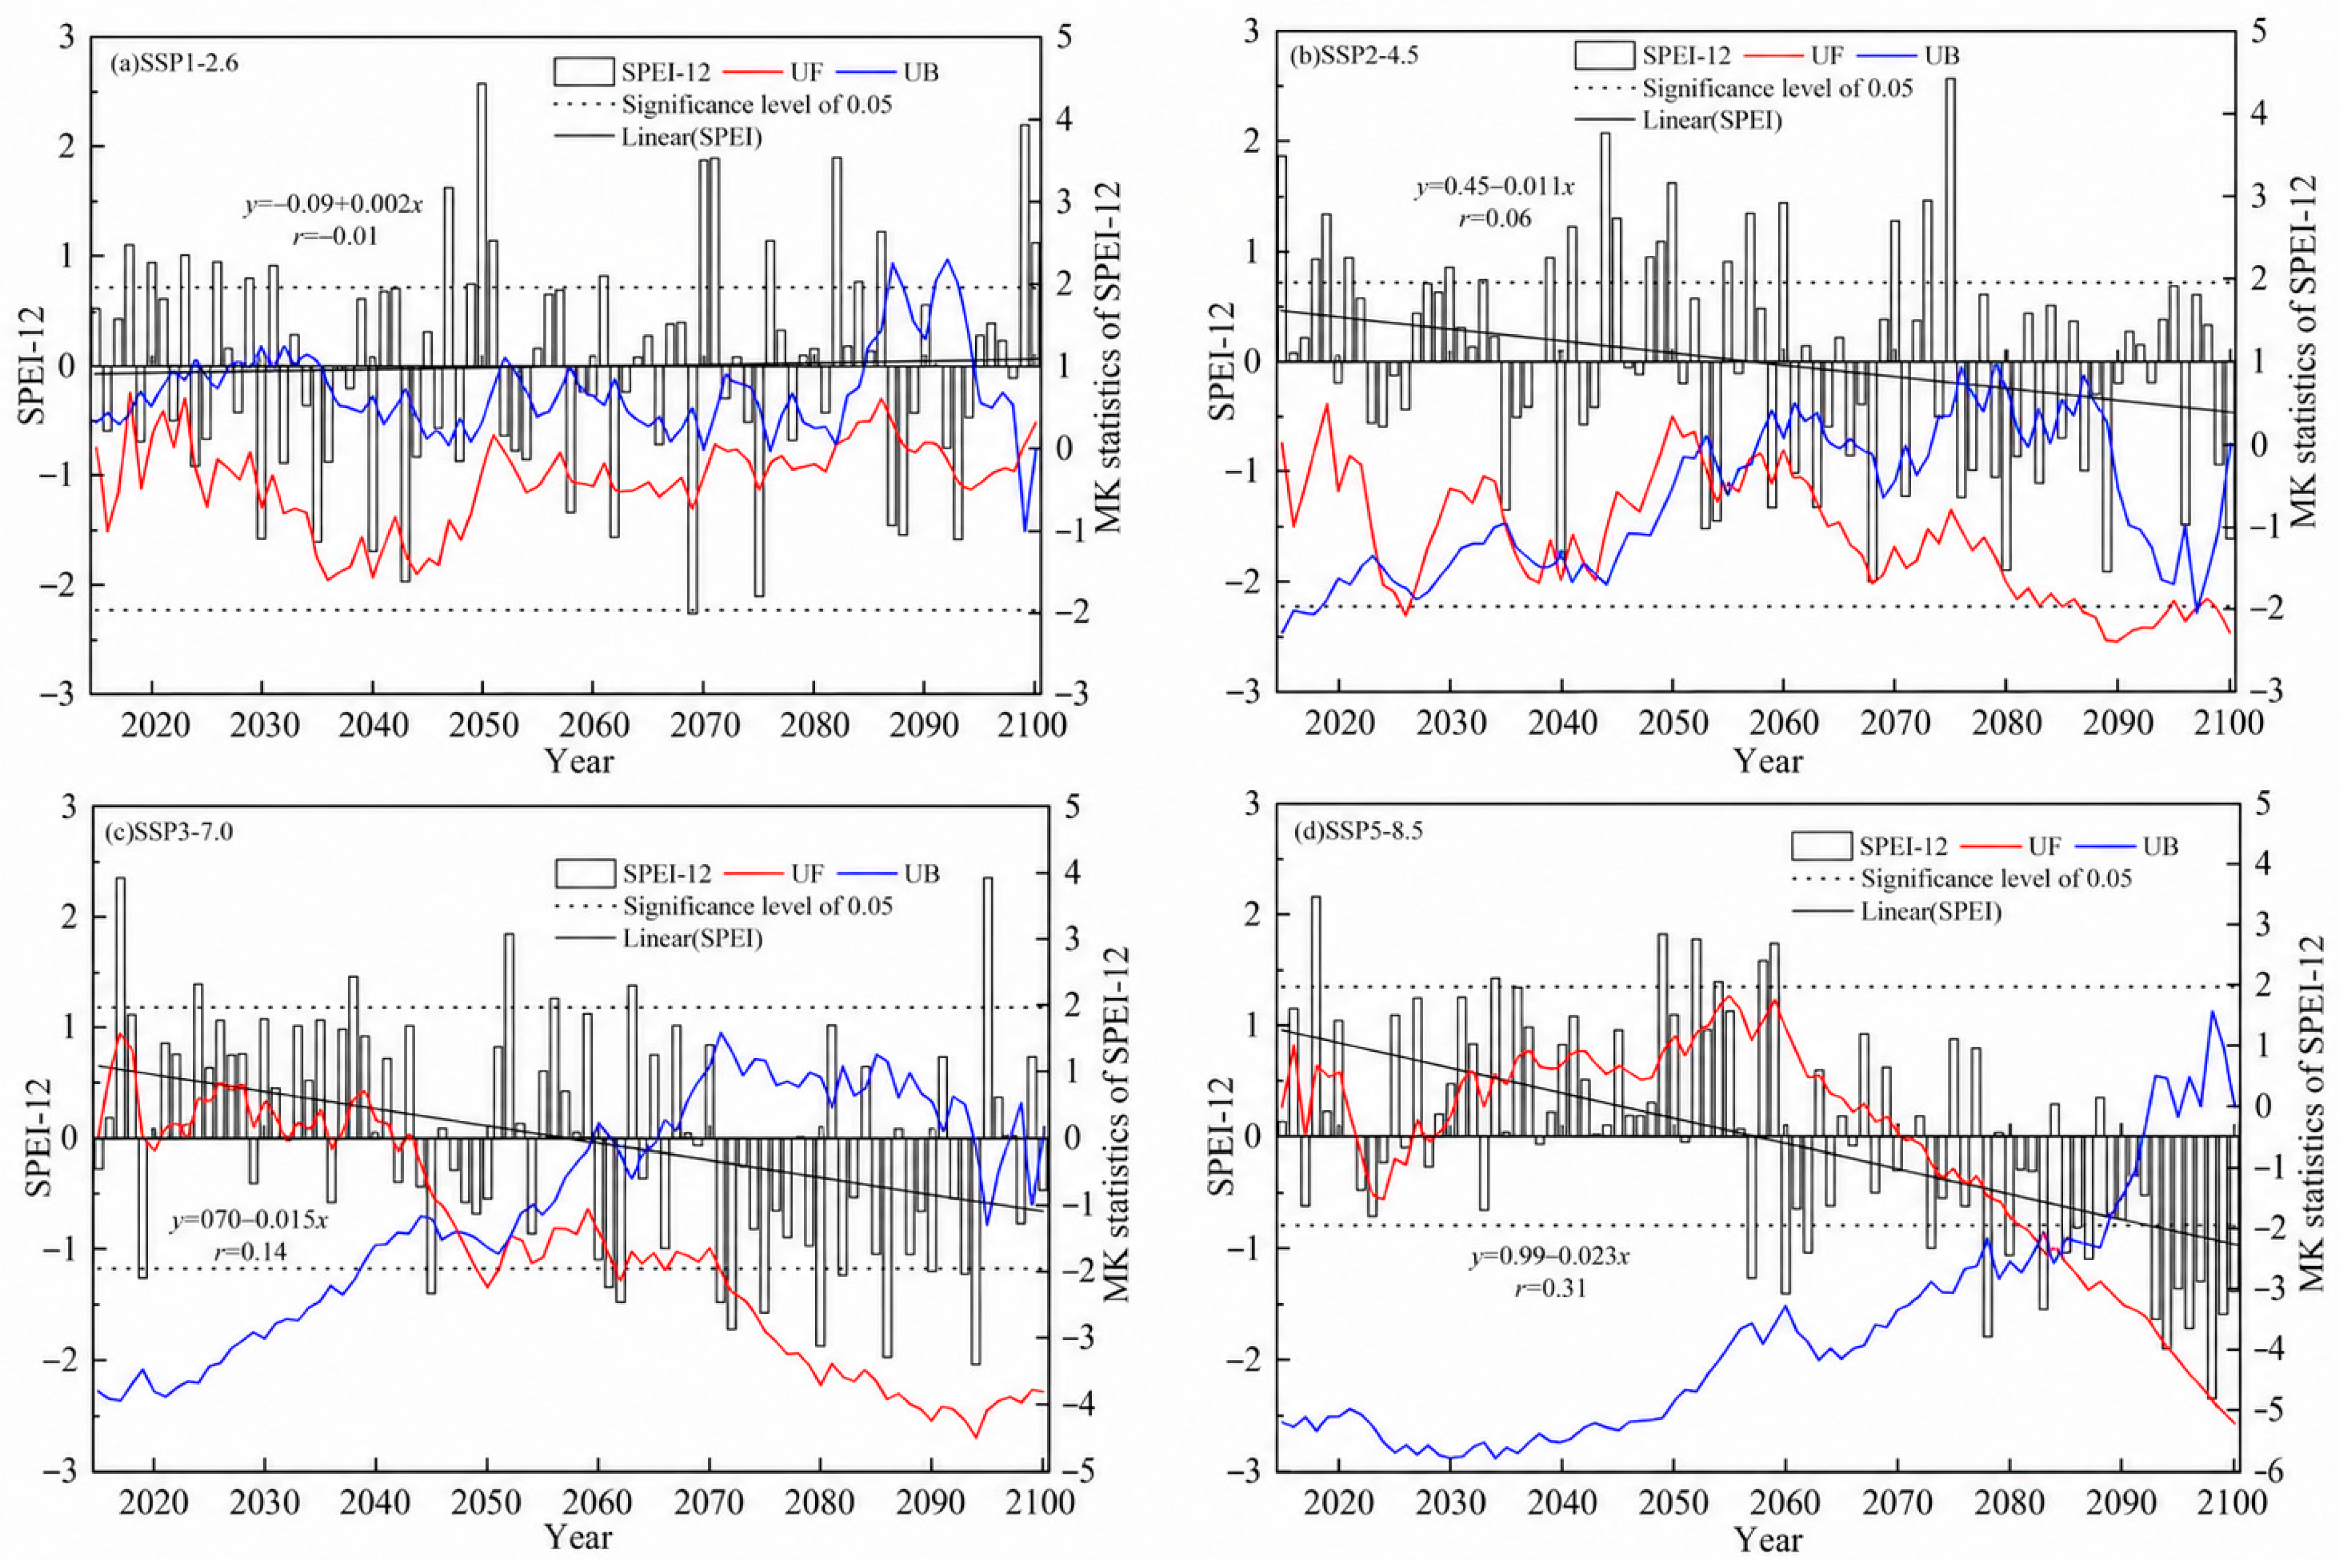
Utilizing the outcomes from BMME simulations, calculations were performed for the SPEI-12 and MK mutation tests across various SSP-RCPs for the period 2015–2100 (as shown in Figure 9). Figure 9 illustrates significant disparities in the changes in drought and wet condition indices under different SSP-RCP scenarios. From the fitting and UF curves, it can be seen that a general humidification tendency is unique to the SSP1-2.6 scenario and the rising rate is 0.02/10a. With the increase in situational radiative forcing, the other three scenarios are all drying trends, and the decreasing rates are 0.11/10a, 0.15/10a and 0.23/10a respectively. Compared with the historical SPEI-12 sequence, it is evident that the overall change rate of drought and wet conditions in the SSP2-4.5 scenario is similar to that in the historical period, but the SPEI-12 in this scenario exhibits increased hydro-climatic volatility, showing frequent wet periods during the early to mid-21st century, while frequent drought events occurred in the latter part of the century. This behavior differs from historical patterns, but rather than indicating inconsistency, it may reflect a nonlinear response of the regional hydroclimate system under intermediate radiative forcing. Such transitions suggest a potential shift toward increased variability and regime change in drought–wet dynamics under future climate conditions. Overall, it is more likely for the SSP2-4.5 scenario to conform to the development.

3.3.2. Change Period of Future Drought and Wet Conditions in Henan Section of the Yellow River

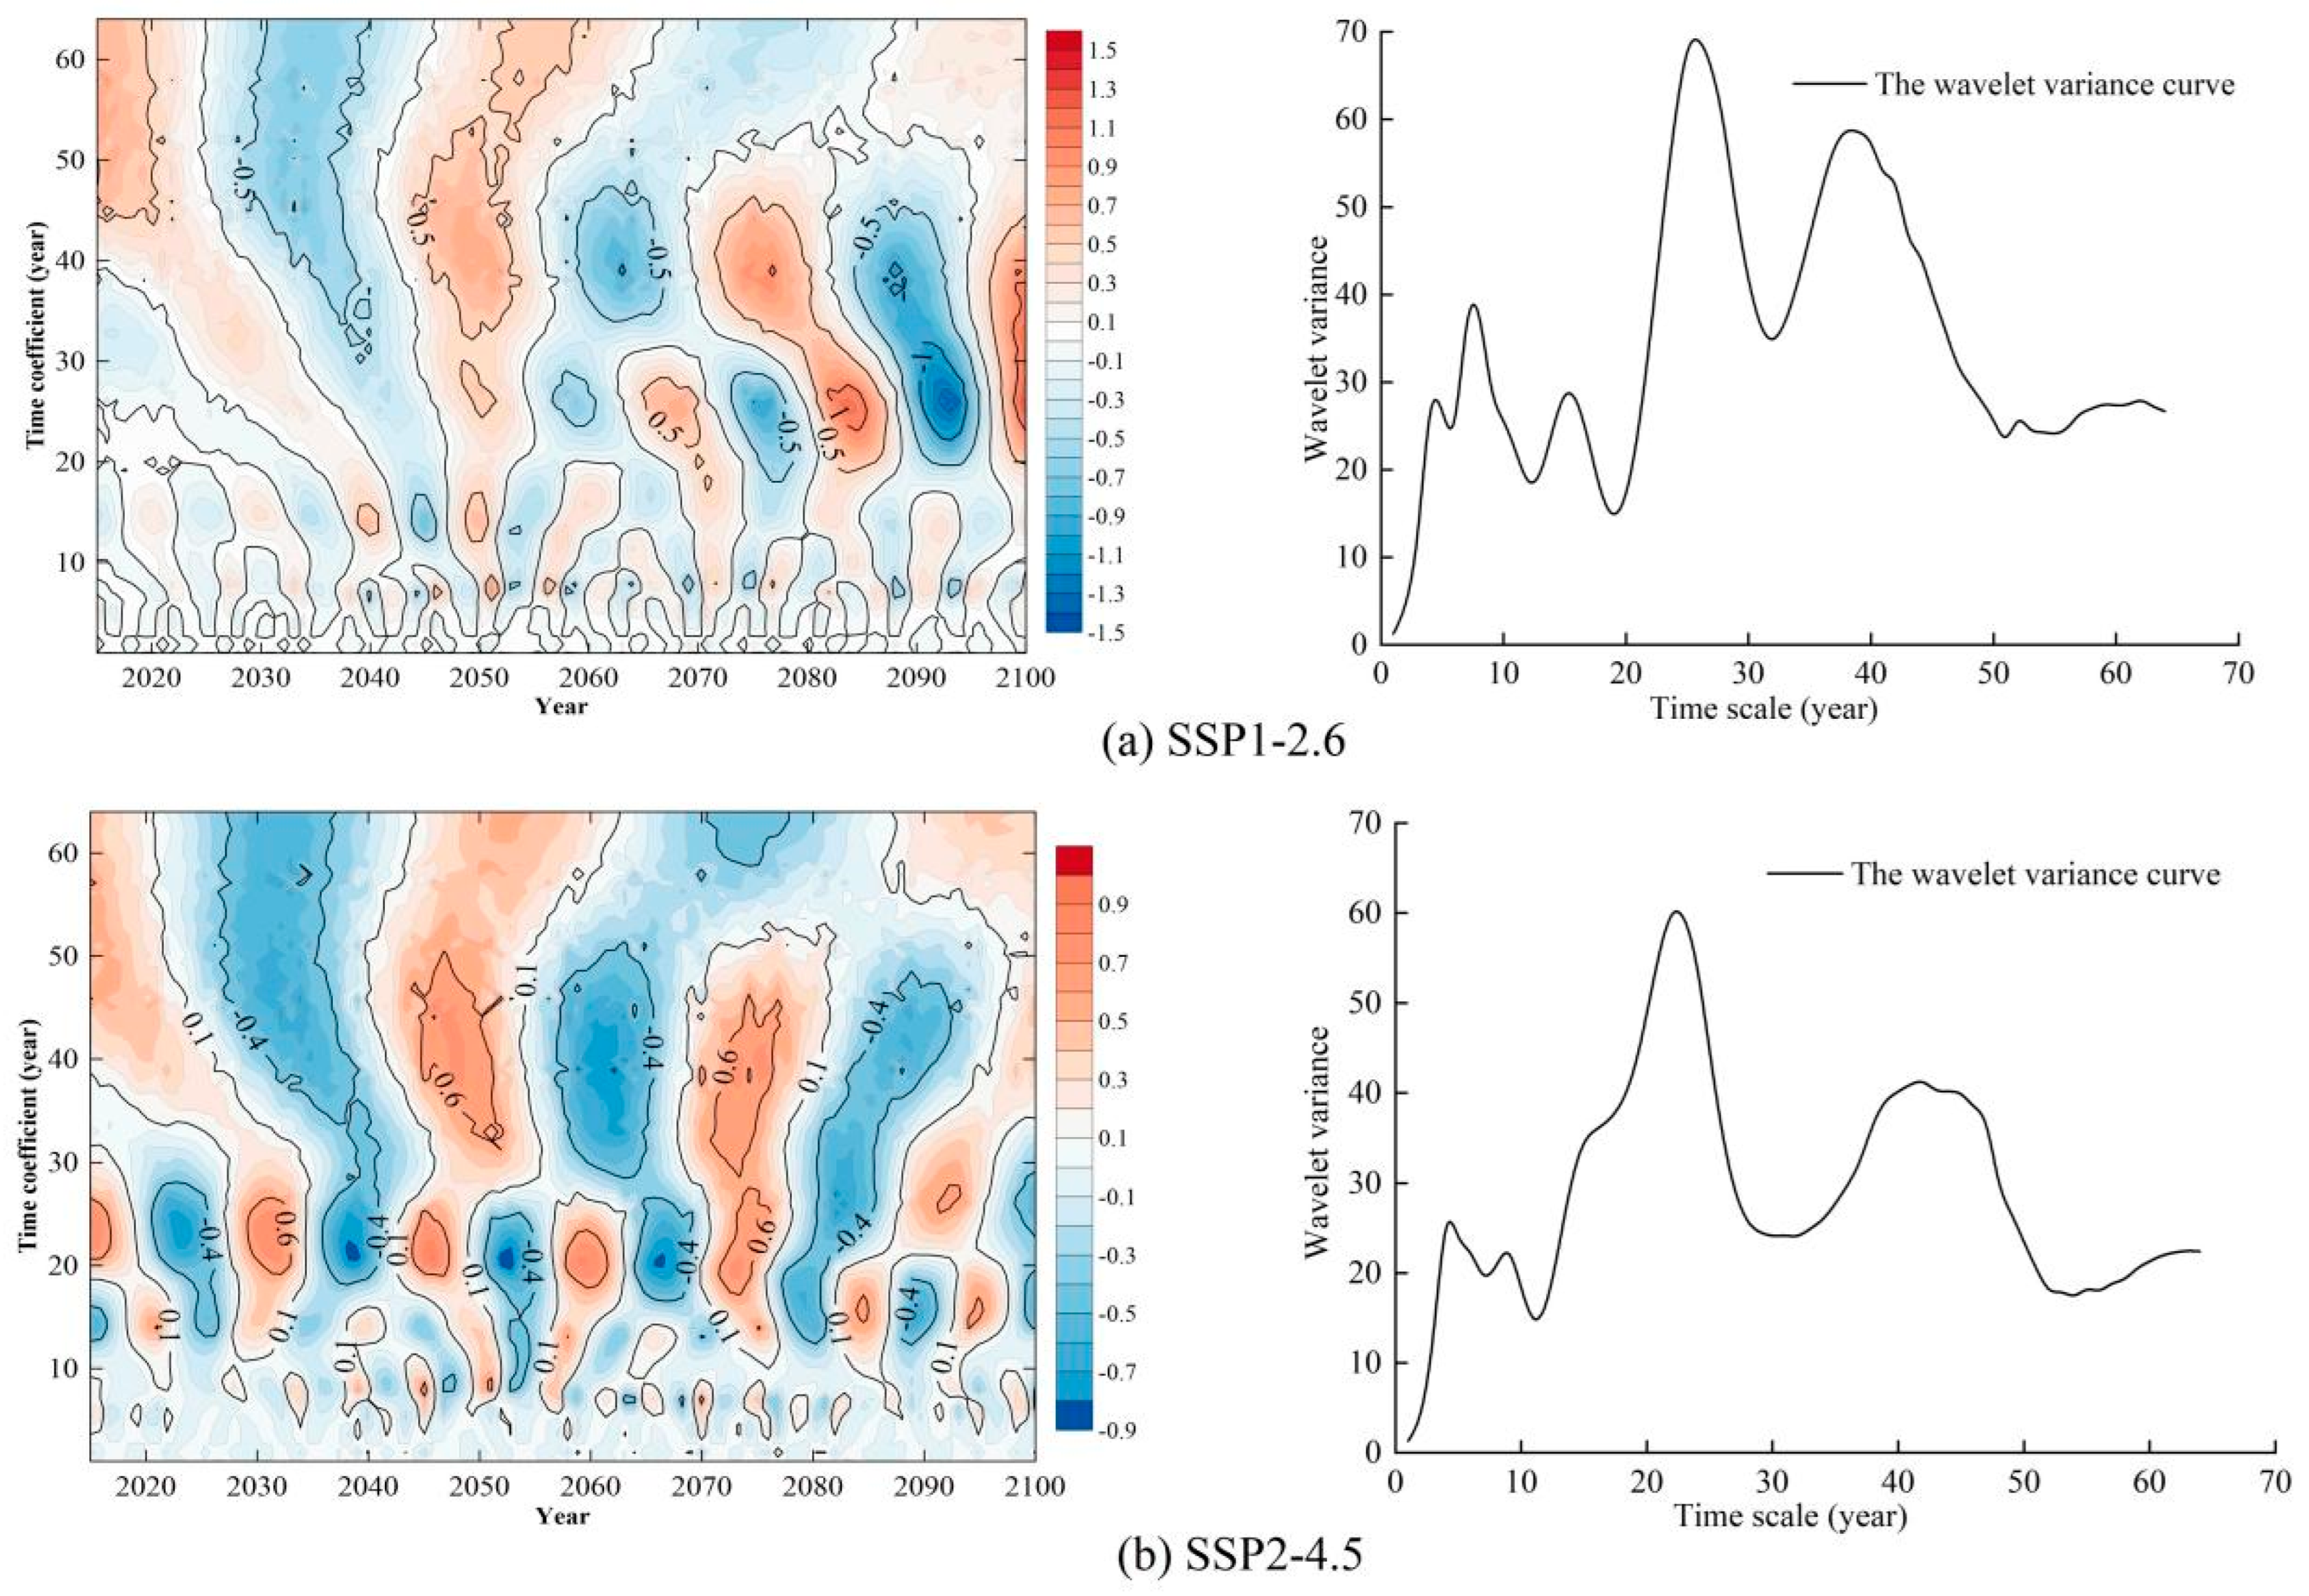
Figure 10 presents the contour map of the real part of the wavelet coefficients and the corresponding wavelet variance of the SPEI-12 series for the Henan section of the Yellow River from 2015 to 2100 under the SSP1-2.6 and SSP2-4.5 scenarios. It can be seen that there are evident multi-timescale periodic oscillations under these SSP-RCP scenarios. It should be noted that, under the SSP3-7.0 and SSP5-8.5 scenarios, the identified periodic signals do not span at least two complete cycles within the study period. As a result, the corresponding periodic characteristics are considered statistically unreliable and are therefore excluded from further analysis.
Under the SSP1-2.6 scenario, the changes in drought and wet conditions in the Henan section of the Yellow River in 2014–2100 will have oscillation periods of 8, 25 and 39 years, and 25 years is the first principal period, followed by 39 and 8 years correspondingly. For the SSP2-4.5 scenario, the periodic changes in drought and wet conditions will have four time scales of 5, 9, 24 and 43 years, respectively. The 24-year period is stable and the first principal period. To sum up, there are principal periods of 5–10 and 20–30 years in the SSP1-2.6 and the SSP2-4.5 scenarios, which is similar to the results of the principal period being 8 years and the dominant sub-periods of drought and wet conditions being 4 years and 18 years in the Henan section of the Yellow River during 1970–2020. It can be seen that the scenarios perform well under the short-term prediction (5–10 years) of drought and wet conditions. However, since each scenario contains a 20–30-year period, greater attention should be paid to the periodic intervals during future periods. The significant 20–30-year periodic oscillation of dry–wet conditions in the Henan section of the Yellow River is generally consistent with the typical interdecadal cycle of large-scale climate systems. This periodicity is mainly attributed to the Pacific Decadal Oscillation (PDO), Atlantic Multidecadal Variability (AMV) and regional monsoon circulation anomalies, which dominate the interdecadal variability of temperature, precipitation and water vapor transport over the Yellow River Basin. Such decadal signals are persistent and can be further transmitted to drought–wet evolution, leading to the stable 20–30-year oscillation detected by wavelet analysis across all SSP-RCP scenarios. Under future scenarios, areas with H > 0.5 and Sen < 0 show continued drying with strong long-term persistence. This non-reversible drying trend directly elevates regional hydrological risk: it may reduce available water resources, lower soil moisture, increase crop water stress, and restrict agricultural productivity. For water management, this highlights the urgency of long-term water conservation, reservoir regulation, and drought adaptation strategies in the Henan section of the Yellow River.

3.4. Analysis of the Characteristic Values of Future Drought and Wet Conditions in the Henan Section of the Yellow River

3.4.1. Analysis of the Maximum Characteristic Values of Future Drought and Wet Conditions in Henan Section of the Yellow River

Table 5 presents the maximum five characteristic values of drought and wet conditions and their corresponding years under the four scenarios according to the run theory. According to the tabulated data, prospective simulations indicate that arid events are predominantly concentrated during the mid-to-late 21st century, and the drought frequency is relatively stable. In most cases, the drought duration is very long, with 7 to 8 months of drought in a drought year, and in severe cases even reaches 9–10 months. Average drought severity exceeds the −1.50 threshold for severe drought, and there are even years where the average drought severity is higher than the threshold of drought of SPEI = −2.0.
The wet situation will also occur in the mid-to-late 21st century. The wet frequency is stable and comparable to that of droughts, mostly 3 or 4 times a year. The duration of wet periods is usually 6–9 months. The severity is also higher than the SPEI heavy wet threshold of 1.50, and there are also years with a severity higher than the wet threshold of 2.0.

3.4.2. Spatial Variation in the Characteristics of Future Drought and Wet Conditions in the Henan Section of the Yellow River

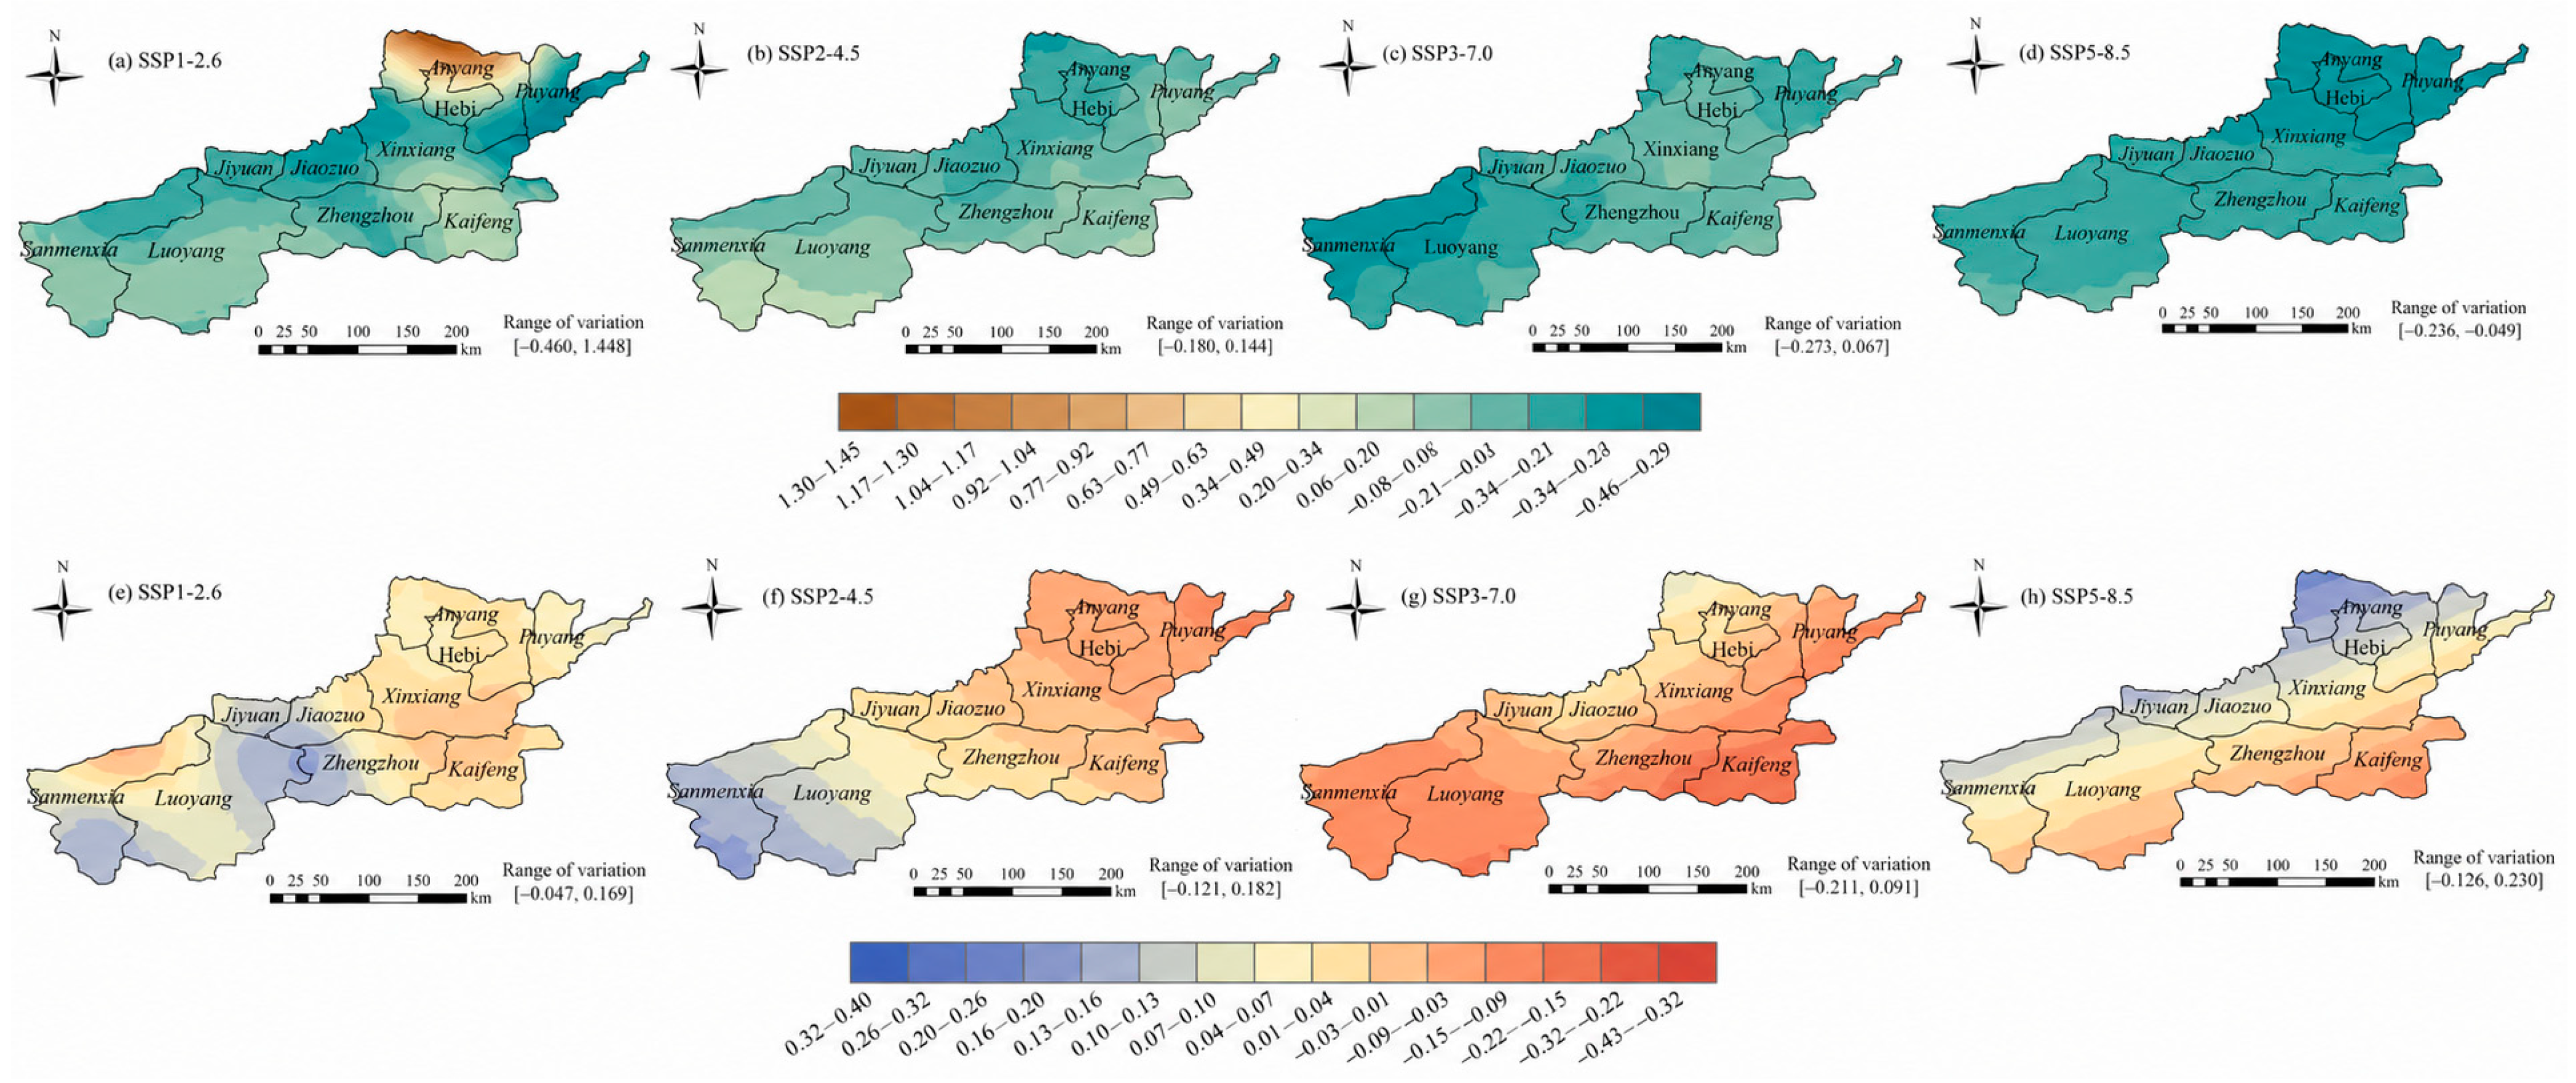
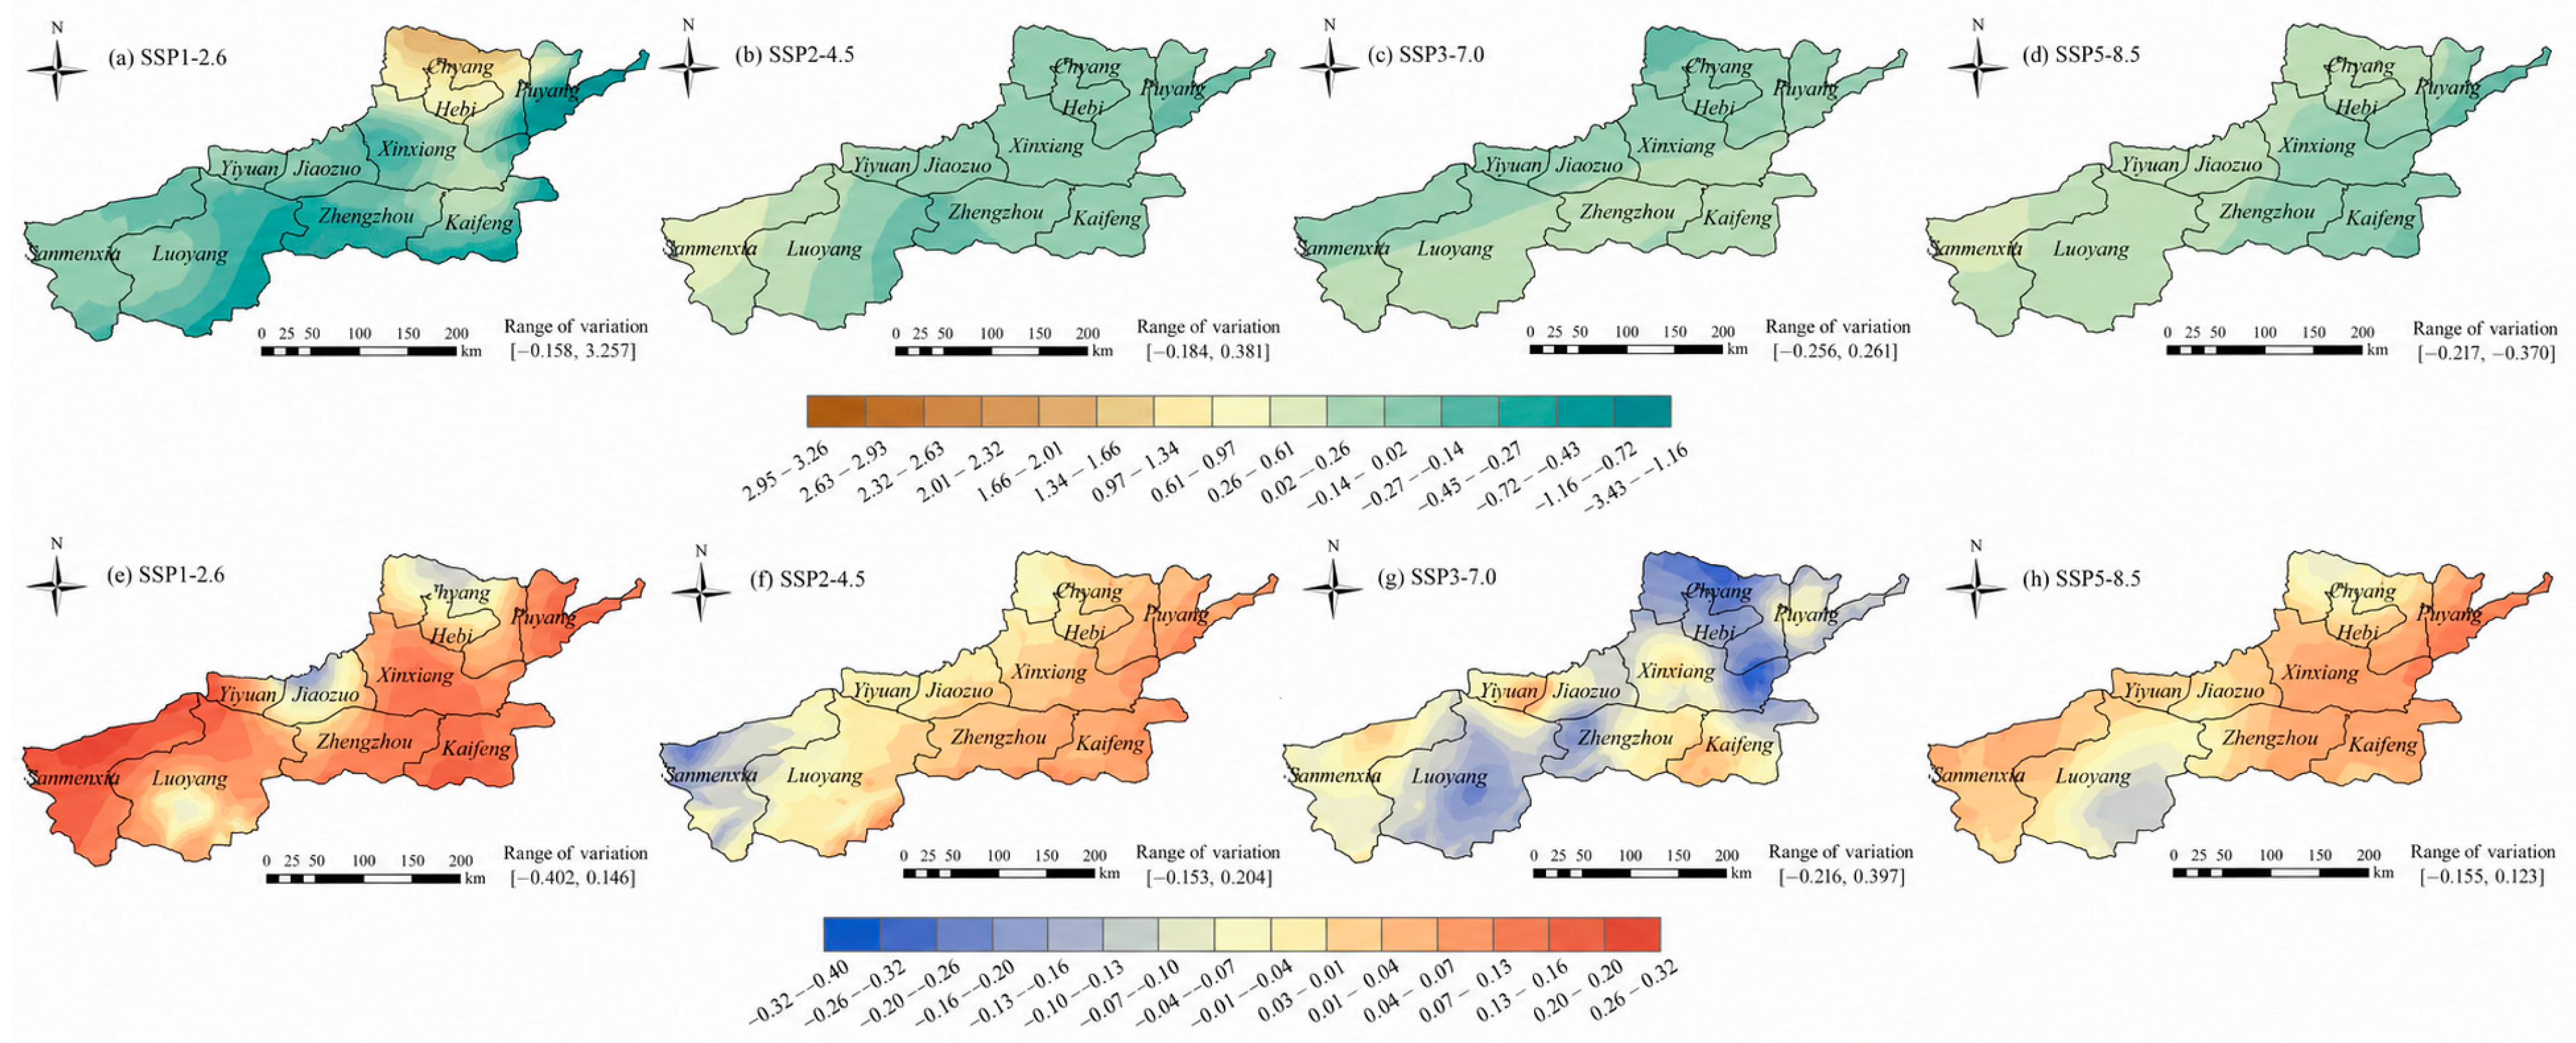
Based on the SPEI-1 results of the base period (1970–2014) and the projection period (2015–2100) in the Henan section of the Yellow River, the variation ranges of the characteristics of future drought and wet conditions compared with the base period under the four SSP-RCP scenarios will be discussed by using the run theory (Figure 10, Figure 11 and Figure 12).
According to the spatial distributions in Figure 11a,b, the occurrence rate of drought within the Puyang region and the Henan section of the Yellow River under the SSP1-2.6 scenario will mainly show a decreasing trend, while only Anyang area shows a significant increasing trend, which could increase by 1.45 times per year. For the SSP2-4.5 scenario, only some areas of Sanmenxia, Luoyang and Kaifeng will show an increasing trend in the drought frequency, while the remaining areas show a decreasing trend from south to north. In the SSP3-7.0 case, the drought frequency will mainly show a decreasing trend, with the most obvious decreases in Sanmenxia, reaching 0.273 times/year; only some areas of Xinxiang will show an increasing trend, and the maximum is only 0.067 times/year. In the SSP5-8.5 case, the drought frequency in each region is expected to decline relative to the baseline period, and the reduction in the Henan section of the Yellow River will increase from west to east. In summary, the number of droughts in most areas under the four scenarios is projected to manifest a downward pattern relative to the baseline period.
From Figure 11e–h, an escalation in wet frequency is observed within the Henan section of the Yellow River across the SSP1-2.6, SSP2-4.5, and SSP5-8.5 scenarios. Regarding the SSP1-2.6 scenario, wet occurrences in Sanmenxia, Luoyang, Xinxiang, and Kaifeng are projected to drop relative to the historical baseline, with the peak decline limited to 0.047 times/year. For the SSP2-4.5 scenario, the wet frequency will increase from east to west as per the Taylor diagram, and the wet frequency will decrease only in the east. For the SSP5-8.5 scenario, the wet frequency will increase from south to north, with the largest reduction in Luoyang, Kaifeng and other places, while the other areas follow an upward trajectory. Regarding the SSP3-7.0 scenario, the wet frequency will also show an increasing trend from south to north, but most of them show a decreasing trend; the northernmost Anyang will show an increasing trend, only 0.091 times/year, which is different from the other three scenarios.
To sum up, for the SSP1-2.6 scenario, the drought frequency changes significantly and the spatial distribution of wet events is scattered. The drought frequency in the other three scenarios exhibits a downward trend relative to the base period, and the coverage area of drought frequency under the four scenarios will decrease with the increasing degree of radiation forcing. Except for the SSP1-2.6 case, the variations in wet frequency of the other three scenarios have obvious east–west or south–north boundaries, and show a decreasing trend in a small part of southern Kaifeng, and the largest coverage area is the SSP3-7.0 scenario.
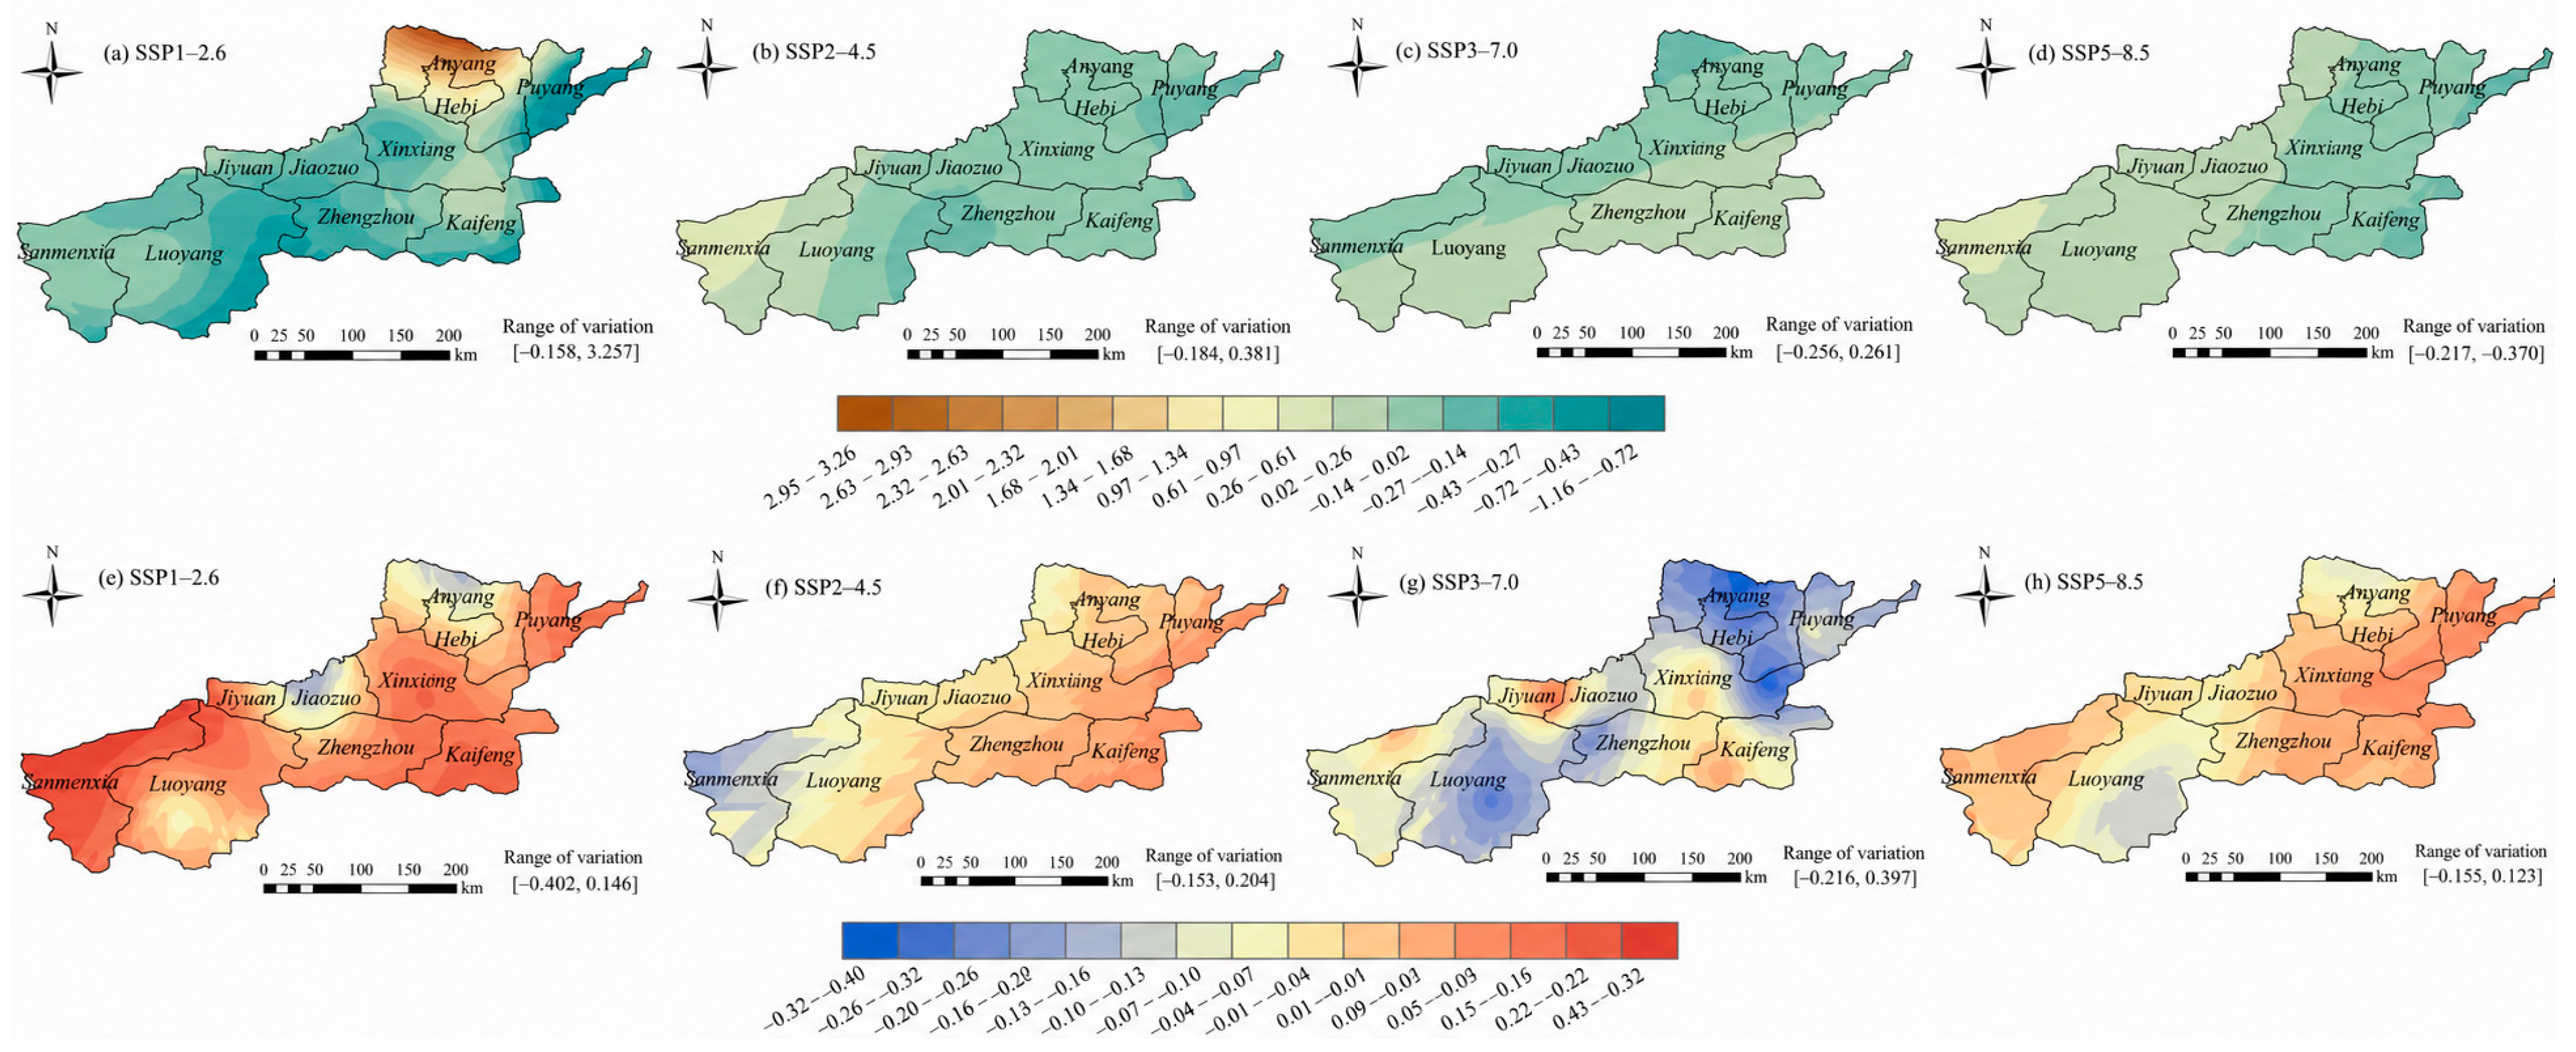
From Figure 12a,b, it can be seen that in the SSP1-2.6 case, the drought duration in the central part of the Henan section of the Yellow River will mainly show a decreasing trend, but the maximum is only 0.184. Anyang area shows a significant increasing trend, up to 3.257, with the largest increase in the four scenarios, which is basically consistent with the change trend of drought frequency. Under the SSP2-4.5 scenario, the drought duration in Sanmenxia and northern Luoyang will show an increasing trend, with a maximum of 0.381, while the drought duration in the other areas will be reduced compared with the base period. For the SSP3-7.0 and SSP5-8.5 scenarios, the drought duration in about half of the region will show an increasing trend, and be decreasing from south to north under the SSP3-7.0 scenario, while decreasing from west to east under the SSP5-8.5 scenario, all with obvious boundaries.
From Figure 12e–h, it is evident that within the SSP1-2.6 case, wet period durations in specific regions like Sanmenxia, Kaifeng, and Puyang are expected to be shorter than those in the reference period, with a maximum reduction potential of 0.402, while Anyang and Jiaozuo have the largest increase intensity, up to 0.146. In the SSP2-4.5 case, an increasing tendency in wet period duration is observed spanning from the southeast toward the northwest, whereas a declining pattern is confined to limited southeastern sectors. For the SSP3-7.0 case, the distribution form is similar to the SSP1-2.6 case; the maximum reduction in wet period duration in some areas of Jiyuan and Kaifeng can reach 0.216, while most of the other areas will show an upward trend, and the maximum in Anyang can reach 0.397. Within the SSP5-8.5 case, a diminishing trend in wet period duration is projected for the northwestern and eastern territories relative to the baseline timeframe, with a maximum of 0.155, while that in the southern part of Luoyang will have the largest upward trend of 0.123.
To sum up, under the SSP1-2.6 scenario, except for Anyang and Jiaozuo, the duration of drought and wet periods in most areas will decrease compared with the base period. In the SSP2-4.5 case, the duration of drought and wet periods in the western part of the study area will increase, while the eastern part will show a decreasing trend. For the SSP3-7.0 and SSP5-8.5 scenarios, the change in drought duration will have an obvious step law, while the distribution of wet period duration change is more scattered. In general, with the increase in emission scenarios, the geographical extent characterized by prolonged drought durations expands progressively; furthermore, the coverage of increased wet persistence peaks in the SSP3-7.0 case.
From Figure 13a,b, it can be seen that in the SSP1-2.6 case, the drought severity in the Henan section of the Yellow River will have decreasing trends in comparison to the base period, and the reduction degree in the eastern regions such as Puyang is the most obvious, reaching 0.225, and with some areas in the western Sanmenxia area showing an increasing trend, but the maximum value is only 0.025. For the SSP2-4.5 scenario, the change value of drought severity in most areas will be between −0.03 and 0.04, which is basically unchanged compared with the base period; the decrease trend in a small part of western Zhengzhou is the most serious, reaching 0.149, and the increase value of drought severity in western Sanmenxia reaches 0.220. In the SSP3-7.0 case, a north-to-south rising gradient in drought intensity is observed relative to the baseline, and drought severity exhibits an increasing trend in most areas, whereas a decreasing trend is observed in the northern region. In the SSP5-8.5 case, the drought severity in many places will exhibit an upward trend compared with the base period, while some areas in the eastern part of the study area show a decreasing trend, with a maximum of 0.076, and Jiyuan and other places show an increasing trend, with a maximum of 0.162.
From Figure 13e–h, it can be seen that regarding the SSP1-2.6 case, wet intensity in most locales is projected to decline relative to the historical base, with the exception of specific Anyang vicinities; notably, northern Sanmenxia records the most substantial abatement, reaching 0.369. In the SSP2-4.5 case, the increase and decrease in wet severity will be basically consistent, with the maximum decrease of 0.131 in Xinxiang and 0.133 in Sanmenxia. In the SSP3-7.0 case, the spatial variation in wet severity will be more scattered, with the maximum reduction of 0.328 occurring in Kaifeng, and the maximum increase in severity of 0.260 appearing in northern Anyang. In the SSP5-8.5 case, the wet severity in many areas will exhibit a declining trend relative to the base period; the maximum reduction is 0.192 in some areas of Puyang and Sanmenxia, while only Anyang and Luoyang will show an increasing trend, with a maximum of 0.169.
To sum up, under the SSP1-2.6 scenario, the severity of drought and wet conditions in most areas of the Henan section of the Yellow River will exhibit a declining trend relative to the base period; that is, prospective drought and wet condition intensities may diminish. Furthermore, as emission pathways intensify, the geographical extent plagued by rising drought severity expands; likewise, the spatial footprint of increased wet intensity reaches its peak in the SSP3-7.0 case.

3.5. Spatial Trend of Drought and Wet Condition Risks in the Future

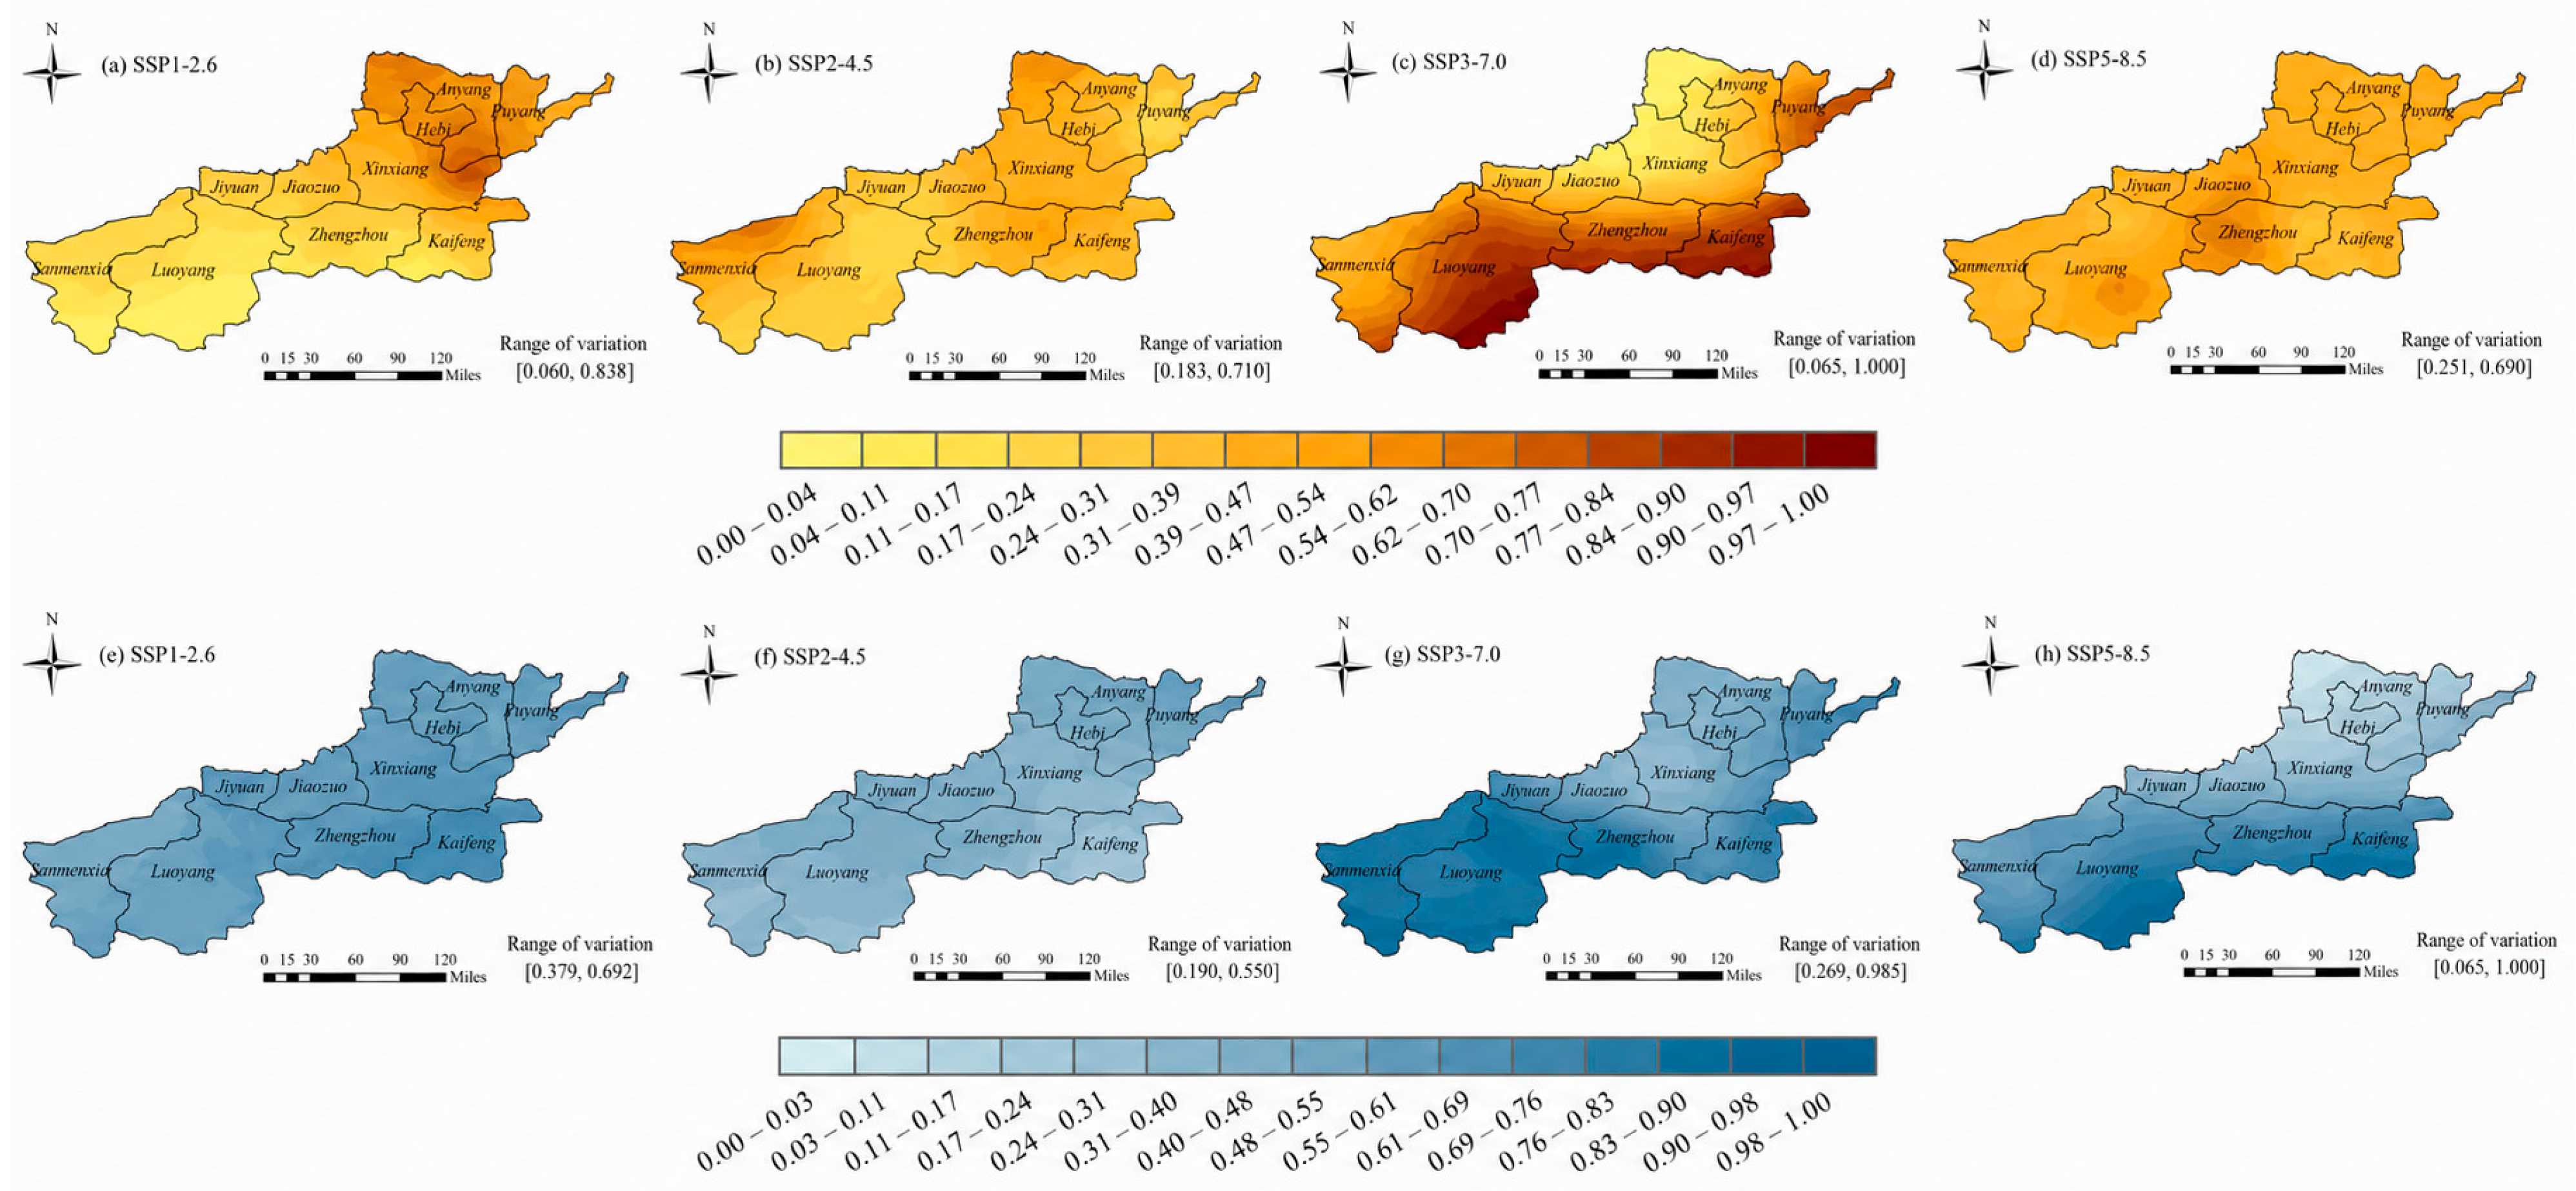
Based on three risk factors—exposure, resilience, and vulnerability—this study further explores the spatial static risk of integrated drought–wet events under future scenarios in the Henan section of the Yellow River. The corresponding findings are illustrated in Figure 14; the risk distribution of future drought–wet conditions shows no significant consistency across the four scenarios.
In the SSP3-7.0 case, the drought risk intensity will be the largest and the coverage area will be the widest, showing a decreasing distribution from south to north. Luoyang, Zhengzhou, Kaifeng and Puyang are projected to be exposed to severe drought risks in coming decades. The next is the SSP1-2.6 scenario, where the drought risk at the Xinxiang–Hebi junction will be the highest, which can reach 0.838. In the SSP2-4.5 case, the maximum drought risk will occur in the north of Sanmenxia, reaching 0.710. In the SSP5-8.5 case, the drought risk severity in western Zhengzhou will be the largest, reaching 0.690, and the drought risk in other areas are mostly around 0.5.
Under the SSP3-7.0 and SSP5-8.5 scenarios, there will be large wet risk. The areas prone to wet conditions are the western and southern parts of the study area, and the wet risk in the northeast is the smallest. The wet risk in the SSP1-2.6 case is stronger than that in SSP2-4.5, and the comparison is most obvious in Kaifeng.
To sum up, in the SSP3-7.0 case, the drought and wet condition risks will be large and the distribution range will be wide, and it is very similar to the future drought changes trend predicted in Figure 5, but the wet distribution is quite different. In the SSP2-4.5 case, the drought and wet condition risk severity is the smallest and the distribution is relatively uniform. For the SSP1-2.6 and SSP5-8.5 scenarios, there is no obvious regularity in the occurrence of drought and wet conditions, and the high-risk coverage area is also significantly reduced compared with SSP3-7.0. It shows that under different economic–social development paths, the uncertainty of drought and wet conditions is high.

4. Discussion

4.1. Reliability and Uncertainty of CMIP6-BMME Simulations

It was found that the structural differences between independent models can be avoided to a certain extent after equal-weight ensemble averaging of the three selected CMIP6 models [60]; in comparison to other models, it can better simulate the trend of temperature and precipitation in the Henan section of the Yellow River. However, despite the climate data used in this study having been interpolated, bias-corrected and ensemble-averaged to reduce the variability of the data, the correlation coefficient between the simulated and measured precipitation values in the BMME was still only 0.64 and the RMSE was also large. The reason may be that the precipitation process was largely affected by temperature, wind speed and net surface radiation, and the internal operation process of each climate model will change with time according to the actual situation in different regions [61]. Therefore, in terms of the internal structure or initial condition setting of different models, it is necessary to further deepen the research on the parameterization of each model in different regions and the adaptability of the geographical environment, so as to improve the simulation accuracy and higher level of confidence.

4.2. Future Drought–Wet Transition Characteristics

The projected wetting tendency under the SSP1-2.6 scenario differs substantially from the drying trends identified under higher-emission pathways. This result may be associated with the relatively limited warming magnitude under SSP1-2.6, which suppresses the increase in potential evapotranspiration (PET) and weakens warming-induced drying effects in the SPEI calculation framework. In addition, moderate increases in precipitation under low-emission conditions may partially offset atmospheric evaporative demand, thereby contributing to a gradual wetting tendency. Previous studies have also suggested that low-emission scenarios may maintain relatively stable East Asian summer monsoon moisture transport, which could further support regional humidification in northern China. However, because large-scale atmospheric circulation dynamics were not explicitly analyzed in this study, the physical mechanisms behind the projected wetting trend still require further investigation.

4.3. Mechanisms of Drought and Wet Risk Evolution

Prior research concerning drought and wet condition attributes within Henan Province or the Henan section of the Yellow River has primarily focused on historical timelines, so it is impossible to clearly compare and discuss the future trend of drought and wet conditions in this area. Based on the research of the whole of Henan Province, it was found that the frequency of drought and wet conditions in the central and western parts of the Henan section of the Yellow River from 1960 to 2018 was relatively high, while the frequency of drought and wet conditions in the east of Xinxiang–Kaifeng was relatively low [62]. According to this trend, the risk distribution of drought and wet conditions predicted by the SSP3-7.0 case is consistent with the research results. Although drought frequency under SSP3-7.0 decreases in some regions relative to the historical baseline, the integrated drought risk remains the highest because the risk index is jointly determined by event frequency, duration, and cumulative severity. Under high-emission scenarios, prolonged drought persistence and intensified cumulative deficits outweigh the reduction in occurrence frequency, resulting in fewer but more destructive drought events. While hydro-climatic traits and risk allocations vary across distinct SSP-RCP cases, the high-emission scenarios (SSP3-7.0 and SSP5-8.5) are projected to witness a substantial escalation in both drought persistence and intensity relative to the baseline timeframe, and the risk and coverage area are relatively large, which is consistent with the research conclusions in China under the CMIP6 models [62]. These findings highlight the necessity of strengthening regional climate adaptation strategies and improving integrated water-resource management under future climate change.

4.4. Methodological Limitations and Future Perspectives

The Delta downscaling method was adopted in this study due to its simplicity, computational efficiency, and wide application in regional climate impact assessments [31,32]. This method is particularly suitable for studies where long-term mean changes are of primary interest, as it preserves the observed spatial patterns while incorporating climate change signals from GCMs. However, the Delta method has several inherent limitations. First, it assumes that the spatial pattern of climate variables remains unchanged in the future, which may not hold under strong anthropogenic forcing or in regions with complex topography. Second, it only adjusts the mean values of climate variables and does not account for changes in variability, extremes, or temporal sequencing, which are critical for assessing drought and wet condition risks. Third, the method relies on the accuracy of the reference climatology and may introduce biases if the reference period is not representative of long-term climate conditions. Therefore, while the Delta method is effective for trend analysis and scenario comparison, it may underestimate the magnitude and frequency of extreme events. Furthermore, the projected spatial risk distributions identified in this study should be interpreted as future amplifications or attenuations of historical spatial heterogeneity rather than entirely new spatial patterns. Because the Delta downscaling method preserves the baseline spatial structure of climate variables, the projected changes primarily reflect modifications in the intensity and persistence of drought–wet conditions under different SSP-RCP scenarios. Future studies should consider more advanced bias-correction techniques, such as quantile mapping or weather generators, to better capture changes in climate variability and extremes.
In the application of run theory, uncertainties primarily arise from threshold selection and data aggregation. Regarding threshold uncertainty, the chosen cutoff directly redefines the event boundaries, thereby altering the frequency and duration of identified “runs”. An excessively high threshold may cause significant events to be overlooked (Type II error), while an overly low threshold risks misidentifying normal fluctuations as extreme events, ultimately leading to biased estimations of risk frequency and intensity. Regarding event aggregation uncertainty, the choice of integration methods and time windows reshapes the spatio-temporal structure of the event sequence. For instance, aggregating daily data into monthly cumulative precipitation may mask short-term drought–wet abrupt transitions, thereby underestimating the abruptness of risks. This information loss and smoothing effect during aggregation introduce systematic biases into the assessment. The SPEI threshold of −0.5 adopted in this study follows the Chinese national meteorological drought classification standard. Based on the historical and observed climatic trends in the Henan reach of the Yellow River, regional temperatures have exhibited a continuous upward tendency, while precipitation has shown considerable interannual variability. Under future CMIP6 climate projections, sustained warming combined with unstable precipitation conditions is likely to enhance atmospheric evaporative demand and increase the persistence of moisture deficits, thereby reflecting a realistic potential for long-term drought risk in the study area.
Different SPEI timescales were adopted in this study to characterize hydroclimatic variability from complementary temporal perspectives. The SPEI-1 index is highly sensitive to short-term moisture anomalies and was therefore used in run theory to identify the frequency, duration, and severity of drought–wet events. In contrast, SPEI-12 integrates cumulative moisture conditions over a full annual cycle and is more suitable for detecting long-term climatic trends, persistence characteristics, and mutation behavior. They represent different manifestations of hydroclimatic variability across temporal scales.
In this study, the CMIP6 model was used to explore the future trend of drought and wet conditions in different SSP-RCP scenarios based on the precipitation and temperature data output by BMME. However, drought and wet conditions are a complex hydrological cycle process, which is not only related to climate factors, but also to human activities, topography, and atmospheric circulation and other important factors. Because this study primarily relies on precipitation and temperature variables derived from CMIP6 outputs, uncertainties associated with hydrological and ecological processes may not be fully captured. Incorporating human–water interactions and land-surface feedbacks into future assessments could improve the reliability of regional drought projections.
Considering the increasing variability of future climatic conditions, fixed-threshold SPEI classifications may have limited adaptability under changing climate regimes. Future studies should consider dynamic threshold approaches and integrate multiple drought indicators, including vegetation, soil moisture, and hydrological indices, to improve the representation of complex drought processes under future climate change.

5. Conclusions

For this research, a reanalysis dataset spanning 1970–2014 was utilized to downscale five distinct CMIP6 models, followed by an assessment of their proficiency in simulating rainfall and thermal patterns, and we then proved that the BMME can better represent the measured results of the Henan section of the Yellow River than the single climate model. Based on BMME output data, this study calculates the SPEI values under different SSP-RCP scenarios and analyzes the spatiotemporal evolution characteristics of future drought events and wet periods in the Henan section of the Yellow River from multiple perspectives. The main conclusions are as follows:
(1) During the historical period, the Henan reach of the Yellow River exhibited a drying trend at a rate of 0.15 per decade. Combined analysis using Sen’s slope and the Hurst exponent indicates that hydroclimatic conditions in parts of Xinxiang are likely to remain relatively stable in future periods. In the southern part of Hebi–Puyang, regions characterized by negative Sen’s slope values and H > 0.5 are expected to maintain persistent drying tendencies, whereas areas north of Hebi–Puyang with positive Sen’s slope values and H > 0.5 are likely to continue exhibiting wetting tendencies.
(2) In the coming periods, only the SSP1-2.6 case will develop toward the wetting trend, while the other three scenarios will develop toward the drought trend, and the drought rate will increase with the rise of the radiation forcing scenario. The four scenarios perform well under the small-scale signal of drought–wet and all have 20–30-year evolution periods.
(3) Based on the run theory, it is found that drought and wet conditions often occur mostly in the mid-to-late 21st century. Compared with the historical period, the coverage area of drought will decrease with the radiative forcing increasing in the four scenarios. Except for the SSP1-2.6 case, the other three scenarios have obvious east–west or south–north boundaries, and the SSP3-7.0 scenario has the largest coverage area. The area covered by the drought duration and severity increasing will gradually increase with the increase in emission scenarios, and the area covered by the wet period duration and severity increasing is the largest in the SSP3-7.0 case.
(4) Under the SSP3-7.0 scenario, the drought and wet risk is significantly higher than in other scenarios, with risk index values generally exceeding 0.7 and showing a wider spatial coverage; the future drought and wet period risk will be the smallest and evenly distributed.

Author Contributions

C.Y.: Conceptualization, Methodology, Writing—Original Draft, Supervision. W.Q.: Conceptualization, Writing—Review and Editing. R.H.: Table Formatting, Polishing. J.T. and Q.Z.: Resources, Z.Z.: Formal analysis. All authors have read and agreed to the published version of the manuscript.

Funding

This research was financially by the National Key Research and Development Program of China (No. 2024YFC3211301), the Henan Provincial Science and Technology Key Program (232102320032), the Henan Provincial Water Conservancy Science and Technology Research Project (No. GG202405; No. GG202404), and Ecological Flow Assessment for Key Control Sections of Major Rivers and Lakes and Existing Water Conservancy and Hydropower Projects in Henan Province Hydrological and Water Resources Center (20250388A).

Data Availability Statement

The raw datasets used in this study are publicly accessible via an online repository (http://data.cma.cn/site/index.html, accessed on 25 February 2025; http://www.geodata.cn, accessed on 27 February 2025; https://esgf-node.llnl.gov/search/cmip6/, accessed on 27 February 2025). The processed and analyzed data generated during the current study are available from the corresponding author upon reasonable request. The computer code developed and applied in this study can also be obtained by contacting the corresponding author with a justified request.

Acknowledgments

The authors wish to express their gratitude to the editor and the anonymous reviewers for their insightful comments and constructive suggestions, which significantly enhanced the quality of this paper.

Conflicts of Interest

The authors declare that they have no known competing financial interests or personal relationships that could have appeared to influence the work reported in this paper.

References

  1. Deng, K.Q.; Azorin-Molina, C.; Yang, S.; Hu, C.D.; Zhang, G.F.; Minola, L.; Chen, D.L. Changes of Southern Hemisphere westerlies in the future warming climate. Atmos. Res. 2022, 270, 106040. [Google Scholar] [CrossRef]
  2. IPCC. Summary for Policymakers. In Climate Change 2021: The Physical Science Basis; Masson-Delmotte, V., Zhai, P., Pirani, A., Connors, S.L., Péan, C., Chen, Y., Goldfarb, L., Gomis, M.I., Matthews, J.B.R., Berger, S., et al., Eds.; Cambridge University Press: Cambridge, UK; New York, NY, USA, 2021; pp. 3–32. [Google Scholar]
  3. Gu, L.; Yin, J.B.; Slater, L.J.; Chen, J.; Do, H.X.; Wang, H.M.; Chen, L.; Jiang, Z.Q.; Zhao, T. Intensification of Global Hydrological Droughts Under Anthropogenic Climate Warming. Water Resour. Res. 2023, 59, e2022WR032997. [Google Scholar] [CrossRef]
  4. Wu, T.M.; Imrit, M.A.; Movahedinia, Z.; Kong, J.D.; Woolway, R.I.; Sharma, S. Climate tracking by freshwater fishes suggests that fish diversity in temperate lakes may be increasingly threatened by climate warming. Divers. Distrib. 2023, 29, 300–315. [Google Scholar] [CrossRef]
  5. Hirabayashi, Y.; Mahendran, R.; Koirala, S.; Konoshima, L.; Yamazaki, D.; Watanabe, S.; Kim, H.; Kanae, S. Global flood risk under climate change. Nat. Clim. Change 2013, 3, 816–821. [Google Scholar] [CrossRef]
  6. Arnell, N.W.; Gosling, S.N. The impacts of climate change on river flood risk at the global scale. Clim. Change 2016, 134, 387–401. [Google Scholar] [CrossRef]
  7. Ahmadalipour, A.; Moradkhani, H.; Svoboda, M. Centennial drought outlook over the CONUS using NASA-NEX downscaled climate ensemble. Int. J. Climatol. 2017, 37, 2477–2491. [Google Scholar] [CrossRef]
  8. Tabari, H. Climate change impact on flood and extreme precipitation increases with water availability. Sci. Rep. 2020, 10, 13768. [Google Scholar] [CrossRef]
  9. Zhao, T.B.; Dai, A.G. CMIP6 Model-Projected Hydroclimatic and Drought Changes and Their Causes in the Twenty-First Century. J. Clim. 2022, 35, 897–921. [Google Scholar]
  10. Aghakouchak, A.; Chiang, F.; Huning, L.S.; Love, C.A.; Mallakpour, I.; Mazdiyasni, O.; Moftakhari, H.; Papalexiou, S.M.; Ragno, E.; Sadegh, M. Climate Extremes and Compound Hazards in a Warming World. Annu. Rev. Earth Planet. Sci. 2020, 48, 519–548. [Google Scholar] [CrossRef]
  11. Ministry of Water Resources of the People’s Republic of China. 2018 China Flood and Drought Disaster Bulletin; China Water & Power Press: Beijing, China, 2019. [Google Scholar]
  12. Zong, Y.Q.; Chen, X.Q. The 1998 flood on the Yangtze, China. Nat. Hazards 2000, 22, 165–184. [Google Scholar] [CrossRef]
  13. Changjiang Water Resources Commission of the Ministry of Water Resources. Yangtze River Sediment Bulletin 2020; Changjiang Publishing House: Wuhan, China, 2021; pp. 4–56. [Google Scholar]
  14. Hou, S.Y.; Niu, L.Q. Characteristics and rainfall causes analysis of 2021 summer rainstorm flood in Heilongjiang Basin. Water Resour. Hydropower Northeast China 2023, 41, 16–17+21. [Google Scholar]
  15. Lambert, S.J.; Boer, G.J. CIMP1 evaluation and intercomparison of coupled climate models. Clim. Dyn. 2001, 17, 83–106. [Google Scholar] [CrossRef]
  16. Behrens, L.K.; Martin, T.; Semenov, V.A.; Latif, M. The Arctic Sea ice in the CMIP3 climate model ensemble—Variability and anthropogenic change. Cryosphere Discuss. 2012, 6, 5317–5344. [Google Scholar]
  17. Torres, R.R.; Marengo, J.A. Climate change hotspots over South America: From CMIP3 to CMIP5 multi-model datasets. Theor. Appl. Climatol. 2014, 117, 579–587. [Google Scholar] [CrossRef]
  18. Eyring, V.; Bony, S.; Meehl, G.A.; Senior, C.A.; Stevens, B.; Stouffer, R.J.; Taylor, K.E. Overview of the Coupled Model Intercomparison Project Phase 6 (CMIP6) experimental design and organization. Geosci. Model Dev. Discuss. 2016, 9, 1937–1958. [Google Scholar] [CrossRef]
  19. Mondal, S.K.; Tao, H.; Huang, J.L.; Wang, Y.J.; Su, B.D.; Zhai, J.Q.; Jing, C.; Wen, S.S.; Jiang, S.; Chen, Z.Y.; et al. Projected changes in temperature, precipitation and potential evapotranspiration across Indus River Basin at 1.5–3.0 degrees C warming levels using CMIP6-GCMs. Sci. Total Environ. 2021, 789, 147867. [Google Scholar] [CrossRef]
  20. Nashwan, M.S.; Shahid, S. A novel framework for selecting general circulation models based on the spatial patterns of climate. Int. J. Climatol. 2020, 40, 4422–4443. [Google Scholar] [CrossRef]
  21. Eyring, V.; Cox, P.M.; Flato, G.M. Taking climate model evaluation to the next level. Nat. Clim. Change 2019, 9, 102–110. [Google Scholar] [CrossRef]
  22. Ma, Z.C.; Sun, P.; Zhang, Q.; Zou, Y.F.; Lv, Y.F.; Li, H.; Chen, D.H. The Characteristics and Evaluation of Future Droughts Across China Through the CMIP6 Multi-Model Ensemble. Remote Sens. 2022, 14, 1097. [Google Scholar] [CrossRef]
  23. Liu, C.; Liu, X.; Tian, W.; Xie, J. Ecological Protection and High-Quality Development of the Yellow River Basin Urgently need to Solve the Water Shortage Problem. Yellow River 2020, 42, 6–9. [Google Scholar]
  24. Li, C.; Raj, K.G.; Zhang, J.; Shang, Y.; Gnyawali, K.R.; Zhang, F.; Miao, L.J. Slightly enhanced drought in the Yellow River Basin under future warming scenarios. Atmos. Res. 2022, 280, 106423. [Google Scholar] [CrossRef]
  25. Ding, Y.B.; Jiang, C.Z.; Zhou, Z.Q.; Gao, T.A.; Wang, S.R.; Zhang, X.C.; Cai, H.J.; Shi, H.Y. Evaluation of precipitation and its time series components in CMIP6 over the Yellow River Basin. Clim. Dyn. 2022, 60, 1203–1223. [Google Scholar] [CrossRef]
  26. Zuo, Q.; Zhang, Z.; Li, D.; Wu, Q.; Jiang, L. Regonal division and research framework for high-qualty development path optimization in the Henan section of the Yellow river. South-to-North Water Transf. Water Sci. Technol. 2021, 19, 209–216. [Google Scholar]
  27. Nature Climate Change. The CMIP6 landscape. Nat. Clim. Change 2019, 9, 727. [Google Scholar] [CrossRef]
  28. Harris, I.; Jones, P.D.; Osborn, T.J.; Lister, D.H. Updated high-resolution grids of monthly climatic observations—The CRU TS3.10 Dataset. Int. J. Climatol. 2014, 34, 623–642. [Google Scholar] [CrossRef]
  29. Xu, J.W.; Gao, Y.H.; Chen, D.L.; Xiao, L.H.; Ou, T.H. Evaluation of global climate models for downscaling applications centred over the Tibetan Plateau. Int. J. Climatol. 2017, 37, 657–671. [Google Scholar] [CrossRef]
  30. Hay, L.E.; Wilby, R.; Leavesley, G.H. A comparison of delta change and downscaled GCM scenarios for three mountainous basins in the United States. J. Am. Water Resour. Assoc. 2000, 36, 387–397. [Google Scholar] [CrossRef]
  31. Zhang, Z.H.; Deng, S.F.; Zhao, Q.D.; Zhang, S.Q.; Zhang, X.W. Projected glacier meltwater and river run-off changes in the Upper Reach of the Shule River Basin, north-eastern edge of the Tibetan Plateau. Hydrol. Process. 2019, 33, 1059–1074. [Google Scholar] [CrossRef]
  32. Pierce, D.W.; Barnett, T.P.; Santer, B.D.; Gleckler, P.J. Selecting global climate models for regional climate change studies. Proc. Natl. Acad. Sci. USA 2009, 106, 8441–8446. [Google Scholar] [CrossRef]
  33. Chen, W.L.; Jiang, Z.H.; Li, L. Probabilistic Projections of Climate Change over China Under the SRES A1B Scenario Using 28 AOGCMs. J. Clim. 2011, 24, 4741–4756. [Google Scholar] [CrossRef]
  34. Schuenemann, K.C.; Cassano, J.J. Changes in synoptic weather patterns and Greenland precipitation in the 20th and 21st centuries: 1. Evaluation of late 20th century simulations from IPCC models. J. Geophys. Res. Atmos. 2009, 114, D20113. [Google Scholar] [CrossRef]
  35. Jiang, D.B.; Hu, D.; Tian, Z.P.; Lang, X.M. Differences between CMIP6 and CMIP5 Models in Simulating Climate over China and the East Asian Monsoon. Adv. Atmos. Sci. 2020, 37, 1102–1118. [Google Scholar] [CrossRef]
  36. Seker, M.; Gumus, V. Projection of temperature and precipitation in the Mediterranean region through multi-model ensemble from CMIP6. Atmos. Res. 2022, 280, 106440. [Google Scholar] [CrossRef]
  37. Claudia, T.; Reto, K. The use of the multi-model ensemble in probabilistic climate projections. Philos. Trans. Ser. A Math. Phys. Eng. Sci. 2007, 365, 2053–2075. [Google Scholar]
  38. Vicente-Serrano, S.M.; Beguería, S.; López-Moreno, J.I.; Angulo, M.; El Kenawy, A. A New Global 0.5° Gridded Dataset (1901–2006) of a Multiscalar Drought Index: Comparison with Current Drought Index Datasets Based on the Palmer Drought Severity Index. J. Hydrometeorol. 2010, 11, 1033–1043. [Google Scholar] [CrossRef]
  39. Samim, T.A.; Lee, S.H.; Hussainzada, W.; Bhanage, V.; Nayyer, F. Comprehensive drought assessment based on the SPEI and its impact on crop production and streamflow in Afghanistan. J. Hydrol. Reg. Stud. 2025, 62, 102893. [Google Scholar] [CrossRef]
  40. Ssembajwe, R.; Twah, A.; Kagezi, H.G.; Löytty, T.; Kobusinge, J.; Gidudu, A.; Arinaitwe, G.; Du, Q.Y.; Voda, M. Assessment and Validation of FAPAR, a Satellite-Based Plant Health and Water Stress Indicator, over Uganda. Remote Sens. 2025, 17, 3501. [Google Scholar] [CrossRef]
  41. Johnson, A.; Ana, M.; Helena, M. Spatiotemporal Characteristics of Meteorological Drought and Wetness Events across the Coastal Savannah Agroecological Zone of Ghana. Water 2023, 15, 211. [Google Scholar] [CrossRef]
  42. Peng, Y.; Jun, X.; Gang, X.; Lingsheng, M.; Shengqing, Z.; Wei, C.; Wenyu, W. Impacts of climate change-related flood events in the Yangtze River Basin based on multi-source data. Atmos. Res. 2021, 263, 105819. [Google Scholar]
  43. Vicente-Serrano, S.M.; Begueria, S.; Lopez-Moreno, J.I. A Multiscalar Drought Index Sensitive to Global Warming: The Standardized Precipitation Evapotranspiration Index. J. Clim. 2010, 23, 1696–1718. [Google Scholar] [CrossRef]
  44. National Climate Center; China Meteorological Administration; Lanzhou Institute of Arid Meteorology, China Meteorological Administration. Meteorological Drought Grade; Standardization Administration of China: Beijing, China, 2017. [Google Scholar]
  45. Sen, P.K. Estimates of the Regression Coefficient Based on Kendall’s Tau. J. Am. Stat. Assoc. 2012, 63, 1379–1389. [Google Scholar] [CrossRef]
  46. Mann, H.B. Nonparametric tests against trend. Econometrica 1945, 13, 245–259. [Google Scholar] [CrossRef]
  47. Shi, W.Z.; Huang, S.Z.; Liu, D.F.; Huang, Q.; Han, Z.M.; Leng, G.Y.; Wang, H.; Liang, H.; Li, P.; Wei, X.T. Drought-flood abrupt alternation dynamics and their potential driving forces in a changing environment. J. Hydrol. 2021, 597, 126179. [Google Scholar] [CrossRef]
  48. Xiao, T.; Mcpherson, B.; Esser, R.; Jia, W.; Moodie, N.; Chu, S.P.; Lee, S.Y. Forecasting commercial-scale CO2 storage capacity in deep saline reservoirs: Case study of Buzzard’s bench, Central Utah. Comput. Geosci. 2019, 126, 41–51. [Google Scholar] [CrossRef]
  49. Rehman, S. Study of Saudi Arabian climatic conditions using Hurst exponent and climatic predictability index. Chaos Solitons Fractals 2009, 39, 499–509. [Google Scholar] [CrossRef]
  50. Ray, R.; Khondekar, M.H.; Ghosh, K.; Bhattacharjee, A.K. Scaling and nonlinear behaviour of daily mean temperature time series across India. Chaos Solitons Fractals 2016, 84, 9–14. [Google Scholar] [CrossRef]
  51. Juez, C.; Garijo, N.; Nadal-Romero, E.; Vicente-Serrano, S.M. Wavelet analysis of hydro-climatic time-series and vegetation trends of the Upper Aragón catchment (Central Spanish Pyrenees). J. Hydrol. 2022, 614, 128584. [Google Scholar] [CrossRef]
  52. Yao, N.; Zhao, H.C.; Li, Y.; Biswas, A.; Feng, H.; Liu, F.G.; Pulatov, B. National-Scale Variation and Propagation Characteristics of Meteorological, Agricultural, and Hydrological Droughts in China. Remote Sens. 2020, 12, 3407. [Google Scholar] [CrossRef]
  53. Zeri, M.; Cunha-Zeri, G.; Gois, G.; Lyra, G.B.; Oliveira, J.F. Exposure assessment of rainfall to interannual variability using the wavelet transform. Int. J. Climatol. 2019, 39, 568–578. [Google Scholar] [CrossRef]
  54. Rajarshi, D.; Manne, R.J.; Saswata, N. Assessment of climate change impacts on runoff and hydrological drought risk using the VIC-3L model and four-variate D-vine copulas in the Upper Bhima basin, India. J. Water Clim. Change 2025, 16, 3447–3482. [Google Scholar]
  55. Achite, M.; Katipoğlu, M.O.; Jehanzaib, M.; Kartal, V.; Mansour, H. Understanding run theory for evaluating hydrologic drought in the Wadi Mina Basin (Algeria): A historical analysis. Theor. Appl. Climatol. 2024, 155, 9673–9688. [Google Scholar] [CrossRef]
  56. Sharma, A.; Sharma, D.; Panda, S.K. Assessment of spatiotemporal trend of precipitation indices and meteorological drought characteristics in the Mahi River basin, India. J. Hydrol. 2022, 605, 127314. [Google Scholar] [CrossRef]
  57. He, J.; Yang, X.H.; Li, Z.; Zhang, X.J.; Tang, Q.H. Spatiotemporal Variations of Meteorological Droughts in China During 1961–2014: An Investigation Based on Multi-Threshold Identification. Int. J. Disaster Risk Sci. 2016, 7, 63–76. [Google Scholar] [CrossRef]
  58. Araneda-Cabrera, R.J.; Bermudez, M.; Puertas, J. Revealing the spatio-temporal characteristics of drought in Mozambique and their relationship with large-scale climate variability. J. Hydrol. Reg. Stud. 2021, 38, 100938. [Google Scholar] [CrossRef]
  59. Guo, Y.; Huang, S.Z.; Huang, Q.; Wang, H.; Wang, L.; Fang, W. Copulas-based bivariate socioeconomic drought dynamic risk assessment in a changing environment. J. Hydrol. 2019, 575, 1052–1064. [Google Scholar] [CrossRef]
  60. Su, B.D.; Huang, J.L.; Mondal, S.K.; Zhai, J.Q.; Wang, Y.J.; Wen, S.S.; Gao, M.N.; Lv, Y.R.; Jiang, S.; Jiang, T.; et al. Insight from CMIP6 SSP-RCP scenarios for future drought characteristics in China. Atmos. Res. 2021, 250, 105375. [Google Scholar] [CrossRef]
  61. Katiraie-Boroujerdy, P.S.; Asanjan, A.A.; Chavoshian, A.; Hsu, K.L.; Sorooshian, S. Assessment of seven CMIP5 model precipitation extremes over Iran based on a satellite-based climate data set. Int. J. Climatol. 2019, 39, 3505–3522. [Google Scholar] [CrossRef]
  62. Chu, C.J.; Zhou, J.F. Extreme and Persistent Feature of Drought-Flood Evolution in Henan Province During 1960–2018. Res. Soil Water Conserv. 2022, 29, 164–171. [Google Scholar]
Figure 1. Geographic location map of Henan section of the Yellow River.
Water 18 01252 g001
Figure 2. Method application flowchart.
Water 18 01252 g002
Figure 3. Taylor diagram of (a) precipitation and (b) temperature for monthly data from 1970 to 2014 based on simulations and observations.
Water 18 01252 g003
Figure 4. Measured and simulated (a) annual precipitation and (b) annual average temperature trends in the Henan section of the Yellow River from 1970 to 2014.
Water 18 01252 g004
Figure 5. Measurement and simulation of (a) annual precipitation and (b) annual average temperature trends for various models of the Henan section of the Yellow River from 1970 to 2014.
Water 18 01252 g005aWater 18 01252 g005b
Figure 6. Observed and simulated (a) annual precipitation and (b) annual mean temperature under different scenarios in the Henan section of the Yellow River from 2015 to 2020.
Water 18 01252 g006
Figure 7. The SPEI-12 time series in Henan section of the Yellow River from 1970 to 2020.
Water 18 01252 g007
Figure 8. The spatial distribution of Sen’s slope (a) and Hurst (b) of multi-year average SPEI-12 in Henan section of the Yellow River.
Water 18 01252 g008
Figure 9. The SPEI-12 time series in Henan section of the Yellow River from 2015 to 2100.
Water 18 01252 g009
Figure 10. The wavelet coefficient real part contour map and wavelet variance chart of SPEI-12 series in Henan section of the Yellow River from 2015 to 2100.
Water 18 01252 g010
Figure 11. Changes in future drought (ad) and wet period (eh) frequency in Henan section of the Yellow River compared with the base period under four scenarios.
Water 18 01252 g011
Figure 12. Changes in future drought (ad) and wet period (eh) duration in Henan section of the Yellow River compared with the base period under four scenarios.
Water 18 01252 g012
Figure 13. Changes in future drought (ad) and wet (eh) severity in the Henan section of the Yellow River compared with the base period under different scenarios.
Water 18 01252 g013
Figure 14. Spatial distribution of future drought (ad) and wet (eh) risk in Henan section of the Yellow River under four scenarios.
Water 18 01252 g014
Table 1. Overview of the 5 climate models employed in this study.
NumberModelCountry and InstitutionResolution
1CanESM5Canada, CCCma2.8° × 2.8°
2CNRM-ESM2-1France, CNRM-CERFACS1.4° × 1.4°
3IPSL-CM6A-LREurope, IPSL1.25° × 1.25°
4MIROC6Japan, MIROC1.4° × 1.4°
5MRI-ESM2-0Japan, MRI1.125° × 1.125°
Table 2. Categorization of drought and wet conditions based on the SPEI.
GradeSPEICategory
1SPEI ≤ −2.0Extreme drought
2−2 < SPEI ≤ −1.5Severe drought
3−1.5 < SPEI ≤ −1Moderate drought
4−1 < SPEI ≤ −0.5Mild drought
5−0.5 < SPEI ≤ 0.5Normal
60.5 < SPEI ≤ 1Mild wet
71.0 < SPEI ≤ 1.5Moderate wet
81.5 < SPEI ≤ 2.0Severe wet
92.0 < SPEIExtreme wet
Table 3. Comprehensive comparison table of Sen’s slope and Hurst index.
Sen’s SlopeHSPEI TrendTrend of Drought and Wet Conditions
<0<0.5Decline, the future will be on the riseDrought increasing
Wet condition decreasing
=0<0.5No upward or downward trendNo upward or downward trend
>0<0.5Rising, the future will be a downward trendDrought decreasing
Wet condition increasing
<0>0.5Decline, the future will be a downward trendDrought increasing
Wet condition decreasing
=0>0.5No upward or downward trendNo upward or downward trend
>0>0.5Rising, the future will be on the riseDrought decreasing
Wet condition increasing
Table 4. Assessment of model simulation capability based on SS and TS indexes.
ModelPrecipitationTemperatureComprehensive Ranking
SS RankingTS RankingSS RankingTS Ranking
CanESM545555
CNRM-ESM2-112332
IPSL-CM6A-LR33444
MIROC654113
MRI-ESM2-021221
Table 5. Characteristics of first five drought and wet conditions under future model scenarios.
Climatic ScenarioFrequency of Drought and Wet ConditionsDuration of Drought and Wet Conditions (month)Severity of Drought and Wet Conditions
DroughtWetDroughtWetDroughtWet
YearFYearFYearDYearDYearSYearS
SSP1-2.62030420654203282076820202.9120672.30
2046420844202972050720742.0720562.19
2054420573203072070720392.0320291.89
2093420873203572082620811.9120301.74
2075320713206972099620911.7720801.70
SSP2-4.520794204432063102060820922.0720472.62
2035320453205982019720702.0420782.15
2053320583205372043720291.8821002.10
2076320733206872044720851.7620531.98
2096320933208972075720971.7520331.84
SSP3-7.02071420394206292017920781.8020211.90
2072420564207182059920561.7820731.88
2082420313208082081920911.7120771.70
2085420593208682038820891.6820991.57
2080320963209482095820951.5920201.57
SSP5-8.52016520254209392049820662.7820692.31
2017520664209882018720961.7320152.20
2019520403206072075720381.6220321.87
2091520583207872036620601.5720671.73
2062420713209772080620831.5720891.72
Disclaimer/Publisher’s Note: The statements, opinions and data contained in all publications are solely those of the individual author(s) and contributor(s) and not of MDPI and/or the editor(s). MDPI and/or the editor(s) disclaim responsibility for any injury to people or property resulting from any ideas, methods, instructions or products referred to in the content.