Article

Assessment of Inhibition of Activated Sludge Respiration in Industrial, Hospital and Municipal Wastewater Using ISO 8192:2007

Institute of Urban Water Management and Landscape Water Engineering, Graz University of Technology, Stremayrgasse 10/I, 8010 Graz, Austria
*
Author to whom correspondence should be addressed.
Water 2026, 18(10), 1162; https://doi.org/10.3390/w18101162
Submission received: 16 April 2026 / Revised: 5 May 2026 / Accepted: 11 May 2026 / Published: 12 May 2026
(This article belongs to the Section Wastewater Treatment and Reuse)

Abstract

Industrial and municipal wastewater may contain substances that inhibit biological processes in wastewater treatment plants (WWTPs), posing risks to operational stability and environmental protection. The aim of this study is to evaluate the practical suitability of the ISO 8192:2007 respiration inhibition test for assessing the toxicity of wastewater. Nitrified activated sludge from a municipal WWTP was used to analyze wastewater from three industrial companies, wastewater from several discharge locations at a hospital, and WWTP influent. Oxygen consumption and inhibition were determined at sample-specific dilution levels and the reference substance 3,5-dichlorophenol. Two samples from the dental department of the hospital showed toxic effects on activated sludge respiration (inhibition > 50%), while no toxic effects were observed in the remaining samples. Several samples exhibited stimulatory effects (inhibition < 0%), indicating the presence of readily biodegradable organic matter. However, inhibitory effects (0–50% inhibition) were detected in individual wastewater samples at higher concentrations. This demonstrates that the method can detect toxicological changes in wastewater and is suitable for routine monitoring and early warning in WWTPs.

1. Introduction

Industrial and municipal wastewater can contain a wide range of organic and inorganic substances that interfere with the biological processes in wastewater treatment plants. The pharmaceutical industry [1,2,3,4,5,6], the petrochemical industry [1,7,8], energy-generating industries [9], hospitals [10,11], and leachates from landfills [12], generate highly polluted wastewater. Heavy metals [13,14,15,16,17] can also enter wastewater, while household products [18] and agricultural [18,19] activities also release chemical compounds that can adversely affect WWTPs performance. For the biological treatment of wastewater, WWTPs typically employ the activated sludge process, which is considered the most common and effective method [12,18,20,21,22,23]. However, wastewater contaminated with harmful substances can be toxic to microorganisms, thereby posing a risk to the stability of plant operation. Stable WWTPs operation depends on the activity and quantity of the microorganisms responsible for handling changes in wastewater composition [12]. If the concentrations of certain substances increase suddenly, microbial activity can decline [24,25], which, in severe cases, may lead to failure of the treatment process [12,21,26,27]. Following such a failure, several months may be required to restore the system to its normal operational state [15,28]. It is therefore essential to determine the toxicity of wastewater in good time in order to prevent harm to treatment processes and the environment [9,12,18,26,27,29,30,31,32].
A significant contributing factor to the exceedance of discharge limits is the failure of biological treatment processes [12]. Inhibited nitrification can result in a decrease in treated wastewater quality, resulting in ammonia toxicity and eutrophication in aquatic environments [33]. Determining the toxicity of wastewater is therefore not only relevant for WWTPs operations, but also for complying with environmental protection regulations.
The varying properties of pollutants and composition of wastewater make it difficult to predict their effects on WWTPs. The literature reports a number of effects, including the inhibition of biological degradation and an influence on sludge settling properties [34]. It has been reported that the treatment of these pollutants is rendered difficult by their differing degradation properties [35]. Furthermore, there is a reduction in the affinity of bacterial cells for carbon sources, changes in cell membrane structure and a reduction in dissolved oxygen concentrations [36]. Further potential ramifications comprise sludge bulking, diminished solid separation and diminished removal of organic compounds [9], which engender an elevated risk of operational disruptions [9,37]. The remediation of such issues can incur significant financial costs [30,31]. Potential resolutions may include the incorporation of polymer additives [37] or the substitution of activated sludge with that from a proximate WWTP. Preventive protective measures are essential for the above reasons [18,21,32].
Several standardized methods exist for assessing wastewater toxicity, including ISO 8692:2012 (algal toxicity) [38], ISO 11348-1:2019 to ISO 11348-3:2019 (bacterial toxicity) [39,40,41], ISO 6341:2013 (daphnia toxicity) [42], and ISO 15088:2009 (fish toxicity) [43]. However, these methods are only partially suitable for protecting WWTPs operations, as they are primarily geared toward toxic effects on organisms in aquatic ecosystems. They have, however, proven particularly effective for protecting the aquatic environment [44]. The ISO 8192:2007 method [45], which is comparable to ISO 9509:2006 [46], is used to determine the inhibition of oxygen consumption in activated sludge. As it directly employs activated sludge, the method is well suited for assessing the effects of potentially toxic substances on activated sludge from affected wastewater treatment plants. In previous studies [47,48], the method was further developed and verified. Study [47] identified sensitive boundary conditions and optimized and verified the method, while study [48] quantified measurement uncertainties using both the GUM approach and Monte Carlo simulation. This investigation builds on these findings.
In the literature [29,47,49,50,51], the ISO 8192:2007 [45] method has so far mostly been used with well-defined chemical compounds (e.g., 3,5-dichlorophenol). To the best of the authors’ knowledge, the application of ISO 8192:2007 [46] to complex industrial, hospital and municipal wastewater is not yet fully apparent. This study aims to address this gap by examining whether the standard procedure ISO 8192:2007 [45], as modified by Neunteufel et al. [47], can be reliably used in practical applications to assess the toxicity of different types of wastewater on the biological activity of activated sludge used in a WWTP. The present study examines the applicability of the method to testing of wastewater samples and its practical usefulness. The study further explores the feasibility of reliably detecting inhibitory effects in various wastewater streams. Additionally, it investigates the practicality of the method as a tool for routine monitoring, early warning systems, and control in WWTPs.
The following research questions will be addressed:
-
Can the ISO 8192:2007 method [45], as modified by Neunteufel et al. [47], previously tested primarily on well-defined chemical compounds (e.g., 3,5-dichlorophenol), be applied to wastewater samples to indicate their effects on activated sludge respiration?
-
Does the method show potential for regular assessment and early detection of toxicological changes in wastewater discharges?

2. Materials and Methods

2.1. Instruments and Chemicals

The instruments and chemicals used in this investigation included air pumps (600 L/h, SuperFish; and 300 L/h, JBL, Neuhofen, Germany), a digital measuring device (Multi 3430 WTW, Weilheim, Germany), a pH probe (IDS pH-Electrode SenTix 940 WTW, Weilheim, Germany), a magnetic stirrer (Rotilabo MH 15 Karl Roth GmbH + Co. KG, Karlsruhe, Germany), an oxygen probe (FDO 925 WTW, Weilheim, Germany), a precision scale (Sartorius analytic, Göttingen, Germany), filter paper (MN 640 w MACHEREY-NAGEL, Düren, Germany), a wastewater sample homogenizer (IKA disperser T 50 digital ULTRA-TURRAX, Staufen, Germany), test vessels, an Imhoff funnel, a stirring magnet, 3,5-dichlorophenol (SIGMA-ALDRICH Co., St. Louis, MO, USA), calcium chloride dihydrate (MERCK, Darmstadt, Germany), meat extract (Karl Roth GmbH + Co. KG, Karlsruhe, Germany), urea (MERCK, Darmstadt, Germany), anhydrous potassium monohydrogen phosphate (MERCK, Darmstadt, Germany), magnesium sulfate heptahydrate (MERCK, Darmstadt, Germany), meat peptone (Karl Roth GmbH + Co. KG, Karlsruhe, Germany), and N-allylthiourea (MERCK-Schuchardt, Hohenbrunn, Germany).

2.2. Activated Sludge and Samples

For all conducted tests, nitrified activated sludge from a WWTP in Graz, Austria, was chosen for analysis.
The wastewater samples examined were industrial wastewater from three industrial companies, hospital wastewater from several different discharge locations, and the inflow to a WWTP. The activated sludge from this plant was also used for the tests. When selecting industrial companies, particular attention was devoted to those suspected of having toxic wastewater given the nature of their production processes. We obtained samples from seven different locations within the hospital. The influent samples from the WWTP are subject to an annual study, where one sample is analyzed each month; thus, 12 analyzed samples were included in the study. Industrial companies No. 1 and No. 2, as well as the hospital, are referred to as indirect dischargers, meaning that they discharge their wastewater, after internal pretreatment, into a public sewer system. In contrast, industrial company No. 3 is a direct discharger, meaning it discharges its wastewater, after internal treatment, directly into receiving water. The investigated hospital wastewater is discharged into the public sewer system without pretreatment. Table 1 shows the type and number of samples of each investigated discharge.
Industrial inflow samples were taken before the internal pretreatment process, while industrial effluent samples were taken after the internal pretreatment process. Qualified random samples are defined as a mixture of at least five samples of equal volume taken at least two-minute intervals over a period of no more than two hours.

2.3. Respiration Inhibition Test

Experiments and measurements were conducted in accordance with the guidelines set out in ISO 8192:2007 [45] with the modification described by Neunteufel et al. [47]. The activated sludge was left to settle for one hour at room temperature. Subsequently, the decanted supernatant was substituted with chlorine-free tap water. This process was repeated four times to clean the used activated sludge. For further use on the following day, the activated sludge was aerated at room temperature and supplied daily with approximately 40 mL/L of test medium to ensure a sufficient supply of nutrients to the activated sludge. The concentration of Total Suspended Solids (TSSs) in the washed activated sludge was determined through filtration and drying processes. These processes were carried out at a temperature of 105 °C for a minimum duration of 24 h.
To determine the extent of inhibition of total oxygen consumption, the following test medium was prepared in accordance with ISO 8192:2007: 16 g of peptone, 11 g of meat extract, 3 g of urea, 0.7 g of sodium chloride, 0.4 g of calcium chloride dihydrate, 0.2 g of magnesium sulphate heptahydrate, 2.8 g of anhydrous potassium dihydrogen phosphate and 1 L of distilled/deionized water. In addition, 3,5-dichlorophenol was dissolved at a concentration of 1 g per 1000 mL of distilled/deionized water. This substance was utilized as a reference substance and evaluated in conjunction with all wastewater samples to verify the suitability and sensitivity of the activated sludge and to ensure that the measured inhibition values fell within the valid range stipulated by the relevant standard.
Then, in accordance with ISO 8192:2007, the activated sludge was diluted to achieve a TSS concentration of approximately 3 g/L. The test mixtures—consisting of the test medium, the activated sludge and, depending on the dilution level being investigated, the test substance supplemented with chlorine-free tap water—were prepared and aerated. All examined wastewater samples were homogenized using a disperser for 2 min per 1 L of wastewater sample before corresponding aliquots were taken for the test mixtures.
According to ISO 8192:2007 [45] recommendations, test mixtures with different dilution levels, with at least three test substance concentrations and a blank control (BC), were prepared.
After aeration for 30 min, the test mixture was transferred into a test vessel placed on a magnetic stirrer and the oxygen consumption was measured in the test vessel using an oxygen probe.
The test vessels contained 750 mL of the test mixture. This mixture contained 375 mL of activated sludge and 24 mL of the test medium. It was also supplemented with a corresponding amount of the test substance and chlorine-free tap water. This was added to make a total volume of 750 mL, depending on the dilution level examined.
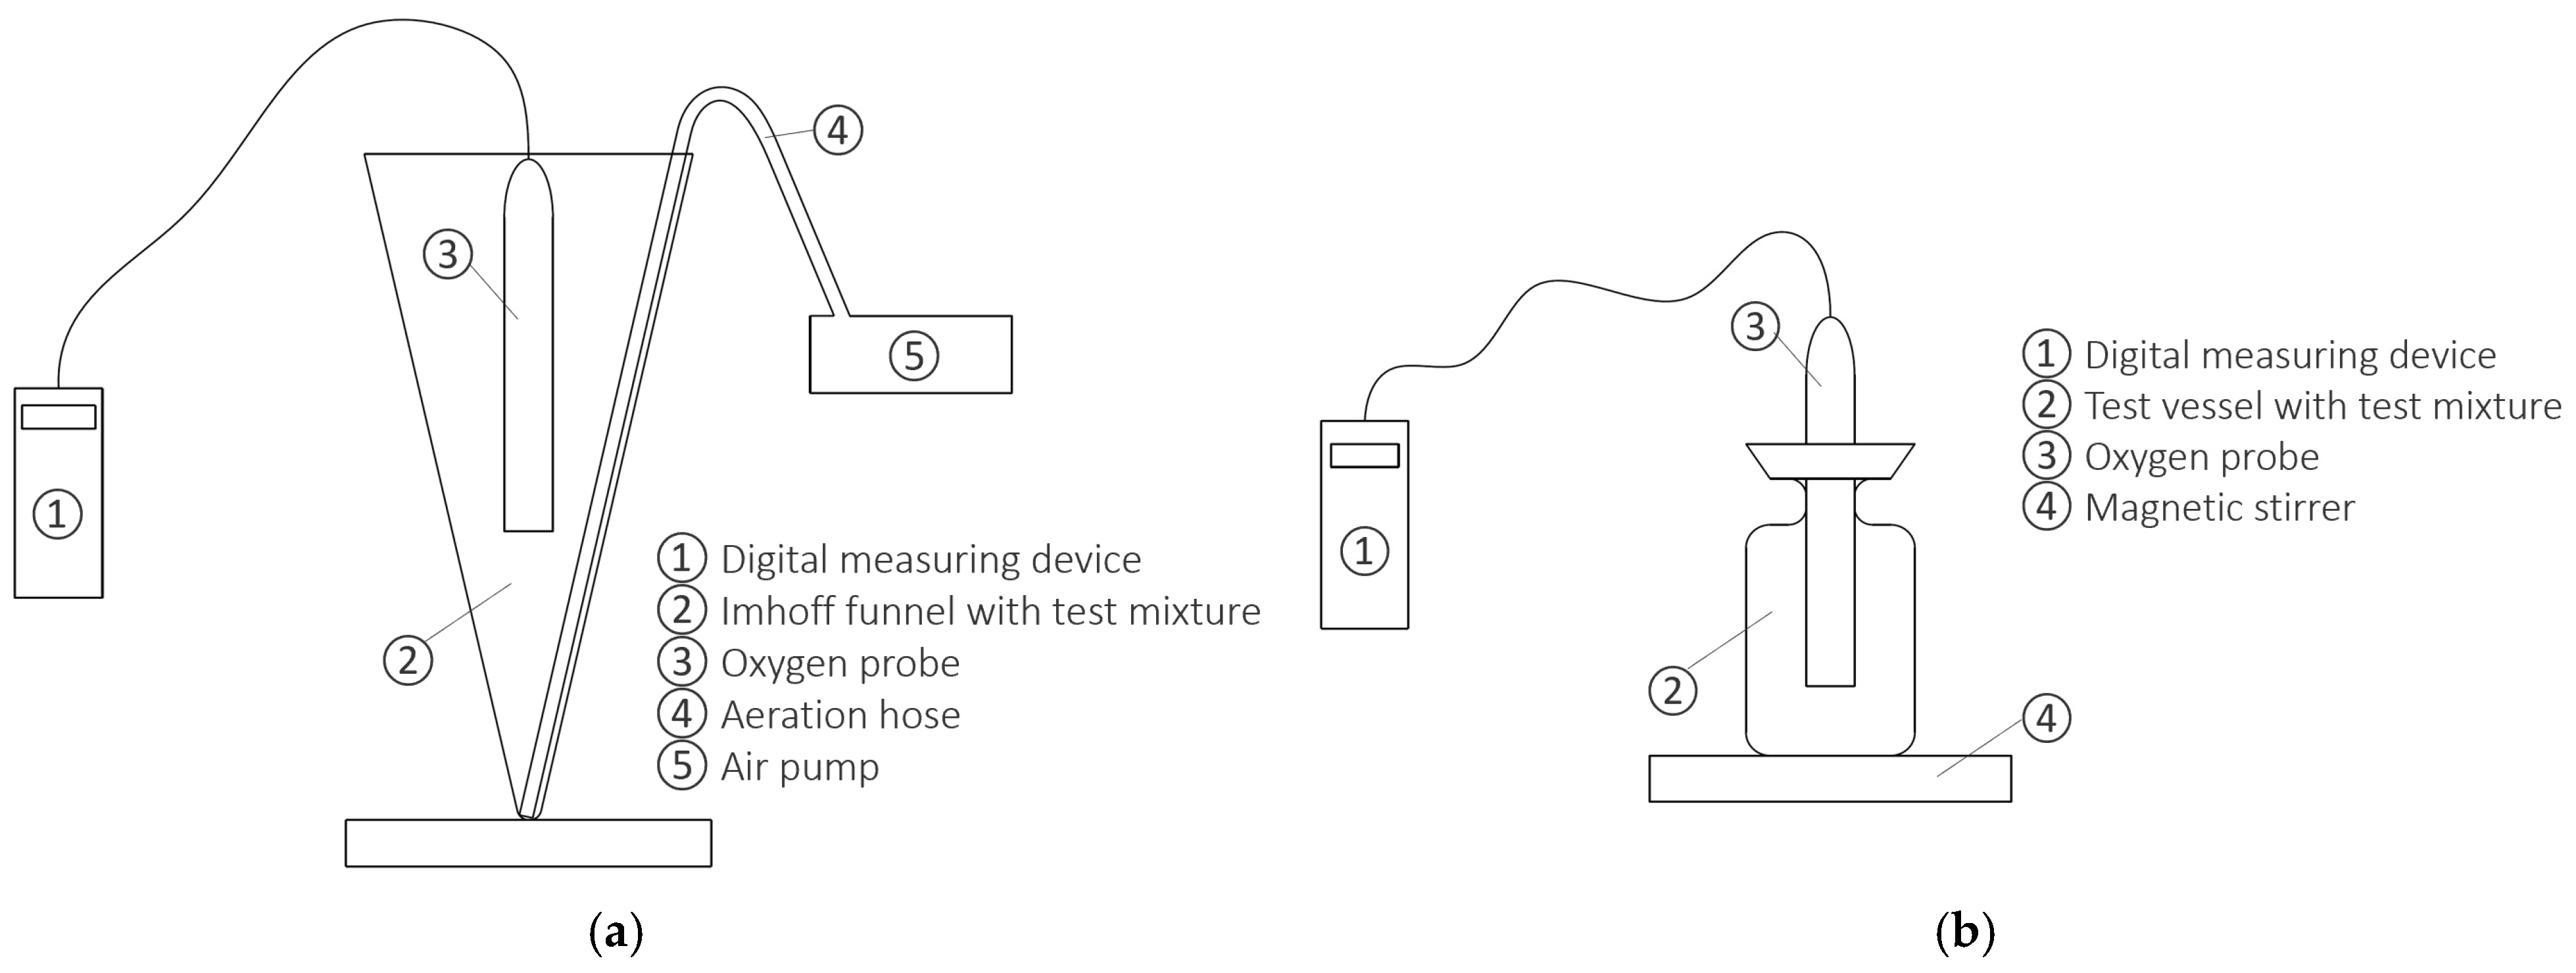
During the tests, the temperature of the test environment and test mixture was kept at 22 ± 2 °C, and the pH value of the test medium was kept at 7.5 ± 0.5. Figure 1 illustrates the equipment and experimental setup for aeration and oxygen concentration measurement.
Experiments were evaluated by linear regression of the oxygen consumption curves (at an oxygen concentration between approximately 2 and 7 mg/L). Outliers were identified and removed by employing Cook’s Distance. This method is based on the residuals of a (multiple) linear regression model and quantifies the influence of individual observations on the fitted regression model. Following the recommendation of Hardin et al. [52], values exceeding 4/n (where n is the sample size) were considered as influential outliers and treated as such in the analysis.
The calculation formula was chosen in accordance with ISO 8192:2007 [45] with the modification reported by Neunteufel et al. [47].
The oxygen consumption rate was calculated as follows:
R i = ( ρ 1 ρ 2 t ) × 60 [ m g / L · h ] ,
where ρ 1 represents the oxygen concentration at the beginning of the relevant range (mg/L), ρ 2 is the oxygen concentration at the end of the relevant range (mg/L), and t is the time interval (min). The percentage inhibition of total oxygen consumption was calculated as follows:
I = [ 1 R T R T B C ] × 100 [ % ]
with R T as the oxygen consumption of the respective test mixture (mg/L·h) and R T B C as the oxygen consumption of the blank control (mg/L·h).

2.4. Dilution Scheme

For all investigated samples, mean values of the percentage inhibition of total oxygen consumption as well as mean oxygen consumption rates were determined. Measurements were conducted at different dilution levels specific to each sample type. Each dilution level was analyzed in quadruplicate using two different oxygen probes. Two oxygen consumption measurements were performed with each probe in two different test mixtures at each dilution level. In addition, blank controls were measured for all sample types to allow for comparison with the respective dilution levels. As previously stated, the relevant standard requires a minimum of three dilution levels. To ensure consistent sludge characteristics and achieve comparable results for the up-to-seven hospital samples analyzed each day, the number of dilution steps was limited to three (dilution factors of 10, 5 and 2.14) due to the high daily sample throughput. Assuming the behavior of the WWTP influent was comparable, the same dilution scheme was applied. However, a higher toxic load was anticipated for the industrial companies, particularly companies Nos. 2 and 3; thus, a broader range of dilution levels was chosen. For industrial company No. 1, dilution factors (DFs) of 10, 7.5, 5, 3.5, and 2.14 were applied, whereas for industrial companies Nos. 2 and 3, dilution factors of 25, 15, 10, 7.5, 5, 3.5, and 2.14 were used due to the presence of highly toxic substances in their production processes. The dilution factor (DF) of 2.14 is the maximum test condition when there is no dilution. It results from the specific composition of the test mixture, consisting of 351 mL of wastewater sample, 24 mL of test medium, and 375 mL of activated sludge, without adding chlorine-free tap water. Therefore, DF 2.14 is the highest concentration of the test sample in the given test conditions.

3. Results and Discussion

In the activated sludge respiration inhibition test, toxicity is determined by the percentage reduction in oxygen consumption relative to the blank control. Positive inhibition values indicate impaired biological activity, while negative inhibition values indicate that the addition of the test substance has increased the biological activity in the test mixture compared to the blank control. The pivotal reference parameter is the effective concentration EC50, defined as the concentration of the test substance at which the oxygen consumption of the activated sludge is reduced by 50%. The classification of an effect as clearly toxic is contingent upon the surpassing of this inhibition threshold. Inhibition values well below this threshold are generally not considered toxic in terms of a relevant impact on the treatment process at WWTPs. To facilitate clearer interpretation of the results, three states are defined: “Toxic effects” refer to inhibition values greater than 50%, “inhibitory effects” describe values between 0% and 50%, and “stimulatory effects” correspond to values below 0%.
In both Neunteufel et al.’s study [48] and the present study, 3,5-dichlorophenol was used as the reference substance. The evaluation focused on concentrations of 10 mg/L and 20 mg/L, as these account for the EC50 value for respiration inhibition according to ISO 8192:2007 [45], representing the most sensitive and informative region of the inhibition curve. In the present dataset, the EC50 values ranged from 8.72 to 24.36 mg/L, fully complying with the 2–25 mg/L validity range specified in ISO 8192:2007 [45].
For a concentration of 10 mg/L 3,5-dichlorophenol, Neunteufel et al. [48] yielded a 95% coverage interval of 38.49–49.65% in the measurement uncertainty analysis. The mean inhibition value obtained in the present study (42.53%) lies within this interval.
For 20 mg/L of 3,5-dichlorophenol, Neunteufel et al. [48] determined a 95% coverage interval ranging from 61.17 to 68.71% inhibition. Our mean inhibition value of 61.63%, remains consistent with the expectations outlined in the measurement uncertainty analysis.
For the blank control, Neunteufel et al.’s [48] measurement uncertainty analysis resulted in a 95% coverage interval of 43.93–50.06 mg/L·h. In the present study, the mean oxygen consumption rate of the blank control was 47.7 mg/L·h, which lies within this interval and confirms the expected stability of the system.
Additionally, the activity of the activated sludge met the minimum requirement in all experiments, as the blank control’s specific oxygen uptake rate consistently exceeded the normative threshold of 20 mg/g suspended solids per hour. As all EC50 values lie within the normative reference range and the activity requirements for the blank control are met, the activated sludge can be considered suitable for toxicity testing in accordance with ISO 8192:2007 [45]. In cases where only a limited number of measurements were available, measurement uncertainty cannot be determined, as this would require a sufficiently large dataset to reliably characterize input distributions and coverage intervals. Therefore, for the wastewater samples from the investigated discharges, for which a maximum of four replicates per sample were available, the variability of the inhibition results is reported using the standard deviation, as this provides an appropriate measure of the spread observed among replicate measurements.

3.1. Industrial Companies

3.1.1. Industrial Company No. 1

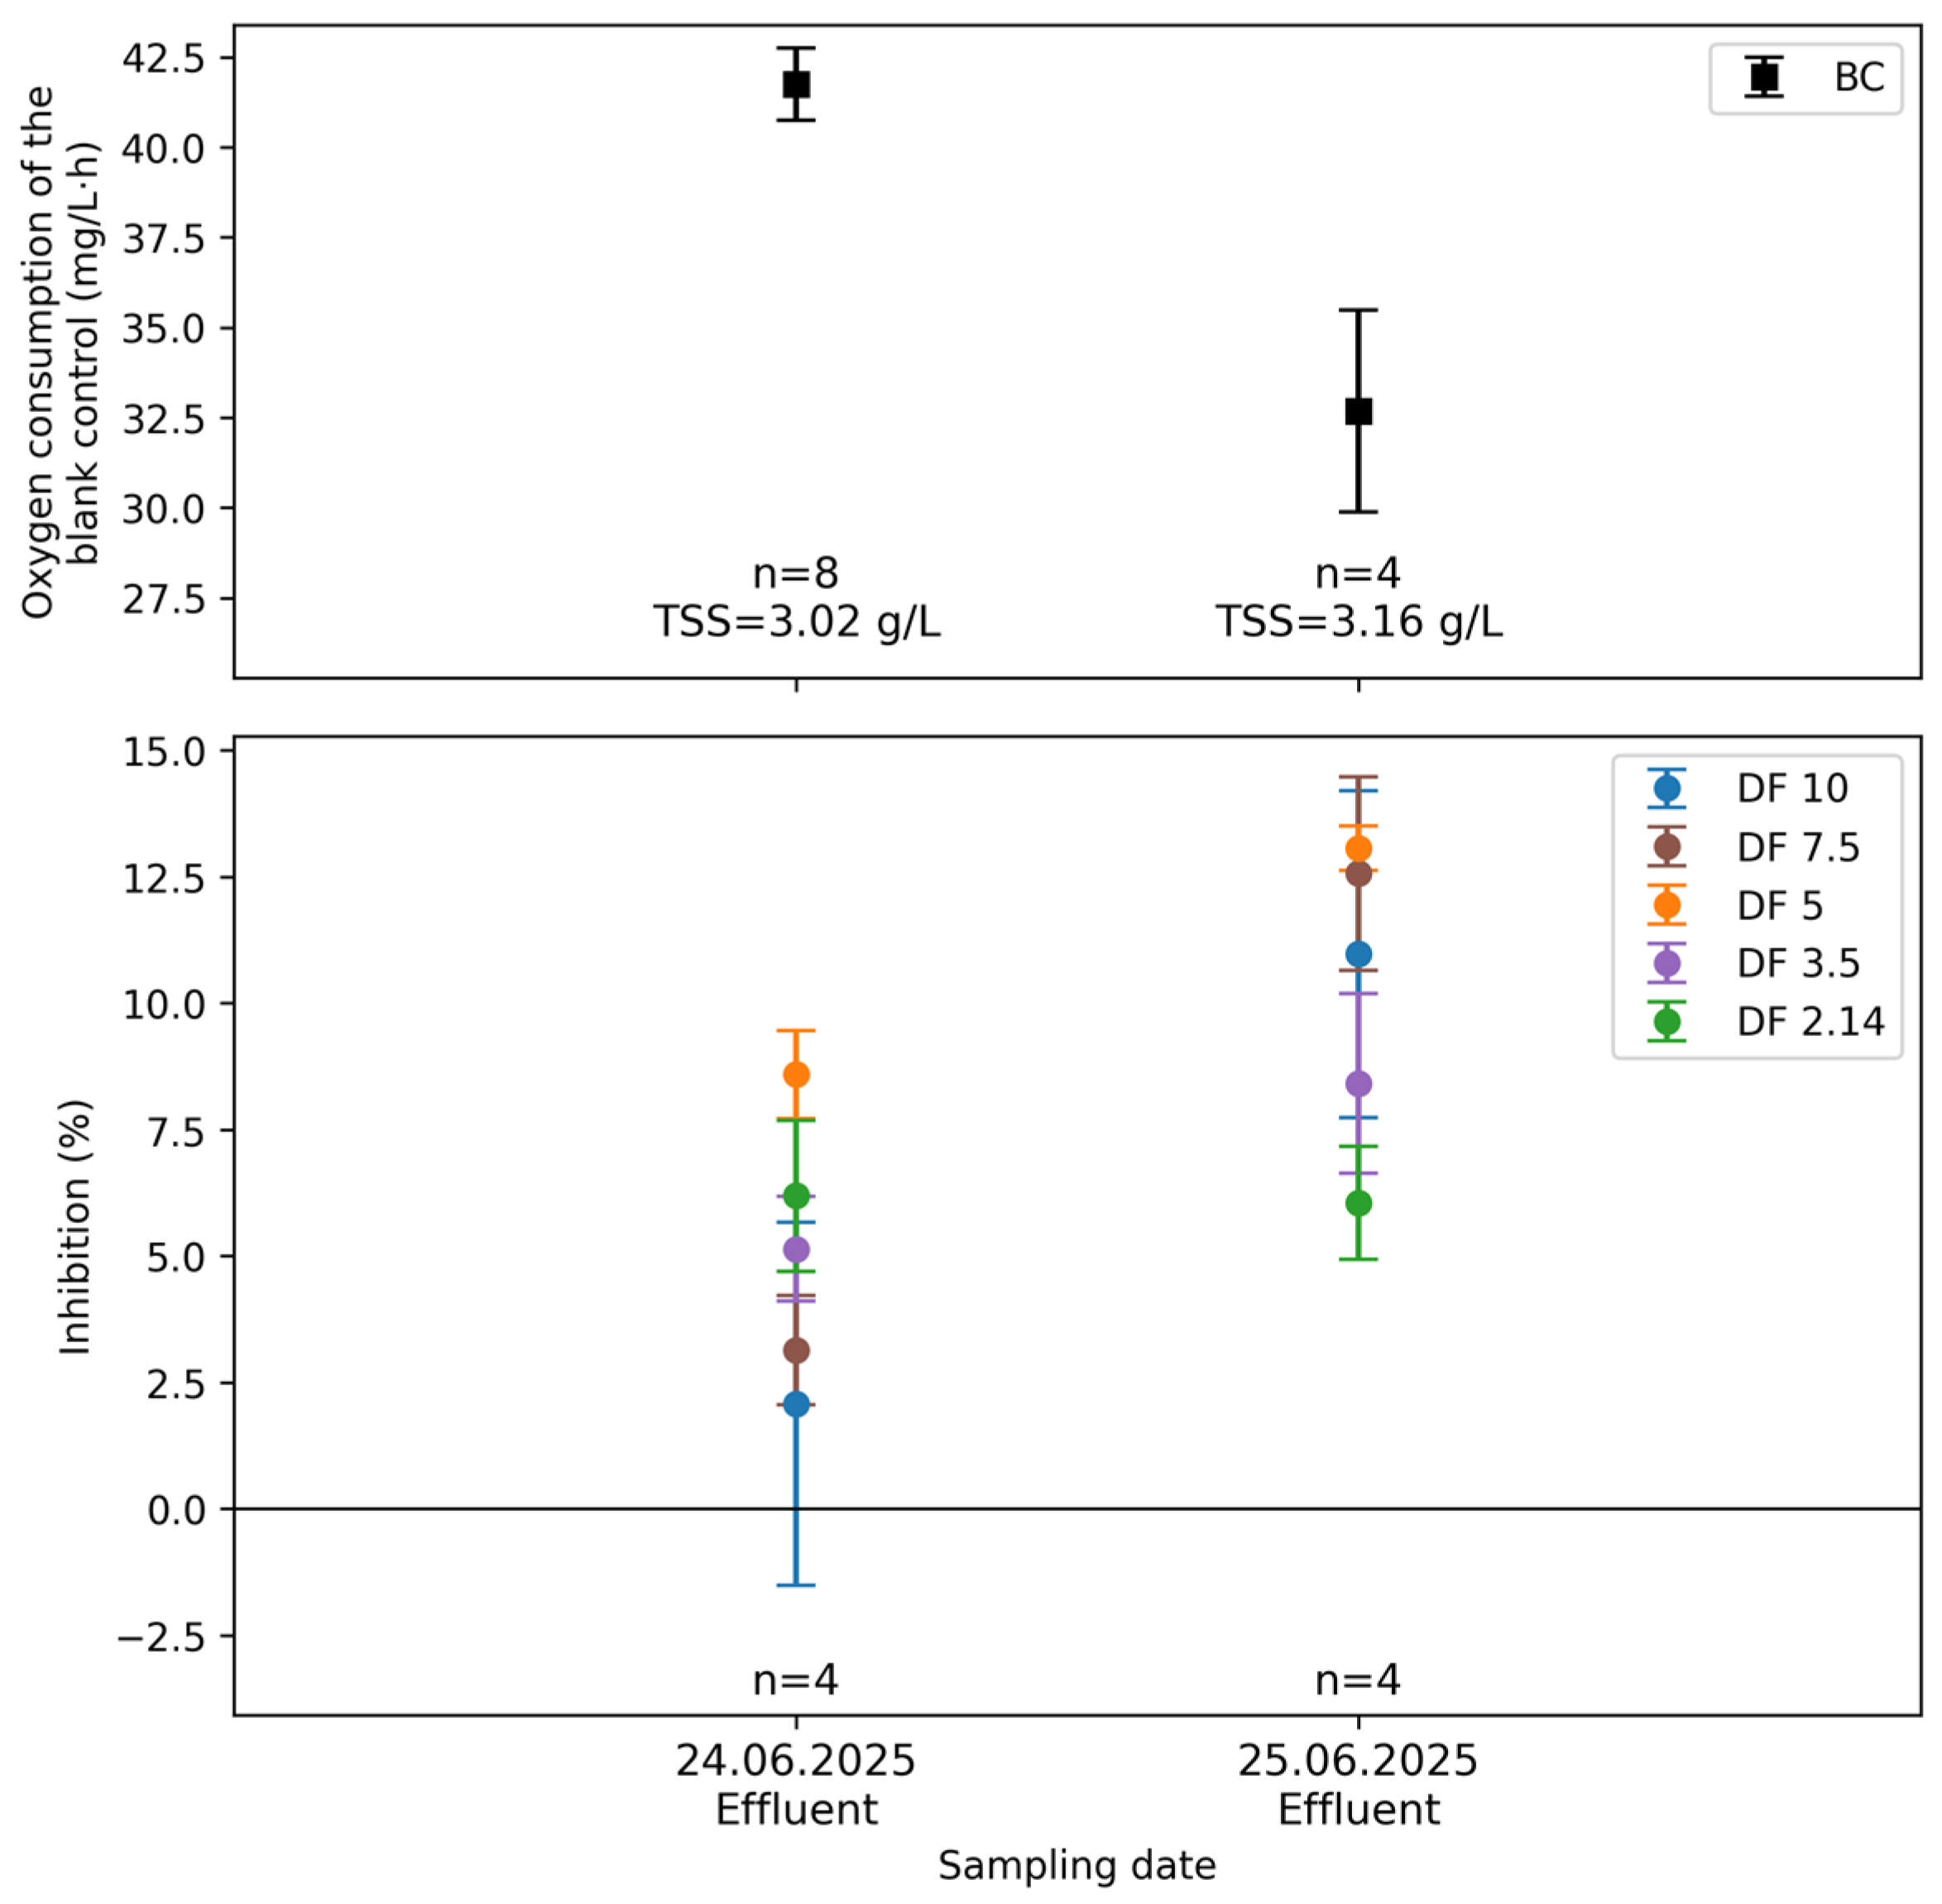
Two volume-proportional 24 h composite samples of effluent collected on two consecutive days were available for toxicity testing. The activated sludge used in both tests originated from a day class representing a dry-weather day. The results on the two sampling days are displayed in Figure 2; exact values can be found in Table A1 and Table A2 in the Appendix A.
The investigation of the effluent samples from industrial company No. 1 demonstrated that the samples caused less inhibitory effects of activated sludge used in the wastewater treatment plant, indicating that they lack toxic effects. Furthermore, an increase in inhibition was observed on the second day. For the second test on 25 June 2025, the same activated sludge as the previous day was used due to the considerable time required. However, the results for the blank control sample show that the oxygen consumption rate fell from 41.7 mg/L·h to 32.7 mg/L·h on the second day. This observation has been made in earlier studies [47]. Since the blank control does not contain wastewater, the observed decrease in oxygen consumption rate is related to changes in the activity of the reused activated sludge. This should be considered when interpreting the results of the second test. As recommended in a previous study [47], all measurements should ideally be conducted on the same day using the same activated sludge, or alternatively, fresh activated sludge should be prepared to ensure consistent and comparable conditions.

3.1.2. Industrial Company No. 2

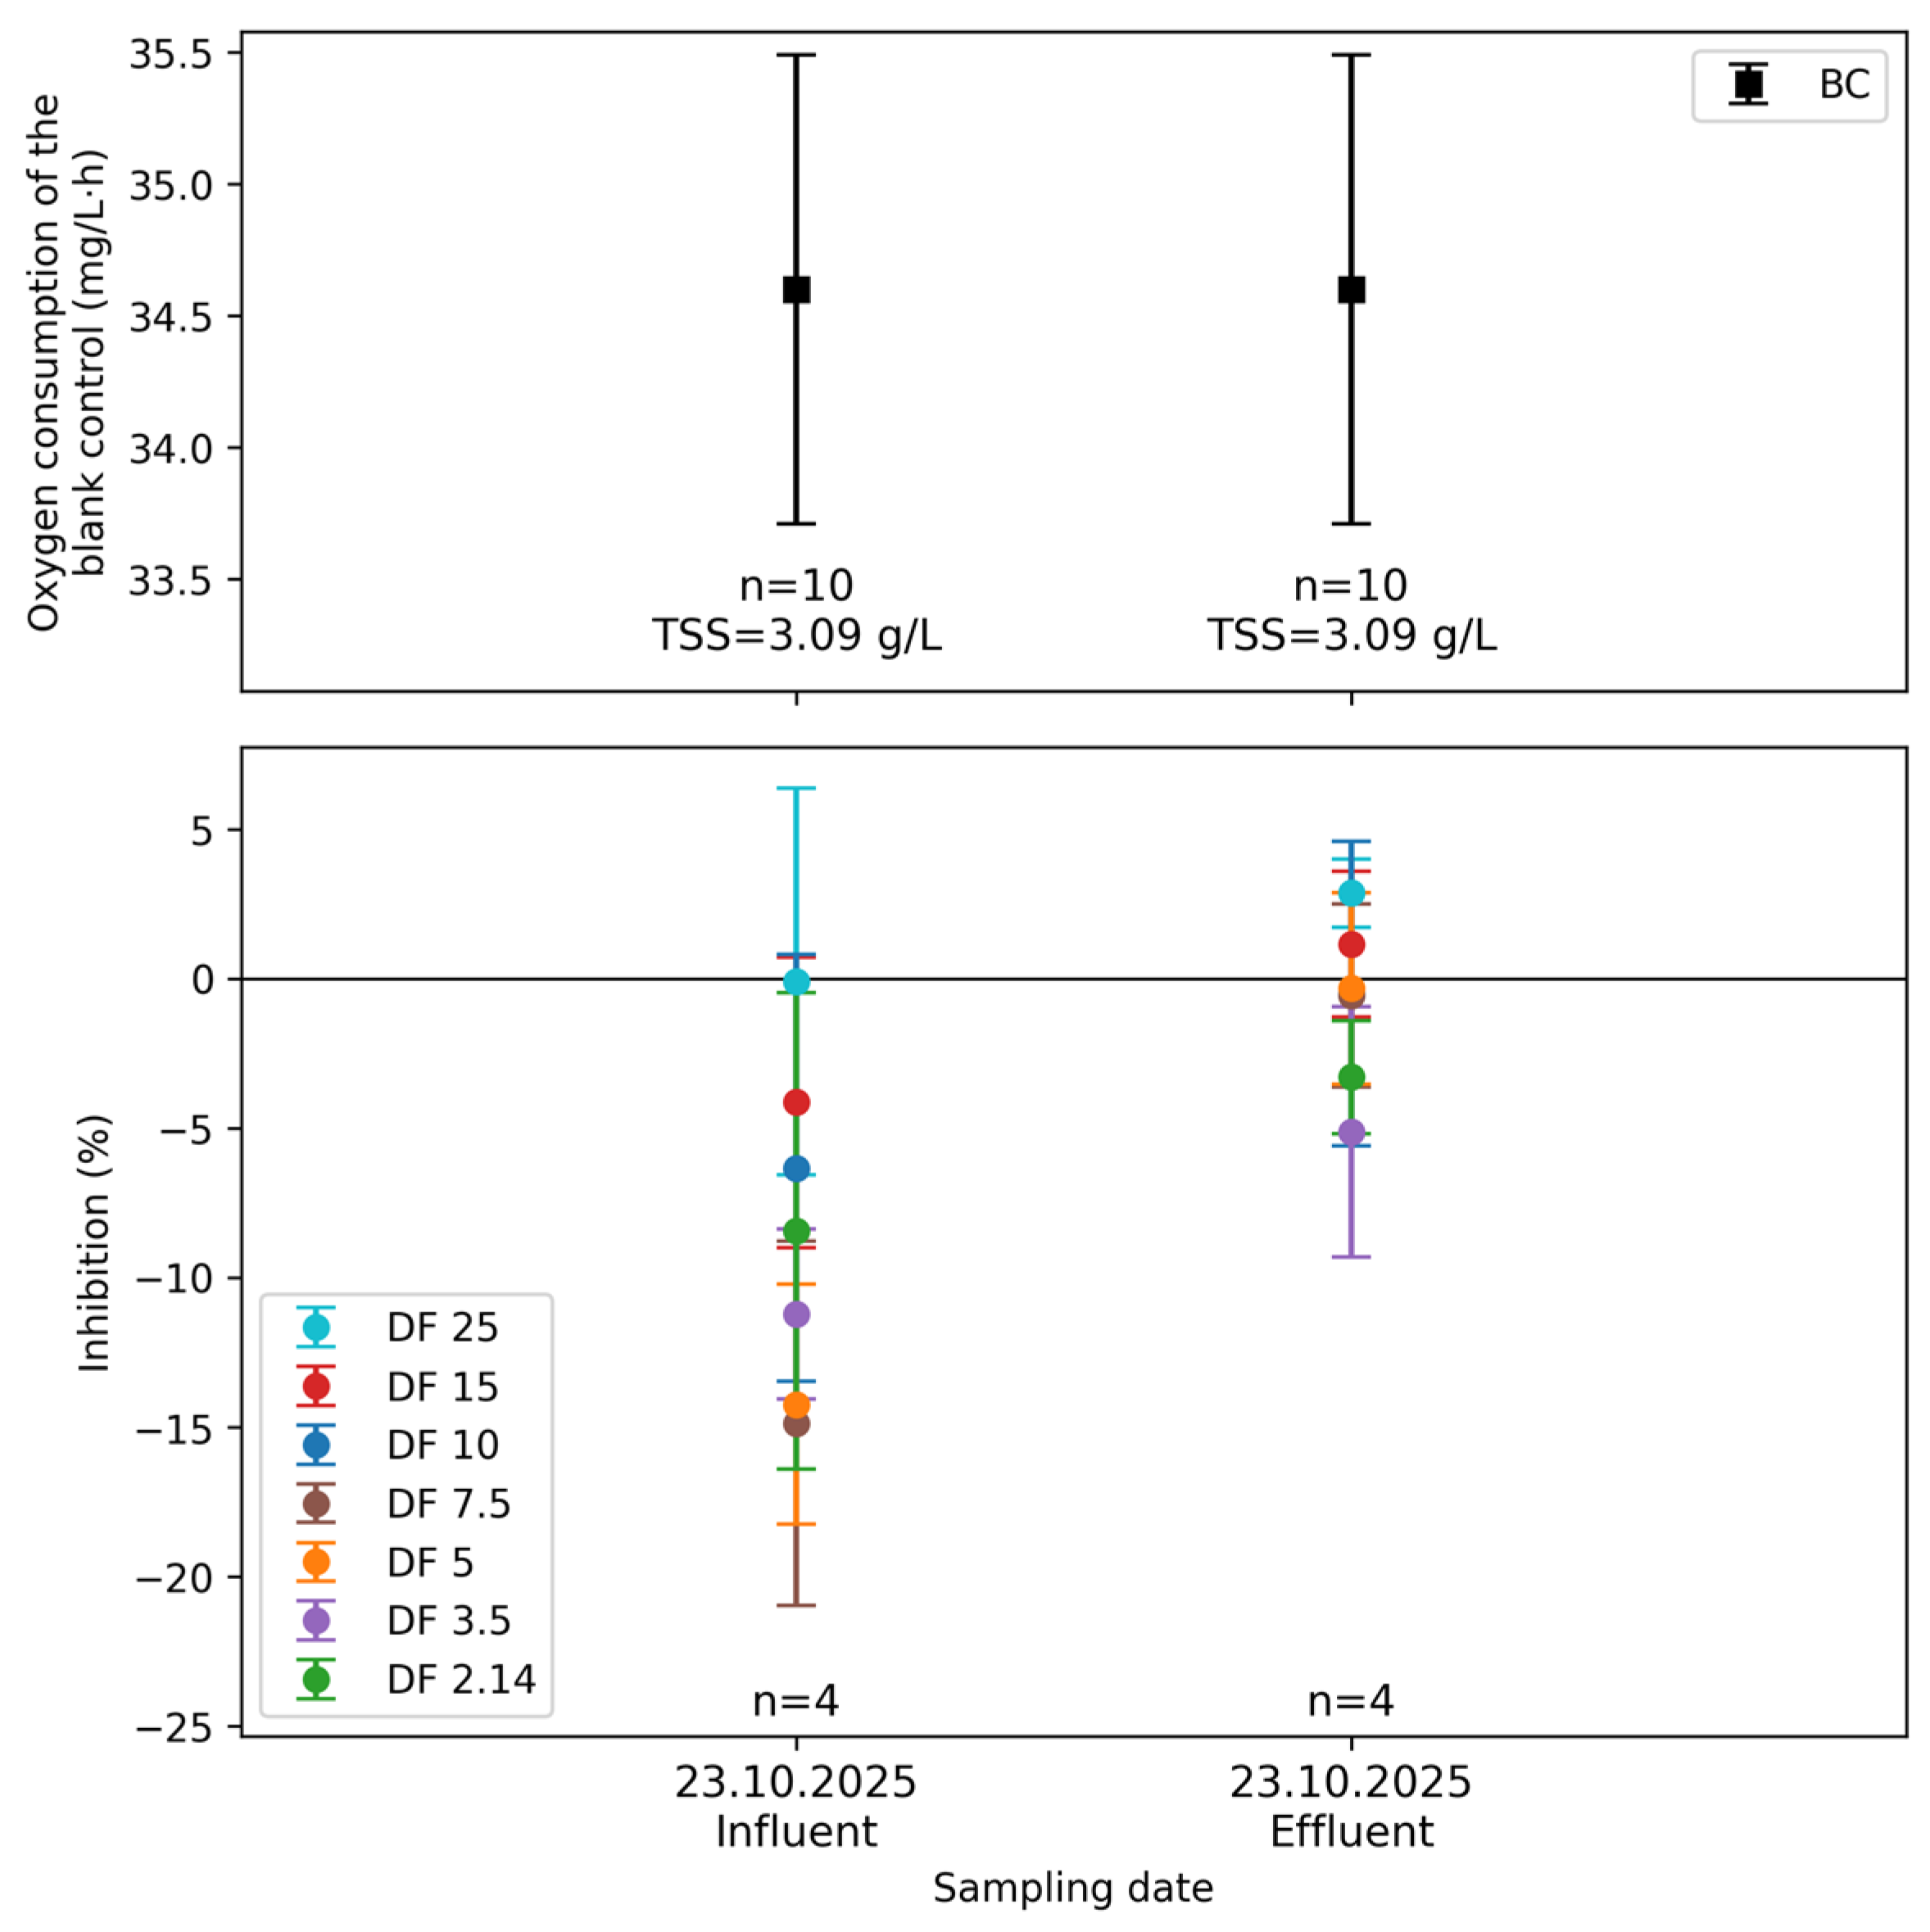
Toxicity tests were carried out on influent and effluent samples, and the activated sludge used in the tests was taken on a dry-weather day. The results for the influent and effluent sample are presented in Figure 3 and Table A3 and Table A4 in the Appendix A.
The findings related to the influent and effluent samples from industrial company No. 2 show inhibition values ranging from stimulatory to low inhibitory effects. Negative values are methodologically possible and do not indicate a toxic effect. Rather, the findings suggest that the oxygen consumption measured in the presence of the wastewater sample was higher than in the blank control. This finding indicates that the organic substances present in the influent and effluent samples were effectively utilized by the microorganisms present in the activated sludge, leading to an enhancement in biological activity.

3.1.3. Industrial Company No. 3

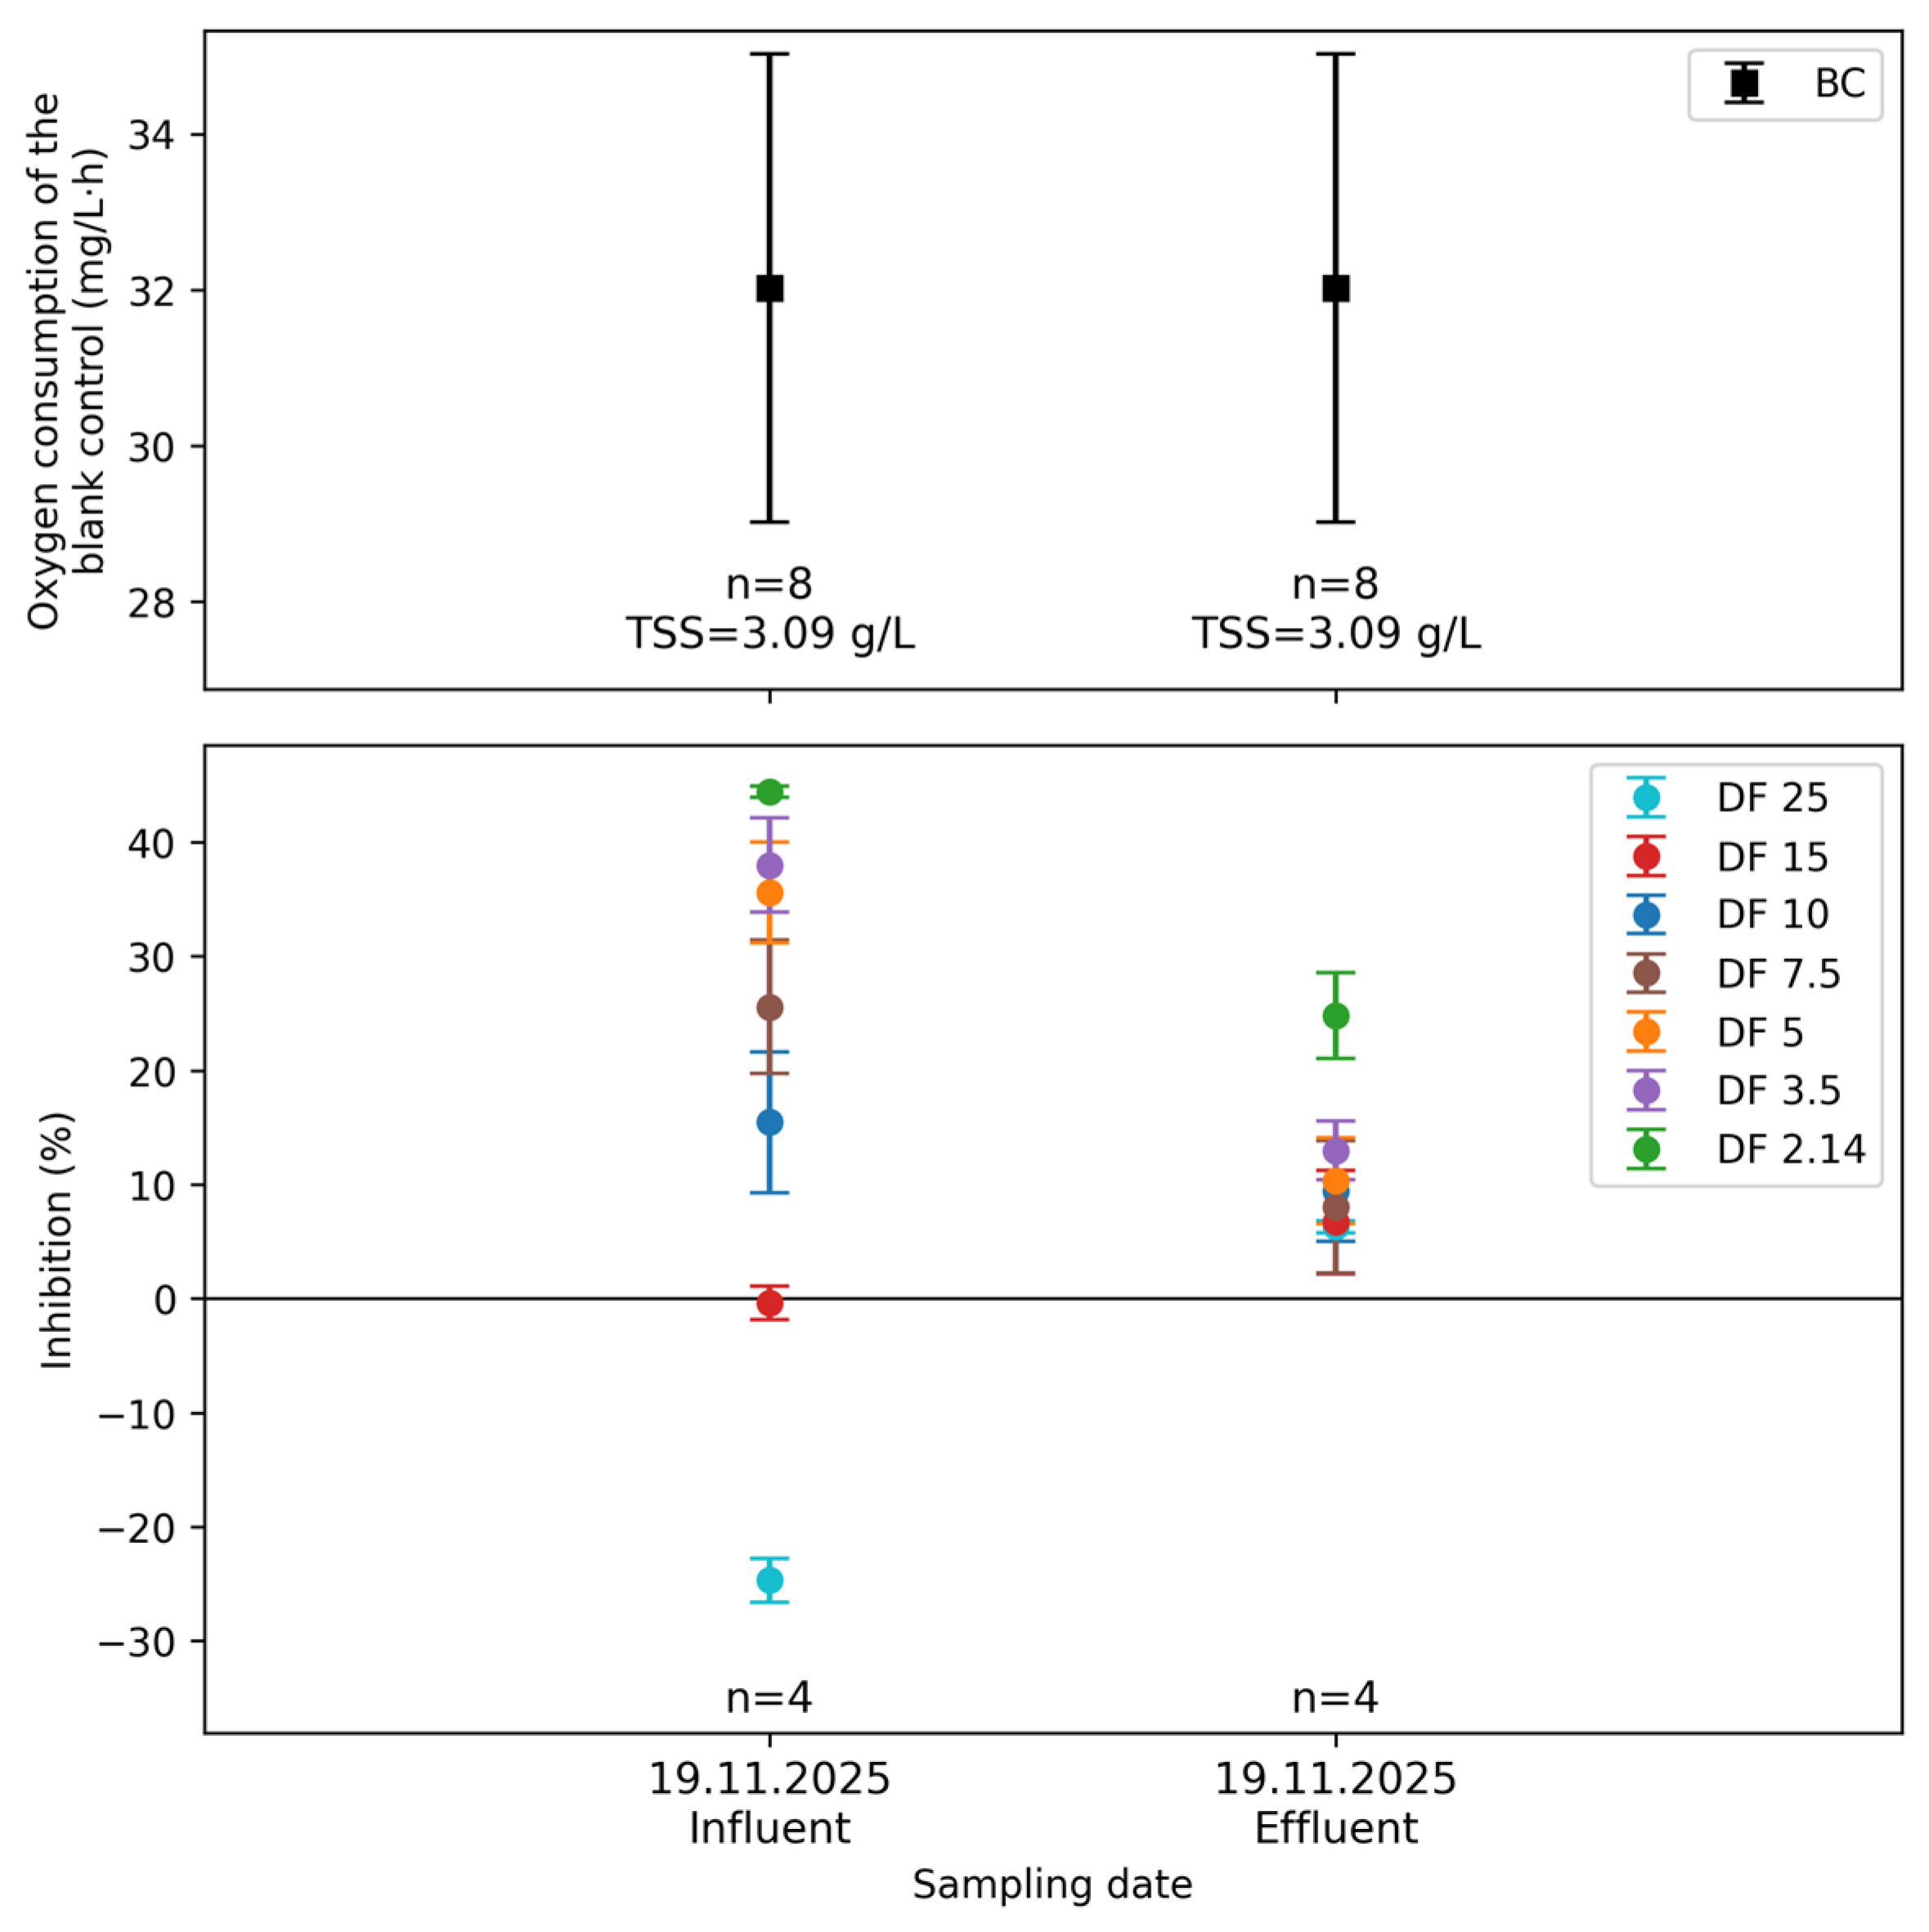
Samples of the influent and effluent were used to carry out the toxicity tests, and the activated sludge used in the tests originated from a dry-weather day. Figure 4 shows the results for the influent and effluent samples; exact values can be seen in Table A5 and Table A6 in the Appendix A.
The results of analysis of the influent samples from industrial company No. 3 exhibit a significant difference. The highest dilution levels (DF 25 and DF 15) result in negative or nearly neutral inhibition values (−25% and −0.35%), which, as previously mentioned, indicates a stimulatory effect of microbial activity. Moderately positive inhibition values (15–45%) are only observed from dilution level DF 10 onwards, increasing steadily in more concentrated samples. The highest recorded inhibition was measured at DF 2.14, with an approximate percentage of 44%. This value is below the toxic inhibition limit of 50%.
The effluent samples from the same company exhibit a slight but steadily increasing inhibition of oxygen consumption across all dilution levels examined. While the high dilution levels (DF 25, DF 15, DF 10, and DF 7.5) exhibit only a minimal inhibition of approximately 6–9%, these values exhibit a moderate increase with increasing sample concentration. The strongest inhibition was observed at the lowest dilution level (DF 2.14), at approximately 25%. Nevertheless, these values remain below the ranges that are classified as toxicologically critical (inhibition > 50%).

3.2. Hospital Discharges

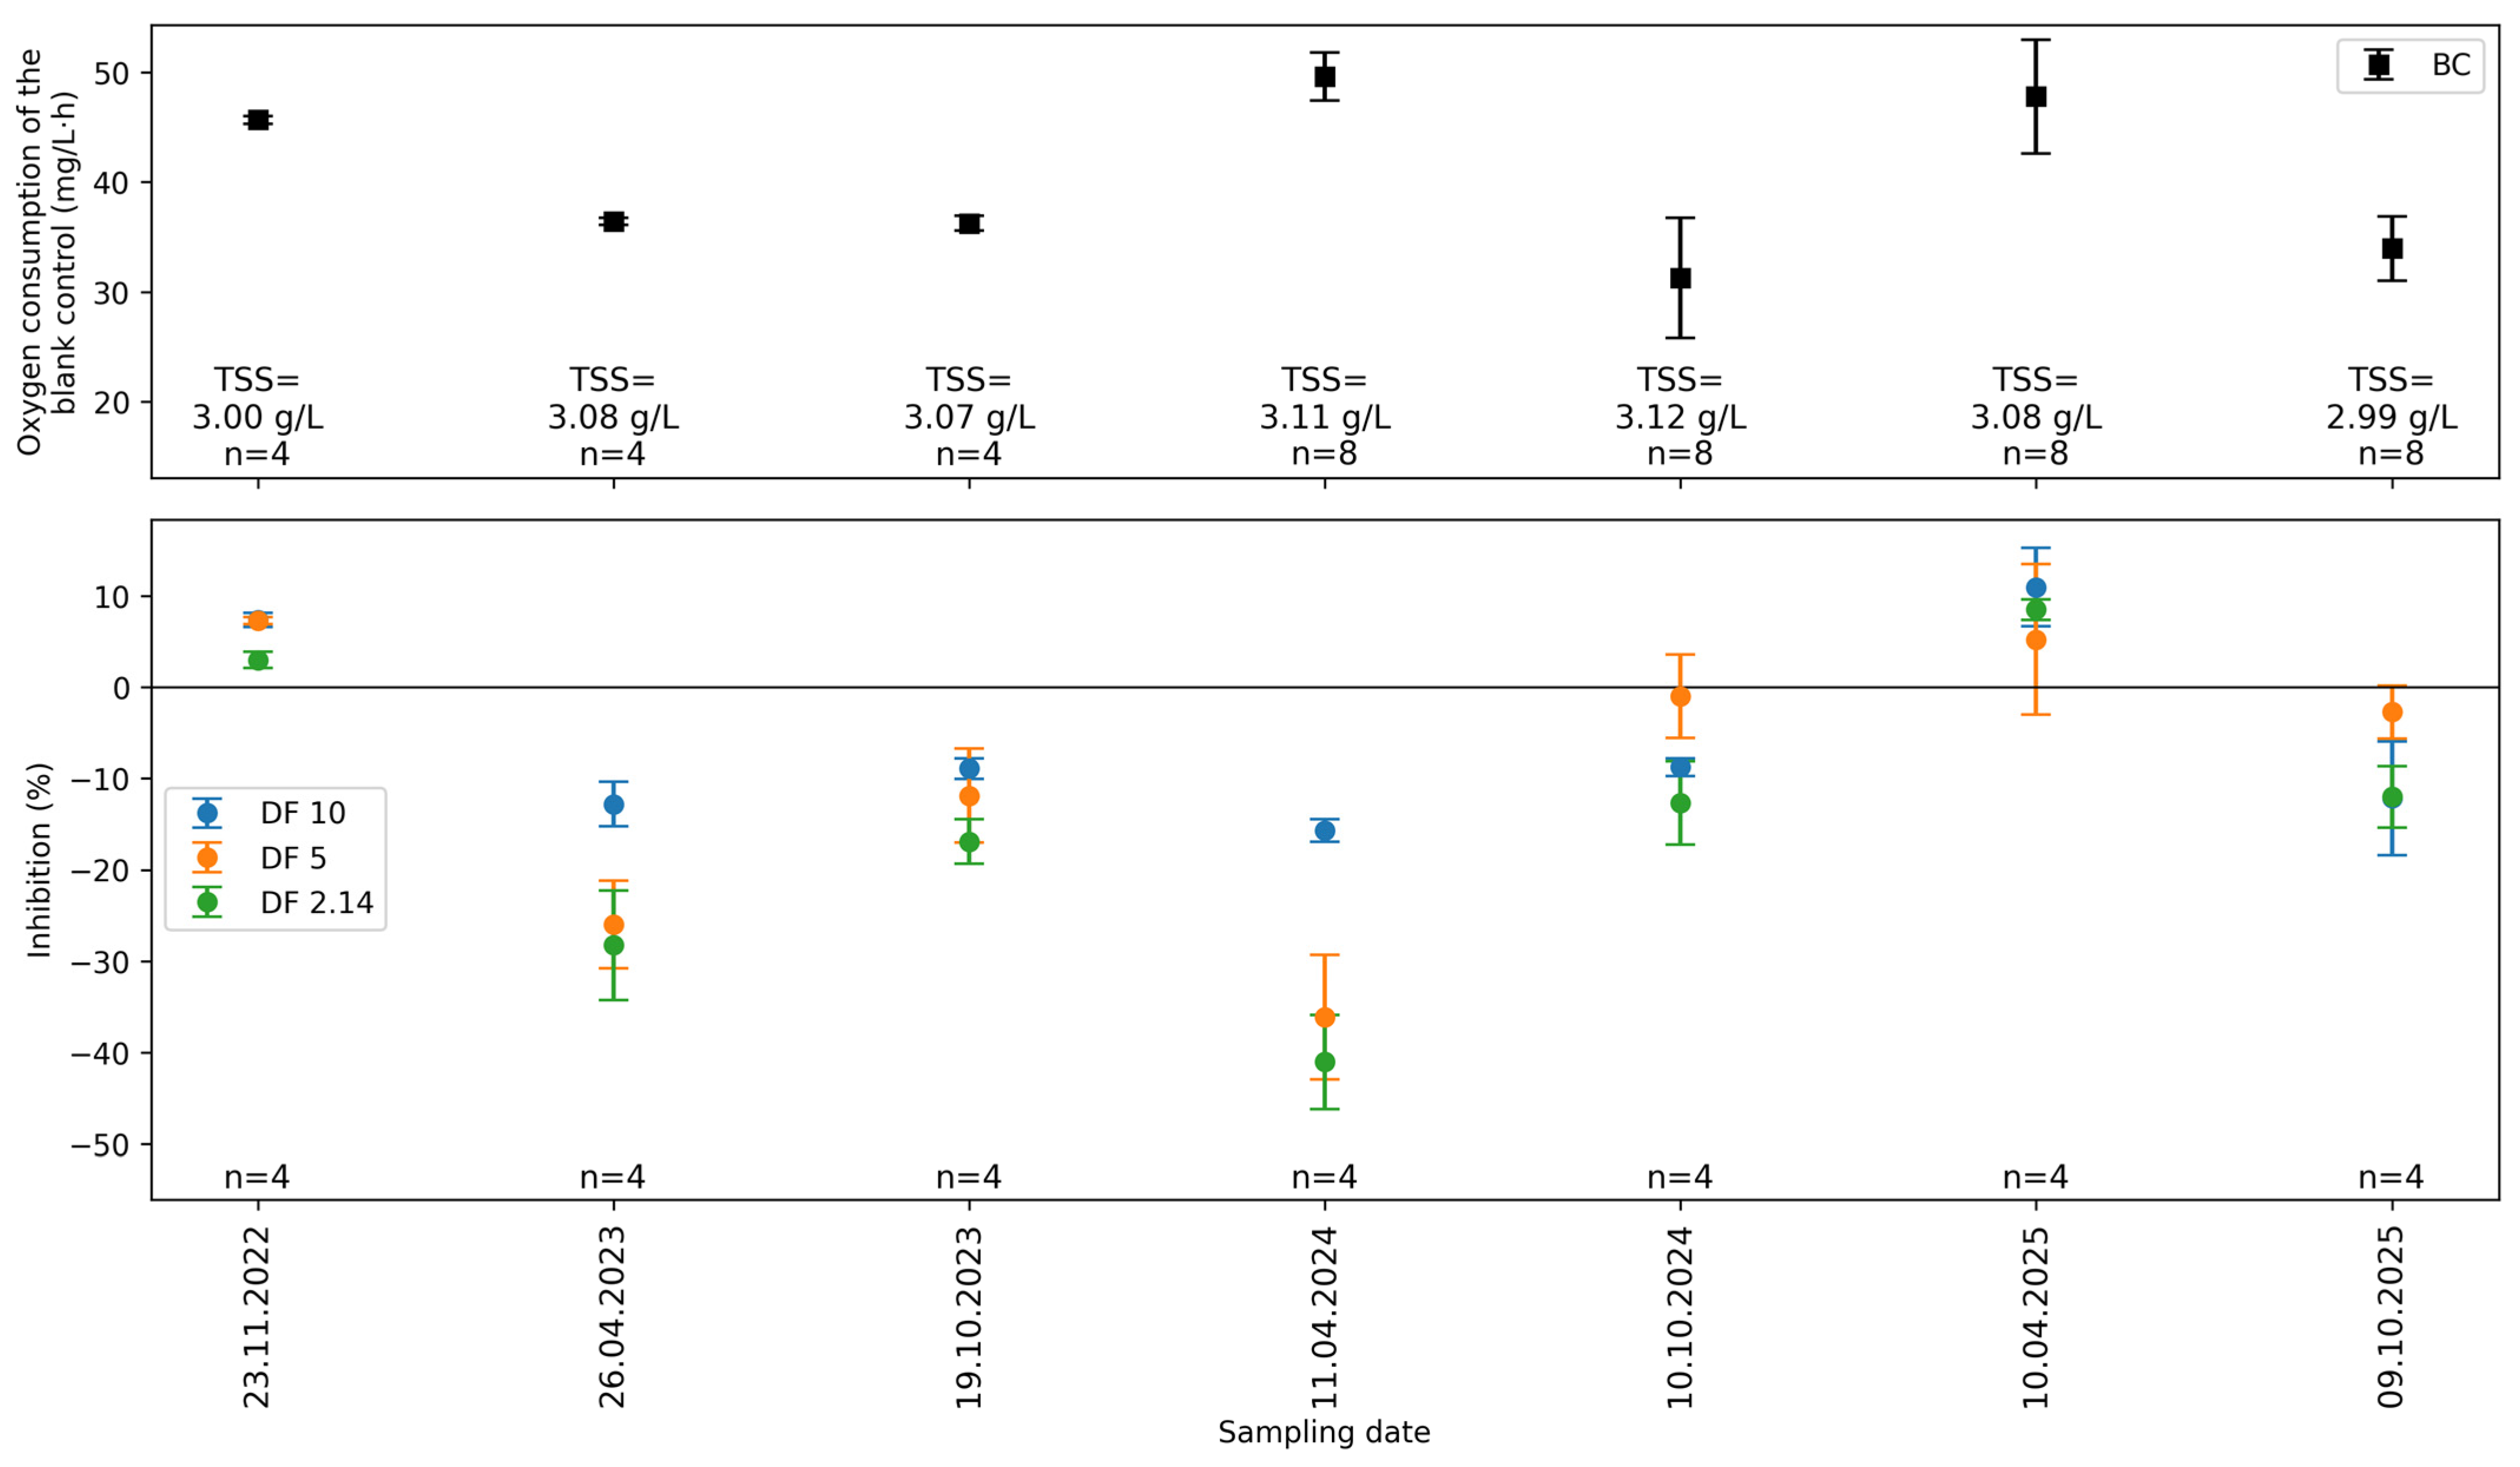
Toxicity tests were carried out at various discharge points from a hospital into the public sewer system. At location 7, wastewater from the dental department is pretreated using an amalgam separator before discharge into the public sewer system. At all other investigated discharge points, the wastewater is released without any pretreatment. The results for these samples from locations 1–7 are presented in Figure 5, Figure 6, Figure 7, Figure 8, Figure 9 and Figure 10. Figure 5 represents the results for location 1; exact values can be seen in Table A7 in the Appendix A.
The results show that the samples predominantly exhibited stimulatory, with minor inhibitory effects observed at some dilution levels. The most negative inhibition values occur particularly at higher concentrations (e.g., DF 2.14) and the most marked negative inhibition values were observed in April 2024 (up to −41%) and April 2023 (up to −28%). Such values are characteristic of samples that contain substrates that are readily utilized by microorganisms. The few positive inhibition values (DF 10 in November 2022 and April 2025) are in the low single-digit range (max. around 11%). The findings show that the oxygen consumption levels in the wastewater sample preparations were higher than those observed in the blank control preparations. Therefore, the samples under investigation induced a stimulatory effect on microbial activity.
The standard wastewater parameters (COD, BOD5, total nitrogen, and total phosphorus; see Table A15 in the Appendix A) are consistent with the biological findings. These results indicate sufficient nutrient availability and the presence of readily biodegradable organic matter. This is in agreement with the stimulatory effect of microbial activity observed in the inhibition tests.
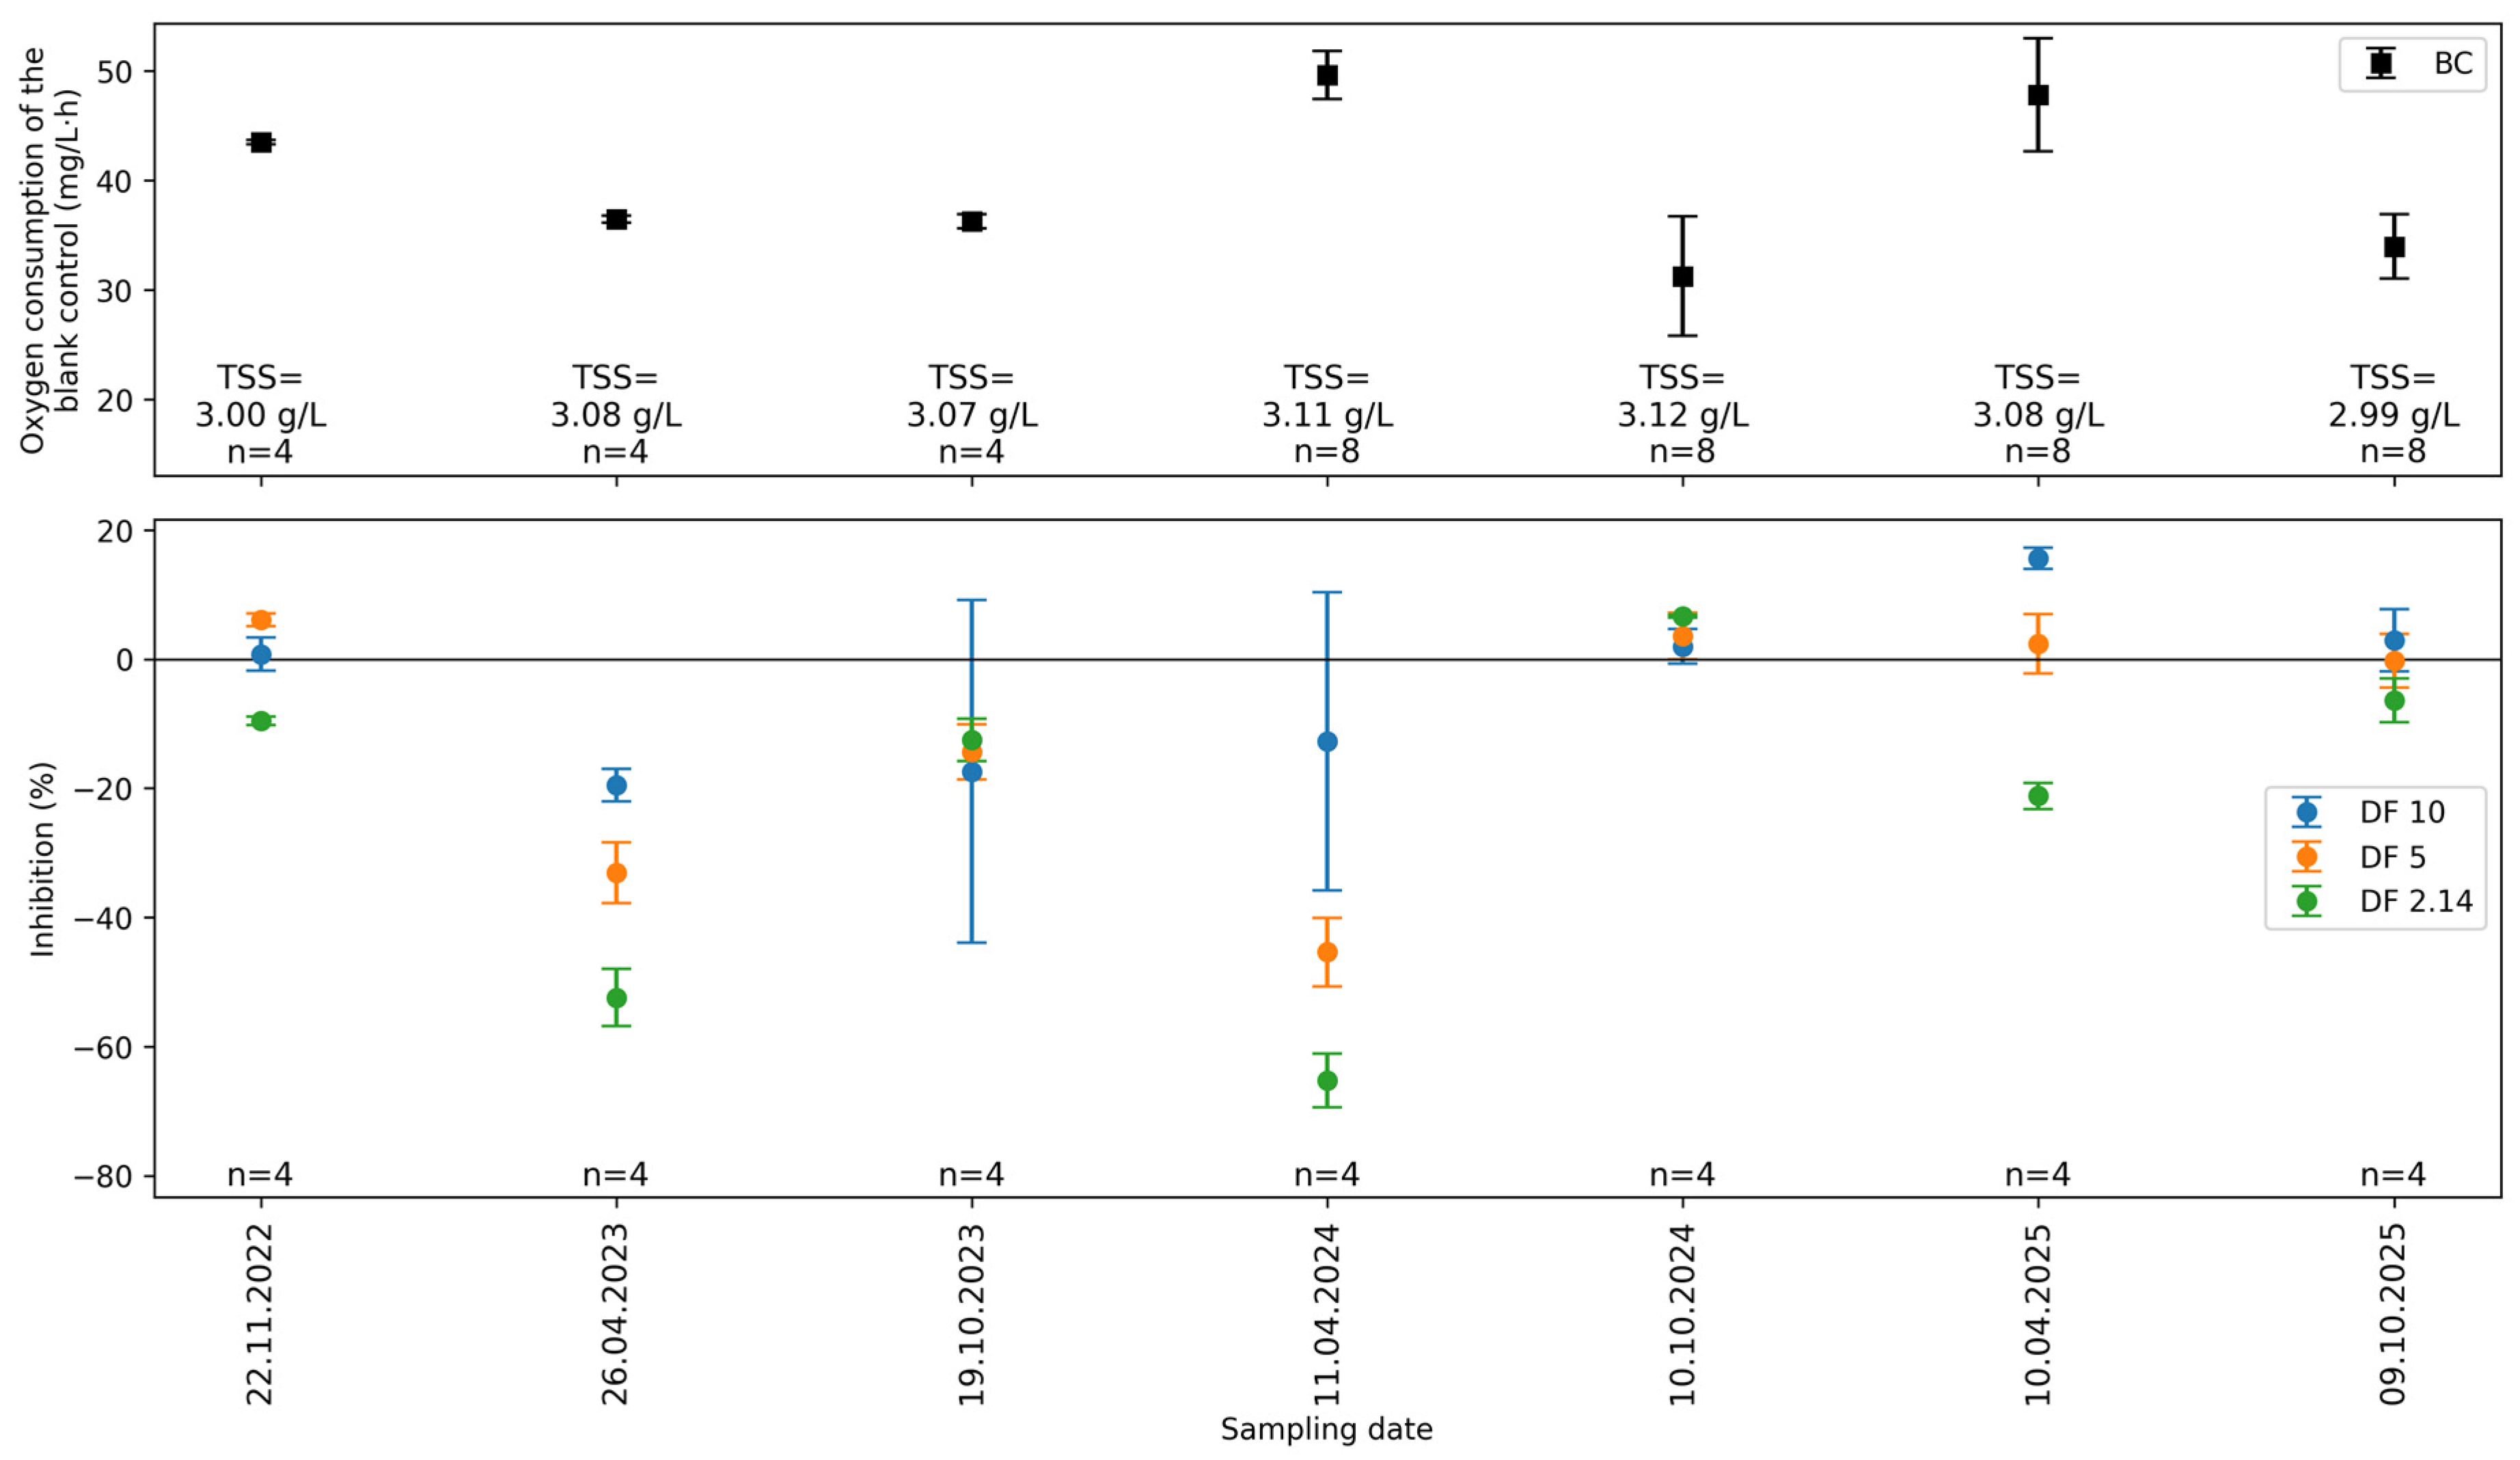
Figure 6 and Table A8 in the Appendix A show the results of analysis of the seven investigated discharge samples from location 2 over a period of three years.
The inhibition values at dilution stages DF 10, DF 5 and DF 2.14 across all measurement times demonstrate that the majority of the values are negative, indicating that the wastewater samples have mostly a stimulatory effect on the oxygen consumption of the used activated sludge. As was evidenced in preceding studies, the most apparent negative inhibition values occur at higher sample concentrations. This phenomenon is particularly evident in April 2023 (−52.46%) and April 2024 (−65.27%). The limited number of positive inhibition values are recorded in October 2024 (up to 6.64%) and April 2025 (up to 15.62%), which shows only an inhibitory effect.
Figure 6. Results (oxygen consumption and inhibition) of the samples from a hospital at discharge location 2. Sampling dates are given in the format day.month.year. (BC: Blind control, TSS: Total Suspended Solid, and DF: Dilution factor).
Water 18 01162 g006
As before, the corresponding standard wastewater parameters (Table A15) confirm the biological findings, suggesting that there is an adequate supply of nutrients and that there is an abundance of organic matter that can easily be broken down. This is consistent with the stimulatory effect of microbial activity observed in the inhibition tests.
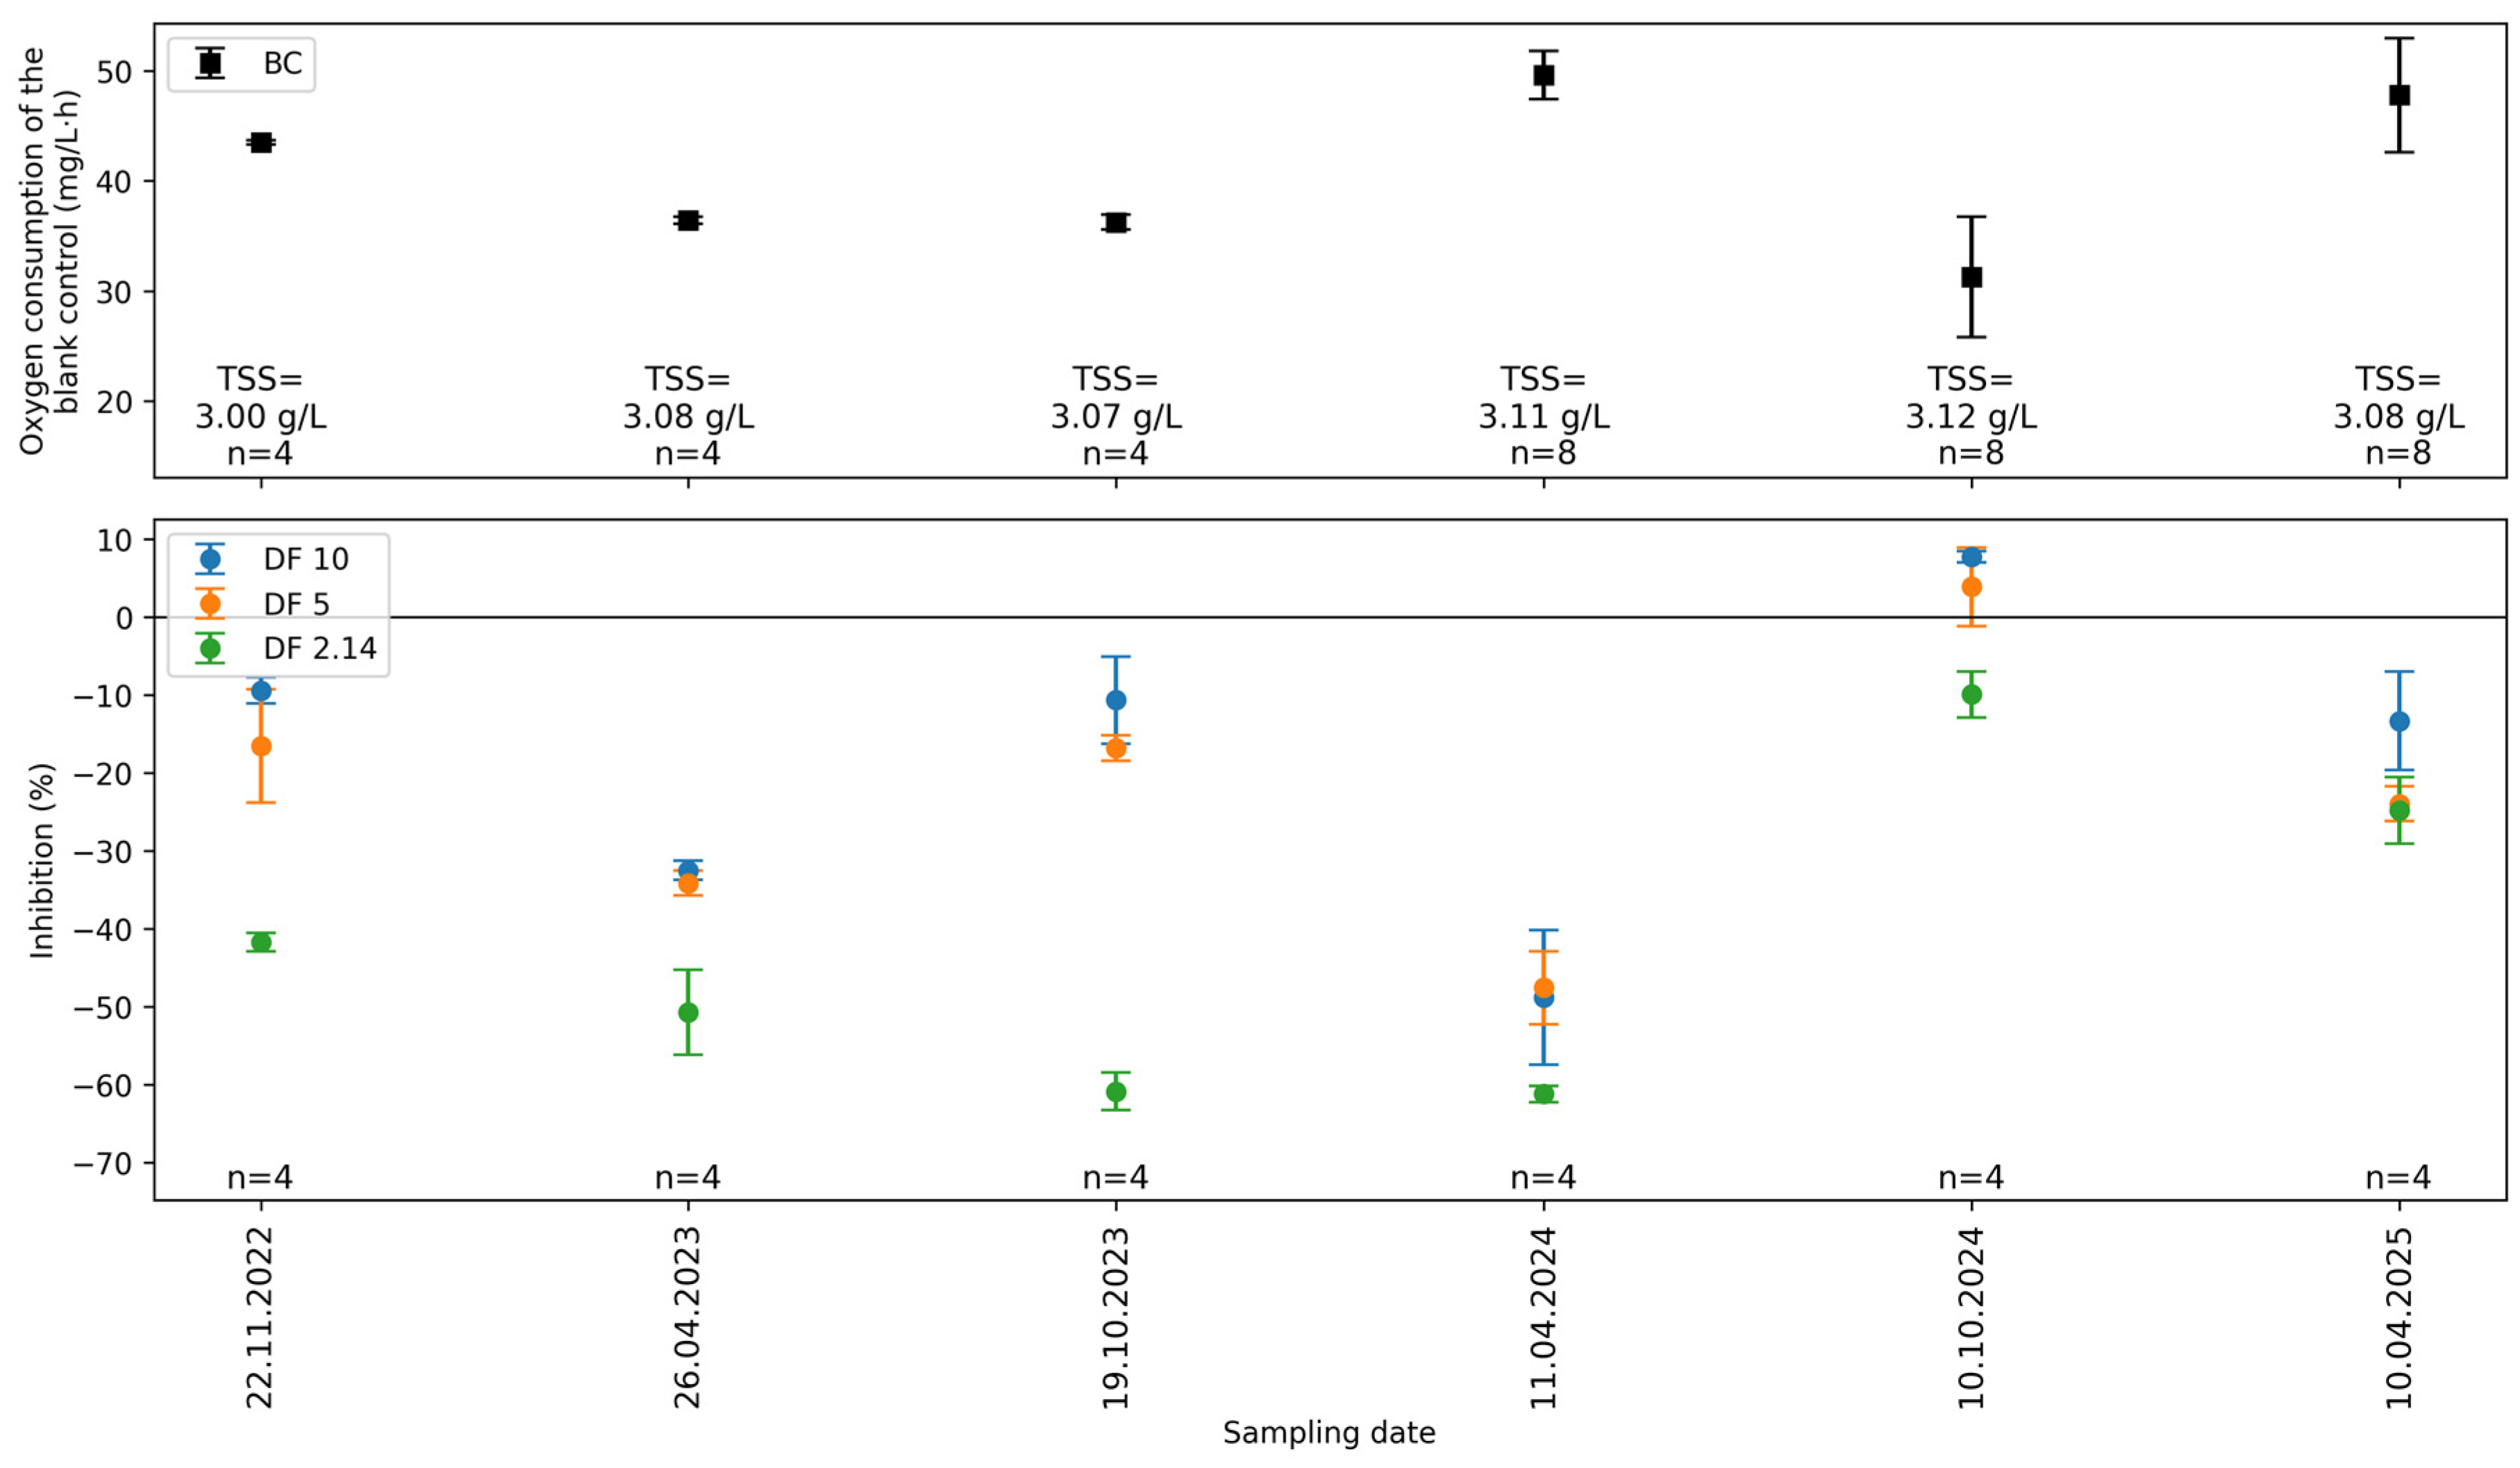
The inhibition values of the six investigated samples from location 3 over a period of three years (Figure 7 and Table A9) show that the samples predominantly exhibited stimulatory effects, with minor inhibitory effects.
Figure 7. Results (oxygen consumption and inhibition) of the samples from a hospital at discharge location 3. Sampling dates are given in the format day.month.year. (BC: Blind control, TSS: Total Suspended Solid, and DF: Dilution factor).
Water 18 01162 g007
As was the case with the preceding data, particularly strong negative inhibition was observed at the highest concentration. In April 2023 (−50.75%), October 2023 (−60.9%) and April 2024 (−61.24%), the samples exhibited distinct stimulatory effects of microbial activity. The inhibition values of DF 2.14 are also strongly negative in the other years (up to −41.75%), which underlines the consistency of this observation.
The corresponding standard wastewater parameters (Table A15) also align with the biological results at this location, indicating adequate nutrient availability and the presence of readily biodegradable organic matter.
As with the preceding tables, the inhibition values at location 4 (Figure 8 and Table A10) indicate predominantly low-to-negative inhibition at all dilution levels.
Figure 8. Results (oxygen consumption and inhibition) of the samples from a hospital at discharge location 4. Sampling dates are given in the format day.month.year. (BC: Blind control, TSS: Total Suspended Solid, and DF: Dilution factor).
Water 18 01162 g008
The most significant negative inhibition occurs in April 2023 (up to approximately −28%), while at other points in time, there are predominantly slight deviations in the range of around −10% to +10%.
For this site, the wastewater parameters, see Table A15, also indicate a readily biodegradable organic load, as reflected in the inhibition values.
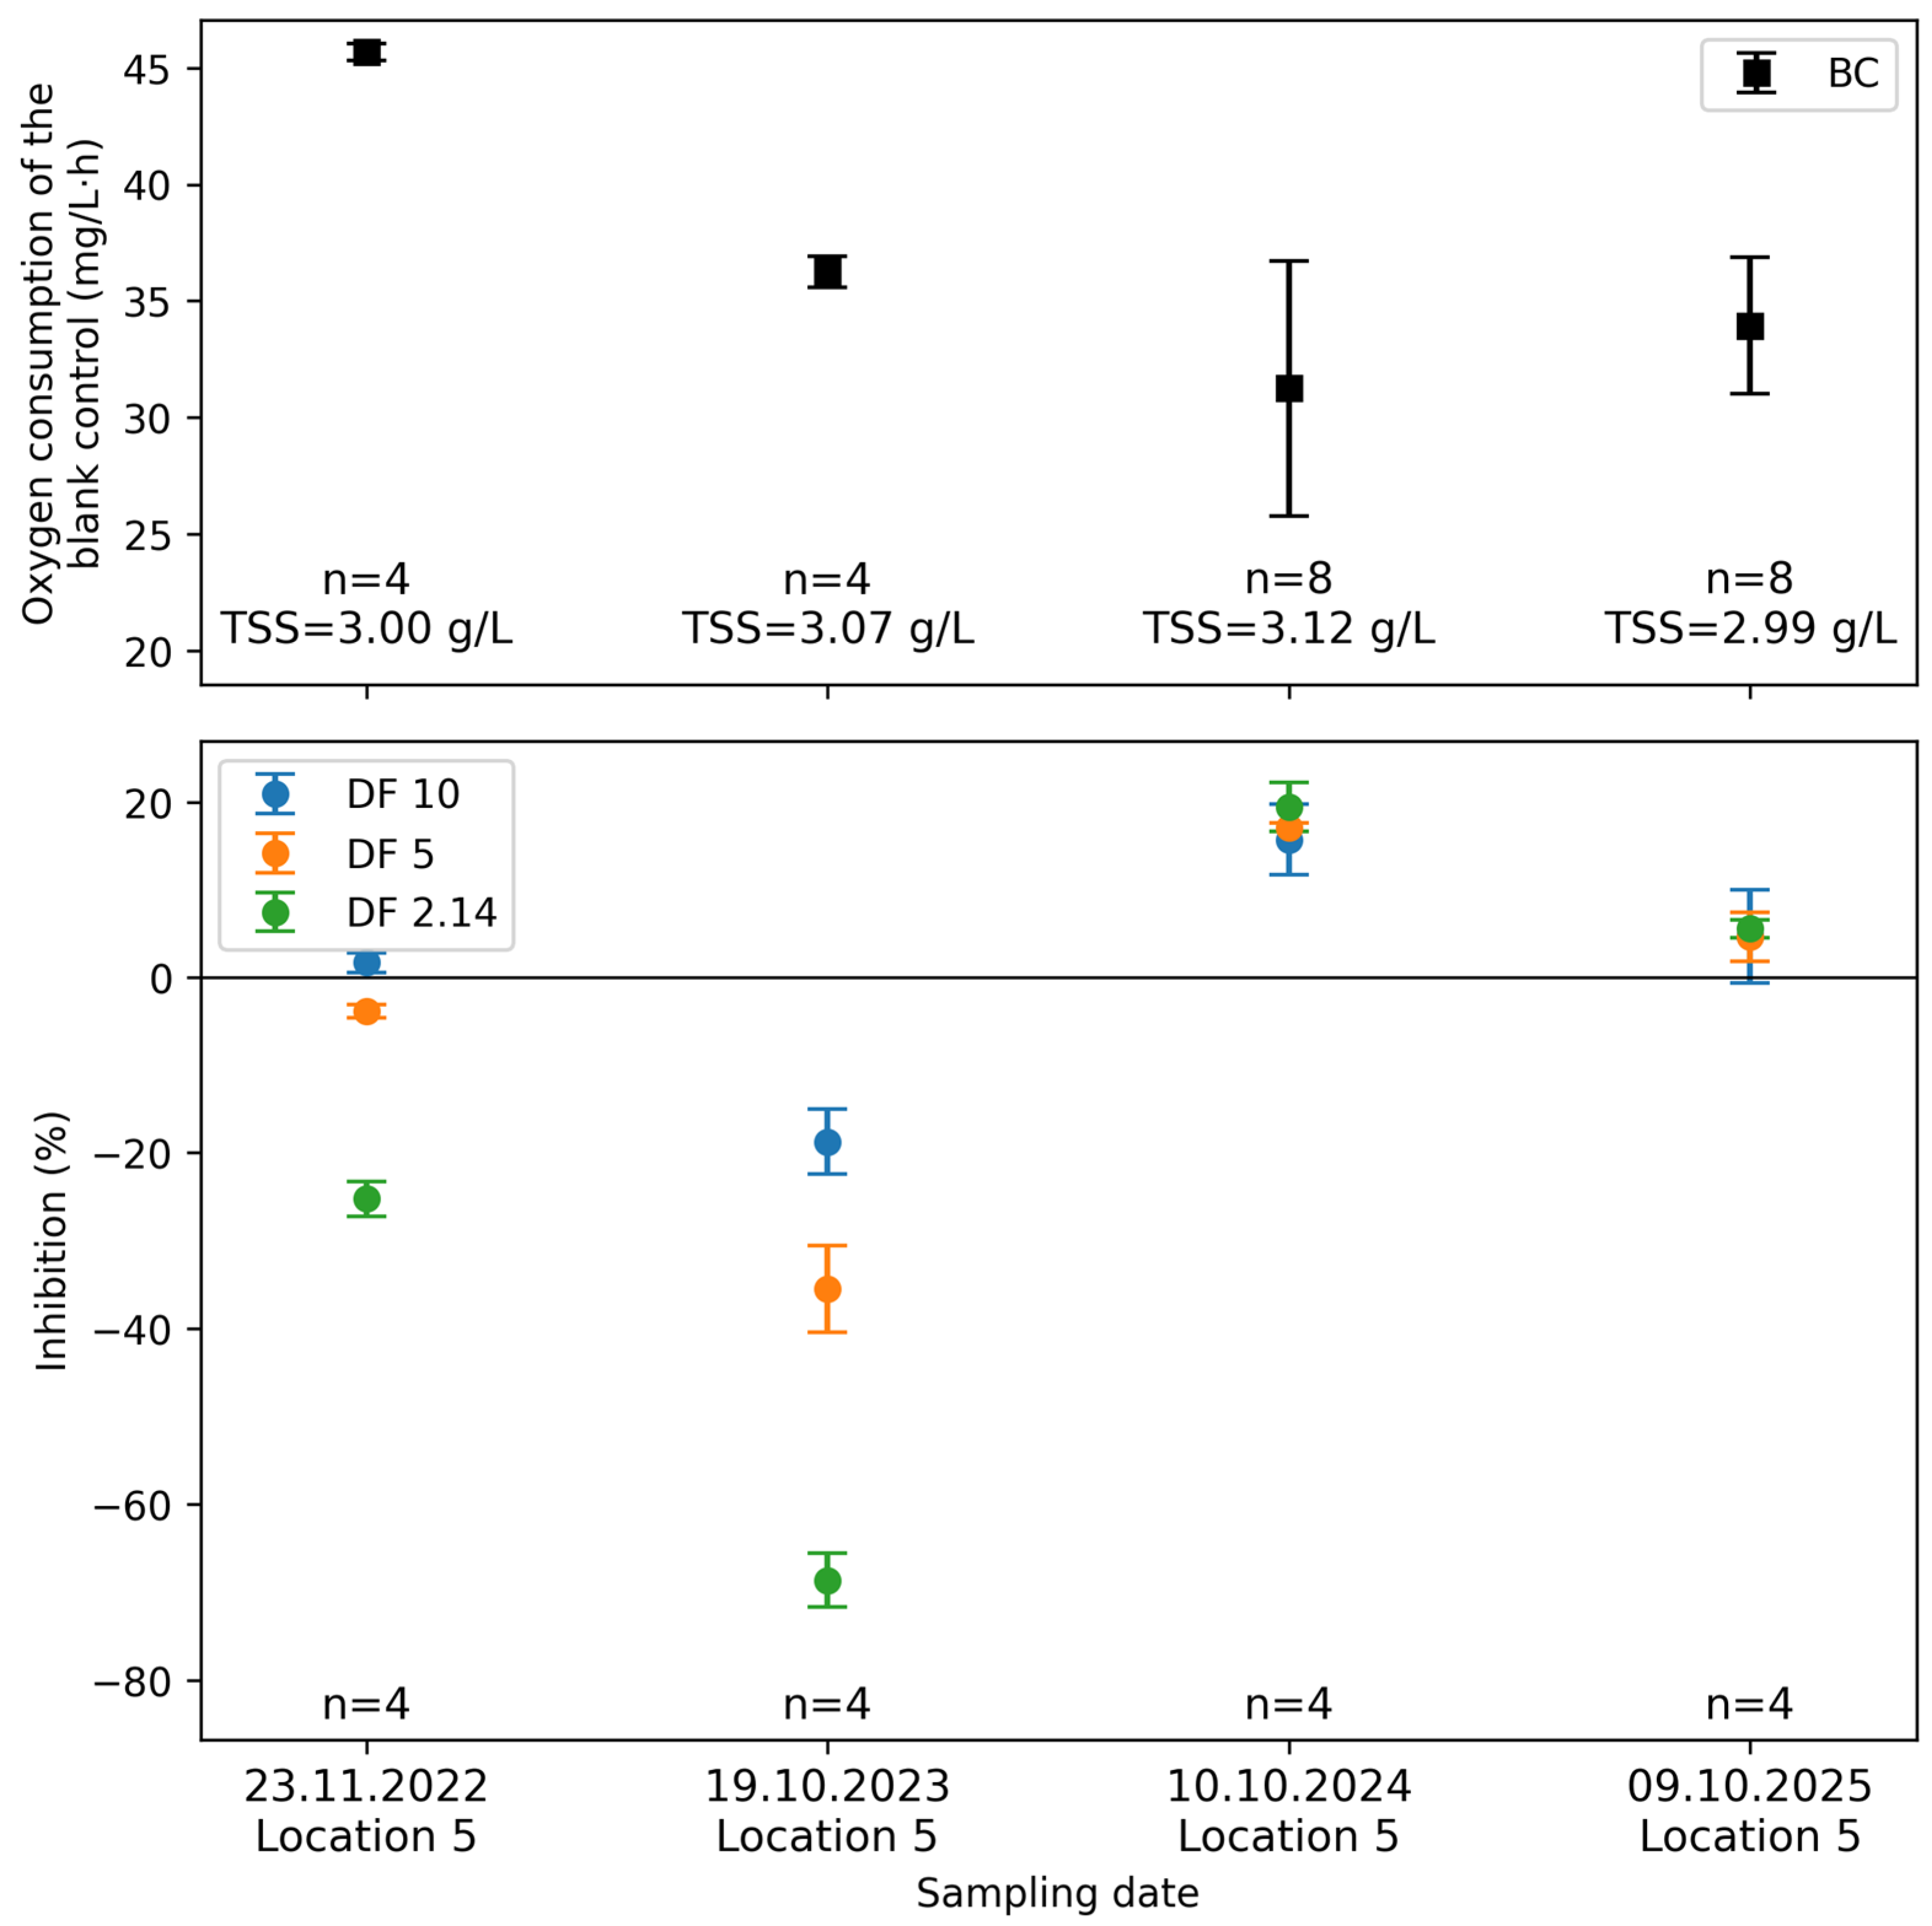
The results (Figure 9 and Table A11) obtained from location 5 demonstrate the same pattern previously observed in the preceding tables.
Figure 9. Results (oxygen consumption and inhibition) of the samples from a hospital at discharge location 5. Sampling dates are given in the format day.month.year. (BC: Blind control, TSS: Total Suspended Solid, and DF: Dilution factor).
Water 18 01162 g009
The inhibition values are predominantly negative, especially in higher-concentration samples. The most negative values are observed in October 2023, with a recorded decrease of up to −68.63%. In comparison, in October 2024, all dilution levels showed an inhibitory effect (15–19%). The measurements from 2025 exhibited a minimal inhibitory effect (4–6%). It is important to note that, from October 2024, only qualified random samples were taken, rather than volume-proportional 24 h composite samples. Consequently, the composition of the samples may exhibit greater variability, which may account for the observed variations in the inhibition values.
At this location, there are considerable fluctuations in the organic load of the wastewater parameters (Table A15), with the 24 h composite samples from 2022 and 2023 containing a high proportion of readily biodegradable material. In contrast, the grab samples from 2024 and 2025 were significantly more diluted. These differences are reflected in the inhibition results, which show a strong stimulatory effect of microbial activity at higher organic loads, and a low inhibitory effect in the grab samples.
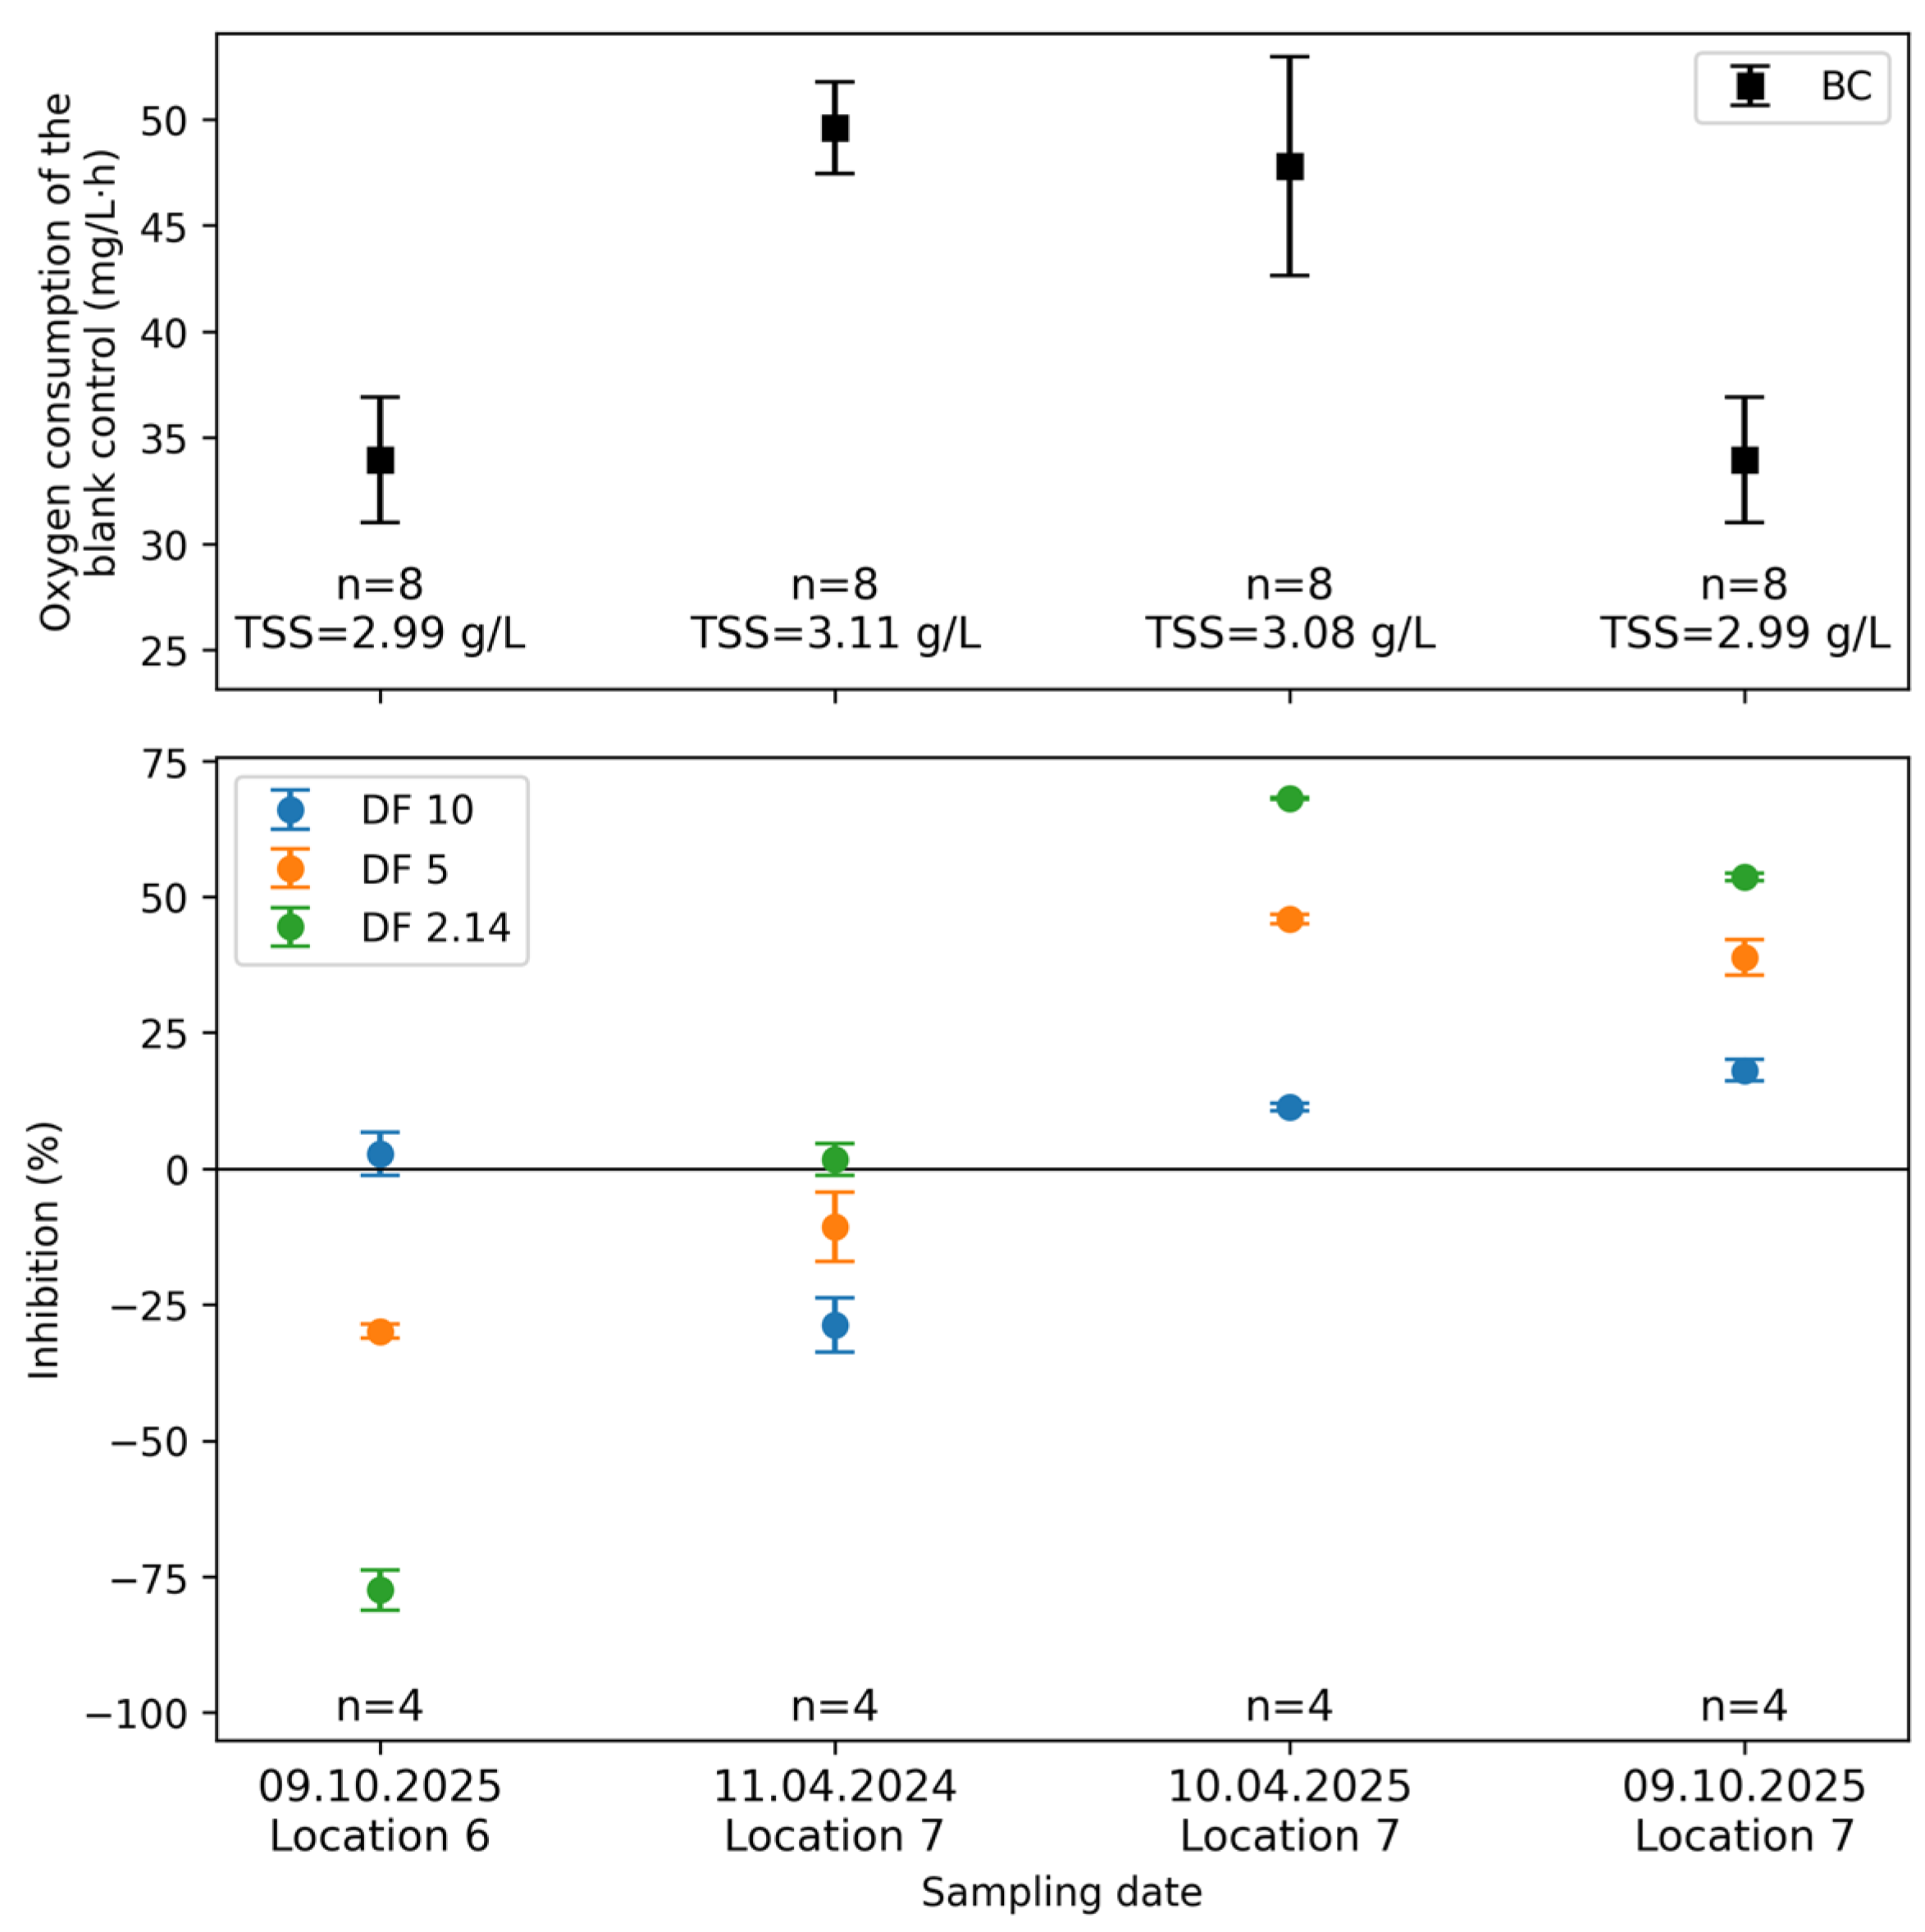
Figure 10 and Table A12 show the results of the measurements at two additional locations, locations 6 and 7.
Figure 10. Results (oxygen consumption and inhibition) of the samples from a hospital at discharge location 6 and 7. Sampling dates are given in the format day.month.year. (BC: Blind control, TSS: Total Suspended Solid, and DF: Dilution factor).
Water 18 01162 g010
The inhibition values from location 6 indicate a marked negative inhibition, particularly at a high concentration (−77.50%). At location 7, the inhibition values exhibit a divergent profile. Two of the three samples examined demonstrate toxic inhibition values at elevated concentrations and thus in a highly diluted state (68.04% and 53.67%). This indicates that the wastewater samples themselves possess toxic properties. This can be explained by the fact that the relatively small amount of wastewater (daily volumes amount to less than 3 m3/d) from this location comes from the dental department of the hospital. This is why this wastewater must also be regularly tested for certain heavy metals. However, despite the observed toxicity in the individual samples, these effects are not considered relevant to the overall WWTP performance, as the actual wastewater stream undergoes substantial dilution within the sewer system and the treatment plant. This is also why discharges from location 7 generally do not need to be tested for toxicity. It should also be noted that only three qualified random samples were analyzed, instead of 24 h composite samples. Consequently, the results reflect snapshot conditions rather than fully integrated discharge characteristics.
The discharge of location 6 shows a highly biodegradable organic load (Table A15), which corresponds to a strong stimulatory effect of microbial activity. At location 7, the relationship between the corresponding heavy metal concentrations and biological effects is not linear. While the sample from April 2024 exhibited comparatively higher heavy metal levels without causing inhibition, the 2025 samples contained much lower concentrations of heavy metals yet still exhibited clear toxic effects (see also Table A15). This suggests that other factors must have influenced microbial activity, in addition to the measured metals.

3.3. WWTP

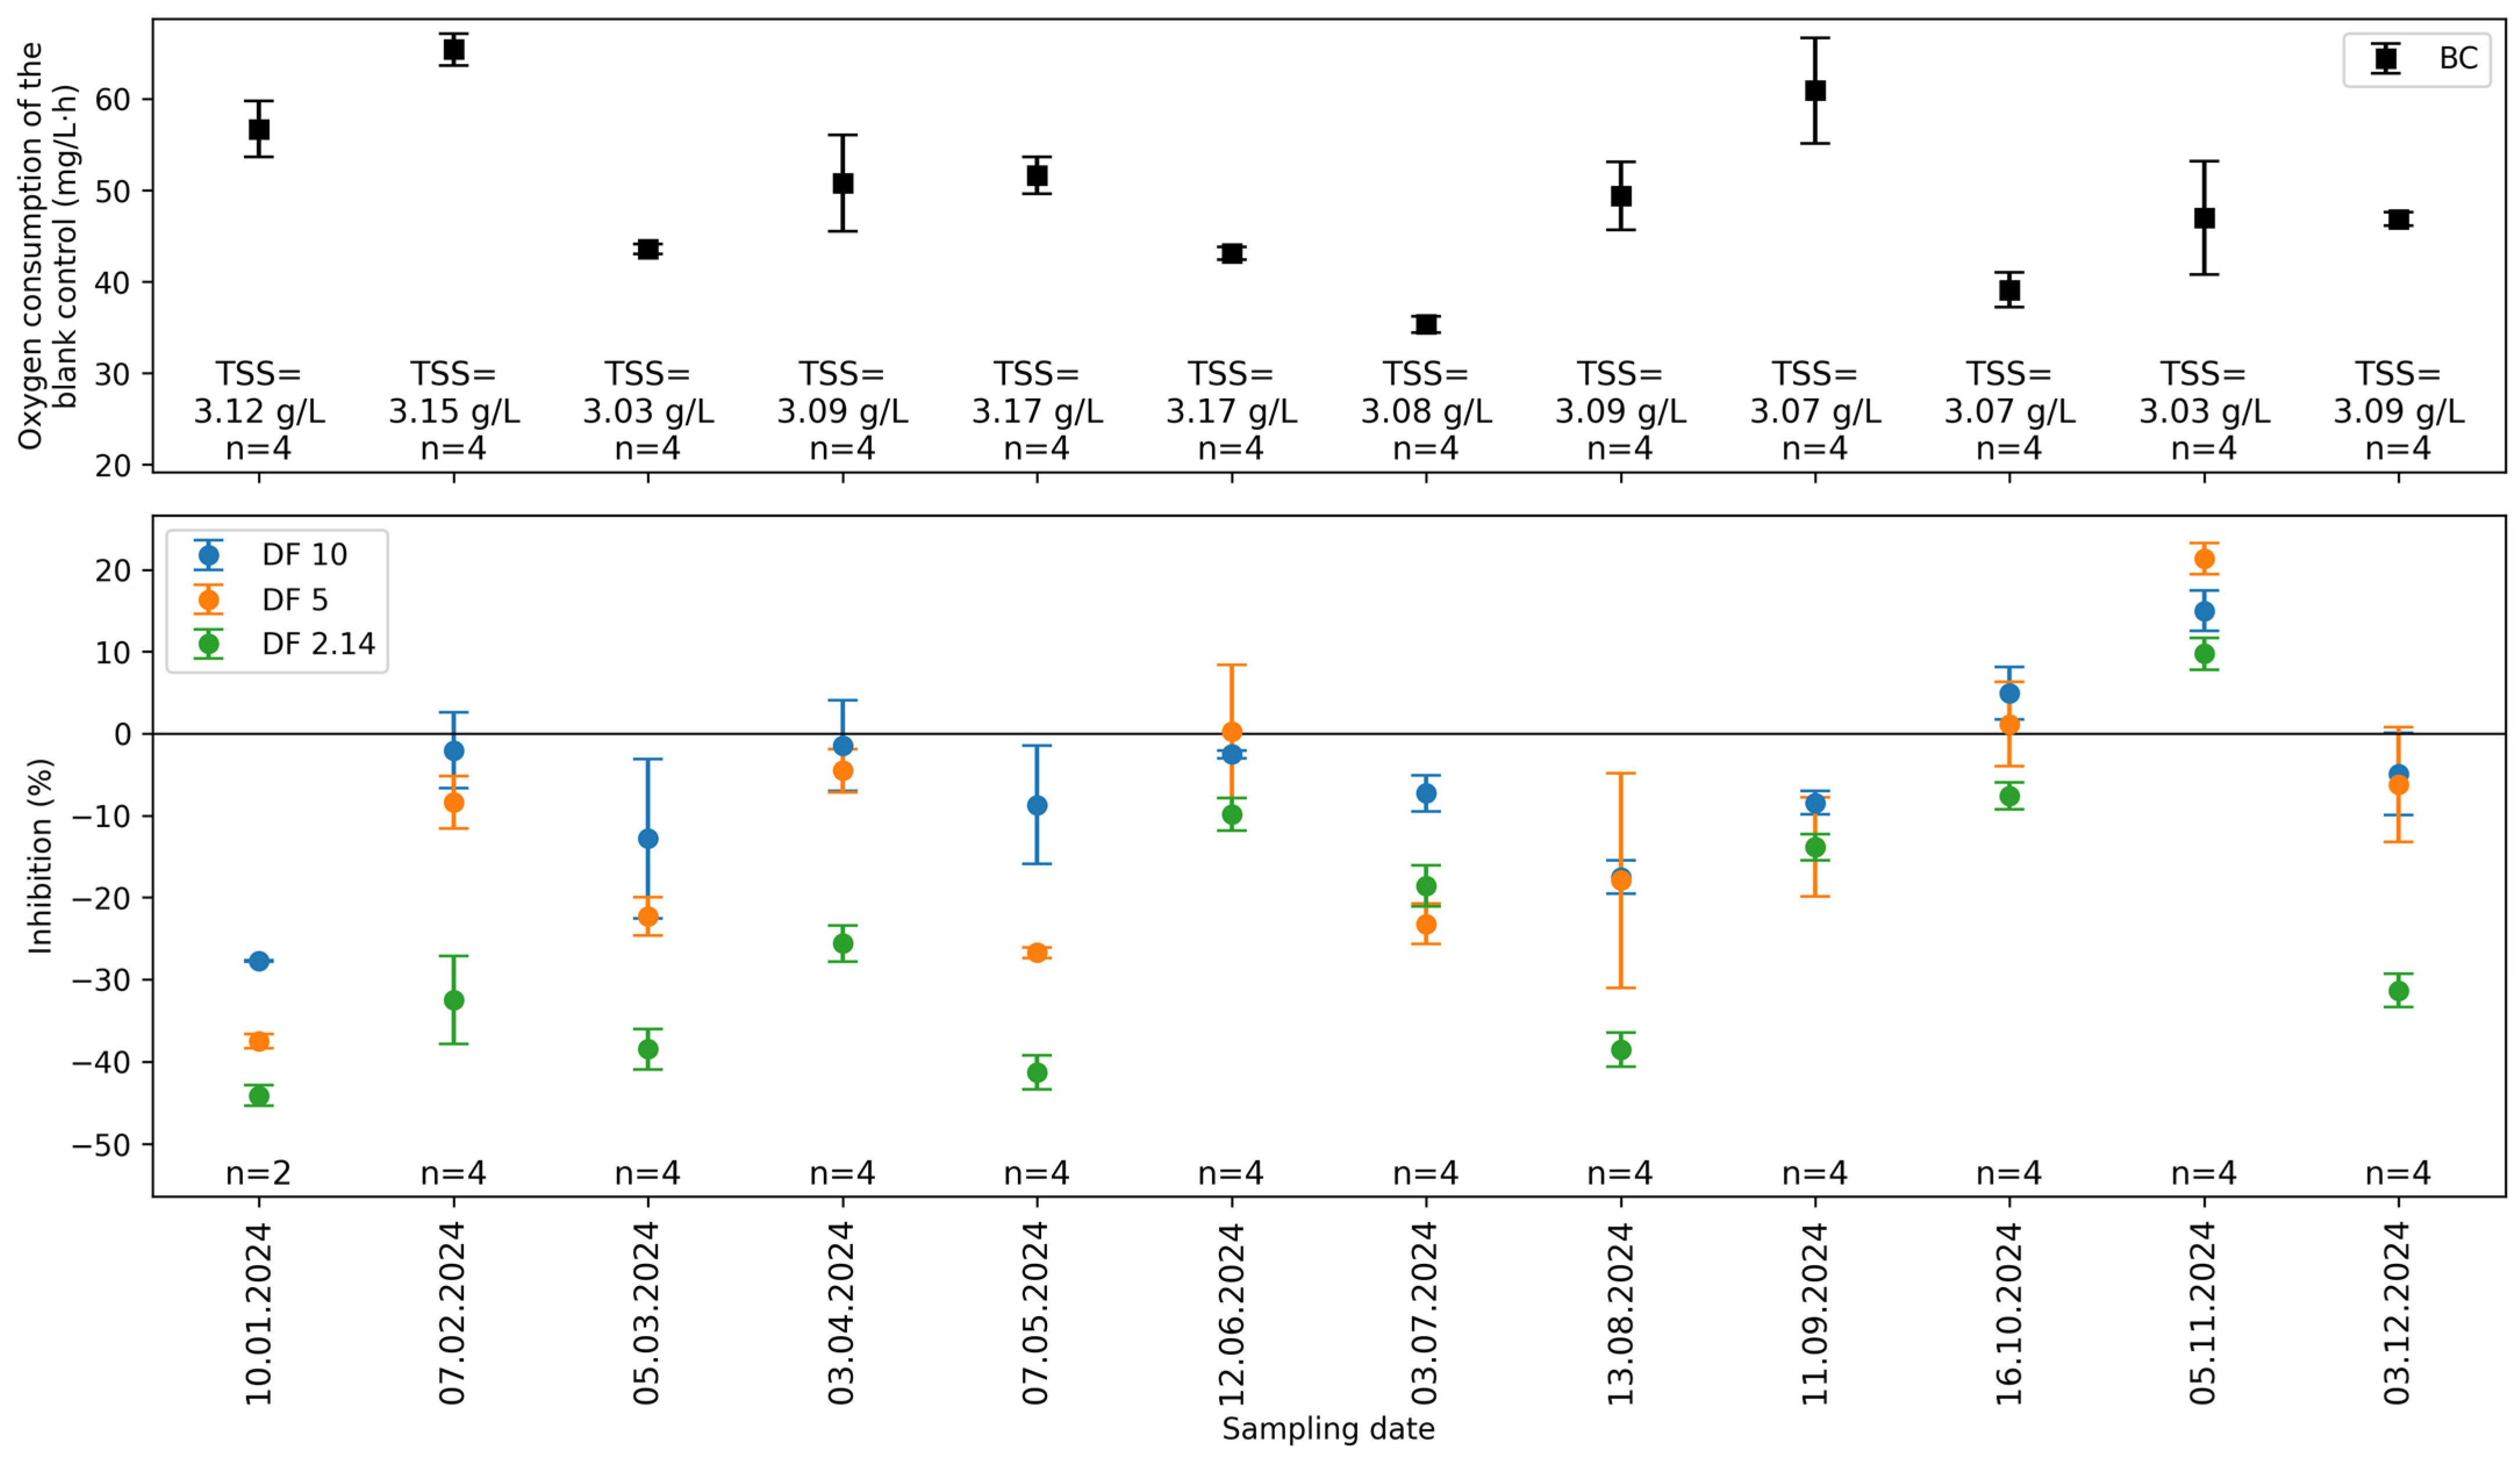
Toxicity tests were carried out on 12 volume-proportional 24 h composite samples flowing into the WWTP over a period of one year. The results for these daily influent samples are presented in Figure 11 and Table A13 and Table A14.
Across the entire sampling period, which encompassed all months from January to December 2024, the influent wastewater samples from the treatment plant exhibited consistently stable oxygen consumption rates and no indications of toxic effects. The inhibition values across all dilution stages remained predominantly negative or close to zero (with the exception of November). Even the sample from November show moderate positive inhibition values of up to 21.3% for DF 5. Slight positive inhibition is also shown at other dilution levels. No operational or chemical cause could be identified for the elevated inhibition observed in November, since all parameters routinely monitored at the wastewater treatment plant were within the normal operating ranges at the time of sampling. The data demonstrate that the WWTP influent had consistently no toxic effects to the activated sludge, and that the biological system remained fully capable of degrading the incoming organic load under all tested conditions.
As in the previous cases, the corresponding relevant chemical parameters were also analyzed for the associated samples and are shown in Table A16. Throughout the sampling year, conventional wastewater exhibited fluctuating, predominantly biodegradable organic loads. This is reflected in the inhibition values across the different sampling periods.
In summary, a toxic effect of the tested wastewater on the activated sludge from the examined WWTP was observed at the two samples from the dental department in a hospital, where it is known that toxic heavy metals can enter wastewater. Furthermore, it was observed that elevated sample concentrations in wastewater from individual industrial companies could result in a modest reduction in biological activity, indicating the potential presence of problematic compounds that only exhibit an inhibitory effect at higher concentrations. Conversely, numerous samples exhibited a stimulatory effect, as evidenced by the negative inhibition values, suggesting an augmentation in microbial oxygen consumption due to the presence of readily degradable organic substances. This finding indicates that the investigated wastewater discharges do not invariably exert a detrimental effect on the microbiology of the WWTP; indeed, they can also exert a beneficial influence.

3.4. Applicability of ISO 8192:2007 for Wastewater Monitoring

The employed measurement method has been shown to have potential as a valuable tool for companies and WWTPs operators. Although many of the samples examined did not exhibit or only exibited little inhibitory effects, the highly inhibitory effects observed for samples from industrial company No. 3 and the toxic effects at location 7 at the hospital demonstrate that the method is suitable for detecting toxicological changes in wastewater discharged by industrial companies. These findings highlight the potential of the method as a preventive monitoring tool. Overall, the results obtained emphasize the importance of systematic ecotoxicological monitoring for wastewater treatment plant operators to ensure effective biological treatment against potentially toxic discharges from critical wastewater generation areas.
This tool may provide a means of assessing the impact of wastewater on the biological treatment performance of a WWTP for companies regardless of whether they are direct or indirect dischargers. Moreover, regularly carrying out such toxicity tests may facilitate the early detection of changes in operating procedures, and may thereby support compliance with limit values and the long-term operational safety of WWTPs. For authorities and legal representatives, the procedure may provide a robust foundation for the continuous assessment of wastewater quality from various dischargers. Additionally, it may facilitate the identification of potential polluters in the event of malfunctions or peak loads in the WWTPs. The results suggest that the ISO 8192:2007 method could potentially form the basis of a practical toxicity monitoring strategy at wastewater treatment plants, provided it is applied regularly.
Due to its time-consuming nature, and since it requires activated sludge from the relevant treatment plant in order to produce meaningful and representative results, this monitoring method is primarily intended for WWTPs operators and direct dischargers. While in principle the method can also be applied by indirect dischargers, it requires access to activated sludge from the receiving WWTPs, which may increase organizational effort. As an alternative, indirect dischargers could commission external laboratories with access to appropriate sludge to conduct testing on their behalf.
A forward-looking monitoring approach may include regular testing of influent samples, as well as targeted testing of wastewater streams from critical dischargers. Based on the findings reported in the literature for comparable measurement approaches that similarly rely on respiratory inhibition tests, a monitoring frequency of two measurements per week is recommended to detect relevant changes [53]. However, this recommendation only applies to the wastewater treatment plant under investigation and its current operational conditions; application of this approach in other plants with different boundary conditions is limited. Establishing site-specific baseline oxygen consumption and inhibition ranges may enable operators to distinguish between normal operational variability and unusual deviations. Sudden increases in inhibition values or atypical changes in oxygen uptake could then act as an early warning signal, prompting further investigation before there are any adverse effects on the performance of the biological treatment. In this context, determining measurement uncertainty is essential for defining a site-specific validity range for the applied test method. Only by quantifying this measurement uncertainty can operators reliably assess whether observed changes in oxygen consumption or inhibition values exceed the expected variability. This knowledge is crucial in order to avoid misinterpreting normal measurement variations as critical process disturbances and to ensure that any identified deviations genuinely reflect changes in wastewater composition or biological activity, rather than being due to methodological uncertainty.


4. Limitations and Outlook

The results of the one-year influent sampling of the WWTP demonstrate that there is a significant fluctuation in the oxygen consumption of the blank control investigated throughout the year, with values ranging between 43.57 and 51.64 mg/L·h during the spring, 35.34 mg/L·h and 49.39 mg/L·h during the summer, 39.13 and 60.92 mg/L·h in the autumn, and 46.87 and 65.42 mg/L·h in the winter. However, no distinct seasonal pattern could be identified, since comparable ranges and overlaps were observed throughout all periods. The observed variability indicates that the microbial activity of the activated sludge is more influenced by classical wastewater parameters or operating conditions than it is by season. Fluctuations in oxygen consumption can be attributed to various factors, including temperature variations or alterations in the composition of the wastewater. However, the observed differences in the oxygen consumption of the blank controls are methodologically relevant because the rate of oxygen consumption is used directly in the inhibition calculation. Consequently, variation in the process has a significant impact on the resulting inhibition values. It can be deduced that an increase in oxygen consumption of the blank control results in higher inhibition values.
This finding suggests a potential correlation between the oxygen consumption of the blank control and specific wastewater or operational parameters. In particular, a dependency on the incoming oxygen-demanding pollution loads (expressed as BOD5 and COD loads (in kg·d−1)), sludge retention time, and the activated sludge temperature on the day preceding sludge sampling appears plausible. It is therefore recommended that further scientific investigations be conducted in order to specifically analyze which factors influence oxygen consumption in the absence of test material, and how these factors relate to the typical wastewater parameters of the sewage treatment plant. Should there be established correlations between oxygen consumption and specific wastewater parameters or operational parameters, conclusions can be drawn about the oxygen consumption and ultimately inhibition based on routinely examined wastewater parameters. This would provide wastewater treatment plant operators with an additional control option.

5. Conclusions

With the exception of two samples originating from the dental department, none of the investigated wastewater samples exhibited toxic effects on the activated sludge. In contrast, numerous samples exhibited stimulatory effects, suggesting that wastewater discharges do not necessarily impair WWTPs microbiology and may enhance microbial activity in some cases.
Reference tests with 3,5-dichlorophenol confirmed the validity of the method, with all EC50 values (8.72–24.36 mg/L) falling within the normative reference range. Inhibition values at 10 and 20 mg/L were consistent with the variability reported by Neunteufel et al. [47], and the blank control consistently met the normative activity criterion, exhibiting specific oxygen uptake rates above 20 mg/g suspended solids per hour, while mean oxygen consumption rates remained within the associated measurement uncertainty. The observed variability in wastewater samples was appropriately characterized using the standard deviation, which supports a reliable interpretation under practical conditions.
The results confirm that the ISO 8192:2007 [45] method, including the modification by Neunteufel et al. [47], can be reliably applied to complex wastewater matrices under practical conditions.
For improved robustness, measurements should be conducted within a single day to minimize alterations in sludge activity.
The increased inhibitory effects observed for samples from industrial company No. 3 and hospital location 7 emphasize the importance of systematic ecotoxicological monitoring for WWTPs operators, helping them to safeguard biological treatment processes against critical discharges. These findings underline the potential of the method as a preventive monitoring tool enabling early detection of toxicological changes.
Furthermore, analysis of the blank control revealed considerable variability in oxygen consumption, ranging from 35 to 65 mg/L·h over the course of a year. This fluctuation occurred independently of seasonal influences or recorded day classes and therefore cannot currently be linked to specific operational conditions. As the blank value is an essential parameter in the inhibition calculation, variability in this value directly impacts the result. Further research is required to assess potential correlations with wastewater and operational parameters, which could provide operators with an additional process control option.

Author Contributions

Conceptualization, B.N., G.G. and D.M.; methodology, B.N. and G.G.; validation, B.N.; formal analysis, B.N.; investigation, B.N.; resources, G.G.; data curation, B.N.; writing—original draft preparation, B.N.; writing—review and editing, B.N., G.G. and D.M.; visualization, B.N.; supervision, G.G. and D.M.; funding acquisition, D.M. All authors have read and agreed to the published version of the manuscript.

Funding

This research was supported by TU Graz Open Access Publishing Fund.

Data Availability Statement

The data presented in this study are available on request from the corresponding author.

Acknowledgments

We would like to thank the industrial companies, the hospital and the WWTP operator for providing us with their wastewater samples, activated sludge and results for publication. We would also like to thank the laboratory department of the Institute of Urban Water Management and Landscape Water Engineering, Graz University of Technology, for their work from sampling to analysis, in particular Harald Gerhold. Open Access Funding by the Graz University of Technology.

Conflicts of Interest

The authors declare no conflicts of interest.

Appendix A

Table A1. Results (oxygen consumption and inhibition) of the effluent sample (24 June 2025) from industrial company No. 1.
EffluentTSS of Used Activated Sludge (g/L)DatenOxygen Consumption Rate (mg/L·h)Inhibition (%)
BC3.0224 June 2025841.74 ± 1.0-
DF 103.0224 June 2025440.88 ± 1.512.07 ± 3.59
DF 7.53.0224 June 2025440.43 ± 0.453.14 ± 1.08
DF 53.0224 June 2025438.16 ± 0.338.59 ± 0.87
DF 3.53.0224 June 2025439.60 ± 0.515.14 ± 1.03
DF 2.143.0224 June 2025439.16 ± 0.616.19 ± 1.49
Table A2. Results (oxygen consumption and inhibition) of the effluent sample (25 June 2025) from industrial company No. 1.
EffluentTSS of Used Activated Sludge (g/L)DatenOxygen Consumption Rate (mg/L·h)Inhibition (%)
BC3.1625 June 2025432.69 ± 2.80-
DF 103.1625 June 2025429.10 ± 1.0610.97 ± 3.23
DF 7.53.1625 June 2025428.58 ± 0.6212.56 ± 1.91
DF 53.1625 June 2025428.42 ± 0.1213.06 ± 0.44
DF 3.53.1625 June 2025429.94 ± 0.528.41 ± 1.77
DF 2.143.1625 June 2025430.71 ± 0.306.05 ± 1.12
Table A3. Results (oxygen consumption and inhibition) of the influent samples from industrial company No. 2.
InfluentTSS of Used Activated Sludge (g/L)DatenOxygen Consumption Rate (mg/L·h)Inhibition (%)
BC3.0923 October 20251034.60 ± 0.89-
DF 253.0923 October 2025434.64 ± 2.25−0.10 ± 6.47
DF 153.0923 October 2025436.04 ± 1.72−4.15 ± 4.85
DF 103.0923 October 2025436.80 ± 2.47−6.35 ± 7.14
DF 7.53.0923 October 2025439.76 ± 2.13−14.89 ± 6.09
DF 53.0923 October 2025439.54 ± 1.44−14.25 ± 4.02
DF 3.53.0923 October 2025438.49 ± 1.01−11.23 ± 2.84
DF 2.143.0923 October 2025437.52 ± 2.77−8.44 ± 7.97
Table A4. Results (oxygen consumption and inhibition) of the effluent samples from industrial company No. 2.
EffluentTSS of Used Activated Sludge (g/L)DatenOxygen Consumption Rate (mg/L·h)Inhibition (%)
BC3.0923 October 20251034.60 ± 0.89-
DF 253.0923 October 2025433.62 ± 0.582.85 ± 1.14
DF 153.0923 October 2025434.21 ± 0.801.15 ± 2.43
DF 103.0923 October 2025434.79 ± 1.81−0.52 ± 5.09
DF 7.53.0923 October 2025434.80 ± 1.07−0.57 ± 3.06
DF 53.0923 October 2025434.72 ± 1.09−0.34 ± 3.19
DF 3.53.0923 October 2025436.38 ± 1.44−5.14 ± 4.18
DF 2.143.0923 October 2025435.75 ± 0.73−3.30 ± 1.89
Table A5. Results (oxygen consumption and inhibition) of the influent samples from industrial company No. 3.
InfluentTSS of Used Activated Sludge (g/L)DatenOxygen Consumption Rate (mg/L·h)Inhibition (%)
BC3.0519 November 2025832.02 ± 3.00-
DF 253.0519 November 2025439.92 ± 0.61−24.69 ± 1.93
DF 153.0519 November 2025432.13 ± 0.48−0.35 ± 1.46
DF 103.0519 November 2025427.07 ± 1.9815.45 ± 6.20
DF 7.53.0519 November 2025423.83 ± 1.8825.58 ± 5.87
DF 53.0519 November 2025420.62 ± 1.4135.60 ± 4.39
DF 3.53.0519 November 2025419.85 ± 1.3238.00 ± 4.13
DF 2.143.0519 November 2025417.80 ± 0.1744.42 ± 0.52
Table A6. Results (oxygen consumption and inhibition) of the effluent samples from industrial company No. 3.
EffluentTSS of Used Activated Sludge (g/L)DatenOxygen Consumption Rate (mg/L·h)Inhibition (%)
BC3.0519 November 2025832.02 ± 3.00-
DF 253.0519 November 2025430.00 ± 0.176.31 ± 0.55
DF 153.0519 November 2025429.87 ± 1.456.72 ± 4.53
DF 103.0519 November 2025429.00 ± 1.429.43 ± 4.42
DF 7.53.0519 November 2025429.44 ± 1.868.06 ± 5.82
DF 53.0519 November 2025428.70 ± 1.2010.37 ± 3.76
DF 3.53.0519 November 2025427.86 ± 0.8312.99 ± 2.58
DF 2.143.0519 November 2025424.08 ± 1.2124.81 ± 3.79
Table A7. Results (oxygen consumption and inhibition) of the samples from the hospital at discharge location 1.
Location 1
Date23 November 202226 April 202319 October 202311 April 202410 October 202410 April 20259 October 2025
Oxygen consumption rate (mg/L·h)
TSS of used activated sludge (g/L)3.003.083.073.113.123.082.99
nBC/n4/44/44/48/48/48/48/4
BC45.67 ± 0.3536.45 ± 0.3236.26 ± 0.6649.60 ± 2.1731.26 ± 5.4747.78 ± 5.1633.95 ± 2.94
DF 1042.29 ± 0.3341.12 ± 1.0039.48 ± 0.5757.38 ± 1.1534.00 ± 0.3642.54 ± 2.0238.07 ± 2.11
DF 542.35 ± 0.4145.92 ± 1.8740.57 ± 1.8667.51 ± 3.5731.57 ± 1.4345.27 ± 3.9234.87 ± 0.98
DF 2.1444.30 ± 0.2946.75 ± 2.2242.38 ± 0.7369.91 ± 1.8335.21 ± 1.4343.72 ± 0.4738.03 ± 1.16
Inhibition (%)
DF 107.39 ± 0.77−12.81 ± 2.46−8.90 ± 1.11−15.71 ± 1.26−8.77 ± 0.9310.95 ± 4.30−12.15 ± 6.23
DF 57.28 ± 0.42−25.98 ± 4.81−11.90 ± 5.15−36.13 ± 6.78−1.01 ± 4.555.23 ± 8.25−2.72 ± 2.90
DF 2.142.98 ± 0.91−28.27 ± 5.97−16.90 ± 2.47−41.03 ± 5.17−12.65 ± 4.578.50 ± 1.14−12.02 ± 3.40
Table A8. Results (oxygen consumption and inhibition) of the samples from the hospital at discharge location 2.
Location 2
Date22 November 202226 April 202319 October 202311 April 202410 October 202410 April 20259 October 2025
Oxygen consumption rate (mg/L·h)
TSS of used activated sludge (g/L)3.003.083.073.113.123.082.99
nBC/n4/44/44/48/48/48/48/4
BC43.49 ± 0.2136.45 ± 0.3236.26 ± 0.6649.60 ± 2.1731.26 ± 5.4747.78 ± 5.1633.95 ± 2.94
DF 1043.17 ± 1.1043.57 ± 1.0242.58 ± 9.6455.91 ± 11.4730.64 ± 0.8440.31 ± 0.5632.97 ± 1.64
DF 540.84 ± 0.4448.50 ± 1.7841.47 ± 1.5572.07 ± 1.8330.14 ± 1.1246.65 ± 2.3534.04 ± 1.42
DF 2.1447.63 ± 0.3155.56 ± 1.5540.79 ± 0.9781.96 ± 2.4829.18 ± 0.1357.90 ± 0.5436.13 ± 1.15
Inhibition (%)
DF 100.74 ± 2.57−19.53 ± 2.52−17.43 ± 26.53−12.77 ± 23.101.96 ± 2.7115.62 ± 1.642.88 ± 4.83
DF 56.10 ± 0.96−33.06 ± 4.71−14.39 ±4.3−45.40 ± 5.283.58 ± 3.612.38 ± 4.58−0.28 ± 4.17
DF 2.14−9.53 ± 0.66−52.46 ± 4.43−12.51 ± 3.29−65.27 ± 4.216.64 ± 0.25−21.20 ± 2.04−6.43 ± 3.39
Table A9. Results (oxygen consumption and inhibition) of the samples from the hospital at discharge location 3.
Location 3
Date22 November 202226 April 202319 October 202311 April 202410 October 202410 April 2025
Oxygen consumption rate (mg/L·h)
TSS of used activated sludge (g/L)3.003.083.073.113.123.08
nBC/n4/44/44/48/48/48/4
BC43.49 ± 0.2136.45 ± 0.3236.26 ± 0.6649.60 ± 2.1731.26 ± 5.4747.78 ± 5.16
DF 1047.60 ± 0.7248.30 ± 0.3540.12 ± 2.0673.79 ± 4.2528.83 ± 0.0954.15 ± 3.05
DF 550.70 ± 3.1548.89 ± 0.4742.36 ± 0.6873.16 ± 1.5430.04 ± 1.5759.24 ± 1.26
DF 2.1461.65 ± 0.4654.94 ± 1.9858.34 ± 0.8479.97 ± 1.9534.36 ± 0.9059.63 ± 1.87
Inhibition (%)
DF 10−9.44 ± 1.69−32.52 ± 1.21−10.66 ± 5.62−48.83 ± 8.627.76 ± 0.74−13.34 ± 6.31
DF 5−16.58 ± 7.28−34.15 ± 1.58−16.84 ± 1.65−47.59 ± 4.683.88 ± 5.04−23.99 ± 2.23
DF 2.14−41.75 ± 1.20−50.75 ± 5.49−60.9 ± 2.42−61.24 ± 1.05−9.94 ± 2.95−24.83 ± 4.25
Table A10. Results (oxygen consumption and inhibition) of the samples from the hospital at discharge location 4.
Location 4
Date23 November 202226 April 202319 October 202311 April 202410 October 202410 April 20259 October 2025
Oxygen consumption rate (mg/L·h)
TSS of used activated sludge (g/L)3.003.083.073.113.123.082.99
nBC/n4/44/44/48/48/48/48/4
BC45.67 ± 0.3536.45 ± 0.3236.26 ± 0.6649.60 ± 2.1731.26 ± 5.4747.78 ± 5.1633.95 ± 2.94
DF 1045.60 ± 0.2445.11 ± 1.2438.66 ± 0.7047.56 ± 1.1832.85 ± 1.0241.07 ± 0.9433.06 ± 0.90
DF 547.79 ± 0.4746.74 ± 1.0338.20 ± 0.1749.42 ± 1.0932.45 ± 0.7743.08 ± 2.5832.51 ± 0.65
DF 2.1446.70 ± 0.9444.76 ± 1.3840.20 ± 1.3851.88 ± 2.1430.83 ± 0.2942.46 ± 0.7934.06 ± 0.65
Inhibition (%)
DF 100.14 ± 0.84−23.76 ± 3.16−6.62 ± 1.294.07 ± 2.87−5.10 ± 3.2914.04 ± 1.872.62 ± 2.66
DF 5−4.66 ± 1.78−28.24 ± 2.51−5.37 ± 0.510.30 ± 3.11−3.83 ± 2.529.85 ± 5.214.22 ± 1.94
DF 2.14−2.26 ± 2.10−22.80 ± 3.59−10.88 ± 3.60−4.61 ± 3.561.83 ± 0.4011.14 ± 1.33−0.33 ± 1.84
Table A11. Results (oxygen consumption and inhibition) of the samples from the hospital at discharge location 5.
Location 5
Date23 November 202219 October 202310 October 20249 October 2025
Oxygen consumption rate (mg/L·h)
TSS of used activated sludge (g/L)3.003.073.122.99
nBC/n4/44/48/48/4
BC45.67 ± 0.3536.26 ± 0.6631.26 ± 5.4733.95 ± 2.94
DF 1044.89 ± 0.6243.04 ± 1.3526.35 ± 1.2632.36 ± 1.79
DF 547.42 ± 0.5649.13 ± 1.8325.90 ± 0.2732.38 ± 0.95
DF 2.1457.20 ± 0.9861.14 ± 1.525.18 ± 0.9032.06 ± 0.30
Inhibition (%)
DF 101.70 ± 1.12−18.72 ± 3.7515.71 ± 4.044.69 ± 5.29
DF 5−3.84 ± 0.72−35.52 ± 4.9317.13 ± 0.514.63 ± 2.77
DF 2.14−25.24 ± 1.97−68.63 ± 3.0719.44 ± 2.835.57 ± 0.99
Table A12. Results (oxygen consumption and inhibition) of the samples from the hospital at discharge locations 6 and 7.
Location 6Location 7
Date9 October 202511 April 202410 April 20259 October 2025
Oxygen consumption rate (mg/L·h)
TSS of used activated sludge (g/L)2.993.113.082.99
nBC/n8/48/48/48/4
BC33.95 ± 2.9449.60 ± 2.1747.78 ± 5.1633.95 ± 2.94
DF 1033.03 ± 1.3763.82 ± 2.6142.37 ± 0.6027.81 ± 0.66
DF 544.10 ± 0.4354.88 ± 3.1625.84 ± 0.5020.76 ± 1.11
DF 2.1460.26 ± 1.2748.77 ± 1.5615.27 ± 0.0815.73 ± 0.23
Inhibition (%)
DF 102.72 ± 3.99−28.71 ± 4.9511.32 ± 0.7218.09 ± 1.92
DF 5−29.91 ± 1.32−10.67 ± 6.3645.93 ± 0.8738.84 ± 3.27
DF 2.14−77.50 ± 3.741.64 ± 2.9668.04 ± 0.1653.67 ± 0.69
Table A13. Results (oxygen consumption and inhibition) of the daily influent samples from a WWTP (samples from January–June 2024).
January–June
Date10 January 20247 February 20245 March 20243 April 20247 May 202412 June 2024
Oxygen consumption rate (mg/L·h)
TSS of used
activated sludge (g/L)
3.123.153.033.093.173.17
nBC/n4/24/44/44/44/44/4
BC56.72 ± 3.0365.42 ± 1.7443.57 ± 0.5350.78 ± 5.2651.64 ± 1.9943.12 ± 0.73
DF 1072.48 ± 0.0166.71 ± 1.8749.16 ± 4.2251.53 ± 2.956.16 ± 4.3044.22 ± 0.28
DF 578.02 ± 0.4670.89 ± 1.9453.28 ± 0.9853.10 ± 1.6965.45 ± 0.8843.01 ± 3.46
DF 2.1481.77 ± 0.6786.61 ± 2.0860.33 ± 0.6963.81 ± 1.6672.99 ± 2.3247.37 ± 0.73
Inhibition (%)
DF 10−27.78 ± 0.08−2.06 ± 4.63−12.84 ± 9.73−1.47 ± 5.54−8.70 ± 7.25−2.54 ± 0.47
DF 5−37.55 ± 0.88−8.41 ± 3.21−22.31 ± 2.32−4.54 ± 2.62−26.76 ± 0.670.26 ± 8.10
DF 2.14−44.16 ± 1.26−32.51 ± 5.39−38.49 ± 2.47−25.64 ± 2.17−41.32 ± 2.05−9.85 ± 1.97
Table A14. Results (oxygen consumption and inhibition) of the daily influent samples from a WWTP (samples from July–December 2024).
July–December
Date3 July 202413 August 202411 September 202416 October 20245 November 20243 December 2024
Oxygen consumption rate (mg/L·h)
TSS of used
activated sludge (g/L)
3.083.093.073.073.033.09
nBC/n4/44/44/44/44/44/4
BC35.34 ± 0.8749.39 ± 3.7360.92 ± 5.7939.13 ± 1.9147.00 ± 6.2046.87 ± 0.75
DF 1037.93 ± 0.7758.04 ± 0.3266.07 ± 1.3237.21 ± 1.2539.98 ± 1.3049.16 ± 2.35
DF 543.55 ± 0.8558.24 ± 6.4369.34 ± 3.7338.68 ± 2.0136.98 ± 0.8149.77 ± 3.30
DF 2.1441.90 ± 0.8968.42 ± 0.6969.37 ± 0.8242.12 ± 0.6742.42 ± 0.8861.57 ± 1.31
Inhibition (%)
DF 10−7.31 ± 2.21−17.54 ± 2.02−8.44 ± 1.44.91 ± 3.2214.96 ± 2.47−4.90 ± 5.01
DF 5−23.22 ± 2.43−17.94 ± 13.13−13.83 ± 6.041.16 ± 5.1421.32 ± 1.89−6.20 ± 7.01
DF 2.14−18.56 ± 2.51−38.54 ± 2.09−13.87 ± 1.57−7.63 ± 1.679.74 ± 1.96−31.36 ± 2.03
Table A15. Conventional wastewater samples from the hospital, discharge locations 1–7.
Location 1
Date23 November 202226 April 202319 October 202311 April 202410 October 202410 April 20259 October 2025
Settleable solids (mL/L)30903546324250
Total-N (mg/L)69.392.870.172.348.284.475.5
Total-P (mg/L)8.2510.47.117.529.244.279.63
COD (mg/L)565964755729718946725
BOD5 (mg/L)327377327383370487417
Location 2
Date22 November 202226 April 202319 October 202311 April 202410 October 202410 April 20259 October 2025
Settleable solids (mL/L)35703060355770
Total-N (mg/L)54.882.542.350.252.493.371.3
Total-P (mg/L)6.059.684.887.056.275.786.29
COD (mg/L)67812177205994947211211
BOD5 (mg/L)442589217338305352349
Location 3
Date22 November 202226 April 202319 October 202311 April 202410 October 202410 April 2025-
Settleable solids (mL/L)103533341813-
Total-N (mg/L)36.855.944.646.547.1125.2-
Total-P (mg/L)6.0214.96.4711.78.2410.1-
COD (mg/L)7271.2639371070841638-
BOD5 (mg/L)510665560727563380-
Location 4
Date23 November 202226 April 202319 October 202311 April 202410 October 202410 April 20259 October 2025
Settleable solids (mL/L)181101890263835
COD (mg/L)261643206623294372555
BOD5 (mg/L)138175130276192161273
Location 5
Date23 November 202219 October 202310 October 20249 October 2025
Settleable solids (mL/L)<1.01.51.00.8
TSS (mg/L)3527.516<3.0
COD (mg/L)56564017068
BOD5 (mg/L)3134577328
Location 6Location 7
Date9 October 202511 April 202410 April 20259 October 2025
Settleable solids (mL/L)30150.610
Total-N (mg/L)48.7---
Total-P (mg/L)10.6---
COD (mg/L)1053---
BOD5 (mg/L)738---
Copper (mg/L)-4.990.0570.19
Mercury (mg/L)-0.140.0210.01
Silver (mg/L)-0.0770.0120.025
Zinc (mg/L)-2.350.180.094
Table A16. Conventional wastewater parameters of the daily influent samples from a WWTP (samples from January–December 2024).
January–June
Date10 January 20247 February 20245 March 20243 April 20247 May 202412 June 2024
Day classWWDWDWWWDWWW
Settleable solids (mL/L)142918251914
Total-N (mg/L)59.174.158.955.864.722.1
Total-P (mg/L)8.1110.48.817.448.63.51
COD (mg/L)900964756559874311
BOD5 (mg/L)420500420360400150
July–December
Date3 July 202413 August 202411 September 202416 October 20245 November 20243 December 2024
Day classWWDW + Empt.WWDW + Empt.DWDW
Settleable solids (mL/L)1085.52018-
Total-N (mg/L)3242.2-61.169.3-
Total-P (mg/L)4.945.313.269.489.32-
COD (mg/L)325631300773808-
BOD5 (mg/L)150-140420380-
Notes: WW: Wet-weather day, DW: dry-weather day, DW + Empt.: dry-weather day combined with emptying of the storage volume of stored combined sewer overflows (CSOs).

References

  1. Zhang, Z.; Yang, Y.; Xi, H.; Yu, Y.; Song, Y.; Wu, C.; Zhou, Y. Evaluation Methods of Inhibition to Microorganisms in Biotreatment Processes: A Review. Water Cycle 2023, 4, 70–78. [Google Scholar] [CrossRef]
  2. Zhang, Z.; Yu, Y.; Xi, H.; Zhou, Y. Review of Micro-Aeration Hydrolysis Acidification for the Pretreatment of Toxic and Refractory Organic Wastewater. J. Clean. Prod. 2021, 317, 128343. [Google Scholar] [CrossRef]
  3. Vasiliadou, I.A.; Molina, R.; Martinez, F.; Melero, J.A.; Stathopoulou, P.M.; Tsiamis, G. Toxicity Assessment of Pharmaceutical Compounds on Mixed Culture from Activated Sludge Using Respirometric Technique: The Role of Microbial Community Structure. Sci. Total Environ. 2018, 630, 809–819. [Google Scholar] [CrossRef] [PubMed]
  4. Zając-Woźnialis, A.; Kruszelnicka, I.; Zembrzuska, J.; Ginter-Kramarczyk, D.; Ochowiak, M.; Krupińska, A. Efficiency of Diclofenac Removal Using Activated Sludge in a Dynamic System (SBR Reactor) with Variable Parameters of pH, Concentration, and Sludge Oxygenation. Materials 2023, 16, 1422. [Google Scholar] [CrossRef] [PubMed]
  5. Dehnavi, H.A.; Amin, M.M.; Fatehizadeh, A.; Attar, H.M.; Ebrahimpour, K.; Bina, B. Assessment of Toxicity and Kinetic Effects of Erythromycin on Activated Sludge Consortium by Fast Respirometry Method. Environ. Health Eng. Manag. 2021, 8, 205–214. [Google Scholar] [CrossRef]
  6. Dereszewska, A.; Cytawa, S. Effect of Diclofenac Concentration on Activated Sludge Conditions in a Biological Wastewater Treatment Plant. Water 2023, 15, 1838. [Google Scholar] [CrossRef]
  7. Gao, K.; Yang, Y.; Graham, N.J.D.; Zhang, Y.; Jiang, Y.; Duan, C.; Li, A.; Zhang, Q.; An, X.; Hou, L. Self-Assembled Membrane with Excellent Antifouling Performance for Enhanced Treatment of Petrochemical Wastewater. Chem. Eng. J. 2024, 496, 153931. [Google Scholar] [CrossRef]
  8. Jerez, S.; Ventura, M.; Martínez, F.; Pariente, M.I.; Melero, J.A. Carbonaceous Materials from a Petrol Primary Oily Sludge: Synthesis and Catalytic Performance in the Wet Air Oxidation of a Spent Caustic Effluent. J. Environ. Manag. 2024, 365, 121606. [Google Scholar] [CrossRef]
  9. Cai, B.; Xie, L.; Yang, D.; Arcangeli, J.-P. Toxicity Evaluation and Prediction of Toxic Chemicals on Activated Sludge System. J. Hazard. Mater. 2010, 177, 414–419. [Google Scholar] [CrossRef]
  10. Pérez-Bou, L.; Rosa-Masegosa, A.; Vilchez-Vargas, R.; Link, A.; Gonzalez-Martinez, A.; Gonzalez-Lopez, J.; Muñoz-Palazon, B. Treatment of Hospital Wastewater Using Aerobic Granular Sludge Technology: Removal Performance and Microbial Dynamics. J. Water Process Eng. 2024, 60, 105206. [Google Scholar] [CrossRef]
  11. Niu, J.; Ma, C.; Li, X.; Dong, Q.; Liu, Y.; Wang, H. Screening, Prioritization, and Identification of Key Toxic Substances in Hospital Wastewater. J. Hazard. Mater. 2025, 496, 139352. [Google Scholar] [CrossRef]
  12. Kungolos, A. Evaluation of Toxic Properties of Industrial Wastewater Using On-Line Respirometry. J. Environ. Sci. Health Part A 2005, 40, 869–880. [Google Scholar] [CrossRef] [PubMed]
  13. Zhou, X.-R.; Wang, R.; Tang, C.-C.; Varrone, C.; He, Z.-W.; Li, Z.-H.; Wang, X.C. Advances, Challenges, and Prospects in Microalgal-Bacterial Symbiosis System Treating Heavy Metal Wastewater. Chemosphere 2023, 345, 140448. [Google Scholar] [CrossRef]
  14. Ren, S.; Frymier, P.D. The Use of a Genetically Engineered Pseudomonas Species (Shk1) as a Bioluminescent Reporter for Heavy Metal Toxicity Screening in Wastewater Treatment Plant Influent. Water Environ. Res. 2003, 75, 21–29. [Google Scholar] [CrossRef]
  15. Philp, J.C.; Balmand, S.; Hajto, E.; Bailey, M.J.; Wiles, S.; Whiteley, A.S.; Lilley, A.K.; Hajto, J.; Dunbar, S.A. Whole Cell Immobilised Biosensors for Toxicity Assessment of a Wastewater Treatment Plant Treating Phenolics-Containing Waste. Anal. Chim. Acta 2003, 487, 61–74. [Google Scholar] [CrossRef]
  16. Liu, T.; Zheng, X.; Zhang, Q.; Wang, Y.; Tang, G. The Effects of Cd2+ and Cu2+ on Characteristics of Soluble Microbial Products from Activated Sludge via Altering Expression of Cellular Metabolism Pathways. J. Water Process Eng. 2024, 66, 106050. [Google Scholar] [CrossRef]
  17. Duwiejuah, A.B.; Otoo, R.K.N.; Imoro, A.Z. Comparison of the Adsorption Performance of Coconut Husk and Palm Kernel Shells Biochars for the Removal of Toxic Metals from Mining Wastewater. Waste Manag. Bull. 2025, 3, 100249. [Google Scholar] [CrossRef]
  18. Ren, S.; Frymier, P.D. Estimating the Toxicities of Organic Chemicals to Bioluminescent Bacteria and Activated Sludge. Water Res. 2002, 36, 4406–4414. [Google Scholar] [CrossRef] [PubMed]
  19. Li, X.; Wu, Y.; Chen, M.; Rui, T.; Shi, P.; Yang, F.; Zhang, Z.; Hu, M.; Zhang, F.; Wu, X.; et al. Micro-Nano-Bubble Ozonation Enhanced Thiamethoxam Mineralization and Toxicity Alleviation in Wastewater. Eco-Environ. Health 2025, 4, 100202. [Google Scholar] [CrossRef]
  20. Wong, K.-Y.; Zhang, M.-Q.; Li, X.-M.; Lo, W. A Luminescence-Based Scanning Respirometer for Heavy Metal Toxicity Monitoring. Biosens. Bioelectron. 1997, 12, 125–133. [Google Scholar] [CrossRef]
  21. Ren, S. Assessing Wastewater Toxicity to Activated Sludge: Recent Research and Developments. Environ. Int. 2004, 30, 1151–1164. [Google Scholar] [CrossRef]
  22. Foladori, P.; Bruni, L.; Tamburini, S. Toxicant Inhibition in Activated Sludge: Fractionation of the Physiological Status of Bacteria. J. Hazard. Mater. 2014, 280, 758–766. [Google Scholar] [CrossRef]
  23. Boonnorat, J.; Boonapatcharoen, N.; Prachanurak, P.; Honda, R.; Phanwilai, S. Toxic Compounds Biodegradation and Toxicity of High Strength Wastewater Treated under Elevated Nitrogen Concentration in the Activated Sludge and Membrane Bioreactor Systems. Sci. Total Environ. 2017, 592, 252–261. [Google Scholar] [CrossRef] [PubMed]
  24. Xing, F.; Duan, L.; Zhang, H.; Zhang, H.; Li, S. Research on the Application and Mechanisms of Electroactive Microorganisms in Toxicants Monitoring: A Review. Toxics 2024, 12, 173. [Google Scholar] [CrossRef] [PubMed]
  25. Soleimani, T.; Ferber, D.L.; Junqua, G.; Ferber, M.L. An Approach for Modular Environmental Life Cycle Assessment of Effluent Treatment: Configuration of Effluent Treatment Modules Based on Decision Tree Tailored to Best Available Techniques. Environ. Impact Assess. Rev. 2025, 112, 107782. [Google Scholar] [CrossRef]
  26. Gutiérrez, M.; Etxebarria, J.; de las Fuentes, L. Evaluation of Wastewater Toxicity: Comparative Study between Microtox® and Activated Sludge Oxygen Uptake Inhibition. Water Res. 2002, 36, 919–924. [Google Scholar] [CrossRef]
  27. Strotmann, U.; Zaremba, S.; Bias, W.-R. Kurzzeit-Toxizitätstests zur Messung der Toxizität von Chemikalien gegenüber Belebtschlamm. Acta Hydrochim. Hydrobiol. 1992, 20, 136–142. [Google Scholar] [CrossRef]
  28. Maal-Bared, R. Operational Impacts of Heavy Metals on Activated Sludge Systems: The Need for Improved Monitoring. Environ. Monit. Assess. 2020, 192, 560. [Google Scholar] [CrossRef]
  29. Yuan, Y.; Yu, Y.; Xi, H.; Zhou, Y.; He, X. Comparison of Four Test Methods for Toxicity Evaluation of Typical Toxicants in Petrochemical Wastewater on Activated Sludge. Sci. Total Environ. 2019, 685, 273–279. [Google Scholar] [CrossRef]
  30. Hoffmann, C.; Christofi, N. Testing the Toxicity of Influents to Activated Sludge Plants with the Vibrio Fischeri Bioassay Utilising a Sludge Matrix. Environ. Toxicol. 2001, 16, 422–427. [Google Scholar] [CrossRef]
  31. Temmink, H.; Vanrolleghem, P.; Klapwijk, A.; Verstraete, W. Biological Early Warning Systems for Toxicity Based on Activated Sludge Respirometry. Water Sci. Technol. 1993, 28, 415–425. [Google Scholar] [CrossRef]
  32. Ren, S.; Frymier, P.D. Comparative Study of Two Bioassays for Applications in Influent Wastewater Toxicity Monitoring. J. Environ. Eng. 2003, 129, 216–221. [Google Scholar] [CrossRef]
  33. Pambrun, V.; Marquot, A.; Racault, Y. Characterization of the Toxic Effects of Cadmium and 3.5-Dichlorophenol on Nitrifying Activity and Mortality in Biologically Activated Sludge Systems—Effect of Low Temperature. Environ. Sci. Pollut. Res. 2008, 15, 592–599. [Google Scholar] [CrossRef]
  34. Ricco, G.; Tomei, M.C.; Ramadori, R.; Laera, G. Toxicity Assessment of Common Xenobiotic Compounds on Municipal Activated Sludge: Comparison between Respirometry and Microtox®. Water Res. 2004, 38, 2103–2110. [Google Scholar] [CrossRef]
  35. Poulopoulos, S.G.; Voutsas, E.C.; Grigoropoulou, H.P.; Philippopoulos, C.J. Stripping as a Pretreatment Process of Industrial Oily Wastewater. J. Hazard. Mater. 2005, 117, 135–139. [Google Scholar] [CrossRef]
  36. Chen, H.-L.; Yao, J.; Wang, L.; Wang, F.; Bramanti, E.; Maskow, T.; Zaray, G. Evaluation of Solvent Tolerance of Microorganisms by Microcalorimetry. Chemosphere 2009, 74, 1407–1411. [Google Scholar] [CrossRef]
  37. Ren, S.; Frymier, P.D. Toxicity Estimation of Phenolic Compounds by Bioluminescent Bacterium. J. Environ. Eng. 2003, 129, 281–389. [Google Scholar] [CrossRef]
  38. ÖNORM EN ISO 8692:2012; Wasserbeschaffenheit—Süßwasseralgen-Wachstumshemmtest mit Einzelligen Grünalgen. Austrian Standards: Vienna, Austria, 2012.
  39. ÖNORM EN ISO 11348-1:2019; Wasserbeschaffenheit—Bestimmung der Hemmwirkung von Wasserproben auf die Lichtemission von Vibrio fischeri (Leuchtbakterientest)—Teil 1: Verfahren mit Frisch Gezüchteten Bakterien. Austrian Standards: Vienna, Austria, 2019.
  40. ÖNORM EN ISO 11348-2:2019; Wasserbeschaffenheit—Bestimmung der Hemmwirkung von Wasserproben auf die Lichtemission von Vibrio fischeri (Leuchtbakterientest)—Teil 2: Verfahren mit Flüssig Getrockneten Bakterien. Austrian Standards: Vienna, Austria, 2019.
  41. OENORM EN ISO 11348-3:2019; Wasserbeschaffenheit—Bestimmung der Hemmwirkung von Wasserproben auf die Lichtemission von Vibrio fischeri (Leuchtbakterientest)—Teil 3: Verfahren mit Gefriergetrockneten Bakterien. Austrian Standards: Vienna, Austria, 2019.
  42. ÖNORM EN ISO 6341:2013; Wasserbeschaffenheit—Bestimmung der Hemmung der Beweglichkeit von Daphnia magna Straus (Cladocera, Crustacea)—Akuter Toxizitäts-Test. Austrian Standards: Vienna, Austria, 2013.
  43. 43. ÖNORM EN ISO 15088:2009; Wasserbeschaffenheit—Bestimmung der Akuten Toxizität von Abwasser auf Zebrafisch-Eier (Danio rerio). Austrian Standards: Vienna, Austria, 2009.
  44. Collivignarelli, M.C.; Caccamo, F.M.; Bellazzi, S.; Abbà, A.; Bertanza, G. Assessment of the Impact of a New Industrial Discharge on an Urban Wastewater Treatment Plant: Proposal for an Experimental Protocol. Environments 2023, 10, 108. [Google Scholar] [CrossRef]
  45. ISO 8192; Water Quality Test for Inhibition of Oxygen Consumption by Activated Sludge for Carbonaceous and Ammonium Oxidation. International Standards Organisation: Geneva, Switzerland, 2007.
  46. ISO 9509; Water Quality—Toxicity Test for Assessing the Inhibition of Nitrification of Activated Sludge Microorganisms. International Standards Organisation: Geneva, Switzerland, 2006.
  47. Neunteufel, B.; Gruber, G.; Muschalla, D. Determination of Toxicity Using the Activated Sludge Respiration Inhibition Test and Identification of Sensitive Boundary Conditions. Water 2024, 16, 3464. [Google Scholar] [CrossRef]
  48. Neunteufel, B.; Muschalla, D. Quantification and Validation of Measurement Uncertainty in the ISO 8192:2007 Toxicity Assessment Method: A Comparative Analysis of GUM and Monte Carlo Simulation. Toxics 2025, 13, 857. [Google Scholar] [CrossRef]
  49. Gendig, C.; Domogala, G.; Agnoli, F.; Pagga, U.; Strotmann, U.J. Evaluation and Further Development of the Activated Sludge Respiration Inhibition Test. Chemosphere 2003, 52, 143–149. [Google Scholar] [CrossRef]
  50. Strotmann, U.; Durand, M.-J.; Thouand, G.; Eberlein, C.; Heipieper, H.J.; Gartiser, S.; Pagga, U. Microbiological Toxicity Tests Using Standardized ISO/OECD Methods—Current State and Outlook. Appl. Microbiol. Biotechnol. 2024, 108, 454. [Google Scholar] [CrossRef]
  51. Pagga, U.; Bachner, J.; Strotmann, U. Inhibition of Nitrification in Laboratory Tests and Model Wastewater Treatment Plants. Chemosphere 2006, 65, 1–8. [Google Scholar] [CrossRef]
  52. Hardin, J.W.; Hilbe, J.M. Generalized Linear Models and Extensions, 2nd ed.; Stata Press: College Station, TX, USA, 2007. [Google Scholar]
  53. Pichler, H.; Gamperer, T. Atmungsmessung zur Identifikation von Betriebsstörungen, Methodik und Anwendungen. In Proceedings of the 28. Sprechertagung der ÖWAV-Kanal- und Kläranlagen-Nachbarschaften, Hagenberg, Austria, 11–12 September 2019. [Google Scholar]
Figure 1. Test setup and measurement procedure of the activated sludge respiration inhibition test following ISO 8192:2007 [45] with the modification by Neunteufel et al. [47]: (a) aeration equipment; (b) measurement devices and setup [48].
Water 18 01162 g001
Figure 2. Results (oxygen consumption and inhibition) of the effluent sample (24 June 2025 and 25 June 2025) from industrial company No. 1. Sampling dates are given in the format day.month.year. (BC: Blind control, TSS: Total Suspended Solid, and DF: Dilution factor).
Water 18 01162 g002
Figure 3. Results (oxygen consumption and inhibition) of the influent and effluent samples from industrial company No. 2. Sampling dates are given in the format day.month.year. (BC: Blind control, TSS: Total Suspended Solid, and DF: Dilution factor).
Water 18 01162 g003
Figure 4. Results (oxygen consumption and inhibition) of the influent and effluent samples from industrial company No. 3. Sampling dates are given in the format day.month.year. (BC: Blind control, TSS: Total Suspended Solid, and DF: Dilution factor).
Water 18 01162 g004
Figure 5. Results (oxygen consumption and inhibition) of the samples from a hospital at discharge location 1. Sampling dates are given in the format day.month.year. (BC: Blind control, TSS: Total Suspended Solid, and DF: Dilution factor).
Water 18 01162 g005
Figure 11. Results (oxygen consumption and inhibition) of the daily influent samples from a WWTP (samples from January–December 2024). Sampling dates are given in the format day.month.year. (BC: Blind control, TSS: Total Suspended Solid, and DF: Dilution factor).
Water 18 01162 g011
Table 1. Type and number of samples of all investigated discharges.
Type of SampleInfluent SamplesEffluent Samples
Industrial company No. 1-1 (1)
Industrial company No. 21 (2)1 (1)
Industrial company No. 31 (3)1 (1)
Hospital location 1-7 (1), (4)
Hospital location 2-7 (1)
Hospital location 3-6 (1)
Hospital location 4-7 (1)
Hospital location 5-4 (1), (5)
Hospital location 6-1 (3)
Hospital location 7-3 (3)
WWTP influent12 (1)-
Notes: (1) Volume-proportional 24 h composite samples; (2) time-proportional 24 h composite samples; (3) qualified random samples; (4) 10/2025: time-proportional 24 h composite samples; (5) 2024 onwards: qualified random samples.
Disclaimer/Publisher’s Note: The statements, opinions and data contained in all publications are solely those of the individual author(s) and contributor(s) and not of MDPI and/or the editor(s). MDPI and/or the editor(s) disclaim responsibility for any injury to people or property resulting from any ideas, methods, instructions or products referred to in the content.